Europe

Highlights So What? Investors should look to European assets for considerable upside. Why? In the Euro Area, investors have constantly overestimated the angst of the median voter towards the currency union. The European Parliament has few real powers, so a fractured European Parliament does not really matter. Europe’s high-beta economy should benefit from a Chinese and global rebound. Stronger European growth will translate into more credit demand and lower non-performing loans, which will boost bank earnings. Go long European banks as a tactical trade, and long European equities versus Chinese equities as a strategic play. We will also consider going long EUR/USD as a strategic play once we get clarity on potential tariffs. Feature
Chart 1
Europe’s economy and asset markets continue to underperform in 2019 despite a global policy pivot away from tightening monetary policy and a solid quarter of Chinese credit growth. Investors are broadly unattracted to continental Europe, regularly voicing fears that it is beset by a combination of hazards: from a no-deal Brexit to the ballooning Target 2 imbalances. According to the latest Bank of America Merrill Lynch survey of fund managers, the most crowded trade remains “short European equities” (Chart 1). The doom and gloom are intriguing considering that China is stimulating its economy and will continue to do so as long as trade tensions are elevated. “Higher beta” equities, including Europe and EM, should benefit from this stimulus (Chart 2). Exports, a key growth engine for the currency union, are closely linked to Chinese credit growth (Chart 3). Chart 2Chinese Stimulus Good For "High Beta" Economies
Chinese Stimulus Good For "High Beta" Economies
Chinese Stimulus Good For "High Beta" Economies
Chart 3Europe Will Benefit From Improving Chinese Growth
Europe Will Benefit From Improving Chinese Growth
Europe Will Benefit From Improving Chinese Growth
And yet Europe remains unloved. Given that most client questions focus on the political situation – and that many ask about the upcoming May 23 European Parliament (EP) elections – we focus on both in this analysis. First, we review the latest survey data on the collective sentiment towards Europe and integration. Second, we give our insights regarding the upcoming EP elections. Our broad conclusion is simple. If our house view that global growth is about to bottom is correct, and barring a collapse in U.S.-China trade talks, European assets – primarily equities and the euro – should be the top performers this year. What Does The European Median Voter Want? The Median Voter Theory is a critical concept for investors. At BCA Research Geopolitical Strategy, we believe that the median voter – not the policymaker – is the price maker in the political market place. Politicians, especially in democracies, are price takers. They are bound by constraints, of which the preferences of the median voter are the most concrete impediments to action. This concept is simple to understand, but difficult to implement. It is far easier to get lost in rumor intelligence-driven analysis of political consultants and journalists who pass on the cocktail party chatter insights gathered through speaking with policymakers. These insights focus on the preferences of the people in power. But their preferences are secondary to those of the median voter. Trust in the EU remains below 50%, but this is in line with or better than the usual trust most governments achieve. Chart 4Support For The Euro Has Been Trending Upwards
Support For The Euro Has Been Trending Upwards
Support For The Euro Has Been Trending Upwards
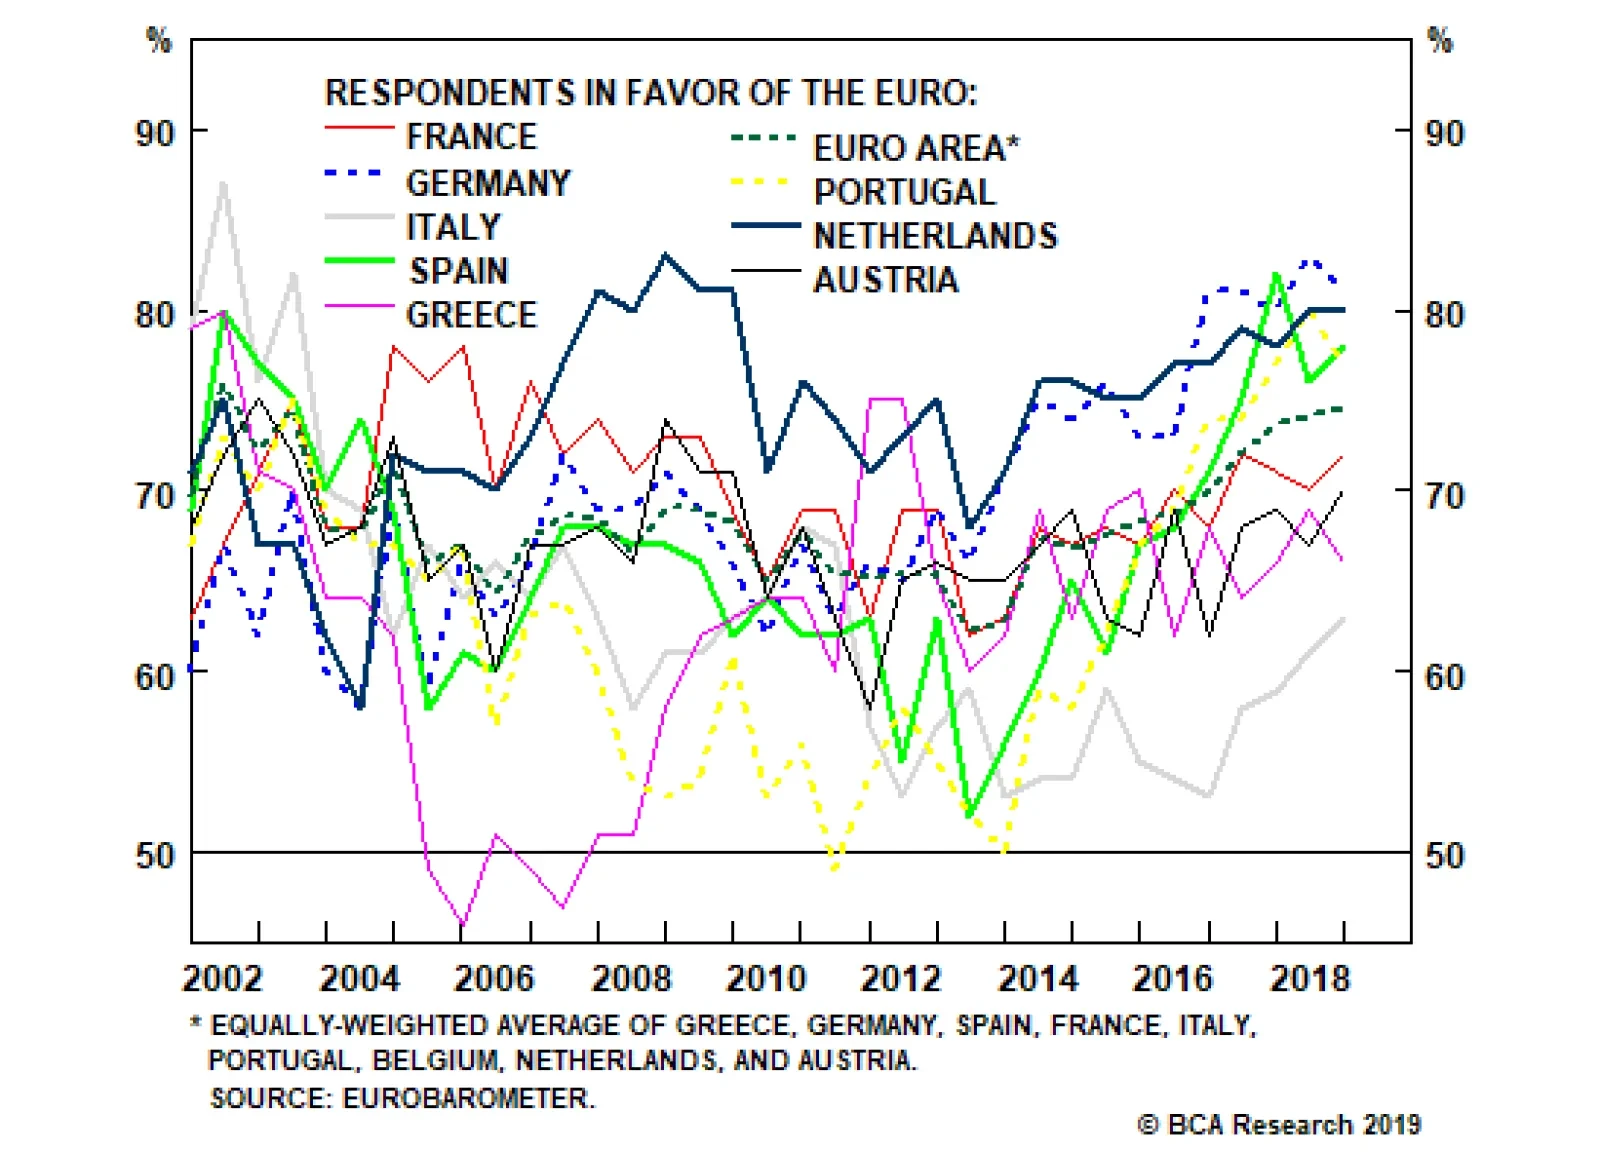
In the Euro Area, investors have constantly overestimated the angst of the median voter towards the currency union. This has led many investors to keep their money off the table, or take active short positions, even when it was prudent to remain invested. The prime example is the sentiment towards the common currency itself. Support for the euro hit a low in 2013 but has shot up since then across the continent (Chart 4). Even in Italy, the support for the euro is now at an eight-year high. Many investors have remained blind to this empirical fact. Not only has the support for the currency rebounded, but it has done so by converting doubters. Chart 5 shows that the increased support for the common currency – particularly in Spain, Germany, the Netherlands, and Italy – has occurred at the same time as the opposition has fallen. In other words, it is not the “undecideds” that are switching into supporters of the euro, rather it is the opponents who are relenting. Chart 5ASupport For The Common Currency Rising...
Support For The Common Currency Rising...
Support For The Common Currency Rising...
Chart 5B...As Doubters Convert
...As Doubters Convert
...As Doubters Convert
Chart 6Support For The EU Also On The Rise
Support For The EU Also On The Rise
Support For The EU Also On The Rise
What of the support for the EU broadly defined? Latest Pew Research polling also shows a strong rebound in support among the public in the largest member states (Chart 6). The last time we published the data – in the summer of 2016 following Brexit – the figures were much lower. Given that for many Europeans the EU is merely another layer of bureaucracy and government, the support level is impressive when put in the international context. Chart 7 shows that the trust in the EU, compared to the trust Europeans have in their own governments, falls somewhere squarely in the middle. When compared to non-European countries, Europeans have considerably more trust in the EU than Americans have in their own government and in line with the sentiment of Japanese towards their own government. In other words, the trust in the EU remains below 50%, but this is in line with or better than the usual trust most governments achieve.
Chart 7
Why has the median voter remained supportive of European institutions despite mixed economic performance? For one, investors – particularly outside continental Europe – continue to overstate how much emphasis Europeans put on “economic prosperity” as a key goal of the integrationist process. Sure, everyone wants a humming economy, but Chart 8 shows that for most large European economies, “peace” and a “stronger say in the world” are more cogent explanations for the EU’s raison d’être than economic performance.
Chart 8
Now, a skeptic might argue that this is because the EU has failed to deliver on the promise of prosperity. Nonetheless, the data suggest that Europeans today no longer expect European institutions to focus primarily on economic matters. Geopolitics, particularly security and foreign policy, are not just concerns of the shadowy elites and bureaucrats in Brussels. The median voter is concerned with these matters as well. The one worrying aspect of Chart 8 is that voters in Italy and Spain don’t think the EU means much to them at all. That level of nihilism might be compatible with continued European integration today. However, it also means that both countries, particularly Italy, remain a risk whenever a recession hits. The second reason for the improvement in median voter support of European institutions is that the migration crisis of 2015 – which peaked in October 2015, merely eight months ahead of the fateful referendum in the U.K. – is done and gone (Chart 9). Illegal immigration is an issue of concern, but it has been for over half a century. In fact, every decade has seen a turn against immigration, usually following a recession. It is a recurring problem that will remain a major policy issue for the rest of the century. The path from a “policy problem” to “the end of European integration” is neither direct nor immediate. Third, terrorism has abated as an existential threat to Europe. Chart 10 shows that we have seen the end of the “bull market in terror” in Europe. Unfortunately, the data for that chart only goes to 2017, otherwise it would show an even more jarring collapse in both attacks and casualties. Chart 9The Migration Crisis Is No Longer A Crisis
The Migration Crisis Is No Longer A Crisis
The Migration Crisis Is No Longer A Crisis
Chart 10The "Bull Market In Terror" Is Over
The "Bull Market In Terror" Is Over
The "Bull Market In Terror" Is Over
The chart is also useful in putting the latest bout of terrorism – mainly of the radical Islamic variety – in its proper historical context. Europe has been riven with far left and nationalist terror (often both) since the late 1960s. The number of casualties per year in the 1970s was nearly two times greater than the peak of the recent bout of radical Islamic terror. This is largely the case even excluding the Troubles in Ireland and Northern Ireland. There is simply no evidence that the European median voter is moving towards Euroskepticism. Although it is difficult to make the connection, we would go on to posit that the abating of the migration crisis and bull market in radical Islamic terror has allowed the median voter in Europe to assess whether breaking apart the EU would truly resolve these crises. Elements of European integration, particularly the common labor market and Schengen Agreement – which is part and parcel of the integrationist evolution – definitely make it easier for migrants and terrorists to cross borders. However, the geopolitical forces that breed both are at least partly, if not completely, non-European in origin. As such, it is not clear how individual European countries that lack any hard power would deal with these events on their own. Thus European integration is not a policy born of strength but of weakness. Chart 11 illustrates this concept empirically. It shows the percent of respondents who think their country could better face the future outside the EU. The dotted line represents the pessimistic view. An astounding 87% of Dutch responders, for example, are pessimistic about the country’s future outside the EU. We pick on the Dutch because they have tended to vote for Euroskeptic parties. Similarly, a very high number of Germans, Finns, Swedes, French, and Spaniards are lacking confidence in “national sovereignty.” Only the Italians are flirting with “going it alone,” although even in their case the momentum for sovereignty appears to have stalled, as it has in traditionally Euroskeptic Austria. Chart 11AEuropeans Lack Confidence In National Sovereignty...
Europeans Lack Confidence In National Sovereignty...
Europeans Lack Confidence In National Sovereignty...
Chart 11B...And Believe They Are Better Off Sticking Together
...And Believe They Are Better Off Sticking Together
...And Believe They Are Better Off Sticking Together
Many investors approach European integration with an ideological slant. But charts don’t lie. Since we founded BCA Research Geopolitical Strategy, we have used Euro Area perseverance as the premier example of how an empirically-driven approach to political analysis can generate alpha. There is simply no evidence that the European median voter is moving towards Euroskepticism. A broad trend has existed since 2013 of rising support for the common currency, the euro. And a mini up-cycle in support for broader European institutions appears to be present since 2016, probably due to the combination of Brexit, an abating migration crisis, and the end of the bull market in terror. Bottom Line: The median voter supports both the euro and broad European integration. This is an empirical fact. But … Euroskeptics Are Winning Seats! Chart 12Anti-Establishment Parties Are Gaining Seats
Anti-Establishment Parties Are Gaining Seats
Anti-Establishment Parties Are Gaining Seats
Despite the comfort of our empirical data, the reality is that anti-establishment parties continue to increase their share of parliamentary seats across the continent (Chart 12). In the recent Spanish election, for example, the populist Vox managed to win 10.3% of the vote. Headlines immediately picked up on the extraordinary performance, noting that Euroskeptics have finally established a foothold in Spain. Spanish Prime Minister Pedro Sánchez, the leader of the victorious Socialist Party, has welcomed the characterization as a foil to his program, promising to build a pro-European bloc with other left-leaning parties. Sánchez is playing politics. He understands how broadly European integration is supported in Spain and is trying to paint his opponents – who disagree with him on many issues, but not on Spain’s membership in the EU and EMU – as being on the other side of the median voter’s preferences. In reality, Vox is not a hard Euroskeptic party. It is right wing on immigration, multiculturalism, and the centralization of the Spanish state, but on Europe Vox merely wants less integration from the current, already highly integrated level. Anti-establishment parties are realizing that the median voter does not want to abandon European integration. As such, the right-leaning anti-establishment parties are focusing on anti-immigrant and anti-multicultural policies, while the left-leaning are focusing on anti-austerity politics. But there appears to be an emerging truce on integration. We forecast this transition in our 2016 report titled “After Brexit, N-Exit?” We posited that anti-establishment parties would increasingly focus on anti-immigration policies, while reducing the emphasis on Euroskepticism, in order to remain competitive. We now have a number of examples of this process, from Italy’s Lega to Finland’s the Finns Party. Which brings us to the election at hand: the EP election on May 23.
Chart 13
Ironically, the EP election gives Euroskeptics the best chance at winning seats. First, the turnout has been falling for decades (Chart 13) given the dubious relevance of the legislative body (more on that below). Second, Euroskeptic voters tend to be highly motivated during EP elections as they get to vote “against Europe.” Third, ironically, EP elections allow Euroskeptics to build pan-European coalitions with their fellow skeptics. Despite the hype, the latest seat projections give Euroskeptics merely 26% of the seat total in the body, or just under 200 seats in the 750-seat body (Diagram 1). Chart 14 shows that the support for Euroskeptics has actually taken a serious dip following the Brexit referendum, with the overall continent-wide support remaining around 20%. This is broadly the same level at which the support was five years ago, giving Euroskeptic parties no gain in half a decade. Diagram 1Euroskeptics Expected To Hold Only A Quarter Of The Seats
European Parliament Election: Much Ado About A Moderately Relevant Event
European Parliament Election: Much Ado About A Moderately Relevant Event
Chart 14
All that said, if a fifth of Europe’s electorate is voting for anti-integrationist parties in the midst of the most important European-wide election, that must be a bad sign for Europe. Right? Wrong. The media rarely unpacks the Euroskeptics beyond citing their overall support figures. However, we have gone beyond merely citing the three leading Euroskeptic blocs. Instead, we have separated the individual Members of European Parliament (MEPs) from across the three Euroskeptic blocs into four camps: Eastern European Camp – These are MEPs from EU member states that are former members of the Warsaw Pact or former Republics of the Soviet Union. Hardcore Camp – These are committed Euroskeptics who genuinely want their countries to leave European institutions. The Dutch Party for Freedom wants to see the Netherlands leave both the EU and the EMU. However, parties such as the Swedish Democrats and the Finns Party are more nuanced. Nonetheless, we erred on the side of apocalypse and added them all to the hardcore camp. Classical Camp – These are MEPs who would have fit the Euroskeptic definition back in the 1990s. They generally do not have a problem with the EU, but tend to be skeptical of the EMU and definitely do not want to see any further integration (although some would welcome integration on the military front). Italy’s Lega belongs to this camp, at least since the 2017 election, given the reorientation of the party’s policy away from criticizing the EMU and toward anti-immigrant policies. On The Way Out Camp – The U.K. MEPs will eventually be forced to exit the EP given the eventual departure of the U.K. from the EU. In this camp, we have thrown all the U.K. MEPs who sit in Euroskeptic groupings, which includes both UKIP MEPs and Conservative Party members – even those who are not actually anti-EU. Diagram 2Almost Three Quarters Of Euroskeptic MEPs Are Bluffing
European Parliament Election: Much Ado About A Moderately Relevant Event
European Parliament Election: Much Ado About A Moderately Relevant Event
Diagram 2 shows the distribution of the currently 311 Euroskeptic MEPs. The largest portion, by far, are Eastern European MEPs. The second-largest portion are MEPs from the U.K., who are either on their way out or about to become the “lamest ducks” in the history of any legislature. What does this mean? First, that almost three quarters of the Euroskeptic MEPs are essentially bluffing. Eastern European Euroskepticism is a geopolitical oxymoron. Investors should ignore any Euroskeptic rhetoric from Eastern Europe for two reasons. First, many Eastern European economies remain highly dependent on the EU for structural funding (Chart 15). But even that crude measure does not illustrate the benefit of EU membership. If Eastern and Central European countries were to leave the EU, they would lose access to the common market, a huge economic cost given their close integration with the German manufacturing supply chain. Second, and perhaps more importantly, the EU is a critical geopolitical anchor for the former Warsaw Pact member states. As much as the Polish and Hungarian Euroskeptic MEPs like to speak of the “tyranny of Brussels,” they all remember all too clearly the actual tyranny of Moscow. As such, Eastern Europe’s Euroskepticism is a bluff, a rhetorical political tool to blame the ills of poor governance on Brussels for the sake of domestic political gains. It holds no actual threat to European integration or its institutions given that the alternative to Brussels is… Moscow.
Chart 15
This is why the three Euroskeptic blocs will find it difficult to cooperate in the future. The Eastern European-heavy European Conservatives and Reformists (ECR) are highly skeptical of Russia, as the largest party in the bloc is the Polish Law and Justice (PiS) Party. The PiS is highly critical of Moscow’s foreign policy and is the ruling party of Poland. Its rhetoric is on occasion illiberal and anti-EU, but it has also changed domestic policy when pressured by Brussels. The ECR is expected to be the smallest Euroskeptic party, with 55 MEPs. The genuinely hard-core Euroskeptic bloc is the Europe of Nations and Freedom (ENF). It is expected to win 58 MEPs and is dominated by genuine, long-time, anti-EU parties such as Marine Le Pen’s National Rally of France (formerly the National Front) and the Dutch Party for Freedom. However, its latest iteration is likely to be dominated by Matteo Salvini’s Lega, which is Italy’s ruling party and has taken a decided turn towards soft Euroskepticism. Finally, the moderately Euroskeptic Europe of Freedom and Direct Democracy (EFDD) is expected to win 57 seats. However, its largest bloc are the ruling Italian Five Star Movement (M5S) and an assortment of Euroskeptic British MEPs, including Niger Farage. Italy’s M5S has already toned down its Euroskeptic rhetoric given that it now sits in Rome and runs the EMU’s third-largest economy. Meanwhile, U.K. MEPs will be largely irrelevant, raising the question of whether EFDD should even be classified as Euroskeptic in the next EP. Bottom Line: When all is said and done, the European Parliament election is a much-hyped non-event. By our count, only about 60 out of approximately 190 Euroskeptic MEPs will be actual hard-core Euroskeptics (or, just 8% of the entire EP). The rest are either reformed centrists – the two major Italian parties, Lega and M5S – on their way out – U.K. Euroskeptics – or are just bluffing – all Eastern European MEPs. That said, the EP seat distribution will reflect the polarization and fracturing observed in most national parliaments across of Europe. It is likely that neither the center-left nor the center-right will have enough seats to select the European Commission President. Does Any Of This Even Matter? Does the EP election even matter? To answer this question, we first have to assess whether the European Parliament itself matters. Both the proponents and opponents of the EU overstate the bloc’s supranational institutions: the EP and the Commission. A fractured European Parliament does not really matter ... In fact, the European Parliament has few real powers. The true power in the EU is vested in the European Council. The European Council could be conceived of as an upper chamber of a combined EU legislature, the Senate to the European Parliament’s House of Representatives (to put into U.S. context). It is comprised of the heads of government of EU member states and is therefore elected on the national, not supranational, level. It is, by far, where most power resides in the EU. The Commission, on the other hand, is the EU’s technocratic executive. Its members are not democratically elected, but are chosen by the European Council and approved by both the Council and the EP.1 The EU Commission President is elected according to the Spitzenkandidat system. The party grouping that secures a majority governing coalition in the EP gets to name their leader as the candidate for the European Commission President. This system is not enshrined in EU law, it is merely a convention. In fact, it was designed to try to boost the voting turnout for the EP elections. The idea being that Europe’s voters would turn out to vote if it meant that their votes would ultimately determine who gets to head the European Commission. At the end of the day, the European Council has to approve the Spitzenkandidat. And, according to the letter of the law, the European Council can ultimately even ignore the Spitzenkandidat suggestions of the European Parliament and propose their own head of the European Commission. As such, the fact that Diagram 1 suggests a fractured European Parliament does not really matter. The European Council could, in the end, simply find a consensus candidate and have national governments instruct their MEPs to vote for that candidate in the EP. In fact, the European Parliament has few real powers. It is one of the only legislatures in the world with no actual legislative initiative (i.e., it cannot produce laws!). It gets to hold a ceremonial vote on new EU treaties – the treaties that act as a constitution of the bloc – but cannot veto them. On most important matters – including the EU budget – the Parliament cannot overrule the European Council (the heads of national governments), which means that it cannot subvert the sovereignty of the EU member states. In the political construct that is the EU, it is the upper-chamber that holds all the power (if we are to extend the analogy of the European Council as the “Senate”). Another important thing to remember is that MEPs are rarely unaffiliated. The vast majority are members of national parties on the national level. Few, if any, are actual supranational agents. In fact, most MEPs fall into two categories. They are either young up-and-comers being groomed for a successful career on the national level – the level that actually matters – or they are past-their-expiration-date elders looking for a cushy retirement posting that includes frequent, taxpayer-funded, trips between Brussels and Strasbourg. Bottom Line: The importance of the EP is vastly overstated by both Europhiles and Euroskeptics. Its role within the EU legislative process has been increasing through treaty evolution and convention. However, the true power in the EU still rests with the national governments and the EP can be sidelined if the European capitals so desire. Furthermore, while the EP is a supranational body with supranational powers, its soul is very much national. This is because most of its MEPs either have an eye on returning to domestic politics or are emeriti of domestic politics looking for one last bout of relevance. Investment Implications Given our sanguine view of European politics, and the BCA House View that global growth should bottom (Chart 16), investors should look to European assets for considerable upside. This is particularly the case if the U.S. and China overcome their cold feet and conclude a trade deal. Our colleague Peter Berezin, BCA’s Chief Investment Strategist, has proposed that investors go long European banks as a tactical trade. Peter has pointed out that banks are now trading at distressed valuations (Chart 17).2 Given a Chinese and global rebound, and barring a total relapse into trade war, Europe’s high-beta economy should benefit, leading to higher bond yields in core European markets.This has tended to help European bank stocks in the past (Chart 18). Stronger economic growth will also translate into more credit demand and lower non-performing loans. This will boost bank earnings (Chart 19). Chart 16Growth Is Recovering In The U.S. And China
Growth Is Recovering In The U.S. And China
Growth Is Recovering In The U.S. And China
Chart 17European Banks: A Good Value Play
European Banks: A Good Value Play
European Banks: A Good Value Play
Chart 18Euro Area: Higher Bond Yields Bode Well For Bank Stocks
Euro Area: Higher Bond Yields Bode Well For Bank Stocks
Euro Area: Higher Bond Yields Bode Well For Bank Stocks
Chart 19More Credit, Fatter Bank Earnings
More Credit, Fatter Bank Earnings
More Credit, Fatter Bank Earnings
In addition, U.S. dollar outperformance is long-in-the-tooth. If global growth is truly bottoming, and assuming a trade deal is done, then the policy divergence that has favored the greenback should be over (Chart 20). As such, we will consider going long EUR/USD as a strategic play once we get clarity on China tariffs and potential tariffs on U.S. auto imports (the latter risk is rising from 35% to 50% given Trump’s willingness to take risks this year). Chart 20If Trade War Subsides, Dollar May Fall
If Trade War Subsides, Dollar May Fall
If Trade War Subsides, Dollar May Fall
Chart 21A Reversal In Tech Outperformance Supports Long Europe/China
A Reversal In Tech Outperformance Supports Long Europe/China
A Reversal In Tech Outperformance Supports Long Europe/China
Finally, Dhaval Joshi, BCA’s Chief European Strategist, believes that Europe is a clear tactical overweight to China.3 Part of the reason is that the two markets are mirror opposites of each other in terms of sector skews. China is overweight technology and underweight healthcare, while Europe is overweight healthcare and underweight technology. The year-to-date outperformance by global technology stocks relative to healthcare is long in the tooth and ripe for a correction (Chart 21). Given our positive structural assessment of European political risk, we recommend going long European equities and short China as a strategic play. Marko Papic Consulting Editor marko@bcaresearch.com Footnotes 1 For the American context, the Commission would be what the various U.S. Departments would look like if they were serving at the pleasure of the U.S. Senate. While the analogy is not perfect, it does capture the fact that the EU’s executive is controlled by the European Council. 2 Please see BCA Global Investment Strategy Weekly Report, “King Dollar Is Due For A Breather,” dated April 26, 2019, available at gis.bcaresearch.com. 3 Please see BCA Research European Investment Strategy Weekly Report, “Suffering Market Vertigo,” dated May 2, 2019, available at eis.bcaresearch.com.
Highlights U.S.: The Fed remains decidedly neutral, despite market expectations (and White House pressure) for lower U.S. interest rates. Treasury yields are mispriced and should grind higher over the next 6-12 months, led first by inflation expectations and later by a more hawkish Fed. Canada: The Bank of Canada’s latest reports and commentary indicate that monetary policy will stay on hold over at least the balance of 2019. Bond markets are already priced for that outcome. Maintain a neutral stance on Canadian government bonds in global hedged fixed income portfolios. Sweden: The Riksbank’s recent dovish turn, calling for a flatter trajectory for interest rates and extending asset purchases, will keep Swedish bond yields lower for longer. Thus, we are closing our recommended tactical trades in Sweden that were positioned for rate hikes. Feature Global bond yields remain stuck in a range, seeking a new directional narrative. The downside is limited by green shoots of improving global growth (mostly from China stimulus), some commodity price reflation through higher oil prices and robust returns in most risk asset markets (i.e. an easing of financial conditions). At the same time, the upside for yields is capped by dovish forward guidance from data-dependent central banks who see below-trend economic growth and below-target inflation in the rearview mirror. Chart of the WeekForward MIS-guidance
Forward MIS-guidance
Forward MIS-guidance
We expect these opposing forces to be resolved through faster global growth and higher realized inflation over the next 6-12 months. Major central banks will not need to turn even more dovish and begin a monetary policy easing cycle to boost growth, despite current market pricing suggesting otherwise. Global bond yields will grind upward, first through higher inflation expectations and, later, from a shift away from discounting rate cuts and, in some countries, pricing in rate hikes. The pressure for higher yields will be strongest in the U.S., where the Treasury market now discounts that the current 2.5% fed funds rate will be the cyclical peak, below the median FOMC projection, even as inflation expectations have been moving higher (Chart of the Week). We continue to recommend pro-growth, pro-risk allocations in global fixed income markets: below-benchmark overall duration exposure, favoring global corporates over government bonds, focusing government bond exposure to countries where policymakers will be relatively less hawkish (Japan, U.K., Australia, Canada, New Zealand), and positioning for faster inflation expectations and bearish steepening of yield curves (most notably in the U.S. and core Europe). May FOMC Meeting: Sorry, Mr. President The Fed kept rates unchanged at last week’s FOMC meeting, dashing market hopes of a potential shift in language toward a future rate cut. The official statement acknowledged that U.S. inflation was running below the 2% target, but Fed Chair Jerome Powell later described that inflation shortfall as “transitory” and expected to reverse. Treasury yields got whipsawed by the mixed messaging, with the 2-year yield falling -6bps after the statement but then climbing +11bps during Powell’s press conference. Powell standing his ground so firmly was a sharp rebuke to U.S. money markets, which remain priced for rate cuts over the next year. It was also a strong sign of the Fed maintaining its political independence in the face of U.S. President Trump calling for aggressive rate cuts. From a growth perspective, the Fed is right to not panic. The employment backdrop remains solid, with the U.S. unemployment rate hitting a 50-year low in April of 3.6%. While cyclical growth indicators like the ISM Manufacturing index have trended lower, the headline index remains above the expansionary 50 level (Chart 2). The rally in U.S. equity and credit markets seen so far in 2019 has eased financial conditions, signaling an imminent rebound in the U.S. leading economic indicator (second panel). Furthermore, core measures of retail sales and capital goods orders have begun to reaccelerate after the Q1 slump impacted by the U.S. government shutdown. From a growth perspective, the Fed is right to not panic. On the inflation side, the story is more nuanced. Higher oil prices will boost headline inflation measures over the next six months. At the same time, the lagged impact of the surprising pickup in U.S. productivity growth (+2.4% year-over-year in Q1) will help dampen core inflation rates (Chart 3) via lower unit labor costs (flat year-over-year in Q1). Further complicating the issue for the Fed is the impact of lower inflation in the components that Fed Chair Powell deemed “transitory”, such as airfares, apparel and, most interestingly, the cost of financial services. Chart 2A Blossoming U.S. ##br##Rebound
A Blossoming U.S. Rebound
A Blossoming U.S. Rebound
Chart 3Blame Equities For The Cooling Of ##br##U.S. Core Inflation
Blame Equities For The Cooling Of U.S. Core Inflation
Blame Equities For The Cooling Of U.S. Core Inflation
The broad Financial Services and Inflation grouping, which includes market-related costs such as wealth management fees, now represents 9% of the overall U.S. core PCE deflator. The inflation rate of the Financial Services index is highly correlated to the performance of U.S. equity markets (Chart 4). This makes sense, as the costs of professional portfolio management are often tied to the size of assets under management. At a minimum, the market should be priced for the same neutral (unchanged) stance that the Fed is currently signaling, which is appropriate given signs of U.S. growth perking up. Chart 4Faster Productivity Means The Fed Can Be Patient
Faster Productivity Means The Fed Can Be Patient
Faster Productivity Means The Fed Can Be Patient
In 2018, prior to the year-end correction in U.S. equity markets, the contribution to core PCE inflation from the Financial Services category was a steady 0.5-0.6 percentage points. After the market rout, that contribution has fallen to 0.2 percentage points, accounting for nearly all of the 40bp decline in core PCE inflation since U.S. equities peaked last September. With equity markets having now regained all the late-2018 losses, Financial Services inflation should boost core PCE inflation by at least 20-30bps by year-end – and perhaps more if stocks continue to appreciate, per the BCA House View. With our Fed Monitor now sitting just above the zero line, indicating no pressure on the Fed to hike rates, the -30bps of rate cuts now discounted over the next year is too aggressive (Chart 5). At a minimum, the market should be priced for the same neutral (unchanged) stance that the Fed is currently signaling, which is appropriate given signs of U.S. growth perking up. The Fed will remain cautious on returning to a more hawkish stance until actual U.S. inflation turns higher, which will take some time given the competing forces of falling unit labor costs and fading “transitory” disinflationary effects. Chart 5Stay Underweight USTs & Below-Benchmark UST Duration
Stay Underweight USTs & Below-Benchmark UST Duration
Stay Underweight USTs & Below-Benchmark UST Duration
We think the 2017 experience will be useful to think about in the coming months. Then, the Fed paused its rate hiking cycle for a few months, primarily due to softer inflation readings related to unusual forces temporarily dampening core inflation (most notably, a one-time collapse in wireless phone prices related to a change in how those costs were measured). Once those “transitory” forces faded out of the data, the Fed resumed lifting the funds rate. It will likely take longer in 2019 before the Fed would feel confident enough to begin raising rates again, especially with the funds rate now much closer to neutral than two years ago. Nonetheless, we expect a similar story of rebounding inflation driving Treasury yields higher to unfold over the latter half of this year. A moderate below-benchmark U.S. duration stance, favoring shorter maturities, combined with a long position in inflation-protected TIPS over nominal Treasuries, remains appropriate. Bottom Line: The Fed remains decidedly neutral, despite market expectations (and White House pressure) for lower U.S. interest rates. Treasury yields are mispriced and should grind higher over the next 6-12 months, led first by inflation expectations and later by a more hawkish Fed. Canada Update: Stay Neutral Back in March, we upgraded our recommended Canadian government bond exposure to neutral after spending a long time at underweight.1 The rationale for our move was that the stunning loss of momentum in the Canadian economy at the end of 2018 would force the Bank of Canada (BoC) to not only stop raising rates, but stay on hold for longer than expected. After our upgrade, we noted that we would consider additional changes to our Canadian allocation after the releases of the latest BoC Business Outlook Survey (BoS) and the updated economic projections at the April 24 monetary policy meeting. None of those events makes us want to move away from the current neutral recommendation. The problem for the BoC is that its policy rate of 1.75% remains well below its own estimated neutral range, which is now 2.25%-3.25% (Chart 6). A similar message comes when looking at the neutral real rate (“r-star”) estimate for Canada produced by the New York Fed, with an r-star of 1.5% versus a current real policy rate around 0%.2 This suggests that Canadian monetary policy remains accommodative and that the BoC should be looking for opportunities to continue moving interest rates toward “neutral” when the economy is accelerating. Yet our own BoC Monitor suggests that an unchanged policy stance is currently appropriate, while -11bps of rate cuts are now discounted in the Canadian Overnight Index Swap (OIS) curve. In other words, the BoC is torn between a fundamental interest rate framework that says the hiking cycle is not done yet, and a sluggish economy that demands a dovish bias. The BoC is torn between a fundamental interest rate framework that says the hiking cycle is not done yet, and a sluggish economy that demands a dovish bias. In the press conference following the April 24 BoC policy meeting, BoC Governor Steve Poloz noted that any reference to the need for interest rates to return to the BoC’s neutral range was deliberately omitted from the official policy statement. This is a clear signal that the central bank has shifted its focus from “normalizing” rates to preventing a deeper downturn in Canadian growth. The latest BoS showed that business confidence, expected sales and future investment intentions all fell sharply in the first quarter of 2019 (Chart 7). There was a huge drop in the number of firms reporting capacity pressures and labor shortages, with more firms now expecting their prices to fall than rise over the next year. The main headwinds to the diminished outlook for future sales were related to “a more uncertain outlook in the Western Canadian energy sector, continued weakness in housing-related activity in some regions, and tangible impacts from global trade tensions”.3 Chart 6A Long Way From BoC ##br##Rate Cuts
A Long Way From BoC Rate Cuts
A Long Way From BoC Rate Cuts
Chart 7Negative Messages From The BoC Business Outlook Survey
Negative Messages From The BoC Business Outlook Survey
Negative Messages From The BoC Business Outlook Survey
The BoC places a lot of weight on the BoS in determining its economic forecasts, and in setting monetary policy. Thus, it is no surprise that in the official statement following the April 24 monetary policy meeting, the BoC Governing Council noted that they were “monitoring developments in household spending, oil markets and global trade policy to gauge the extent to which the factors weighing on growth and the inflation outlook were dissipating”.4 Those were the same three concerns of businesses highlighted in the BoS, assuming that “weakness in the Canadian housing market” is related to “developments in household spending” – a logical link given the high level of Canadian household and mortgage debt. Looking at those three factors, there is nothing suggesting that the BoC needs to adjust policy anytime soon (Chart 8). Oil prices are rising, but household spending remains weak and global trade uncertainties have not completely diminished and Canadian export growth has stagnated. Given the mixed picture from the economic data, the BoC will likely remain on hold until there is a clear signal from the data. From a bond investment strategy perspective, staying at neutral also makes sense. A move to overweight Canadian bonds would require an even deeper economic downturn into recessionary territory that would push Canadian unemployment higher (Chart 9). Downgrading back to underweight, however, would require signs of a sustainable rebound in Canadian domestic demand and stronger global growth that would boost Canadian exports – an outcome that would not be visible in the data until at least the third quarter of 2019. Chart 8Watch What The BoC ##br##Is Watching
Watch What The BoC Is Watching
Watch What The BoC Is Watching
Chart 9A Neutral Weight On Canada Is Still Justified
A Neutral Weight On Canada Is Still Justified
A Neutral Weight On Canada Is Still Justified
One final point on staying neutral on Canada comes from looking at cross-country spread levels between government bonds in Canada and other major developed economies. The spread levels look historically wide versus sovereign debt from Germany, the U.K., and Australia; wide versus recent history in Japan; but very narrow versus the U.S. (Chart 9). Those spreads are shown without hedging out the currency risk of going long Canadian bonds – and, by association, the Canadian dollar. Once the currency risk is hedged out of those cross-country spreads using 3-month currency forwards, the spread differentials are all far less interesting both in absolute terms and relative to history (Chart 10 & 11). Chart 10Big Differences In Canadian Bond Spreads Vs Other Major DM...
Big Differences In Canadian Bond Spreads Vs Other Major DM...
Big Differences In Canadian Bond Spreads Vs Other Major DM...
Chart 11… But Those Spreads Disappear Once The C$ Exposure Is Hedged
...But Those Spreads Disappear Once The C$ Exposure Is Hedged
...But Those Spreads Disappear Once The C$ Exposure Is Hedged
So even on an individual country basis, there is no compelling case to be anything but neutral Canadian government bonds versus global currency-hedged benchmarks – which is how we present all our fixed income recommendations in Global Fixed Income Strategy. Bottom Line: The Bank of Canada’s latest reports and commentary indicate that monetary policy will stay on hold over at least the balance of 2019. Bond markets are already priced for that outcome. Maintain a neutral stance on Canadian government bonds in global hedged fixed income portfolios. Sweden Trade Update – Time To Retreat & Regroup Exactly one year ago (May 8, 2018), we initiated trades in our Tactical Overlay portfolio to position for tighter monetary policy, and higher bond yields, in Sweden.5 Specifically, we have been recommending shorting 2-year Swedish government bonds versus German equivalents (hedging the currency exposure back into krona), while also selling 2-year Swedish bonds and buying 10-year Swedish debt in a yield curve flattening trade. The positions were chosen to benefit from an expected bearish repricing of the short-end of the Swedish curve. At this time last year, the positive upward momentum of Swedish growth and inflation had reached a point where the Riksbank was clearly – and credibly – signaling that the long process of normalizing its highly accommodative crisis-era monetary policies would begin. That meant lifting policy rates away from negative territory, as well as shutting down the bond-buying quantitative easing (QE) program. One year later, the economic backdrop has done a 180-degree turn against our original thesis (Chart 12): Swedish growth has slowed, with both the manufacturing PMI and leading economic indicator at the lowest levels since 2013. Unemployment has increased and nominal wage growth has rolled over. Headline CPIF inflation has fallen back below the Riksbank 2% target, while core CPIF inflation remains stuck near 1.5%. The Riksbank changed its forward guidance at last month’s monetary policy meeting, signaling that the benchmark interest rate will remain at -0.25% for “somewhat longer” than was indicated as recently as February (when a rate hike around the end of 2019 or in early 2020 was signaled). The Riksbank also pledged to maintain the size of its QE bond purchases from July 2019 to December 2020, a dovish surprise. Swedish money markets are still discounting 13bps of rate hikes over the next twelve months. Yet our Riksbank Monitor, on the other hand, is now indicating a need for rate cuts, driven by both softer inflation and weaker growth. The minutes from last month’s policy meeting revealed that the forward guidance was adjusted simply because headline inflation had temporarily dipped back below the 2% Riksbank target. The implication is that a return to 2% inflation would prompt the Riksbank to hike. Swedish money markets are still discounting 13bps of rate hikes over the next twelve months. Yet our Riksbank Monitor, on the other hand, is now indicating a need for rate cuts, driven by both softer inflation and weaker growth. A useful rule for investment risk management is: when the underlying rationale for a position is clearly not unfolding as expected, the best thing to do is simply close that position and look for new opportunities better aligned to the current reality. Chart 12No More Pressure On Riksbank ##br##To Hike
No More Pressure On Riksbank To Hike
No More Pressure On Riksbank To Hike
Chart 13Time To Exit Our Recommended "Hawkish" Trades In Sweden
Time To Exit Our Recommended "Hawkish" Trades In Sweden
Time To Exit Our Recommended "Hawkish" Trades In Sweden
With that in mind, we are choosing to close our tactical trades in Sweden (Chart 13). The 2-year Sweden-Germany spread trade generated a loss of -52bps (including the return from hedging the euro exposure in Germany back into Swedish krona). We were more fortunate with the curve flattening trade, which generated a return of +61bps as the Swedish curve bullishly flattened through falling 10-year yields rather than bearishly flattening through rising 2-year yields (our original expectation). Thus, we are closing out our Sweden trades at a small net gain of +9bps. We will do a deeper analysis on Sweden in an upcoming Global Fixed Income Strategy report to search for new potential trade ideas. Bottom Line: The Riksbank’s recent dovish turn, calling for a flatter trajectory for interest rates and extending asset purchases, will keep Swedish bond yields lower for longer. Thus, we are closing our recommended tactical trades in Sweden that were positioned for a faster path of rate hikes. Robert Robis, CFA, Chief Fixed Income Strategist rrobis@bcaresearch.com Ray Park, CFA, Research Analyst ray@bcaresearch.com Footnotes 1 Please see BCA Global Fixed Income Strategy Weekly Report, “March Calmness”, dated March 19, 2019, available at gfis.bcaresearch.com. 2 The NY Fed’s estimates for non-U.S. r-star rates for the euro area, Canada, and the U.K. can be found on the NY Fed website. https://www.newyorkfed.org/research/policy/rstar 3https://www.bankofcanada.ca/2019/04/business-outlook-survey-spring-2019/ 4https://www.bankofcanada.ca/2019/04/fad-press-release-2019-04-24/ 5 Please see BCA Global Fixed Income Strategy Special Report, “Sweden: The Riksbank Cannot Kick The Can Down The Road Anymore”, dated May 8, 2018, available at gfis.bcaresearch.com. Recommendations
Reconcilable Differences
Reconcilable Differences
Duration Regional Allocation Spread Product Tactical Trades Yields & Returns Global Bond Yields Historical Returns
The lack of more pronounced strength in pro-cyclical currencies such as the Australian, New Zealand, and Canadian dollars suggests that caution prevails. Our Foreign Exchange Services team’s bias is that currency markets continue to fight a tug-of-war between…
Highlights Recent data suggest central bankers remain behind the curve in boosting inflation expectations. Ergo, expect a dovish bias to persist over the next few months. Our thesis remains that global growth is in a volatile bottoming process. However, market focus could temporarily flip towards short term data weakness, which warrants taking out some insurance. Meanwhile, in an environment where volatility is low and falling, it also pays to have insurance in place. Rising net short positioning in the yen and Swiss franc is making them attractive from a contrarian standpoint. Maintain a limit-buy on CHF/NZD at 1.45. The path of least resistance for the dollar remains down. This is confirmed by incoming data that suggests the euro area economies have bottomed, which should boost the EUR/USD. The rising dollar shortage remains a key risk to our sanguine view. But the forces driving dollar liquidity lower are largely behind us. Feature Investors looking for more clarity on the global growth picture from the April data print have been left in a quandary. In the U.S., the headline first-quarter real GDP growth number of 3.2% was well above consensus but was boosted by volatile components such as inventories and net exports. Real final sales to domestic purchasers, a cleaner print for final demand, came in at 1.5%, the lowest increase since 2015. Assuming trend growth in the U.S. is around 2%, a view shared by the Federal Open Market Committee (FOMC), then the increase in first-quarter final sales was a big miss. Most importantly, the U.S. ISM manufacturing index fell to 52.8 in April, a drop that was broad-based across seven of the 10 components. Chart I-1At The Cusp Of A V-Shaped Recovery?
At The Cusp Of A V-Shaped Recovery?
At The Cusp Of A V-Shaped Recovery?
Across the ocean, European growth was a tad stronger. Italy managed to nudge itself out of a technical recession, while Spanish year-on-year growth of 2.4% helped drive euro area GDP growth to the tune of 1.2%. The most volatile components of euro area growth tend to be investment and net exports. Should both pick up on the back of stronger external demand, then GDP could easily gravitate towards 1.5%-2%, pinning it well above potential. The German PMI is currently one of the weakest in the euro zone. But forward-looking indicators suggest we are at the cusp of a V-shaped bottom over the next month or so (Chart I-1). China remains the epicenter of any growth pickup and the headline PMI numbers were soft, with the official NBS manufacturing PMI falling to 50.1 from 50.5, and the private sector Caixin manufacturing PMI falling to 50.2 from 50.8. Still, the numbers remain above the critical 50 threshold level, and well beyond the 45-48 danger zone. Export growth numbers across southeast Asia remain weak, and after a brisk rise since the start of the year, many China plays including commodity prices, the yuan, emerging market stocks, and Asian currencies are all rolling over. The bearish view is that there are diminishing marginal returns to Chinese stimulus, and the authorities need to be more aggressive to turn the domestic economy around. The reality is that policy stimulus works with a lag, and we need about three to six months before we see the effects of the current policy shift. Southeast Asian exports track the Chinese credit impulse with a lag of six months, and there is little reason to believe this time should be different (Chart I-2). Chart I-2Global Trade Should Soon Bottom
Global Trade Should Soon Bottom
Global Trade Should Soon Bottom
The broad message is that global growth likely bottomed in the first quarter. However, before evidence of this fully unfolds, markets are likely to be swayed by the ebbs and flows of higher-frequency data, making for a volatile bottoming process. We recommend maintaining a pro-cyclical bias, but taking out some insurance against a potential spike in volatility. The Fed On Hold This week’s FOMC meeting focused on the lack of inflationary pressures in the U.S. but was largely a non-event for financial markets, aside from a spike in volatility. Nonetheless, there were three key takeaways. First, the dip in inflation appears to be “transitory,” driven by lower clothing prices and financial services fees. Second, Chair Powell made it clear that the Fed will only feel the need to ease policy if inflation runs “persistently” below target. Finally, the Fed’s interpretation of its “symmetric” inflation target is slowly shifting. Many FOMC members increasingly believe that the Fed should explicitly pursue an overshoot of its 2% inflation target to make up for past misses. Taken together, we expect the Fed to remain on hold for the time being, but to eventually start raising rates again as inflationary pressures pick up. Chart I-3Inflation Should Be Higher In The U.S. Versus The Euro Area
Inflation Should Be Higher In The U.S. Versus The Euro Area
Inflation Should Be Higher In The U.S. Versus The Euro Area
The bigger picture is that in a very globalized world with fully flexible exchange rates, it is becoming more and more difficult for any one central bank to independently achieve its inflation objective. This is because, should inflation be on the rise and moving higher in one country, expectations of higher interest rates should lift its currency, which eventually tempers inflationary pressures, and vice versa. This is obviously a very simplistic view of the world economy, since other factors such as demographics, productivity, labor mobility, openness of the economy, and policy divergences among others, play important roles. However, it is remarkable that almost every developed market central bank has continued to attempt to boost inflation to the 2% level since the Global Financial Crisis, but very few have been able to achieve this independently. In a very globalized world with fully flexible exchange rates, it is becoming more and more difficult for any one central bank to independently achieve its inflation objective. Take the case of Europe versus the U.S., two economies that could not be more different. Euro area imports constitute about 41% of GDP, while the number in the U.S. is only 15%, so tradeable prices matter a lot more for the former. Meanwhile, the demographic profile is worse in Europe, with the old-age dependency ratio at 32% in Europe versus 23% in the U.S. Finally, other measures of supply-side constraints such as labor market slack or capacity utilization suggest the euro area is well behind the U.S. on the path toward a closed output gap (Chart I-3). Despite this, since 2015, headline inflation in both the U.S. and euro area have moved tick-for-tick. Yes, policy divergences between the two countries have been very wide, either via the lens of quantitative easing or simply the differential in policy rates (Chart I-4). But the fact that the magnitude and direction of overall inflation has moved homogenously, begs the question of the ability of either central bank to influence overall prices. One explanation could be that variations in headline CPI are largely driven by volatile items that tend to be exogenous, while variations in core CPI tend to be mostly driven by endogenous factors. This is confirmed by most research that suggest there is a weak link between rising commodity prices and longer-term inflation.1 That said, over the shorter run, commodity price gyrations can dominate and be the main driver of inflation expectations (Chart I-5). Chart I-4U.S. And Euro Area Overall CPI Are Broadly Similar
U.S. And Euro Area Overall CPI Are Broadly Similar
U.S. And Euro Area Overall CPI Are Broadly Similar
Chart I-5In The Short Term, Commodity Prices Matter For Inflation Expectations
In The Short Term, Commodity Prices Matter For Inflation Expectations
In The Short Term, Commodity Prices Matter For Inflation Expectations
The bottom line is that muted inflationary pressures are a global phenomenon, and not centric to the U.S. This means that as a whole, global central banks are set to stay accommodative for the time being, which will be bullish for global growth (Chart I-6). This warrants maintaining a pro-cyclical stance but being extremely selective in what might be a volatile bottoming process. Chart I-6Global Monetary Policy Needs To Ease Further
bca.fes_wr_2019_05_03_s1_c6
bca.fes_wr_2019_05_03_s1_c6
Maintain A Pro-Cyclical Stance With the S&P 500 breaking to all-time highs, crude oil prices up around 40% from their lows, and U.S. 10-year Treasury yields rolling over relative to the rest of the world, this has historically been fertile ground for high-beta currency trades. That said, the lack of more pronounced strength in pro-cyclical currencies like the Australian, New Zealand, and Canadian dollars suggest that caution prevails. Our bias is that currency markets continue to fight a tug-of-war between strong dollar fundamentals and fading tailwinds. Our portfolio consists mostly of trades along the crosses, but we have been cautiously adding to U.S. dollar short positions over the past few weeks: Long AUD/USD: Our limit-buy on the Aussie was triggered at 0.70. Data out of Australia are showing tentative signs of a bottom. Last week’s important jobs report showed that the economy continues to offer more employment than the consensus expects. Meanwhile, the credit growth data out of Australia this week suggests that macro-prudential policies continue to drive a wedge between owner-occupied and investor housing (Chart I-7). House prices in Australia are already deflating to the tune of around 6%. Once the cleansing process is through, we expect house price growth to eventually converge toward levels of credit and/or natural income growth. Moreover, the Australian dollar remains a commodity currency, and will benefit from rising terms-of-trade. Iron ore prices remain firm on the back of supply-related issues. Meanwhile, a rising mix of liquefied natural gas in the export basket will provide tailwinds as China continues to steer its economy away from coal. Finally, Chinese credit growth has been a key determinant of the re-rating of Australian equities. Ergo, a rising Chinese credit impulse will ignite Australian share prices, and by extension the Australian dollar (Chart I-8). Chart I-7Australian Credit Growth Converging To Steady State
Australian Credit Growth Converging To Steady State
Australian Credit Growth Converging To Steady State
Chart I-8More Chinese Credit Will Help Australian Equities
More Chinese Credit Will Help Australian Equities
More Chinese Credit Will Help Australian Equities
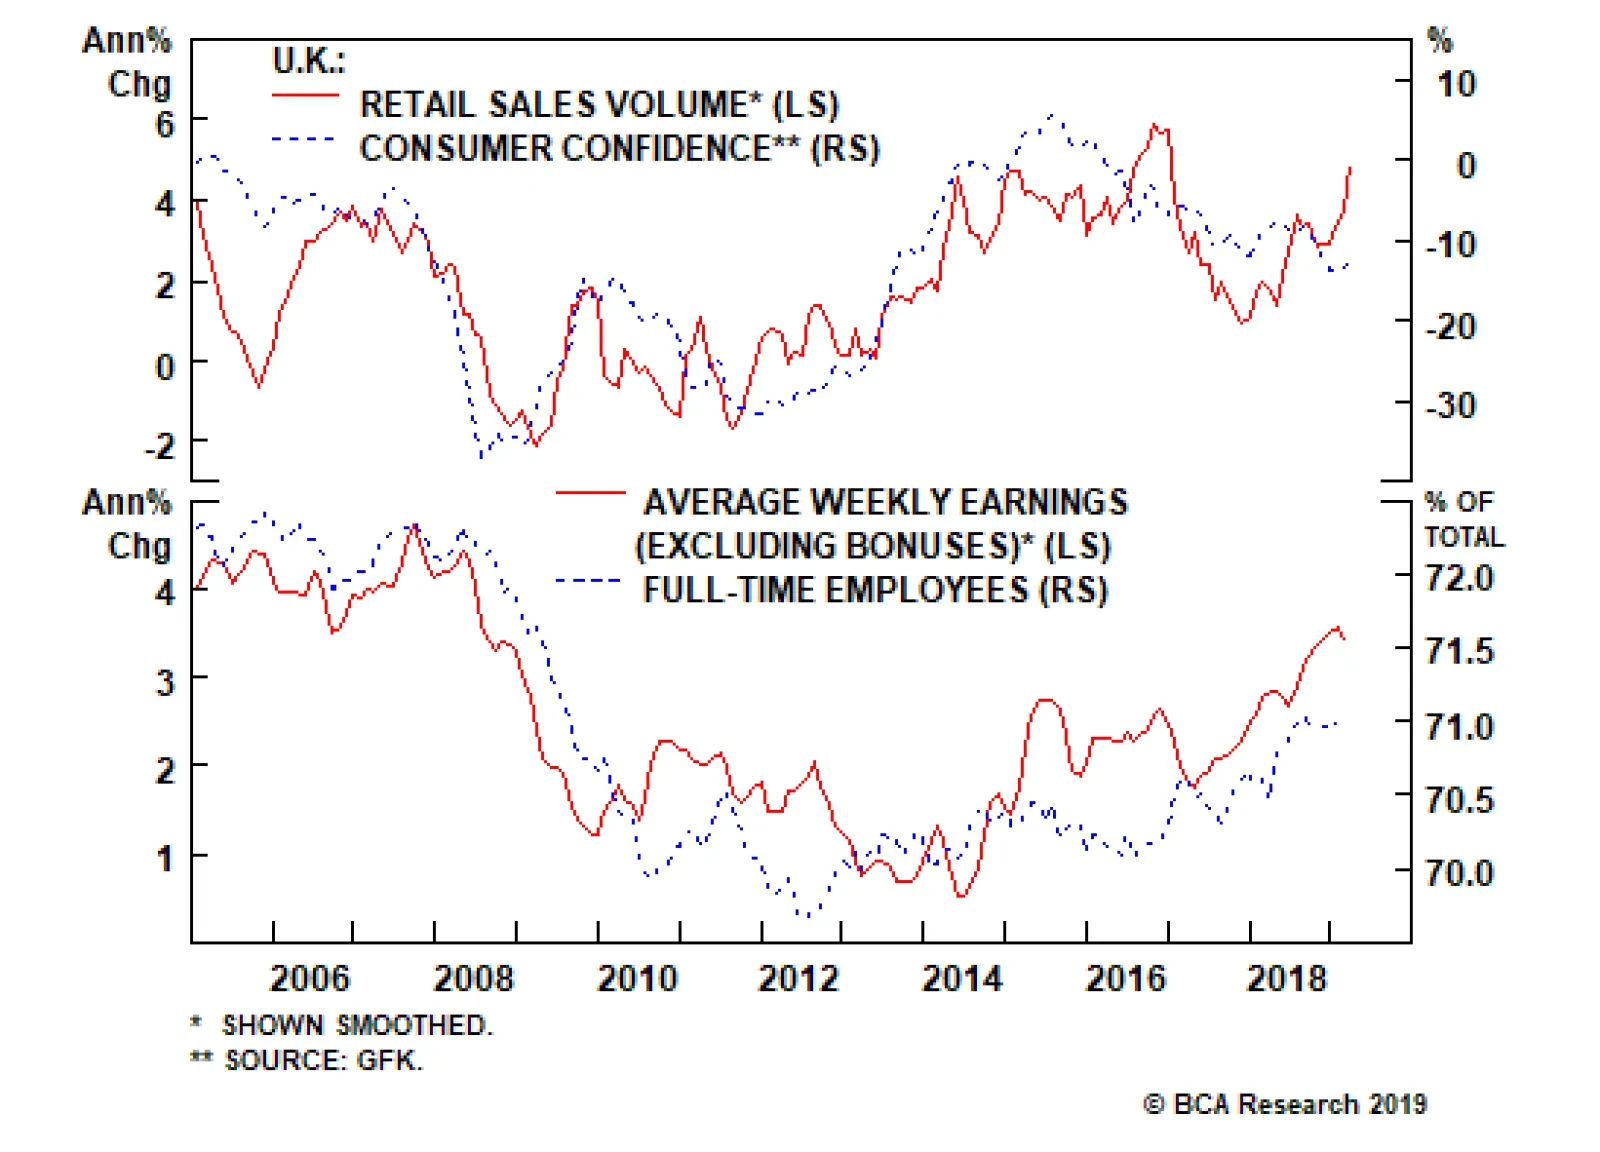
Long GBP/USD: Our buy-limit order on the British pound was triggered at 1.30 on March 29th. As we argued back then, the pound is sitting exactly where it was after the 2016 referendum results, but the odds of a hard Brexit have significantly fallen since then. On the domestic front, economic surprises in the U.K. relative to both the U.S. and euro area continue to soar. The reality is that the pound and U.K. gilt yields should be much higher – solely on the basis of hard incoming data. Employment growth has been holding up very well, wages are inflecting higher, and the average U.K. consumer appears in decent shape. Full-time employees continue to creep higher as a percentage of overall employment (Chart I-9). This view was echoed in yesterday’s Bank Of England (BoE) policy meeting, where the central bank raised its growth forecast while striking a more hawkish tone. Chart I-9U.K.: What Brexit?
U.K.: What Brexit?
U.K.: What Brexit?
Chart I-10Sweden: Volatile Bottom
Sweden: Volatile Bottom
Sweden: Volatile Bottom
Long SEK/USD: The Swedish krona should be one of the first currencies to benefit from any bottoming in European growth (Chart I-10). The Swedish economy appears to have bottomed relative to that of the U.S., making the USD/SEK an attractive way to play USD downside. From a technical perspective, the cross is trading at its lowest level since the global financial crisis (Chart I-11). Economic surprises in the U.K. relative to both the U.S. and euro area continue to soar. The main appeal of the Swedish krona is that it is extremely cheap. Meanwhile, despite negative interest rates, Swedish household loan growth has been slowing as consumers are increasingly financing purchases through rising wages. This will alleviate the need for the Riksbank to maintain ultra-accommodative policy, despite its recent dovish shift. Buy Some Insurance Given current low levels of volatility and elevated equity market valuations, the dollar would have been a great insurance policy for any stock market correction. But with U.S. interest rates having risen significantly versus almost all G10 countries in recent years, the dollar has itself become the object of carry trades. This has also come with a good number of unhedged trades, as the rising exchange rate has lifted hedging costs. Chart I-11How Much Lower Could The Swedish Krona Go?
How Much Lower Could The Swedish Krona Go?
How Much Lower Could The Swedish Krona Go?
Chart I-12Buy Some##br## Insurance
Buy Some Insurance
Buy Some Insurance
It will be difficult for the dollar to act as both a safe-haven and carry currency, because the forces that drive both move in opposite directions. As markets become volatile and some carry trades are unwound, unhedged trades will become victim to short-covering flows. Currencies such as the Japanese yen and the Swiss franc that could have been used to fund carry trades are ripe for reversals. This suggests at a minimum building some portfolio hedges. One such hedge is going long the CHF/NZD. This trade has a high negative carry, so we do not intend to hold it for longer than three months. But it should pay off handsomely on any rise in volatility (Chart I-12). Maintain a limit-buy at 1.45. Chester Ntonifor, Foreign Exchange Strategist chestern@bcaresearch.com Footnotes 1 Stephen G Cecchetti and Richhild Moessner, “Commodity Prices And Inflation Dynamics,” Bank Of International Settlements, Quarterly Review, (December 2008). Currencies U.S. Dollar Chart II-1USD Technicals 1
USD Technicals 1
USD Technicals 1
Chart II-2USD Technicals 2
USD Technicals 2
USD Technicals 2
Recent data in the U.S. continue to moderate: Annualized Q1 GDP came in at 3.2% quarter-on-quarter, well above estimates. Personal income increased by 0.1% month-on-month in March, below the estimated 0.4%. On the other hand, personal spending increased by 0.9% month-on-month in March. PCE deflator and core PCE deflator fell to 1.5% and 1.6% year-on-year, respectively in March. Michigan consumer sentiment index slightly increased to 97.2 in April. Markit manufacturing PMI increased from 52.4 to 52.6 in April, while ISM manufacturing PMI fell to 52.8. Q1 nonfarm productivity increased by 3.6%, surprising to the upside. DXY index fell by 0.3% this week. On Wednesday, the Fed announced their decision to keep interest rates on hold at current levels, further suggesting that there is no strong case to move rates in either direction based on recent economic developments. Moreover, Fed chair Powell reiterated their strong commitment to the 2% inflation target. Report Links: Currency Complacency Amid A Global Dovish Shift - April 26, 2019 Beware Of Diminishing Marginal Returns- April 19, 2019 Not Out Of The Woods Yet - April 5, 2019 The Euro Chart II-3EUR Technicals 1
EUR Technicals 1
EUR Technicals 1
Chart II-4EUR Technicals 2
EUR Technicals 2
EUR Technicals 2
Recent data in the euro area are improving: Money supply (M3) in the euro area increased by 4.5% year-on-year in March. The sentiment in the euro area remains soft in April: economic sentiment indicator fell to 104; business climate fell to 0.42; industrial confidence fell to -4.1; consumer confidence was unchanged at -7.9. Q1 GDP came in at 1.2% year-on-year, surprising to the upside. Unemployment rate fell to 7.7% in March. Markit PMI increased to 47.9 in April. EUR/USD appreciated by 0.3% this week. European data keep grinding higher. Italian GDP moved back into positive territory in Q1. Spanish GDP also rebounded in Q1. Positive Chinese credit data suggests the euro will soon benefit from rising Chinese imports. Report Links: Reading The Tea Leaves From China - April 12, 2019 Into A Transition Phase - March 8, 2019 A Contrarian Bet On The Euro - March 1, 2019 Japanese Yen Chart II-5JPY Technicals 1
JPY Technicals 1
JPY Technicals 1
Chart II-6JPY Technicals 2
JPY Technicals 2
JPY Technicals 2
Recent data in Japan have been positive: The unemployment rate in March increased slightly to 2.5%; job-to-applicant ratio was unchanged at 1.63. Tokyo consumer price inflation increased to 1.4% year-on-year in March, the highest level since October 2018. Industrial production fell by 4.6% year-on-year in March. However, projections for April suggest a 2.7% month-on-month jump. Retail sales grew by 1% year-on-year in March, higher than expected. Housing starts grew by 10% year-on-year in March. This is the highest growth level since February 2017. USD/JPY fell by 0.2% this week. The Japanese government’s intention to raise sales tax this October could be a highly deflationary outcome. However, there is still an outside chance that the tax hike will be postponed. We continue to recommend yen as a safety hedge. Report Links: Beware Of Diminishing Marginal Returns - April 19, 2019 Tug OF War, With Gold As Umpire - March 29, 2019 A Trader’s Guide To The Yen - March 15, 2019 British Pound Chart II-7GBP Technicals 1
GBP Technicals 1
GBP Technicals 1
Chart II-8GBP Technicals 2
GBP Technicals 2
GBP Technicals 2
Recent data in the U.K. have been positive: U.K. mortgage loans in March increased to 40K. Nationwide housing prices increased by 0.9% on a year-on-year basis in April. Markit manufacturing PMI came in above expectations at 53.1 in April, even though it fell; Markit construction PMI however increased to 50.5. Money supply (M4) increased by 2.2% year-on-year in March. GBP/USD increased by 1% this week. The Bank of England kept rates on hold at 0.75% this week. In the May inflation report, the BoE mentioned that U.K.’s economic outlook will depend significantly on the nature and timing of EU withdrawal, and the new trading agreement with EU in particular. But governor Carney struck a slightly hawkish tone, revising up GDP estimates and guiding the next policy move as a rate hike. Report Links: Not Out Of The Woods Yet - April 5, 2019 A Trader’s Guide To The Yen - March 15, 2019 Balance Of Payments Across The G10 - February 15, 2019 Australian Dollar Chart II-9AUD Technicals 1
AUD Technicals 1
AUD Technicals 1
Chart II-10AUD Technicals 2
AUD Technicals 2
AUD Technicals 2
Recent data in Australia have shown tentative signs of recovery: Private sector credit growth fell to 3.9% year-on-year in March. However, this is heavily biased downwards by lending to home investors that has slowed to a crawl. The Australian Industry Group (AiG) manufacturing index increased to 54.8 in April. RBA commodity index increased by 14.4% year-on-year in April. AUD/USD fell by 0.4% this week. The data are starting to look brighter in Q2, suggesting that the economy might have bottomed in Q1. The Australian dollar is likely to grind higher, especially driven by rising terms of trade. Report Links: Beware Of Diminishing Marginal Returns- April 19, 2019 Not Out Of The Woods Yet - April 5, 2019 Into A Transition Phase - March 8, 2019 New Zealand Dollar Chart II-11NZD Technicals 1
NZD Technicals 1
NZD Technicals 1
Chart II-12NZD Technicals 2
NZD Technicals 2
NZD Technicals 2
Recent data in New Zealand are mixed: ANZ activity outlook increased by 7.1% in April. ANZ business confidence in April improved to -37.5. On the labor market front in Q1, the employment change fell to 1.5% year-on-year; unemployment rate was unchanged at 4.2%, but participation rate fell to 70.4%; labor cost index fell to 2% year-on-year. Building permits contracted by 6.9% month-on-month in March. NZD/USD depreciated by 0.4% this week. The data from New Zealand continue to underperform its antipodean neighbor. We anticipate this trend will persist. Stay long AUD/NZD, currently 0.5% in the money. Report Links: Not Out Of The Woods Yet - April 5, 2019 Balance Of Payments Across The G10 - February 15, 2019 A Simple Attractiveness Ranking For Currencies - February 8, 2019 Canadian Dollar Chart II-13CAD Technicals 1
CAD Technicals 1
CAD Technicals 1
Chart II-14CAD Technicals 2
CAD Technicals 2
CAD Technicals 2
Recent data in Canada continue to underperform: GDP in February contracted by 0.1% on a month-on-month basis. Markit manufacturing PMI fell below 50 to 49.7 in April. USD/CAD fell by 0.1% this week. During Tuesday’s speech, Governor Poloz acknowledged recent negative developments in the Canadian economy, and blamed it on the U.S.-led trade war, as well as the sharp decline in oil prices late last year. While a bottoming in the global growth could be a tailwind for the Canadian economy near-term, a Ricardian equivalence framework will suggest fiscal austerity over the next few years, will be a headwind for long-term CAD investors. Report Links: Currency Complacency Amid A Global Dovish Shift - April 26, 2019 A Shifting Landscape For Petrocurrencies - March 22, 2019 Into A Transition Phase - March 8, 2019 Swiss Franc Chart II-15CHF Technicals 1
CHF Technicals 1
CHF Technicals 1
Chart II-16CHF Technicals 2
CHF Technicals 2
CHF Technicals 2
Recent data in Switzerland have been negative: KOF leading indicator fell to 96.2 in April. Real retail sales contracted by 0.7% year-on-year in March. SVME PMI fell below 50 to 48.5 in April. USD/CHF fell by 0.1% this week. The reduced volatility worldwide could make the Swiss franc less attractive. Moreover, the relative outperformance of the euro area is a headwind for the franc. Our long EUR/CHF position is now 1% in the money. We intend to trade the franc purely as an insurance policy near-term. Report Links: Beware Of Diminishing Marginal Returns - April 19, 2019 Balance Of Payments Across The G10 - February 15, 2019 A Simple Attractiveness Ranking For Currencies - February 8, 2019 Norwegian Krone Chart II-17NOK Technicals 1
NOK Technicals 1
NOK Technicals 1
Chart II-18NOK Technicals 2
NOK Technicals 2
NOK Technicals 2
Recent data in Norway has been positive: Retail sales increased by 0.6% in March, in line with expectations. This was a marked improvement from the 1.2% drop in February. The unemployment rate held low at 3.8% USD/NOK increased by 1% this week. We expect the Norwegian krone to pick up based on the strong fundamentals and positive oil price outlook. Report Links: Currency Complacency Amid A Global Dovish Shift - April 26, 2019 A Shifting Landscape For Petrocurrencies - March 22, 2019 Balance Of Payments Across The G10 - February 15, 2019 Swedish Krona Chart II-19SEK Technicals 1
SEK Technicals 1
SEK Technicals 1
Chart II-20SEK Technicals 2
SEK Technicals 2
SEK Technicals 2
Recent data in Sweden have been mostly positive: Retail sales increased on a month-on-month basis by 0.5% in March, but fell to 1.9% on a yearly basis. Producer price index was unchanged at 6.3% year-on-year in March. Trade balance came in at a large surplus of 7 billion SEK in March. Manufacturing PMI fell to 50.9 in April, but notably, import orders and backlog orders rose. USD/SEK increased by 0.4% this week. Despite the RiksBank’s dovish shift last week, we continue to favor our long SEK position. Our conviction is rooted in the fact that the Swedish krona is undervalued, and relative PMI trends favor Sweden vis-à-vis the U.S. Report Links: Balance Of Payments Across The G10 - February 15, 2019 A Simple Attractiveness Ranking For Currencies - February 8, 2019 Global Liquidity Trends Support The Dollar, But... - January 25, 2019 Trades & Forecasts Forecast Summary Core Portfolio Tactical Trades Closed Trades
First, up until the last decade, Japan benefited from a robust global economy where trade grew strongly. Europe is entering its second decade of low growth in an environment of much weaker global economic activity. Second, excess capital stock in…
Europe has a more dire demographic profile than the U.S. It needs to purge capital stock and invigorate its economy through reforms, a smaller public sector, and more diversified financing channels. But can the euro area fare better than Japan has over the…
First, the level of product and service market regulation in Europe is highly punitive. Like Japan, most euro area countries fare poorly in the World Bank’s Ease of Doing Business survey. In fact, Italy scores even lower than China! Meanwhile, the U.S. ranks…
Highlights Open an equity market relative overweight to Europe versus China. Upgrade Denmark to neutral. Downgrade the Netherlands to underweight. Maintain Switzerland at overweight. With the Euro Stoxx 50 now up almost 20 percent from its January 3 low, the majority of this year’s absolute gains have already been made. Core euro area bond yields will edge modestly higher… …and EUR/USD will appreciate, as the backward-looking data on which the ECB depends catches up with the more perky real-time economic data. Feature Vertical charts scare us, as we contemplate falling over the edge. But they also excite us, as we contemplate a lucrative investment opportunity. Right now, the vertical chart that is causing us palpitations is technology versus healthcare (Chart of the Week). Chart of the WeekTechnology Versus Healthcare Has Gone Vertical!
Technology Versus Healthcare Has Gone Vertical!
Technology Versus Healthcare Has Gone Vertical!
The technology versus healthcare sector pair is critical, because it looms large in several stock markets’ ‘fingerprint’ sector skews. Meaning that the technology versus healthcare relative performance has unavoidable consequences for regional and country stock market allocation (Chart I-2 and Chart I-3). The technology versus healthcare sector pair is critical, because it looms large in several stock markets’ ‘fingerprint’ sector skews. Chart I-2When Technology Underperforms Healthcare, Netherlands Underperforms Switzerland
When Technology Underperforms Healthcare, Netherlands Underperforms Switzerland
When Technology Underperforms Healthcare, Netherlands Underperforms Switzerland
Chart I-3When Technology Underperforms Healthcare, China Underperforms Switzerland
When Technology Underperforms Healthcare, China Underperforms Switzerland
When Technology Underperforms Healthcare, China Underperforms Switzerland
Specifically, from a European stock market perspective, the Netherlands is overweight technology while Switzerland and Denmark are both overweight healthcare. Further afield, the U.S. is overweight technology while China is both overweight technology and underweight healthcare. Explaining Verticality And The Subsequent Fall What creates vertical charts? To answer the question, let’s turn it on its head: what prevents vertical charts? The answer is: the presence of value investors. In a healthy market, a cohort of value investors will sit on the side lines and only transact with the marginal seller when the price falls to a semblance of value. In other words, the value sensitive investors help to set the price, preventing verticality. But if the value sensitive cohort switches out of character to join a strong uptrend, the cohort will suddenly become value insensitive. In this case, the marginal seller will set the price higher and the formerly uninterested value sensitive buyer will now buy at the higher price. The market has morphed into a trend-following market. As more of the value cohort switch sides, the process adds rocket fuel to the rally. Driven by the ‘fear of missing out’ the marginal buyer will buy at larger and larger price increments, and the chart becomes vertical. What triggers the subsequent fall? When all of the value cohort have joined the uptrend, the fuel has run out: the marginal seller will no longer find a willing marginal buyer at the elevated price. At this critical point, one of two things will happen. Either: a completely new cohort of even deeper value investors will switch out of character and provide new fuel to the trend, allowing it to continue. Or: the deep value investors will stay true to character and will only deal with the marginal seller when the price falls, perhaps sharply, to a semblance of deep value. Technology versus healthcare is now at this critical technical point at which the probability of trend-reversal has significantly increased. Both the theoretical and empirical evidence suggests that at this critical point, the probability of trend-continuation decreases to about a third and the probability of a trend-reversal increases to about two-thirds. Technology versus healthcare is now at this critical technical point at which the probability of trend-reversal has significantly increased (Chart I-4). Chart I-4Technology Versus Healthcare: The Probability Of A Trend-Reversal Is High
Technology Versus Healthcare: The Probability Of A Trend-Reversal Is High
Technology Versus Healthcare: The Probability Of A Trend-Reversal Is High
Therefore, on a tactical horizon, it is now appropriate to underweight technology versus healthcare – which, to reiterate, carries unavoidable consequences for country and regional stock market allocation: Open an overweight to Europe versus China. Upgrade Denmark to neutral. Downgrade the Netherlands to underweight. Maintain Switzerland at overweight. Distinguishing Between Valuation And Growth Is Extremely Difficult There is another problem for value investors. Over short periods – meaning less than a year – it is very difficult, if not impossible, to decompose a price return into its two components: the component coming from the change in valuation and the component coming from the change in earnings growth expectations. A stock market’s actual earnings are highly sensitive to small changes in economic growth. This is universally the case but is especially true in Europe, because the European stock market’s skew towards growth-sensitive cyclicals gives it a very high operational leverage to GDP growth: a seemingly minor 0.5 percent change in economic growth translates into a major 25 percent change in stock market earnings growth (Chart I-5). The slightest improvement in economic growth expectations causes the market to upgrade its forecasts for earnings very sharply. Chart I-5A Minor Upgrade To Economic Growth = A Major Upgrade To Profits Growth
A Minor Upgrade To Economic Growth = A Major Upgrade To Profits Growth
A Minor Upgrade To Economic Growth = A Major Upgrade To Profits Growth
Given this very high operational leverage, the slightest improvement in economic growth expectations causes the market to upgrade its forecasts for earnings very sharply. Which of course lifts the market’s price, P, very sharply. In contrast, equity analysts’ forecasts for earnings, which drive the market’s ‘official’ forward earnings, E, adjust much more slowly. As my colleague, Chris Bowes explains: “analysts get married to a view and usually require overwhelming evidence to materially change it.” The upshot is that the P rises very sharply but the official forward E does not, meaning that the official forward P/E also rises very sharply. This gives the impression that the move is mostly valuation driven, but the truth is that the move is mostly earnings growth driven. In a similar vein, when central banks guide interest rates lower, how much of the equity market’s move is due to a higher valuation, and how much is due to improved prospects for economic growth resulting from the central bank policy change? Over relatively short periods of time, it is extremely difficult to tell. All of which provides an important lesson: over short periods, do not focus on separately forecasting the valuation change and earnings growth change of a stock market. Much better to forecast the stock market price directly, by focussing on the two main things which will drive it: changes to central bank policy, and changes to short-term real-time economic growth. Focus On Central Banks And Short-Term Economic Growth Central bank policy now ‘depends’ on relatively longer-term changes (say, year-on-year) in backward-looking data, most notably the consumer price index. Whereas the stock market’s earnings growth expectations take their cue from shorter-term changes in real-time economic indicators (Chart I-6). Chart I-6Quarter-On-Quarter Growth Is Rebounding
Quarter-On-Quarter Growth Is Rebounding
Quarter-On-Quarter Growth Is Rebounding
Hence, the ‘sweet spot’ for equity markets is when, in simple terms, year-on-year CPI inflation is decelerating, implying central banks will become more dovish, while quarter-on-quarter economic growth is accelerating, implying the market will upgrade earnings growth (Chart I-7). The stock market’s earnings growth expectations take their cue from shorter-term changes in real-time economic indicators. The ‘weak spot’ for equity markets is the exact opposite, when year-on-year CPI inflation is accelerating, implying central banks will become less dovish, while quarter-on-quarter economic growth is decelerating, implying the market will downgrade earnings growth. As 2019 progresses, our high-conviction prediction is that equity markets will move from a sweet spot to a weak spot. With the Euro Stoxx 50 now up almost 20 percent from its January 3 low, it implies that the majority of 2019’s gains have already been made in the first four months of the year – and the market is unlikely to be significantly higher at the end of the year. Compared to the equity market, the bond, interest rate, and currency markets are – almost by definition – much more dependent on central banks’ lagging reaction functions than on real-time growth. Which solves the mystery as to why bond yields are close to new lows while equity markets are close to new highs. It also solves the mystery as to why EUR/USD has lagged the very clear recovery in euro area real-time growth and in euro area stock markets (Chart I-8). Central banks are following lagging indicators. Chart I-7Stock Markets Take Their Cue from Real-Time Indicators
Stock Markets Take Their Cue from Real-Time Indicators
Stock Markets Take Their Cue from Real-Time Indicators
Chart I-8Central Banks Are Following Lagging Indicators, Stock Markets Are Following Real-Time Indicators
Central Banks Are Following Lagging Indicators, Stock Markets Are Following Real-Time Indicators
Central Banks Are Following Lagging Indicators, Stock Markets Are Following Real-Time Indicators
But as the backward-looking data, on which the ECB depends, catches up with the more perky real-time data, core euro area bond yields will edge modestly higher, and EUR/USD will gently appreciate. Next week, in lieu of the usual weekly report, I will be giving this quarter’s webcast titled ‘From Sweet Spot to Weak Spot?’ live on Wednesday May 8 at 10.00 AM EDT (3.00 PM BST, 4.00 PM CEST, 10.00 PM HKT). Through a series of key charts, the webcast will reveal the prospects and opportunities for all asset-classes through the remainder of 2019. At the end of the webcast, I will also unveil a brand new investment recommendation. So don’t miss it! Fractal Trading System* Supporting the arguments in the main body of this report, fractal analysis suggests that the recent rally in China’s stock market is at a technical point that has reliably signaled previous major reversals. Accordingly, this week’s recommended trade is a stock market pair trade, short China versus Japan. Set the profit target at 2.5 percent with a symmetrical stop-loss. We now have six open positions. For any investment, excessive trend following and groupthink can reach a natural point of instability, at which point the established trend is highly likely to break down with or without an external catalyst. An early warning sign is the investment’s fractal dimension approaching its natural lower bound. Encouragingly, this trigger has consistently identified countertrend moves of various magnitudes across all asset classes. Chart I-9Short China Vs. Japan
Short China VS. Japan
Short China VS. Japan
The post-June 9, 2016 fractal trading model rules are: When the fractal dimension approaches the lower limit after an investment has been in an established trend it is a potential trigger for a liquidity-triggered trend reversal. Therefore, open a countertrend position. The profit target is a one-third reversal of the preceding 13-week move. Apply a symmetrical stop-loss. Close the position at the profit target or stop-loss. Otherwise close the position after 13 weeks. Use the position size multiple to control risk. The position size will be smaller for more risky positions. * For more details please see the European Investment Strategy Special Report “Fractals, Liquidity & A Trading Model,” dated December 11, 2014, available at eis.bcaresearch.com. Dhaval Joshi, Chief European Investment Strategist dhaval@bcaresearch.com Recommendations Asset Allocation Equity Regional and Country Allocation Equity Sector Allocation Bond and Interest Rate Allocation Currency and Other Allocation Closed Fractal Trades Trades Closed Trades Asset Performance Currency & Bond Equity Sector Country Equity Indicators Bond Yields Chart II-1Indicators To Watch - Bond Yields
Indicators To Watch - Bond Yields
Indicators To Watch - Bond Yields
Chart II-2Indicators To Watch - Bond Yields
Indicators To Watch - Bond Yields
Indicators To Watch - Bond Yields
Chart II-3Indicators To Watch - Bond Yields
Indicators To Watch - Bond Yields
Indicators To Watch - Bond Yields
Chart II-4Indicators To Watch - Bond Yields
Indicators To Watch - Bond Yields
Indicators To Watch - Bond Yields
Interest Rate Chart II-5Indicators To Watch - Interest Rate Expectations
Indicators To Watch - Interest Rate Expectations
Indicators To Watch - Interest Rate Expectations
Chart II-6Indicators To Watch - Interest Rate Expectations
Indicators To Watch - Interest Rate Expectations
Indicators To Watch - Interest Rate Expectations
Chart II-7Indicators To Watch - Interest Rate Expectations
Indicators To Watch - Interest Rate Expectations
Indicators To Watch - Interest Rate Expectations
Chart II-8Indicators To Watch - Interest Rate Expectations
Indicators To Watch - Interest Rate Expectations
Indicators To Watch - Interest Rate Expectations
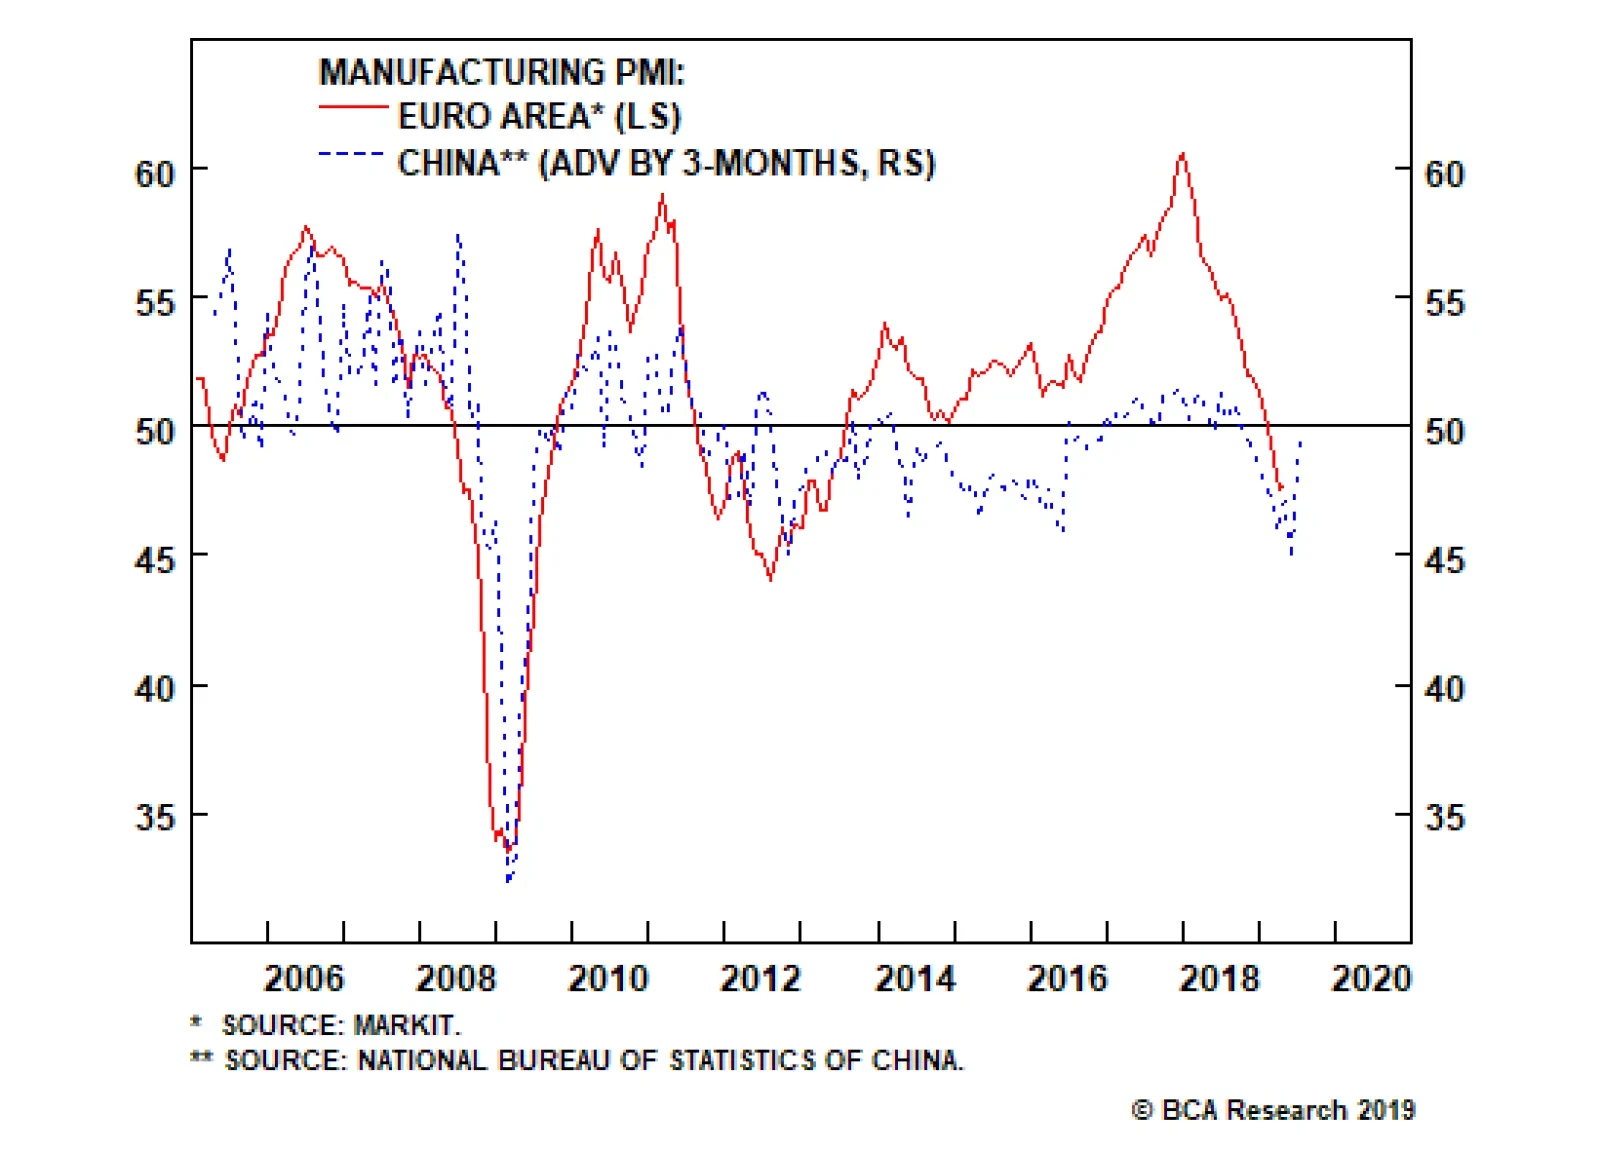
It’s official, the Italian technical recession is over. Italian GDP growth moved back into positive territory in the first quarter. Additionally, Spanish GDP growth rebounded to 0.7% on a quarterly basis, or 2.4% year-on-year. Thanks to those two surprises,…
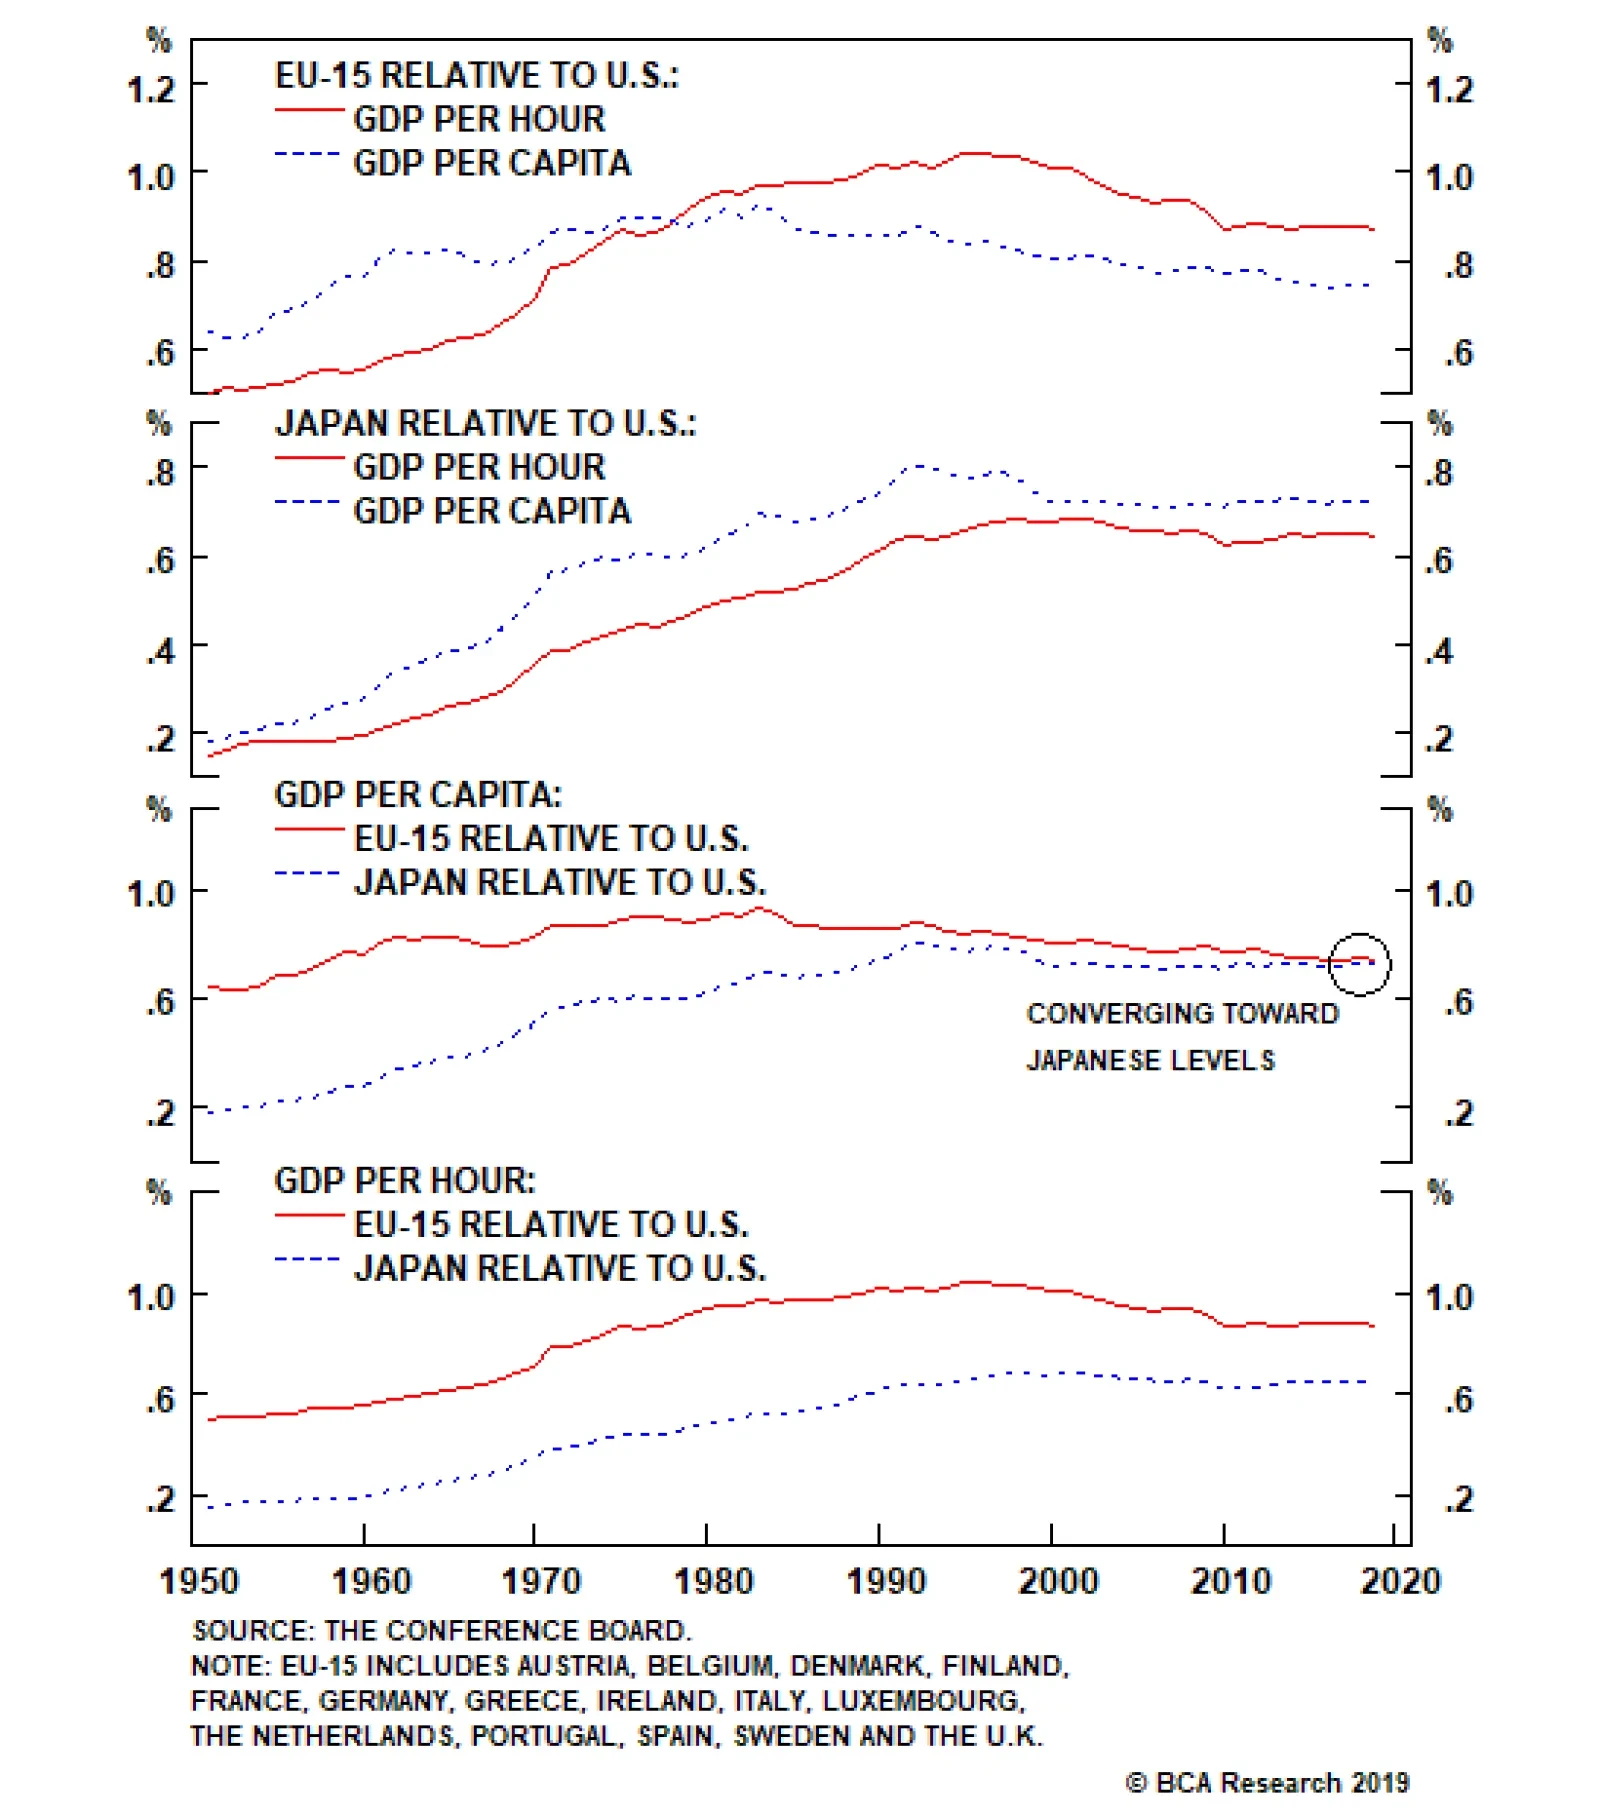
The second factor weighing on European asset utilization and returns is the poorer level of labor productivity. From the 1950s to the early 1980s, European GDP per worker rose relative to the U.S., albeit peaking at 92% of the levels across the Atlantic. Due…