Europe

Highlights Chinese credit origination surpassed expectations in March. Credit growth is now clearly trending higher, and the latest data suggest that economic activity is rebounding. This bodes well for global growth. The conventional wisdom is that China’s releveraging efforts represent “short-term gain for long-term pain.” We disagree. For the most part, Chinese releveraging is inevitable, desirable, and sustainable. Credit growth is inevitable because rising debt is necessary for transforming the country’s copious savings into fixed-asset investment. It is desirable for ensuring that GDP growth stays close to trend. It is broadly sustainable because the interest rate at which the government and much of the private sector are able to borrow is well below the economy’s growth rate. In fact, under a plausible set of assumptions, faster credit growth in China could lead to a lower debt-to-GDP ratio. Stronger global growth later this year should weaken the U.S. dollar. We are closing our long DXY trade for a carry-adjusted gain of 16.4% and exiting our long USD/CNY trade for a loss of 3.1%. We are also taking profits on our short AUD/CAD, short EUR/CAD, and short EUR/RUB trades of 1.6%, 3.9%, and 8.6%, respectively, and initiating two new currency trades: short USD/RUB and long EUR/JPY. The combination of a weaker dollar and faster Chinese growth should benefit EM and European stocks. Gold hit our limit buy order of $1275/ounce and we are now long the yellow metal. Feature A Blockbuster Month For Chinese Credit Growth After turning cautious for about six months, we moved back to being bullish on global equities in late December. We also sold our put on the EEM ETF on January 3rd for a gain of 104% in anticipation of a wave of Chinese credit stimulus. Credit growth blew past expectations in January, but surprised on the downside in February. This made the March release particularly important. In the end, the March data did not disappoint those who were hoping for a solid reading. New CNY loans rose by RMB 1690 billion, above Bloomberg consensus estimates of RMB 1250 billion. Our adjusted aggregate financing measure, which excludes a number of items such as equity financing but includes local government bond issuance, rose by 12.3% year-over-year, up from 11.6% in February (Chart 1). China’s credit impulse leads the import component of its manufacturing PMI (Chart 2). The credit impulse bottomed in November 2018, which should feed into higher imports over the coming months. This week’s release of better-than-expected data on industrial production, retail sales, and housing activity all suggest that the rebound in Chinese growth is already afoot. Chart 1Chinese Credit Growth Is Rebounding...
Chinese Credit Growth Is Rebounding...
Chinese Credit Growth Is Rebounding...
Chart 2...Which Should Bode Well For Global Exports To China
...Which Should Bode Well For Global Exports To China
...Which Should Bode Well For Global Exports To China
Short-Term Gain For Long-Term Pain? At times like these, the bears are always ready with their standby argument: Sure, China may be stimulating, but all that credit growth will just make the debt bubble even bigger. Once the bubble bursts, there will be hell to pay. Long-term investors should steer clear of any growth-sensitive assets. It is a seductive argument. But it is wrong. Chinese releveraging is: 1) inevitable; 2) desirable; and 3) sustainable. The fundamental macroeconomic problem that China faces is that it consumes too little of what it produces. 1. Chinese Debt Growth Is Inevitable The fundamental macroeconomic problem that China faces is that it consumes too little of what it produces. The result is a national savings rate of 45%, by far the highest of any major economy (Chart 3). Chart 3China Still Saving A Lot
China Still Saving A Lot
China Still Saving A Lot
Chart 4From Exporting Savings To Investing Domestically And Building Up Debt
From Exporting Savings To Investing Domestically And Building Up Debt
From Exporting Savings To Investing Domestically And Building Up Debt
There was a time when China was able to export a large part of its excess production. Its current account surplus reached nearly 10% of GDP in 2007. As its economy has grown in relation to the rest of the world, running massive trade surpluses has become more difficult. This is especially true today, when the country is being targeted by the Trump administration and much of the international community for alleged unfair trade practices. As China’s ability to churn out large current account surpluses declined, the government moved to Plan B: propping up growth by recycling the country’s copious savings into fixed-asset investment. This process saw households park their savings in banks and other financial institutions which, in turn, lent the money out to companies and local governments in order to finance various investment projects. Not surprisingly, debt levels exploded higher (Chart 4). As China’s population ages and more workers leave the labor force, savings will decline. However, this is likely to be a slow process. In the meantime, further debt growth is inevitable. 2. Chinese Debt Growth Is Desirable In an ideal world, Chinese households would consume more of their incomes, leaving only enough savings to finance high-quality private and public investment projects. That is not the world we are living in. In a far-from-ideal world, we need to think about second-best solutions. Yes, a sizable share of Chinese investment spending goes towards projects of dubious value. Yet, the same could have been said about Japan’s fabled “bridges to nowhere.” One may regard the construction of a seldom-used bridge as a misallocation of capital. But what is the counterfactual? If the bridge had not been built, would the workers have found productive work? If not, then there also would have been a misallocation of capital – human capital – which is arguably a much more serious problem. In any case, keep in mind that the rate of return on private investment depends on the state of the economy. If an economy is suffering from chronic lack of demand, only the most worthwhile projects will be undertaken. As the economic outlook improves, the set of viable projects will expand. It is only when all excess private-sector savings have been depleted, and interest rates are rising, that public spending starts to crowd out private investment. 3. Chinese Debt Growth Is Sustainable Even if one accepts the proposition that China needs continued debt growth to maintain full employment, is it still possible that all this additional debt will push the economy into a full-blown debt crisis? Most self-professed “serious-minded” observers would say yes. But then again, many of these same observers were predicting that Japan was heading for a debt crisis when government debt reached 100% of GDP in the late 1990s. Today, Japan’s government debt-to-GDP ratio stands at about 240% of GDP, and yet interest rates remain at rock-bottom levels. China will avoid a debt crisis for the same reason Japan has been able to avoid one. Much of China’s debt stock is composed of state-owned enterprise, local government, and other forms of quasi-public sector debt. Credit policy in China is often indistinguishable from fiscal policy. Given the abundant supply of savings in the economy, most of this debt can be internally financed at fairly low interest rates. The standard equation for government debt dynamics says that the change in the debt-to-GDP ratio, D/Y, can be expressed as:1
Image
G - T is the primary budget deficit, r is the borrowing rate, and g is the growth rate of the economy (it is irrelevant whether r and g are defined in nominal or real terms, as long as they are both expressed the same way). China will avoid a debt crisis for the same reason Japan has been able to avoid one. The Chinese 10-year government bond yield is currently four percentage points below projected GDP growth over the next decade, which is one of the biggest gaps among the major economies (Chart 5). Arithmetically, this means that China can have as large a primary fiscal deficit as it wants. As long as r remains below g, the debt-to-GDP ratio will converge to a stable level. Chart 6 shows this point analytically.
Chart 5
Chart 6
In fact, it is possible that a permanently larger budget deficit could lead to a decline in the equilibrium debt-to-GDP ratio. How could that be? The answer is revealed by the equation above. If the debt-to-GDP ratio is fairly high to begin with and an increase in the primary budget deficit leads to higher inflation (and hence, lower real rates and/or faster nominal GDP growth), this could more than fully counteract the increase in the deficit. Chart 7Stronger Growth Coincided With Accelerating Inflation And Lower Real Rates
Stronger Growth Coincided With Accelerating Inflation And Lower Real Rates
Stronger Growth Coincided With Accelerating Inflation And Lower Real Rates
This is not just a theoretical curiosity. Historically, Chinese inflation has risen while real rates have fallen whenever GDP growth has accelerated (Chart 7). Given China’s high debt levels, even a modest amount of additional inflation could put significant downward pressure on the debt-to-GDP ratio.2 Of course, all this is predicated on the assumption that faster credit growth will not cause interest rates to rise above the growth rate of the economy. For the portion of China’s debt stock that is either directly or indirectly backstopped by the central government, this seems like a safe assumption. After all, if credit/fiscal stimulus is simply being undertaken in response to inadequate demand, there is no need for policymakers to hike rates. Things get trickier when we look at private debt. In the past, the government has encouraged state-owned banks to roll over souring loans for fear that a wave of defaults would undermine the economy and endanger social stability. More recently, however, policymakers have been backing away from this strategy due to the well-founded view that it encourages moral hazard. Faster growth in China in the second half of this year will lift Chinese imports. This will be welcome news for the rest of the world. We expect the authorities to continue taking steps to instill market discipline by allowing failing firms to, well, fail. Realistically, however, the transition to a full market-based economy will take quite a bit of time. In the interim, the government will keep cutting taxes and increasing on-budget spending in order to ensure that any decline in employment among failing firms is offset by employment growth elsewhere. In such an environment, neither a debt crisis nor a deep economic slowdown appear likely. Investment Conclusions Faster growth in China in the second half of this year will lift Chinese imports. This will be welcome news for the rest of the world.
Chart 8
Chart 9Germany Welcomes The Upturn In Chinese Credit Growth
Germany Welcomes The Upturn In Chinese Credit Growth
Germany Welcomes The Upturn In Chinese Credit Growth
While the U.S. will benefit from a revival in Chinese growth, Europe will gain even more (Chart 8). Germany, in particular, should see a pronounced acceleration in growth. China’s credit impulse leads Chinese automobile spending which, in turn, reliably leads euro area automobile exports, as well as overall exports (Chart 9). The recent rebound in the expectations component of the German ZEW index, as well as in the manufacturing output component of the April flash PMI, suggests that green shoots are starting to sprout (Chart 10). Italy should also benefit from the steep drop in bond yields since last October (Chart 11). Italian industrial production strongly surprised to the upside in February, suggesting that the euro area’s third biggest economy may have finally turned the corner. Chart 10Tentative Green Shoots Out Of Germany
Tentative Green Shoots Out Of Germany
Tentative Green Shoots Out Of Germany
Chart 11Italy: The Drop In Bond Yields Should Boost The Economy
Italy: The Drop In Bond Yields Should Boost The Economy
Italy: The Drop In Bond Yields Should Boost The Economy
The ECB will not hike rates this year even if growth shifts into higher gear, but the market will probably price in a bit more monetary tightening in 2020 and 2021. This should help lift the euro. We recommend that investors position themselves for this by going long EUR/JPY. Relatedly, we are closing our short EUR/CAD trade for a gain of 3.9%. The U.S. dollar tends to be a countercyclical currency, meaning that it moves in the opposite direction of the global business cycle (Chart 12). This countercyclicality stems from the fact that the U.S. is more geared towards services than manufacturing compared with most other economies (Chart 13). As such, when global growth accelerates, capital tends to flow from the U.S. to the rest of the world, translating into more demand for foreign currency and less demand for dollars. Chart 12The Dollar Is A Countercyclical Currency
The Dollar Is A Countercyclical Currency
The Dollar Is A Countercyclical Currency
Chart 13The U.S. Is A Low-Beta Play On Global Growth
The U.S. Is A Low-Beta Play On Global Growth
The U.S. Is A Low-Beta Play On Global Growth
A “patient” Fed and the prospect of stronger global growth in the second half of this year are bearish for the dollar. As such, we are closing our long DXY trade for a carry-adjusted gain of 16.4% and exiting our long USD/CNY trade for a loss of 3.1%. We are also closing our short AUD/CAD trade for a gain of 1.6%. Faster Chinese growth will boost metal prices, which is bullish for the Aussie dollar. Lastly, we are switching our short EUR/RUB trade (which is currently up 8.6%) into a short USD/RUB trade. A weaker greenback and stronger global growth will be manna from heaven for international stocks, especially when priced in U.S. dollars. Investors should prepare to move European and EM equities to overweight within a global equity portfolio during the coming weeks. A “patient” Fed and the prospect of stronger global growth in the second half of this year are bearish for the dollar. We are less keen on upgrading Japanese equities. While Japanese exporters will benefit from stronger Chinese growth, the domestic economy will be weighed down by the upcoming hike in the sales tax, which is slated to take place in October. Moreover, the yen is likely to experience headwinds as global bond yields rise in relation to JGB yields. Investors contemplating buying Japanese stocks should hedge any currency risk. Finally, the price of gold fell to $1275/ounce earlier this week, triggering our buy order. With the Fed on pause, the U.S. economy starting to overheat, and the dollar likely to trend lower, bullion could shine over the coming months. Peter Berezin, Chief Global Strategist Global Investment Strategy peterb@bcaresearch.com Footnotes 1 Please see Global Investment Strategy Weekly Report, “Is There Really Too Much Government Debt In The World?” dated February 22, 2019, for a fuller discussion of this debt sustainability equation.
Image
Strategy & Market Trends MacroQuant Model And Current Subjective Scores
Chart 14
Tactical Trades Strategic Recommendations Closed Trades
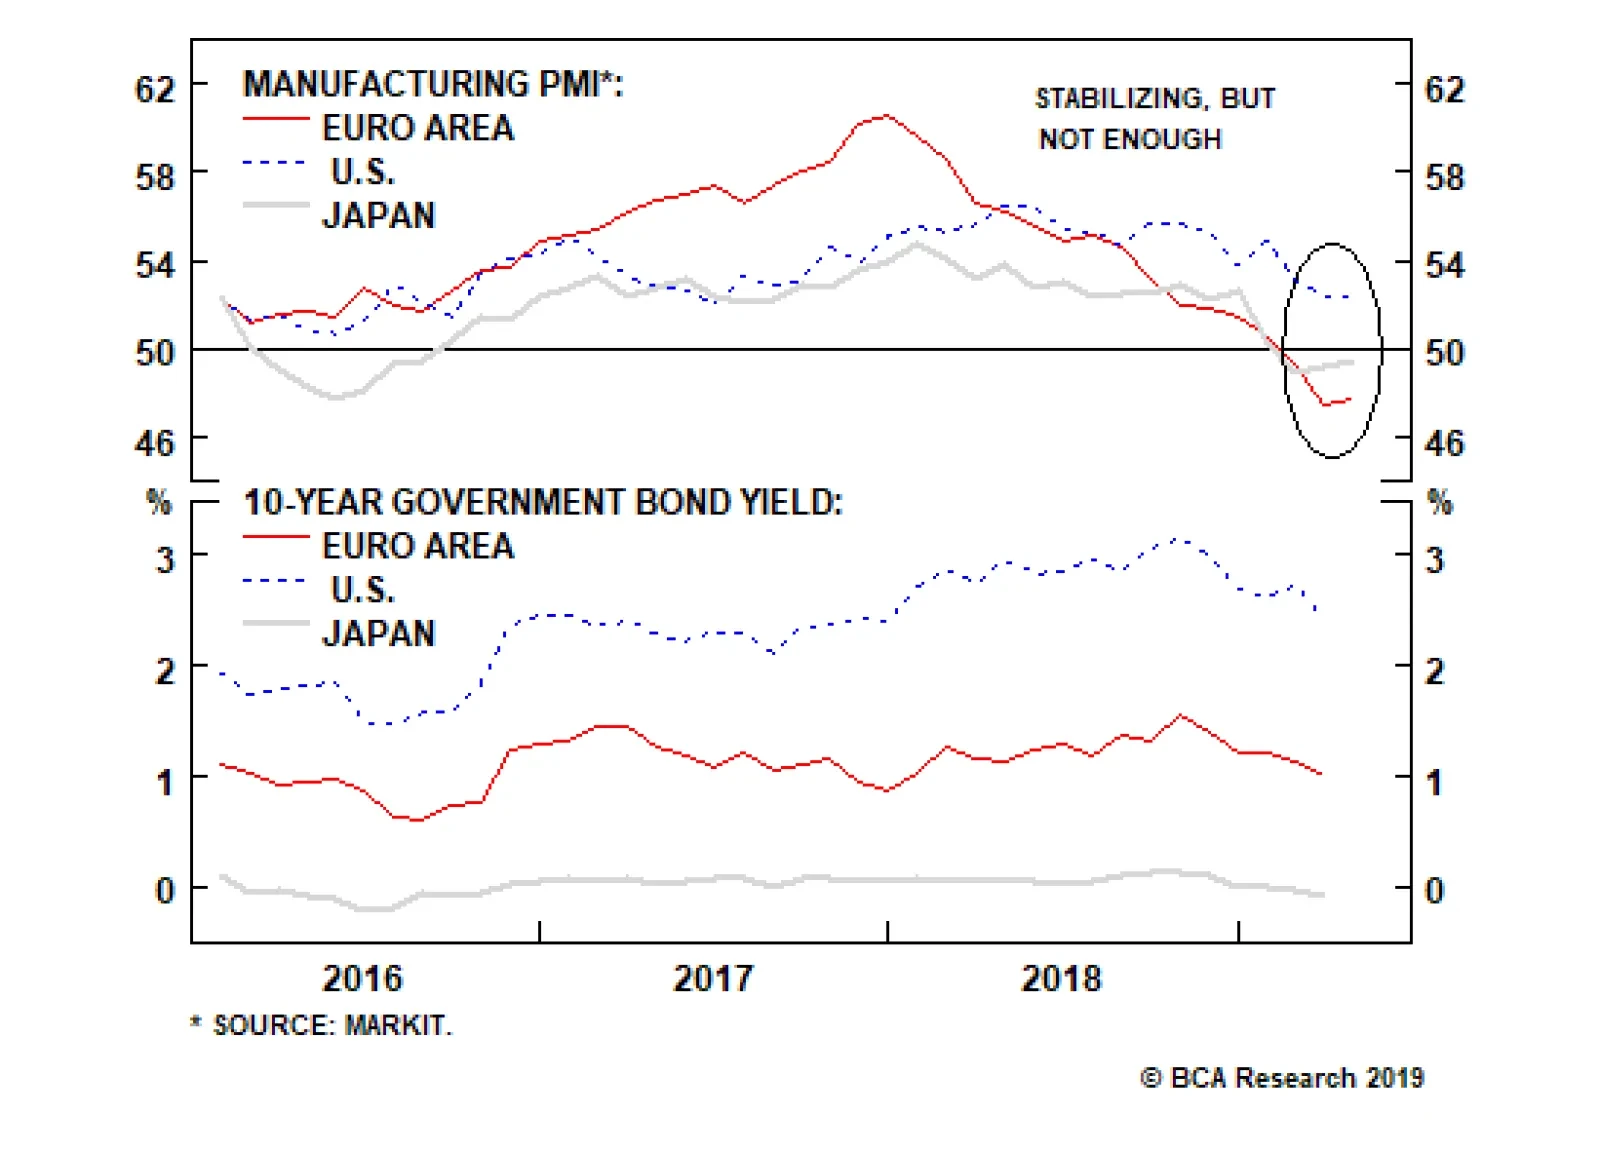
The flash estimates for the Eurozone manufacturing PMI moved up in April to 47.8 from 47.5. In Japan, they rose to 49.5 from 49.2. In the U.S, they were stable at 52.4. Despite this stabilization, bond yields weakened and the counter-cyclical dollar…
Dear Client, This Special Report is the full transcript and slides of a keynote presentation I recently gave to the Sovereign Investor Institute in London titled: 'The Biggest Risks To The Global Economy Are…' The short presentation pulls together several concepts and observations which identify the ‘weak links’ in the global economy. Therefore, the presentation should serve as a useful summary of the global economy’s current vulnerabilities. The report then explains how each of the risks translates into a European investment context. I hope you find it insightful. Best regards, Dhaval Joshi, Chief European Investment Strategist
Image
Feature Full Transcript And Slides
Image
Good morning Thank you for inviting me to give today’s keynote presentation under the title: ‘The Biggest Risks To The Global Economy Are…’ (Slide 1). I will not discuss all the risks out there, but the four risks that I will present are the ones that I think are the most significant. And the biggest of these four risks I will leave to the end. So let’s begin. Risk 1 is China’s Credit Cycle (Slide 2). You can see this very clearly in this slide (Slide 3) which shows the short-term accelerations and decelerations in credit within the world’s three largest economies – Europe, the United States, and China. In essence, it is showing how much new credit was created in the last six months compared with the preceding six months. Was it more credit creation or was it less, and how much more or less? Everything is in dollars to allow a fair comparison.
Image
Image
Now look at the red line. The red line is China. Just ten years ago, China’s credit cycle was irrelevant. It simply didn’t matter. But after the GFC, China’s short-term credit expansions and contractions suddenly became as large as those in Europe and the U.S. More recently, China’s cycle is dwarfing the others, so now it is the European and the U.S. credit cycles that are irrelevant! This means that whenever China’s short-term credit cycle turns down, as it did in late 2015, early 2017, and 2018, the global economy feels a chill. The point is that this short-term cycle is a near-perfect oscillator. Down-oscillations will occur every eighteen months or so, and any of them has the potential to turn nasty. Though we are currently in an up-oscillation, the next down-oscillation is due later this year. And I predict that it will pose a big risk to the global economy. Risk 2 is Trade Imbalances (Slide 4). This slide (Slide 5) has a mischievous title ‘Where President Trump Is Right About Europe’. The red line shows where the president is absolutely right: Europe is running a massive – a record-high – trade surplus with the United States. It is an undeniable fact. But the president is wrong about the underlying cause. The underlying cause is not unfair trade practices or tariffs, the underlying cause is the other line, the blue line, which shows the divergent monetary policies of the ECB and the Fed.
Image
Image
The trade imbalance and monetary policy divergence are moving together tick for tick, and the transmission mechanism is of course the exchange rate. The divergent monetary policies have depressed the euro, and a depressed euro obviously makes German cars cheaper for American consumers. That is the reason that the president is seeing so many BMWs driving down Fifth Avenue! My point is that these record-high imbalances are being used to justify economic nationalism – retaliatory tariffs, restricted trade, and potentially all-out trade wars. Alternatively, this chart suggests that the imbalances would correct with large-scale movements of exchange rates. But to me, either of these options poses a big risk to the global economy. Risk 3 Is Technological Disruption (Slide 6). To understand why, I want to introduce you to a concept known as Moravec’s Paradox (Slide 7). A professor of robotics, Hans Moravec, noticed something odd. He realized that things that we find very hard are actually very easy for AI. Things like complex mathematics, speaking multiple languages, or advance pattern recognition. Typically, as few people have these skills, they are well-paid skills.
Image
Image
Whereas things that we find very easy are incredibly difficult for AI. Things like human movement and recognizing, and responding to, emotional signals. Typically, as everybody has these skills, they are low-paid skills. Moravec’s Paradox means that the current wave of technological progress is much more disruptive than previous waves. The steam engine destroyed low-paid jobs, forcing workers up the income ladder. But the current wave of technology, led by AI, is destroying well-paid jobs forcing workers down the income ladder.
Image
You can see it in the data. While job creation in most major economies is on the face of it very strong, just look at what type of jobs are being created (Slide 8). Food delivery, bar work, care work and social work. Now you’ll agree that this is not highly paid work with career prospects! In essence, the current wave of technology is revealing a huge misallocation of capital. You might have invested huge amounts of time and money in say, becoming a linguist. Only to find that AI can translate languages much better than you – and your employment opportunities are limited to lower-income work. Well that misallocation of capital is very disruptive. In my opinion, it’s one of the main reasons why even though economies are growing and unemployment is very low, people don’t feel good. Making them susceptible to simplistic fixes such as ‘take back control’ and economic nationalism. My point is that the current wave of AI-led job disruption has much further to run, and the populist backlash will remain a big risk to the global economy. But now I want to turn to what I believe is the biggest risk of all. Risk 4 Is Higher Bond Yields (Slide 9). Most people believe that economic downturns cause financial market downturns. But the truth is the complete opposite: the causality almost always runs the other way! In the vast majority of cases, it is financial market imbalances and mispricing that cause economic downturns and crises. Take the last three economic downturns – in 2001, in 2008 and in 2011. They all had their roots in financial mispricing – the dot com bubble, the U.S. mortgage market, and euro area sovereign debt. Likewise for the Great Depression in the 30s, Japan’s recession in the early 90s. I could go on. You get the point… What is the financial vulnerability today that could cause an economic downturn? (Slide 10) The answer is that the very rich valuation of equities and other risk-assets is highly sensitive to bond yields. Which means that substantially higher bond yields pose a very big risk to the global economy.
Image
Image
You see, at very low bond yields, the bond price can no longer go up much but it can go down massively (Slide 11). The latest advances in financial theory now conclusively show that this unattractive ‘negative’ asymmetry is what defines ‘risk’ for investors. The crucial point is that at low bond yields, bonds become as risky, or more risky, than equities (Slide 12). And this necessarily means that equities no longer need to deliver a superior return, a risk-premium, over the low bond yield (Slide 13). As bond yields decline this means equity valuations get an exponential boost because both components of the equity’s required return – the risk-free component and the risk-premium component – are collapsing simultaneously (Slide 14).
Image
Image
Image
Image
But if bond yields rise substantially, the process would go into vicious reverse and equity valuations would fall off a cliff. Other risk-assets too, and bear in mind that if we include real estate – as we should – global risk-assets are worth $400 trillion, five times the size of the global economy! Our research shows that the point of vulnerability is if the global 10-year bond yield approaches 2 percent, which is about 50 basis points above where it stands right now. And that, to me, is by far the biggest risk to the global economy.
Image
So to summarise, the biggest risks to the global economy are: China’s credit cycle; trade imbalances and technological disruption and their associated populist backlash; and the biggest risk is higher bond yields (Slide 15). In the near future I think alarm bells should start to ring if China’s credit cycle has tipped into a down-oscillation and/or the global 10-year bond yield is 50 bps higher. Don’t worry, the alarm bells are not ringing right now but they might be later this year. Finally, given the title you gave me, this presentation has necessarily focussed on the key risks. But I don’t want you to get too negative. I also have another presentation called ‘The Biggest Positives For The Global Economy Are…’ And for balance, I hope you invite me to present that next time! Thank you. How Do The Risks Translate Into A European Investment Context? Risk 1: China’s Credit Cycle, is highly relevant to European investors, for two reasons. First, the European economy is very open, meaning that exports make a substantial contribution to GDP growth. This is especially true in Europe’s engine economy, Germany, but it is also important for other major economies like Sweden. And it is evidenced in large trade surpluses as, for example, illustrated in Slide 5. Therefore, whenever China’s credit cycle enters a down-oscillation, as it did last year, Germany cannot escape the nasty chill coming through its all-important net export channel. Second, the European equity market is over-exposed to global growth sensitive sectors and companies – specifically, Industrials, Materials, and Financials. These sectors tend to have a very high operational gearing to global growth. Meaning that a small change in global growth has a disproportionate effect on these companies’ profits and share price performance. The upshot is that in a credit cycle up-oscillation, Europe’s global-growth sensitive stock markets and sectors benefit from a sharp burst of outperformance. The opposite applies in a credit cycle down-oscillation. It follows that if China’s credit cycle is due to tip into a down-oscillation later this year, it would be time to close our successful relative overweighting to European equities and to the global growth sensitive cyclical sectors. Risk 2: Trade Imbalances, is also highly relevant to European investors, for the obvious reason that European economies – especially Germany – are running huge trade surpluses. This puts these economies squarely in the cross-hairs of a retaliatory salvo involving tariffs, trade barriers, or worse, an all-out trade war. Clearly, Europe’s ‘exporting champions’ are the most vulnerable to this risk. The issue is important for the exchange rate too. We showed conclusively that Europe’s trade imbalance is the consequence of the depressed euro. It follows that another way to correct this imbalance is via a stronger euro. In this sense, the fundamentals imply euro upside from here. Risk 3: Technological Disruption, manifests through disruption in the jobs market, the lack of feel good, and the ensuing backlash leading to populism and nationalism. This is particularly relevant to Europe because its collection of nations, each with its own political processes, provides more scope for a political tail-event. A lull in the major political-event cycle is a good thing for Europe. In this regard, the upcoming EU parliamentary elections is not a big risk given the EU parliament’s inability, by itself, to drive policy. The risk increases approaching a meaningful political event, and this includes the date of Brexit. Therefore, this risk is likely to rise somewhat towards the end of the year. Risk 4: Higher Bond Yields, is clearly very relevant to Europe because many of the core euro area bond yields are at their lower bound. This means that the negative asymmetry of returns has its maximum impact on, for example, German bunds. It follows that German bunds are a sell in the near-term. Nevertheless, the upside to yields is ultimately limited given the aforementioned vulnerability of risk-asset valuations to higher bond yields. Therefore, the better long-term strategy is to short German bunds relative to U.S. T-bonds. Finally, a 50 basis points rise in 10-year yields from current levels would be a trigger to flip to underweight European equities. Fractal Trading System* Crude oil is at a technical reversal level. The best way to play this is on a hedged basis versus metals: short WTI, long LMEX. Set the profit target at 5 percent with a symmetrical stop-loss. In other trades, we are pleased to report long AUD/CNY achieved its profit target at which it was closed. This leaves five open positions. For any investment, excessive trend following and groupthink can reach a natural point of instability, at which point the established trend is highly likely to break down with or without an external catalyst. An early warning sign is the investment’s fractal dimension approaching its natural lower bound. Encouragingly, this trigger has consistently identified countertrend moves of various magnitudes across all asset classes.
Short WTI / Long LMEX
Short WTI / Long LMEX
The post-June 9, 2016 fractal trading model rules are: When the fractal dimension approaches the lower limit after an investment has been in an established trend it is a potential trigger for a liquidity-triggered trend reversal. Therefore, open a countertrend position. The profit target is a one-third reversal of the preceding 13-week move. Apply a symmetrical stop-loss. Close the position at the profit target or stop-loss. Otherwise close the position after 13 weeks. Use the position size multiple to control risk. The position size will be smaller for more risky positions. * For more details please see the European Investment Strategy Special Report “Fractals, Liquidity & A Trading Model,” dated December 11, 2014, available at eis.bcaresearch.com Dhaval Joshi, Chief European Investment Strategist dhaval@bcaresearch.com Fractal Trading Model Recommendations Asset Allocation Equity Regional and Country Allocation Equity Sector Allocation Bond and Interest Rate Allocation Currency and Other Allocation Closed Fractal Trades Trades Closed Trades Asset Performance Currency & Bond Equity Sector Country Equity Indicators Bond Yields Chart I-1Indicators To Watch - Bond Yields
Indicators To Watch - Bond Yields
Indicators To Watch - Bond Yields
Indicators To Watch - Bond Yields
Indicators To Watch - Bond Yields
Indicators To Watch - Bond Yields
Indicators To Watch - Bond Yields
Indicators To Watch - Bond Yields
Indicators To Watch - Bond Yields
Indicators To Watch - Bond Yields
Indicators To Watch - Bond Yields
Indicators To Watch - Bond Yields
Interest Rate Indicators To Watch - Interest Rate Expectations
Indicators To Watch - Interest Rate Expectations
Indicators To Watch - Interest Rate Expectations
Indicators To Watch - Interest Rate Expectations
Indicators To Watch - Interest Rate Expectations
Indicators To Watch - Interest Rate Expectations
Indicators To Watch - Interest Rate Expectations
Indicators To Watch - Interest Rate Expectations
Indicators To Watch - Interest Rate Expectations
Indicators To Watch - Interest Rate Expectations
Indicators To Watch - Interest Rate Expectations
Indicators To Watch - Interest Rate Expectations
Unsurprisingly, incoming data has been weak of late, which the ECB (like other central banks) blamed on the external environment. It did fall short of speculation that it will introduce a tiered system for its marginal deposit facility, which would have…
Welcome to Italy! After the 2008 global financial crisis, Italian banks’ balance sheets were left unrepaired and undercapitalized. For an individual bank whose solvency is impaired, the right thing to do is shrink its loan book relative to its equity…
Highlights Evidence continues to mount that the Chinese economy is in a bottoming process. This suggests the path of least resistance for the RMB is up. Meanwhile, as the U.S. and China move closer to a trade deal, any geopolitical risk premium in the RMB will slowly erode. The ultimate catalyst for CNY longs will be depreciation in the U.S. dollar, which we believe is slowly underway. The ECB is turning more dovish at a time when euro area growth is hitting a nadir. This will be bullish for the euro beyond the near term. Our limit buy on the pound was triggered at 1.30. Target 1.45 with stops at 1.25. With the Aussie dollar close to the epicenter of Chinese stimulus, data down under is increasingly stabilizing. We are closing our short AUD/NOK position for a small profit. Feature Chart I-1The Chinese Yuan Is Pro-cyclical
The Chinese Yuan Is Pro-cyclical
The Chinese Yuan Is Pro-cyclical
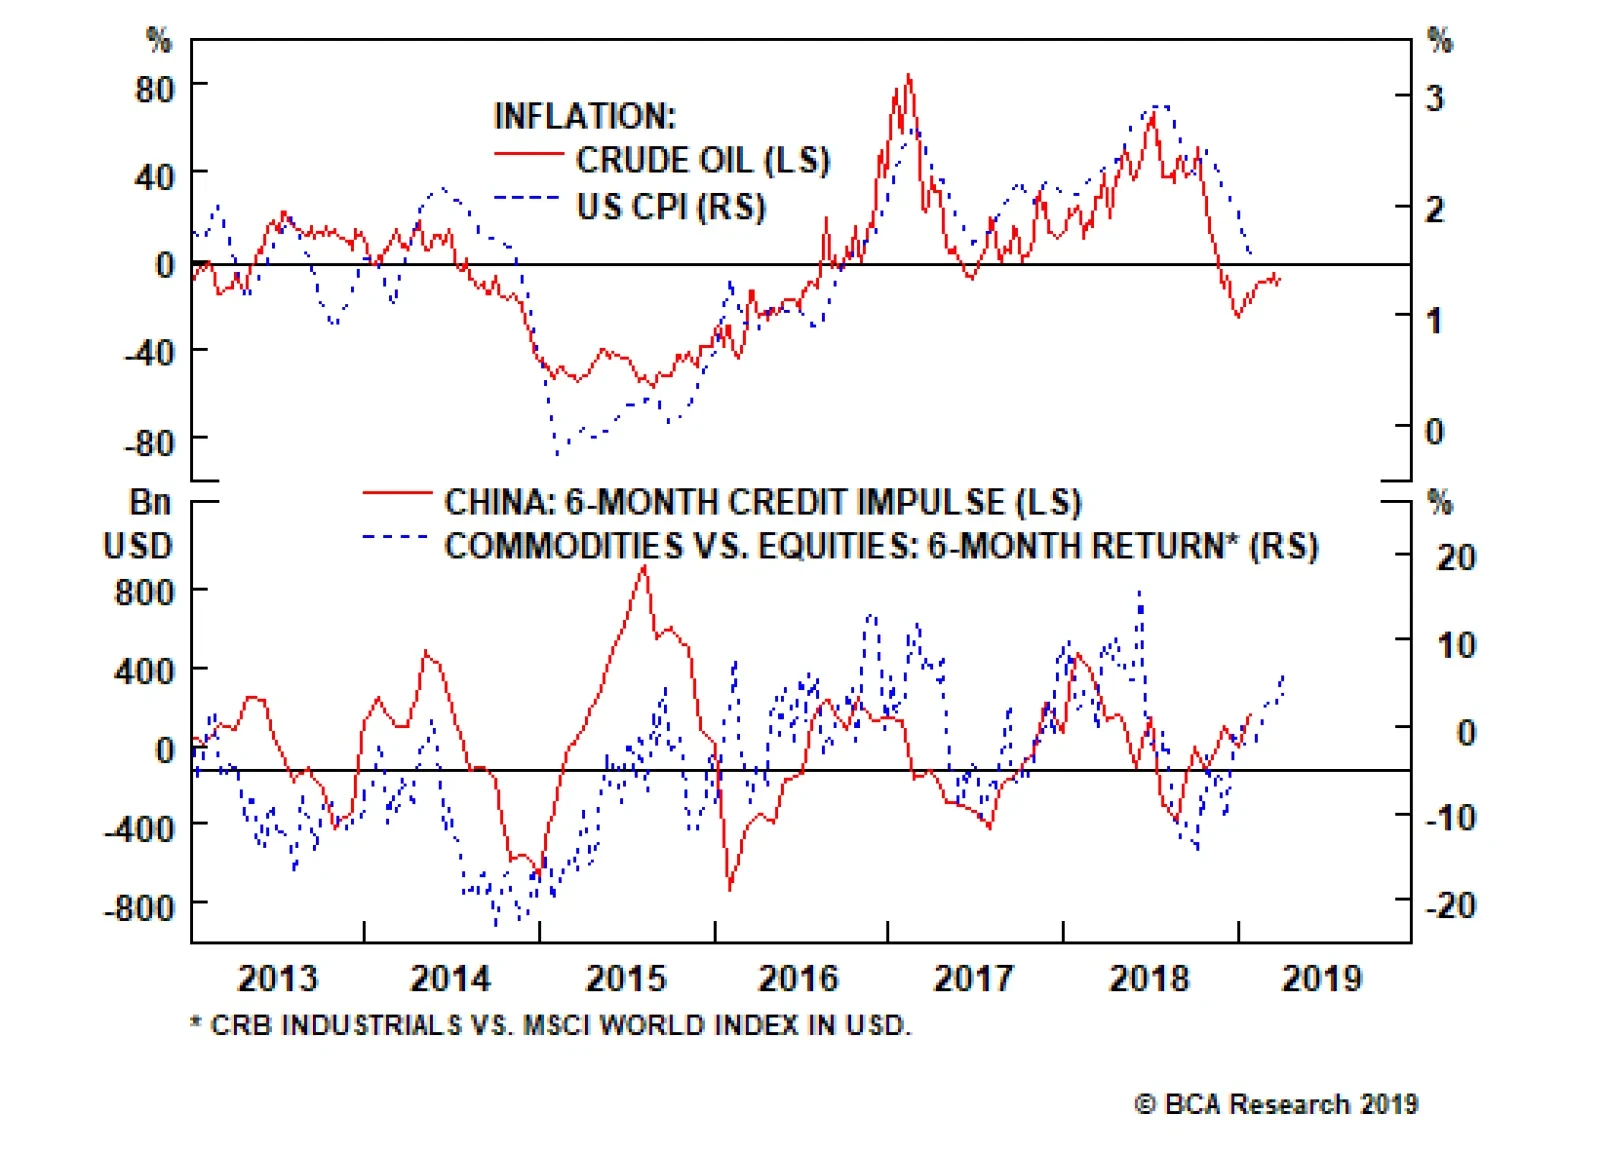
In addition to the dovish shift by global central banks, most investors are rightly fixated on China at this juncture in the economic cycle. For one, it has been mostly responsible for the mini cycles in the global economy since 2014. And with improvements in both Chinese credit and manufacturing data in recent months, the consensus is drawing closer to the fact that we may be entering a reflationary window. Looking at risk assets, MSCI China is up 25% from its lows, while the S&P 500 is up 20%. Commodity prices are also rising, with crude oil hitting a new calendar-year high this week. The corollary is that if the improvement in Chinese data proves sustainable, it will propel these asset markets to fresh highs. The evolution of the cycle has important implications for the yuan exchange rate, because the RMB has been trading like a pro-cyclical currency in recent years. The USD/CNY has been moving tick for tick with emerging market equities, Asian currencies, and even some commodity prices (Chart I-1). Ever since its liberalization over a decade ago, the RMB may finally be behaving like a free-floating exchange rate. Therefore, a simple evaluation of how relative prices between China and the rest of the world evolve will be valuable input for the fair value of the RMB exchange rate. Reading the tea leaves from Chinese credit data can be daunting, but we agree with the assessment of our China Investment Strategy team that while the credit impulse has clearly bottomed,1 the magnitude of the rise is unlikely to be what we saw in 2015-2016. That said, a higher credit-to-GDP ratio also requires a smaller increase in credit growth to have an outsized effect on GDP. As such, monitoring what is happening with hard data in the economy concurrently – in particular, green shoots – could add valuable evidence to the reflation theme. A Repeat Of 2016? Cycle bottoms can be protracted and volatile, but also V-shaped. So it is useful when economic data is at a nadir to pay attention to any green shoots emerging, because by the time the last piece of pertinent economic data has turned around, it may well be too late to call the cycle. Admittedly, most measures of Chinese (and global) growth remain weak. But there have been notable improvements in recent months that suggest economic velocity may be picking up: Production of electricity and steel, all inputs into the overall manufacturing value chain, are inflecting higher. Intuitively, these tend to lead overall industrial production. Overall industrial production remains weak, but the production of electricity and steel, all inputs into the overall manufacturing value chain, are inflecting higher. Intuitively, these tend to lead overall industrial production (Chart I-2). Electricity production for the month of February grew 5% after grinding to a halt in 2015-2016. Production of steel also rose by 7%. If these advance any further, they will begin to exceed Q4 GDP growth, indicating a renewed mini-cycle. Chart I-2A Revival In Industrial Activity
A Revival In Industrial Activity
A Revival In Industrial Activity
Chart I-3Metal Prices Are Sniffing A Rebound
Metal Prices Are Sniffing A Rebound
Metal Prices Are Sniffing A Rebound
In recent weeks, both steel and iron ore prices have been soaring. Many commentators have attributed these increases to supply bottlenecks and/or seasonal demand. However, it is evident from both the manufacturing data and the trend in prices that demand is also playing a role (Chart I-3). Overall residential property sales remain soft, but evidence from tier-1 and even tier-2 cities is signalling that this may be behind us, given robust sales. Over the longer term, the ebb and flow of property sales has tended to be in sync across city tiers. A revival in the property market will support construction activity and investment. House prices have been rising to the tune of 10% year-on-year, and real estate stocks in China may be sniffing an eventual pick-up in property volumes (Chart I-4). Over the last 20 years or so, Chinese credit growth has been a reliable indicator for car sales with a lead of about six months. Government expenditures were already inflecting higher ahead of last month’s China National People’s Congress (NPC). Again, this suggests stimulus this time around may be more fiscal than monetary (Chart I-5). In addition to the recent VAT cut for manufacturing firms from 16% to 13%, a string of policy easing measures will begin to accrue, including a cut to social security contributions effective May 1st, and perhaps a pickup in infrastructure spending. Already, real estate infrastructure spending growth is perking up, with that in the mining sector soaring to multi-year highs. Chart I-4Real Estate Volumes Could Pick Up
Real Estate Volumes Could Pick Up
Real Estate Volumes Could Pick Up
Chart I-5The Fiscal Spigots Are Opening
The Fiscal Spigots Are Opening
The Fiscal Spigots Are Opening
Finally, Chinese retail sales including those of durable goods remain very weak. Car sales are deflating at the fastest pace in over two decades. But the latest VAT cut by the government is being passed through to consumers, with an increasing number of car manufactures cutting retail prices. Chart I-6Car Sales Typically Have V-Shaped Recoveries
Car Sales Typically Have V-Shaped Recoveries
Car Sales Typically Have V-Shaped Recoveries
Over the last 20 years or so, Chinese credit growth has been a reliable indicator for car sales with a lead of about six months (Chart I-6). The indicator right now suggests we could witness a coiled-spring rebound in Chinese car sales over the next few months. Bottom Line: Both Chinese stocks and commodity prices have been suggesting a bottoming process in the domestic economy for a while now. Incoming data is beginning to corroborate this view. This has important implications for both the Chinese yuan and other global assets. Capital Flows Improving domestic and external conditions will likely offset any renewed pressure on the Chinese yuan from capital outflows. Our China Investment Strategy team reckons that even after adjusting for cross-border RMB settlements and illicit capital outflows, there is less evidence of capital flight today than there was in 2015-2016.2 Chart I-7Offshore Markets Don't See RMB Weakness
Offshore Markets Don't See RMB Weakness
Offshore Markets Don't See RMB Weakness
Typically, offshore markets have had a good track record of anticipating depreciation in the yuan. Back in 2014, offshore markets started pricing in a rising USD/CNY rate, and maintained that view all the way through to 2018, when the yuan eventually bottomed. Right now, no such depreciation is being priced in (Chart I-7). The reason offshore markets in Hong Kong and elsewhere can be prescient is because more often than not, they are the destination for illicit flows out of China. For example, one of the often-rumored ways Chinese money has left the country is through junkets, key operators in Macau casinos.3 These junkets bankroll their Chinese clients in Macau while collecting any debts in China allowing for illicit capital outflows. This was particularly rampant ahead of the Chinese 2015-2016 corruption clampdown, when Macau casino equities were surging while equity prices in China remained subdued. Historically, both equity markets tend to move together, since over 70% of visitors to Macau come from China (Chart I-8). Right now, both the Chinese MSCI index and Macau casino stocks are rising in tandem, suggesting gains are more related to fundamentals than hot money outflows. Chart I-8Macau Casinos: A Good Proxy For Chinese Spending
Macau Casinos: A Good Proxy For Chinese Spending
Macau Casinos: A Good Proxy For Chinese Spending
A surge in illicit capital outflows could also be part of the reason for an explosion in sight deposits in Hong Kong ahead of the 2015-2016 clampdown (Chart I-9). Admittedly, most of these deposits were and still are due to cross-border RMB settlements, but it is also possible that part of these constituted hot money outflows. With these sight deposits rising at a more reasonable pace, it suggests little evidence of capital flight. Chart I-9The Chinese Government Has Clamped Down On Illicit Flows
The Chinese Government Has Clamped Down On Illicit Flows
The Chinese Government Has Clamped Down On Illicit Flows
Trade Truce A trade truce between the U.S. and China will be the final catalyst for a stronger yuan. The news flow so far has been positive, with both U.S. President Donald Trump and Chinese President Xi Jinping publicly acknowledging they are closer to a deal. Even well-known China hawk Peter Navarro, head of the U.S. National Trade Council, has admitted that the two sides are in the final stages of talks. But with a still-ballooning U.S. trade deficit with China, Trump will want to take home a win (Chart I-10). Chart I-10Trump Needs To Take A Win Back To America
Trump Needs To Take A Win Back To America
Trump Needs To Take A Win Back To America
Concessions on the Chinese side so far seem reasonable, allowing us to speculate that there is a rising probability of a deal. They have agreed to increase agriculture and energy imports from the U.S. by about $1 trillion over the next six years, announced a cut on import tariffs, revised their Patent Law to improve protection of intellectual property, and provided a clear timeline for when foreign caps will be removed in sectors such as autos and financial services. These seem like very reasonable concessions that will allow Trump to go home and declare victory. Trade wars are usually synonymous with recessions. As such, there are acute political constraints inching both sides towards an agreement. For President Trump, a deteriorating U.S. manufacturing sector in the midwestern battleground states is a thorn in his side. For President Xi, rising unemployment is a key constraint. On the currency front, the details of any agreement are still unknown, but should Chinese economic fundamentals start to genuinely improve, it will put upward pressure under rates – and ergo the yuan (Chart I-11). A gradually rising yuan exchange rate will further assuage any doubts or concerns that Trump may have. Bottom Line: Our fundamental models show the yuan as undervalued by about 3%. This means China could allow its currency to gradually appreciate towards fair value, with little impact on the domestic economy or even exports. Given some green shoots in incoming economic data, little risk of capital flight, and the rising likelihood of a trade deal between the U.S. and China, our bias is that the path of least resistance for the Chinese RMB is up (Chart I-12). Chart I-11Rising Chinese Rates Will Favor The Yuan
Rising Chinese Rates Will Favor The Yuan
Rising Chinese Rates Will Favor The Yuan
Chart I-12The RMB Is Not Expensive
The RMB Is Not Expensive
The RMB Is Not Expensive
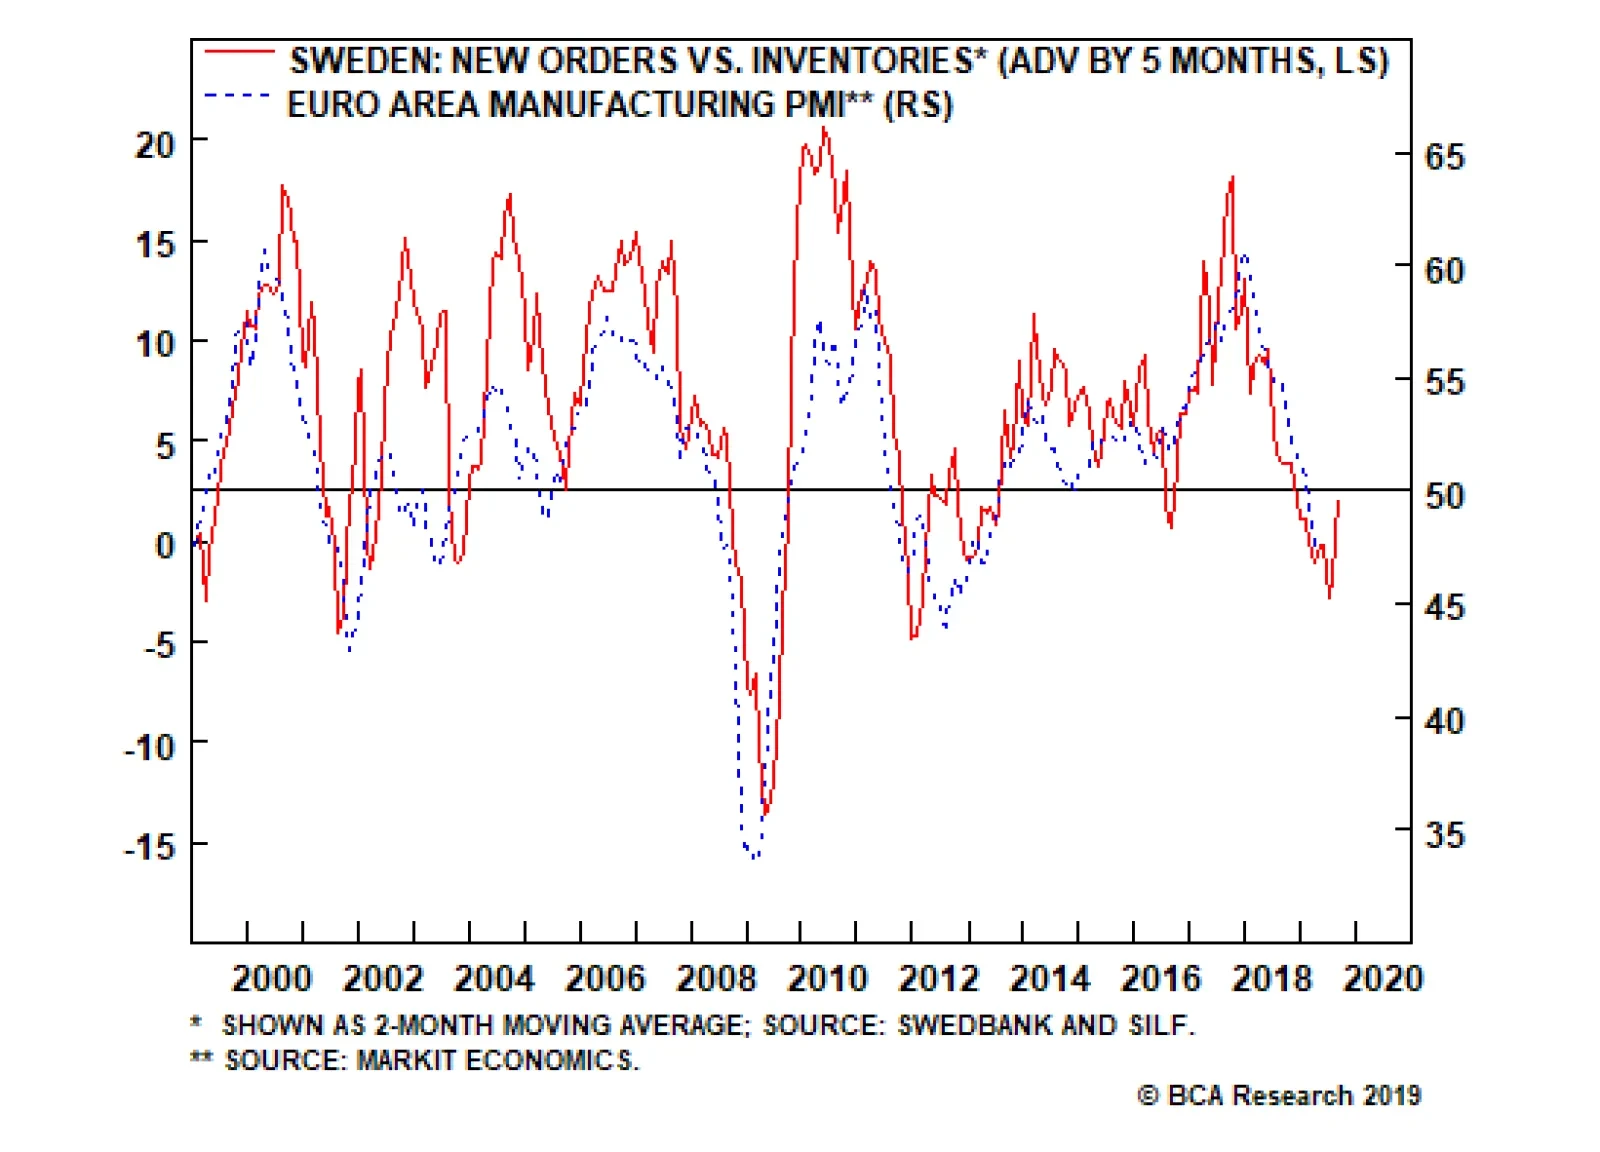
Another Dovish Shift By The ECB In another dovish twist, the European Central Bank kept monetary policy unchanged following this week’s meeting, while highlighting that it might be on hold for longer. Unsurprisingly, incoming data has been weak of late, which the ECB (like other central banks) blamed on the external environment. It did fall short of speculation that it will introduce a tiered system for its marginal deposit facility, which would have alleviated some cash flow pressures for euro area banks. Our bias is for the new Targeted Long Term Refinancing Operation (TLTRO III – in other words, cheap loans), to remain a better policy tool than a tiered central bank deposit system. In the case of a TLTRO, the ECB can effortlessly decentralize monetary policy, since liquidity gravitates towards the countries that need it the most. While a tiered system can allow a bank to offer higher rates and attract deposits, there is no guarantee that these deposits will find their way into new loans. It is also likely to benefit countries with the most excess liquidity. In the case of a TLTRO, the ECB can effortlessly decentralize monetary policy. Beyond any short-term volatility in the euro, we think the ECB’s dovish shift could be paradoxically bullish. If a central bank eases financing conditions at a time when growth is hitting a nadir, it is tough to argue that it is bearish for the currency. Meanwhile, fiscal policy is also set to be loosened. Swedish new orders-to-inventories lead euro area growth by about five months, and the recent bounce could be a harbinger of positive euro area data surprises ahead (Chart I-13). Chart I-13Euro Area Growth Will Recover
Euro Area Growth Will Recover
Euro Area Growth Will Recover
Bottom Line: European rates are further below equilibrium compared to the U.S., and the ECB’s dovish shift will help lift the euro area’s growth potential. Meanwhile, investors are currently too pessimistic on euro area growth prospects. Our bias is that the euro is close to a floor. House Keeping Our buy-stop on the British pound was triggered at 1.30. We recommend placing stops at 1.25, with an initial target of 1.45. As we argued last week,4 the odds of a hard Brexit continue to fall, with U.K. Prime Minister Theresa May explicitly saying this week that the path for the U.K. going forward is either a deal with the EU or with no Brexit at all. As we go to press, EU leaders have granted the U.K. an extension until the end of October, with a review in June. Chart I-14What Next For The Pound?
What Next For The Pound?
What Next For The Pound?
Back when the referendum was held in June 2016, even the pro-Brexit Tories, a minority in the party, promised continued access to the Common Market. Fast forward to today and there are simply not enough committed Brexiters in Westminster to deliver a hard exit. Given that the can has been kicked down the road, markets are likely to turn their focus on incoming economic data. On that front, economic surprises in the U.K. relative to both the U.S. and euro area are soaring (Chart I-14). Elsewhere, we are also taking profits on our short AUD/NOK position. Since 2015, the market has been significantly dovish on Australia, in part due to a more accelerated downturn in house prices and a marked slowdown in China. The reality is that the downturn in Australia has allowed some cleansing of sorts and has brought it far along the adjustment path relative to its potential. Any potential growth pickup in China will light a fire under the Aussie dollar, which is a risk to this position. Chester Ntonifor, Foreign Exchange Strategist chestern@bcaresearch.com Footnotes 1 Please see China Investment Strategy Special Report, titled “China: Stimulating Amid The Trade Talks,” dated February 20, 2019, available at fes.bcaresearch.com 2 Please see China Investment Strategy Special Report, titled “Monitoring Chinese Capital Outflows,” dated March 20, 2019, available at fes.bcaresearch.com 3 Farah Master, “Factbox: How Macau's casino junket system works,” Reuters, October 21, 2011. 4 Please see Foreign Exchange Strategy Weekly Report, titled “Not Out Of The Woods Yet,” dated April 5, 2019, available at bca.bcaresearch.com Currencies U.S. Dollar Chart II-1USD Technicals 1
USD Technicals 1
USD Technicals 1
Chart II-2USD Technicals 2
USD Technicals 2
USD Technicals 2
Recent data in the U.S. have been mostly positive: In March, 196K nonfarm jobs were created, surprising to the upside; unemployment rate stayed low at 3.8%, though average hourly earnings growth fell to 3.2% year-on-year. The factory orders in February contracted by 0.5% month-on-month. More importantly, headline consumer price inflation in March rose to 1.9% year-on-year, however this was mostly lifted by rising energy prices. Core inflation excluding food and energy dropped by 10 basis points to 2%. JOLTs job openings unexpectedly fell to 7.1 million in February, from 7.6 million. However, initial jobless claims fell to 196K. After a 3-month lull, producer prices are inflecting higher at a pace of 2.2% year-on-year for the month of March. DXY index fell by 0.44% this week. Global risk assets are on the rise this week. Meanwhile, the Fed minutes highlighted that members are in no rush to raise rates. Stalling interest rate differentials will be a headwind for the dollar. Report Links: Not Out Of The Woods Yet - April 5, 2019 Tug OF War, With Gold As Umpire - March 29, 2019 Into A Transition Phase - March 8, 2019 The Euro Chart II-3EUR Technicals 1
EUR Technicals 1
EUR Technicals 1
Chart II-4EUR Technicals 2
EUR Technicals 2
EUR Technicals 2
Recent data in the euro area have been positive: The Sentix Investor Confidence index continues to inflect higher, coming in at -0.3 from -2.2. German industrial production grew by 0.7% month-on-month in February. Trade balances improved across the euro area. In France, the trade deficit fell to €-4.0B in February. In Germany, the trade surplus increased to €18.7B. Italian retail sales increased by 0.9% year-on-year in February. On the inflation front, consumer price inflation in Germany and France both stayed at 1.3% year-on-year in March. EUR/USD rose by 0.57% this week. On Wednesday, the ECB has decided to leave policy unchanged as expected. Mario Draghi also highlighted more uncertainties and downside risks to the euro area amid the ongoing trade disputes. While the global trade war might add volatility to the pro-cyclical euro, easier financial conditions should eventually backstop growth. Report Links: Into A Transition Phase - March 8, 2019 A Contrarian Bet On The Euro - March 1, 2019 Balance Of Payments Across The G10 - February 15, 2019 The Yen Chart II-5JPY Technicals 1
JPY Technicals 1
JPY Technicals 1
Chart II-6JPY Technicals 2
JPY Technicals 2
JPY Technicals 2
Recent data in Japan have been negative: Preliminary cash earnings fell by 0.8% year-on-year in February, the only decline since mid-2017. Household confidence continues to tick lower, coming in at 40.5 in March. The trade balance in February came in at a surplus of ¥489.2B. Capex is rolling over. Machinery orders fell by 5.5% year-on-year in February. Machine tool orders remain extremely weak, at -28.5% year-on-year for the month of March. Lastly, the foreign investment in Japanese stocks increased to ¥1,463.7B. USD/JPY fell by 0.46% this week. In its April regional outlook, the BoJ downgraded most of the prefectures in Japan, with only Hokkaido that had an upgrade in the aftermath of the earthquake. As domestic deflationary pressures intensify, this will favor the yen. This also raises the probability the government defers the consumption tax hike. Report Links: Tug OF War, With Gold As Umpire - March 29, 2019 A Trader’s Guide To The Yen - March 15, 2019 Balance Of Payments Across The G10 - February 15, 2019 British Pound Chart II-7GBP Technicals 1
GBP Technicals 1
GBP Technicals 1
Chart II-8GBP Technicals 2
GBP Technicals 2
GBP Technicals 2
Recent data in the U.K. have been strong: In February, manufacturing production increased by 0.6% year-on-year; industrial production also increased by 0.1% year-on-year, both surprising to the upside. Both were deflating in January. The goods trade balance in February fell to £-14.1B, however the total trade balance came in at a smaller deficit of £4.86B. Monthly GDP also came in higher at 2% year-on-year in February. House prices gains have pared the increase of previous years, but the Halifax house price index still increased by 2.6% year-on-year for the month of March. GBP/USD rose by 0.41% this week. Theresa May got an extension for Brexit to October 31. Meanwhile, U.K. data have been stronger than consensus recently. We are long GBP/USD from 1.30, with a 0.6% profit. Report Links: Not Out Of The Woods Yet - April 5, 2019 A Trader’s Guide To The Yen - March 15, 2019 Balance Of Payments Across The G10 - February 15, 2019 Australian Dollar Chart II-9AUD Technicals 1
AUD Technicals 1
AUD Technicals 1
Chart II-10AUD Technicals 2
AUD Technicals 2
AUD Technicals 2
Recent data in Australia have continued to improve: Investment lending for homes in February grew by 2.6%. Home loans in February increased by 2% month-on-month, surprising to the upside. Westpac consumer confidence came in at 100.7 in April, increasing by 1.9%. AUD/USD surged by 0.64% this week. The RBA Deputy Governor Guy Debelle hinted that a wait-and-see approach for interest rates seemed like the appropriate path, signaling that policy will continue to be accommodative. Meanwhile, the Australian dollar is probably anticipating better upcoming data from China, as it is Australia’s largest trading partner. If the world’s second largest economy can turn around, the Aussie dollar is likely to grind higher. Report Links: Not Out Of The Woods Yet - April 5, 2019 Into A Transition Phase - March 8, 2019 Balance Of Payments Across The G10 - February 15, 2019 New Zealand Dollar Chart II-11NZD Technicals 1
NZD Technicals 1
NZD Technicals 1
Chart II-12NZD Technicals 2
NZD Technicals 2
NZD Technicals 2
There was little data out of New Zealand this week: The food price index came in at 0.5% month-on-month in March, shy of the estimate of 1.3%. NZD/USD plunged after rising by 0.5% initially this week, returning flat. Incoming data in New Zealand is likely to lag its commodity currency counterparts pushing the kiwi relatively lower. Our long AUD/NZD position is now 0.7% in the money since entry last Friday. Report Links: Not Out Of The Woods Yet - April 5, 2019 Balance Of Payments Across The G10 - February 15, 2019 A Simple Attractiveness Ranking For Currencies - February 8, 2019 Canadian Dollar Chart II-13CAD Technicals 1
CAD Technicals 1
CAD Technicals 1
Chart II-14CAD Technicals 2
CAD Technicals 2
CAD Technicals 2
Recent data in Canada have been negative: On the labor market front, the participation rate in March fell slightly to 65.7%; 7,200 jobs were lost, underperforming the estimated creation of 1,000 jobs; unemployment rate was unchanged at 5.8%. On the housing market front, starts in March increased by 192.5K year-on-year, underperforming the expected 196.5K; building permits dropped by 5.7% month-on-month in February. USD/CAD rebounded quickly after falling by 0.7% earlier this week, offsetting the loss. While the dovish shift by the BoC and looser fiscal policy, together with rising oil prices are likely to be growth tailwinds, the data disappointment coming from the housing market and overall economy limit upside in the CAD. Report Links: A Shifting Landscape For Petrocurrencies - March 22, 2019 Into A Transition Phase - March 8, 2019 Balance Of Payments Across The G10 - February 15, 2019 Swiss Franc Chart II-15CHF Technicals 1
CHF Technicals 1
CHF Technicals 1
Chart II-16CHF Technicals 2
CHF Technicals 2
CHF Technicals 2
There was scant data in Switzerland this week: The foreign currency reserves came in at 756B CHF in March. Unemployment rate in March was unchanged at 2.4%, in line with expectations. USD/CHF appreciated by 0.44% this week. With the euro area economy slowly recovering, the franc is likely to underperform as risk appetite rises. We are long EUR/CHF for a 0.1% profit. Report Links: Balance Of Payments Across The G10 - February 15, 2019 A Simple Attractiveness Ranking For Currencies - February 8, 2019 Waiting For A Real Deal - December 7, 2018 Norwegian Krone Chart II-17NOK Technicals 1
NOK Technicals 1
NOK Technicals 1
Chart II-18NOK Technicals 2
NOK Technicals 2
NOK Technicals 2
Recent data in Norway have been strong, with inflation grinding higher: Headline consumer price inflation increased to 2.9% year-on-year in March; core inflation also rose to 2.7% year-on-year, both surprising to the upside. Producer price index grew by 5.2% year-on-year in March, outperforming expectations. USD/NOK depreciated by 1.16% this week. The improving domestic economy, rising oil prices, and the tick up in inflation are all the reasons why we favor the Norwegian krone. We are playing the NOK via a few pairs, notably long NOK/SEK and short AUD/NOK, which are currently 3.11% and 0.75% in the money, respectively. Report Links: A Shifting Landscape For Petrocurrencies - March 22, 2019 Balance Of Payments Across The G10 - February 15, 2019 A Simple Attractiveness Ranking For Currencies - February 8, 2019 Swedish Krona Chart II-19SEK Technicals 1
SEK Technicals 1
SEK Technicals 1
Chart II-20SEK Technicals 2
SEK Technicals 2
SEK Technicals 2
Recent data in Sweden have been mixed: Industrial production fell to 0.7% year-on-year in February, lower than the previous reading of 3%. New manufacturing orders contracted by 2.8% year-on-year in February. However, the leading manufacturing new orders to inventory ratio is rising suggesting we might be near a bottom. Consumer price inflation came in higher at 1.9% year-on-year in March. USD/SEK fell by 0.21% this week. We remain bullish on the Swedish krona due to its cheap valuation and the imminent pickup in the euro area economy. Report Links: Balance Of Payments Across The G10 - February 15, 2019 A Simple Attractiveness Ranking For Currencies - February 8, 2019 Global Liquidity Trends Support The Dollar, But... - January 25, 2019 Trades & Forecasts Forecast Summary Core Portfolio Tactical Trades Closed Trades
Feature For a decade, mainstream economics has prescribed remedies for sluggish growth in the euro area on the basis of three articles of blind faith. First, that the ailment arises from structural impediments to growth; second, that in response to an ailing economy, ultra-loose monetary policy is always and everywhere effective; and third, that ‘Keynesian’ government stimuluses are at best a necessary evil and at worst a recipe for disaster. As a result, European policymakers have expended much time and energy attempting structural reforms, experimenting with ultra-loose monetary policy, while shirking government borrowing and spending. But have policymakers misdiagnosed the ailment? Chart of the WeekItaly’s Private Sector Is Paying Back Debt
Italy's Private Sector Is Paying Back Debt
Italy's Private Sector Is Paying Back Debt
Why The Focus On Public Deficits And Debt Might Be Misplaced We frown upon government deficits. They are associated with crowding out and misallocation of resources. But when the private sector is running a financial surplus, the exact opposite is true. Government borrowing and spending causes no crowding out because the government is simply utilising the private sector’s surplus savings and debt repayments. And importantly, this deficit spending prevents a deflationary shrinkage of the broad money supply. Most people are aware of the size of government deficits. Few people are aware of the size of private sector surpluses; and the leakage from the national income stream that they create. By not making this connection, people might believe that government deficits are profligate. But if the private sector as a whole has a financial surplus, it makes sense for the government to borrow to support economic growth. In a similar vein, an economy’s debt sustainability depends on its total indebtedness, not on its public indebtedness or its private indebtedness in isolation. Debt becomes unsustainable when the marginal extra euro of debt results in misallocation of resources and mal-investment. At this point, the extra debt adds nothing to growth or, worse, it subtracts from growth. This is also the point at which lenders tend to be unwilling to provide the marginal loan. Therefore, debt reaches its sustainable limit when the economy has exhausted all productive uses for it. Deficit spending can prevent a deflationary shrinkage of the broad money supply. It does not matter whether these productive uses are funded with private debt or with public debt. For example, successful economies require investment in high-quality healthcare and education. Some economies fund this with private debt, while others fund it with public debt. This means that if productive private indebtedness is low, there is more scope for productive public indebtedness. Many people believe that Italy has one of the world’s most indebted economies. But this belief is wrong. Although Italy’s public indebtedness is high, Italy’s private indebtedness is one of the lowest in the world, making Italy’s total indebtedness less than that of France and the U.K., and broadly equal to that of the U.S. (Chart I-2-I-5). Crucially, Italy’s extremely low private indebtedness means that it could afford relatively high public indebtedness before reaching the limit of debt sustainability. Chart I-2Italy: Total Debt = 250% Of GDP
Italy: Total Debt = 250% Of GDP
Italy: Total Debt = 250% Of GDP
Chart I-3France: Total Debt = 315% Of GDP
France: Total Debt = 315% Of GDP
France: Total Debt = 315% Of GDP
Chart I-4U.K.: Total Debt = 280% Of GDP
U.K.: Total Debt = 280% Of GDP
U.K.: Total Debt = 280% Of GDP
Chart I-5U.S: Total Debt = 250% Of GDP
U.S: Total Debt = 250% Of GDP
U.S: Total Debt = 250% Of GDP
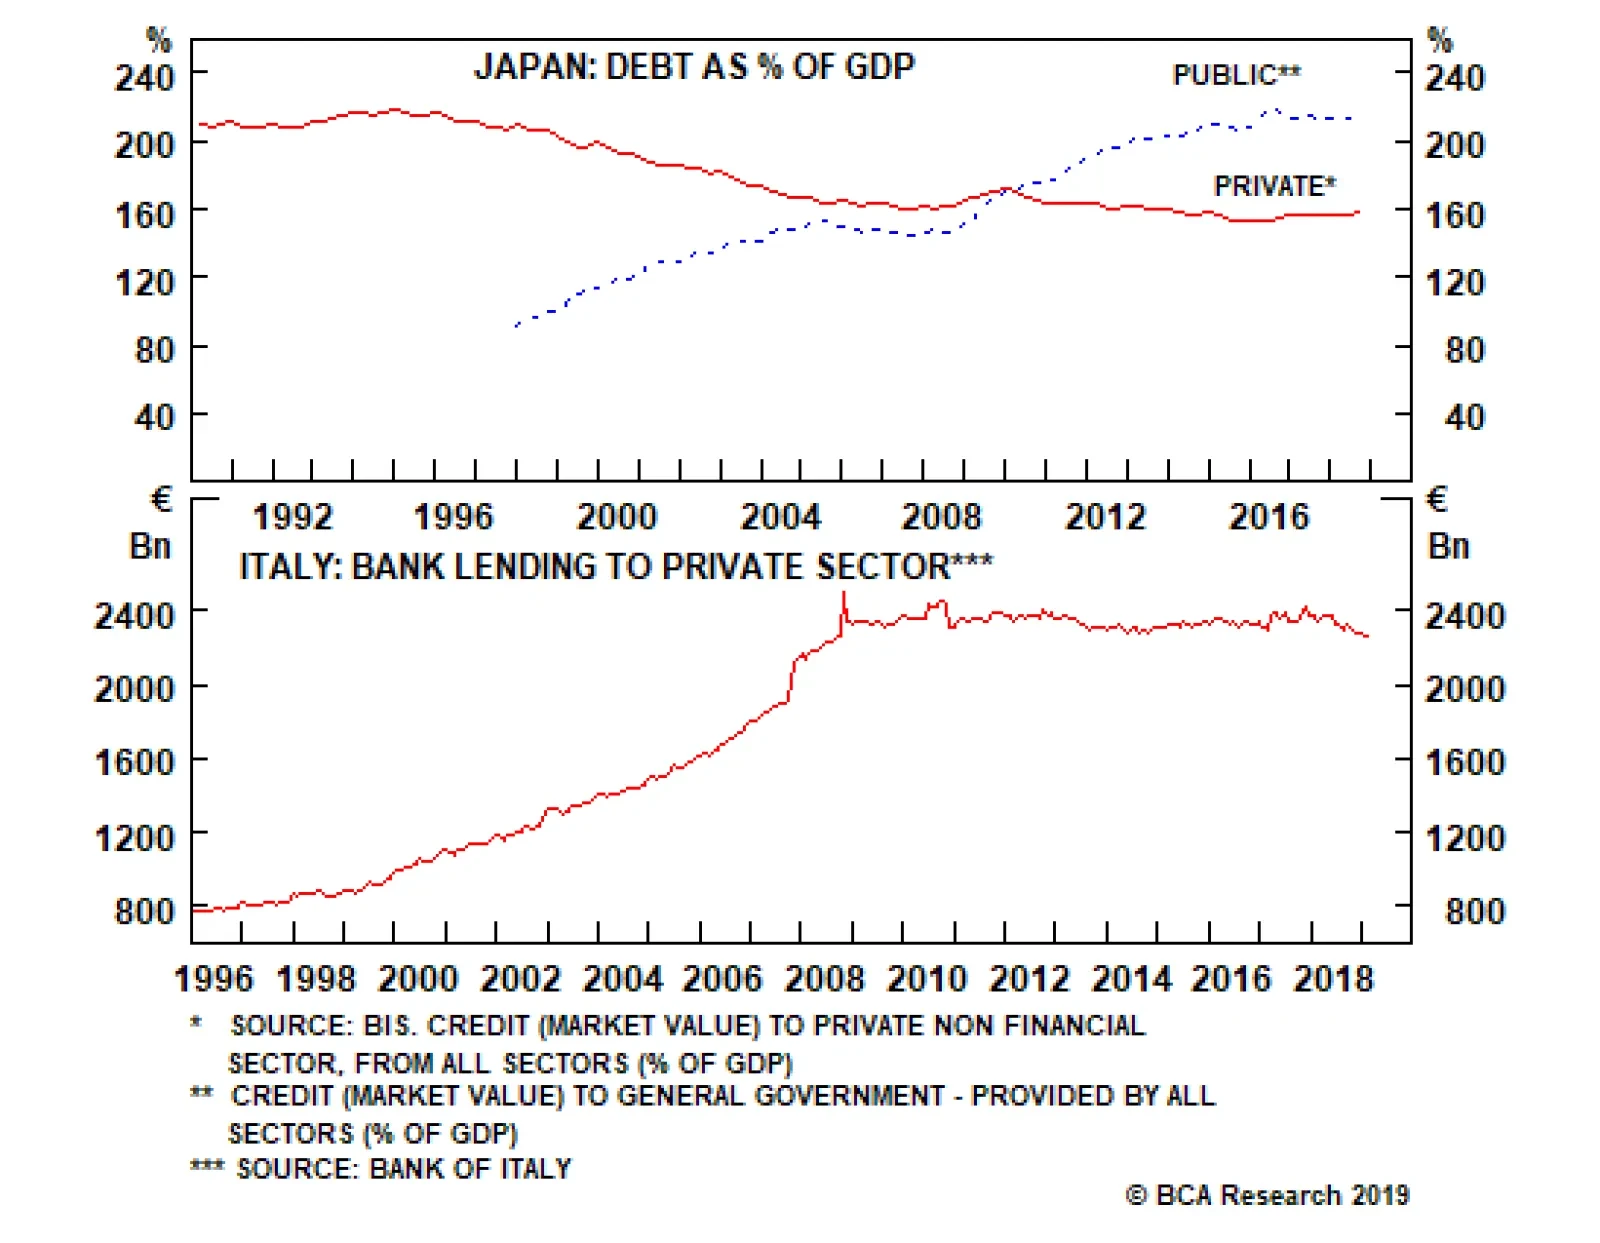
Italy And Japan: Compare And Contrast In a normal world, the task of ensuring that private sector savings are borrowed and spent falls on the banks, which take in the savings and debt repayments and lend them out to others in the private sector who can make the best use of the funds. But if a dysfunctional banking system fails this task, the savings generated by the private sector will find no borrowers. The unrecycled funds become a leakage from the national income stream generating a persistent deflationary headwind for the economy. Welcome to Italy! Since 2008, the stock of loans to Italian households and firms has been stagnant while in real terms it has fallen (Chart of the Week). The upshot is that the real money supply has shrunk despite low private sector indebtedness, low interest rates and massive injections of ECB liquidity into the banking system. Japan’s public sector levering has been counterbalancing its private sector de-levering. After the 2008 global financial crisis Italian banks’ balance sheets were left unrepaired and undercapitalized. For an individual bank whose solvency is impaired, the right thing to do is shrink its loan book relative to its equity capital. But when the entire banking system is doing this simultaneously, the economy falls into a massive fallacy of composition: what is right for an individual bank becomes very deflationary when all banks are doing it together. Under these circumstances, an agent outside the fallacy of composition – namely, the government – must counter this deflationary headwind by borrowing and spending the un-recycled private sector savings. Welcome to Japan! The Japanese government has been doing precisely this for the past 25 years. Many people fret about the Japanese government’s persistent deficits and its ballooning public debt. What these people do not realise is that these persistent deficits are simply counterbalancing private sector de-levering. Hence, Japan’s all-important total (public plus private) indebtedness as a share of GDP has not been rising (Chart I-6). In Italy, the banking system has been dysfunctional for over a decade, preventing the private sector from borrowing (Chart I-7). Under these circumstances, the Italian government could borrow the private sector’s excess savings and debt repayments and put them to highly productive use, just like in Japan. Chart I-6Japan’s Persistent Deficits Have Been Counterbalancing Private Sector De-levering
Japan's Persistent Deficits Have Been Counterbalancing Private Sector De-levering
Japan's Persistent Deficits Have Been Counterbalancing Private Sector De-levering
Chart I-7The Italian Banking System Has Been Dysfunctional
The Italian Banking System Has Been Dysfunctional
The Italian Banking System Has Been Dysfunctional
Japan and Italy have quite similar demographics, but there is also a big difference. Despite the Japanese government’s persistent deficit and ballooning debt, the 10-year Japanese government bond seems not the slightest bit concerned and is yielding zero. Whereas in Italy, where the government finances are close to structural balance, the merest hint of a Keynesian stimulus sent the 10-year BTP yield rocketing towards 4 percent. Why? The answer is that Italy does not have its own central bank. The Japanese government bond yield is a direct function of the BoJ’s expected monetary policy. But the Italian BTP yield has two components: the ECB’s expected monetary policy plus a risk-premium for currency redenomination in the event that Italy left the euro. Italy’s problem is that even if modest deficit spending was the right policy, it would take time to prove. Meanwhile, bond vigilantes shoot first and ask questions later. The euro debt crisis was essentially a fear of currency redenomination which resulted from bond vigilantes running amok. When bond markets refuse to lend to sovereigns at a rational interest rate, maturing debt has to be refinanced at a penalising interest rate, causing an undeserved deterioration in the government’s finances. Thereby, the fear of redenomination could become a self-fulfilling prophecy. In Italy, the banking system has been dysfunctional for over a decade. The bottom line is that every economy has its own ‘tipping-point’ interest rate, at which its debt financing can flip from stability to instability. But we believe this interest rate is low everywhere. Modern Monetary Theory Simplified Modern Monetary Theory (MMT) is a hot topic of the moment. Our view is that its breakthrough is to establish the ‘appropriate’ public sector deficits in the context of private sector surpluses, and it simplifies to this question: In highly indebted economies, what is the interest rate needed to keep total (public plus private) indebtedness as a share of GDP stable, and prevent a deflationary shrinkage of the broad money supply? The answer differs slightly from economy to economy because private sector indebtedness is modestly rising in some places, stable in a few, while declining in others (Chart I-8). But crucially, at a global level, total indebtedness is stabilising with the global bond yield within a historically depressed sideways channel (Chart I-9). Chart I-8Private Sector Indebtedness Is Not Rising As A Whole
Private Sector Indebtedness Is Not Rising As A Whole
Private Sector Indebtedness Is Not Rising As A Whole
Chart I-9The Global Long Bond Yield Has Been In A Sideways Channel
The Global Long Bond Yield Has Been In A Sideways Channel
The Global Long Bond Yield Has Been In A Sideways Channel
Admittedly, the global bond yield is now at the bottom of this channel. This means that from a tactical perspective, we can expect 10-year yields to go up about 50 bps before hitting the top of the channel. However, from a structural perspective, the interest rate needed to stabilise total indebtedness as a share of GDP now appears to be extremely low. And this means that structurally low bond yields are here to stay. Finally, I am excited to report that two of the main commentators on MMT – Richard Koo and Stephanie Kelton – are keynote speakers at our annual conference on September 26-27 in New York City. Suffice to say it will be an event not to be missed! Fractal Trading System* There are no new trades this week, leaving five open positions. For any investment, excessive trend following and groupthink can reach a natural point of instability, at which point the established trend is highly likely to break down with or without an external catalyst. An early warning sign is the investment’s fractal dimension approaching its natural lower bound. Encouragingly, this trigger has consistently identified countertrend moves of various magnitudes across all asset classes. Chart I-10
Short the 10-Year OAT
Short the 10-Year OAT
The post-June 9, 2016 fractal trading model rules are: When the fractal dimension approaches the lower limit after an investment has been in an established trend it is a potential trigger for a liquidity-triggered trend reversal. Therefore, open a countertrend position. The profit target is a one-third reversal of the preceding 13-week move. Apply a symmetrical stop-loss. Close the position at the profit target or stop-loss. Otherwise close the position after 13 weeks. Use the position size multiple to control risk. The position size will be smaller for more risky positions. * For more details please see the European Investment Strategy Special Report “Fractals, Liquidity & A Trading Model,” dated December 11, 2014, available at eis.bcaresearch.com Dhaval Joshi, Chief European Investment Strategist dhaval@bcaresearch.com Fractal Trading System Recommendations Asset Allocation Equity Regional and Country Allocation Equity Sector Allocation Bond and Interest Rate Allocation Currency and Other Allocation Closed Fractal Trades Trades Closed Trades Asset Performance Currency & Bond Equity Sector Country Equity Indicators Bond Yields Chart II-1Indicators To Watch - Bond Yields
Indicators To Watch - Bond Yields
Indicators To Watch - Bond Yields
Chart II-2Indicators To Watch - Bond Yields
Indicators To Watch - Bond Yields
Indicators To Watch - Bond Yields
Chart II-3Indicators To Watch - Bond Yields
Indicators To Watch - Bond Yields
Indicators To Watch - Bond Yields
Chart II-4Indicators To Watch - Bond Yields
Indicators To Watch - Bond Yields
Indicators To Watch - Bond Yields
Interest Rate Chart II-5Indicators To Watch - Interest Rate Expectations
Indicators To Watch - Interest Rate Expectations
Indicators To Watch - Interest Rate Expectations
Chart II-6Indicators To Watch - Interest Rate Expectations
Indicators To Watch - Interest Rate Expectations
Indicators To Watch - Interest Rate Expectations
Chart II-7Indicators To Watch - Interest Rate Expectations
Indicators To Watch - Interest Rate Expectations
Indicators To Watch - Interest Rate Expectations
Chart II-8Indicators To Watch - Interest Rate Expectations
Indicators To Watch - Interest Rate Expectations
Indicators To Watch - Interest Rate Expectations
Our Foreign Exchange Strategy team’s simple observation is that while the pound is sitting exactly where it was after the 2016 referendum results, the odds of a hard Brexit have significantly fallen since then. We are opening a buy-stop on GBP/USD at 1.30…

Yesterday, the German factory orders sent a chill down the spine of anyone with a positive disposition toward European growth, as they fell 8.4% on an annual basis in February. However, foreign orders drove this meltdown, contracting 12.6% on an annual basis,…
Understand that the all-important impulses to an economy do not come from the level of the bond yield, oil price, net exports, inventories, and so on. The impulse always comes from the change in these metrics. And as the metrics cannot decline (or rise)…