Europe

Highlights Await the U.K. parliament to coalesce a majority on a on a credible strategy for Brexit that is also acceptable to the EU27. At that point, buy the pound, the FTSE250, and U.K. homebuilder shares. An eerie calm has descended over developed economy currencies. But the Chinese yuan has rebounded sharply. Stay tactically overweight emerging market currencies, cyclical equity sectors, and equities versus bonds. But don’t expect these rallies to last beyond the summer. Feature Chart of the WeekAn Eerie Calm Has Descended Over The Currency Markets. Why?
An Eerie Calm Has Descended Over The Currency Markets. Why?
An Eerie Calm Has Descended Over The Currency Markets. Why?
End Of The Road For May From the moment almost three years ago that the U.K. voted to leave the EU, it was clear that a rational and measured Brexit would require the U.K. to remain in a customs union with the EU. Rational and measured because a customs union would protect the cross-border supply chains which are vital to so many U.K. businesses. Rational and measured because a customs union would avoid a hard customs border on the island of Ireland, and thereby prevent a break-up of the U.K. Rational and measured because a customs union would best deliver on the narrow 52:48 vote to leave the EU, which was driven by a desire to control migration and the supremacy of the European Court of Justice – both of which are compatible with remaining in a customs union – rather than a desire to strike independent trade deals – which is not. Yet Theresa May did not steer to this rational and measured Brexit, because she knew it would rip apart the Conservative party, a hard minority of which sees the sovereignty of trade policy as its Holy Grail. Beholden to this minority, May put her party interest above the national interest. But now, May has run out of road. Her Brexit deal has been rejected twice by huge parliamentary majorities. In the coming days, parliament, through a series of indicative votes, is likely to wrest control of the Brexit process from the government. So far, parliament has expressed what it is against (a no-deal Brexit), but it has yet to express what course of action it is for. We await the U.K. parliament to coalesce a majority on a credible strategy for Brexit that is also acceptable to the EU27. At that point, irrespective of the exact strategy, we will buy the pound, the FTSE250, and U.K. homebuilder shares. Important Message From The Currency Markets An unusually eerie calm has descended over the currency markets (Chart of the Week). For the past six months, GBP/USD has drifted within a tight 5 percent range, USD/JPY has also moved within a similarly narrow range, and EUR/USD has been trapped within an even tighter 3 percent range (Chart I-2 and Chart I-3). Chart I-2GBP/USD And EUR/USD Have Been Very Calm Recently
GBP/USD And EUR/USD Have Been Very Calm Recently
GBP/USD And EUR/USD Have Been Very Calm Recently
Chart I-3USD/JPY Has Also Been Very Calm Recently
USD/JPY Has Also Been Very Calm Recently
USD/JPY Has Also Been Very Calm Recently
The calm is eerie because Brexit tensions have actually intensified as the Article 50 clock has run down without a breakthrough; the Federal Reserve has made a dramatic volte-face from its sequential rate hikes; the ECB has pivoted back to dovish after the German economy narrowly avoided a technical recession; and the Japanese economy contracted sharply in the third quarter of 2018. Adding to the eeriness of the calm in currency markets, the equity and bond markets have experienced wild gyrations. Global equities plunged 20 percent before quickly recovering most of the losses, while long bond prices moved by close to 15 percent1 (Chart I-4 and Chart I-5).1 Chart I-4While Equities Have Been Turbulent, Currencies Have Been Calm
While Equities Have Been Turbulent, Currencies Have Been Calm
While Equities Have Been Turbulent, Currencies Have Been Calm
Chart I-5While Bonds Have Been Turbulent, Currencies Have Been Calm
While Bonds Have Been Turbulent, Currencies Have Been Calm
While Bonds Have Been Turbulent, Currencies Have Been Calm
Given all of this turbulence, why have currency markets remained a relative oasis of calm? The simple answer is that exchange rates are, by definition, relative prices. And in the major economies, growth and inflation rates have moved in the same direction by the same amount at roughly the same time. In fact, looking at quarter-on-quarter growth rates, the major economies have all recently experienced identical 1.5 percent slowdowns: from 4 to 2.5 percent in the U.S.; and from 2.5 percent to around 1 percent in both the euro area and the U.K.2 (Chart I-6 - Chart I-8). Chart I-6U.S. GDP Growth Slowed By 1.5 Percent
U.S. GDP Growth Slowed By 1.5 Percent
U.S. GDP Growth Slowed By 1.5 Percent
Chart I-7Euro Area GDP Growth Slowed By 1.5 Percent
Euro Area GDP Growth Slowed By 1.5 Percent
Euro Area GDP Growth Slowed By 1.5 Percent
Chart I-8U.K. GDP Growth Slowed By 1.5 Percent
U.K. GDP Growth Slowed By 1.5 Percent
U.K. GDP Growth Slowed By 1.5 Percent
Markets do not care about the level of growth. They care much more about the change in growth. Financial markets are a discounting mechanism, and what matters most to the price is the change in the assumptions that are embedded within it. For example, if the price were discounting a major economy to grow at 4 percent and that rate of growth subsequently fell to 2.5 percent, then the seemingly benign outcome of respectable growth would cause interest rate expectations to decline. In another major economy, if growth slowed from 2.5 percent to 1 percent, it would precipitate a broadly similar decline in interest rate expectations. In this situation of synchronised and meaningful slowdowns across major economies, and the consequent policy responses, equity and bond absolute prices would experience wild gyrations. By contrast, currencies are relative prices. So if the decline in major economy growth rates and interest rate expectations were broadly similar, currency markets would remain a relative oasis of calm. Which perfectly describes the observation of the last six months. This observation of near-identical slowdowns in the major economies supports our thesis that their genesis came from outside the developed economies, which we expounded in A European Cycle ‘Made In China’. And now we present the smoking gun. While an eerie calm has descended over developed economy currencies, all the action has been in emerging economy currencies, especially the Chinese yuan which has rebounded sharply. The message from the currency markets reinforces our thesis: last year’s growth downswing and the current upswing were made in China (see final chart). Never Focus On Levels Of Economic Growth It is worth repeating that a head-to-head comparison of growth rates across different economies is a meaningless exercise. Here’s a simple way to grasp this crucial point: a 1.5 percent growth rate would be a very pleasing outcome for Europe, it would be a very unpleasing outcome for the U.S., and it would be a catastrophic outcome for China. The reason is that if a population is growing, the economy needs to generate real growth well in excess of the rate of population growth to improve (per person) living standards. That excess comes from productivity growth which lifts standards of living and wellbeing. In the case of Germany or Japan where the population is not growing, or is indeed shrinking, the GDP growth rate that is consistent with these rising standards of living is much lower than in those economies where the population is growing (Chart I-9 and Chart I-10). Chart I-9The Same Productivity Growth In The Euro Area And The U.S. ...
The Same Productivity Growth In The Euro Area And The U.S. ...
The Same Productivity Growth In The Euro Area And The U.S. ...
Chart I-10... Generates Different GDP Growth
... Generates Different GDP Growth
... Generates Different GDP Growth
Necessarily, an economy with weaker demographics – like Germany or Japan – will flirt with technical recessions much more often than one with population growth – like the U.S. or China. But this is just Arithmetic 101. It doesn’t mean that Germany or Japan are in a fundamentally worse shape when it comes to all-important productivity growth and improving wellbeing. Just as important for investors, earnings per share (eps) growth depends on productivity growth and not on GDP growth. Granted, higher GDP from an increasing population will boost a firm’s sales, but without increasing productivity, the firm will have to hire more staff to produce those sales. In essence, the firm will have to employ more capital – issue more shares – which means than earnings per share will not grow. To reemphasise, levels of GDP growth, in themselves, do not drive financial markets. The Perils Of Data-Dependency Recently, the world’s major central banks have become even more wedded to ‘data-dependency’, for two reasons: first, under ever increasing external scrutiny, objectivity to the economic data boosts the transparency and rationale of central bank policy; second, data-dependency acts as a foil to politicians who might want to influence or interfere with the independence of monetary policy. No names mentioned! We applaud the central banks for their good intentions. Yet enhanced data-dependency also carries perils, as it increases the amplitude of the ever-present and natural oscillations in economic growth. The reason is that the high-profile hard data on which monetary policy ‘depends’ such as CPI inflation and GDP growth record what happened in the past, and sometimes in the distant past. Meanwhile, a monetary policy shift today will act on the economy in the future due to the unavoidable lags in transmission. It follows that enhanced data-dependency is akin to a crop farmer who uses last season’s depressed price, from oversupply, to justify planting much less seed for next season. The inevitable undersupply at next season’s harvest will then cause the crop price to surge. Making the farmer plant much more for the following season, at which point the price will collapse again. And the oscillations will continue ad infinitum. Unfortunately, the more backward the data on which policy actions depend, the higher the amplitude of the price and output oscillations. Right now, growth sensitive investment positions are midway through exactly such an up-oscillation, justifying a near-term overweight in emerging market currencies, cyclical equity sectors, and equities versus bonds. But these rallies are highly unlikely to last beyond the summer (Chart I-11). Chart I-11The Recent Mini-Cycle Is ‘Made In China’
The Recent Mini-Cycle Is 'Made In China'
The Recent Mini-Cycle Is 'Made In China'
Stay tuned for the next turn. Fractal Trading System* We are pleased to report that long DAX versus the 30-year bund achieved its 2.5 percent profit target which is now crystallised and closed. This week we note that the sharp sell-off in AUD/CNY is close to the limit of tight liquidity that has signaled recent reversals in this cyclical currency cross. Accordingly, this week’s recommended trade is to go long AUD/CNY. Set a profit target of 1.5 percent with a symmetrical stop-loss. For any investment, excessive trend following and groupthink can reach a natural point of instability, at which point the established trend is highly likely to break down with or without an external catalyst. An early warning sign is the investment’s fractal dimension approaching its natural lower bound. Encouragingly, this trigger has consistently identified countertrend moves of various magnitudes across all asset classes. Chart I-12
Long AUD/CNY
Long AUD/CNY
The post-June 9, 2016 fractal trading model rules are: When the fractal dimension approaches the lower limit after an investment has been in an established trend it is a potential trigger for a liquidity-triggered trend reversal. Therefore, open a countertrend position. The profit target is a one-third reversal of the preceding 13-week move. Apply a symmetrical stop-loss. Close the position at the profit target or stop-loss. Otherwise close the position after 13 weeks. Use the position size multiple to control risk. The position size will be smaller for more risky positions. * For more details please see the European Investment Strategy Special Report “Fractals, Liquidity & A Trading Model,” dated December 11, 2014, available at eis.bcaresearch.com Dhaval Joshi, Chief European Investment Strategist dhaval@bcaresearch.com Footnote 1 The German 30-year bund. 2 Based on annualised quarter-on-quarter real GDP growth rates. Fractal Trading System Recommendations Asset Allocation Equity Regional and Country Allocation Equity Sector Allocation Bond and Interest Rate Allocation Currency and Other Allocation Closed Fractal Trades Trades Closed Trades Asset Performance Currency & Bond Equity Sector Country Equity Indicators Bond Yields Chart II-1Indicators To Watch - Bond Yields
Indicators To Watch - Bond Yields
Indicators To Watch - Bond Yields
Chart II-2Indicators To Watch - Bond Yields
Indicators To Watch - Bond Yields
Indicators To Watch - Bond Yields
Chart II-3Indicators To Watch - Bond Yields
Indicators To Watch - Bond Yields
Indicators To Watch - Bond Yields
Chart II-4Indicators To Watch - Bond Yields
Indicators To Watch - Bond Yields
Indicators To Watch - Bond Yields
Interest Rate Chart II-5Indicators To Watch - Interest Rate Expectations
Indicators To Watch - Interest Rate Expectations
Indicators To Watch - Interest Rate Expectations
Chart II-6Indicators To Watch - Interest Rate Expectations
Indicators To Watch - Interest Rate Expectations
Indicators To Watch - Interest Rate Expectations
Chart II-7Indicators To Watch - Interest Rate Expectations
Indicators To Watch - Interest Rate Expectations
Indicators To Watch - Interest Rate Expectations
Chart II-8Indicators To Watch - Interest Rate Expectations
Indicators To Watch - Interest Rate Expectations
Indicators To Watch - Interest Rate Expectations
Highlights So What? The late-cycle rally still faces non-trivial political hurdles. Why? U.S.-China trade talks, the U.S. threat of tariffs on auto imports, and Brexit continue to pose risks. A shocking revelation from the Mueller report could have a temporary negative impact on equity markets. A bombshell would increase Trump’s chances of removal from office. We give 35% odds to tarrifs on autos and auto parts, and 10% odds to a hard Brexit. Feature In our February 6 report we outlined how a “Witches’ Brew” of geopolitical risks had the potential to short-circuit the late-cycle equity rally. A month later, that brew is still bubbling. President Donald Trump’s approval rating has rebounded but going forward it faces challenges from negative headlines (Chart 1). These include a soaring trade deficit, a large influx of illegal immigrants on the southern border, a weak jobs report for February, a setback in North Korean diplomacy, and an intensification of the scandals plaguing Trump’s inner circle. Chart 1Don't Get Comfortable Just Yet, Mr. President
Don't Get Comfortable Just Yet, Mr. President
Don't Get Comfortable Just Yet, Mr. President
Each of these issues calls into question the effectiveness of Trump’s core policies and the stability of his administration, though in reality they are only potentially problematic. While Special Counsel Robert Mueller’s forthcoming report poses a tail risk, the substantial threat remains Trump’s trade policy. Indeed, investors face “the persistence of uncertainties related to geopolitical factors” and the “threat of protectionism,” according to European Central Bank President Mario Draghi, who spoke as he rolled out a new round of monetary stimulus for Europe and its ailing banks. What did Draghi have in mind? The obvious culprits are the U.S.-China trade talks, the U.S. threat of tariffs on auto imports, and Brexit. There were other issues – such as “vulnerabilities in emerging markets” – but the first three are the most likely to have turned Draghi’s head. The global economic outlook is likely to improve on the back of Chinese stimulus and policy adjustments by the ECB and Federal Reserve. But growth has not yet stabilized and financial markets face additional volatility due to the fact that none of these “geopolitical factors” is going to be resolved easily. The good news is that Trump, overseeing a precarious economy ahead of an election, has an incentive to play softball rather than hardball. Mueller’s Smoking Gun? News reports suggest that Mueller will soon issue the final report of his investigation into President Trump’s election campaign links with Russia. There is really only one way in which the Mueller report could be market relevant: it could produce smoking-gun evidence that results in non-trivial impeachment proceedings. Any scandal big enough to remove Trump from office or clearly damage his reelection chances is significant because financial markets would dislike the extreme policy discontinuity (Chart 2). Anything short of this will be a red herring for markets, though admittedly many of our clients disagree.
Chart 2
Very little is known about what Mueller will report and how he will interpret his mandate. Mueller’s investigation may or may not make it to the public in full form, at least initially, and he may or may not make any major additional indictments. Congress will strive to get access to the report, which is internal to the Justice Department, while spin-off investigations will proliferate among lower-level federal district attorneys and congressional committees. The legal battle, writ large, will run into the 2020 election and beyond. House Democrats alone can decide whether to bring articles of impeachment against Trump, but the case would be struck down in the Senate if it did not rest on ironclad evidence of wrongdoing that implicated Trump personally. Republican Senators will not jump ship easily – especially not 18 of them. That would require a sea change in grassroots support for Trump. Trump’s approval among Republicans remains the indicator to watch, and it is still strong (Chart 3). If this number crashes in the aftermath of the Mueller report, then Trump could find himself on a Nixonian trajectory, implying higher odds of a Senate conviction (Chart 4). At that point, markets would begin discounting a Democratic sweep in 2020, with business sentiment and risk assets likely to drop at the prospect of higher taxes and increased regulation (Chart 5).
Chart 3
Chart 4
Chart 5A 2020 Democratic Sweep Would Dent Business Sentiment
A 2020 Democratic Sweep Would Dent Business Sentiment
A 2020 Democratic Sweep Would Dent Business Sentiment
After all, if scandals remove Trump from office, then not only is a Democrat likely to win the White House, but any Democrat is likely to win – even a non-centrist like Bernie Sanders or other Democratic candidates like Kamala Harris who have swung hard to the left. Meanwhile, the odds of Democrats taking control of the Senate (while keeping the House) will rise. With Democratic candidates flirting with democratic socialism and proposing a range of left-wing policies, the prospect of full Democratic control of the legislative and executive branches would weigh on financial markets. We doubt that the Mueller report can fall short of a smoking gun while still dealing a fatal blow to Trump. The Democrats control the House, so if the scandal grows to gigantic proportions, they will impeach. Yet if they impeach without an ironclad case, Trump will be acquitted. And if Trump is acquitted, it is hard to see how his chances of reelection would fall. The impeachment of former President Bill Clinton looms large over Democrats, since it ended up boosting his popularity. If Democrats are overzealous to no end, it will help Trump’s campaign. If Trump should then win re-election, he will have veto power and likely a GOP Senate, so his policies will remain in place. The outcome for markets would be policy continuity, though the market-positive aspects of Trump’s first term may not be improved while the market-negative aspects, such as his trade policy and foreign policy, may reboot. Mueller is an all-or-nothing prospect: he either leads us to the equivalent of the Watergate Tapes or not. Lesser crimes are unlikely to have a decisive impact on the election. But volatility is likely to go up as the report comes due, just as it did during the Lewinsky scandal (Chart 6), at least until the dust settles and there is clarity on impeachment. And an equity sell-off at dramatic points in the saga cannot be ruled out, especially if global factors combine with actual impeachment (Chart 7). Chart 6Impeachment Proceedings Likely To Raise Vol...
Impeachment Proceedings Likely To Raise Vol...
Impeachment Proceedings Likely To Raise Vol...
Chart 7… And Potentially Dampen Returns
...And Potentially Dampen Returns
...And Potentially Dampen Returns
Bottom Line: A specific, shocking revelation from the Mueller report could have a negative impact on equity markets and risk assets, but any such moves would be temporary as long as the growth and earnings backdrop remain positive and Mueller does not drop a bombshell that increases Trump’s chances of removal from office. Separating The Budget From The Border The president faces adverse developments on the southern border after having initiated a controversial national emergency in order to transfer military funds to construct new barriers. The U.S. has seen an abnormally large increase in apprehensions and attempted entries this year (Charts 8A & 8B). Ultimately the influx calls attention to the porous southern border and as such may help to justify Trump’s policy focus. For now it raises the question of why the administration’s tough tactics are failing to deter immigrants. Meanwhile his emergency declaration has divided the Republican Party, with several members likely to join with Democrats in a resolution of disapproval that Trump will veto.
Chart 8
Chart 8
Congress will not be able to override the veto, but Trump’s decree also faces challenges in the judicial system. We doubt that the Supreme Court will rule against him but it certainly is possible. The ruling is highly likely to come before the election. Meanwhile Trump is kicking off the FY2020 budget battle with his newest request of $8.6 billion for the border wall and cuts to a range of discretionary non-defense spending. The presidential budget is a fiction – it is based on unrealistic cuts to a range of government programs. Any budget that is passed will bear no relation to the administration’s proposals. Opinion polls referenced above clearly demonstrate that Trump’s approval rating suffered from the recent government shutdown. This does not mean that he will conclude the next budget battle by the initial deadline of October 1 or that a late-2019 shutdown is impossible. He might accept a short shutdown to try to secure defense spending that would arguably legitimize his repurposing of military funds for border construction. But his experience early this year means that the odds of another long-running, bruising shutdown are low. Might Trump refuse to raise the debt ceiling later this year to get his way on the wall? This is even less likely than a shutdown due to the negative impact that a debt ceiling constraint would have on social security recipients and bond markets. Trump also has the most to lose if the 2011 budget caps snap back into place in 2020 due to any failure of the FY2020 negotiations (Chart 9). As such, the debt ceiling – which the Treasury Department can keep at bay until the end of the fiscal year in October – and the 2020 budget may be resolved together this time around.
Chart 9
In short, Trump will be forced to punt on congressional funding for the wall later this year and will have to campaign on it again in November 2020, with the slogan “Finish the Wall.” This is a market-positive outcome, as the hurdles to fiscal spending in 2020 are likely to be reduced: Trump will have to concede to some Democratic priorities and abandon his proposed cuts. The Democrats, for their part, are likely to have enough moderates to get the next budget over the line with Republican support. To illustrate, Republicans only need 21 votes for a majority, while no fewer than 26 Democrats were recently chastised by House Speaker Nancy Pelosi for cooperating with Republicans. The implication is that a bipartisan majority can be found. Since Trump cannot get his budget cuts, and does not really even want them, the projected contraction of the budget deficit in 2020 will be reduced or erased (Chart 10). On the margin, this would support higher inflation and bond yields.
Chart 10
The biggest threat to Trump’s reelection is still the risk that the long business cycle will expire by November next year. However, the exceedingly low February payrolls print was misleading – the unemployment rate fell and wage growth was firm (Chart 11). American households are in relatively good shape and that bodes well for Trump, for the time being. Chart 11American Households Are In Good Shape
American Households Are In Good Shape
American Households Are In Good Shape
Bottom Line: The economy is relatively well supported and Trump and the Democrats are ultimately likely to cooperate on the budget under the table, reducing the risks of a debt ceiling breach, or an extended government shutdown later this year, or a fall off the 2020 stimulus cliff. The Trade Deficit: Trump’s Pivot To Europe Trade policy is where Trump’s challenges merge with Draghi’s woes. The U.S. trade deficit lurched upwards to a ten-year high of $621 billion in 2018 (Chart 12). The trade deficit is uniquely important to Trump because he campaigned on an unorthodox protectionist agenda in order to reduce it. It will be very difficult for him to evade the consequences if the deficit is higher, as a share of GDP, in November 2020 than it was in January 2017. Chart 12Trade Deficit Jump Is A Blow To Trump
Trade Deficit Jump Is A Blow To Trump
Trade Deficit Jump Is A Blow To Trump
The underlying cause of the rising deficit is that a growing American economy at full employment with a relatively strong dollar will suck in larger quantities of imports. This effect is overriding any that Trump’s tariffs have had in discouraging imports. Meanwhile the global slowdown, reinforced by trade retaliation and negative sentiment, are harming U.S. exports (Chart 13). The administration’s policies of fiscal stimulus combined with encouraging private investment are guaranteed to lead to a higher current account deficit, barring an offsetting (and highly unlikely) rise in private saving. The current account deficit must equal the gap between domestic saving and investment and a rising fiscal deficit represents a drop in saving. Chart 13Trade War Hurting U.S. Exports
Trade War Hurting U.S. Exports
Trade War Hurting U.S. Exports
What does the trade deficit imply for the U.S.-China talks? On one hand, the U.S. could put more pressure on China after feeling political heat from the large deficit. On the other hand, China has always offered to reduce the bilateral trade deficit directly through bulk purchases of goods, particularly commodities. It is Trump’s top negotiator, Robert Lighthizer, who has insisted that China make structural changes to reduce trade imbalances on a long-term and sustainable basis.1 In a sign of progress, the U.S. and China have reportedly arrived at a currency agreement. No details are known and therefore it is impossible to say if it would mean a more “market-oriented” renminbi, which could fluctuate and have a variable impact on the trade deficit, or a renminbi that is managed to be stronger against the dollar, which would tend to weigh on the deficit, as Trump might wish. The two negotiating teams are working on the text of five other structural issues that should also mitigate the deficit. Moreover, China’s new foreign investment law, if enforced, could increase American market access by leveling the playing field for foreign firms. However, there is still no monitoring mechanism, the two presidents have not scheduled a final signing summit, and the deterioration in North Korean peace talks also works against any quick conclusion. If Trump concludes a deal, the next question for investors is whether he will impose Section 232 tariffs on auto and auto imports on the EU and other partners (Chart 14).
Chart 14
The European Commission’s top trade negotiator, Cecilia Malmstrom, recently met with Lighthizer in Washington to discourage tariffs. She refused to admit agriculture into the negotiations, as per a U.S.-EU joint statement in July 2018, but proposed equalizing tariffs on industrial goods as a way for both sides to make a positive start (Chart 15). She said that the U.S. repealing the Section 232 steel and aluminum tariffs are necessary for any final deal. And she reiterated that any new tariffs (e.g., the proposed Section 232 tariffs on autos and auto parts) would prevent a deal and provoke immediate retaliation on $23 billion worth of American exports.
Chart 15
Malmstrom also said that the EU would prefer to work with the U.S. on reforming the World Trade Organization and addressing China’s trade violations. This approach fits with that of Japan, which has joined the U.S. and EU in trilateral discussions toward reforming the global trade architecture in a bid to mitigate U.S. protectionism and constrain China. The problem with the EU’s position is that once the U.S. and China make a trade deal, the U.S. will not have as immediate of a need to form a trade coalition against China (other than in dealing with WTO issues). Moreover, Japan will be forced to accept a deal with the U.S. in short order. A rotation of Trump trade policy to focus on Europe is likely. We give 35% odds to tariffs on autos and auto parts. The USMCA will increase the cost of production in North America while Europe is so far excluding cars from negotiations with the U.S., so there is room for a clash. But any tariffs on autos will be less sweeping than those against China. Trump will play softball rather than hardball for the following reasons: The public is less skeptical of trade with Europe and Japan than with China. The auto sector is heavily concentrated in the Red States and many states that are heavily exposed to trade with the EU are also critical to Trump’s reelection (Map 1).
Chart
Section 232 tariffs that are required to be enacted by May 18 would have plenty of time to impact the U.S. economy negatively by November 2020. Congress and the defense establishment are against a trade war with U.S. allies, while bipartisanship reigns when it comes to tougher actions toward China. The bilateral trade deficit is less excessive with Europe than with China (see Chart 12 above). The U.S. carmaker and auto parts lobby are unanimously against the tariffs – and in fact has called for the removal of the steel and aluminum tariffs in a stance that echoes that of the EU. The existing steel and aluminum tariffs provide Trump with leverage in the negotiations with the EU and Japan, whereas the U.S. has agreed not to impose new tariffs on these partners while trade negotiations are underway. New tariffs would nix negotiations and ensure that the ensuing quarrels are long and drawn out, with a necessarily worse economic impact. To initiate a new trade war in the wake of the U.S.-China war would be to undercut the positive impact on trade, financial conditions, and sentiment that is supposedly driving Trump’s desire for a China deal in the first place. The U.S. eventually will need to build a trilateral coalition to hold China to account and ensure that it does not slide back into its past mercantilist practices. Even limited or pinprick tariffs will have an adverse impact on equity markets, given that they will hit Europe at a time when its economy is decelerating dangerously and when Brexit uncertainty is already weighing on European assets and sentiment (see next section). This may be why both the U.K. and Germany have recently softened their positions on Chinese telecom company Huawei, which they have been investigating for national security concerns related to the rollout of 5G networks. They are signaling that they are not going to sacrifice their relationship with China if the U.S. is dealing with China bilaterally while threatening to turn around and slap tariffs on their auto exports. If the U.S. goes ahead with tariffs – on the basis that its China agreement allows it to isolate Europe – the EU will not be a pushover, as exports to the U.S. only amount to 2.6% of GDP (Chart 16). The result of the U.S.-China quarrel has been a deepening EU-China trade relationship and that trend is set to continue (Chart 17), especially if the U.S. continues to use punitive measures that increase the substitution effect and the strategic value of the Chinese and European markets to each other. Chart 16The EU Will Not Be A Pushover In Face Of U.S. Tariffs
The EU Will Not Be a Pushover In Face Of U.S. Tariffs
The EU Will Not Be a Pushover In Face Of U.S. Tariffs
Chart 17EU-China Trade Relationship Deepening
EU-China Trade Relationship Deepening
EU-China Trade Relationship Deepening
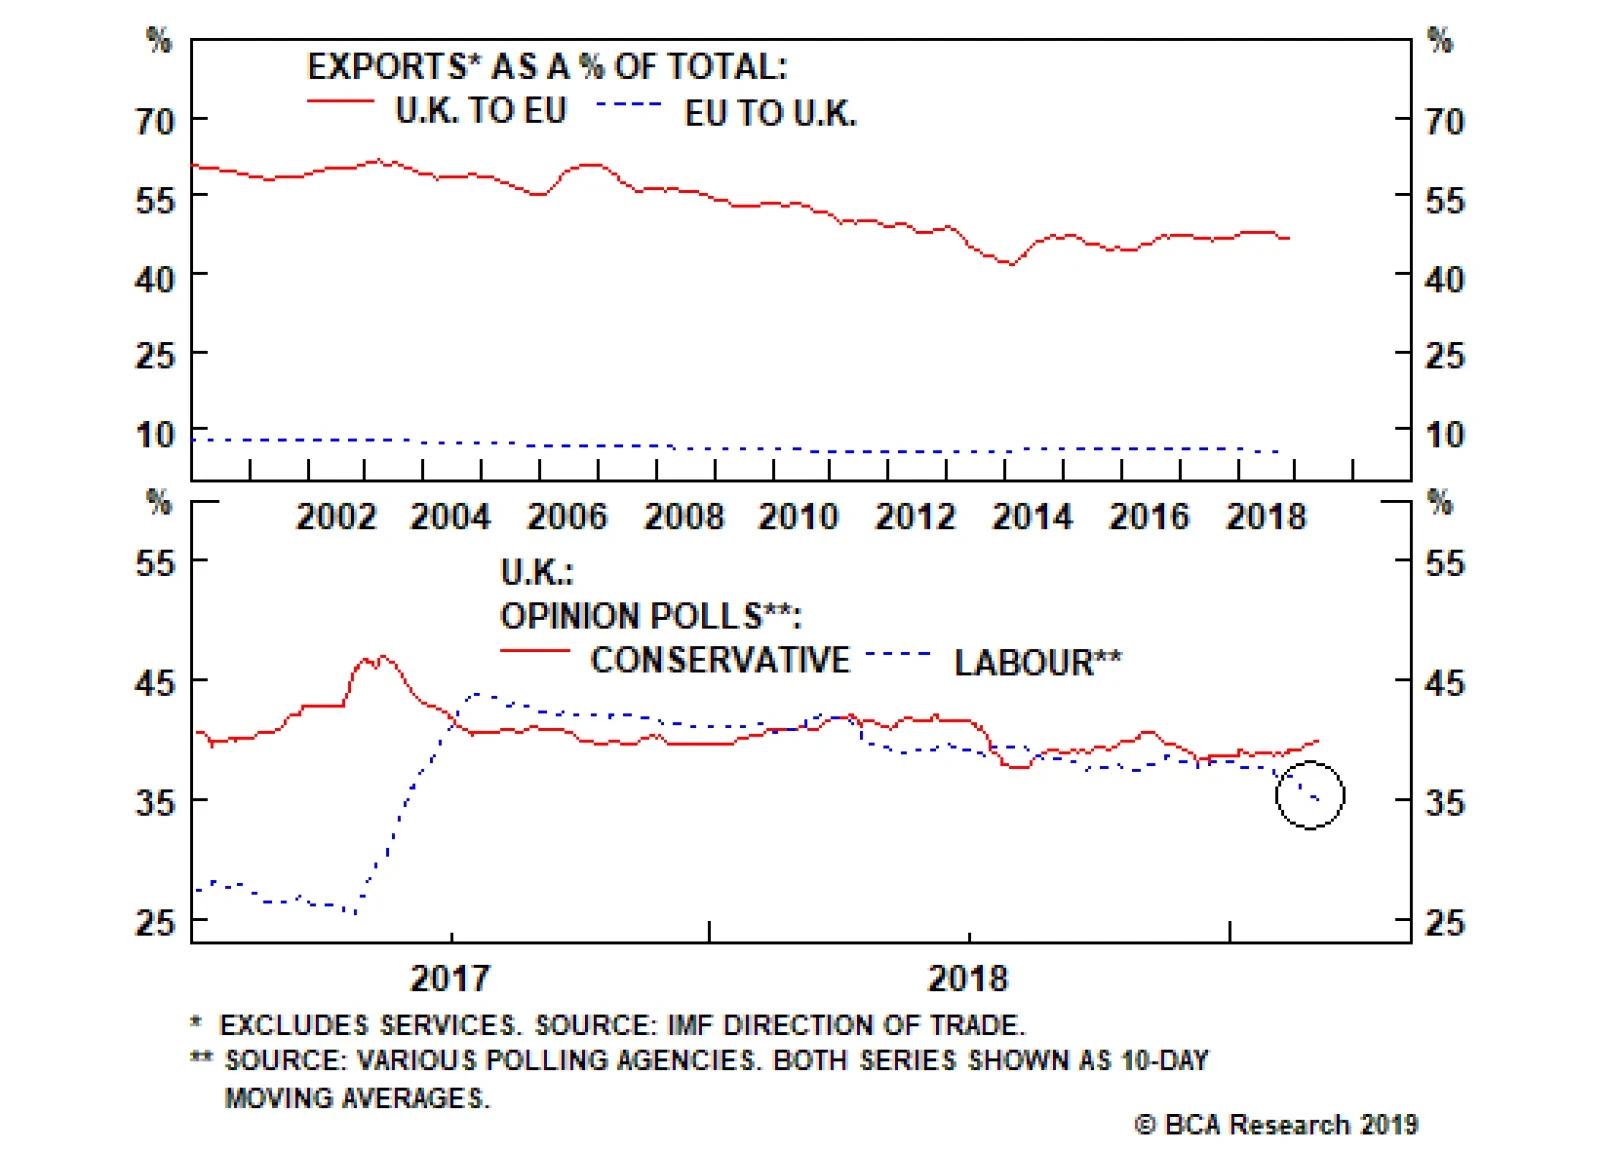
Bottom Line: In the wake of any U.S.-China agreement, we give a 35% chance that Trump will impose tariffs on European cars and car parts. Such tariffs are not our base case because they are unlikely to shrink the U.S. trade deficit and would have a negative impact on the Red State economy. But lower magnitude tariffs cannot be ruled out – and the impact on the euro and European industrial sector would clearly be detrimental in the short run. Assuming that global and European growth is recovering, a tariff shock to Europe’s carmakers could present a good opportunity to buy on the dip. Any U.S.-EU trade war will ultimately be shorter-lived and less disruptive than the U.S.-China trade war, which is likely to resume at some point even if Presidents Trump and Xi get a deal this year. The United Kingdom: Snap Election More Likely A series of important votes is taking place in Westminster this week, with the end result likely to be an extension to negotiations over a withdrawal deal at the EU Council summit on March 21. Conditional on that extension, the odds of a new election are sharply rising. The first vote, as we go to press on Tuesday, has resulted in a rejection of Prime Minister Theresa May’s exit plan by 149 votes – the second rejection after her colossal defeat in January by 230 votes. The loss was expected because the EU has not offered a substantial compromise on the contentious Irish “backstop” arrangement, which would keep Northern Ireland and/or the U.K. in the European Customs Union beyond the transition date of December 31, 2020. All that was offered was an exit clause for the U.K. sans Northern Ireland. But Northern Ireland is part of the U.K. and the introduction of additional border checks on the Irish Sea would mark a new division within the constitutional fabric. This is unacceptable to the Conservative Party and especially to the Democratic Union Party of Northern Ireland, which gives May her majority in parliament. On Wednesday, we expect the vote for a “no deal” exit, in which the U.K. simply leaves the EU without any arrangements as to the withdrawal (or future relationship), to fail by an even larger margin than May’s plan. Leaving without a deal would cause a negative economic shock due to the automatic reversion to relatively high WTO tariff levels with the EU, which receives 46% of the U.K.’s exports and is thus vital in the maintenance of its trade balance and terms of trade (Chart 18). It is impossible to see parliament voting in favor of such an outcome – parliament was never the driving force behind Brexit, with most MPs preferring to remain in the EU. Chart 18No Deal Brexit A Huge Blow To U.K.
No Deal Brexit Huge Blow To U.K.
No Deal Brexit Huge Blow To U.K.
The risk is that parliament should fail repeatedly to pass the third vote this week, a motion asking the EU for an extension period to the March 29 “exit day.” This is unlikely but possible. In this case, the supreme decision-making body of the U.K. will be paralyzed. A bloodbath will ensue in which the country will either see Prime Minister May ousted, a snap election called, or both. If the extension passes, the EU Council is likely to go along with the decision. It is in the EU’s near-term economic interest not to trigger a crash Brexit and in its long-term interest to delay Brexit until the U.K. public decides they would rather stay after all. The problem is that it will not want to grant an extension for longer than July, when new Members of the European Parliament take their seats after the May 23-26 EU elections. The U.K. may be forced to put up candidates for the election. What good would an extension do anyway? The likeliest possibility is, yet again, a new election. The conditions are not yet ripe for a second referendum, though the odds are rising that one will eventually occur. The Labour Party has fallen in the opinion polls amidst Jeremy Corbyn’s indecisive leadership and a divisive platform change within the party to push for a second Brexit referendum (Chart 19). An election now gives May’s Conservatives an opportunity to build a larger and stronger majority – after all, in the U.K. electoral system, the winner takes all in each constituency, so the Tories would pick up most of the seats that Labour loses. May’s faction might be able to strengthen its hand vis-à-vis hard Brexiters who have less popular support yet currently have the numbers to block May’s withdrawal plan. Chart 19A New Election Would Be Opportunistic
A New Election Would Be Opportunistic
A New Election Would Be Opportunistic
Theresa May might be unwilling to call an election given her fateful mistake of calling the snap election of 2017. If she demurs, she could face an internal party coup. There is a slim chance that a hard Brexiter could take the helm, bent on steering the U.K. out of the EU without a deal. Parliament, however, would rebel against such a leader. Ultimately, the economic and financial constraints of a crash Brexit are too hard and we expect that the votes will reflect this fact, whether in an adjusted exit deal or a new election. But both outcomes require an extension. However, we must point out that the constitutional and geopolitical constraints alone are not sufficient to prevent a crash out: parliament is the supreme lawmaking authority and there is no other basis for the U.K. to leave in an orderly fashion. The United Kingdom has survived worse, as many hard Brexiters will emphasize. A crash is a mistake that can happen. But the odds are not higher than 10%-20% given the stakes (Diagram 1). Diagram 1The Path To Salvation Remains Fraught With Dangers
The Witches’ Brew Keeps Bubbling…
The Witches’ Brew Keeps Bubbling…
With the EU economy not having stabilized and the U.S. contemplating Section 232 trade tariffs, Brexit is all the more reason to be wary of sterling, the euro, and European equities in the near term, especially relative to the U.S. dollar and U.S. equities. Gilts can rally even in the event of an extension given the uncertainty that this would entail, though the BCA House View is neutral. Bottom Line: Expect parliament to ask for an extension. At the same time, the odds of a new election have risen sharply. The absence of a new election could lead to a power struggle within the Tory party that could escalate the risk of a hard Brexit, though we still place the odds at 10%. A second referendum is rising in probability but will only become possible after the dust settles from the current crisis. Investment Conclusions The ECB’s stimulus measures are positive for European and global growth over a 6-to-12-month time frame. They suggest that financial assets could be supported later in the year, depending in great part on what happens in China. China’s combined January and February total social financing growth reinforces our Feb 20 report arguing that the risk of stimulus is now to the upside. As People’s Bank Governor Yi Gang put it, the slowdown in total social financing last year has stopped. The annual meeting of the National People’s Congress also resulted in largely accommodative measures on top of this credit increase. Nevertheless, stimulus operates with a lag, and for the reasons outlined above we are not yet willing to favor EUR/USD or European equities within developed markets. A 35% chance of tariffs is non-negligible. We expect U.S. equities to outperform within the developed world and Chinese equities to outperform within the emerging world on a 6-to-12 month basis. Matt Gertken, Vice President Geopolitical Strategy mattg@bcaresearch.com Marko Papic, Senior Vice President Chief Geopolitical Strategist marko@bcaresearch.com Footnotes 1 Lighthizer now has bipartisan support in Congress, whose members will lambast Trump if he squanders the historic leverage he has built up in exchange for a shallow deal that only temporarily weighs on the trade deficit.

If Trump concludes a deal with China, the next question for investors is whether he will impose Section 232 tariffs on auto and auto imports on the EU and other partners. A rotation of Trump trade policy to focus on Europe is likely. We give 35% odds to…
The first vote, as we go to press on Tuesday, has resulted in a rejection of Prime Minister Theresa May’s exit plan by 149 votes – the second rejection after her colossal defeat in January by 230 votes. However, that was expected. On Wednesday, we…
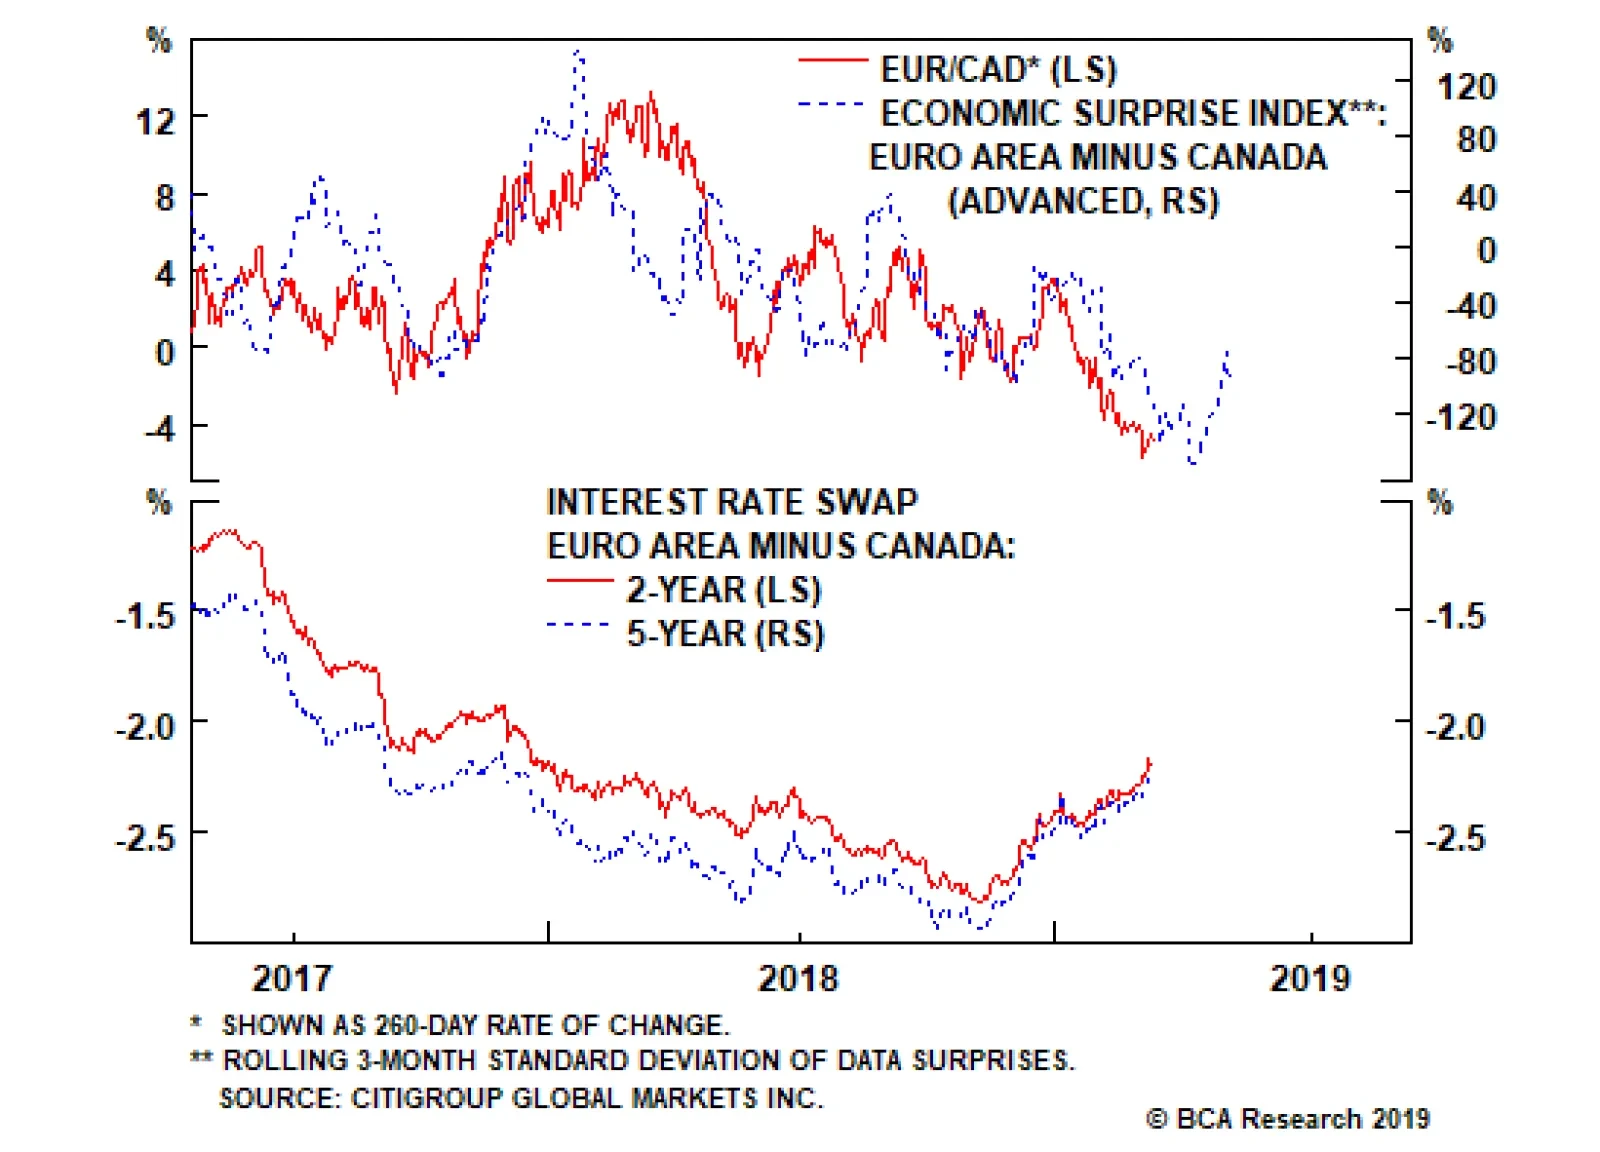
First, valuations and balance-of-payment dynamics favor the euro versus the CAD on a long-term basis. Second, we estimate there is more scope for long-term interest-rate expectations to rise in the euro area than in Canada. European rates are further below…
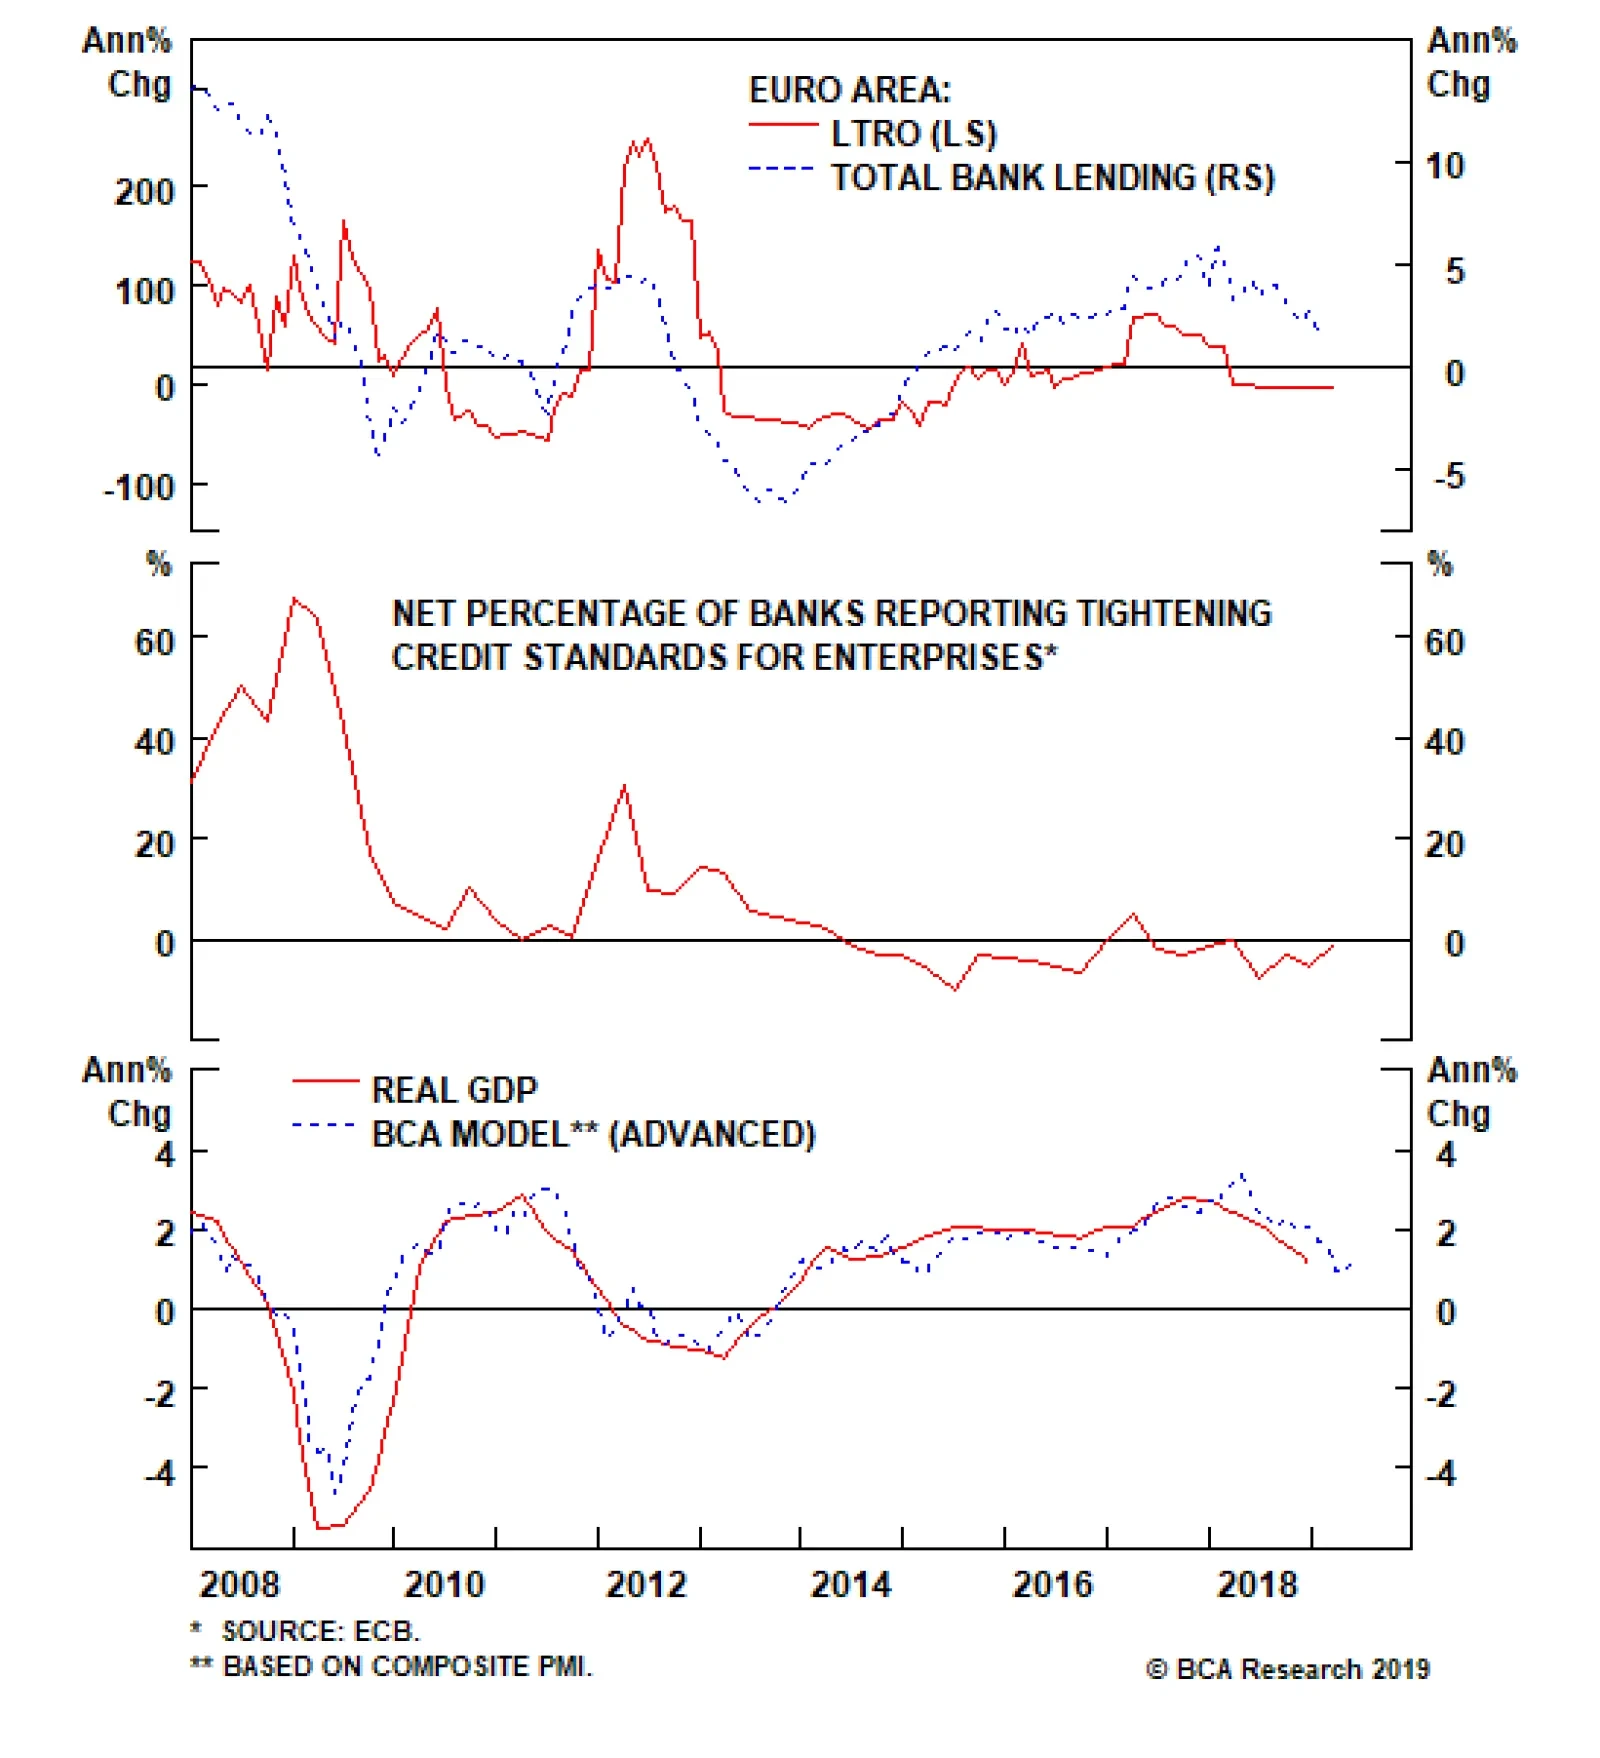
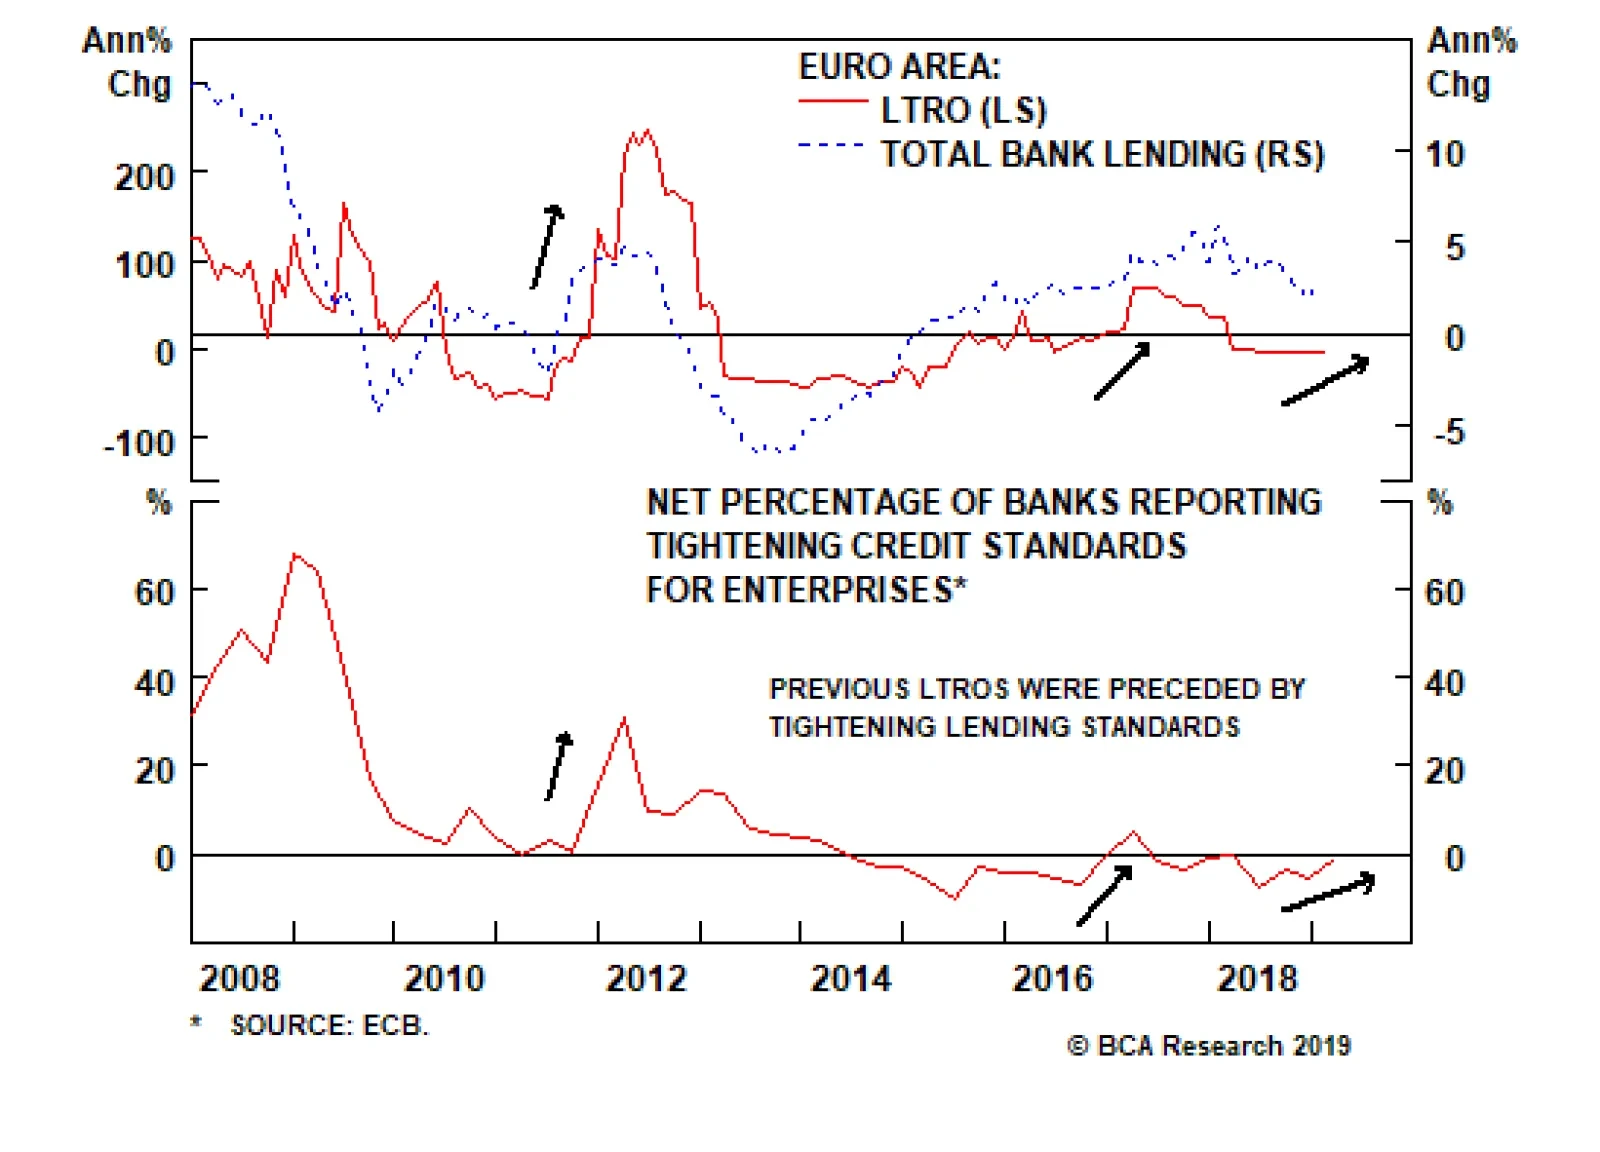
The European Central Bank left rates unchanged at Thursday’s policy meeting but the decision to launch a new Targeted Long Term Refinancing Operation (TLTRO III – or, in other words, cheap loans), could be paradoxically bullish for the euro. If a central bank…
Highlights The deceleration in global growth that began in 2018 is entering a transition phase. The bottoming out process could prove to be volatile, warning against betting the farm too early on pro-cyclical currencies. Tactical short USD bets should initially be played via the euro1 and Swedish krona. The poor Canadian GDP report last week could be a harbinger for more data disappointments down the road. Meanwhile, the dovish shift by the ECB could paradoxically be bullish for the euro beyond the near term. Go short USD/SEK and buy EUR/CAD for a trade. Feature A currency exchange rate is simply a measure of relative prices between two countries. As such, the starting point for any currency forecast should be how those values are likely to evolve over time. For much of 2018, U.S. growth benefited from the impact of the Trump tax cuts, a boost to government spending agreed in January of that year, and the lagged effect of an easing in financial conditions from December 2016 to January 2018. Outside the U.S., what appeared to be idiosyncratic growth hiccups in both Europe and Japan finally morphed into full-blown slowdowns. Slower Chinese credit growth and the U.S.-China trade war were the ultimate straws that broke the camel’s back, deeply hurting global growth (Chart I-1). Consequently, the greenback surged. Chart I-1The Global Growth Slowdown Persists
The Global Growth Slowdown Persists
The Global Growth Slowdown Persists
Fading U.S. Dollar Tailwinds At first glance, the picture remains largely similar today, with global growth still slowing and U.S. growth still outperforming. However, a key difference from last year is that U.S. growth leadership is set to give way to the rest of the world. The U.S. ISM manufacturing PMI peaked last August and has been steadily rolling over relative to its trading partners. The U.S. economic surprise index tells a similar story, with last month’s disappointing retail sales numbers nudging the series firmly below zero. Relative leading economic indices also suggest that U.S. growth momentum has slowed relative to the rest of the world. Historically, the relative growth differential between the U.S. and elsewhere has had a pretty good track record of dictating trends in the dollar (Chart I-2). Chart I-2U.S. Growth Leadership Might Soon End
U.S. Growth Leadership Might Soon End
U.S. Growth Leadership Might Soon End
Whether or not these trends persist beyond the first quarter will depend on the sustainability of China’s recent stimulus efforts. On the positive side, typical reflation indicators such as commodity prices, emerging market currencies, and industrial share prices have perked up in response to a nascent upturn in the credit impulse. On the other hand, policy shifts affect the economy with a lag, suggesting it is too early to tell whether the latest credit injection has been sufficient to turn around the Chinese economy, let alone the rest of the world. What is clear is that the bottoming processes tend to be volatile and protracted, suggesting it is still too early to bet the farm on pro-cyclical currencies. In the interim, investors could track the following indicators to help time a definitive turning point: Whether or not easing liquidity conditions will lead to higher growth is often captured by the CRB Raw Industrial index-to-gold, copper-to-gold, and oil-to-gold ratios. It is encouraging that these also tend to move in lockstep with the U.S. bond yields, another global growth barometer. The power of the signal is established when all three indicators peak or bottom at the same time, as is the case now (Chart I-3). The next confirmation will come with a clear break-out in these ratios. Chart I-3Reflation Indicators Are Perking Up
Reflation Indicators Are Perking Up
Reflation Indicators Are Perking Up
Chinese M2 relative to GDP has bottomed. Historically, this ratio has lit a fire under cyclical stocks and, by extension, pro-cyclical currencies (Chart I-4). The growth rate is still at zero, meaning excess liquidity is not accelerating on a year-over-year basis. Meanwhile, our Emerging Markets team argues that broad credit growth is still decelerating.2 A break above the zero line, probably in the second half of this year, could be a catalyst to shift fully to a pro-cyclical currency stance. Chart I-4Chinese Excess Liquidity Improving
Chinese Excess Liquidity Improving
Chinese Excess Liquidity Improving
On a similar note, currencies in emerging Asia that sit closer to the epicenter of stimulus appear to have bottomed. If those in Latin America can follow suit, it would indicate that policy stimulus is sufficient, and the transmission mechanism is working (Chart I-5). Chart I-5EM Currencies Are Trying To Bottom
EM Currencies Are Trying To Bottom
EM Currencies Are Trying To Bottom
Finally, China-sensitive industrial commodities, especially metals and building materials, appear to have troughed and are perking up nicely. There was a supply-related issue with the Vale dam bursting in Brazil and a subsequent surge in iron-ore prices, but it is now clear that the entire industrial commodity complex has stopped falling (Chart I-6). Chart I-6Chinese Industrial Commodities Are Rallying
Chinese Industrial Commodities Are Rallying
Chinese Industrial Commodities Are Rallying
Be Selective On USD Shorts Our strategy is to be selective as U.S. dollar tailwinds shift to headwinds, by initially expressing tactical USD shorts via the euro and the Swedish krona. Last week, we highlighted the fact that investors are currently too pessimistic on Europe’s growth prospects. More importantly, most of the factors that toppled European growth domestically – the implementation of new auto-emission standards in Germany, the rising cost of capital in Italy via exploding bond yields, and the populist Gilets Jaunes protests in France – are mostly behind us. Fiscal policy is also set to be loosened this year, and last year’s weakness in the euro will contribute to easier financial conditions. The improvement in European investor sentiment relative to current conditions could be a harbinger of positive euro area data surprises ahead (Chart I-7). Chart I-7Euro Zone Data Might Surprise To The Upside
Euro Zone Data Might Surprise To The Upside
Euro Zone Data Might Surprise To The Upside
The European Central Bank left rates unchanged at yesterday’s policy meeting but the decision for a new Targeted Long Term Refinancing Operation (TLTRO III – or in other words, cheap loans), could be paradoxically bullish for the euro. If a central bank eases financing conditions at a time when growth is hitting a nadir, it is tough to argue that this is bearish for the currency. Our Global Fixed Income team nailed the move by the ECB in this week’s report.3 European banks have been in the firing line of sluggish growth, negative interest rates, and increased regulatory scrutiny. In the case of Italy, an NPL ratio 9.4% is nearly triple that of the euro area. And with circa 10% of total bank lending in Spain and Italy funded by TLTROs, re-funding by the ECB is exactly what the doctor ordered. In the case of the Sweden, the undervaluation of the krona has begun to mitigate the effects of negative interest rates – mainly a buildup of household leverage and an exodus of foreign direct investment. The GDP report last week was well above expectations, with year-on-year growth of 2.4%. Encouragingly, this was driven by net exports rather than consumption. The Swedish manufacturing PMI release for February was also very encouraging. Orders jumped from 50.4 to 54.0 while export orders jumped from 51.5 to 53.4. The growth in wages is beginning to catch up to new borrowings, meaning domestic consumption could be increasingly financed through income. This will alleviate the need for the Riksbank to maintain an ultra-accommodative policy. On a relative basis, the Swedish economy appears to have bottomed relative to that of the U.S., making the USD/SEK an attractive way to play USD downside. From a technical perspective, the cross is facing strong resistance at the triple top established from the 2009 highs around 9.45 (Chart I-8). Aggressive investors should begin accumulating short positions, while being cognizant of the negative carry. Chart I-8The Swedish Krona Looks Like A Buy
The Swedish Krona Looks Like A Buy
The Swedish Krona Looks Like A Buy
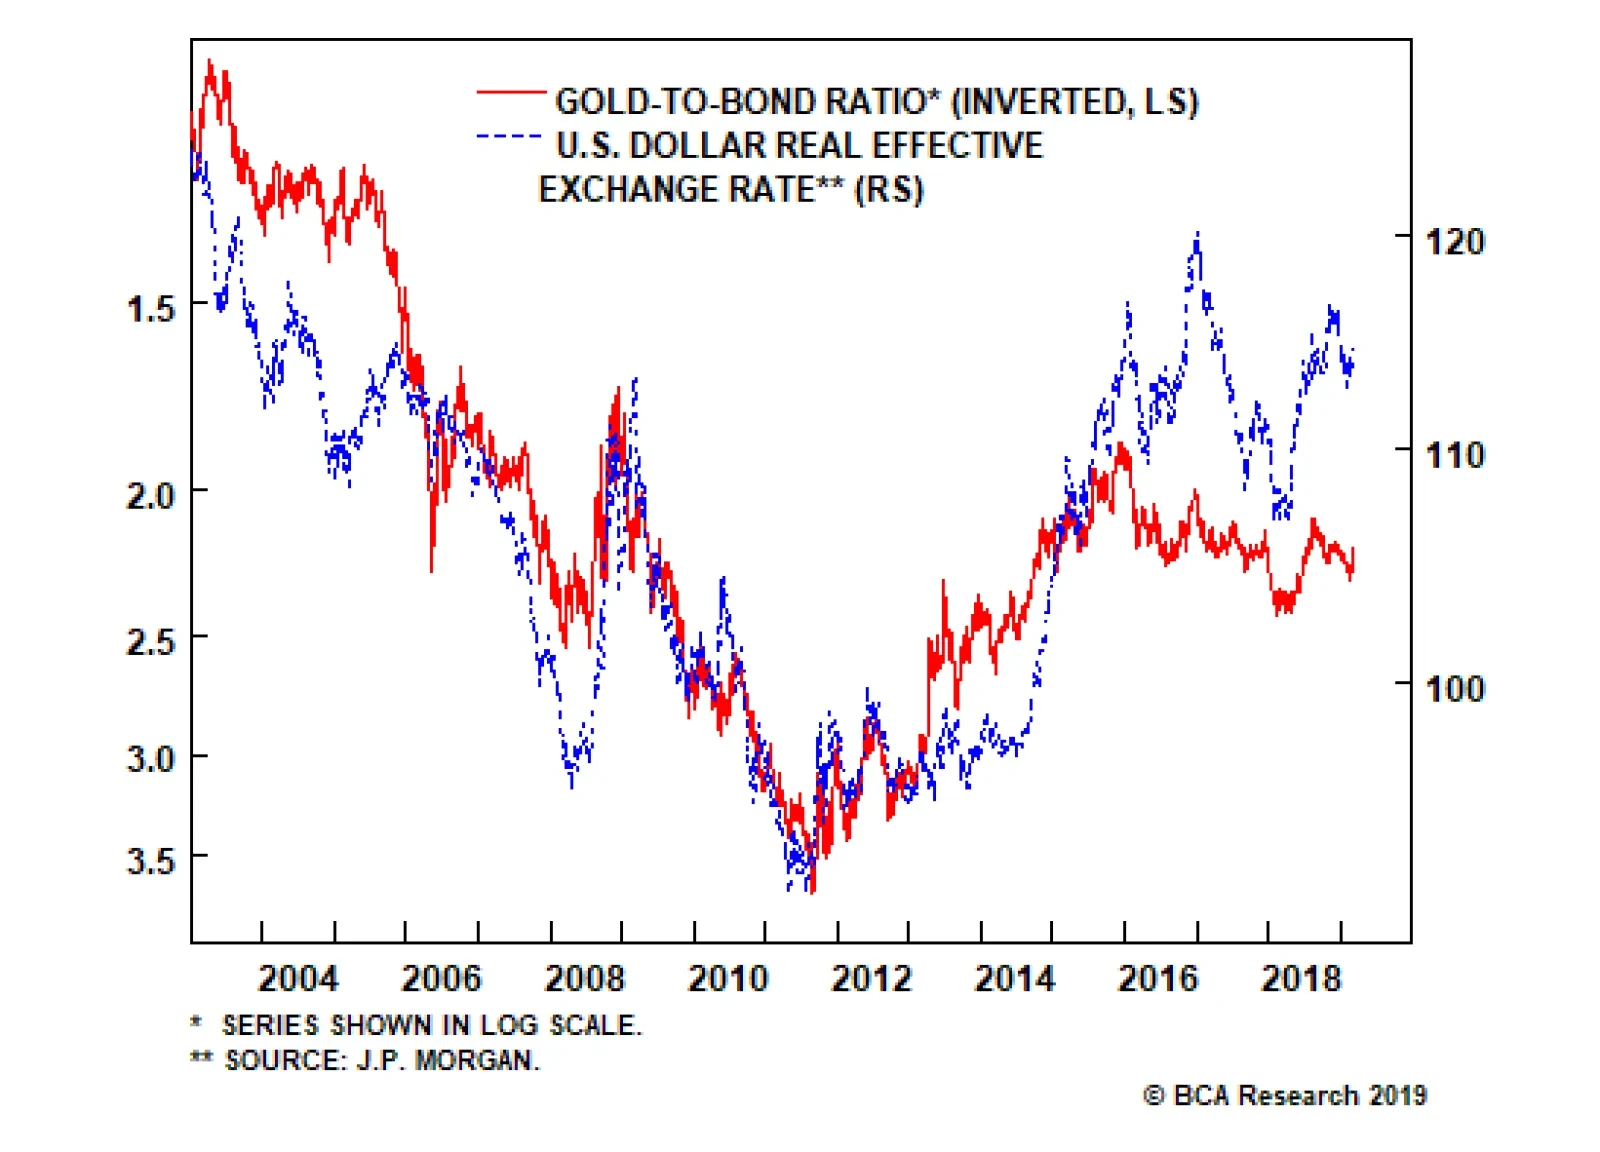
Bottom Line: Our favorite indicator for gauging ultimate downside in the dollar is the gold-to-bond ratio. Ever since the global financial crisis, gold has stood as a viable threat to dollar liabilities, capturing the ebb and flow of investor confidence in the greenback tick-for-tick (Chart I-9). Any sign that the balance of forces are moving away from the U.S. dollar will favor a breakout in the gold-to-bond ratio. For now, USD short positions should be played via the euro and Swedish krona. Chart I-9Pay Close Attention To The Gold-To-Bond Ratio
Pay Close Attention To The Gold-To-Bond Ratio
Pay Close Attention To The Gold-To-Bond Ratio
Buy EUR/CAD For A Trade Last week saw an extremely disappointing GDP report out of Canada, which prompted the Bank of Canada to keep interest rates on hold this week, followed by quite dovish commentary. In a 90-degree maneuver from its January policy statement that rates will need to rise over time, BoC Governor Stephen Poloz said the path for future increases had become “highly uncertain.” Like many central banks around the world, the BoC has been blindsided by the depth of the negative growth impulse outside its borders, which has begun to seep into the domestic economy. The economy grew at an annualized pace of 0.4% in the fourth quarter, the lowest in over two years. Capital expenditures collapsed at a rate of 2.7%, marking the third consecutive quarter of declines. The forward OIS curve is pricing in no rate hikes for Canada this year, meaning sentiment on the loonie is already depressed. However, our contention is that even if growth bottoms by the second half of this year, the Canadian dollar will offer little value to play this cyclical rebound. Our recommendation is to play the loonie’s downside via the euro. First, valuations and balance-of-payment dynamics favor the euro versus the CAD on a long-term basis. Second, we estimate there is more scope for long-term interest rate expectations to rise in the euro area than in Canada (Chart I-10). European rates are further below equilibrium, and the ECB’s dovish shift will help lift the growth potential of the euro area. Meanwhile, the Canadian neutral rate will be heavily weighed down by the large stock of debt in the Canadian private sector, exacerbated by overvaluation in the housing market. This means that expectations in the 2-year forward market are likely to favor the euro versus the CAD. Chart I-10Buy EUR/CAD For A Trade
Buy EUR/CAD For A Trade
Buy EUR/CAD For A Trade
The biggest risk to this view is the price of oil. The EUR/CAD exchange rate is not as negatively correlated with oil as the USD/CAD, but nonetheless the CAD benefits more from rising oil prices than the euro does. BCA’s bullish oil view is a risk over the next six months. On the downside, the EUR/CAD could potentially test the bottom of the upward trending channel that has existed since 2012. This would put EUR/CAD in the vicinity of 1.45 (currently trading at 1.5049). However, initial upside resistance rests at the triple top a nudge above 1.6 (Chart I-11). Chart I-11EUR/CAD Technicals: Limited Downside
EUR/CAD Technicals: Limited Downside
EUR/CAD Technicals: Limited Downside
Meanwhile, economically, Canada is benefiting less from oil prices today than it has in the past. First, the Canadian oil benchmark trades at a large discount to Brent, and second, Canada is having trouble shipping its own oil at a moderate cost due to lack of pipeline capacity.4 Bottom Line: Investors should buy the EUR/CAD for a trade. The Canadian dollar is likely to outperform its antipodean counterparts, but faces limited upside versus the U.S. dollar. There are better opportunities to play USD downside, namely via the Swedish krona and the euro. Stand Aside On The Australian Dollar For more than two decades, the Australian dollar has tended to be mostly driven by external conditions, especially the commodity cycle. But for the first time in several years, domestic factors have joined in to exert powerful downward pressure on the currency. The Australian Prudential Regulation Authority (APRA) has been on a mission to surgically deflate the overvalued housing market, while engineering a soft landing in the economy. Initially, their macro-prudential measures worked like a charm, as owner-occupied housing activity remained resilient relative to “investment-style” housing. What has become apparent now is that the soft landing intended by the authorities is rapidly morphing into a housing crash (Chart I-12). Chart I-12Australia: Anatomy Of A Hard Landing
Australia: Anatomy Of A Hard Landing
Australia: Anatomy Of A Hard Landing
In addition, the upcoming general election could exacerbate the risks to the country’s banks and the housing market.5 The center-left Labour Party, which has moved further to the left in this electoral cycle, has promised several regulatory changes. First, the Labour government would want to get rid of “negative gearing,” the practice of using investment properties that are generating losses to offset one’s income tax bill. Second, the capital gains tax exemption from selling properties will be reduced from 50% to 25%. Third, the Labour government would end the policy of reimbursing investors for the corporate tax paid by the company. This would end the incentive for retirees to own high dividend yielding equities, such as those of Australian banks. This week, the Reserve Bank of Australia kept rates on hold and acknowledged risks to the housing market, but bank stocks suggest they remain well behind the curve (Chart I-13). The futures market is already pricing in 23 basis points of rate cuts by the end of the year, and the contention of our fixed income team is that more might be needed down the road. First, all the preconditions for a rate hike – underemployment below 8%, a rebound in Chinese economic activity and core CPI in the range of 2-3% – have not been met. The reality is that core CPI has lagged the target range since late-2015, and now faces downside risks. Chart I-13Australian Bank Stocks Are Pricing In A Curve Inversion
Australian Bank Stocks Are Pricing In A Curve Inversion
Australian Bank Stocks Are Pricing In A Curve Inversion
That said, a lot of the bad news already appears priced into the Australian dollar, which is down 14% from its 2018 peak, and 37% from its 2011 peak. This suggests outright short AUD bets are at risk from either upside surprises in global growth, or simply the forces of mean reversion (Chart I-14). Chart I-14Stand Aside On The Australian Dollar For Now
Stand Aside On The Australian Dollar For Now
Stand Aside On The Australian Dollar For Now
Bottom Line: Sentiment on the Aussie dollar is already bearish, warning against putting on fresh shorts. Our short AUD positions, expressed via the NZD and the CAD, are currently 6.74% and 1.99% in the money, respectively. Investors should hold onto these positions, but tighten stops to protect profits. Chester Ntonifor, Foreign Exchange Strategist chestern@bcaresearch.com Footnotes 1 Please see Foreign Exchange Strategy Special Report titled “A Contrarian Bet On The Euro,” dated March 1, 2019 available at fes.bcaresearch.com 2 Please see Emerging Markets Strategy Weekly Report titled “EM: A Sustainable Rally Or False Start?,” dated March 7, 2019 available at ems.bcaresearch.com 3 Please see Global Fixed Income Strategy Special Report, titled “The ECB’s Next Move: Taking Out Some Insurance,” dated March 5, 2019, available at gfis.bcaresearch.com 4 Please see Commodity & Energy Strategy Weekly Report, titled “Oil Price Diffs: Global Convergence,” dated March 7, 2019, available at ces.bcaresearch.com 5 Please see Geopolitical Strategy Special Report, titled “A Year Of Change In Australia?,” dated December 5, 2018, available at gps.bcaresearch.com Currencies U.S. Dollar Chart II-1USD Technicals 1
USD Technicals 1
USD Technicals 1
Chart II-2USD Technicals 2
USD Technicals 2
USD Technicals 2
Recent data in the U.S. have been mixed: Annualized Q4 GDP growth came in line with expectations at 2.6%, but both the Atlanta and New York Fed models suggest sub 1% growth in Q1 this year. ISM manufacturing PMI missed expectations, falling to 54.2, while the non-manufacturing PMI increased to 59.7. Q4 unit labor costs increased to 2%, surprising to the upside. The DXY index has gained 1.17% this week. Upside on the dollar will be based on Fed’s capacity to continue tightening monetary policy later this year. However, there are increasing signs pointing to a weakening in leadership of U.S. growth this cycle, which could be a headwind for the counter-cyclical dollar. Report Links: Balance Of Payments Across The G10 - February 15, 2019 A Simple Attractiveness Ranking For Currencies - February 8, 2019 Global Liquidity Trends Support The Dollar, But... - January 25, 2019 The Euro Chart II-3EUR Technicals 1
EUR Technicals 1
EUR Technicals 1
Chart II-4EUR Technicals 2
EUR Technicals 2
EUR Technicals 2
Recent data in the euro area show some specter of stabilization: Yearly consumer price inflation increased to 1.5%, in line with expectations. Q4 GDP growth on a year-on-year basis fell to 1.1%, marginally in line. Encouragingly, the Markit composite PMI increased to 51.9. The manufacturing PMI came in at 49.3, while services PMI came in at 52.8. Finally, retail sales grew higher than expected, with a reading of 2.2%. EUR/USD has fallen by 1.3% this week. The ECB kept interest rates on hold with a dovish tilt. Paradoxically, this could be bullish for the euro, if it allows growth to definitively bottom. Easing financial conditions in the euro area are reflationary and risks to the periphery have been curtailed. Report Links: A Contrarian Bet On The Euro - March 1, 2019 Balance Of Payments Across The G10 - February 15, 2019 A Simple Attractiveness Ranking For Currencies - February 8, 2019 The Yen Chart II-5JPY Technicals 1
JPY Technicals 1
JPY Technicals 1
Chart II-6JPY Technicals 2
JPY Technicals 2
JPY Technicals 2
Recent data in Japan have been mixed: Yearly inflation surprised to the upside, coming in at 0.6%. The core inflation excluding fresh food also came in higher than expected at 1.1%. January unemployment rate missed expectations, climbing to 2.5%; while the jobs-to-applicants ratio stayed at 1.63. Nikkei manufacturing PMI surprised to the upside, coming in at 48.9. USD/JPY has risen by 0.4% this week. While we are positive on the safe-haven yen on a structural basis, we struggle to see any near-term upside amid significant Japanese stock and bond outflows. We will be discussing the outlook for the yen in an upcoming report. Report Links: Balance Of Payments Across The G10 - February 15, 2019 A Simple Attractiveness Ranking For Currencies - February 8, 2019 Yen Fireworks - January 4, 2019 British Pound Chart II-7GBP Technicals 1
GBP Technicals 1
GBP Technicals 1
Chart II-8GBP Technicals 2
GBP Technicals 2
GBP Technicals 2
Recent data in the U.K. have been improving: February consumer confidence came in at -13, slightly higher than expectations. Markit manufacturing PMI came in at 52, in line with expectations; while the services PMI surprised to the upside, coming in at 51.3. The Halifax house price index surprised to the upside, rising 5.9% mom in February. GBP/USD has fallen by 1.2% this week. During the speech on March 5, the Bank of England governor Mark Carney highlighted the market underestimates the potential for interest rate hikes. Overall, we remain bullish on the pound in the long-term, but volatility is set to rise in the near term as we approach the Brexit March 29 deadline. Report Links: Balance Of Payments Across The G10 - February 15, 2019 A Simple Attractiveness Ranking For Currencies - February 8, 2019 Deadlock In Westminster - January 18, 2019 Australian Dollar Chart II-9AUD Technicals 1
AUD Technicals 1
AUD Technicals 1
Chart II-10AUD Technicals 2
AUD Technicals 2
AUD Technicals 2
Recent data in Australia have been dismal: The RBA commodity price index advanced by 9.1% year-on-year in February, but this was supply related. Building permits continue to contract at 29% year-on-year. Finally, the annualized Q4 GDP growth fell to 0.2%, more than 50% below expectations. AUD/USD fell by 1.2% this week. The RBA kept the interest rate unchanged at 1.5%. Governor Philip Lowe acknowledged the downside risks to the housing market and overall economy, and warned about the “significant uncertainties around the forecast.” That said, AUD/USD has fallen by a 13% since the January 2018 highs, warning against establishing fresh shorts at this juncture. Report Links: Balance Of Payments Across The G10 - February 15, 2019 A Simple Attractiveness Ranking For Currencies - February 8, 2019 CAD And AUD: Jumping Higher To Plunge Deeper - February 1, 2019 New Zealand Dollar Chart II-11NZD Technicals 1
NZD Technicals 1
NZD Technicals 1
Chart II-12NZD Technicals 2
NZD Technicals 2
NZD Technicals 2
Recent data in New Zealand have been mixed: Seasonally adjusted building permits increased 16.5% month-on-month in January, a huge jump. However, the ANZ activity business confidence dropped to -30.9. Most importantly, terms of trade fell to -3% in the fourth quarter, underperforming expectations. NZD/USD depreciated by 0.9% this week. The key for the Kiwi will be a pickup in agricultural commodity prices, which remain in a definitive bear market. Report Links: Balance Of Payments Across The G10 - February 15, 2019 A Simple Attractiveness Ranking For Currencies - February 8, 2019 Updating Our Intermediate Timing Models - November 2, 2018 Canadian Dollar Chart II-13CAD Technicals 1
CAD Technicals 1
CAD Technicals 1
Chart II-14CAD Technicals 2
CAD Technicals 2
CAD Technicals 2
Recent data in Canada have been disappointing: Q4 current account balance has deteriorated, coming in at C$ -15.48 billion. Moreover, annualized Q4 GDP growth missed analysts’ forecast, coming in at 0.4%. Finally, the Markit manufacturing PMI weakened to 52.6 in February. USD/CAD has gained 2.1% this week. The BoC kept interest rates on hold at 1.75% given that domestic economic conditions have now coupled to the downside with a bleak external picture. The caveat for the Canadian dollar is that rising oil prices could provide some support. Report Links: Balance Of Payments Across The G10 - February 15, 2019 A Simple Attractiveness Ranking For Currencies - February 8, 2019 CAD And AUD: Jumping Higher To Plunge Deeper - February 1, 2019 Swiss Franc Chart II-15CHF Technicals 1
CHF Technicals 1
CHF Technicals 1
Chart II-16CHF Technicals 2
CHF Technicals 2
CHF Technicals 2
Recent data in Switzerland have been negative: Annualized Q4 GDP growth missed analysts’ expectations by 50%, coming in at 0.2%. In addition, the retail sales contracted 0.4% year-on-year. Lastly, CPI was in line at 0.6%, but this is a far cry from the March 2018 peak. EUR/CHF has been flat this week. Overall, we are bullish EUR/CHF on a cyclical basis. Stabilization in global growth will make safe-haven currencies like the franc less attractive. In addition, the foreign direct investment and portfolio investment outflows from Switzerland should put more downward pressure on the franc. Report Links: Balance Of Payments Across The G10 - February 15, 2019 A Simple Attractiveness Ranking For Currencies - February 8, 2019 Waiting For A Real Deal - December 7, 2018 Norwegian Krone Chart II-17NOK Technicals 1
NOK Technicals 1
NOK Technicals 1
Chart II-18NOK Technicals 2
NOK Technicals 2
NOK Technicals 2
Recent data in Norway have been mixed: Monthly unemployment rate fell to 2.5%, in line with expectations. However, the Q4 current account balance fell to 46.8 billion from 91.36 billion in Q3. The manufacturing PMI has been stable for a few months now, coming in at 56.3 for the month of February. USD/NOK increased by 2.2% this week. We are optimistic on the NOK on a structural basis, given the positive outlook for oil prices. Moreover, the NOK is undervalued and trading at a large discount to its long-term fair value. Report Links: Balance Of Payments Across The G10 - February 15, 2019 A Simple Attractiveness Ranking For Currencies - February 8, 2019 Global Liquidity Trends Support The Dollar, But... - January 25, 2019 Swedish Krona Chart II-19SEK Technicals 1
SEK Technicals 1
SEK Technicals 1
Chart II-20SEK Technicals 2
SEK Technicals 2
SEK Technicals 2
Recent data in Sweden have been positive: Retail sales was in line with expectations at 0.8% month-on-month. However, annualized Q4 GDP growth was double expectations at 1.2%. The February manufacturing PMI also came in higher at 52.5. In addition, industrial production yearly growth came in higher at 3.4%. Lastly, the Q4 current account balance increased to 39.6 billion. USD/SEK increased by 2% this week. The SEK is still trading at a large discount to its long-term fair value. We remain bearish on USD/SEK on a structural basis as we see many signs pointing to a recovery in the Swedish economy, which is a tailwind for the Swedish krona. Report Links: Balance Of Payments Across The G10 - February 15, 2019 A Simple Attractiveness Ranking For Currencies - February 8, 2019 Global Liquidity Trends Support The Dollar, But... - January 25, 2019 Trades & Forecasts Forecast Summary Core Portfolio Tactical Trades Closed Trades
This morning, the ECB greatly curtailed its growth and inflation forecasts. Expected GDP growth in 2019 and 2020 was downgraded to 1.1% and 1.6% from 1.7% and 1.7%, respectively. While anticipated inflation was also revised down for the entire forecast…
Dear Client, I am travelling this week so this report is a joint effort juxtaposing two contrasting observations about France. The ‘opulence’ part highlights France as the world’s dominant producer of luxury goods, and makes the case that some of the French luxury goods companies should form a core part of a long-term investment portfolio. The ‘rebellion’ part borrows from a recent Special Report on French politics penned by my colleague Jeremie Peloso. It analyses the recent yellow vest protests in France, and assesses whether they are a cause for concern. Best regards, Dhaval Joshi, Chief European Investment Strategist Feature Opulence Made In France
Chart I-1
Global luxury goods sales amount to a quarter of a trillion dollars, and Europe dominates in the production of these luxury goods. Measured by the number of companies, the leading luxury goods country is Italy. But on the more important metric of share of total global sales, the undisputed world leader is France. In fact, just four French companies produce a quarter of the world’s luxury goods sales. The four are: LVMH, Kering, L’Oreal, and Hermes1 (Chart of the Week, Chart I-2, and Table I-1).
Chart I-2
Chart I-
France’s luxury goods sector is an excellent diversifier for investors. This is because, compared to other goods and services, luxuries follow very different laws of economics: The demand for luxuries has a positive elasticity to price. Put more simply, the desirability of a luxury increases as its price goes up. This is opposite to the demand for non-luxuries which has a negative elasticity to price: for non-luxury items, the demand declines as the price goes up. By definition, you cannot compete with a luxury item by undercutting its price. Given that a luxury implies fine-craftsmanship rather than mass production, the sector is highly resilient to the existential threats confronting other European industries that emanate from out-sourcing to lower cost economies and from automation. Luxury demand is also relatively insensitive to exchange rate movements. The barrier to entry into the luxuries sector is extremely high. It takes years, or even decades, for a luxury item to acquire its premium status based on consistent high quality in materials and craftsmanship. This high barrier to entry makes it much harder for other economies to challenge the European and French dominance in providing these luxury products. Despite these attractive characteristics the sector does still require a source of structural demand. Our premise, expounded in our Special Report “Buying European Clothes: An Investment Megatrend”, is that the feminisation of consumer spending, particularly in Europe, is providing a strong structural tailwind to the demand for ‘soft’ luxury goods. A recent industry study by Deloitte corroborates this thesis, pointing out that the strongest growth in the luxury sector is to be found in cosmetics, fragrances, bags and accessories. On this premise, the four leading French companies are big beneficiaries.2,3 Are market valuations already aware of, and fully discounting, the thesis of feminisation of consumer spending? We think not, as most investors are surprised by the thesis and unaware of the on-going dynamics behind it. On this basis, three of the four French luxury companies, trading on forward PE multiples in the 20s or below, still appear reasonably valued for their growth prospects (Table I-2). The exception is Hermes which, on a multiple of 40, does seem richly priced.
Chart I-
The bottom line is that the three other leading French luxury goods companies – LVMH, Kering, and L’Oreal – do deserve to be a core part of a long-term investment portfolio. Rebellion Made In France The yellow vest protest movement is not a coherent force led by a clear leadership. What started on the social media as a protest against the fuel tax in rural areas has evolved into a movement against President Macron. This transition occurred in part because a large segment of the population believes that Macron’s reforms have mainly benefited the wealthy. 77 percent of respondents in a recent poll view him as the “president of the rich.” The modification of the ‘wealth tax’ – which mostly shifts the focus toward real estate assets instead of financial assets – was highly criticized for favouring the wealthiest households. It resonated strongly with the perception that past governments helped the wealthiest households to accumulate more wealth on the back of the middle class. But it is not clear how intense or durable this popular sentiment will be, given that this type of inequality is not extreme in France and has not been rising (Chart I-3). Chart I-3What Income Inequality?
What Income Inequality?
What Income Inequality?
Public support for the protests has hovered consistently around 70 percent since they started in November 2018 (Chart I-4). However, there are now more respondents who think that the protests should stop as that they should continue (Chart I-5). As a sign of things to come, a demonstration against the yellow vests and in support of Macron and his government – held by the “red scarves” – managed to gather more people on the streets of Paris than the regionally based yellow vests have done in the capital city.4
Chart I-4
Chart I-5
Who are the yellow vests? They are mostly rural, mostly hold a high school degree (or less), and overwhelmingly support anti-establishment political leaders Marine Le Pen (right-wing leader of the National Rally) or Jean-Luc Mélenchon (left-wing leader of La France Insoumise). This suggests that the movement has failed to cross the ideological aisle and win converts from the centre (Diagram I-1).
Chart I-
How many French people are actually protesting? Although there was a slight pickup in protests at the beginning of January, the numbers countrywide are not high. In fact, they are far from what they were back in November and therefore would have to get much larger for markets to become concerned anew (Chart I-6). If we are to compare these protests to those in 1995 or 2010, the numbers pale in comparison (Table I-3). For instance, the protest of December 1995 brought a million people onto the streets while the demonstrations against the Woerth pension reform in 2010 lasted for seven months and gathered close to nine million protesters across eight different events (Chart I-7).
Chart I-6
Chart I-
Chart I-7
We would compare the yellow vest protests to the 15-month long Spanish Indignados in 2011, which gathered between six and eight million protesters overall, and the U.S. Occupy Wall Street protests that same year. The two movements were similarly disorganized and combined disparate and often contradictory demands. In both cases, the governments largely ignored the protesters. Thus the yellow vests should not have a major impact on Macron’s reform agenda. As expected, Macron has not mentioned changing course on his most business-friendly reforms, which we see as a signal to investors that, despite the recent chaos, the plan remains the same. There is no strategic reason why Macron would reverse course. His popularity is already in the doldrums. His only chance at another term is to plough ahead and campaign in 2022 on his accomplishments. Nevertheless, to ensure that he does not plough into a rock, Macron will adjust course to calm the protesters. For example, the recent increase in the minimum wage that the government announced in response to the demonstrations was not supposed to be implemented until later in the presidential term. In a similar vein, pension reforms will likely be postponed given the ongoing protests. Macron hoped to introduce a universal, unified pension system by the middle of 2019 to replace an overly complex and fragmented system in which 42 different types of pension coexist, each one having its own rules of calculation. Though protests (both yellow vest and otherwise) have been unimpressive by historical standards, it might be too risky for the government to push the pension reform so close to these events. Such adjustments to the reform agenda should help reduce the protest movement’s fervour or otherwise its support. The bottom line is that the yellow vest protests were to be expected – they are the natural consequence of Emmanuel Macron’s push to reform the French economy and state. However, when compared to previous efforts to derail government reforms, the numbers simply do not stack up. Their disunited and broad objectives are likely to limit the effectiveness of the movement going forward.5 Dhaval Joshi, Chief European Investment Strategist dhaval@bcaresearch.com Jeremie Peloso, Research Analyst jeremiep@bcaresearch.com Footnotes 1 In the case of L’Oreal this refers to the L’Oreal Luxe division. 2 Please see the European Investment Strategy “Buying European Clothes: An Investment Megatrend”, dated December 6, 2018 available at eis.bcaresearch.com. 3 Deloitte: Global Powers of Luxury Goods 2018, Shaping the future of the luxury industry 4 According to the government, 10,500 “red scarves” marched in Paris on January 27, 2018. 5 For the full report, please see the Geopolitical Strategy Special Report “France: La March A Suivre?”, dated February 27, 2019, available at gps.bcaresearch.com.
ECB President Mario Draghi has already noted that the growth risks in the euro zone are now tilted to the downside. We expect the ECB to follow a dovish script at the March ECB meeting, along these lines: Downgrade the ECB’s growth forecasts. Delay…