Europe
The ECB has categorized the current downturn, which has pushed real GDP growth in the Eurozone to a below-trend pace of 1.7% and triggered a technical recession in Italy, as simply the product of a bunch of idiosyncratic country-specific shocks. The…

Highlights European Growth: Europe’s economy is slowing, while core inflation remains subdued. The ECB must now contemplate the need for a monetary policy ease so soon after ending its bond buying program. Likely ECB Options: The ECB will likely have no choice but to initiate a new round of LTROs – likely to be announced in either April or May – to prevent an unwanted tightening of credit conditions at a time of slowing economic growth. Fixed Income Implications: Stay below-benchmark on euro area duration, with inflation expectations likely to rebound alongside a more dovish ECB and rising global oil prices. Stay underweight Italian government bonds and neutral overall euro area corporate credit exposure, however, until there are more decisive signs that growth is stabilizing. Feature Back in December, the European Central Bank (ECB) - confident that the euro zone economy was healthy enough to allow the slow process of policy normalization to begin - ended its Asset Purchase Program and signaled that rate hikes could commence as soon as late 2019. Just two months later, the central bank is faced with an unexpectedly persistent and broad-based growth slump. Markets now expect no change in short-term interest rates until well into 2020. By most conventional measures, the ECB is running a very accommodative monetary stance, with a €4.7 trillion balance sheet and negative interest rates (both in nominal and inflation-adjusted terms). On a rate-of-change basis, however, policy has become incrementally less stimulative, with the balance sheet no longer expanding and real interest rates unchanged from levels of a year ago (Chart 1). An additional potential tightening of liquidity conditions is on the horizon with the ECB’s long-term funding operations for euro zone banks (LTROs and TLTROs) set to begin rolling off next year. Chart 1The ECB Needs To Ease Policy Somehow
The ECB Needs To Ease Policy Somehow
The ECB Needs To Ease Policy Somehow
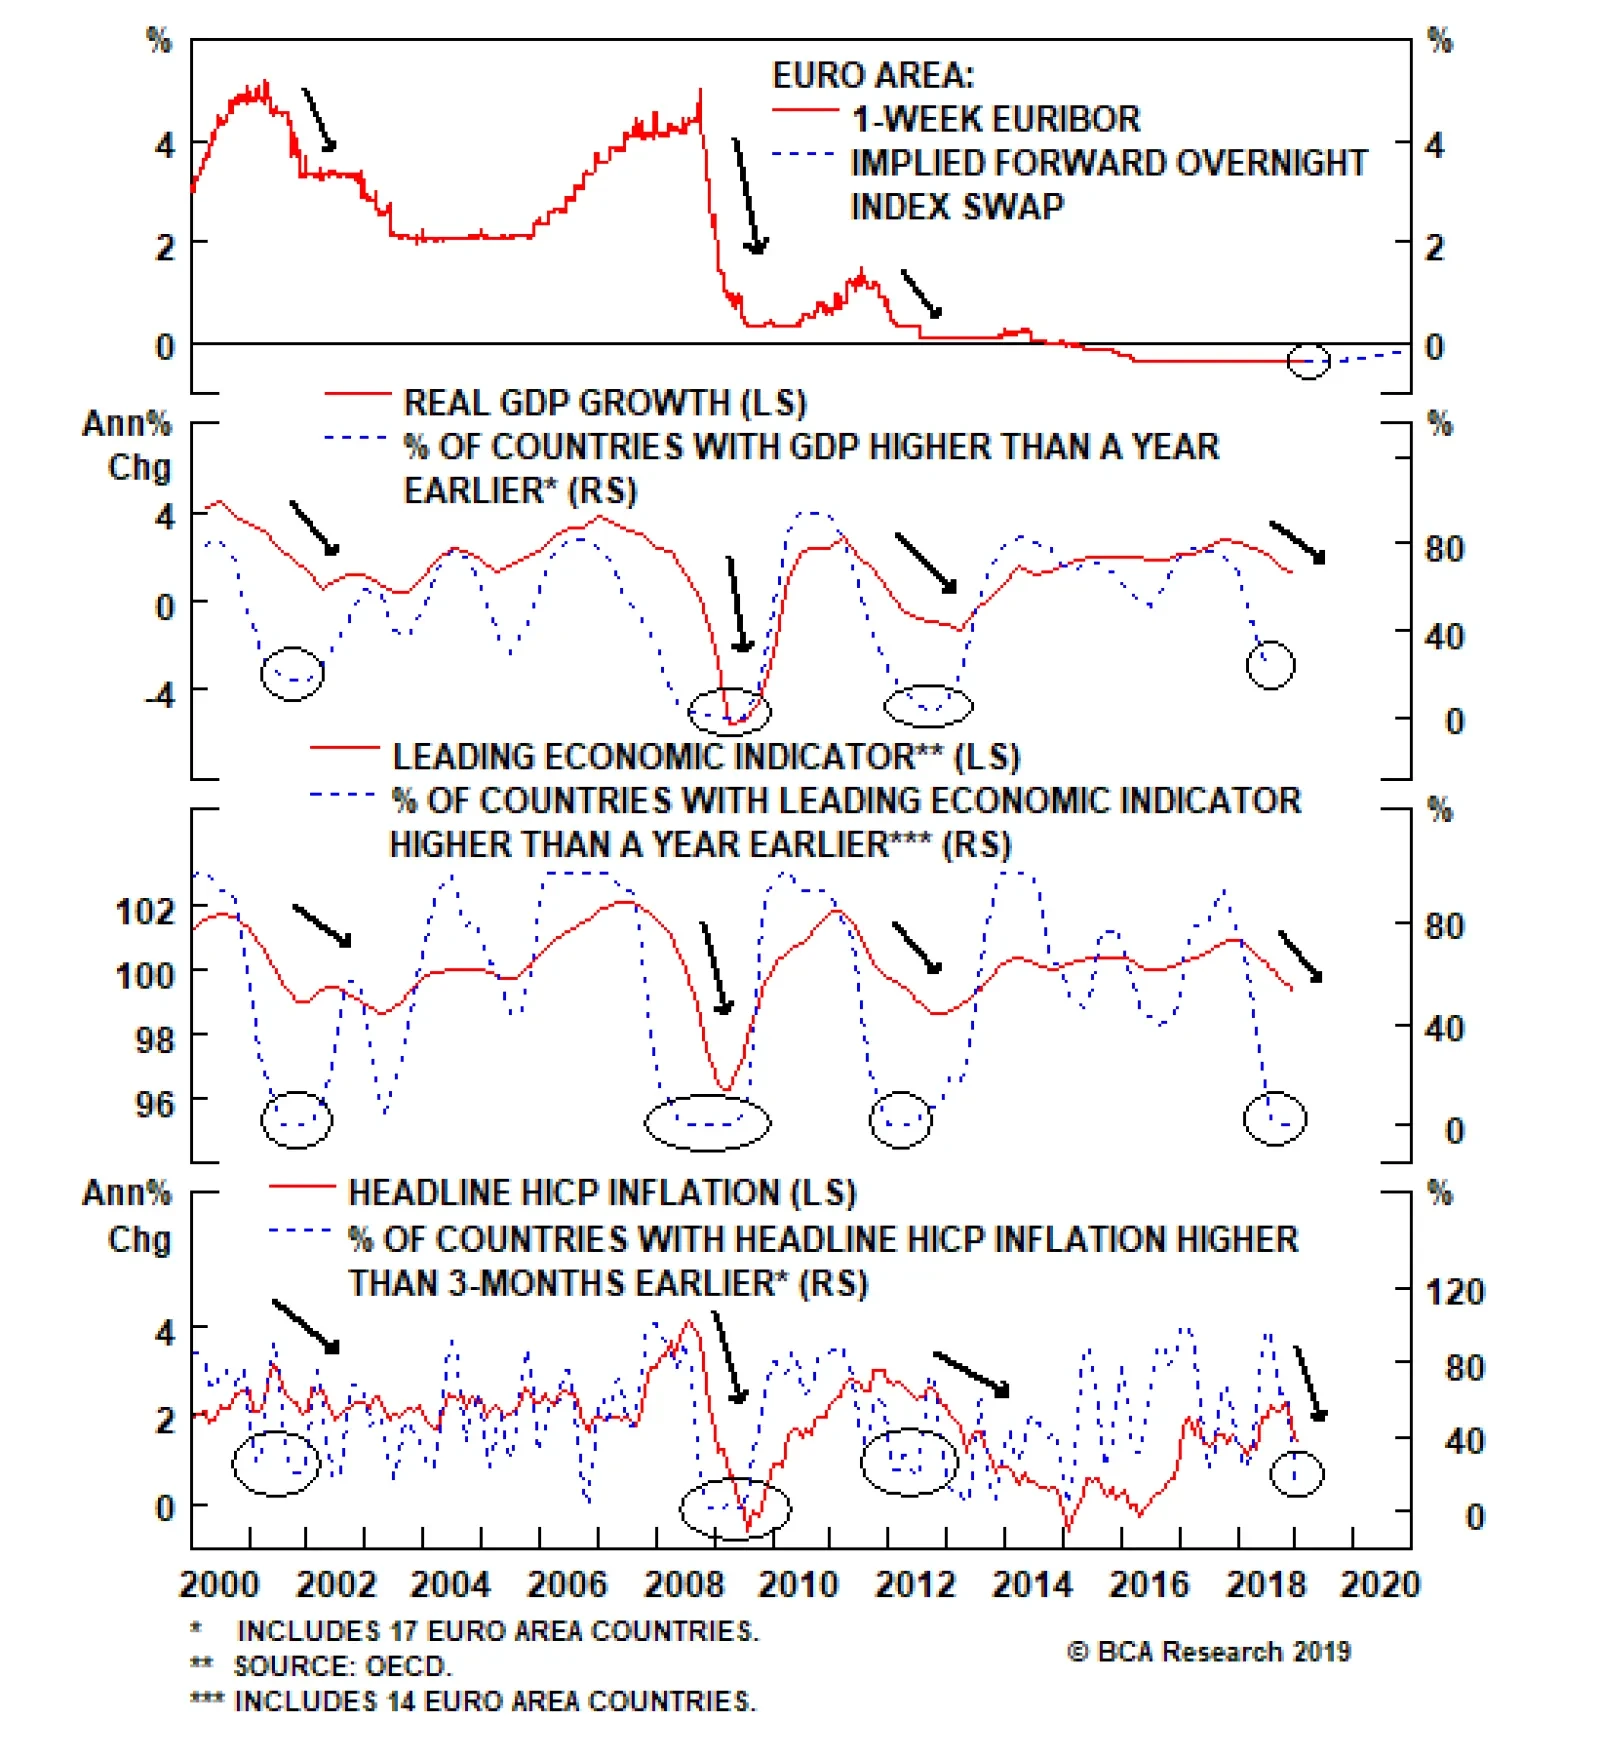
Our ECB Monitor indicates that fresh monetary easing will soon be required if the current downtrend in growth persists. Given the persistent fragilities within the European banking system, not only in Italy but increasingly in core countries like Germany, a combination of slowing economic momentum and tightening monetary liquidity is a potentially toxic brew. Weaker growth raises the specter of a rise in non-performing loans held by banks that also have significant sovereign debt exposures (the so-called “Doom Loop”). In this Special Report, we consider the policy options that the ECB could realistically deliver in the coming months - given the state of the economy, inflation and banking system – with the associated investment implications for European fixed income markets. Our conclusion: the ECB will be forced to take a dovish turn as an insurance policy against tighter credit conditions and weak growth. Eurozone Economy: Broad-Based Mediocrity The ECB has categorized the current downturn, which has pushed real GDP growth in the Eurozone to a below-trend pace of 1.7% and triggered a technical recession in Italy, as simply the product of a bunch of idiosyncratic country-specific shocks (a cut in Germany auto production due to changing emissions standards, Italy-EU fiscal policy debates that raised the cost of capital in Italy, and political unrest in France damaging consumer spending). The biggest shock, however, has been exogenous. Trade policy uncertainty and a weakening Chinese economy have both been a major drag on growth for euro zone countries that rely heavily on exports, in general, and Chinese import demand, in particular. The “one-off shocks” narrative is incorrect because the slowdown has been broad-based. The majority of countries within the euro zone are suffering slowing GDP growth, falling leading economic indicators and decelerating headline inflation, according to our diffusion indices for each (Chart 2). The previous three times such a synchronized slowdown unfolded (2001, 2009 and 2012), the ECB responded with a full-blown rate cutting cycle. Inflation trends today, however, make it a bit more difficult for the ECB to consider any such possible shift in a more dovish direction. Chart 2ECB Typically Eases After A Broad-Based Economic Downturn
ECB Typically Eases After A Broad-Based Economic Downturn
ECB Typically Eases After A Broad-Based Economic Downturn
The overall unemployment rate for the region is 7.8%, well below the OECD’s estimate of the full employment NAIRU1 rate. In contrast to our diffusion indicators for the economy, the majority of euro area countries (83%) have unemployment rates lower than NAIRU (Chart 3). The previous two times labor markets were so tight in the euro area, wage inflation reached 4%, core inflation climbed beyond 2.5% and the ECB pushed policy interest rates to between 4-5%. Today, a large majority of countries are witnessing faster wage growth and core inflation, but the overall level of both is still relatively low (2.5% and 1%, respectively). Chart 3ECB Policy Is Already Very Easy
ECB Policy Is Already Very Easy
ECB Policy Is Already Very Easy
So from the point of view of the state of overall growth and inflation, the ECB is in a difficult position. Euro area growth has slowed, but not by enough to ease the nascent inflation pressures in labor markets. The story gets more complex when looking at growth and inflation at the individual country level. For the four largest economies in the region – Germany, France, Italy and Spain – the latter two remain a source of concern. Unemployment in both Spain and Italy remains in double-digits, with headline and core inflation rates at 1% or lower (Chart 4). Italy’s manufacturing PMI is now at 47.6 and Spain’s is now at 49.9, both below the 50 level indicating an expanding economy. Chart 4Italy & Spain Are Becoming An Issue (Again)
Italy & Spain Are Becoming An Issue (Again)
Italy & Spain Are Becoming An Issue (Again)
Credit growth exhibits a similar pattern. Total bank lending is contracting on a year-over-year basis in Italy (-4.3%) and Spain (-2.1%), while still growing at a positive, albeit decelerating, rate in Germany (+1.5%) and France (+5.3%). The most recent ECB Bank Lending Survey for the fourth quarter of 2018 showed that lending standards were becoming more stringent in Italy and Spain than in Germany or France (Chart 5). In Italy, where the growth downturn has been deeper and borrowing costs have gone up due to the Italian populist government’s repudiation of EU deficit limits, banks are actually tightening lending standards. Chart 5Credit Conditions Tightening At The Margin
Credit Conditions Tightening At The Margin
Credit Conditions Tightening At The Margin
The last thing the ECB wants to see now is a sustained credit contraction in the large economies where growth and banking systems are the most fragile – most notably, Italy. Bottom Line: Europe’s economy is slowing, while core inflation remains subdued. Weakness is more pronounced in the Peripheral countries compared to the Core, especially Italy. The ECB must now contemplate the need for a monetary policy ease so soon after ending its bond buying program. Italy’s Banks Are Still A Huge Headache For The ECB European banks have struggled to generate acceptable profits in recent years against a backdrop of sluggish economic growth, negative interest rates and increased regulatory capital requirements. Bank equity values remain near post-2008 crisis lows, with Italian bank stocks severely underperforming their competitors within the euro zone (Chart 6). Credit spreads for Italian banks are also far more elevated than those of their euro area peers, a reflection of the higher yields and wider spreads on Italian government bonds (which, given Italy’s BBB sovereign credit rating, means that the floor on Italian yields and credit spreads is higher than those of other euro zone countries with better credit ratings). Chart 6Italy's Fiscal Problems Impacting The Banks
Italy's Fiscal Problems Impacting The Banks
Italy's Fiscal Problems Impacting The Banks
Even given the economic fragility in Italy, Italian banks remain reasonably well-capitalized. According to the data from the European Banking Authority (EBA), Italian banks have a Common Equity Tier 1 (CET1) capital ratio of 13.8%, well above the minimum levels required by Basel III bank regulations and close to the overall euro area CET1 ratio of 14.7% (Chart 7).
Chart 7
The problem for Italian banks, however, remains the high level of non-performing loans (NPLs). EBA data shows that Italian banks have an NPL ratio of 9.4%, nearly three times the total euro area NPL ratio of 3.4%. While this is a substantial improvement from the near-20% NPL ratio seen after the 2011 European debt crisis, the absolute level of NPLs remains high. The other major risk for Italian banks is their large holdings of Italian sovereign bonds, which raises the risk of mark-to-market losses hitting the banks’ capital position as government bond yields rise (i.e. the “Doom Loop”). The ECB’s bond purchases have helped to reduce the share of Italian sovereign debt held by Italy’s banks from 25% to around 19% over the past five years (Chart 8). Yet with Italy’s sovereign credit rating now BBB – on the cusp of junk – Italian bank balance sheets remain heavily exposed to sovereign debt risk.
Chart 8
The ECB has tried to mitigate the impact of its extraordinary monetary stimulus on the profitability of Europe’s banks by offering longer-term loans (against acceptable collateral) at low interest rates. These programs, known as Long-Term Refinancing Operations (LTROs), have mostly been used by banks in Italy and Spain, which have taken up a combined 56% of all outstanding LTROs (Chart 9). Chart 956% Of ECB LTROs Have Gone To Italy & Spain
56% Of ECB LTROs Have Gone To Italy & Spain
56% Of ECB LTROs Have Gone To Italy & Spain
The most recent LTRO operation launched in 2016 was a Targeted LTRO (TLTRO) that tied the extension of ECB funding directly to the amount of new loans made by any bank that received the funding. Those TLTROs were offered at the ECB’s Marginal Deposit Rate of -0.4%, effectively providing a 40bps subsidy for new bank lending. The impact on loan growth from the TLTROs was far greater in Italy and Spain, where the share of total bank lending funded by LTROs in each country is now 10% compared to 4% for all euro area bank loans (Chart 10). Chart 10LTROs Funding 10% Of Bank Lending In Italy & Spain
LTROs Funding 10% Of Bank Lending In Italy & Spain
LTROs Funding 10% Of Bank Lending In Italy & Spain
The TLTROs extended in 2016 had a maturity of four years, which means that the loans will begin to mature next year.2 If the ECB lets these operations expire without any offering of a new program, then banks that have used that cheap liquidity will be faced with one of two choices: replace that funding with bank debt at much higher market interest rates, or reduce the size of their loan books (i.e. delever their balance sheets). For Italy’s banks, replacing all of that cheap TLTRO funding with expensive bank debt is highly unlikely. According to the Bank of Italy’s latest Financial Stability Report, bank debt represents as large a share of overall Italy bank funding as the TLTROs (around 10%), but the growth rate of that debt has been contracting at a -15% to -20% rate over the past couple of years (Table 1).3 This is how rising Italian sovereign bond yields translate into higher bank debt yields and market funding costs, restricting lending activity. Table 1Italian Banks Have Slashed Expensive Debt Market Funding
The ECB's Next Move: Taking Out Some Insurance
The ECB's Next Move: Taking Out Some Insurance
Already, Italian banks have been cutting back on lending to the most risky borrowers, according to Bank of Italy data (Chart 11). The growth rates of loans deemed “risky” and “vulnerable” contracted at a faster pace in 2018 than during 2015-17, while loans extended to “solvent” and “safe” borrowers grew more quickly in 2018 than the prior three years. These trends are likely to continue with credit standards now being tightened by Italian banks according to the ECB Bank Lending Survey.
Chart 11
An additional factor for the banks to consider is the upcoming implementation of the Basel III regulatory requirement that banks must maintain a minimum amount of funding with a maturity greater than one year (the Net Stable Funding Ratio, or NSFR). Even though the current round of TLTROs do not begin to expire until June 2020, they will turn into “short-term” funding as of June of this year when it comes to banks calculating their NSFR. That ratio is not yet binding, but banks will likely seek to plan ahead for their long-term funding and will seek guidance from the ECB. So the ECB is now faced with the prospect of letting the TLTROs begin to expire next year, placing 4% of total euro area bank lending and 10% of Italian and Spanish bank lending at risk. Given the current fragile state of growth in the euro area, especially in Italy, the central bank would be taking a huge gamble by risking an even deeper downturn through banks shrinking their loan books. The easiest way to prevent that outcome – more LTROs. Bottom Line: The ECB will likely have no choice but to initiate a new round of LTROs – likely to be announced in April or May - to prevent an unwanted tightening of credit conditions amid slowing economic growth. The ECB’s Likely Next Move? New LTROs With More Dovish Forward Guidance The ECB Governing Council meets this week. There will be a new set of economic projections prepared for this meeting, and the ECB has typically chosen to make changes to its monetary policies alongside shifts in its economic forecasts. ECB President Mario Draghi has already noted that the growth risks in the euro zone are now tilted to the downside. Even noted monetary hawks like German Bundesbank President Jans Weidmann and Dutch Central Bank President Klaas Knot – both candidates to replace Draghi when his term expires in October – have toned down their calls for monetary tightening given the weak growth in their own economies. We expect the ECB to follow a dovish script at the March ECB meeting, along these lines: Downgrade the ECB’s growth forecasts Delay the date when inflation is projected to return back to 2% target Extend forward guidance on the first rate hike out to “mid-2020 or later” (which only validates current market pricing) A pessimistic assessment of the outlook for bank lending based on elevated bank funding costs impairing the transmission of ECB’s “highly accommodative” monetary policy A discussion about the need for a new LTRO program to replace the ones that start expiring in 2020 Step 4 in that script could be delayed until the April or May ECB meetings, to allow for more time to see how the economic data unfolds. Almost all of the current downturn in real GDP growth can be attributed to the plunge in net exports – the contribution to growth from domestic demand has been stable over the past year (Chart 12). Thus, the ECB will likely want to see if the current indications of a U.S.-China trade deal, combined with more stimulus from China’s policymakers, puts a floor under the downturn in euro area trade activity. Chart 12ECB Growth Forecasts Require A Rebound In Exports
ECB Growth Forecasts Require A Rebound In Exports
ECB Growth Forecasts Require A Rebound In Exports
Step 5 in our March ECB meeting script can also be delayed to April or May, but the ECB is not likely to wait longer than that and run the risk of letting the current slowing of euro area credit growth turn into a full-blown contraction due to the end of cheap funding (Chart 13). Chart 13Tightening Lending Standards: Trigger For A New LTRO?
Tightening Lending Standards: Trigger For A New LTRO?
Tightening Lending Standards: Trigger For A New LTRO?
There has also been some speculation that the ECB could satisfy both the hawks and doves on the Governing Council by announcing a hike in the ECB Overnight Deposit rate at the same time as a new LTRO program. The Overnight Deposit rate represents the floor of the ECB’s policy interest rate corridor, with the Marginal Lending rate representing the ceiling and the Main Refinancing rate acting as the midpoint of the corridor. Yet with the ECB maintaining such a large balance sheet, with €1.2 trillion in excess reserves, the effective short-term interest rate (1-week EONIA) has traded near the Overnight Deposit Rate floor. Thus, lifting only the Overnight Deposit Rate, which is -0.4% and has been blamed for damaging the earnings of euro area banks, would effectively be the same as a traditional hike in the ECB’s main interest rate tool, the Main Refinancing Rate (Chart 14). Chart 14The ECB Cannot
The ECB Cannot "Just" Hike The Deposit Rate
The ECB Cannot "Just" Hike The Deposit Rate
Bottom Line: Offering a new LTRO, but perhaps for only a shorter time period than the expiring TLTROs (i.e. two years instead of four), seems to be the best solution for the ECB. This will prevent a potential liquidity-driven bank credit crunch in the most vulnerable parts of the European economy – Italy and Spain. Fixed Income Investment Implications Of Our ECB View 1. Duration: the benchmark 10-year German Bund yield had fallen as low as 0.09% in the most recent global bond rally, largely driven by a collapse in inflation expectations. The ECB’s likely dovish guidance on rate hikes will prevent any meaningful rise in real Bund yields. Inflation expectations, however, do have a lot more upside if BCA’s bullish oil forecast is realized – especially so if the ECB also takes a more dovish turn (Chart 15). Stay below-benchmark on euro zone duration, and stay long inflation-linked instruments like CPI swaps. Chart 15Stay Below-Benchmark On European Duration Exposure
Stay Below-Benchmark On European Duration Exposure
Stay Below-Benchmark On European Duration Exposure
2. Italian Sovereign Debt: A new LTRO program, combined with more dovish forward guidance, should help prevent the current Italian growth downturn from intensifying. However, a weak economy will sustain pressure on Italian sovereign spreads. Stay underweight for now, but look to upgrade when growth stabilizes (Chart 16). Chart 16Stay Cautious On Euro Area Spread Product Until Growth Bottoms
Stay Cautious On Euro Area Spread Product Until Growth Bottoms
Stay Cautious On Euro Area Spread Product Until Growth Bottoms
3. Euro Area Corporates: A more dovish ECB will help stabilize corporate credit spreads in the euro area, but like Italian sovereign debt, signs of more stable growth are required before spreads can meaningfully compress. Stay neutral for now. Robert Robis, CFA, Chief Fixed Income Strategist rrobis@bcaresearch.com Footnotes 1 Non-accelerating inflation rate of unemployment. 2 The loans were offered in four allotments in June 2016, September 2016, December 2016 and March 2017. Hence, the loans will mature in June 2020, September 2020, December 2020 and March 2021. 3 The November 2018 Bank of Italy Financial Stability Report can be found here: https://www.bancaditalia.it/pubblicazioni/rapporto-stabilita/2018-2/index.html Recommendations The GFIS Recommended Portfolio Vs. The Custom Benchmark Index
The ECB's Next Move: Taking Out Some Insurance
The ECB's Next Move: Taking Out Some Insurance
Duration Regional Allocation Spread Product Tactical Trades Yields & Returns Global Bond Yields Historical Returns
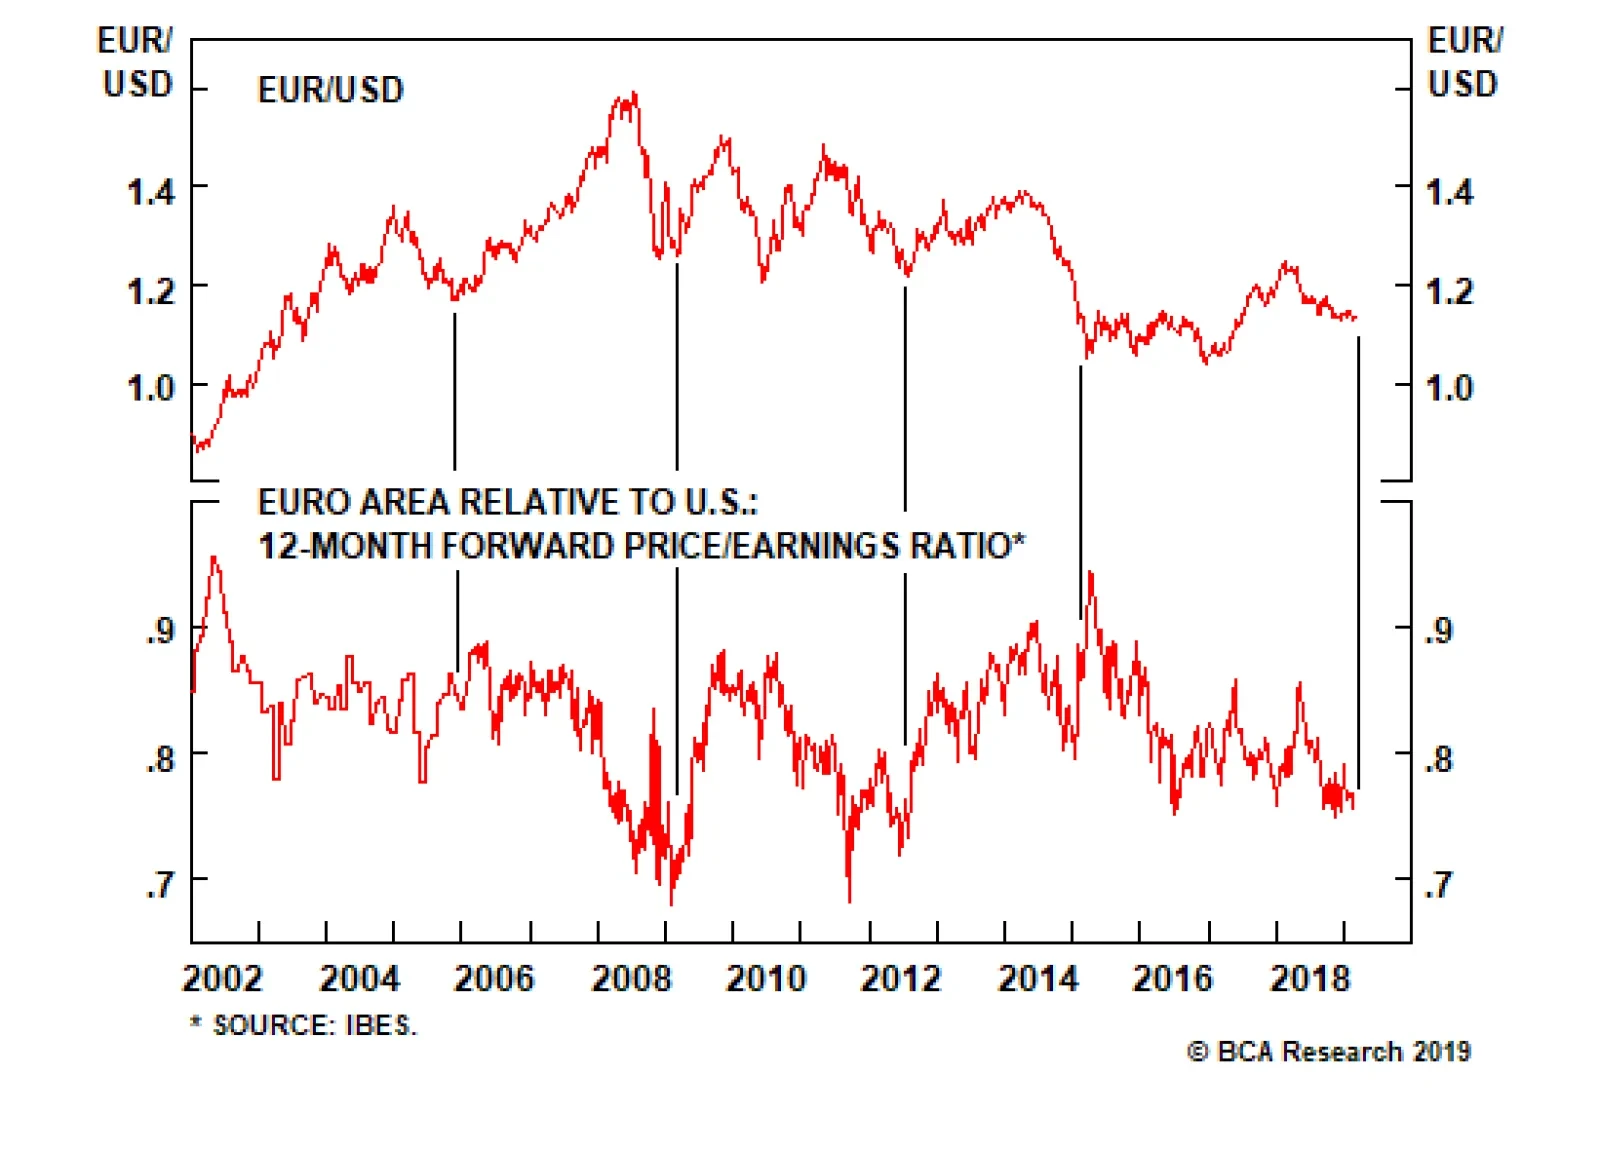
First, on a 12-month forward P/E ratio basis, euro area equities are trading at the kind of deep discount to U.S. stocks normally symptomatic of a trough in relative sentiment toward Europe. Such a discount is often followed by a rally in EUR/USD. Second,…
It is safe to say that the euro area is in a funk today: European real GDP growth dipped to a 1.1% annual rate in the fourth quarter of 2018, while industrial production has plunged by 3.9% on a year-on-year basis. But the markets warned us this would happen:…
A catastrophic no-deal Brexit would undoubtedly hurt the EU27, and be particularly painful for the member states most exposed to U.K. trade, notably Ireland and the Netherlands. But here’s the paradox: a no-deal Brexit which did not cause pain pour encourager…
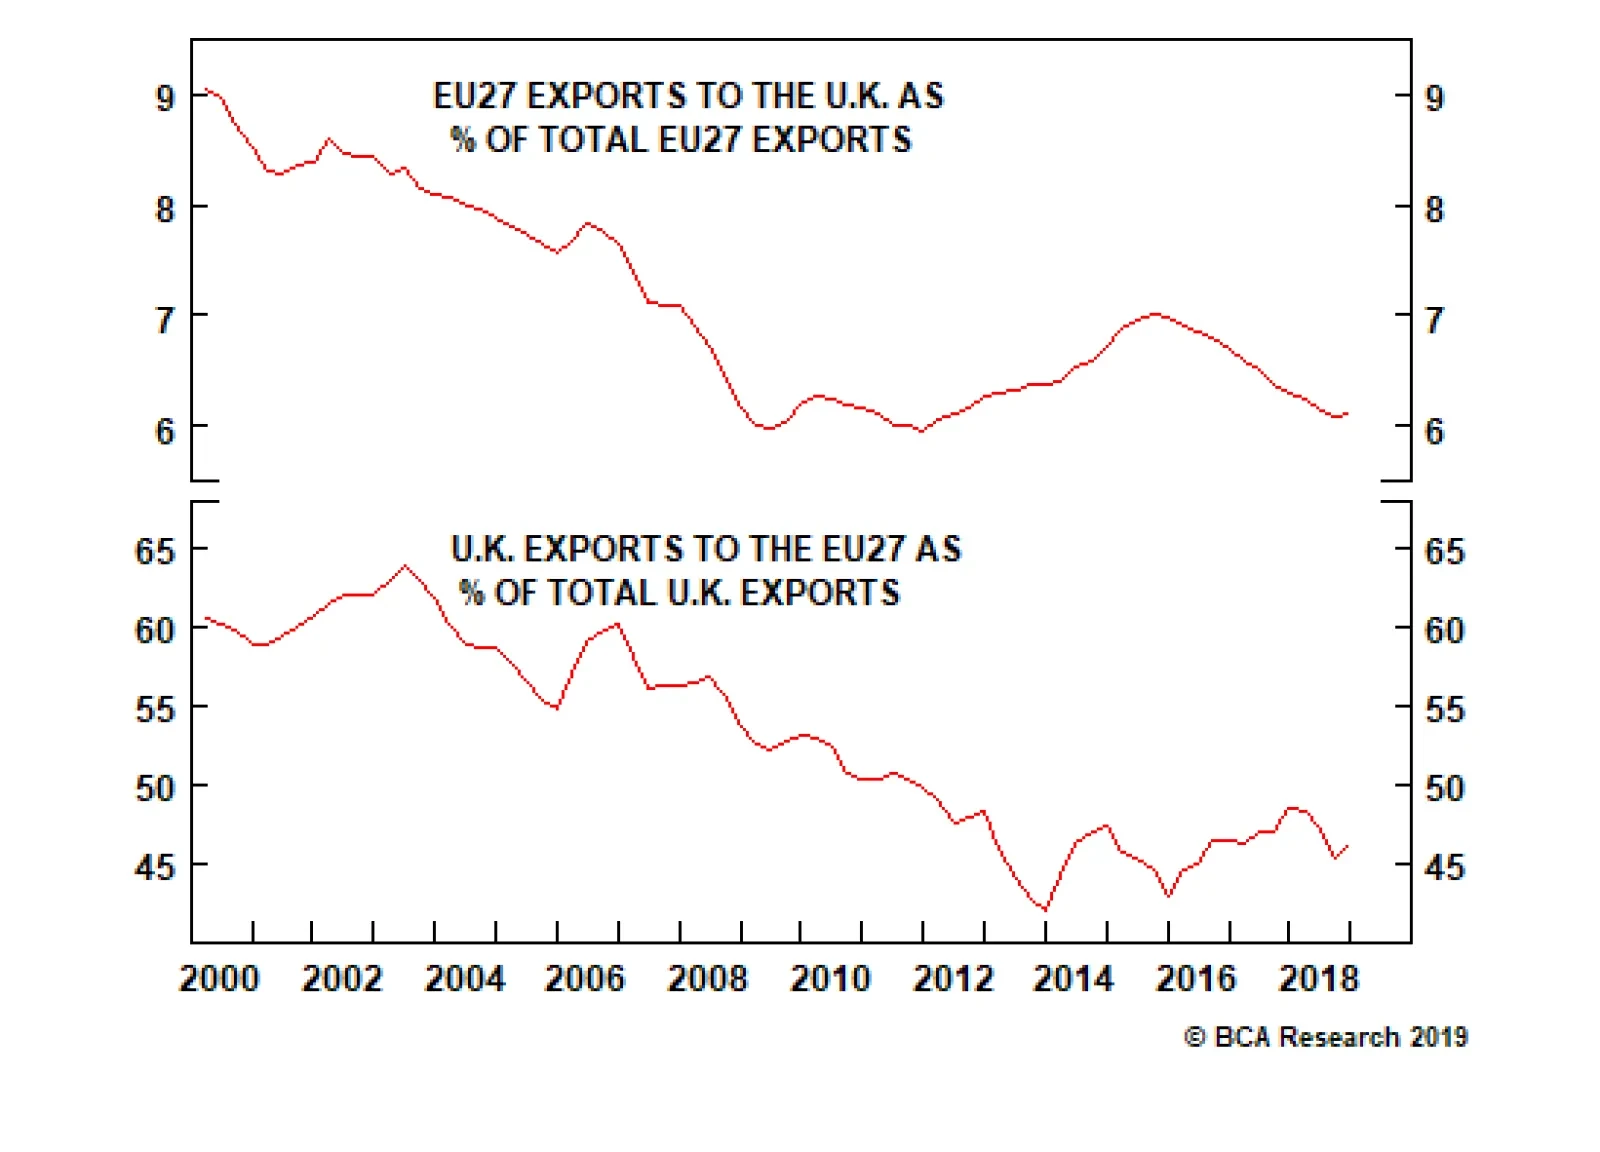
The two-year time limit in Article 50 was designed to disadvantage the exiting country relative to the EU, and this disadvantage has now become abundantly clear. After the two years have run down, a no-deal or ‘cliff edge’ exit would be bad for the EU27, but…
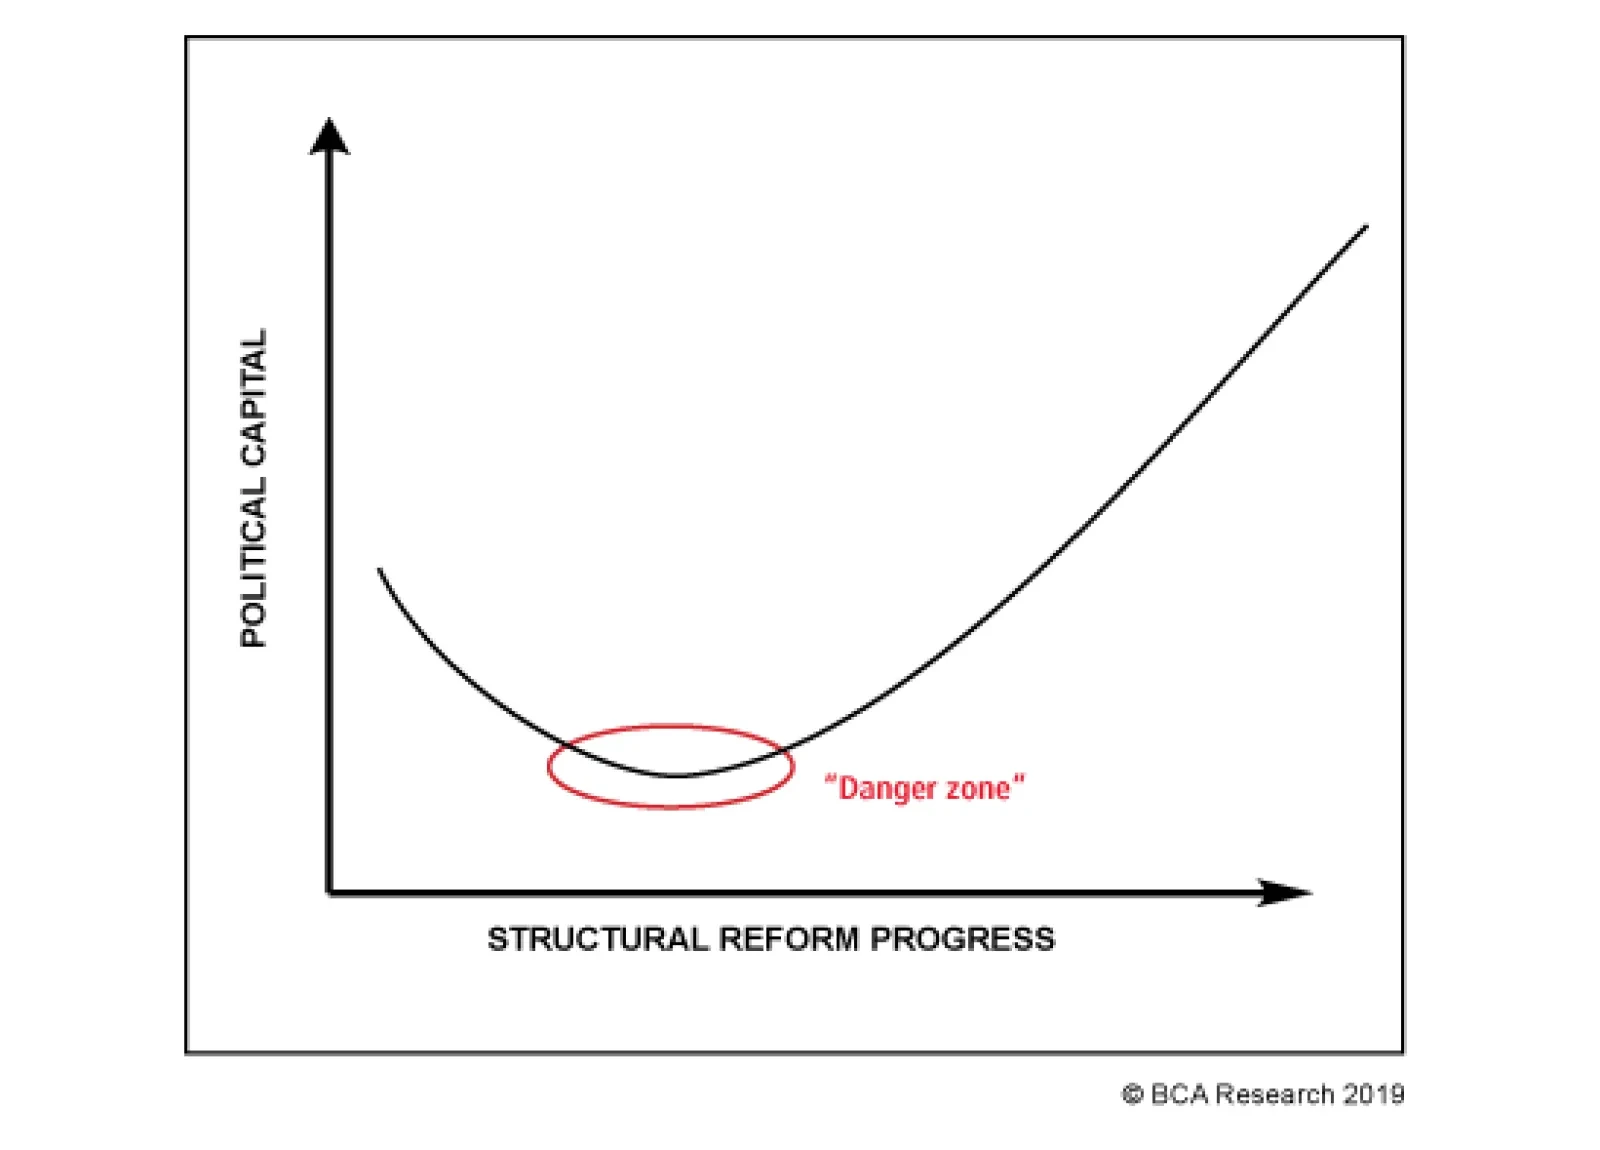
Cutting the size of the state might be what Macron needs to get out of that zone over the course of his term. Unlike the last two presidents, Macron’s term has begun with a whirlwind. If he stops now, it is highly unlikely that his support level will…
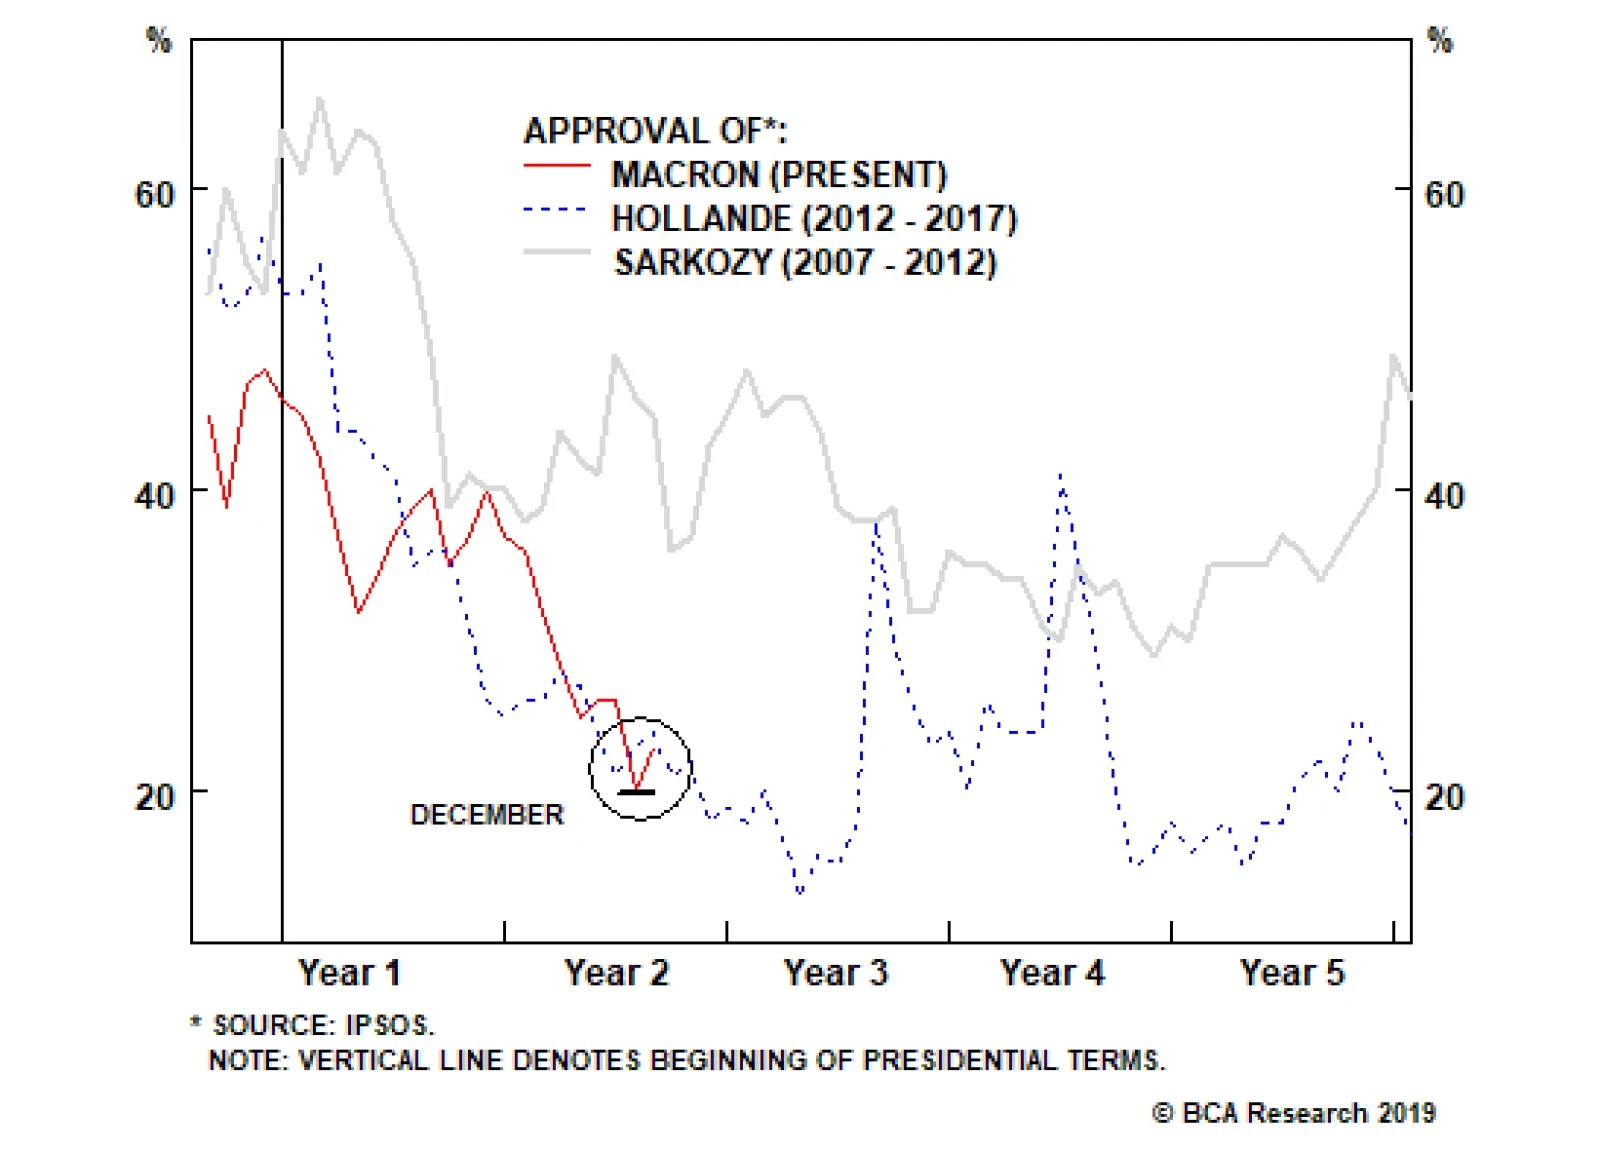
The yellow vest movement is not a coherent force led by a clear leadership. The demands of the group are many: lower taxes, better services, less of the current reforms (specifically in education), and more of other reforms. Despite this lack of clarity, the…
Highlights Investors are currently too pessimistic on Europe’s growth prospects. In fact, European growth will soon bottom. European growth and inflation are also set to improve relative to the U.S. This should give investors an opportunity to reassess the long-term outlook for European Central Bank policy relative to the Fed. Global growth dynamics are also moving in an increasingly dollar-bearish direction, which should create a tailwind for the euro. Based on the pricing of European assets relative to the U.S., there is scope to see more capital flows into the euro area, implying that more euro buying is forthcoming. The entire European currency complex is a buy relative to the dollar; while the NOK, the SEK, and even the GBP could outperform the euro, the CHF will underperform. EUR/JPY also has upside. Feature The case to sell the euro is easy to make. European growth has been very poor: PMIs, industrial production and even German exports are all pointing to a contraction in output; and economic surprises are testing levels recorded during the euro area crisis. Most importantly, this economic retrenchment is particularly sharp when compared to the U.S., which suggests that real interest rate differentials should continue to hurt EUR/USD (Chart 1). Chart 1Selling The Euro Seems So Easy...
Selling The Euro Seems So Easy...
Selling The Euro Seems So Easy...
The problem with this narrative is that investors are already well aware of Europe’s woes. Could Europe instead recover and the euro rebound against the dollar? After all, in the past, when investor pessimism towards Europe experienced as pronounced a dip as the one just witnessed, EUR/USD invariably rebounded soon after (Chart 2). Chart 2...But Maybe We Should Look The Other Way
...But Maybe We Should Look The Other Way
...But Maybe We Should Look The Other Way
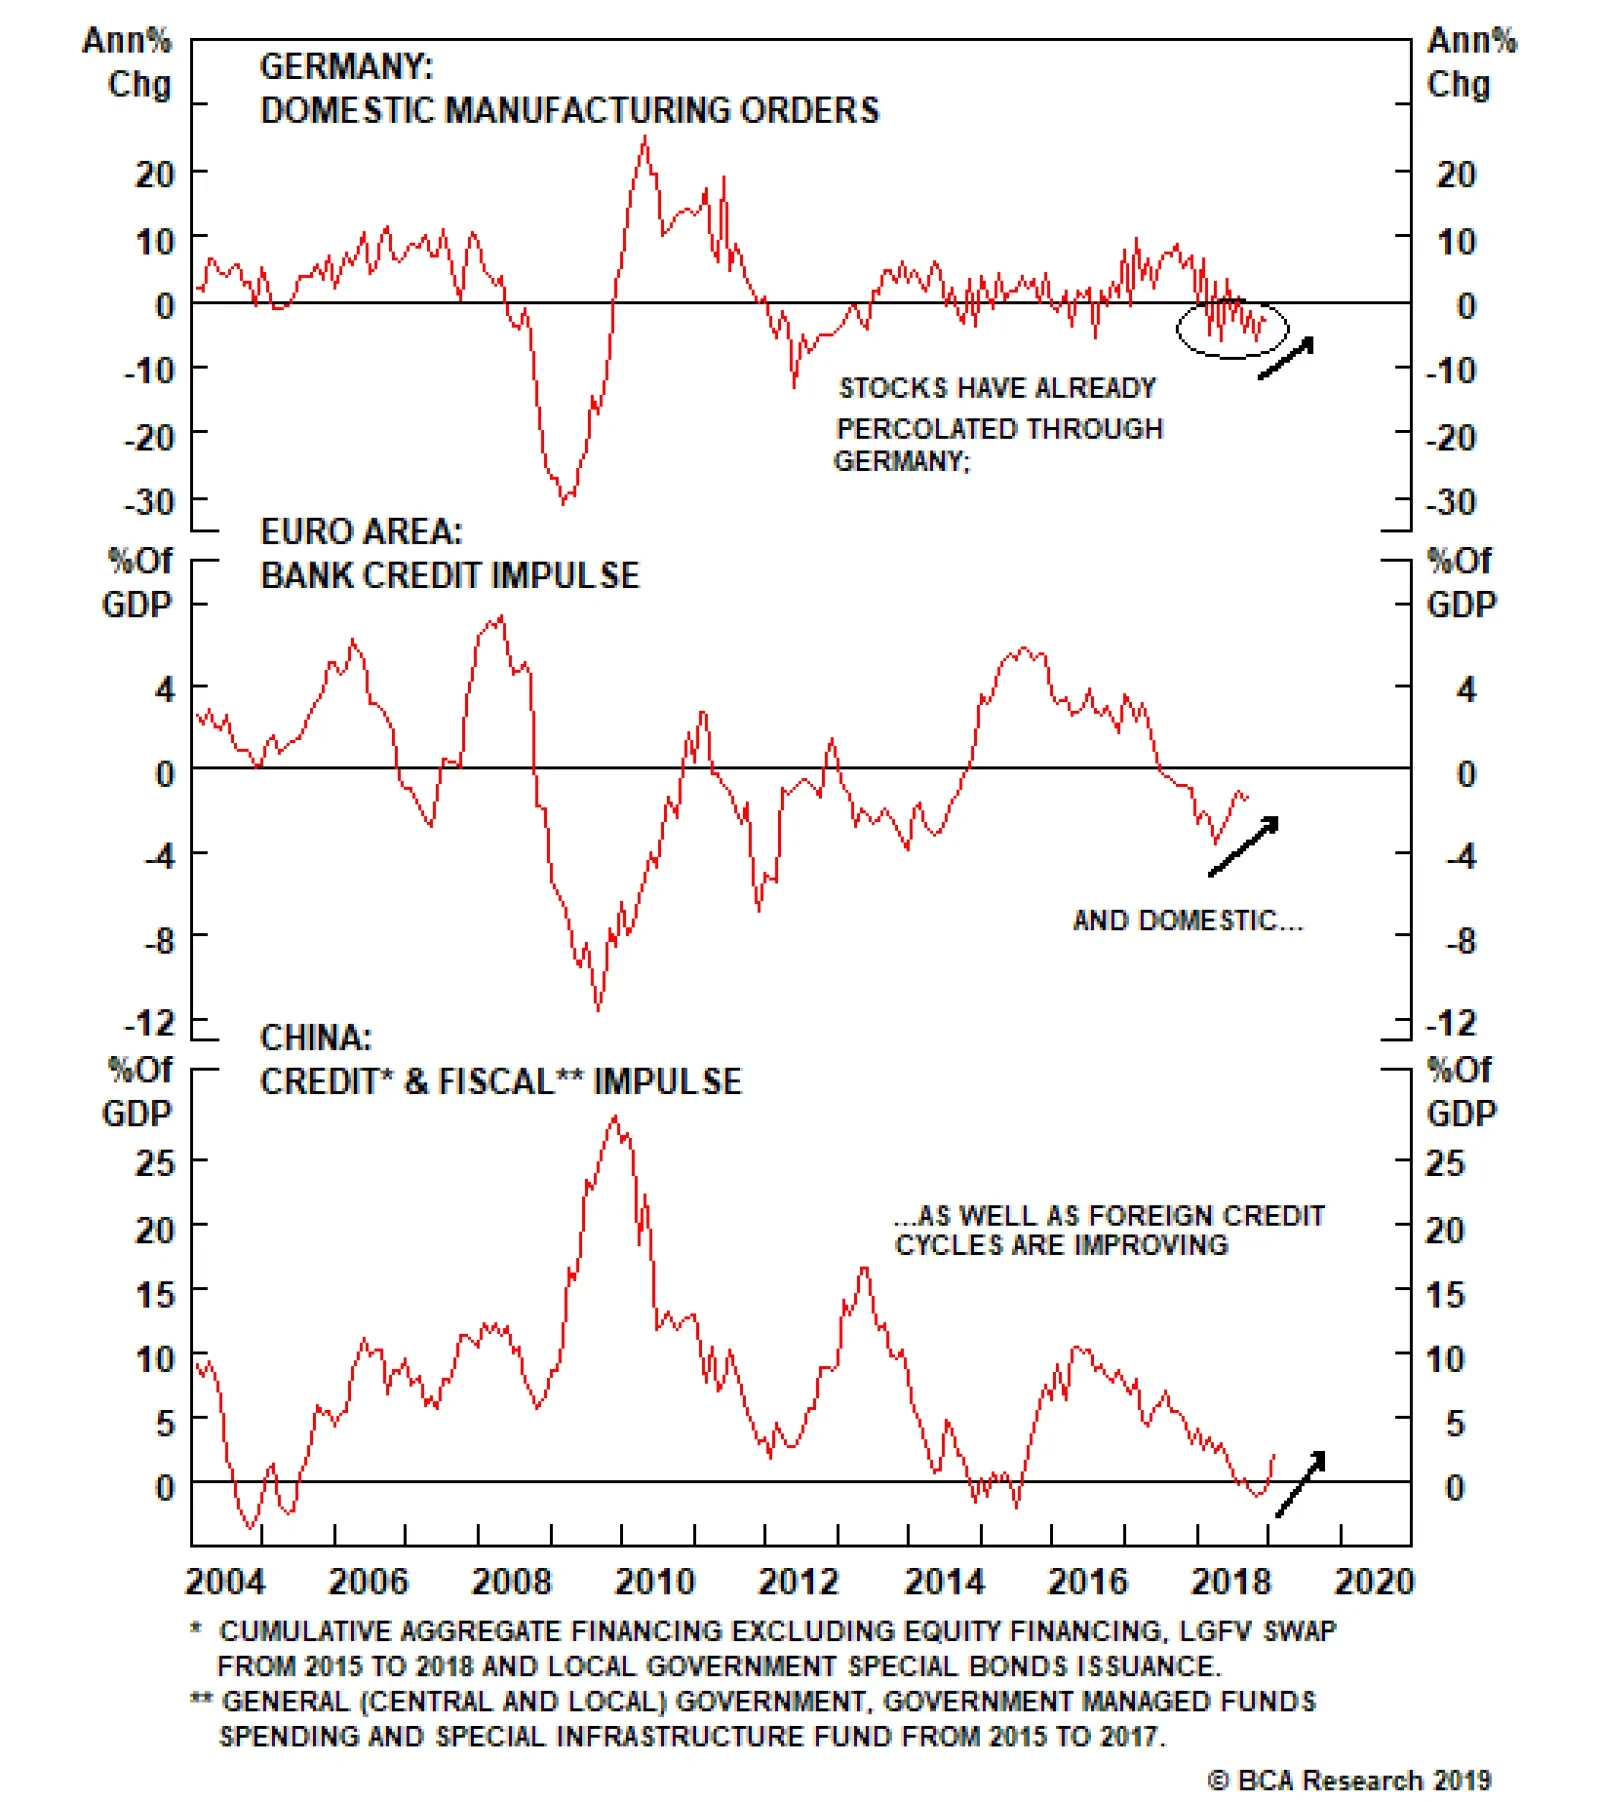
In this piece, we explore what could go right for the euro, and argue that the euro is indeed attractive at current levels. European Growth Has Hit A Nadir It is safe to say that the euro area is in a funk today: European real GDP growth dipped to a 1.1% annual rate in the fourth quarter of 2018, while industrial production has plunged by 3.9% on a year-on-year basis. But the markets warned us this would happen: The euro has fallen 9% from its February 2018 top, German bund yields are again flirting with the 0.1% level and European banks plunged by more than 40% between January and December last year. Going forward, for European yields to remain as depressed as they are, for the euro to fall again by a similar margin, or for domestic plays to suffer large declines, European growth will have to slow even further. We are not expecting such a scenario. Instead, we expect European growth to recover significantly this year. First, when it comes to Germany, the locomotive of Europe, the shock from the implementation of the new WLTP auto emission standards is passing: Automobile production is stabilizing, capex is accelerating and inventories have been pared down. Moreover, the slowdown in foreign demand has already percolated through the domestic economy, as domestic manufacturing orders are already experiencing one of their sharpest declines since the Great Financial Crisis (Chart 3, top panel). Chart 3European Growth Is Set To Rebound
European Growth Is Set To Rebound
European Growth Is Set To Rebound
Another source of optimism comes from the credit market. As the middle panel of Chart 3 illustrates, the European 12-month credit impulse has begun to bottom. This points to stronger euro area-wide domestic demand. Moreover, the Chinese credit and fiscal impulse is also bottoming, suggesting the drag from foreign demand could be dissipating (Chart 3, bottom panel). When looking at other specific trouble spots, Italy first springs to mind. In our view, the most recent deceleration in Italy was mainly a consequence of the tightening in financial conditions that resulted from the surge in Italian yields following the budget standoff between Rome and Brussels. However, the Lega Nord / Five Star Movement coalition has folded and is more or less acquiescing to the EU’s demands. Moreover, the rising probability that the European Central Bank will continue to provide long-term liquidity to the eurozone banking system via some form of new LTRO should diminish the funding risk to the Italian banking system, and thus, the risks to Rome’s fiscal sustainability. This implies that the decline in Italian borrowing costs could deepen (Chart 4), further easing Italian financial conditions and improving the growth outlook in the euro area’s third-largest economy. Chart 4Easing Financial Conditions In Italy
Easing Financial Conditions In Italy
Easing Financial Conditions In Italy
France, too, has had its fair share of problems, though it is interesting that its industrial sector is not suffering as much as Germany’s, as highlighted by a French manufacturing PMI above the 50 boom/bust line. Instead, the French service sector is the one contracting (Chart 5). This bifurcation is likely to be a byproduct of the gilets jaunes protests that have lasted since November 2018 and affected retail trade. However, the intensity of the protests is declining and the French population is getting used to this. As a result, we are seeing a rebound in French household confidence, which implies that consumption, the main engine of French growth, is likely to perk up. Chart 5Fade The Gilets Jaunes, Paris In Spring Is Beautiful
Fade The Gilets Jaunes, Paris In Spring Is Beautiful
Fade The Gilets Jaunes, Paris In Spring Is Beautiful
Finally, euro area fiscal policy is set to be loosened this year, with the fiscal thrust moving from 0.05% of GDP to 0.4% of GDP (Chart 6). The response of French President Emmanuel Macron to the gilets jaunes protests could even make the fiscal policy support slightly bigger this year. Chart 6Positive Fiscal Thrust In 2019
Positive Fiscal Thrust In 2019
Positive Fiscal Thrust In 2019
Ultimately, this combination of factors suggests that the large dip in European industrial production is likely to prove transitory, and that European activity will revert back toward the levels implied by the Belgian Business Confidence Index, which has historically been a good leading indicator of European growth (Chart 7). Chart 7European IP To Follow Brussels' Mood
European IP To Follow Brussels' Mood
European IP To Follow Brussels' Mood
Bottom Line: The deterioration in European growth has captured the imagination of investors. However, the performance of European assets last year forewarned that growth would decelerate meaningfully. What matters now is how growth will evolve. Developments from Germany, France, Italy, the credit channel and the fiscal front all suggest that European activity will perk up soon. It’s All Relative While getting a sense of European growth is important when making a call on EUR/USD, economic trends must also be considered relative to the U.S. Surprisingly, despite notorious European growth underperformance, rays of hope are emerging. A major structural negative for EUR/USD has abated: The European debt crisis is behind us, and the aggregate European banking sector has been getting healthier, albeit slowly. This means that the euro area credit growth is not declining anymore against that of the U.S. This is a very long-term force that dictates multi-year cycles in the EUR/USD. As Chart 8 shows, it will be difficult for EUR/USD to move below 1.10 so long as the broad trend in the relative credit growth does not weaken anew. Chart 8Credit Dynamics Suggest That The Worst Is Over For EUR/USD
Credit Dynamics Suggest That The Worst Is Over For EUR/USD
Credit Dynamics Suggest That The Worst Is Over For EUR/USD
More immediately, the euro area leading economic indicator relative to the U.S. is forming a bottom (Chart 9). Since the U.S. is not benefiting from as large a fiscal boost as in 2018, and financial as well as monetary conditions have tightened there relative to Europe, this suggests the improvement in the euro area relative LEI could continue this year. Chart 9Bottoming European LEI Versus U.S.
Bottoming European LEI Versus U.S.
Bottoming European LEI Versus U.S.
Relative labor market slack is also evolving in a euro-friendly fashion. From 2013 to 2018, the euro area suffered from greater labor market slack than the U.S., courtesy of a double-dip recession and generally more-moribund growth. However, thanks to a 4.2-percentage-point fall in the European unemployment rate since 2013 to 7.9%, the euro area unemployment gap has not only closed, it is also below that of the U.S. Historically, when the U.S. unemployment gap leapfrogs that of Europe, EUR/USD tends to appreciate (Chart 10). Chart 10Less Slack Leads To A Stronger EUR/USD
Less Slack Leads To A Stronger EUR/USD
Less Slack Leads To A Stronger EUR/USD
Relative slack does not only have value in itself, it also matters for relative inflation trends, which have been a crucial determinant of EUR/USD. As Chart 11 illustrates, EUR/USD tends to follow how euro area core CPI evolves relative to the U.S. After sharply falling last year, European relative core inflation is trying to rebound, which at a minimum suggests that EUR/USD has limited downside. Moreover, EUR/USD has correlated positively with German market-based inflation expectations (Chart 11, bottom panel). This suggests that actual relative inflation as well as euro area inflation expectations play a key role in determining perceptions among investors of how ECB policy will evolve relative to the Federal Reserve. Chart 11EUR/USD Trades Off Of Inflation Dynamics
EUR/USD Trades Off Of Inflation Dynamics
EUR/USD Trades Off Of Inflation Dynamics
The recent euro decline has matched the decline in inflation expectations. However, inflation expectations have been much weaker than implied by the level of wage growth in Europe (Chart 12). This suggests that European inflation breakevens have scope to improve, a positive for the euro. Moreover, European wage growth is not only picking up steam in isolation, it is also rising relative to the U.S., which highlights that European inflation should not just stabilize vis-à-vis the U.S., but also accelerate. Chart 12European Wages Point To Rising Inflation Expectations
European Wages Point To Rising Inflation Expectations
European Wages Point To Rising Inflation Expectations
This case is made even more saliently by looking at relative financial conditions. Due to the tightening in U.S. financial conditions compared to the euro area, European headline and core inflation is set to accelerate relative to the U.S. (Chart 13). Again, this reinforces the case that maybe the euro has upside this year. Chart 13Relative Euro Area Inflation Will Rise Thanks To Easier FCI
Relative Euro Area Inflation Will Rise Thanks To Easier FCI
Relative Euro Area Inflation Will Rise Thanks To Easier FCI
Ultimately, for the euro to rise, investors will have to begin pricing in some switch in policy spreads between the ECB and the Fed. In the past, we showed that short-term policy expectations are important, but long-term ones can be even more relevant, especially when a central bank is well along the path of lifting rates, as the Fed is, while the other remains at maximum accommodation, like the ECB is today.1 Currently, investors expect euro area short rates to be only 0.5% 5-years from now (Chart 14, top panel). The spread between the eurozone and U.S. 5-year forward 1-month OIS rates remains near all-time lows, which explains the weakness in the euro. Now that European policy is much more accommodative than the U.S.’s, there’s scope for investors to upgrade the path of long-term euro area rates relative to the U.S. This would be bullish for the euro (Chart 14, bottom panel). Recovering relative credit flows and improving relative slack and inflation dynamics could catalyze this change. Chart 14The ECB Is Never Raising Rates
The ECB Is Never Raising Rates
The ECB Is Never Raising Rates
Bottom Line: To make the euro an attractive buy, European growth and inflation conditions cannot just increase, they need to improve relative to the U.S. Since long-term interest rate expectations are very depressed in Europe relative to the U.S., a small improvement in the relative growth profile could be enough to catalyze a repricing of the ECB vis-à-vis the Fed, creating a powerful tailwind behind the euro. Nothing Happens In A Vacuum Ultimately, exchange rates, like other prices in the economy, do not only respond to domestic determinants but are also influenced by much larger, global forces. This is because those global trends percolate through domestic economies, resulting in changing relative expected returns that drive money across borders, leading to currency movements. In the case of the euro, global growth matters a lot, because European growth is much more sensitive to global economic fluctuations than U.S. growth is. This is particularly true if shocks emanate from emerging markets (Chart 15). Today, global cyclical variables are increasingly pointing toward an end to the global growth slowdown. A stabilization and reacceleration in global activity would support the euro.
Chart 15
First, Chinese monetary conditions have begun to ease, which historically tends to be linked with improvements in European growth relative to the U.S. (Chart 16). Questions remain surrounding this point: How durable will the rebound in Chinese credit be? By how much will Chinese policymakers nurture this bounce? And will this jump be large enough to lift economic activity in the Middle Kingdom? Nonetheless, a reflationary wind from China has begun to blow, and since investors have already discounted much bad news out of Europe, only small improvements could turn the euro around. Chart 16If China Is Really Stimulating, Europe Will Rip A Greater Dividend
If China Is Really Stimulating, Europe Will Rip A Greater Dividend
If China Is Really Stimulating, Europe Will Rip A Greater Dividend
Second, as Chart 17 shows, our Nowcast for global industrial activity has decisively stepped down. Yet, the countercyclical dollar has been flat since October 2018. Historically, the performance of EM carry trades funded in yen tends to lead global growth. Currently the performance of these strategies is stabilizing. If EM carry trades funded in yen can rally further, this will spell trouble for the greenback, helping the euro – the anti-dollar – in the process. Chart 17An Early Positive For Global Growth
An Early Positive For Global Growth
An Early Positive For Global Growth
Third, EUR/USD tends to correlate with the relative performance of global cyclical equities (Chart 18). The stabilization in these sectors since 2015 suggests it will be difficult for the euro to fall further from current levels. In fact, if EM carry trades can rebound more, cyclicals have additional scope to outperform, and the euro could rally. Chart 18Cyclical Stocks Pointing To No Real Downside In EUR/USD
Cyclical Stocks Pointing To No Real Downside In EUR/USD
Cyclical Stocks Pointing To No Real Downside In EUR/USD
Fourth, the prospects for the semiconductor sector are improving. Demand for semis is highly pro-cyclical, and the U.S. Chip Stock Timing Model developed by our U.S. Equity Strategy service colleagues is currently sending a bullish signal.2 Since such developments link to improving global growth prospects, they are also associated with a stronger EUR/USD (Chart 19). This is also consistent with a generally weaker dollar and stronger Asian currencies. Chart 19The Outlook For Semiconductors Point Toward A Stronger Euro And A Weaker Dollar
The Outlook For Semiconductors Point Toward A Stronger Euro And A Weaker Dollar
The Outlook For Semiconductors Point Toward A Stronger Euro And A Weaker Dollar
Finally, the breakout in copper prices, the stabilization in the CRB Raw Industrials Index and the rally in gold prices all support an improving global growth outlook that could lift EUR/USD. Bottom Line: Various indicators, such as Chinese monetary conditions, EM carry trades, semiconductor demand determinants and commodity prices are suggesting that global growth may soon bottom. Such a development should hurt the countercyclical dollar, amounting to a macro tailwind for EUR/USD. The Bad News Is Priced In Ultimately, the capacity of EUR/USD to rally rests on how much investors upgrade their outlook for Europe. It is therefore crucial to get a sense of exactly how uninspiring Europe currently is to global market participants. There is no better gauge of relative economic pessimism than the price of euro area financial assets relative to U.S. ones. Essentially, money talks. On this front, markets already seem to have internalized the known bad news from Europe, and there is scope for a contrarian rally in the euro, especially if, as we expect, European economic activity improves. First, on a 12-month forward P/E ratio basis, euro area equities are trading at the kind of deep discount to U.S. stocks normally symptomatic of a trough in relative sentiment toward Europe. Such a discount is often followed by a rally in EUR/USD (Chart 20). Chart 20Stock Valuations: Investors Do Not Like Europe
Stock Valuations: Investors Do Not Like Europe
Stock Valuations: Investors Do Not Like Europe
Second, retailers’ equities can often give a more focused assessment of how investors perceive the comparative outlook for domestic demand between two nations. Currently, euro area retailers trade at a 16-year low versus their U.S. counterparts (Chart 21). Investors are therefore much more ebullient about the prospects for U.S. domestic demand than in Europe. Interestingly, the euro’s gyrations since 2016 have tracked the direction of the relative performance of retailers but have diverged in terms of levels. This suggests some underlying support for the currency. Chart 21Can European Domestic Demand Really Validate Such Pessimistic Expectations?
Can European Domestic Demand Really Validate Such Pessimistic Expectations?
Can European Domestic Demand Really Validate Such Pessimistic Expectations?
Third, the relative stock-to-bond ratio also often provides a good read on investors’ comparative economic euphoria/pessimism towards two nations. In 2018, the annual performance of the euro area stock-to-bond ratio relative to the U.S. collapsed to levels not recorded since the euro area crisis was at its apex (Chart 22). This further confirms that investors were massively depressed on European growth prospects relative to the U.S. While this indicator is rebounding, it is still in negative territory, implying that market participants still have room to upgrade their assessment of the euro area relative to the U.S. Historically, this kind of setup has been associated with a rebound in the EUR/USD. Chart 22The Stock-To-Bond Ratio Points To Some Upside Potential
The Stock-To-Bond Ratio Points To Some Upside Potential
The Stock-To-Bond Ratio Points To Some Upside Potential
Fourth, European net earnings revisions relative to the U.S. have also hit bombed-out levels and are in the process of improving. Since earnings are tightly linked to global growth and reflect the same information that informs capital flows into a country (Chart 23), sell-side analysts becoming more positive on Europe at the margin could indicate that investors are in the process of re-assessing whether to buy European assets. A decision to do so would support EUR/USD. Chart 23When The Sell-Side Move From Deeply To Mildly Bearish, EUR/USD Rallies
When The Sell-Side Move From Deeply To Mildly Bearish, EUR/USD Rallies
When The Sell-Side Move From Deeply To Mildly Bearish, EUR/USD Rallies
Bottom Line: Financial market pricing suggests that investors are displaying deep pessimism toward the euro area’s relative growth prospects. The euro could be a contrarian buy. Most importantly, there are early signs that this growth pricing is starting to move in favor of Europe. If our economic view on Europe and global growth is correct, this trend has further to go, implying that more capital could move into Europe, creating a potent tailwind for EUR/USD. What Else? Three additional factors need to be considered: Currency valuations, balance-of-payment dynamics, and technicals. First, while it is not as cheap as it once was, the real trade-weighted euro is still trading below its historical average (Chart 24). Purchasing-power considerations can rarely be used as a timing tool, but our confidence in the euro’s upside would be greatly dented if the euro were a very expensive currency. It is not even mildly pricey. Chart 24Euro Valuations: No Headwinds There
Euro Valuations: No Headwinds There
Euro Valuations: No Headwinds There
Second, balance-of-payment considerations have become increasingly euro-positive. The euro area runs a current account surplus of 3.3% of GDP, and despite large FDI outflows – a natural consequence of being a savings-rich economy – the basic balance of payments remains in surplus. Moreover, as fixed-income outflows have been dissipating, the aggregate portfolio flows into Europe have also been improving (Chart 25). The end of the ECB’s Asset Purchase Program should solidify this trend. Chart 25The Euro Area Balance Of Payments Is Increasingly Favorable
The Euro Area Balance Of Payments Is Increasingly Favorable
The Euro Area Balance Of Payments Is Increasingly Favorable
Finally, technical oscillators are behaving increasingly well. As Chart 26 shows, not only does our Intermediate-Term Indicator remains oversold, but also, it is has begun to form a positive divergence with the price of EUR/USD. If the economic outlook is becoming more bullish, such a technical setup can often be translated into significant gains. Chart 26EUR/USD: Oversold And A Positive Divergence Is Forming
EUR/USD: Oversold And A Positive Divergence Is Forming
EUR/USD: Oversold And A Positive Divergence Is Forming
Bottom Line: The euro’s valuation is not as attractive as it once was, but it remains cheap. Moreover, the euro area’s balance-of-payment dynamics and the EUR/USD’s technical setup both suggest the timing is increasingly ripe to buy the euro against the dollar. Investment Conclusions A trough in European growth, improving growth and inflation prospects relative to the U.S., green shoots for global growth and deep pessimism toward Europe relative to the U.S. all argue that the timing is right to bet on a euro rebound. At this point, the durability of the euro rebound remains unclear. Investors are under-appreciating the ability of the Fed to raise rates this year, which could help the dollar. On the other hand, they seem even more sanguine toward the ECB ever lifting rates. Ultimately, the capacity of the euro to rebound on a long-term basis against the dollar will be constrained by global growth. This means that China will continue to play a center-stage role for this crucial FX pair. At this point, it is unclear how determined Chinese policymakers are to reflate their economy. Thus, we recommend investors monitor Chinese policy to gauge how long to stay in the euro. For the time being, enough pieces are falling into place to warrant buying EUR/USD for three to six months. However, if the Chinese credit impulse can continue on its recent rebound, the durability of a euro rally could be extended, implying that the euro may be in the process of forming a long-term bottom against the dollar. A strengthening euro should support the entire European currency complex against the dollar. In fact, the NOK, the SEK and the GBP may even outperform the EUR. The NOK is being boosted by rising oil prices, a more hawkish central bank, better valuations and an even healthier balance of payments. The SEK is also supported by a Riksbank that is slightly more hawkish than the ECB, and better valuations; it also benefits from a Swedish economy that is even more pro-cyclical than the euro area’s. The GBP also benefits from a greater valuation discount than the euro, and political developments in the U.K. are beginning to move toward a more clear-cut positive outcome on the Brexit front.3 The countercyclical and expensive CHF will prove the European laggard. Finally, EUR/JPY is also set to continue its rebound that began on January 4th. In fact, it may be one of the best vehicles to express a euro-bullish view because it is less sensitive to what the Fed does than EUR/USD is. Rising bond yields are an unmitigated positive for EUR/JPY, and BCA firmly believes that U.S. Treasury yields have upside, whether or not the Fed goes back to lifting rates. The Fed will mostly impact whether it is the real or inflation component that lifts Treasury yields. Bottom Line: The entire European currency complex is set to rise along with the euro against the greenback. In fact, the NOK, the SEK and the GBP are likely to outperform the euro, while the CHF should underperform. EUR/JPY may in fact offer the best risk-adjusted returns to play a euro rebound. While it is clear that at this moment that buying the euro makes sense, the principal risk lies around how long this rally will last. We are increasingly convinced that the euro has made a low for the cycle and that its long-term outlook is looking increasingly bright. Mathieu Savary, Vice President Foreign Exchange Strategy mathieu@bcaresearch.com Footnotes 1 Please see the EUR/USD: Focus On The Western Shores Of The Atlantic section of the Foreign Exchange Strategy Weekly Report, titled “Canaries In The Coal Mine Alert: EM/JPY Carry Trades”, dated December 1, 2017, available at fes.bcaresearch.com 2 Please see U.S. Equity Strategy Weekly Report, titled “Reflationary Or Recessionary”, dated February 25, 2019, available at uses.bcaresearch.com 3 Please see European Investment Strategy Weekly Report, titled “Why A Catastrophic No-Deal Might Be Good… For The EU”, dated February 28, 2019, available at eis.bcaresearch.com Trades & Forecasts Forecast Summary Core Portfolio Tactical Trades Closed Trades
Highlights Global growth is still slowing. Having rallied since the start of the year, global stocks will likely enter a “dead zone” over the next six-to-eight weeks as investors nervously await the proverbial green shoots to sprout. We think they will appear in the second quarter, setting the scene for a reacceleration in global growth in the second half of the year, and an accompanying rally in global risk assets. Investors should overweight stocks and spread product while underweighting safe government bonds over a 12-month horizon. The U.S. dollar will strengthen a bit over the next few months, but should start to weaken in the summer as the global economy catches fire. Stronger global growth and a weaker dollar in the back half of the year will benefit EM assets and European stocks. Feature I skate to where the puck is going to be, not to where it has been. — Wayne Gretzky How To Be A Good Macro Strategist To paraphrase Gretzky, a mediocre macro strategist draws conclusions based solely on incoming data. A good macro strategist, in contrast, tries to figure out where the data is heading. How can one predict how the economic data will evolve? Examining forward-looking indicators is helpful, but it is not enough. One also has to understand why the data is evolving the way it is. If one knows this, one can then assess whether the forces either hurting or helping growth will diminish, intensify, or remain the same. What Accounts For the Growth Slowdown? There is little mystery as to why global growth slowed in 2018. Chinese credit growth fell steadily over the course of the year, which generated a negative credit impulse. Unlike in the past, China is now the most important driver of global credit flows (Chart 1). Chart 1Global Credit Flows Are Increasingly Driven By China
Global Credit Flows Are Increasingly Driven By China
Global Credit Flows Are Increasingly Driven By China
Meanwhile, the global economy was rocked by rising oil prices. Brent rose from $55/bbl on October 5, 2017 to $85/bbl on October 4, 2018. Government bond yields also increased, with the 10-year U.S. Treasury yield rising from 2.05% on September 7, 2017 to 3.23% on October 5, 2018 (Chart 2). Chart 2Rising Oil Prices And Bond Yields Contributed To Slower Global Growth Last Year
Rising Oil Prices And Bond Yields Contributed To Slower Global Growth Last Year
Rising Oil Prices And Bond Yields Contributed To Slower Global Growth Last Year
A mediocre macro strategist draws conclusions based solely on incoming data. A good macro strategist, in contrast, tries to figure out where the data is heading. In an ironic twist, Jay Powell’s ill-timed comment that rates were “a long way” from neutral marked the peak in bond yields. Unfortunately, the subsequent decline in yields was accompanied by a vicious stock market correction and a widening in credit spreads. This led to an overall tightening in financial conditions, which further hurt growth (Chart 3). Chart 3Financial Conditions Tightened In 2018, Especially After Powell's Hawkish Comments
Financial Conditions Tightened In 2018, Especially After Powell's Hawkish Comments
Financial Conditions Tightened In 2018, Especially After Powell's Hawkish Comments
The critical point is that all of these negative forces are behind us: Financial conditions have eased significantly over the past two months; oil prices have rebounded, but are still well below their 2018 highs; and as we explain later on, Chinese growth is likely to bottom by the middle of this year. This means that global growth should start to improve over the coming months. The United States: Better News Ahead The latest U.S. economic data has been weak, with this morning’s disappointing ISM manufacturing print being the latest example. The New York Fed’s GDP Nowcast is pointing to annualized growth of 0.9% in the first quarter. While there is no doubt that underlying growth has decelerated, data distortions have probably also contributed to the perceived slowdown. For instance, the dismal December retail sales report reduced the base for consumer spending going into 2019, thus shaving about 0.4 percentage points off Q1 growth. The drop in real personal consumption expenditures (PCE) cut the New York Fed’s Q1 growth estimate by a further 0.15 percentage points. We suspect that much of the weakness in December retail sales and PCE was linked to the government shutdown. The closure caused some of the surveys used to compile these reports to be postponed until January, which is historically the weakest month for retail sales. The Johnson Redbook Index – which covers 80% of the retail sales surveyed by the Department of Commerce – as well as the sales figures from Amazon and Walmart all point to strong spending during the holiday season (Chart 4). Chart 4The December U.S. Retail Sales Report Was Probably A Fluke
The December U.S. Retail Sales Report Was Probably A Fluke
The December U.S. Retail Sales Report Was Probably A Fluke
Fundamentally, U.S. consumers are in good shape (Chart 5). As a share of disposable income, household debt is over 30 percentage points lower than it was in 2007. The savings rate stands at an elevated level, which gives households the wherewithal to increase spending. Job openings hit another record high, while wage growth continues to trend upwards. Fundamentally, U.S. consumers are in good shape. Chart 5U.S. Consumer Fundamentals Are Solid
U.S. Consumer Fundamentals Are Solid
U.S. Consumer Fundamentals Are Solid
The housing market should improve. Rising mortgage rates weighed on housing last year. However, rates have been declining for several months now, which augurs well for home sales and construction over the next six months (Chart 6). Chart 6Mortgage Rates Will Not Be A Headwind For U.S. Housing Activity Over The Next 6 Months
Mortgage Rates Will Not Be A Headwind For U.S. Housing Activity Over The Next 6 Months
Mortgage Rates Will Not Be A Headwind For U.S. Housing Activity Over The Next 6 Months
While capex intention surveys have come off their highs, they still point to reasonably solid expansion plans (Chart 7). Rising labor costs and high levels of capacity utilization will induce firms to invest in more capital equipment, which should support business spending. Chart 7U.S. Capex Plans Have Come Off Their Highs, But Remain Solid
U.S. Capex Plans Have Come Off Their Highs, But Remain Solid
U.S. Capex Plans Have Come Off Their Highs, But Remain Solid
Government expenditures should also recover. By most estimates, the shutdown shaved one percentage point from Q1 growth. This is likely to be completely reversed in the second quarter. The End Of The Chinese Deleveraging Campaign? The popular narrative about weaker Chinese growth has focused on the trade war. While trade uncertainty undoubtedly hurt growth last year – and has continued to weigh on growth so far this year – most of the weakness in the Chinese economy can be traced to the deleveraging campaign which started in 2017, long before the surge in trade flow angst. Fixed investment spending in China is generally financed through credit markets. Chart 8 shows that the contribution of investment spending to GDP growth has declined in tandem with decelerating credit growth. Most of the weakness in the Chinese economy can be traced to the deleveraging campaign which started in 2017, long before the surge in trade flow angst. Chart 8China: Deleveraging Means Less Investment-Led Growth
China: Deleveraging Means Less Investment-Led Growth
China: Deleveraging Means Less Investment-Led Growth
Chinese credit growth has typically reaccelerated whenever it has dipped towards trend nominal GDP growth. We may have already reached this point (Chart 9). New credit formation came in well above expectations in January. Given possible distortions caused by the timing of the Chinese lunar new year, investors should wait until the February data is released in mid-March before drawing any firm conclusions. Nevertheless, it is starting to look increasingly likely that credit growth has bottomed. The 6-month credit impulse has already surged (Chart 10). The 12-month impulse should also begin moving up provided that month-over-month credit growth simply maintains its recent trend (Chart 11). Chart 9Historically, China Has Scaled Back On Deleveraging When Credit Growth Has Fallen Close To Nominal GDP Growth
Historically, China Has Scaled Back On Deleveraging When Credit Growth Has Fallen Close To Nominal GDP Growth
Historically, China Has Scaled Back On Deleveraging When Credit Growth Has Fallen Close To Nominal GDP Growth
Chart 10A Rebound In The Chinese 6-Month Credit Impulse
A Rebound In The Chinese 6-Month Credit Impulse
A Rebound In The Chinese 6-Month Credit Impulse
Chart 11The 12-Month Impulse Is Set To Turn Up
The 12-Month Impulse Is Set To Turn Up
The 12-Month Impulse Is Set To Turn Up
On the trade front, President Trump’s decision to delay the implementation of tariffs on $200 billion in Chinese imports is a step in the right direction. Nevertheless, gauging whether the trade war will continue to de-escalate is extraordinarily difficult. There is no major constituency within the Republican Party campaigning for protectionism. It ultimately boils down to what one man – Trump – wants. Our best guess is that President Trump will try to score a few political points by “declaring victory” – deservedly or not – in his battle with China in order to pivot to more pressing domestic issues such as immigration. However, there can be no assurance of this, which is why China’s leaders are likely to prioritize growth over deleveraging, at least for the time being. They know full well that the only way they can credibly threaten to walk away from the negotiating table is if their economy is humming along. Europe: From Headwinds To Tailwinds? Slower global growth, higher oil prices, and a spike in Italian bonds yields all contributed to the poor performance of the European economy last year. Economic activity was further hampered by a decline in German automobile production following the introduction of more stringent emission standards. The good news is that these headwinds are set to reverse course. Italian bond yields are well off their highs, as are oil prices (Chart 12). German automobile production is recovering (Chart 13). In addition, the European Commission expects the euro area fiscal thrust to reach 0.40% of GDP this year, up from 0.05% of GDP last year (Chart 14). This should add about half a percentage point to growth. Finally, if our expectation that Chinese growth will bottom out by mid-year proves correct, European exports should benefit. If neither the political establishment nor the general public favor Brexit, it will not happen. Chart 12Headwind No More (I): Italian Bond Yields
Headwind No More (I): Italian Bond Yields
Headwind No More (I): Italian Bond Yields
Chart 13Headwind No More (II): German Auto Sector
Headwind No More (II): German Auto Sector
Headwind No More (II): German Auto Sector
Chart 14The Euro Area Will Benefit From A Modest Amount Of Fiscal Easing This Year
The Euro Area Will Benefit From A Modest Amount Of Fiscal Easing This Year
The Euro Area Will Benefit From A Modest Amount Of Fiscal Easing This Year
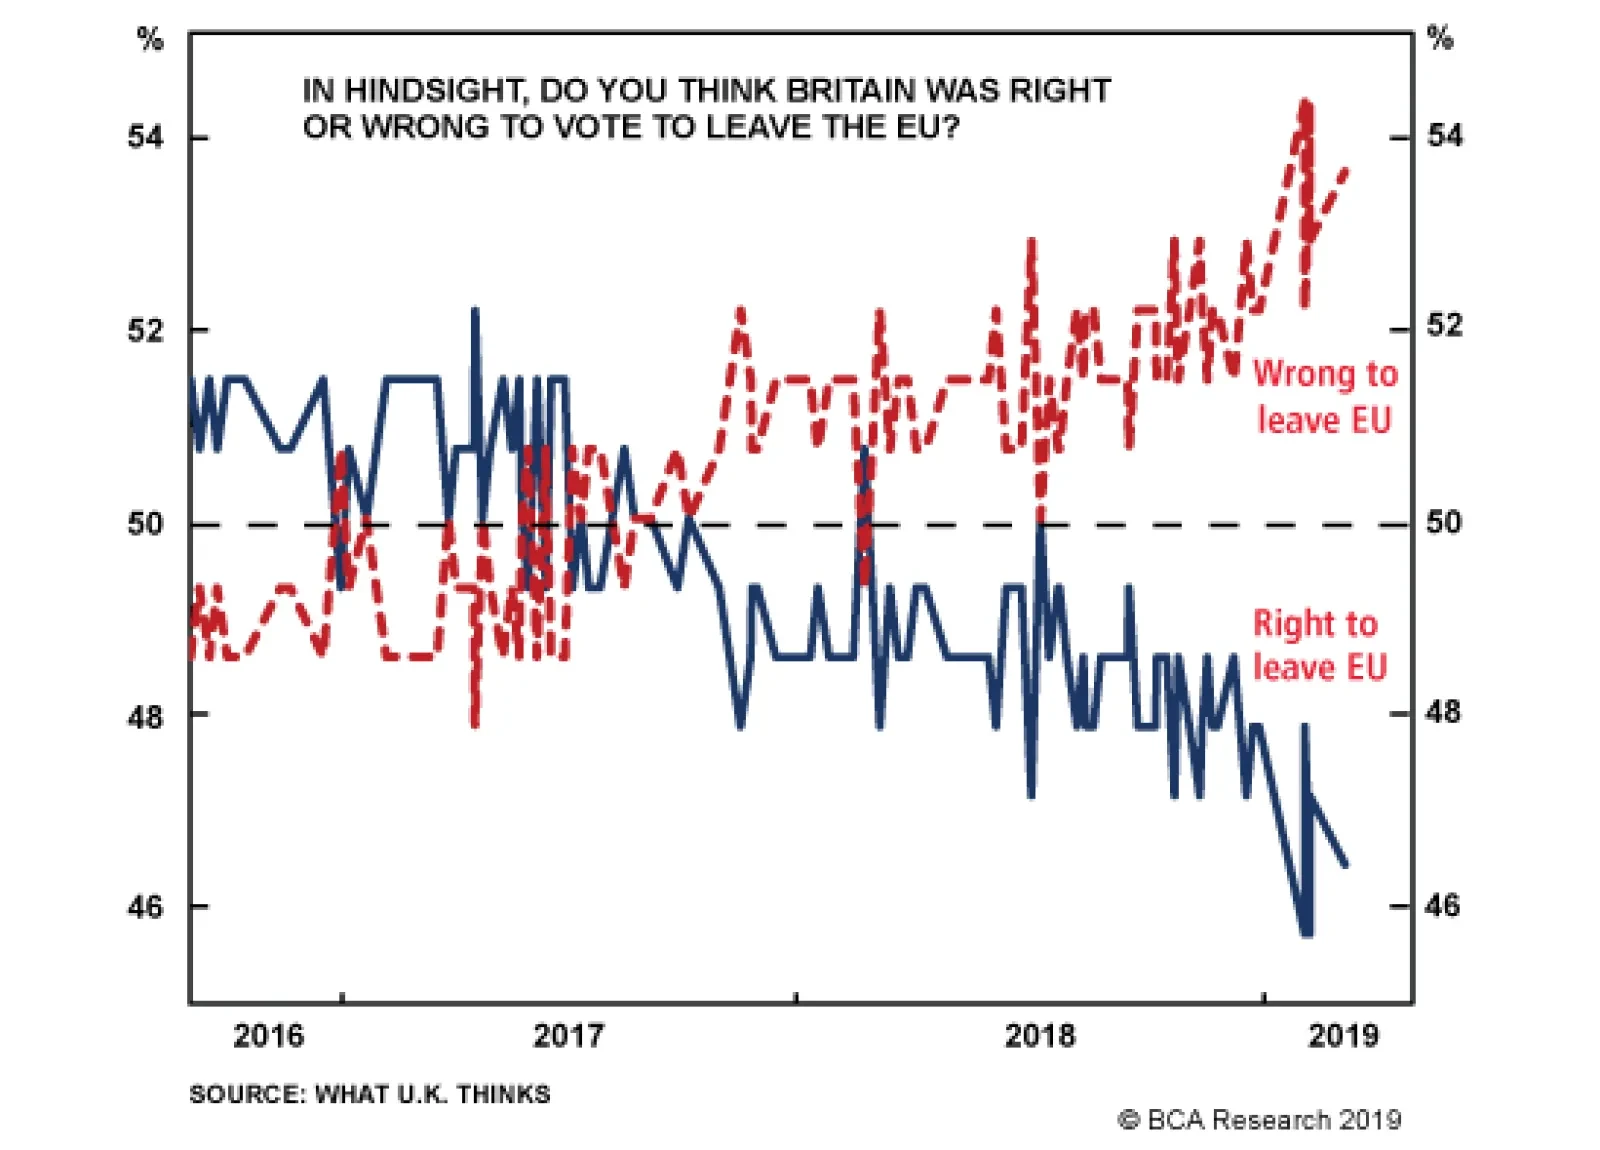
Brexit still remains a risk, but a receding one. We have consistently argued that the political establishment on both sides of the British channel will not accept anything resembling a hard Brexit. As was the case with the EU treaty referendums involving Denmark and Ireland in the 1990s, the European political elites will insist on a “No fair! Let’s play again! Best two-out-of-three?” do-overs until they get the result they want. Theresa May’s efforts to cobble together a parliamentary majority that precludes a hard Brexit, along with the Labor Party’s increasing willingness to pursue a second vote, is consistent with our thesis. Fortunately for the “remain” side, public opinion is shifting in favor of staying in the EU (Chart 15). Focusing on the minutiae of various timetables, rules, and regulations is largely a waste of time. If neither the political establishment nor the general public favor Brexit, it will not happen. We are short EUR/GBP, a trade recommendation that has gained 5.2% since we initiated it. We continue to see upside for the pound. Chart 15The ''Remain'' Side Would Likely Win Another Referendum
The ''Remain'' Side Would Likely Win Another Referendum
The ''Remain'' Side Would Likely Win Another Referendum
Investment Conclusions Global growth is still slowing. Having rallied since the start of the year, global stocks will likely enter a “dead zone” for the next six-to-eight weeks as investors nervously await the proverbial green shoots to sprout. We think they will appear in the second quarter, setting the scene for a reacceleration in global growth in the second half of the year, and an accompanying rally in global risk assets. The dollar is a countercyclical currency, meaning that it moves in the opposite direction of the global business cycle (Chart 16). The greenback will strengthen a bit over the next few months, but should start to weaken in the summer as the global economy catches fire. Chart 16The Dollar Is A Countercyclical Currency
The Dollar Is A Countercyclical Currency
The Dollar Is A Countercyclical Currency
We sold our put on the EEM ETF for a gain of 104% on Jan 3rd, and are now outright long EM equities. We do not have a strong view on EM versus DM equities at the moment, but expect to shift EM to overweight once we see more confirmatory evidence that Chinese growth is stabilizing. Having rallied since the start of the year, global stocks will likely enter a “dead zone” for the next six-to-eight weeks as investors nervously await the proverbial green shoots to sprout. In conjunction with our expected upgrade on EM assets, we will move European equities to overweight. Stronger global growth will benefit European multinational exporters, while brisker domestic growth should allow the market to price in a few more ECB rate hikes starting in 2020. The latter will lead to a somewhat steeper yield curve which, along with rising demand for credit, should boost financial sector earnings (Chart 17). This will give European bank stocks a welcome boost. Chart 17Stronger Euro Area Credit Growth Will Boost Bank Earnings
Stronger Euro Area Credit Growth Will Boost Bank Earnings
Stronger Euro Area Credit Growth Will Boost Bank Earnings
Japanese equities will also benefit from faster global growth, but domestic demand will suffer from the government’s ill-advised plan to raise the sales tax in October. As such, we do not anticipate upgrading Japanese stocks. We also expect the yen to come under some pressure as the BoJ is forced to maintain its ultra-accommodative monetary policy stance, while bond yields elsewhere move modestly higher. Peter Berezin Chief Global Investment Strategist peterb@bcaresearch.com Strategy & Market Trends* MacroQuant Model And Current Subjective Scores
Chart 18
Tactical Trades Strategic Recommendations Closed Trades