Europe

Highlights We always strive to develop new analytical methods to complement our focus on judging currencies based on global liquidity conditions and the business cycle. This week, we introduce a ranking method based strictly on domestic factors: We call it the Aggregate Domestic Attractiveness Ranking. Using this method alone, the USD, the NZD, the AUD, and the NOK are the most attractive currencies over the coming three months, while the JPY, the GBP, the EUR and the CHF are the least attractive ones. If we further filter the results using a valuation gauge, the USD, the NOK and the CAD are the most attractive currencies over the coming three months, while the CHF, the JPY and the GBP are the least attractive ones. Ultimately, the message is clear: if the dollar corrects, domestic factors suggest it will be shallow. However, buying pro-cyclical commodity currencies at the expense of countercyclical ones makes sense no matter what. Feature This publication places significant emphasis on understanding where we stand in the global liquidity and business cycle in order to make forecasts for G-10 currencies. However, we also like to refer to other methods to add supplementary dimensions to our judgment calls. In this optic, we have focused on factor-based analyses such as understanding momentum, carry and valuation considerations. This week, we take another approach: We build a ranking methodology using domestic economic variables only, intentionally excluding global business cycle factors. Essentially, we want to create an additional filter to be used independently of our main method. This way, we can develop a true complement to our philosophy rooted in understanding the global business cycle. With this approach, we rank currencies in terms of domestic growth, slack, inflation, financial conditions, central bank monitors, and real rates. We look at the level of these variables as well as how they have evolved over the past 12 months. After ranking each currency for each criterion, we compute an aggregate attractiveness ranking incorporating all the information. We then compare the attractiveness of each currency to their premiums/discounts to our Intermediate-Term Timing Models. Based on this methodology, the USD, the NOK and the CAD are the most attractive currencies over the coming three months, while the CHF, the JPY, and the GBP are the least attractive ones. Building A Domestic Attractiveness Ranking Domestic Growth
Chart I-1
Chart I-2
The first dimension tries to capture the strength and direction of domestic growth. We begin by looking at the annual growth rate of industrial production excluding construction, as well as how this growth rate has evolved over the past 12 months. Here, the currencies of countries at the top right of the chart are most attractive, while those at the bottom left are least attractive. As Chart I-1 illustrates, Sweden is performing particularly well on this dimension, while the euro area, Switzerland, the U.K, and Japan are not. The U.S. stands toward the middle of the pack. When aggregating this dimension on both the first and second derivative of industrial production, Sweden ranks first, followed by the U.S. and Norway (Chart I-2). The U.K. and the euro area rank at the bottom.
Chart I-3
Chart I-4
When trying to gauge the impact of domestic growth on each currency’s attractiveness, we also look at the forward-looking OECD leading economic indicator (LEI). As with industrial production, the currencies of countries at the top right of the chart are most attractive, while those at the bottom left are least attractive. This changes the ranking. New Zealand exhibits the highest annual growth rate, followed by the U.S. Meanwhile, when looking at how the annual rate of change has evolved over the past 12 months, Australia shows the least deterioration, and the euro area the most (Chart I-3). Putting these two facets of the LEI together, Australia currently ranks first, followed by the U.S. and New Zealand. Switzerland and the U.K perform the most poorly (Chart I-4). Slack
Chart I-5
Chart I-6
Then, we focus on slack, observing the dynamics in the unemployment gap, calculated using the OECD estimates of the non-accelerating inflation rate of unemployment (NAIRU). Here, the currencies of countries at the top right of the chart are least attractive, while those at the bottom left are most attractive. Switzerland enjoys both a very negative and rapidly falling unemployment gap (Chart I-5). The U.K. also exhibits a clear absence of slack, but in response to the woes surrounding Brexit, this tightness is decreasing. Interestingly, the euro area looks good. Despite its high unemployment rate of 7.9%, the unemployment gap is negative, a reflection of its high NAIRU. Combining the amount of slack with the change in slack, Switzerland, New Zealand and the euro area display the best rankings, while the U.S. and Sweden exhibit the worst (Chart I-6). The poor rankings for both the U.S. and Sweden reflect that there is little room for improvement in these countries. Inflation
Chart I-7
Chart I-8
When ranking currencies on the inflation dimension, we look at core inflation and wages. We assume that rising inflationary pressures are a plus, as they indicate the need for tighter policy. We begin with core inflation itself; the currencies of countries at the top right of the chart are most attractive, while those at the bottom left are least attractive. Canada and the U.S. both sport higher core inflation than the rest of the sample, as well positive inflationary momentum (Chart I-7). Switzerland displays both a very low level of inflation as well as declining momentum. U.K. inflation displays the least amount of momentum. On the core CPI ranking, the Canadian dollar ranks first, followed by the USD. Unsurprisingly, Japan and Switzerland rank at the bottom of the heap (Chart I-8).
Chart I-9
Chart I-10
We also use wages to track inflationary conditions as G-10 central banks have put a lot of emphasis on labor costs. Similar to core inflation, we measure each country’s level of wage growth as well as its wage-growth momentum. The currencies of countries at the top right of the chart are most attractive, while those at the bottom left are least attractive. This time, the U.S. and the U.K. display both the highest annual growth rate of wages as well as the fastest increase in wage inflation (Chart I-9). Meanwhile, Norwegian wage growth is very poor, but improving. The U.S. and the U.K. rank first on this dimension, while Switzerland and Canada rank last, the latter is impacted by its very sharp deceleration in wage growth (Chart I-10). Financial Conditions
Chart I-11
Chart I-12
The Financial Conditions Index (FCI) has ample explanatory power when it comes to forecasting a country’s future growth and inflation prospects. This property has made the FCI a key variable tracked by G-10 central banks. Here we plot the level of the FCI relative to the annual change in FCI. A low and easing FCI boosts a nation’s growth prospects, while a high and tightening FCI hurts the outlook. Consequently, the currencies of countries at the top right of the chart are least attractive, while those at the bottom left are most attractive. While Switzerland has the highest level of FCI – courtesy of an overvalued exchange rate – the U.S. has experienced the greatest tightening in financial conditions (Chart I-11). Combining the level and change in FCI, we find that New Zealand currently possess the most pro-growth conditions, followed by both Sweden and Norway. On the other end of the spectrum, Japan and the U.S. suffer from the most deleterious financial backdrop (Chart I-12). Central Bank Monitors
Chart I-13
Chart I-14
We often use the Central Bank Monitors devised by our Global Fixed Income Strategy sister publication as a gauge to evaluate the most probable next moves by central banks. It therefore makes great sense to use this tool in the current exercise. The only problem is that we currently do not have a Central Bank Monitor for Switzerland, Sweden and Norway. Nonetheless, using this variable to create a dimension, we compare where each available Central Bank Monitor stands with its evolution over the past 12 months. The currencies of countries at the top right of the chart are most attractive, while those at the bottom left are least attractive. Currently, Canada and the U.S. show a clear need for tighter policy, without a pronounced fall in their respective Central Bank Monitors (Chart I-13). However, while the U.K. could stand higher rates right now, the British Central Bank Monitor is quickly falling, suggesting the window of opportunity for the Bank of England is dissipating fast. The euro area and Australia do not seem to justify higher rates right now. On this metric, Canada and the U.S. stand at one and two, while Australia and the euro area offer the least attractive conditions for their currencies (Chart I-14). Real Interest Rates
Chart I-15
Chart I-16
The Uncovered Interest Rate Parity (UIP) hypothesis has been one the workhorses of modern finance in terms of forecasting exchange rates. To conduct this type of exercise, our previous work has often relied on a combination of short- and long-term real rates, a formulation with a good empirical track record.1 Accordingly, in the current exercise, we use this same combination of short- and long-term real rates to evaluate the attractiveness of G-10 currencies. This dimension is created by comparing the level of real rates to the change in real rates over the past 12 months. The currencies of countries at the top right of the chart are most attractive, while those at the bottom left are least attractive. The U.S. dollar is buoyed by elevated and rising real rates, while the pound is hampered by low and falling real rates (Chart I-15). This results in the dollar ranking first on this dimension, and the pound ranking last (Chart I-16). Interestingly, the yen ranks second because depressed inflation expectations result in higher-than-average and rising real rates. Aggregate Domestic Attractiveness Ranking and Investment Conclusions
Chart I-17
Chart I-18
Once we have ranked each currency on each dimension, we can compute the Aggregate Domestic Attractiveness Ranking as a simple average of the ranking of the eight different dimensions. Based on this method, domestic fundamentals suggest that the USD, the NZD, the NOK and the AUD are the most attractive currencies over the next three months or so, while the JPY, the GBP, the EUR and the CHF are the least attractive ones (Chart I-17). Interestingly, this confirms our current tactical recommendation espoused over recent weeks to favor pro-cyclical currencies at the expense of defensive currencies. However, it goes against our view that the U.S. dollar is likely to correct further over the same time frame. This difference reflects the fact that unlike our regular analysis, the Aggregate Domestic Attractiveness Ranking does not take into account the global business cycle, momentum and sentiment. We can refine this approach further and incorporate valuation considerations. We often rely on our Intermediate-Term Timing Model to gauge if a currency is cheap or not. Chart I-18 compares the Aggregate Domestic Attractiveness Ranking of G-10 currencies to their deviation from their ITTM. Countries at the bottom left offer the most attractive currencies, while those at the upper right are the least attractive currencies. This chart further emphasizes the attractiveness of the dollar: not only do domestic factors support the greenback, so do its short-term valuations. The CAD, the NOK and the SEK also shine using this method, while the less pro-cyclical EUR, CHF and JPY suffer. The pound too seems to posses some short-term downside. Ultimately, this tells us that if the global environment is indeed unfavorable to the U.S. dollar right now, we cannot ignore the strength of U.S. domestic factors. Consequently, we refrain from aggressively selling the USD during the tactical anticipated correction. Instead, if the global environment favors the pro-cyclical commodity currencies on a three-month basis, it is optimal to buy them on their crosses, especially against the CHF and JPY. Meanwhile, the pound has very little going for it, and selling it against the SEK or the NOK could still deliver ample gains. Mathieu Savary, Vice President Foreign Exchange Strategy mathieu@bcaresearch.com Footnotes 1 Please see Foreign Exchange Strategy Special Report, "In Search Of A Timing Model" dated July 22, 2016, available at fes.bcaresearch.com. Currencies U.S. Dollar Chart II-1USD Technicals 1
USD Technicals 1
USD Technicals 1
Chart II-2USD Technicals 2
USD Technicals 2
USD Technicals 2
Recent data in the U.S. has been mixed: January U.S. consumer confidence index surprised to the downside, coming in at 120.2. U.S. unemployment rate in January increased to 4.0%, from a previous 3.9% reading; however, this data point was likely distorted by the government shutdown Non-farm payrolls in January surprised to the upside, coming in at 304k. The DXY index rebounded by 0.9% this week. Tactically, we remain bearish on the dollar, as we believe that the current easing in financial conditions will help global growth temporarily surprise dismal investor expectations. Nevertheless, we remain cyclical dollar bulls, as the Fed will ultimately hike more than what is currently priced this year, and as China’s current reflation campaign is about mitigating the downside to growth, not generating a new upswing in indebtedness and capex. Report Links: Global Liquidity Trends Support The Dollar, But... - January 25, 2019 So Donald Trump Cares About Stocks, Eh? - January 9, 2019 Waiting For A Real Deal - December 7, 2018 The Euro Chart II-3EUR Technicals 1
EUR Technicals 1
EUR Technicals 1
Chart II-4EUR Technicals 2
EUR Technicals 2
EUR Technicals 2
The recent data in euro area has been negative: The Q4 euro area GDP on a year-over-year basis fell to 1.2%, in line with expectations. Euro area headline inflation in January on a year-over-year basis decreased to 1.4%, from the previous 1.6% in December 2018, core inflation rose to 1.1%. January Markit euro area composite PMI fell to 51.0. Euro area retail sales in December fell to 0.8% on a year-over-year basis, from the previous 1.8%. In response to this poor economic performance, EUR/USD has fallen by 0.8% this week. We remain cyclically bearish on the euro, as we believe that the Fed will hike more than anticipated this cycle and that Europe is more negatively impacted by China’s woes than the U.S. is. Hence, slowing global growth will force the ECB to stay dovish much longer than expected. Moreover, our Intermediate Term Timing Model, is showing that the euro is once again trading at a premium to short term fundamentals. Report Links: 2019 Key Views: The Xs And The Currency Market - December 7, 2018 Six Questions From The Road - November 16, 2018 Evaluating The ECB’s Options In December - November 6, 2018 The Yen Chart II-5JPY Technicals 1
JPY Technicals 1
JPY Technicals 1
Chart II-6JPY Technicals 2
JPY Technicals 2
JPY Technicals 2
Recent data in Japan has been mixed: Annual inflation increased to 0.4% from previous 0.3%, core inflation increased to 0.7% from 0.6%, and inflation ex fresh food increased to 1.1% from 0.9%. December retail trade weakened to 1.3% from the previous 1.4%. Japanese unemployment rate in December has fallen to 2.4%. January consumer confidence index fell to 41.9, underperforming the expectations. USD/JPY has risen by 0.3% this week. We remain bearish on the yen on a tactical basis. The recent FOMC meeting kept the U.S. key interest rate unchanged, so did many other central banks. The resulting ease in global financial conditions could be a headwind for safe havens, like the yen. Moreover, U.S. yields are likely to rise even after the easing in financial conditions is passed, as BCA anticipates the Fed to resume hiking in the second half of 2019. This will create additional downside for the yen. Report Links: Yen Fireworks - January 4, 2019 2019 Key Views: The Xs And The Currency Market - December 7, 2018 Updating Our Intermediate Timing Models - November 2, 2018 British Pound Chart II-7GBP Technicals 1
GBP Technicals 1
GBP Technicals 1
Chart II-8GBP Technicals 2
GBP Technicals 2
GBP Technicals 2
The recent data in Britain has been negative: Markit U.K. composite PMI has surprised to the downside, falling to 50.3 in January; service PMI dropped to 50.1 while construction PMI fell to 50.6. Halifax house prices yearly growth, surprised to the downside, coming in at 0.8%. Finally, Markit Services PMI also underperform, coming in at 50.1. The Bank of England rate decided to keep rates on hold at 0.75%. GBP/USD has lost 0.8% this week. On a long-term basis, we remain bullish on cable, as valuation for the pound are attractive. However, we believe that the current stalemate in Westminster, coupled with the hard-nose approach of Brussels has slightly increase the probability of a No-deal Brexit. This political uncertainty implies that short-term risk-adjusted returns remains low. Report Links: Deadlock In Westminster - January 18, 019 Six Questions From The Road - November 16, 2018 Updating Our Intermediate Timing Models - November 2, 2018 Australian Dollar Chart II-9AUD Technicals 1
AUD Technicals 1
AUD Technicals 1
Chart II-10AUD Technicals 2
AUD Technicals 2
AUD Technicals 2
Recent data in Australia has been negative: Building permits in December has surprised to the downside, coming in at -8.4% on a month-over-month basis. December retail sales has slowed down, coming in at -0.4%. Finally, in December, with exports contracted at a -2% pace, and imports, at -6% pace. The RBA decided to leave the cash rate unchanged at 1.5%. While it was at first stable, AUD/USD ultimately has fallen by 2% this week. Overall, we remain bearish on the AUD in the long run. The unhealthy Australian housing market coupled with very elevated debt loads, could drag residential construction and household consumption down. Moreover, the uncompetitive Australian economy could fall into a potential liquidity trap as the credit conditions tighten further. Report Links: CAD And AUD: Jumping Higher To Plunge Deeper - February 1, 2019 Waiting For A Real Deal - December 7, 2018 Updating Our Intermediate Timing Models - November 2, 2018 New Zealand Dollar Chart II-11NZD Technicals 1
NZD Technicals 1
NZD Technicals 1
Chart II-12NZD Technicals 2
NZD Technicals 2
NZD Technicals 2
The recent data in New Zealand has been negative: The participation rate underperformed expectations, coming in at 70.9%. Moreover, employment growth also surprised to the downside, coming in at 0.1%. Finally, the unemployment rate surprised negatively, coming in at 4.3%. NZD/USD has fallen by 2.3% this week. Overall, we remain bullish on the NZD against the AUD, given that credit excesses are less acute in New Zealand than in Australia. Moreover, New Zealand is much less exposed to the Chinese industrial cycle than Australia. This means that is China moving away from its current investment-led growth model will likely negatively impact AUD/NZD. Report Links: Updating Our Intermediate Timing Models - November 2, 2018 Clashing Forces: The Fed And EM Financial Conditions - October 19, 2018 In Fall, Leaves Turn Red, The Dollar Turns Green - October 12, 2018 Canadian Dollar Chart II-13CAD Technicals 1
CAD Technicals 1
CAD Technicals 1
Chart II-14CAD Technicals 2
CAD Technicals 2
CAD Technicals 2
The recent data in Canada has been negative: GDP has fallen to 1.7% on a year-over-year basis from the previous 2.2%. The December industrial production growth came in at -0.7% month-on-month, a negative surprise. Canadian manufacturing PMI in January decreased to 53. On the back of these poor data and weaker oil prices, USD/CAD rose by 1.6% this week, more than undoing last week’s fall. We expect the CAD to outperform other commodity currencies like the AUD and the NZD, oil prices are likely to outperform base metals on a cyclical basis. Moreover, the Canadian economy is more levered to the U.S. than other commodity driven economies. Thus, our constructive view on the U.S. implies a positive view on the CAD on a relative basis. Report Links: CAD And AUD: Jumping Higher To Plunge Deeper - February 1, 2019 Updating Our Intermediate Timing Models - November 2, 2018 Clashing Forces: The Fed And EM Financial Conditions - October 19, 2018 Swiss Franc Chart II-15CHF Technicals 1
CHF Technicals 1
CHF Technicals 1
Chart II-16CHF Technicals 2
CHF Technicals 2
CHF Technicals 2
Recent data in Switzerland has been mixed: Real retail sales yearly growth improved this month, coming in at -0.3% versus -0.6% last month. However, the SVME Purchasing Manager’s Index underperformed expectations, coming in at 54.3. EUR/CHF has fell 0.2% this week. Despite this setback, we remain bullish on EUR/CHF. Last year’s EUR/CHF weakness tightened Swiss financial conditions significantly and lowered inflationary pressures. Given that the Swiss National Bank does not want a repeat of the deflationary spiral of 2015, we believe that it will continue with its ultra-dovish monetary policy and increase its interventionism in the FX market, in order to weaken the franc, and bring back inflation to Switzerland. Moreover, on a tactical basis, the ease in financial conditions should hurt safe havens like the franc. Report Links: Waiting For A Real Deal - December 7, 2018 Updating Our Intermediate Timing Models - November 2, 2018 Updating Our Long-Term FX Fair Value Models - June 22, 2018 Norwegian Krone Chart II-17NOK Technicals 1
NOK Technicals 1
NOK Technicals 1
Chart II-18NOK Technicals 2
NOK Technicals 2
NOK Technicals 2
Recent data in Norway has been negative: The December retail sales missed the consensus estimates, coming in at -1.80%. December credit indicator decreased to 5.4%. Registered unemployment rate in January has increased to 2.6%, surprising to the downside. USD/NOK has risen by 1.8% this week. We are positive on USD/NOK on a cyclical timeframe. Although we are bullish on oil prices, USD/NOK is more responsive to real rate differentials. This means, that a hikes later this year by the Fed will widen differentials between these two countries and provide a tailwind for this cross. Nevertheless, the positive performance of oil prices should help the NOK outperform non-commodity currencies like the AUD. We also expect NOK/SEK to appreciate and EUR/NOK to depreciate. Report Links: Global Liquidity Trends Support The Dollar, But... - January 25, 2019 Waiting For A Real Deal - December 7, 2018 Updating Our Intermediate Timing Models - November 2, 2018 Swedish Krona Chart II-19SEK Technicals 1
SEK Technicals 1
SEK Technicals 1
Chart II-20SEK Technicals 2
SEK Technicals 2
SEK Technicals 2
Recent data in Sweden has been negative: Consumer confidence surprised to the downside, coming in at 92. Moreover, retail sales yearly growth also underperformed expectations, coming in at 5.6%. Finally, manufacturing PMI came in line with expectations at 51.5. USD/SEK has risen by 2.2% this week. Overall, we remain long term bullish on the krona against the euro, given that Swedish monetary policy is much too easy for the current inflationary environment, a situation that will have to be rectified. However, given our positive view on the U.S. dollar on a cyclical basis, we are cyclically bullish on USD/SEK, since krona is the G-10 currency most sensitive to dollar moves. Report Links: Global Liquidity Trends Support The Dollar, But... - January 25, 2019 Updating Our Intermediate Timing Models - November 2, 2018 Updating Our Long-Term FX Fair Value Models - June 22, 2018 Trades & Forecasts Forecast Summary Core Portfolio Tactical Trades Closed Trades
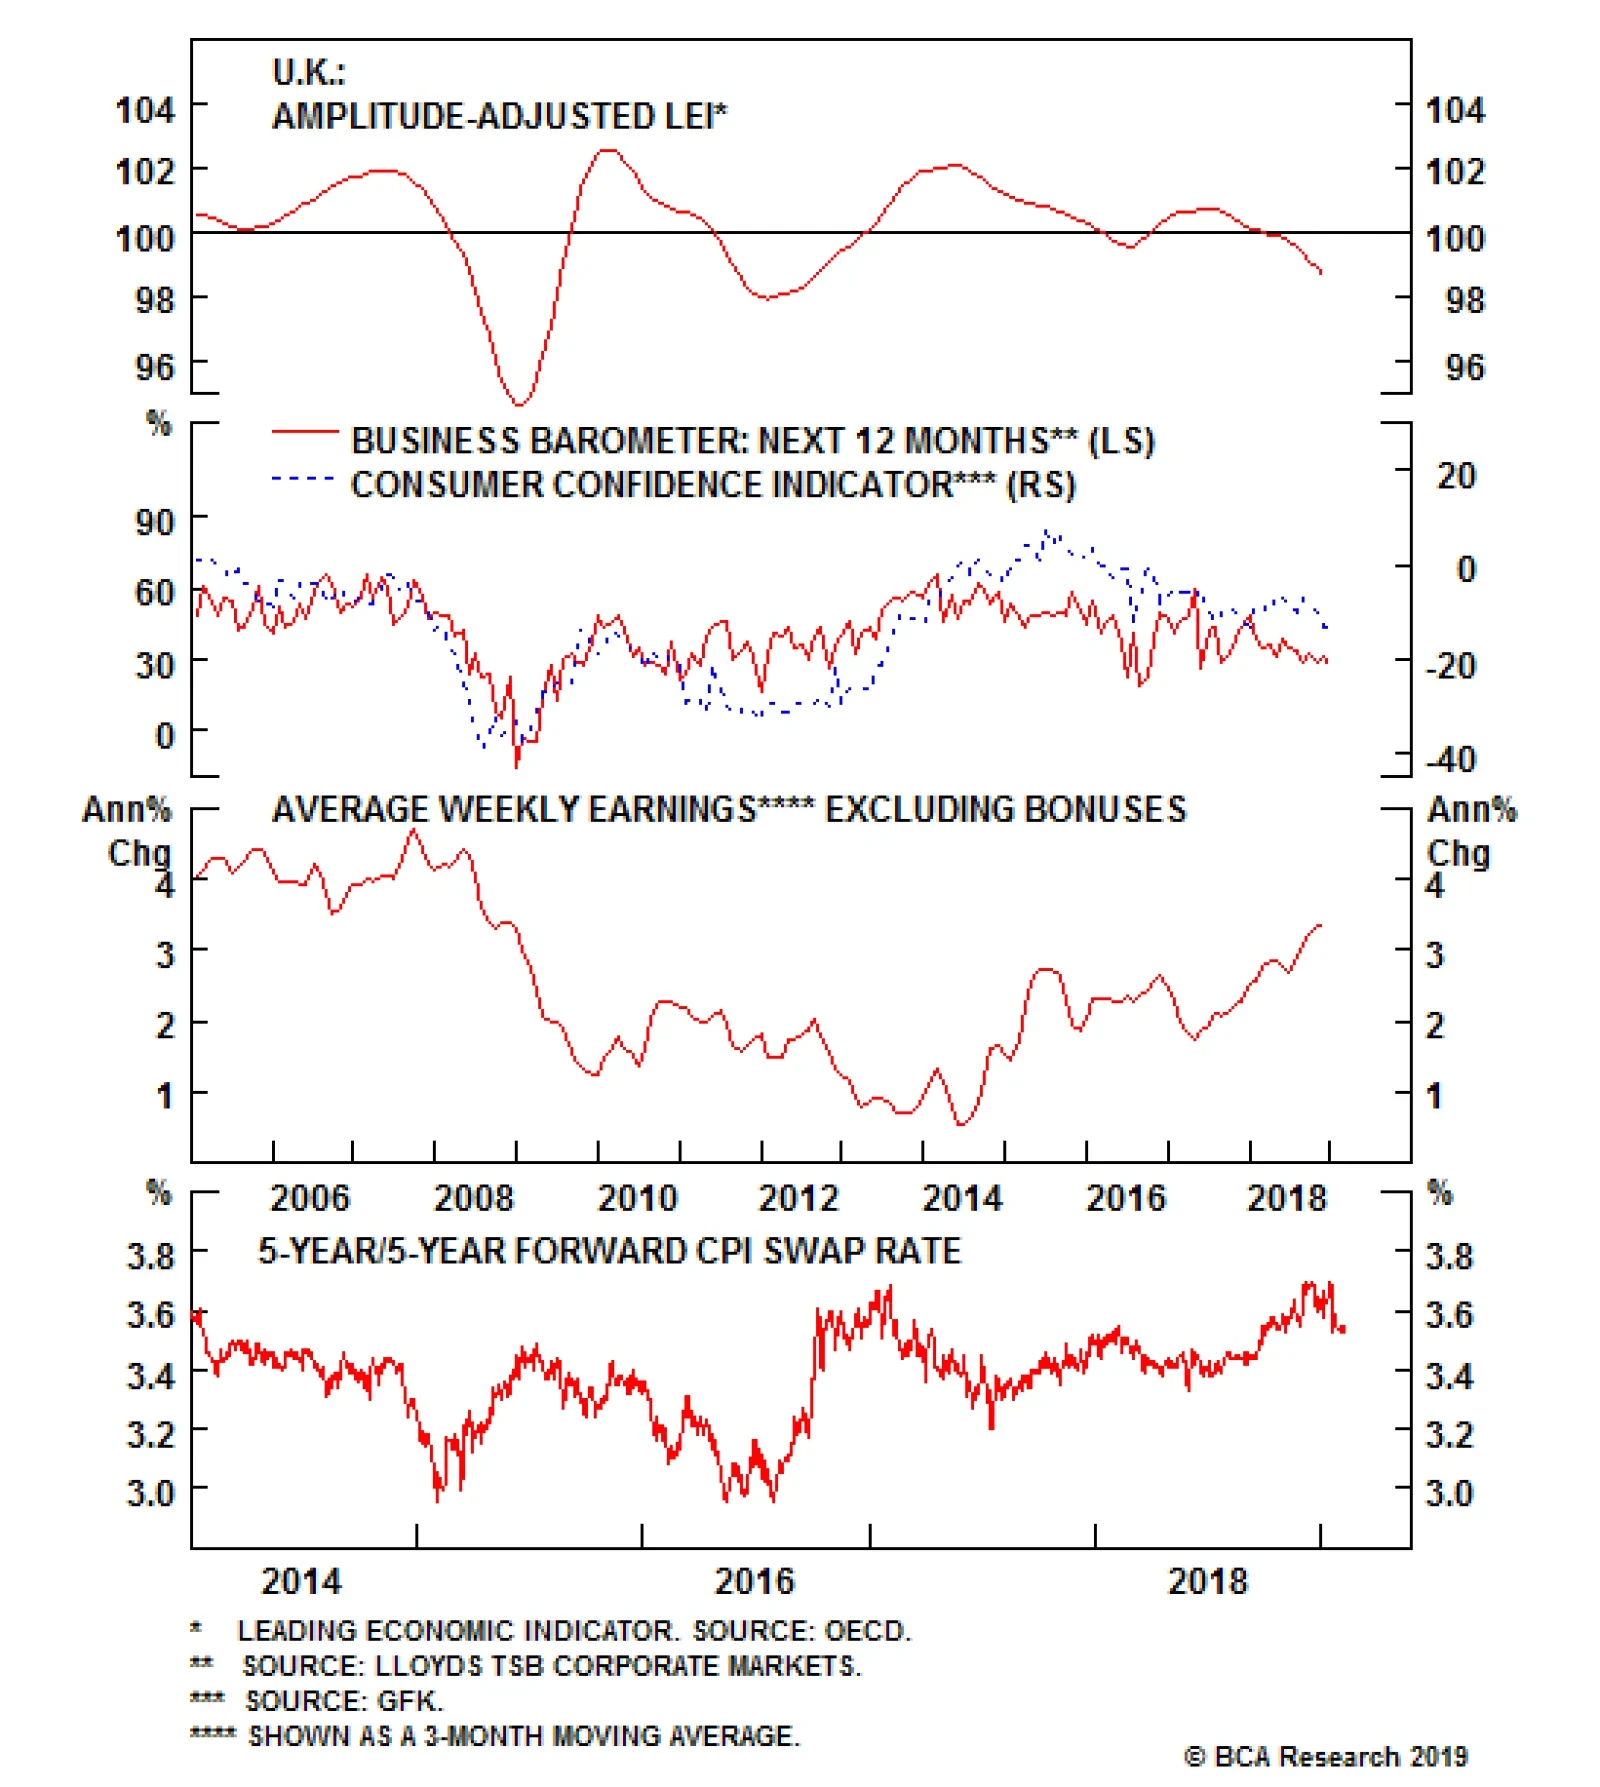
By curtailing its forecasts, the BoE acknowledged reality: The British economy is slowing. Like other central banks around the world, the BoE recognized the deterioration in global trade as a key headwind. However, it also emphasized the role of weakening…
Highlights Since 2008, no developed economy central bank has been able to hike interest rates sequentially by more than 2 percent before needing to take a breather… and then reverse course. The current vulnerability to further tightening emanates from stock markets and risk spreads. Through the next couple of years U.S. long bonds will strongly outperform German bunds… …and USD/EUR will trend lower. Since October 2017, no stock market rally or sell-off has lasted more than three months. Overweight equities tactically, but don’t get too comfortable. The broad stock market will remain trendless, but offer excellent tactical opportunities in both directions. Feature More than a decade has passed since the Global Financial Crisis. Yet through the past ten years, no developed economy central bank has been able to hike interest rates sequentially by more than 2 percent before needing to take a breather… and then swiftly reverse course. 2019 is a pivotal year for monetary policy because it will answer a fundamental question: will the 2 percent limit for monetary tightening that has held since 2008 continue to hold, or finally break? (Chart of the Week). The answer will have a huge bearing on European investment strategy for equities, bonds and currencies. Chart of the WeekSince 2008, The Limit For Sequential Rate Hikes Has Been 2 Percent... So Far
Since 2008, The Limit For Sequential Rate Hikes Has Been 2 Percent... So Far
Since 2008, The Limit For Sequential Rate Hikes Has Been 2 Percent... So Far
A History Of Policy Reversals Swedish interest rates peaked near 5 percent in 2008 before collapsing to the zero bound in the financial crisis. But when the Riksbank started its so-called ‘policy normalisation’ in 2010, the interest rate could only reach 2 percent before the central bank had to backtrack; Norway could manage just 1 percent of tightening before its volte-face. Admittedly, Sweden and Norway were caught in the maelstrom of the euro debt crisis in 2011-12. But on the other side of the world and relatively immune to the crisis in Europe, New Zealand could achieve a tightening of only 1 percent; Korea could manage just 1.25 percent (Chart I-2); the Reserve Bank of Australia marched interest rates up by 1.75 percent before taking a breather… and then marched them down again. Chart I-2Since 2008, The Limit For Sequential Rate Hikes Has Been 2 Percent
Since 2008, The Limit For Sequential Rate Hikes Has Been 2 Percent
Since 2008, The Limit For Sequential Rate Hikes Has Been 2 Percent
The Federal Reserve has sequentially raised interest rates by 2 percent, and guess what? It has just decided to take a breather! Last week, Chairman Jay Powell was asked the question as plainly as possible: is the next move in interest rates as likely to be up as down? And his answer: “we don’t have a strong prior… we will patiently wait and let the data clarify.”1 There is no requirement at BCA for strategists to agree. In fact, the opposite is true in that we encourage independent thinking and diverse ways of looking at the world. BCA’s house view is that the Fed will resume its sequential hiking later in the year. But I believe this takes a too rosy view on the global financial system’s capacity to tolerate further tightening. The Vulnerability Is In Stock Markets And Risk Spreads Monetary policy operates on an economy by adjusting its financial conditions: its bond yields, credit availability, currency, stock market, and risk spreads. And the neutral monetary policy stance – the so-called ‘neutral real interest rate’ – is the policy stance consistent with the economy growing at trend. In the past, a simple rule of thumb was that real rates, over time, should approximate to the real growth in the economy. But some studies argue that the neutral real rate may now be close to zero. All the Fed has done is bring the real interest rate out of negative territory to barely above zero. Yet its recent hikes have been blamed for extreme volatility in stock markets and risk spreads. Last week, Powell acknowledged that if there is a sustained change in financial conditions through any one or more of its components then “that has to play into our thinking.” Furthermore, “the policy stance is now in the range of the Committee’s estimates of neutral… and when you get to that (neutral) range we have to put aside our own priors and let the data speak to us.” All of which raises a salutary observation from my colleague Martin Barnes, BCA Chief Economist: if a real interest rate that is barely above zero is enough to trigger extreme market volatility and threaten the economic expansion, then the system is much more vulnerable than generally assumed.2 Martin has hit the nail on the head. At the current level of tightening, the system is much more vulnerable than generally assumed. But the vulnerable components of financial conditions are not bond yields, credit availability, or currency; the vulnerability emanates from stock markets and risk spreads, and specifically their potential for extreme volatility. Previous reports have focused on the source of this vulnerability. To recap, at low yields, bond prices develop the same unattractive negative asymmetry as equities. Therefore, an extended period of ultra-low interest rates removes the need for an equity risk premium, and justifies sharply higher valuations for equities and other risk-assets. But when the 10-year global bond yield rises back to around 2 percent, the process viciously reverses: bond prices lose their negative asymmetry, re-requiring an equity risk premium and sharply lower valuations for risk-assets.3 Put simply, when interest rates rise from low levels they undermine the support for elevated risk-asset valuations in a viciously non-linear way. The consequent plunge in risk-asset prices aggressively tightens financial conditions and thereby sets an unusually low ceiling for nominal interest rates and bond yields. This dynamic proved to be the major feature of the financial market landscape in 2018 and will loom large in 2019 too. It also solves the riddle as to why the neutral real rate may now be close to zero. An unusually low ceiling for the nominal interest rate combined with inflation hovering around 2 percent, translates into a neutral real interest rate that is not much higher than zero. The Investment Implications When the Riksbank paused after its near 2 percent of hiking, it proved to be a good structural entry point for Swedish long bonds, and a good structural exit point for the Swedish krona (Chart I-3 and Chart I-4). Likewise, when the Reserve Bank of Australia paused after its near 2 percent of hiking, it was an excellent moment to buy Australian long bonds and to sell the Australian dollar (Chart I-5 and Chart I-6). Chart I-3When The Riksbank Paused, It Was A Good Structural Entry Point In To Swedish Bonds...
When The Riksbank Paused, It Was A Good Structural Entry Point In To Swedish Bonds...
When The Riksbank Paused, It Was A Good Structural Entry Point In To Swedish Bonds...
Chart I-4...And A Good Structural Exit Point Out Of The Swedish Krona
...And A Good Structural Exit Point Out Of The Swedish Krona
...And A Good Structural Exit Point Out Of The Swedish Krona
Chart I-5When The RBA Paused, It Was A Good Structural Entry Point In To Australian Bonds...
When The RBA Paused, It Was A Good Structural Entry Point In To Australian Bonds...
When The RBA Paused, It Was A Good Structural Entry Point In To Australian Bonds...
Chart I-6...And A Good Structural Exit Point Out Of The Australian Dollar
...And A Good Structural Exit Point Out Of The Australian Dollar
...And A Good Structural Exit Point Out Of The Australian Dollar
Will the the 2 percent limit for monetary tightening that has held since 2008 continue to hold? If, as we expect, the answer is yes the implication is that through the next couple of years U.S. long bonds will strongly outperform German bunds. Over the same time frame, USD/EUR will trend lower (Chart I-7 and Chart I-8). Chart I-7A Good Structural Entry Point In To Long T-Bonds/Short Bunds
A Good Structural Entry Point in To Long T-Bonds/Short Bunds
A Good Structural Entry Point in To Long T-Bonds/Short Bunds
Chart I-8A Good Structural Exit Point Out Of USD/EUR
A Good Structural Exit Point Out Of USD/EUR
A Good Structural Exit Point Out Of USD/EUR
Finally, as regards the broad stock market, a quick glance at the MSCI all country world index shows a striking feature. Since October 2017, no rally or sell-off has lasted more than three months (Chart I-9). Given the current highly non-linear relationship between equities and bond yields, this pattern is set to continue. Chart I-9Since October 2017, No Rally Or Sell-Off Has Lasted More Than Three Months
Since October 2017, No Rally Or Sell-Off Has Lasted More Than Three Months
Since October 2017, No Rally Or Sell-Off Has Lasted More Than Three Months
In essence, the broad stock market will remain trendless, but offer excellent tactical opportunities in both directions. The current stance is tactically long, but don’t get too comfortable! Fractal Trading System* The sharp recent rally in government bonds has hit a point where tight liquidity conditions could trigger a temporary reversal. Accordingly, the 65-day trade is to go short 30-year T-bonds, setting a profit target at 3 percent with a symmetrical stop-loss. All of the five other open positions are in healthy profit. For any investment, excessive trend following and groupthink can reach a natural point of instability, at which point the established trend is highly likely to break down with or without an external catalyst. An early warning sign is the investment’s fractal dimension approaching its natural lower bound. Encouragingly, this trigger has consistently identified countertrend moves of various magnitudes across all asset classes. Chart I-10
Short U.S. 30 year T-Bond
Short U.S. 30 year T-Bond
The post-June 9, 2016 fractal trading model rules are: When the fractal dimension approaches the lower limit after an investment has been in an established trend it is a potential trigger for a liquidity-triggered trend reversal. Therefore, open a countertrend position. The profit target is a one-third reversal of the preceding 13-week move. Apply a symmetrical stop-loss. Close the position at the profit target or stop-loss. Otherwise close the position after 13 weeks. Use the position size multiple to control risk. The position size will be smaller for more risky positions. Dhaval Joshi, Senior Vice President Chief European Investment Strategist dhaval@bcaresearch.com * For more details please see the European Investment Strategy Special Report “Fractals, Liquidity & A Trading Model,” dated December 11, 2014, available at eis.bcaresearch.com Footnotes 1 The Federal Reserve has raised the federal funds rate by a total of 2.25 percent comprising an isolated 0.25 percent hike at the end of 2015 and a sequential 2 percent hike from December 2016 through December 2018. 2 Please see the BCA Special Report “A Grumpy View Of The Outlook” January 28, 2019 available at www.bcaresearch.com 3 Please see the European Investment Strategy Weekly Report “Risk: The Great Misunderstanding Of Finance”, October 25, 2018 available at eis.bcaresearch.com Fractal Trading System Recommendations Asset Allocation Equity Regional and Country Allocation Equity Sector Allocation Bond and Interest Rate Allocation Currency and Other Allocation Closed Fractal Trades Trades Closed Trades Asset Performance Currency & Bond Equity Sector Country Equity Indicators Bond Yields Chart II-1Indicators To Watch - Bond Yields
Indicators To Watch - Bond Yields
Indicators To Watch - Bond Yields
Chart II-2Indicators To Watch - Bond Yields
Indicators To Watch - Bond Yields
Indicators To Watch - Bond Yields
Chart II-3Indicators To Watch - Bond Yields
Indicators To Watch - Bond Yields
Indicators To Watch - Bond Yields
Chart II-4Indicators To Watch - Bond Yields
Indicators To Watch - Bond Yields
Indicators To Watch - Bond Yields
Interest Rate Chart II-5Indicators To Watch - Interest Rate Expectations
Indicators To Watch - Interest Rate Expectations
Indicators To Watch - Interest Rate Expectations
Chart II-6Indicators To Watch - Interest Rate Expectations
Indicators To Watch - Interest Rate Expectations
Indicators To Watch - Interest Rate Expectations
Chart II-7Indicators To Watch - Interest Rate Expectations
Indicators To Watch - Interest Rate Expectations
Indicators To Watch - Interest Rate Expectations
Chart II-8Indicators To Watch - Interest Rate Expectations
Indicators To Watch - Interest Rate Expectations
Indicators To Watch - Interest Rate Expectations
Our diffusion indices show that the vast majority of euro area countries are now suffering slowing real GDP growth and falling PMIs, flashing levels normally recorded during recessions. Yet the actual pullbacks in real GDP growth and the PMIs have been…
Highlights So What? The late-cycle rally faces non-trivial political hurdles. Why? The rally is based on a too-sanguine view of the Fed, China, and the trade war. Other issues – like Brexit and the U.S. border showdown – are also problematic. Venezuela still has the potential to push oil prices sharply upwards. Feature All is well. Global equities are on the path of recovery, as should be the case at the end of an economic cycle. The U.S. S&P 500 has gained 16% since the bottom on December 24, with healthy technicals suggesting a breakout is ahead (Chart 1). The S&P 500 may be entering one of its typical late-cycle rallies, which tend to be the second best-performing decile of a bull market (Chart 2).1 Meanwhile, emerging market equities and currencies are outperforming developed market peers (Chart 3), a reversal from 2018 Chart 1Late Cycle Rally Ahead?
Late Cycle Rally Ahead?
Late Cycle Rally Ahead?
Chart 2
Chart 3...As Does Current Global Outperformance
...As Does Current Global Outperformance
...As Does Current Global Outperformance
Typically, global risk assets outperform American risk assets at the end of an economic cycle. While institutional investors can use these rallies to lighten the load ahead of a recession, most investors cannot afford to miss such a rally. As such, BCA (and others) are calling for investors to play what is expected to be a yearlong rally in global risk assets and the S&P 500. Our view at BCA Geopolitical Strategy is more cautious, perhaps because it is informed by a methodological bias rooted in geopolitics. We believe that the reversal in U.S. outperformance relative to global risk assets rests on three pillars: The Federal Reserve remains dovish throughout 2019; China begins a major reflationary effort; The U.S.-China tariff truce results in a trade deal. In addition, a consensus is emerging that a “no deal” Brexit will not occur, that U.S. polarization cannot get worse, and that President Trump eschews foreign interventionism. While we hold a nuanced view on each of these assertions, the mix is far less bullish than investors may think. We see a witches’ brew of factors that is murky at best and bearish at worst. The Three Pillars Of The Bullish View Before we turn to geopolitics, let us examine the three pillars underpinning the bullish view. Our colleague Peter Berezin, BCA’s Chief Global Strategist, remains bullish on the U.S. economy and expects the Fed to resume hiking rates by mid-year.2 The Conference Board’s Leading Credit Index remains in expansionary territory (Chart 4). While business capex intention surveys have come off their highs, they still point to robust spending plans over the next few quarters (Chart 5). Chart 4Little Sign Of A Looming Credit Crunch
Little Sign Of A Looming Credit Crunch
Little Sign Of A Looming Credit Crunch
Chart 5Capex Plans Still Solid
Capex Plans Still Solid
Capex Plans Still Solid
It is no surprise that the BCA Fed Monitor continues to suggest that “tighter monetary policy is required” (Chart 6). This is a far cry from 2016, when our indicator was in deeply “tightening” territory and the Fed paused for 12 months. If we compare 2019 to 2016, it is difficult to see how the market expectation of 4.72 bps of rate cuts will occur over the next 12 months (Chart 7). Of the three components that make up the BCA Fed Monitor, only the financial conditions have fallen into “easing required” territory (Chart 8), and they are already shifting back to “tightening required” territory with the stock market rally underway (Chart 9). Chart 6A Hawkish Fed Is Needed
A Hawkish Fed Is Needed
A Hawkish Fed Is Needed
Chart 7
Chart 8BCA Fed Monitor Calls For Tighter Policy
BCA Fed Monitor Calls For Tighter Policy
BCA Fed Monitor Calls For Tighter Policy
Chart 9Financial Conditions Starting To Ease
Financial Conditions Starting To Ease
Financial Conditions Starting To Ease
In addition, in 2016 the Fed was not contracting its balance sheet. Today it is doing so, although the pace has moderated. As such, the Fed’s rate hike pause is occurring amidst an ongoing effort to normalize monetary policy and to transfer rate risks back to the private sector. By chance, this is also occurring at a time when the Treasury Department must issue more debt to cover a larger deficit, a process that could significantly pull U.S. rates higher and, by extension, yields on assets further down the risk curve. This would be a particular problem for global risk assets given the exposure of several EM economies to dollar-denominated debt. The bottom line for investors is that a rate hike pause is not a pause in the overall hawkish policy of the U.S. Fed, which acts as a global central bank. The fall in the amount of dollars available for the international financial system acts as a brake on growth. Over the past 10 years, each time money supply growth fell below the loan uptake of the U.S. corporate sector, BCA’s Global Industrial Activity Nowcast, BCA’s Global Leading Economic Indicator, Korean exports, and global export prices all deteriorated considerably (Chart 10). Chart 10Deteriorating Excess Liquidity Hurts Global Growth
Deteriorating Excess Liquidity Hurts Global Growth
Deteriorating Excess Liquidity Hurts Global Growth
Our muted view on Chinese reflation is unnecessary to repeat here. There is no doubt that Chinese policymakers are stimulating the economy, but the question is whether they are willing to pull the credit lever as aggressively as they have done in the past (Chart 11).So far, all of the evidence we have reviewed point to a cautious effort to stabilize growth, not reflate the entire planetary economy as Beijing did in 2016. If our BCA House View on the Fed is correct, a tepid Chinese effort to stimulate the domestic economy will fall short of lighting the flame of a global risk rally in 2019. Chart 11Compare Any Stimulus To Previous Efforts
Compare Any Stimulus To Previous Efforts
Compare Any Stimulus To Previous Efforts
The BCA China Play Index, which in the past has tracked EM vs. DM equity outperformance, is sending mixed signals today (Chart 12). Enthusiasm for global risk assets has not been confirmed by the most China-sensitive plays. Chart 12Mixed Signals From China-Sensitive Plays
Mixed Signals From China-Sensitive Plays
Mixed Signals From China-Sensitive Plays
Finally, there is the trade truce that should produce a trade deal. The logic is clear: President Trump sets aside the political constraints working against a deal and focuses on ensuring that he wins 2020 by avoiding a recession. The near bear market in the S&P 500 was a game changer that focused the White House on averting any further downside to markets and the economy from the trade war. But if the current rally proves that the selloff in December was a temporary pullback, the White House may be emboldened to play hard-to-get with China. After all, the electorate is generally supportive of getting tough on China (Chart 13) and there is no demand from either Trump voters or Democrats for a quick deal. The Fed pause and lower oil prices also give Trump some space to push negotiations a bit harder.
Chart 13
Already there are leaks from the negotiations that the U.S. is asking for a lot from China, which could prolong the talks. This includes genuine structural changes to the economic relationship that would address long-standing U.S. concerns of forced technology transfers, intellectual property theft, and foreign investor access to the Chinese domestic market. It also includes U.S. demands that these changes be verifiable and enforceable. China is likely to balk at some of the U.S. demands, particularly if the U.S. is indeed pushing for regular reviews of China’s progress, a condition that implicitly creates a hierarchy between the two economies and would thus represent a loss of face for Beijing.3 Table 1 presents our latest expectations of where the U.S. and China will be on March 1. We assign only 10% each to “black and white” outcomes, a “Grand Compromise” and “No deal, with major escalation.” The remaining 80% is divided between “mushy” outcomes, including a 25% probability that negotiations simply continue. Table 1Updated U.S.-China Trade War Probabilities
Witches' Brew: How Geopolitical Risks May Short-Circuit The Late-Cycle Rally
Witches' Brew: How Geopolitical Risks May Short-Circuit The Late-Cycle Rally
How would the market react to such uncertain outcomes? We think that almost anything other than a “Grand Compromise” would be greeted with limited relief, if not outright market correction. A vaguely positive meeting between Presidents Trump and Xi, and a memorandum of understanding, would not remove long-term risks in the relationship, especially if the parallel “tech war” is not resolved. On top of the ongoing U.S.-China negotiations, there is one remaining trade issue that investors should keep in mind: auto tariffs. The Section 232 investigation into whether auto imports are a national security threat is ongoing and U.S. authorities are expected to present their conclusions on February 17. We fear that the Trump administration could still stage a surprise and impose tariffs on auto imports. This is because the just-concluded NAFTA deal likely raised the cost of vehicle production within the trade bloc, necessitating import tariffs in order for the deal to make sense from President Trump’s set of political priorities. An extended truce with China could provide the opportunity. The Trump administration may not have the stomach for a long-term trade war with Europe, but the timing of this decision could upset the market’s perception of Trump’s commitment to free trade once again. Bottom Line: The conventional narrative is that global markets are experiencing a late-cycle rally, one that is worth playing given its usual duration and amplitude. This view rests on three pillars: that the Fed has backed off from tightening, that China is stimulating in earnest, and that the trade deal will produce a definitive outcome. We fear that all three pillars are shaky. First, the Fed is not easing. Its balance sheet contraction process, which is ongoing, is a form of tightening. And the U.S. economy remains healthy. As such, the expectation of a 12-month Fed pause is overly optimistic. Second, China is stimulating, but only tepidly. Third, “black and white,” definitive outcomes are unlikely in the U.S.-China negotiations. In fact, more protectionism could be around the corner if U.S.-China tech issues continue to flare or if the U.S. announces the conclusion of its investigation into auto imports. Geopolitical Factors To Monitor Aside from shaky pillars, markets will also have to contend with several uncertain geopolitical processes this year. While we are not necessarily bearish on each one, we are concerned that the collective investment community is overly bullish. Take Brexit. We agree with the conventional view that the chances of a no-deal Brexit outcome are below 10%. Political betting markets have only priced in an actual exit on March 29, which is in ink in British legislation, at just above 30% (Chart 14). Chart 14Online Betters Expect A Brexit Delay
Online Betters Expect A Brexit Delay
Online Betters Expect A Brexit Delay
The problem is not with the conventional view but with its timing. While Prime Minister Theresa May will ultimately be forced to extend the Article 50 deadline, it may take a lot of brinkmanship and eleventh hour negotiations to do so. Getting from here – collective bullishness – to there – an actual extension of Article 50 – may require a downturn in GBP/USD or other U.K. assets. Furthermore, several scenarios could produce a downturn in GBP/USD (Diagram 1). For example, the Labour Party remains neck-and-neck with the Tories in the polls, despite being led by the most left-leaning leader since the 1970s. Although a new election that produces a Labour government would likely reduce the odds of Brexit eventually occurring, it would raise the odds of Corbyn pursuing unorthodox economic policy while also trying to negotiate his own version of Brexit with the EU. Diagram 1Brexit: The Path To Salvation Remains Fraught With Dangers
Witches' Brew: How Geopolitical Risks May Short-Circuit The Late-Cycle Rally
Witches' Brew: How Geopolitical Risks May Short-Circuit The Late-Cycle Rally
The point is that it is tough to recommend that investors close their eyes and buy GBP/USD, no matter how cheap the currency may look, unless one has a very long time horizon and a high threshold for pain. The second issue where we take a more nuanced position is the ongoing U.S. executive-legislative standoff over the border. The government shutdown is only on pause until February 15. The House Democrats are demanding that a solution be found by Friday, February 8 if it is to be voted on in time. Meanwhile President Trump’s popularity is in the doldrums (Chart 15). His supporters note that President Reagan was even less popular at this point in his term, but that is because unemployment hit 10.4% in January 1983 (Chart 16). The grave risk for President Trump is that he is as unpopular as Reagan, even though unemployment is at 4% and the U.S. economy is on fire. Chart 15President Trump Is Unpopular...
President Trump Is Unpopular...
President Trump Is Unpopular...
Chart 16...And It Can't Be Blamed On Unemployment
...And It Can't Be Blamed On Unemployment
...And It Can't Be Blamed On Unemployment
As such, the real risk is not another shutdown, but rather political dysfunction in Congress that imperils the legislative process. The current two-year budget deal, which raised spending levels in January 2018, is set to expire when the FY2019 ends. Democrats and Trump have to come to an agreement to avert the “stimulus cliff” expected in 2020 (Chart 17). If they cannot conclude the border issue and the FY2019 appropriations, then Trump may declare a national emergency (or act unilaterally in other ways) and spark a new conflict with the courts. He could also threaten not to raise the debt ceiling in spring or summer. This is not an atmosphere in which a FY2020 deal looks very easy. Chart 17Stimulus Cliff Ahead
Stimulus Cliff Ahead
Stimulus Cliff Ahead
Ultimately, we expect Democrats to succumb to the pressure from their voters for more spending. But a total failure to cooperate is a risk. Furthermore, the greatest political risk in the U.S. is that the 2020 election will not be contested on the same issues as in 2016: trade and immigration. Instead, income inequality is rearing its head, as Democratic candidates jostle for attention and as they test various messages on focus groups. If income inequality catches fire as the issue of 2020, we will know it soon. And it may begin to impact the markets as Democrats begin to campaign on, for instance, reversing President Trump’s income tax cuts. While the market may ignore headline election risks for some time, we do not think that non-financial corporates can do the same. Any hint that President Trump’s pro-business policies will be reversed could send shivers down the spines of CEOs and negatively impact capex intentions, hurting the real economy well before the next election. Finally, there is the issue of foreign policy. President Trump has abandoned his maximum pressure tactic on Iran and has begun withdrawing the remaining troops in the Middle East. These trends are likely to continue in 2019 as President Trump focuses on China and lesser issues like Venezuela. There is one important area of alignment between him and the defense and intelligence community, notwithstanding recent scuffles: less focus on the Middle East means more focus on Asia and specifically China. However, President Trump is facing a dilemma. Despite an extraordinary economic performance, his popularity remains in the doldrums. When faced with similar situations in the past, presidents far more orthodox than Trump have sought relevance abroad, by means of military interventions. A convenient opportunity has presented itself in Venezuela, where a revolution against Chavismo could give the U.S. an opening to intervene. On paper, we see how such a scenario could look appealing for a quick, and relatively painless, intervention. The problem is that it could also get messy and, in the analysis of BCA’s Commodity & Energy Strategy, raise oil prices to nearly $100 per barrel by mid-year if a total loss of Venezuelan production ensues (Chart 18). This is a non-negligible risk. Chart 18A Venezuela Collapse Could Send Brent Crude Prices Toward $100/Bbl
A Venezuela Collapse Could Send Brent Crude Prices Toward $100/Bbl
A Venezuela Collapse Could Send Brent Crude Prices Toward $100/Bbl
Bottom Line: Geopolitical risks still abound. We are not alarmist. However, there is little reason to believe that Brexit, U.S. polarization, U.S.-China tensions, or a potential U.S. intervention in Venezuela will end painlessly for the market. An unpopular U.S. president is seeking to remain relevant and a global populist wave is continuing to create unorthodox and anti-establishment policy prescriptions. Given that the current rally is supported by three shaky pillars, any one of these geopolitical risks could catalyze a relapse, the history of late-cycle rallies be damned. Marko Papic, Senior Vice President Chief Geopolitical Strategist marko@bcaresearch.com Matt Gertken, Vice President Geopolitical Strategy mattg@bcaresearch.com Footnotes 1 Please see BCA U.S. Investment Strategy Weekly Report, “Late-Cycle Blues,” dated October 29, 2018, available at usis.bcaresearch.com. 2 Please see BCA Global Investment Strategy Weekly Report, “Patient Jay,” dated January 18, 2019, available at gis.bcaresearch.com. 3 Please see Reuters, “Exclusive: U.S. demands regular review of China trade reform,” dated January 18, 2019, available at reuters.com. Geopolitical Calendar
Highlights Fed Policy: The Fed’s move to a more dovish posture is positive for global risk assets in the near-term. This is setting up for a revival of volatility later in 2019, however, with U.S. growth unlikely to slow enough to justify a continuation of the Fed’s dovish stance. With the market now discounting no change in Fed policy rates over the next year, the risks for U.S. Treasury yields are now tilted to the upside. ECB Policy: Growth has slowed in Europe, but the ECB is limited in its ability to ease policy further given tight labor markets and rising wage growth. Policy rates will stay on hold over at least the next year. U.S. & European Duration: Keep global duration exposure below benchmark, with a more defensive stance on U.S. Treasuries over German Bunds given that the Treasury-Bund spread has overshot to the downside. Feature “In fact, our policy works through changing financial conditions, so it’s sort of the essence of what we do” – Federal Reserve Chairman Jerome Powell Have central bankers now turned TOO dovish? That is a question that will be answered in the coming weeks and months after the Federal Reserve and European Central Bank (ECB) signaled a more cautious outlook on growth and inflation. Both central banks cited common causes for the increased caution, such as financial market instability related to geopolitical uncertainty (U.S.-China trade tensions, Brexit, the U.S. government shutdown). Importantly, neither the Fed nor ECB expressed conviction that monetary policy settings were now too restrictive. The sharp selloff in global stock and credit markets at the end of 2018 did tighten financial conditions which, in and of itself, should result in slower growth on either side of the Atlantic in the first half of 2019 (Chart of the Week). Yet we do not expect a move to a below-trend pace of growth that would trigger rising unemployment and weaker inflation pressures. Chart of the WeekFed Too Dovish, ECB Not Dovish Enough
Fed Too Dovish, ECB Not Dovish Enough
Fed Too Dovish, ECB Not Dovish Enough
The shift to a more dovish posture by the Fed and ECB has already induced some easing of financial conditions to help support growth in the U.S. and Europe until the uncertainties over geopolitics and the Chinese economy are resolved. This appears to be providing more stimulus to economies that may not necessarily need it. That is a risk that policymakers have decided to take to protect against the downside tail risks to economic growth and confidence from global uncertainty. In terms of fixed income markets, more dovish policymakers have created a pro-risk backdrop that will support the outperformance of corporate bonds versus government debt over the next 3-6 months. Without a deeper slowdown of global growth beyond what is currently expected, however, this will only be a temporary respite as central banks revert back to fighting inflation pressures instead of calming financial markets. The result will be a return to monetary tightening and higher bond yields, although that is a far more likely scenario in the U.S. than in Europe over the next 6-12 months given the relative signals from our Central Bank Monitors (bottom panel). Fed Outlook – A Temporary Dovish Turn, Nothing More The quote at the beginning of this report was taken from Fed Chair Powell’s press conference after last week’s FOMC meeting, in response to a question on how the Fed thinks about financial conditions. We can think of no cleaner way to explain the Fed’s understanding of how its monetary policy actions get transmitted to the real economy. By inducing changes in financial asset values (equity prices, corporate bond yields, the value of the U.S. dollar) through adjustments in the fed funds rate – and perceptions about its forward path – the Fed is able to impact the cost of financing across much of the U.S. economy. The goal is either to slow or stimulate growth, as needed, to allow the Fed to reach its dual mandate of maximizing employment while keeping inflation stable. Viewed from this perspective, the Fed’s “dovish” turn last week was a necessary step to not only stabilize financial markets, but to induce a pro-growth rally in risk assets that had sold off too aggressively. On that front, the Fed can say “Mission Accomplished”. Year-to-date, the S&P 500 is up 8% while U.S. investment grade and high-yield corporate bond spreads have fallen by 26bps and 110bps, respectively. The U.S. dollar is also down 1.6% since the start of the year, providing further stimulus to the U.S. economy. U.S. Treasury yields, which had fallen thanks to lower real and inflation components, have also helped ease financial conditions. Real yields have declined as the market has moved to price out all Fed rate hikes for 2019 in response to some signs of cooling U.S. growth (i.e. housing) and the big fall in asset prices. At the same time, inflation expectations have drifted lower as markets now expect the plunge in oil prices seen in 2018 to filter though more broadly into lower realized inflation (Chart 2). Chart 2Too Much Pessimism In UST Yields
Too Much Pessimism In UST Yields
Too Much Pessimism In UST Yields
The ability for yields to decline further is now limited, however, with U.S. economic growth likely to continue at an above-trend pace in the next few quarters, based on the readings from reliable indicators. The ISM Manufacturing index rebounded to 56.6 in January, still well above the 50 level indicating an expanding U.S. economy, even after the decline that began last September. Within the sub-components of the index, the New Orders series also rose last month by 6.9 points, suggesting that the bounce in the overall ISM series could persist. The 10yr UST yield broadly tracks the ISM Manufacturing index (Chart 3), with the post-crisis relationship indicating that the bond yield will have difficulty falling below 2.5% if the ISM remains above 55. Chart 3U.S. Treasuries Vulnerable To Better U.S. Data
U.S. Treasuries Vulnerable To Better U.S. Data
U.S. Treasuries Vulnerable To Better U.S. Data
U.S. economic data continues to broadly meet expectations, and the momentum in U.S. Treasury yields has overshot to the downside versus data surprises (bottom panel). Admittedly, there have been far fewer data releases of late because of the U.S. government shutdown last month. Yet even if the bulk of the unreleased data was weak, Treasury yields at current levels already seem to be discounting very soft growth. Forward-looking indicators of growth - the Conference Board leading economic indicator and BCA’s U.S. employment and capital spending models – are all pointing to the U.S. economy continuing to expand at a solid, above-trend pace in the coming months (Chart 4). Chart 4No Signs Pointing To Slower U.S. Growth
No Signs Pointing To Slower U.S. Growth
No Signs Pointing To Slower U.S. Growth
The U.S. labor market remains tight, as evidenced by continued low unemployment and solid growth in wage measures like Average Hourly Earnings and the Wages and Salaries component of the Employment Cost Index (Chart 5). At the same time, readings from leading inflation indicators like the New York Fed’s Underlying Inflation Gauge remain elevated (bottom panel). The combined message is that U.S. core inflation rates will remain surprisingly sticky in the coming months, even given the lagged impact of last year’s drop in oil prices. Chart 5Persistent U.S. Inflation Pressures
Persistent U.S. Inflation Pressures
Persistent U.S. Inflation Pressures
Many have made the case that the current cycle looks a lot like the Fed’s 2016 pause on policy tightening, which ended up lasting one full year after the December 2015 initial post-QE rate hike. Back then, the Fed’s more dovish posture helped generate easier financial conditions through a weaker U.S. dollar, tighter U.S. corporate credit spreads and higher U.S. equity values. U.S. Treasury yields fell sharply as the market aggressively covered a large bearish tilt towards U.S. interest rates while removing all rate hikes that were discounted for 2016 (Chart 6). There is one major difference between then and now, however – the U.S. economy is growing at a much faster pace, with far less spare capacity (bottom panel). Chart 6This Is NOT A Repeat Of 2016
This Is NOT A Repeat Of 2016
This Is NOT A Repeat Of 2016
When looking at all the U.S. data objectively, we conclude that the Fed’s latest dovish turn will not last anywhere near as long as the 2016 episode. The current easing of U.S. (and global) financial conditions alongside still-solid U.S. growth will eventually set up a return to the Fed rate hiking cycle, at a time when no interest rate increases are discounted in U.S. money markets. This supports our current recommendation to be tactically overweight U.S. corporate debt versus U.S. Treasuries on a 3-6 month horizon, during this window when the Fed is deliberately easing financial conditions by being overly dovish. On a more medium term 6-12 month horizon, however, we are maintaining a below-benchmark stance on U.S. duration exposure. The only way Treasury yields can move lower from here is if a Fed rate cutting cycle starts to be discounted – a highly unlikely scenario given the signals from leading growth and inflation indicators. Bottom Line: The Fed’s move to a more dovish posture is positive for global risk assets in the near-term. This is setting up for a revival of volatility later in 2019, however, with U.S. growth unlikely to slow enough to prevent inflation pressures from surfacing. With the market now discounting a stand-pat Fed over the next year, with minimal expected inflation, the risks for U.S. Treasury yields are now tilted to the upside. ECB Outlook – Firmly Neutral The euro area is currently facing a fairly significant growth slowdown. The manufacturing PMI has fallen for 13 consecutive months and now sits just above the 50 line indicating expanding growth. The OECD’s leading economic indicator (LEI) has also declined over that same period. Both indicators are now back to levels last seen prior to the 2009 and 2012 recessions (Chart 7). Chart 7Euro Area LEI and PMI Overstating The Downturn?
Euro Area LEI and PMI Overstating The Downturn?
Euro Area LEI and PMI Overstating The Downturn?
Yet at the same time, surveys of business and consumer confidence from the European Commission suggest that the current downturn is nothing like those previous slumps. Even the Commission’s indicator of exporter order books (bottom panel) suggests that things do not appear as bad as indicated by the PMI and LEI. So where does the truth lie about the euro area economy? When looking at the hard data on exports (using the IMF’s Direction of Trade statistical database that includes both goods and services), it is obvious that there was a sharp slowing of euro area exports last year (Chart 8). Slumping Chinese demand was a major reason for that slowdown, but exports to the rest of the world also took a major hit. For the more export-intensive economies of Europe, last year’s global growth deceleration was a major punch to the gut. Chart 8European Export Shock Should Bottom Out Later In 2019
European Export Shock Should Bottom Out Later In 2019
European Export Shock Should Bottom Out Later In 2019
Looking ahead, there is still likely to be some pain coming from weaker export demand in the first half of 2019. The Chinese credit impulse (measured as a 12-month change in Total Social Financing as a % of GDP) is still negative, while our global LEI measure continues to drift lower. However, there are some tentative signs that things may be stabilizing. The shorter 6-month China credit impulse has hooked up (the “x’ in the top panel of Chart 8). Our diffusion index of countries within our global LEI – itself a leading indicator of the global LEI – has also begun to move higher, meaning there are fewer countries within the euro area with falling LEIs. While it is still too early to draw firm conclusions, there is a chance that euro area export growth will bottom out by mid-year. This is especially true if a U.S.-China trade detente is soon reached and Chinese policymakers deliver some additional growth stimulus measures, which is BCA’s base case scenario. ECB President Mario Draghi noted last week that a stabilization of global trade tensions would reduce much of the perceived uncertainty within the euro area economy. The U.S.-China trade spat has not been the only thing weighing on euro area growth, though. In our framework for analyzing the ECB’s policy decisions, we look at how broad-based are the trends in growth and inflation within the euro area to determine the next likely move on monetary policy. The way we do that is by looking at diffusion indices of economic data, constructed using figures from as many euro area countries as possible, given data availability. We show those diffusion indices for real GDP growth, manufacturing PMIs, headline inflation and core inflation in the euro area in Chart 9. Chart 9No Pressure On The ECB To Adjust Interest Rates
No Pressure On The ECB To Adjust Interest Rates
No Pressure On The ECB To Adjust Interest Rates
The diffusion indices show that the vast majority of euro area countries are now suffering slowing real GDP growth and falling PMIs, with levels seen during recessions. Yet the actual pullbacks in real GDP growth and the PMIs have been shallower than those past episodes. It is as if today, all countries are suffering a slump, but no deep downturn. This is consistent with the ECB’s belief that Europe has suffered a bunch of one-off triggers for slowing growth – cutbacks in German auto production related to new emission standards, large-scale French street protests, the Italian fiscal policy debate with the EU, slowing exports from global trade tensions – but no broad-based decline that can be attributed to, or solved by, monetary policy. This is especially true with the diffusion index for core euro area inflation which now rising, suggesting that core inflation could remain surprisingly sticky in the coming months. The diffusion indices for euro area labor markets provide additional information as to why the ECB has not shifted to an even more dovish stance, despite the signs of weaker growth. Not only is the overall euro area unemployment rate now below the OECD’s estimate of the full employment NAIRU, the vast majority of countries within the euro area are at full employment (Chart 10). That diffusion index correlates strongly with a traditional Taylor Rule estimate of the equilibrium ECB policy rate, and suggests that the ECB should be raising rates right now. That can also be seen in the diffusion index for wage growth (bottom panel), which shows that the majority of euro area countries are seeing higher wage inflation. Chart 10Tightening Labor Markets In Europe
Tightening Labor Markets In Europe
Tightening Labor Markets In Europe
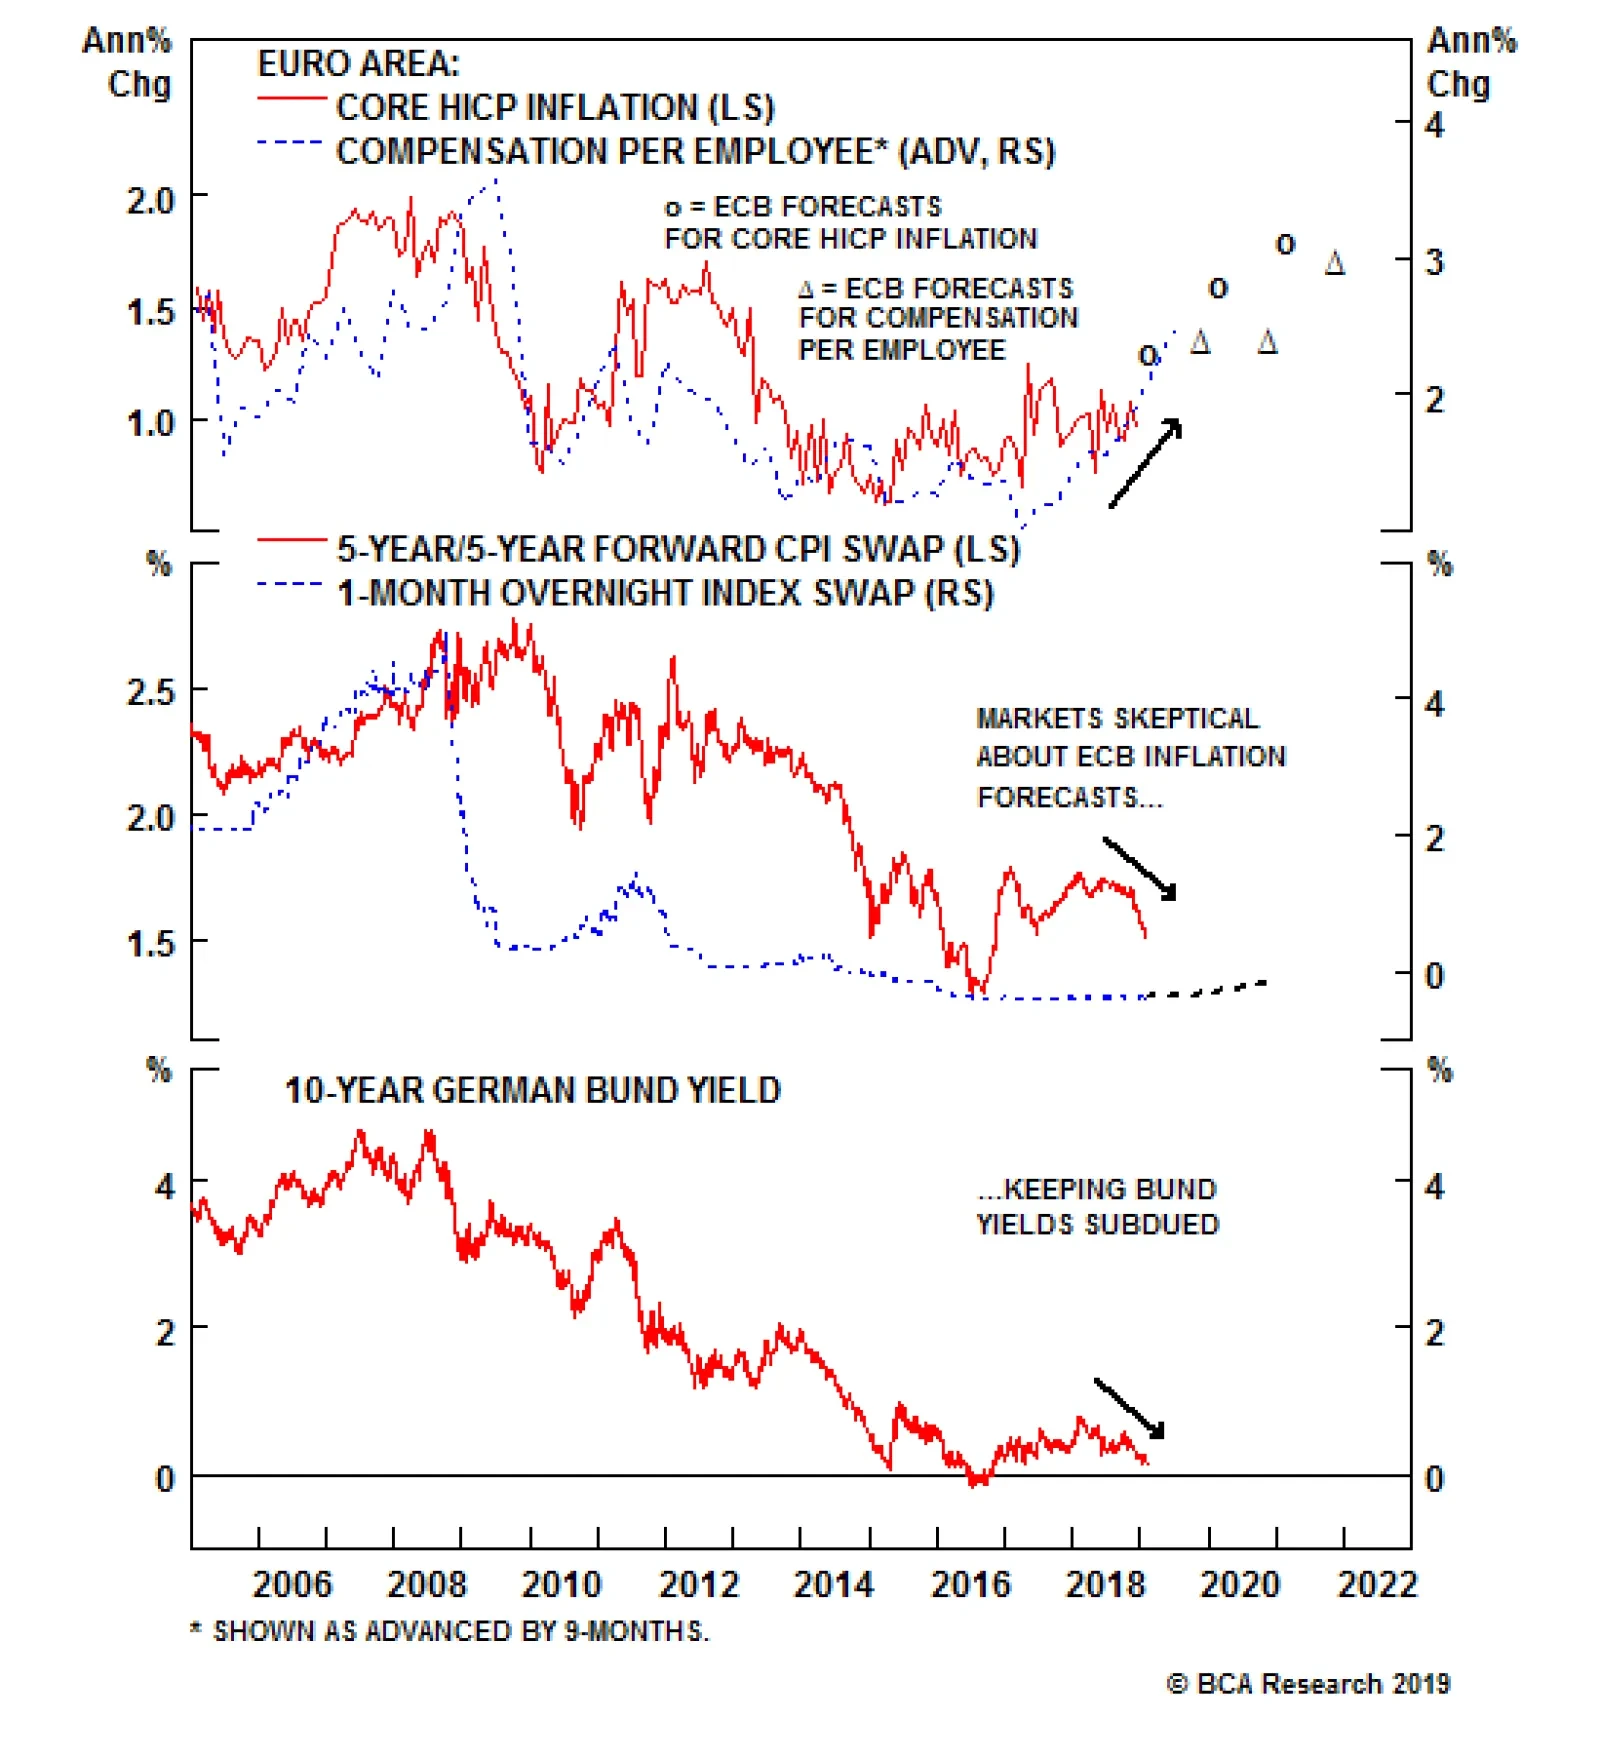
Given the readings on the core inflation and labor market related diffusion indices, the current backdrop is not one where the ECB should be shifting to a more dovish posture. Yet when looking at market-based measures of inflation expectations like CPI swaps, investors clearly do not believe that the ECB’s optimistic inflation forecasts will be achieved over the next two years – typically a sign of policy settings that appear too tight (Chart 11). Chart 11Bund Yields Will Stay Subdued Without More Euro Area Inflation
Bund Yields Will Stay Subdued Without More Euro Area Inflation
Bund Yields Will Stay Subdued Without More Euro Area Inflation
It will require some signs of euro area growth reacceleration, and maybe some upside surprises on core inflation and wage growth, before inflation expectations (and Bund yields) begin rising again. Those are unlikely to become visible until at least the latter half of 2019, and the ECB is likely to keep policy rates unchanged over the balance of the year. Given our relative views on the Fed and ECB, we see the scope for the yield spread between the benchmark 10-year U.S. Treasury and German Bund to widen from current levels. That spread is wide on a long-term basis because of the relative policy stance of the two central banks, with the current 255bps gap roughly equal to the gap between the fed funds rate and ECB refi rate. Yet the momentum of that spread is closely correlated to the difference in the data surprise indices for the U.S. and euro area, and a divergence has opened up between those two measures on the back of better U.S. growth (Chart 12). Chart 12UST-Bund Spread Has Overshot To Downside
UST-Bund Spread Has Overshot To Downside
UST-Bund Spread Has Overshot To Downside
With the forward curves currently pricing in some additional tightening of the Treasury-Bund spread, betting on some renewed spread widening is a positive carry trade that also makes sense on a fundamental basis. Bottom Line: Growth has slowed in Europe, but the ECB is limited in its ability to ease policy further given tight labor markets and rising wage growth. Policy rates will stay on hold over at least the next year. Robert Robis, CFA, Senior Vice President Global Fixed Income Strategy rrobis@bcaresearch.com Recommendations The GFIS Recommended Portfolio Vs. The Custom Benchmark Index
The Pause That Refreshes
The Pause That Refreshes
Duration Regional Allocation Spread Product Tactical Trades Yields & Returns Global Bond Yields Historical Returns
Feature Half Way Back Since BCA went overweight global equities in late December, the MSCI ACWI index has rallied by 8% and the S&P 500 is back to only 8% off its September historical high. So far, this has been little more than a technical rally from the extreme oversold position in Q4. But with U.S. economic growth still resilient, earnings likely to grow healthily again this year (albeit more slowly than in 2018), and the valuation of risk assets (both equities and credit) no longer a headwind, we expect the rally to continue for some time, and so reiterate our overweight on equities. Recommendations
Monthly Portfolio Update
Monthly Portfolio Update
True, there have been some disappointments in U.S. data in recent weeks. In particular, the December manufacturing ISM fell sharply to 54.3 from 59.3, raising fears that the U.S. is starting to decelerate in line with other regions (Chart 1). But the ISM may have been affected by the government shutdown and, overall, U.S. data still look solid, with the Citigroup Economic Surprise Index beginning to rebound, and stronger than in other regions (Chart 2). The residential housing market, which was exhibiting signs of stress last year, with existing home sales -6.4% YoY in December, is showing the first signs of stabilization, helped by mortgage interest rates that are now 50 BPs off their recent peak (Chart 3). Chart 1How Worrying Is The U.S. Slowdown?
How Worrying Is The U.S. Slowdown?
How Worrying Is The U.S. Slowdown?
Chart 2U.S. Data Surprisingly Positive
U.S. Data Surprisingly Positive
U.S. Data Surprisingly Positive
Chart 3Housing Market Should Stabilize
Housing Market Should Stabilize
Housing Market Should Stabilize
In particular, the outlook for consumption looks healthy, with average hourly earnings growing at 3.3% YoY, consumer confidence close to an historic high, and the savings rate above 6%. Unsurprisingly, then, retail sales have boomed in recent months (Chart 4). Unless consumer confidence is dented by a repetition of the government shutdown or some other shock, consumption (68% of GDP, remember) should grow strongly this year. Add to this a residual positive impact of close to 0.5% of GDP coming from last year’s fiscal stimulus, and it is hard to imagine the U.S. going into recession over the next 12 months. Chart 4Consumption Booming
Consumption Booming
Consumption Booming
The Fed will probably go on hold for now, however, given the market jitters in Q4. We are likely back to a situation like that in 2015-2016, where the Fed Policy Feedback Loop becomes the key factor for markets (Chart 5). When financial conditions tighten, with stock prices falling and the dollar appreciating, the Fed turns more dovish. However, this triggers a rally in risk assets and loosens financial conditions, allowing the Fed to start hiking again. With the tightening in financial conditions over the past six months, the Fed is likely to err on the side of caution for now (Chart 6). However, if our macro view is correct – and as inflation starts to pick up again after April, partly due to the base effect – the Fed will want to continue withdrawing accommodation over the course of this year. The Fed Funds Rate, at around 2.4% is still two hikes below what the FOMC sees as the neutral level of interest rates (the 2.8% terminal rate in the FOMC dots). We see the Fed, therefore, raising rates in June and perhaps hiking two or even three times this year. By contrast, the futures market assigns only a 25% probability of even one rate hike this year, and is even pricing in a small probability of a cut.
Chart 5
Chart 6Tighter Conditions Mean More Cautious Fed
Tighter Conditions Mean More Cautious Fed
Tighter Conditions Mean More Cautious Fed
Clearly, there are plenty of risks to the scenario of growth continuing. But those in the hands of President Trump, especially the trade war with China and the fight over funding of the wall on the border with Mexico, we don’t see as being serious impediments. Trump is fully aware that he is unlikely to be reelected in November 2020 if the U.S. is in recession by then. Every incumbent U.S. president since World War Two who fought for reelection during a recession failed to be reelected (Chart 7). The view of BCA’s geopolitical strategists, therefore, is that the White House and Congressional Democrats will agree to concessions to end the shutdown before the end of the current three-week stop-gap period. Less likely, Trump will declare a national emergency that will cause much controversy but have little impact on the economy. Our strategists also argue that there is a 45% probability of trade negotiations with China producing a result (at least a short-term one the president can boast about) before the March 1 deadline, and a further 25% probability of the deadline being extended without further sanctions being imposed.1 Chart 7Trump Won't Be Reelected In A Recession
Trump Won't Be Reelected In A Recession
Trump Won't Be Reelected In A Recession
Equities: Analysts have become overly pessimistic about the earnings outlook for this year, cutting 2019 U.S. EPS growth to 7% (and only 2% YoY in Q1). Our top-down model (based on, admittedly optimistic, U.S. growth assumptions, but also headwinds from a stronger dollar) indicates 12% growth. If analysts are forced to revise up their numbers as better earnings come through, that should be a catalyst for further equity performance (Chart 8). We continue to prefer U.S. over European equities. The steady slowdown in European growth over the past 12 months has not yet bottomed, banks in Europe remain troubled, the earnings picture is less positive, and valuations relative to the U.S. are not especially attractive. We also remain underweight on EM equities: they may produce a positive return in a risk-on environment, but we see them underperforming DM as rising U.S. interest rates and a stronger USD put pressure on EM borrowers with excess foreign-currency debt. Chart 8Analysts Have Overdone Downward Revisions
Analysts Have Overdone Downward Revisions
Analysts Have Overdone Downward Revisions
Fixed Income: The recent fall in U.S. Treasury yields was mainly caused by the inflation expectation component, itself very sensitive (if rather illogically so) to the oil price (Chart 9). As the oil price recovers (see below), inflation picks up moderately, and the Fed hikes by more than the market expects, we see the 10-year Treasury yield rising to 3.5% during the course of the year. BCA’s fixed-income strategists recently raised their recommendation on global credit to overweight, given more attractive spreads and the likelihood that the Fed will be on hold for the next six months.2 Their recommendation is for 3-6 months, and the Fed restarting the hiking cycle, say in June, might terminate the positive story. We are following their lead, by raising both high-yield and investment-grade bonds to overweight within the (underweight) fixed-income asset class. That means we are neutral credit in the overall portfolio. We would warn, though, that this is a somewhat short-term call: we still prefer equities as a way to play the continuing risk-on rally. Given the high level of U.S. corporate leverage, and the over-owned nature of the credit market, this is likely to be an asset class that performs very poorly in the next recession (Chart 10). Chart 9Inflation Expectations Should Recover
Inflation Expectations Should Recover
Inflation Expectations Should Recover
Chart 10Corporate Leverage Is A Concern
Corporate Leverage Is A Concern
Corporate Leverage Is A Concern
Currencies: Currencies will continue to be driven by relative monetary policy. With the growth desynchronization between the U.S. and other DMs set to continue (to a degree), we see modest further USD appreciation this year. The Fed (as argued above) will probably hike more than the market expects. But, given slow European growth, the ECB is unlikely to be able to hike in Q4 this year, as it currently is guiding for and the futures market implies (Chart 11). We see the ECB reopening the Targeted Long-Term Repo Facility (TLTRO), which expires soon. Italy and Spain have been big borrowers from this facility, and bank loan growth is likely to slow as it ends (Chart 12). A renewed TLRTO would be seen as a dovish move. Tighter dollar liquidity conditions also point to a stronger USD. U.S. credit growth continues to accelerate (to 12% YoY – Chart 13) in an environment where the monetary policy has tightened: credit growth is outpacing U.S. money supply growth by 7%. Historically this has been negative for global growth (mainly because the deteriorating liquidity is a problem for EM dollar borrowers) and positive for the dollar (Chart 14).3 Chart 11Can ECB Really Hike In 2019?
Can ECB Really Hike In 2019?
Can ECB Really Hike In 2019?
Chart 12
Chart 13...U.S. Loan Growth Accelerating...
...U.S. Loan Growth Accelerating...
...U.S. Loan Growth Accelerating...
Chart 14... Which Will Tighten Liquidity Further
... Which Will Tighten Liquidity Further
... Which Will Tighten Liquidity Further
Commodities: The supply/demand situation for oil should improve over coming months. With Saudi Arabia and Russia committed to cut supply by 1.2 million barrels/day, U.S. shale production growth slowing given the low one-year forward price for WTI, Canada reducing production, and Venezuela on the verge of collapse (which alone could remove 700-800k b/d from the market), our energy strategists see the crude oil balance in deficit over the next four quarters (Chart 15). Given this, they forecast Brent crude rebounding to above $80 a barrel. Other commodity prices are mostly driven by Chinese demand. We see China continuing to slow, until the accumulated effects of its fiscal and mild monetary stimulus start to come through in H2 and stabilize growth. Our analysis suggests that China remains very disciplined about the size and nature of its stimulus: it is not turning on the liquidity taps as it did in early 2016. Bank loan growth has stabilized, but shadow banking activity continues to contract, as the authorities persist with their crackdown and their emphasis on deleveraging (Chart 16). Industrial commodities prices are therefore likely to weaken over the next six months. Chart 15Oil Balance In Deficit This Year
Oil Balance In Deficit This Year
Oil Balance In Deficit This Year
Chart 16China Sticking To Credit Crackdown
China Sticking To Credit Crackdown
China Sticking To Credit Crackdown
Garry Evans, Senior Vice President Global Asset Allocation garry@bcaresearch.com GAA Asset Allocation Footnotes 1 Please see Geopolitical Strategy Weekly Report, “So Donald Trump Cares About Stocks, Eh?”, dated 9 January 2019, available at gps.bcaresearch.com 2 Please see Global Fixed Income Strategy Weekly Report, “Enough With The Gloom: Upgrade Global Corporates On A Tactical Basis,” dated 15 January 2019, available at gfis.bcaresearch.com 3 For a detailed explanation, please see Foreign Exchange Strategy Weekly Report, “Global Liquidity Trends Support The Dollar, But…,” dated 25 January 2019, available at fes.bcaresearch.com
Highlights Global equity markets have managed to recoup some of last year’s plunge since we upgraded stocks to overweight in late December. The equity rally has been tentative, however, and so far feels more like a technical bounce from oversold levels than a resumption of the bull market. One driving factor behind last year’s market swoon was that policy uncertainty spiked at a time when the last pillar of global growth, the U.S., was showing signs of cracking. Investors thus welcomed the Fed’s signal that it would pause in March. Nonetheless, shrinkage in the Fed’s balance sheet is proving to be troublesome. Quantitative tightening does not necessarily imply permanently higher risk premia, but it will be a source of volatility. There are hopeful but tentative signs that a U.S. slowdown is not the precursor to a recession. The hit to GDP from the U.S. government shutdown will be reversed next quarter. The FOMC has also signaled that policymakers are attuned to the economic risks associated with tightening financial conditions, and that the calm inflation backdrop provides room to maneuver. The FOMC will stand pat in March, but should restart rate hikes in June as the economic soft patch ends. We still see only a modest risk of a U.S. recession this year. In contrast, our outlook for growth outside the U.S. remains downbeat for at least the first half of the year. Among the advanced economies, Japan and Europe are being the most affected by the Chinese economic slowdown and global trade tensions. This means that monetary policy divergence will continue to be a tailwind for the dollar. China continues to stimulate at the margin, but efforts so far have been insufficient to put a floor under growth. The contraction in Chinese exports has just begun. It is still too early to upgrade EM assets or base metals. Despite the cloud still surrounding Brexit, sterling is beginning to look attractive as a long-term punt. Our decision to upgrade corporate bonds to overweight this month, similar to our reasoning for upgrading equities in December, is based on improved value and a sense that investor pessimism had become excessive. Just as the selloff in risk assets was overdone, so too was the rally in government bonds. It is highly unlikely that the Fed is done tightening, as is currently discounted in the money market curve. A resumption of Fed rate hikes around mid-year means that the 10-year Treasury yield will move back above 3% by year end. Feature Global equity markets have managed to recoup some of last year’s plunge since we upgraded the asset class back to overweight in the latter half of December. A decline in the VIX and high-yield bond spreads are also positive signs that global risk appetite is recovering, following an overdone investor ‘panic attack’ last quarter. The equity rally has been tentative, however, and so far feels more like a simple technical bounce from oversold levels than a resumption of the bull market. One problem is that policy uncertainty has spiked at a time when the last pillar of global growth, the U.S., is showing signs of cracking (Chart I-1). Investors are skittish while they await a clear de-escalation of U.S./China trade tensions, an end to the U.S. economic soft patch, an end to the U.S. government shutdown, and signs that global growth is bottoming (especially in China). There has only been some modestly positive news on a couple of these issues. Chart I-1Policy Uncertainty Has Spiked
Policy Uncertainty Has Spiked Watch Policy Uncertainty
Policy Uncertainty Has Spiked Watch Policy Uncertainty
Another factor that appeared to play a role in last quarter’s market swoon is the fear that the end of asset purchases by the European Central Bank and the normalization of the Fed’s balance sheet necessarily imply a structural de-rating for all risk assets. A related worry is that the de-rating might intensify the global economic slowdown, resulting in a self-reinforcing negative feedback loop. Does QT Imply Lower Multiples? The question of balance sheet normalization is a difficult one because there is widespread disagreement on how, or even whether, quantitative easing (QE) works. We have always maintained that QE was not about creating a wave of central bank liquidity that flowed into asset prices. Central banks did not “print money” – they created bank reserves. These reserves did not result in a major acceleration in broader measures of money growth, including M1 and M2, largely because there was little demand for loans and because banks tightened lending standards. In other words, the credit channel of monetary policy was broken. The implication is that investors should not worry that quantitative tightening (QT) implies a withdrawal of central bank liquidity that must mechanically come from the sale of risk assets. Rather, we believe that QE operates mostly through the portfolio balance effect. There are two ways to think about this channel. First, the central bank forced investors to move into riskier assets by purchasing large amounts of “safe” assets, such as government bonds. Investors had little choice but to redeploy the capital into other riskier areas, pushing up asset prices. The second perspective is that central bank purchases of government bonds depressed both the yield curve and bond volatility. Volatility fell because investors could forecast the policy rate with certainty – it would be glued to zero (or negative) for the foreseeable future in most of the advanced economies. This is akin to strong forward guidance that flattened the yield curve. Aggressive monetary stimulus, such as QE, also helped to reduce the perceived risk that the economy would succumb to secular stagnation or fall back into recession. Reduced bond volatility, lower bond yields, and less economic risk all increased the attractiveness of the riskier asset classes. These explanations represent two sides of the same coin. Either way, QE boosted a broad array of asset prices. If this is true, then unwinding QE must be bearish for risk assets, all else equal. In the case of the U.S., the fed funds rate is much more difficult to forecast than was the case when the Fed was buying bonds. Higher yields and bond volatility imply a lower equilibrium multiple in the equity market and wider equilibrium corporate bond spreads. Nonetheless, all else is not equal. If interest rates and bond volatility are rising in the context of healthy economic and profit growth, then it is likely that the perceived risk of secular stagnation is falling. It would be a sign that the economy has finally put the financial crisis firmly in the rear-view mirror. It could be the case that the upgrade in economic confidence overwhelms the negative impact of the reverse portfolio balance effect related to quantitative tightening, allowing risk assets to rise. No one can prove this thesis one way or the other and we are not making the case that unwinding the Fed’s balance sheet will necessarily go smoothly, especially since interest rates are rising at the same time. The problem is that both investors and the Fed are trying to figure out where the neutral fed funds rate lies. If the so-called level of R-star is still very low, then the Fed might have already made a policy mistake by raising rates too far. We discussed in last month’s Overview the market implications of four scenarios for the level of R-star and the Fed’s success in correctly guessing it. If the economy holds up and the economic soft patch ends in the coming months as we expect, then investors will revise their estimate of the neutral rate higher and risk assets will rally even as bond yields rise. The Doom Loop One risk to our base-case scenario is the so-called financial conditions “doom loop”. Irrespective of whether or not QT is playing a role, the doom loop scenario involves a shock to investor confidence that leads to a tightening in financial conditions and market liquidity as stock prices fall and credit spreads widen. More onerous financial conditions, in turn, undermine economic activity, which then feeds back into even tighter financial conditions. One could make the argument that risk assets are even more exposed to this type of negative feedback loop today than in past monetary tightening cycles because of program trading, the Fed’s balance sheet shrinkage and investors’ lingering shell shock from the Great Recession and financial crisis. Nonetheless, there are a few mitigating factors to consider. We believe that a doom loop is more likely to unfold when economic growth becomes very sensitive to changes in financial conditions. This normally happens when economic and financial imbalances are elevated. On a positive note, unlike in the lead-up to the last two recessions, the U.S. private sector is a net saver whose income outstrips spending by 2.1% of GDP (Chart I-2). The highly cyclical parts of the U.S. economy are not stretched to the upside as a share of GDP, reducing the risk that overspending in one part of the economy will required a deep contraction to correct the imbalance (Chart I-3). Chart I-2U.S. Private Sector: A New Saver
U.S. Private Sector: A New Saver The U.S. Private Sector Is A Net Saver
U.S. Private Sector: A New Saver The U.S. Private Sector Is A Net Saver
Chart I-3U.S. Cyclical Spending Not Extended
U.S. Cyclical Spending Not Extended
U.S. Cyclical Spending Not Extended
In terms of financial excesses, the good news is that the U.S. household sector is in its best shape in decades. Our main concern is debt accumulation in the corporate sector. We reviewed the related risks in a Special Report published in the November 2018 issue.1 We concluded that corporate leverage will not cause the next U.S. recession, because high levels of debt will only become a problem when profits begin to contract (i.e. when the economic downturn is already underway). Nonetheless, when a recession does occur, corporate spreads will widen by more than in the past for any given degree of economic contraction (see below). ‘Fed Put’ Still In Play Another factor that tempers the risk of a doom loop is that the so-called ‘Fed Put’ is still operating. The December FOMC Minutes and comments by various FOMC members communicated to investors that the Fed is attuned to the economic risks associated with tightening financial conditions, and that the calm inflation backdrop provides policymakers with room to maneuver. Chair Powell even said he was willing to adjust the Fed’s balance sheet run-off if necessary. One important reason for policymakers’ willingness to be flexible is that the fed funds rate is still not far from the zero-lower-bound, making it potentially more difficult for the FOMC to respond adequately in the event of a recession this year because the fed funds rate can only be cut by 250 basis points. Several U.S. data releases have been delayed due the government shutdown, but what has been released has been mixed. The downdraft in the January reading of the manufacturing ISM was eye-opening, highlighting that the global manufacturing slowdown has reached U.S. shores. The good news is that the non-manufacturing ISM and the small business survey, although off their peaks, remain consistent with solid underlying growth. The December U.S. payroll report revealed that wage growth continued to accelerate on the back of gangbusters job creation at the end of the year. There have also been some recent hints that the soft patch in capital spending and housing is ending (Chart I-4). Existing home sales fell sharply in December, but extremely low inventories suggest that it is more of a supply than a demand problem. The impressive bounce in home mortgage applications for purchases is a hopeful sign. U.S. commercial and industrial loan growth is also accelerating. Chart I-4Some Tentative Signs
Some Tentative Signs
Some Tentative Signs
These tentative signs that the economic soft patch is close to an end will not be enough to get the FOMC to tighten in March, after so many members have gone out of their way to signal a pause in recent weeks. Nonetheless, we believe the economy will remain strong enough for the Fed to resume hiking in June. The U.S. government shutdown will complicate interpreting incoming economic data. Ultimately, while its impact on Q1 real GDP growth will be non-trivial, it will be reversed the following quarter and we do not expect any permanent damage to be done. U.S. inflation should edge higher by mid-year, supporting our view that the Fed will resume tightening in June. The decline in oil prices will continue to feed into a lower headline inflation rate in the coming months, but that does not mean that the core rate will fall. Indeed, core CPI has increased by roughly 0.2% in each of the past three months, translating into an annualized rate of approximately 2.4%. Base effects will depress annual core inflation in February but, thereafter, this effect will begin to reverse. The acceleration in wage growth according to measures such as average hourly earnings and the Employment Cost Index highlights that underlying inflationary pressures continue to percolate (Chart I-5). The implication is that the Treasury bond market is overly complacent in discounting that the fed funds rate has peaked for the cycle. Chart I-5U.S. Wage Pressure Is Percolating
U.S. Wage Pressure Is Percolating
U.S. Wage Pressure Is Percolating
Looking further ahead, our base case remains that the next U.S. recession will not occur until 2020, and will be the result of tighter fiscal policy and further Fed tightening that takes short-term rates a step too far. No Bottom Yet For Global Growth Our outlook for growth outside the U.S. remains downbeat for at least the first half of the year. Our global economic indicators still show no sign of a turnaround, except for a bottoming in the diffusion index based on BCA’s Global Leading Economic Indicator (Chart I-6). The global ZEW economic sentiment index continued to fall in January, while business and consumer confidence readings in the advanced economies eroded heading into year end. Chart I-6Global Leading Indicators Still Deteriorating
Global Leading Indicators Still Deteriorating Global Growth Is Still Moderating...
Global Leading Indicators Still Deteriorating Global Growth Is Still Moderating...
A better global growth dynamic awaits more serious policy stimulus in China. Real GDP growth decelerated further to 6.4% year-over-year in the last quarter of 2018. This is no disaster, but the point is that there are still no signs of stabilization. The Chinese authorities continue to tweak the policy dials at the margin, most recently providing some tax cuts and a liquidity injection into the banking system. Nonetheless, the central government has so far abstained from stimulating the property market due to existing speculative excesses. This is very different from the previous two policy easing episodes, including 2015/16 (Chart I-7). Chart I-7China: No Property Market Stimulus...
China: No Property Market Stimulus...
China: No Property Market Stimulus...
The stimulus undertaken so far has been insufficient in terms of putting a floor under growth according to our 12-month Credit Impulse (Chart I-8). It is a hopeful sign that broad money growth is trying to bottom, but this does not guarantee that the credit impulse is about to turn. The latter is required to confirm that Chinese import demand will accelerate, providing a lift to EM exporters, EM asset prices and commodity prices. Without a positive credit impulse, China’s investment and construction activity will continue to moderate, leading to lower imports of machinery and raw materials. Chart I-8...And No Credit Impulse
...And No Credit Impulse
...And No Credit Impulse
The economic situation in China is likely to get worse before it gets better. Dismal trade figures in December confirmed that the trade war is beginning to bite. The period of export ‘front-running’ related to higher U.S. tariffs is over as total exports fell by 4.4% year-over-year. Last year’s collapse in export orders indicates that the woes are just beginning. In turn, moderating production related to the Chinese export sector will bleed into domestic consumption and imports, suggesting that it is too early to expect a durable rally in EM assets or commodity prices. Lackluster Chinese demand and growing trade concerns have weighted on global business confidence, contributing to the pullback in capital goods orders, manufacturing PMIs and industrial production in the advanced economies (Chart I-9). Even the average service sector PMI and consumer confidence index in the advanced economies have fallen in recent months, although both remain at a high level. Chart I-9The Fallout From Trade
The Fallout From Trade
The Fallout From Trade
Europe and Japan, in particular, are feeling the pinch. German GDP only grew 1.5% in 2018, implying that Q4 GDP growth was in the vicinity of just 0.2% QoQ. Meanwhile, European industrial production contracted by 3.3% year-over-year in December. The German Ifo and ZEW surveys do not point to any significant improvements in this trend. A few idiosyncratic factors explain some of this poor performance, including new emissions testing standards that have weighted on the German auto industry, a tightening in financial conditions in Italy, and the ‘gilets jaunes’ protests in France. Nonetheless, the euro area slowdown cannot be fully explained by one-off factors. The economy is highly sensitive to global trade fluctuations given that 18% of the euro area’s gross value added is generated in the manufacturing sector. Hence, China’s poor economic health has been painful for Europe, and the trend in Chinese credit does not bode well for the near term (Chart I-10). The European Central Bank (ECB) is likely to stay on the defensive as a result, especially as euro area core inflation, which has been stuck near 1% for three years, is unlikely to pick up if growth remains on the back foot. The ECB stuck with the view that the economic soft patch is temporary after the January policy meeting, but policymakers will consider providing more stimulus in March if the economy does not pick up (using forward guidance or a new TLTRO). This will weigh on the euro. Chart I-10China's Woes Are Infecting Europe
China's Woes Are Infecting Europe
China's Woes Are Infecting Europe
Japan is suffering from similar ills. Exports are no longer growing, and foreign machinery and factory orders are contracting at a 4.1% and 4.3% pace, respectively. This weakness is not mimicked in domestic growth, but the disproportionate contribution of the external sector to Japan’s overall economic health means that this country is also falling victim to the malaise witnessed in China and emerging markets, the destination of 19% and 45% of Japanese shipments, respectively (Chart I-11). Collapsing oil prices and a firming trade-weighted yen have amplified this deflationary backdrop. It is therefore far too early to bet that the Bank of Japan will tighten the monetary dials. Chart I-11Japan Hit By The Chinese Cold As Well
Japan Hit By The Chinese Cold As Well
Japan Hit By The Chinese Cold As Well
If we are correct that the U.S. economic soft patch will soon end, then the dollar will once again look to be the best of a bad lot. Interest rate expectations will move in favor of the dollar. We expect the dollar to rise by about 6% this year on a trade-weighted basis, appreciating most strongly against the AUD and SEK. As for sterling, it is beginning to look attractive as a long-term punt. Brexit Deadlock We are a month closer to the end-March deadline and a Brexit deal seems even farther out of reach. It could play out in one of three ways: (1) a “no deal” where the U.K. leaves the EU with no alternative in place; (2) a “soft Brexit” involving an agreement to form a permanent customs union or some sort of “Norway plus” arrangement; or (3) a decision to reverse the results of the original referendum and stay in the EU. There is no support for the “no deal” option in Parliament, which means that it won’t happen. We do not have a strong view on which of the latter two scenarios will occur. The odds of another referendum are rising and the polls are swinging away from any sort of Brexit, suggesting that the original referendum result may be over-turned via another referendum (Chart I-12). Nonetheless, for investors, it does not matter much whether it is scenario 2 or 3; either outcome would be welcomed by markets. Overweight sterling positions are attractive as a long-term play, although it could be some time before the final solution emerges. Chart I-12Brexit Result May Be Overturned
Brexit Result May Be Overturned
Brexit Result May Be Overturned
Upgrade Corporate Bonds To Overweight Given the recent global economic dynamics, it is perhaps surprising that U.S. corporate financial health actually improved in 2018 according to our Corporate Health Monitors (CHM). We highlighted in the aforementioned Special Report the risks facing U.S. corporate bonds when the economic expansion ends. High levels of corporate leverage mean that the interest coverage ratio for the median corporation in the Barclays-Bloomberg index will plunge to near or below all-time historic lows. The potential for a large wave of fallen angels implies that downgrade activity will be particularly painful for corporate bond investors. The surge in lower-quality issuance has led to a downward trend in the average credit rating and has significantly raised the size of the BBB-rated bonds relative to the IG index and relative to the broader universe of corporate bonds. Moreover, poor market liquidity and covenant erosion will intensify pressure for corporate spreads to widen when the bear market arrives. Rapid debt accumulation is reflected in our bottom-up Corporate Health Monitors (CHM) for the U.S. investment-grade and high-yield sectors (Chart I-13). The CHMs are constructed from six financial ratios that the rating agencies use when rating individual companies. The companies in our bottom-up sample were chosen so as to mimic the sector and quality distribution in the Bloomberg-Barclay’s corporate bond index. Chart I-13U.S. Corporate Health
U.S. Corporate Health
U.S. Corporate Health
The debt-to-book-value of equity ratio for both the U.S. IG and HY sample of companies has risen to nose-bleed levels, although the ratio appears to have flattened off for the latter. Despite rising leverage, the HY CHM has shifted into “improved health” territory and the IG CHM is on the verge of doing the same. Last year’s upturn in the profitability measures, such as the return on capital, overwhelmed the deteriorating leverage trend. In Europe, where we distinguish between domestic and foreign issuers, rising leverage has been concentrated among the latter until recently (Chart I-14). In any event, the CHM for both types of issuers is close to the neutral zone. Chart I-14Euro Area Corporate Health
Euro Area Corporate Health
Euro Area Corporate Health
Improving U.S. corporate health on its own would not justify increasing exposure to corporate bonds within balanced portfolios or moving down in quality. Profit growth is likely to moderate this year, especially in Europe, such that last year’s improvement in corporate health is likely to reverse. And, as previously discussed, the economic cycle is well advanced and this sector is particularly vulnerable to a recession. Nonetheless, value has improved enough to warrant a tactical upgrade to overweight within fixed-income portfolios, at a time when the FOMC has signaled a pause and the next recession is at least a year away. Implied volatility should continue to moderate and spreads should narrow, similar to dynamics in 2016, the last time that the Fed signaled patience following a period of market turmoil (Chart I-15). Chart I-15Fed Patience To Narrow Spreads
Fed Patience To Narrow Spreads
Fed Patience To Narrow Spreads
Spreads have already narrowed from the peak in late December, but 12-month breakeven spreads for most credit tiers are all still close to or above their historical means, except for AA-rated issues (Chart I-16). For example, the 12-month breakeven spread2 for the Baa credit tier is 46%. This means that the spread has been tighter than its current level 46% of the time since 1988 and wider than its current level 54% of the time. Historically, spreads tend to hover within the tight-end of their historical range during this phase of the credit cycle, and only cheapen significantly when the yield curve inverts and the default rate moves higher. Chart I-16Value Restored In IG Corporates...
Value Restored In IG Corporates...
Value Restored In IG Corporates...
For U.S. high yield, our estimate of the spread adjusted for expected defaults has risen to 237 bps (Chart I-17). This implies that investors are discounting a 2019 default rate of 3.2%, in line with Moody's forecast. Since we do not foresee recession this year, high-yield bonds are not expensive enough to be avoided within a portfolio. Chart I-17...And In HY Too
...And In HY Too
...And In HY Too
Value has also improved in the European corporate bond market, but our global fixed-income team still recommends favoring the U.S. market for global credit investors. Leverage is higher in the U.S., especially relative to domestic issuers in Europe, but the U.S. economic and profit outlook for 2019 is better. Conclusions Our decision to upgrade corporate bonds this month, similar to our reasoning for upgrading equities to overweight in December, is based on improved value and a sense that investor pessimism had become excessive. For the equity market, the S&P 12-month forward P/E is an attractive 15.4 as we go to press, and bottom-up estimates for 2019 EPS have been slashed to a very reasonable 8%. Just as the selloff in risk assets late last year was overdone, so too was the rally in government bonds. It is highly unlikely that the Fed is done tightening. A resumption of Fed rate hikes, probably in June, means that the 10-year Treasury yield will move back above 3% by year end. Across the major countries, market expectations for yields 5-10 years from now are close to current levels, which is extremely complacent (Chart I-18). Investors should keep duration short of benchmark. Chart I-18Forward Rates Far Too Low
Forward Rates Far Too Low
Forward Rates Far Too Low
Our shift to overweight in both equities and corporate bonds is tactical in nature. We fully expect to move back to neutral and then to underweight later this year or into 2020, as the peak in U.S. GDP draws nearer. Timing will be difficult as always, which means that investors should be prepared to trim risk exposure earlier than implied by our base-case economic timeline. The tactical upgrade does not imply that we have become more sanguine on the economic and geopolitical risks for 2019. We do not believe that quantitative tightening or U.S. corporate leverage will truncate the U.S. expansion prematurely. Nonetheless, there is a plethora of other risks to keep us up at night. These include a Fed policy mistake, a hard economic landing in China, a full-blown financial crisis in Italy and an escalation in U.S./China trade tensions. The last one has diminished marginally in probability. We have a sense that the recent equity market downdraft unnerved President Trump, such that he now has a diminished appetite for upsetting investors with talk of an escalating trade war ahead of next year’s election. Outside of these well-known risks, our geopolitical team has recently published its “Black Swans” report for 2019. These are deemed to be risks that are off of most investors’ radar screens, but that would have profound implications if they were to occur: It is premature to expect armed conflict over Taiwan, but an outbreak of serious tensions between China and Taiwan is possible as Sino-American strategic distrust continues to build. Russia and Ukraine may have a shared incentive to renew hostilities this year. Saudi Arabia has received a “blank cheque” from Donald Trump, and thus it may continue to be provocative. This could boost the geopolitical risk premium in oil prices. Tensions are building in the Balkans. A renewed conflict on Europe’s doorstep could be the next great geopolitical crisis. A “Lame Duck” Trump could stage a military intervention in Venezuela. We encourage interested readers to see our Special Report for details.3 As for emerging market assets and base metals, we continue to shy away until we receive confirmation that China is aggressively stimulating. We expect better news on this front by mid-year, but watch our China Credit Impulse indicator for timing. In contrast, investors should be overweight oil and related assets now because our commodity specialists still see the price of Brent rising above US$80/bbl sometime this year. Recent political turmoil in Venezuela buttresses our bullish oil view. Finally, this month’s fascinating Special Report, penned by BCA’s Chief Global Strategist, Peter Berezin, examines the long-term implications of the peaking in the average IQ in the advanced economies. Average intelligence is falling for both demographic and environment reasons. The impact will be far from benign, potentially leading to lower productivity growth, lower equity multiples, larger budget deficits and higher equilibrium bond yields. The report begins on page 20. Mark McClellan Senior Vice President The Bank Credit Analyst Mathieu Savary Vice President Foreign Exchange Strategy January 31, 2019 Next Report: February 28, 2019 II. The Most Important Trend In The World Has Reversed And Nobody Knows Why After rising for thousands of years, human intelligence has begun to decline in developed economies. This can be seen in falling IQ scores and a decline in math and science test scores. Environmental factors appear to account for the bulk of this decline, but no one knows what these factors are. If left unchecked, falling intelligence will severely undermine productivity growth. This could lead to lower equity multiples, larger budget deficits, and ultimately, much higher government bond yields. Technological advances, particularly in the genetic realm, promise to radically raise IQs. In a complete abandonment of its one-child policy, China will combine these controversial technologies with pro-natal measures in order to boost sagging birth rates. The coming Eugenic Wars will be one of the most important economic and geopolitical developments of the 21st century. Part 1: What The Tame Fox Says In 1959, a Soviet scientist named Dmitry Belyaev embarked on an ambitious experiment: to domesticate the silver fox. A geneticist by training, Belyaev wanted to replicate the process by which animals such as cats and dogs came to live side-by-side with humans. It was a risky endeavor. The Soviets had essentially banned the study of Mendelian genetics in favor of the blank slate ideology that is popular in progressive circles today. Belyaev persevered. Working under the guise of studying vulpine physiology, he selected foxes based on only one trait – tamability. Less than 10% of foxes made it to the subsequent generation, with the other 90% being sent off to fur farms. By the fourth generation, the changes were undeniable. Rather than fleeing humans, the foxes sought out their attention with no prompting whatsoever. They even wagged their tails and whined and whimpered like dogs do. The tame foxes also displayed physical changes. Their ears flopped over. Their snouts became shorter and their tails stood upright. "By intense selective breeding, we have compressed into a few decades an ancient process that originally unfolded over thousands of years," wrote Lyudmila Trut, who began as Belyaev’s assistant and took over the project when her boss died in 1985. Genetically Capitalist? Evolution can broadly proceed in two ways. The first way is through random mutations. This form of evolution, which scientists sometimes refer to as genetic drift, can take thousands of years to yield any discernable changes. The second way is through natural selection, a process that exploits existing variations in genetic traits. As the Russian fox experiment illustrates, evolution driven by selective pressures (either natural or artificial) can occur fairly quickly. Did selective pressures manifest themselves in human evolution in the lead up to the Industrial Revolution? Did humans, in some sense, domesticate themselves? In his book, A Farewell To Alms, economic historian Gregory Clark argued in the affirmative. Clark documented that members of skilled professions in Medieval England had twice as many surviving children as unskilled workers (Chart II-1). Indeed, the fledgling middle class of the time had even more surviving children than the aristocracy, who were often out fighting wars. As a result, the wages of craftsmen declined by a third relative to laborers between 1200 and 1800, implying that the supply of skilled labor was growing more quickly than the demand for skilled workers over this period.
The Most Important Trend In The World Has Reversed And Nobody Knows Why
The Most Important Trend In The World Has Reversed And Nobody Knows Why
In subsequent work, Clark and Neil Cummins argued that the spread of bourgeois values across pre-industrial England was more consistent with a model of genetic transmission than a cultural one (see Box II-1 for details). Similar developments occurred in other parts of the world. For example, in China, the gateway into the bureaucracy for a thousand years was the highly competitive imperial exam. Xi Song, Cameron Campbell, and James Lee showed that high-status men had more surviving children during the eighteenth- and nineteenth-centuries (Chart II-2).4
The Most Important Trend In The World Has Reversed And Nobody Knows Why
The Most Important Trend In The World Has Reversed And Nobody Knows Why
The 10,000 Year Explosion Stephen Jay Gould famously said that “There’s been no biological change in humans in 40,000 or 50,000 years. Everything we call culture and civilization we’ve built with the same body and brain.” Gould was wrong. Data from the International HapMap Project show that human evolution accelerated by 100-fold starting around 10,000 years ago (Chart II-3).
The Most Important Trend In The World Has Reversed And Nobody Knows Why
The Most Important Trend In The World Has Reversed And Nobody Knows Why
In their book The 10,000 Year Explosion: How Civilization Accelerated Human Evolution, Gregory Cochran and the late Henry Harpending explained why evolution sped up so rapidly.5 The advent of agriculture led to a surge in population levels. This, in turn, increased the absolute number of potentially beneficial genetic mutations that could be subject to selection effects. Farming and the rise of city states also completely reshaped the environment in which people lived. Basic biology teaches us that environmental dislocations of this kind tend to generate selective pressures that cause evolution to accelerate. John Hawks, professor of anthropology and genetics at the University of Wisconsin-Madison, put it best: “We are more different genetically from people living 5,000 years ago than they were different from Neanderthals.” Many of the changes to our genomes relate to diet and diseases. The various genetic resistances that people have built up to malaria are all less than 10,000 years old. Mutations to the LCT gene, which confers lactose tolerance into adulthood, occurred independently in three different geographical locations: one in East Asia, one in the Middle East, and one in Africa. The Middle Eastern variant was probably responsible for the rapid enlargement of the Indo-European language group, which now stretches from India to Ireland. The African variant likely facilitated the Bantu expansion, which started near the present-day border of Nigeria and Cameroon, and then spread out across almost all of sub-Saharan Africa. Evolution Of The Human Brain About half of the genes in the human genome regulate some aspect of brain function. Given the rapid acceleration in evolution, it would be rather surprising if our own brains had not been affected. And indeed, there is plenty of evidence that they were. The frontal lobe of the brain has increased in size over the past 10,000 years. This is the part of the brain that regulates such things as language, memory, and long-term planning. Testosterone levels have also declined. That may explain the steady reduction in violent crime rates (Chart II-4).
The Most Important Trend In The World Has Reversed And Nobody Knows Why
The Most Important Trend In The World Has Reversed And Nobody Knows Why
We know that certain genes that are associated with higher intelligence have been under recent selective pressure. For example, the gene that leads to torsion dystonia – a debilitating movement disorder – appears to have increased in frequency. Why would a gene that causes a known disease become more widespread? The answer is that individuals who have this particular mutation tend to have IQs that are around 10-to 20-points above the population average. Why IQ Matters IQ has a long and contentious history. Yet, despite numerous efforts to jettison the concept, it has endured for one simple reason: It has more predictive power than virtually anything else in the psychological realm. A simple 30-minute IQ test can help predict future educational attainment, job performance, income, health, criminality, and fertility choices (Table II-1 and Chart II-5). IQ even predicts trader performance!6
The Most Important Trend In The World Has Reversed And Nobody Knows Why
The Most Important Trend In The World Has Reversed And Nobody Knows Why
The Most Important Trend In The World Has Reversed And Nobody Knows Why
The Most Important Trend In The World Has Reversed And Nobody Knows Why
Like most physiological traits, IQ is highly heritable.7 The genetic contribution to IQ increases from 20% in early childhood to as high as 80% by one’s late teens and remains at that level well into adulthood.8 This makes IQ almost as heritable as height (Chart II-6).
The Most Important Trend In The World Has Reversed And Nobody Knows Why
The Most Important Trend In The World Has Reversed And Nobody Knows Why
Although there is a great deal of variation among individuals, on average, more intelligent people earn higher incomes (Chart II-7). If the same relationship existed in the pre-industrial era, as seems likely, then human intelligence probably increased in a way that facilitated the economic explosion that we associate with the Industrial Revolution. The stunning implication is that the emergence of the modern era was a question of “when, not if.”
The Most Important Trend In The World Has Reversed And Nobody Knows Why
The Most Important Trend In The World Has Reversed And Nobody Knows Why
Part 2: The Flynn Effect By the late-19th century, it had become clear that the rich were no longer having as many children as the poor. This realization, together with the growing popularity of Darwin’s theories, helped galvanize the eugenics movement. Contrary to popular belief, this movement was not a product of the far-right. In fact, the most vocal proponents of eugenics were among the progressive left. John Maynard Keynes, for example, served as the Director of the British Eugenics Society between 1937 and 1944. Yet, a funny thing happened on the road to idiocracy: The concerns of eugenicists did not come to pass. Rather than becoming dimmer, people became smarter. This phenomenon is now known as the Flynn Effect, named after James Flynn, a psychologist who was among the first to document it. Chart II-8 shows the evolution of IQ scores in a sample of countries between 1940 and 1990. The average country recorded IQ gains of three points per decade over this period, a remarkably large increase over such a relatively short period of time.
The Most Important Trend In The World Has Reversed And Nobody Knows Why
The Most Important Trend In The World Has Reversed And Nobody Knows Why
Explaining The Flynn Effect The Flynn Effect must have been entirely driven by environmental factors since genetic factors – namely the tendency of less-educated people to have more children, and to have them at an earlier age – would have reduced average IQs over the past two hundred years. But how could environmental factors have played the dominant role in light of the strong role of genes discussed above? The answer was proposed by geneticist Richard Lewontin in the 1970s. Lewontin suggested imagining a genetically-diverse sack of seed corn randomly distributed between two large identical fields. One field had fertilizer added to it while the other did not. Genetic variation would explain all of the differences in the height of corn stalks within each field, while environmental factors (the addition of fertilizer) would explain all of the difference in the average height of corn stalks between the two fields. This logic explains why genes can account for the bulk of the variation in IQs within any demographic group, while environmental effects may explain most of the variation across groups, as well as why average scores have changed over time. And what environmental effects are these? The truth is that no one really knows. Plenty of theories have been advanced, but so far there is still little consensus on the matter. Bigger, Healthier Brains It has long been known that learning increases the amount of grey matter in the brain. For example, a recent study showed that the hippocampi of London taxi drivers tend to be larger due to the need for drivers to memorize and navigate complex routes.9 The emergence of modern societies likely kicked off a virtuous circle where the need to solve increasingly complex tasks forced people to hone their learning skills, leading to higher IQs and further technological progress. The introduction of universal primary education amplified this virtuous circle. Better health undoubtedly helped as well. Early childhood diseases reduce IQ by diverting the body’s resources away from mental development towards fighting off infections. There is a strong correlation between measured IQ and disease burden across countries (Chart II-9). A number of studies have documented a strong relationship between the timing of malaria eradication in the U.S. and other parts of the world and subsequent observed gains in childhood IQs.10
The Most Important Trend In The World Has Reversed And Nobody Knows Why
The Most Important Trend In The World Has Reversed And Nobody Knows Why
Brain size and IQ are positively correlated. Forensic evidence from the U.S. suggests that the average volume of adult human skulls has increased by 7% since the late 1800s, or roughly the size of a tennis ball.11 Part 3: The End Of A 10,000 Year Trend The problem with environmental effects is that they eventually run into diminishing returns. This appears to have happened with the Flynn Effect. In fact, not only does the recent evidence suggest that the Flynn Effect has ended, but the data suggest that IQs are starting to decline. Chart II-10 shows that average math and science test scores fell in the OECD’s Program For International Scholastic Achievement (PISA) between 2009 and 2015, the latest year of the examination. The drop in math and science test scores has been mirrored in falling IQ scores. Flynn observed a decade ago that IQs of British teenagers were slipping.12 Similar results have been documented in France, the Netherlands, Germany, Denmark, and most recently, Norway.
The Most Important Trend In The World Has Reversed And Nobody Knows Why
The Most Important Trend In The World Has Reversed And Nobody Knows Why
The Norwegian results, published last year, are particularly noteworthy.13 Bernt Bratsberg and Ole Rogeberg examined three-decades worth of data on IQ tests of Norwegian military conscripts. Military duty has been mandatory for almost all men in Norway since 1814, which means that the study’s authors were able to collect comprehensive data on most Norwegian men and their fathers. Their paper clearly shows that IQ peaked with the generation born in the mid-1970s and declined by about five points, or one-third of a standard deviation, for the one born in 1990 (Chart II-11). For the first time in recorded history, Norwegian kids today are not scoring as well as their parents.
The Most Important Trend In The World Has Reversed And Nobody Knows Why
The Most Important Trend In The World Has Reversed And Nobody Knows Why
A Mystery What caused the sudden reversal of the Flynn Effect in Norway and most other developed economies? Nobody knows. We can, however, offer three possible theories: New Technologies For much of human history, rising intelligence and technological innovation were complementary processes, meaning that the smartest people were the ones who could best exploit the new technologies that were coming their way. Moreover, as noted above, even those who were less gifted benefited from the mental stimulation that a technologically advanced society provided. It remains to be seen how future technological advances such as generalized AI will affect human intelligence, but recent technological advances seem to have had a dumbing down effect.14 For example, the GPS has obviated the need for people to navigate unfamiliar locations, thus blunting the development of their visuospatial skills. Modern word processors have made spelling skills less important. Having all the information in the world just a click away is a wonderful thing, but it has reduced the need for our brains to retain and codify what we learn. Meanwhile, the constant bombardment of information to which we are subject has made it difficult to concentrate on anything for long. How many youth today can read a report of this length without checking their Facebook feed multiple times? My guess is not many. Diminishing Returns To Education The ability to take young bright minds, who would have otherwise spent their lives doing menial labor, and provide them with an education was probably the greatest tailwind to growth that the 20th century enjoyed. There is undoubtedly still scope to continue this process, but the low-hanging fruits have been picked. Educational attainment has slowed dramatically in most of the world (Chart II-12). Economist James Heckman estimates that U.S. high-school graduation rates, properly measured, peaked over 40 years ago.15
The Most Important Trend In The World Has Reversed And Nobody Knows Why
The Most Important Trend In The World Has Reversed And Nobody Knows Why
Despite billions of dollars spent, efforts to improve school performance have generally fallen flat. A recent high-level report by the U.S. Department of Education concluded that “The panel did not find any empirical studies that reached the rigor necessary to determine that specific turnaround practices produce significantly better academic outcomes.”16 This gets to a point that most parents already know, which is that when people talk about “bad schools," they are really talking about “bad students.” Deteriorating Health Better health probably contributed to the Flynn Effect. But is it possible to have too much of a good thing? More calories are welcome when people are starving, but today’s calorie-rich, nutrient-poor diets have led to a surge in obesity rates. A clean environment reduces the spread of germs, but it also makes children hypersensitive to foreign substances. Following German reunification, researchers observed that allergies were much more common among West German children than their Eastern peers, presumably because of the West’s more salubrious environment.17 All sorts of weird and concerning physiological changes are occurring. Sperm counts have fallen by nearly 60% since the early 1970s.18 Testosterone levels in young men are dropping. Among girls, the age of first menarche has declined by two years over the past century.19 Are chemical agents in the environment responsible? If they are, what impact are they having on cognitive development? Nobody knows. Reported mental illness is also on the rise. The share of U.S. teenagers with a reported major depressive episode over the prior year surged by over 60% between 2010 and 2017 (Chart II-13). The fraction of young adults that made suicide plans nearly doubled.20 More than 20% of U.S. women over the age of 40 are on antidepressants.21 Five percent of U.S. children are receiving ADHD medication.22
The Most Important Trend In The World Has Reversed And Nobody Knows Why
The Most Important Trend In The World Has Reversed And Nobody Knows Why
Implications For Economic Growth And Asset Markets So far, the reversal of the Flynn Effect has been largely confined to the developed economies. Test scores are still rising in the developing world, albeit from fairly low levels. For example, two recent studies have documented significant IQ gains in Kenya and Brazil.23 In the poorest countries, opportunities for improving health abound. Even small steps such as fortifying salt with iodine (which costs about five cents per person per year) have been shown to boost IQ by nearly one standard deviation.24 Measures to reduce inbreeding are also likely to boost IQ scores.25 Yet, we should not underestimate the importance of falling cognitive skills in developed economies. Chart II-14 shows that there is a clear positive correlation between student score on math and science and per capita incomes.
The Most Important Trend In The World Has Reversed And Nobody Knows Why
The Most Important Trend In The World Has Reversed And Nobody Knows Why
Most technological innovation still takes place in developed economies. There is an extremely tight relationship between visuospatial IQ and the likelihood of becoming an inventor (Chart II-15). Since IQ is distributed along a bell curve, a 0.1 standard deviation drop in IQs across the entire distribution will result in an 8% decline in the share of people with IQs over 100, a 14% decline in those with IQs over 115, and a 21% decline in those with an IQ over 130 (by convention, each standard deviation on an IQ test is worth 15 points).
The Most Important Trend In The World Has Reversed And Nobody Knows Why
The Most Important Trend In The World Has Reversed And Nobody Knows Why
Falling IQs could result in slower productivity growth, which could further strain fiscal balances. Lower IQs are also associated with decreased future orientation.26 People who live for the moment tend to save less. A decline in savings would push up real rates, leading to less capital accumulation. History suggests that a deceleration in productivity growth and higher real rates will put downward pressure on equity multiples (Chart II-16).
The Most Important Trend In The World Has Reversed And Nobody Knows Why
The Most Important Trend In The World Has Reversed And Nobody Knows Why
Part 4: Generation E For 200 years, the environmentally-driven Flynn Effect disguised the underlying genetically-driven decline in IQs that began not long after the dawn of the Industrial Revolution. Flynn has acknowledged this himself, noting at the 2017 International Society For Intelligence Research Conference that “I have no doubt that there has been some deterioration of genetic quality for intelligence since the late Victorian times.”27 Now that the Flynn Effect has reversed, both genes and the environment are working together to reduce cognitive abilities in developed economies. This means that the most important trend in the world – a trend that allowed the human population to increase during the Malthusian era and later allowed output-per-worker to soar following the Industrial Revolution – has broken down. Yet, there may be another twist in the story – one that began just a few months ago: the first members of Generation E were born. E Is For Edited ... Or Eugenics Lulu and Nana will be like most other children, but with one key difference: They will be the first humans ever to have their genomes edited through a procedure know as CRISPR-Cas9. Rogue Chinese scientist He Jiankui deactivated their CCR5 gene, which the HIV virus uses as a gateway into the body. His actions were rightfully condemned around the world for endangering the twins’ health by using a procedure that has not yet been fully vetted in animal studies, let alone in human trials (Lulu and Nana’s father is HIV+ but it is debatable whether the children were at an elevated risk of infection). He Jiankui remains under house arrest at the university where he worked. But whatever his fate, the dam has been broken. For better or for worse, the era of personal eugenics has arrived. The Return Of The Silver Fox It is easier to delete a gene than to add one. It is even more difficult to swap out a large number of genes in a way that achieves a predictable outcome. Thus, the successful manipulation of highly polygenic traits such as intelligence — traits that are linked to hundreds of different genes – may still be decades away.28 Predicting a trait is much simpler than modifying it, however. The cost of sequencing a human genome has fallen by more than 99% since 2001 (Chart II-17). Start-up company Genomic Prediction has already developed a test for fertilized embryos for IVF users that predicts height within a few centimetres and IQ with a correlation of 0.3-to-0.4, roughly as accurate as standardized tests such as the SAT or ACT.29 Other companies are following suit.30
The Most Important Trend In The World Has Reversed And Nobody Knows Why
The Most Important Trend In The World Has Reversed And Nobody Knows Why
Some will recoil in horror at the prospect of selecting prospective children in this manner. They will argue that such technologies, beyond being simply immoral, will widen social inequality between those who can afford them and those who cannot. Others will counter that screening embryos for certain traits is not that dissimilar to what people already do with prospective romantic partners. They will also point out that mass usage of these technologies will drive down prices to the point that even poor people will be able to access them, thus giving low IQ parents the chance to have high IQ kids. They might also note that such technologies may be the only way to reverse the ongoing accumulation of deleterious mutations within the human germline that has been the unintended by-product of the proliferation of life-saving medicines.31 We will not wade into this thorny debate, other than to note that there will be huge incentives for people to avail themselves of these technologies. The Coming Eugenic Wars And not just individuals either – governments too. While the initial impact of eugenic technologies will be small, the effects will compound over time. Carl Shulman and Nick Bostrom estimate that genetic screening could boost average IQs by up to 65 points in five generations (Table II-2).
The Most Important Trend In The World Has Reversed And Nobody Knows Why
The Most Important Trend In The World Has Reversed And Nobody Knows Why
China has been investing heavily in genetic technologies. As Geoffrey Miller has argued, China’s infatuation with eugenics spans into the modern day.32 Like most other countries, fertility in China is negatively correlated with IQ. Mingrui Wang, John Fuerst, and Jianjun Ren estimate that China is currently losing nearly one-third of a point in generalized intelligence per decade, with the loss having accelerated rapidly between the 1960s and mid-1980s.33 The decline in the genetic component of Chinese IQs is coming at a time when the population itself is about to shrink. According to the UN’s baseline forecast, China will lose 450 million working-age people by the end of the century (Chart II-18). Meanwhile, the country is saddled with debt, the result of an economic model that has, for decades, recycled copious household savings into debt-financed fixed-investment spending in an effort to shore up domestic demand.
The Most Important Trend In The World Has Reversed And Nobody Knows Why
The Most Important Trend In The World Has Reversed And Nobody Knows Why
The authorities may be tempted to tackle all three problems simultaneously by adopting generous pro-natal measures – call it the “at least one-child policy”– which increasingly harnesses emerging eugenic technologies. The resulting baby boom would strengthen domestic demand, thus making the economy less dependent on exports, while ensuring China’s long-term geopolitical viability. The Eugenic Wars are coming, and they will be unlike anything the world has seen before. BOX II-1 The Diffusion Of Bourgeois Values: Culture Or Genes? Higher-income people had more surviving children in the centuries leading up to the Industrial Revolution. Real per capita income was broadly stable during this period. This implies that there must have been downward social mobility, with sons, on average, being less wealthy than their fathers. This downward mobility, in turn, spread the characteristics of higher-income people across the broad swathe of society. What were these characteristics? Cultural values that emphasized thrift, diligence, and literacy were undoubtedly part of what was passed on to future generations. But surprisingly, it also appears that genetic transmission played an important, and perhaps pivotal, role. Models of genetic transmission make very concrete predictions about the correlations in economic status that one would expect to see among relatives. Biological brothers share 50% of their genes, as do fathers and sons. Likewise, first cousins share 25% of their genes, the same as grandfathers and sons. These facts yield two testable predictions: The first is that the correlation coefficient on status measures such as wealth, occupation, and education should be the same for relatives that share the same fraction of genes such as sibling pairs and father-son pairs. Box Chart II-1 shows that this is borne out by the data. The second prediction is that the correlation between status and genetic distance should follow a linear trend so that, for example, the correlation in wealth among brothers is twice that of first cousins and four times that of second cousins. Box Chart II-2 shows that this is also borne out by the data.
Image
Image
Other evidence supports the importance of genes in the transmission of status across generations. The correlation in measures such as wealth, education, and occupation is much higher among identical twins than fraternal twins. Adopted children turn out to be more similar to their biological parents on these measures when they reach adulthood than their adopted parents, even when the children have never met their biological parents. The parent-child correlation also remains the same regardless of family size, suggesting that spreading the same resources over more children may not harm life outcomes to any discernible degree, at least on the measures listed above. Peter Berezin Chief Global Strategist Global Investment Strategy III. Indicators And Reference Charts Our tactical equity upgrade to overweight last month has still not been confirmed by most of our proprietary indicators. Our Willingness-to-Pay (WTP) indicator for the U.S. is falling fast. It is also eroding for Europe, although it has ticked higher in Japan. The WTP indicators track flows, and thus provide information on what investors are actually doing, as opposed to sentiment indexes that track how investors are feeling. Investors have clearly moved funds away from the U.S. equity market and there is no sign yet that this is reversing. Our Revealed Preference Indicator (RPI) for stocks continued to issue a ‘sell’ signal in January. The RPI combines the idea of market momentum with valuation and policy measures. It provides a powerful bullish signal if positive market momentum lines up with constructive signals from the policy and valuation measures. Conversely, if constructive market momentum is not supported by valuation and policy, investors should lean against the market trend. While the RPI is still cautious, value has improved significantly according to BCA’s composite valuation indicator. It is a composite of 11 different valuation measures. This indicator almost reached the fair value line in December. Moreover, our Monetary Indicator has suddenly shifted out of negative territory for stocks, rising to the neutral line in December. Calming words from the Fed has improved the monetary backdrop by removing expected rate hikes from the money market curve. Given the improvement in both value and the monetary backdrop, the RPI could generate a ‘buy’ signal next month. Our Composite Technical indicator for stocks broke down last month, providing a clear ‘sell’ signal, and has not yet delivered a ‘buy’. However, sentiment is now washed out and earnings expectations have been revised heavily downward. These signals are bullish from a contrary perspective. The 10-year Treasury yield is in the neutral range according to our valuation model. Bonds are not overbought, despite the rally in December, because they were still working off oversold conditions. Contrary to the bond valuation model, the 10-year term premium moved further into negative territory in January, suggesting that yields are unsustainably low. Our bond-bearish bias is consistent with the view that the Fed rate hike cycle is not over. The U.S. dollar is somewhat overbought and very expensive on a PPP basis. Nonetheless, we believe it will become more expensive in the first half of 2019, before its structural downtrend resumes in broad trade-weighted terms. EQUITIES: Chart III-1U.S. Equity Indicators
U.S. Equity Indicators
U.S. Equity Indicators
Chart III-2Willingness To Pay For Risk
Willingness To Pay For Risk
Willingness To Pay For Risk
Chart III-3U.S. Equity Sentiment Indicators
U.S. Equity Sentiment Indicators
U.S. Equity Sentiment Indicators
Chart III-4Revealed Preference Indicator
Revealed Preference Indicator
Revealed Preference Indicator
Chart III-5U.S. Stock Market Valuation
U.S. Stock Market Valuation
U.S. Stock Market Valuation
Chart III-6U.S. Earnings
U.S. Earnings
U.S. Earnings
Chart III-7Global Stock Market And Earnings: Relative Performance
Global Stock Market And Earnings: Relative Performance
Global Stock Market And Earnings: Relative Performance
Chart III-8Global Stock Market And Earnings: Relative Performance
Global Stock Market And Earnings: Relative Performance
Global Stock Market And Earnings: Relative Performance
FIXED INCOME: Chart III-9U.S. Treasurys And Valuations
U.S. Treasurys And Valuations
U.S. Treasurys And Valuations
Chart III-10Yield Curve Slopes
Yield Curve Slopes
Yield Curve Slopes
Chart III-11Selected U.S. Bond Yields
Selected U.S. Bond Yields
Selected U.S. Bond Yields
Chart III-1210-Year Treasury Yield Components
10-Year Treasury Yield Components
10-Year Treasury Yield Components
Chart III-13U.S. Corporate Bonds And Health Monitor
U.S. Corporate Bonds And Health Monitor
U.S. Corporate Bonds And Health Monitor
Chart III-14Global Bonds: Developed Markets
Global Bonds: Developed Markets
Global Bonds: Developed Markets
Chart III-15Global Bonds: Emerging Markets
Global Bonds: Emerging Markets
Global Bonds: Emerging Markets
CURRENCIES: Chart III-16U.S. Dollar And PPP
U.S. Dollar And PPP
U.S. Dollar And PPP
Chart III-17U.S. Dollar And Indicator
U.S. Dollar And Indicator
U.S. Dollar And Indicator
Chart III-18U.S. Dollar Fundamentals
U.S. Dollar Fundamentals
U.S. Dollar Fundamentals
Chart III-19Japanese Yen Technicals
Japanese Yen Technicals
Japanese Yen Technicals
Chart III-20Euro Technicals
Euro Technicals
Euro Technicals
Chart III-21Euro/Yen Technicals
Euro/Yen Technicals
Euro/Yen Technicals
Chart III-22Euro/Pound Technicals
Euro/Pound Technicals
Euro/Pound Technicals
COMMODITIES: Chart III-23Broad Commodity Indicators
Broad Commodity Indicators
Broad Commodity Indicators
Chart III-24Commodity Prices
Commodity Prices
Commodity Prices
Chart III-25Commodity Prices
Commodity Prices
Commodity Prices
Chart III-26Commodity Sentiment
Commodity Sentiment
Commodity Sentiment
Chart III-27Speculative Positioning
Speculative Positioning
Speculative Positioning
ECONOMY: Chart III-28U.S. And Global Macro Backdrop
U.S. And Global Macro Backdrop
U.S. And Global Macro Backdrop
Chart III-29U.S. Macro Snapshot
U.S. Macro Snapshot
U.S. Macro Snapshot
Chart III-30U.S. Growth Outlook
U.S. Growth Outlook
U.S. Growth Outlook
Chart III-31U.S. Cyclical Spending
U.S. Cyclical Spending
U.S. Cyclical Spending
Chart III-32U.S. Labor Market
U.S. Labor Market
U.S. Labor Market
Chart III-33U.S. Consumption
U.S. Consumption
U.S. Consumption
Chart III-34U.S. Housing
U.S. Housing
U.S. Housing
Chart III-35U.S. Debt And Deleveraging
U.S. Debt And Deleveraging
U.S. Debt And Deleveraging
Chart III-36U.S. Financial Conditions
U.S. Financial Conditions
U.S. Financial Conditions
Chart III-37Global Economic Snapshot: Europe
Global Economic Snapshot: Europe
Global Economic Snapshot: Europe
Chart III-38Global Economic Snapshot: China
Global Economic Snapshot: China
Global Economic Snapshot: China
Mark McClellan Senior Vice President The Bank Credit Analyst Footnotes 1 Please see The Bank Credit Analyst Special Report "The Long Shadow Of The Financial Crisis," dated October 25, 2018, available at bca.bcaresearch.com 2 The amount of spread widening required for corporate returns to break-even with duration-matched U.S. Treasuries on a one-year horizon. 3 Please see Geopolitical Strategy Special Report "Five Black Swans In 2019," dated January 16, 2019, available at gps.bcaresearch.com 4 Xi Song, Cameron Campbell, and James Lee, "Descent Line Growth and Extinction From A Multigenerational Perspective, Extended Abstract," American Sociological Review 80:3, (April 21, 2015): 574-602. 5 Gregory Cochran and Henry Harpending, "The 10,000 Year Explosion: How Civilization Accelerated Human Evolution," Basic Books, (2009). 6 Mark Grinblatt, Matti Keloharju, and Juhani T. Linnainmaa, “IQ, Trading Behavior, and Performance,” Journal of Financial Economics, 104:2, (May 2012): 339-362. 7 Thomas Bouchard, "Genetic Influence On Human Psychological Traits - A Survey," Current Directions in Psychological Science 13:4, (August 2004): 148-151. 8 The tendency for the genetic contribution to IQ to increase until early adulthood and then to remain at high levels until old age is known as the Wilson Effect. There is no consensus on what causes it, but it probably reflects a number of factors: 1) It may take some children longer than normal to reach full intellectual maturity. Testing their IQs at a young age will result in scores that are lower than those expected based on their parents’ IQs. The opposite is true for children whose IQs increase relatively quickly in young age, but possibly top out earlier; 2) Environmental effects are probably more important in young age when a child’s brain is still quite malleable; 3) Self-reinforcing gene-environment interactions tend to increase with age. Children do not have much control over their environment, but as they get older, they will seek out activities that are more in keeping with their genetic predispositions. For example, a studious child may pursue a career that reinforces their love of learning. 9 "Cache Cab: Taxi Drivers' Brains Grow to Navigate London's Streets," Scientific American, (December 2011). 10 Atheendar Venkataramani, "Early Life Exposure to Malaria and Cognition in Adulthood: Evidence from Mexico," Journal of Health Economics 31:5, (July 2012): 767-780; Hoyt Bleakley, "Health, Human Capital and Development," Annual Review of Economics 2, (March 2010): 283-310; Hoyt Bleakley, "Malaria Eradication in the Americas: A Retrospective Analysis of Childhood Exposure," American Economic Journal: Applied Economics 2, (April 2010): 1-45. 11 "Anthropologists Find American Heads Are Getting Larger," ScienceDaily, (May 2012). 12 "British Teenagers Have Lower IQs Than Their Counterparts Did 30 Years Ago," The Telegraph, (February 2009). 13 Bernt Bratsberg and Ole Rogeberg, "Flynn Effect And Its Reversal Are Both Environmentally Caused," Proceedings of the National Academy of Sciences 115:26, (June 2018): 6674-6678. 14 On the face of it, artificial intelligence would appear to be a substitute for human intelligence. Many applications of AI would undoubtedly have this feature, especially those that allow computers to perform complex mental tasks that humans now must do. However, there are several ways that AI may eventually come to complement human intelligence. First, and most obviously, AI could be used to augment human capabilities either directly by hardwiring it into our brains, or indirectly through the development of drugs or genetic techniques which improve cognition. Second, looking further out, the benefits of highly intelligent AI systems would be limited if humans did not possess the requisite intelligence to understand certain concepts that are currently beyond our mental reach. No matter how well intentioned, trying to explain string theory to a mouse is not going to succeed. There are probably a multitude of ideas that AI could reveal that we simply cannot comprehend at current levels of human intelligence. 15 James Heckman and Paul La Fontaine, "The American High School Graduation Rate: Trends and Levels," The Review of Economics and Statistics 92:2, (May 2010): 244–262. 16 "Turning Around Chronically Low-Performing Schools," The Institute of Education Sciences (IES), (May 2008). 17 E. von Mutius, F.D. Martinez, C. Fritzsch, T. Nicolai, G. Roell, and H. H. Thiemann, "Prevalence Of Asthma And Atopy In Two Areas Of West Germany And East Germany," American Journal of Respiratory and Critical Care Medicine 149:2, (February 1994): 358-64. 18 "Sperm Counts In The West Plunge By 60% In 40 Years As ‘Modern Life’ Damages Men’s Health," Independent, (July 2017). 19 Kaspar Sørensen, Annette Mouritsen, Lise Aksglaede, Casper P. Hagen, Signe Sloth Mogensen, and Anders Juul, "Recent Secular Trends in Pubertal Timing: Implications for Evaluation and Diagnosis of Precocious Puberty," Hormone Research in Paediatrics 77:3, (May 2012): 137-145. 20 “Results from the 2017 National Survey On Drug Use And Health: Detailed Tables,” Substance Abuse and Mental Health Services Administration, Center for Behavioral Health Statistics and Quality, Rockville (Maryland), (September, 2018). 21 Laura A. Pratt, Debra J. Brody, and Qiuping Gu, "Antidepressant Use Among Persons Aged 12 and Over: United States, 2011–2014," NCHS Data Brief No. 283, Centers for Disease Control and Prevention, (August 2017). 22 Some, but not all, of the increase in reported rates of mental illness may be due to more aggressive diagnosis by health practitioners. For example, a recent study revealed that children born in August were 30% more likely to receive an ADHD diagnosis than those born in September, simply because they were less mature compared to other kids in the first few years of elementary school. See: Timothy J. Layton, Michael L. Barnett, Tanner R. Hicks, and Anupam B. Jena, "Attention Deficit-Hyperactivity Disorder and Month of School Enrollment," New England Journal of Medicine 379:22, (November 2018): 2122-2130. 23 Tamara C. Daley, Shannon E. Whaley, Marian D. Sigman, Michael P. Espinosa, and Charlotte Neumann, "IQ On The Rise: The Flynn Effect In Rural Kenyan Children," Psychological Science 14:3, (June 2003): 215-9; Jakob Pietschnig and Martin Voracek, "One Century of Global IQ Gains: A Formal Meta-Analysis of the Flynn Effect (1909-2013)," Perspectives on Psychological Science 10:3, (May 2015): 282-306. 24 N. Bleichrodt and M. P. Born, “Meta-Analysis of Research on Iodine and Its Relationship to Cognitive Development,” In: ed. J. B. Stanbury, "The Damaged Brain of Iodine Deficiency," Cognizant Communication Corporation, New York, (1994): 195-200; "Iodine status worldwide: WHO Global Database on Iodine Deficiency," World Health Organization, Geneva, (2004). 25 Mohd Fareed and Mohammad Afzal, "Estimating the Inbreeding Depression on Cognitive Behavior: A Population Based Study of Child Cohort," PLOS ONE 9:12, (October 2015): e109585. 26 H. de Wit, J. D. Flory, A. Acheson, M. McCloskey, and S. B. Manuck, "IQ And Nonplanning Impulsivity Are Independently Associated With Delay Discounting In Middle-Aged Adults," Personality and Individual Differences 42:1, (January 2007): 111-121; W. Mischel and R. Metzner, "Preference For Delayed Reward As A Function Of Age, Intelligence, And Length Of Delay Interval," Journal of Abnormal and Social Psychology 64:6, (July 1962): 425-31. 27 James Flynn, “IQ decline and Piaget: Does the rot start at the top?” Lifetime Achievement Award Address, 18th Annual meeting of ISIR, (July 2017). 28 For a good discussion of these issues, please see Richard J. Haier, “The Neuroscience of Intelligence,” Cambridge Fundamentals of Neuroscience in Psychology, (December 2016). 29 "The Future of In-Vitro Fertilization and Gene Editing," Psychology Today, (December 2018). 30 "DNA Tests For IQ Are Coming, But It Might Not Be Smart To Take One," MIT Technology Review, (April 2018). 31 Michael Lynch, "Rate, Molecular Spectrum, And Consequences Of Human Mutation," Proceedings of the National Academy of Sciences 107:3, (January 2010): 961-968. 32 Geoffrey Miller, "What *Should* We Be Worried About?" Edge, (2013). 33 Mingrui Wang, John Fuerst, and Jianjun Ren, "Evidence Of Dysgenic Fertility In China," Intelligence 57, (April 2016): 15-24. EQUITIES:FIXED INCOME:CURRENCIES:COMMODITIES:ECONOMY:
Highlights The main headwinds to euro area growth in 2018 are easing in 2019, at least in part and for the time being. The two main tail-risks are a messy Brexit and financial market volatility, but these are not our central case. Stay overweight the Eurostoxx50 versus the S&P500. Go underweight German bunds. Go overweight the German DAX versus German long-dated bunds. Add the German DAX as a new long position to the existing long basket holdings in France, Ireland and Switzerland. Maintain the short basket holdings in Norway and Denmark. Feature Chart of the WeekThe Underperformance Of German Equities Vs. German Bonds Is At A Euro Debt Crisis Extreme!
The Underperformance Of German Equities Vs. German Bonds Is At A Euro Debt Crisis Extreme!
The Underperformance Of German Equities Vs. German Bonds Is At A Euro Debt Crisis Extreme!
Economies do not grow in straight lines. Rather, the process of economic expansion is a never-ending ebb and flow, creating clockwork-like oscillations in economic activity. As a perfect illustration, the growth in the euro area wage bill has trended higher through the past five years and is now running at very healthy 4 percent clip. Yet this strong uptrend has been interspersed with wobbles that have occurred with a remarkable regularity (Chart I-2). Chart I-2Economies Have Regular Wobbles...
Economies Have Regular Wobbles...
Economies Have Regular Wobbles...
The recent setback in euro area activity has spooked some economy watchers. Even the ECB has just moved its risk assessment surrounding the growth outlook to the downside. But the downgrade was largely a result of its ‘data-dependency’ which, by definition, is always backward looking. This meant that the downgrade had a negligible effect on the financial markets which are always forward looking. For the markets, there is a much more important issue: is the recent setback the start of something serious, or can we expect a bounce back? The Setback The explanation for the regular wobbles in euro area growth comes from the oscillations in global economic activity (Chart I-3). But here we need to be wary of a potentially circular argument. As Europe is a dominant component of the global economy, euro area domestic demand setbacks could themselves be the root cause of the over-arching global growth oscillations. Chart I-3...Because Of Clockwork-Like Oscillations In Global Economic Activity
...Because Of Clockwork-Like Oscillations In Global Economic Activity
...Because Of Clockwork-Like Oscillations In Global Economic Activity
Recently, Italy and Germany have suffered idiosyncratic ‘country and sector specific’ setbacks. The spat between Rome and Brussels over Italy’s 2019 budget caused Italian bond yields to soar and Italian bank lending to contract viciously (Chart I-4). Meanwhile, the auto sector – a major engine of the German economy – spluttered as it absorbed the new WLTP emissions testing standard. Through the middle of 2018 German vehicle exports suffered a €20 billion hit which shaved 0.6 percent from the €3.4 trillion German economy (Chart I-5). Chart I-4Italian Bank Lending Contracted Viciously, But Will Now Recover
Italian Bank Lending Contracted Viciously, But Will Now Recover
Italian Bank Lending Contracted Viciously, But Will Now Recover
Chart I-5German Auto Exports Plunged, But Will Now Recover
German Auto Exports Plunged, But Will Now Recover
German Auto Exports Plunged, But Will Now Recover
Despite all of this, the epicentre of the 2018 growth setback was not inside Europe, but outside Europe. The ECB correctly blames the recent down-oscillation not on domestic causes, but on softer external demand, specifically “vulnerabilities in emerging markets”. The central bank argues that once there is clarity on the exports and the trade sector, much of the euro area’s weakness will wash out. Another very important driver of European growth oscillations is the oil price. In recent years, the growth in GDP in excess of wages has perfectly and inversely tracked oscillations in the oil price (Chart I-6). The simple reason is that Europeans are net importers of energy, and the amount of energy they consume tends to be price inelastic. Hence, when energy prices soar as they did for most of 2018, it squeezes European real spending. Conversely, when energy prices plunge as they have more recently, it boosts real spending. Chart I-6Oil: Another Driver Of European Growth
Oil: Another Driver Of European Growth
Oil: Another Driver Of European Growth
Somewhat contrary to received wisdom, one thing that does not generally drive euro area growth oscillations is the euro exchange rate. When the euro weakens, it does of course make the euro area’s exporters more competitive. But working against this, a weaker euro also raises the prices of imported energy and food, thereby squeezing euro area consumers’ real incomes. And vice-versa when the euro strengthens. Hence, while the euro’s moves do create growth winners and losers within the euro area, these tend to cancel out at the aggregate economy level. The Bounce Back The main headwinds to euro area growth in 2018 are easing in 2019, at least in part and for the time being. Regarding the vulnerabilities in emerging markets, many ECB governors argue that “everything we know says that the Chinese government is taking strong measures to address its slowdown”. Recent improvements in China’s monetary statistics provide strong evidence for this view (Chart I-7). Chart I-76-Month Credit Impulses Are Bouncing Back Everywhere
6-Month Credit Impulses Are Bouncing Back Everywhere
6-Month Credit Impulses Are Bouncing Back Everywhere
Meanwhile, credit growth in the euro area itself is also accelerating, albeit modestly. This is hardly surprising given that financing conditions are very favourable. Even though the ECB has done nothing to policy interest rates, more dovish forward guidance has effectively made euro area monetary policy more accommodative: since October, core euro area 10-year bond yields are down 40 bps. And with banks’ balance sheets stronger, the ECB claims “the conditions for a continuation of credit to the economy are in place.” Over the same three month period, the crude oil price has plunged by 35 percent (Chart I-8). Draghi confirmed our observation above: lower energy prices support real disposable income for euro area households. Chart I-8Double Boost: Lower Bond Yields And Lower Oil
Double Boost: Lower Bond Yields And Lower Oil
Double Boost: Lower Bond Yields And Lower Oil
Draghi also pointed out another positive impulse: fiscal policy in the euro area has now flipped from contractionary to slightly expansionary. As regards the idiosyncratic sector specific setbacks, the Italian 10-year BTP yield has unwound its budget spat spike, and is down 100 bps since October. It follows that Italian bank credit growth is likely to recover. And Draghi explained that “the specific episode of the car industry in Germany will soon wash out because there is going to be a rebound in the sector.” Still, two significant tail-risks could smother the bounce back: Uncertainties related to geopolitical factors and the threat of protectionism, specifically, a messy Brexit. Financial market volatility. The Investment Implications Our central case is that the tail-risks do not materialise. And that the recent combination of more favourable financing conditions in the euro area and globally, lower energy prices, fiscal thrust, and the removal of specific setbacks in Italy and Germany should engineer some sort of growth bounce back in the euro area. One important implication is that the strong recent rally in German bunds is close to exhaustion, and even vulnerable to a short-term retracement. This is supported by our trusted technical indicator warning of an imminent liquidity shortage and a corrective price reversal (Chart I-9). Go underweight German bunds on a short term horizon. Chart I-9The Rally In The German Bund Is Exhausted
The Rally In The German Bund Is Exhausted
The Rally In The German Bund Is Exhausted
A mirror-image implication is that the underperformance of the German DAX relative to German long-dated bunds is now at euro debt crisis extremes (Chart I-1 and Chart I-10). This relative performance also appears technically exhausted and ripe for a reversal. As an asset allocation position, go overweight the DAX versus German long-dated bunds on a tactical. Chart I-10The Extreme Underperformance Of The DAX Will Reverse
The Extreme Underperformance Of The DAX Will Reverse
The Extreme Underperformance Of The DAX Will Reverse
In line with the growth rebound thesis, stock market selection – through the underlying sector exposures – should now have a modest tilt towards cyclicality. Stay overweight the Eurostoxx50 versus the S&P500. Within Europe, our current long positions in France, Ireland, and Switzerland combined with short positions in Norway and Denmark do provide the required tilt towards cyclicality. Nevertheless, today we are adding the oversold German DAX to our long stock markets basket. Fractal Trading System* In line with the fundamentals-based arguments in the main body of this report, this week’s recommended trade is to go long the DAX versus the 30-year bund. Set a profit target of 2.5 percent with a symmetrical stop-loss For any investment, excessive trend following and groupthink can reach a natural point of instability, at which point the established trend is highly likely to break down with or without an external catalyst. An early warning sign is the investment’s fractal dimension approaching its natural lower bound. Encouragingly, this trigger has consistently identified countertrend moves of various magnitudes across all asset classes. Chart I-11
Long DAX Vs. 30-Year Government Bond
Long DAX Vs. 30-Year Government Bond
The post-June 9, 2016 fractal trading model rules are: When the fractal dimension approaches the lower limit after an investment has been in an established trend it is a potential trigger for a liquidity-triggered trend reversal. Therefore, open a countertrend position. The profit target is a one-third reversal of the preceding 13-week move. Apply a symmetrical stop-loss. Close the position at the profit target or stop-loss. Otherwise close the position after 13 weeks. Use the position size multiple to control risk. The position size will be smaller for more risky positions. * For more details please see the European Investment Strategy Special Report “Fractals, Liquidity & A Trading Model,” dated December 11, 2014, available at eis.bcaresearch.com Dhaval Joshi, Senior Vice President Chief European Investment Strategist dhaval@bcaresearch.com Fractal Trading System Recommendations Asset Allocation Equity Regional and Country Allocation Equity Sector Allocation Bond and Interest Rate Allocation Currency and Other Allocation Closed Fractal Trades Trades Closed Trades Asset Performance Currency & Bond Equity Sector Country Equity Indicators Bond Yields Chart II-1Indicators To Watch - Bond Yields
Indicators To Watch - Bond Yields
Indicators To Watch - Bond Yields
Chart II-2Indicators To Watch - Bond Yields
Indicators To Watch - Bond Yields
Indicators To Watch - Bond Yields
Chart II-3Indicators To Watch - Bond Yields
Indicators To Watch - Bond Yields
Indicators To Watch - Bond Yields
Chart II-4Indicators To Watch - Bond Yields
Indicators To Watch - Bond Yields
Indicators To Watch - Bond Yields
Interest Rate Chart II-5Indicators To Watch - Interest Rate Expectations
Indicators To Watch - Interest Rate Expectations
Indicators To Watch - Interest Rate Expectations
Chart II-6Indicators To Watch - Interest Rate Expectations
Indicators To Watch - Interest Rate Expectations
Indicators To Watch - Interest Rate Expectations
Chart II-7Indicators To Watch - Interest Rate Expectations
Indicators To Watch - Interest Rate Expectations
Indicators To Watch - Interest Rate Expectations
Chart II-8Indicators To Watch - Interest Rate Expectations
Indicators To Watch - Interest Rate Expectations
Indicators To Watch - Interest Rate Expectations
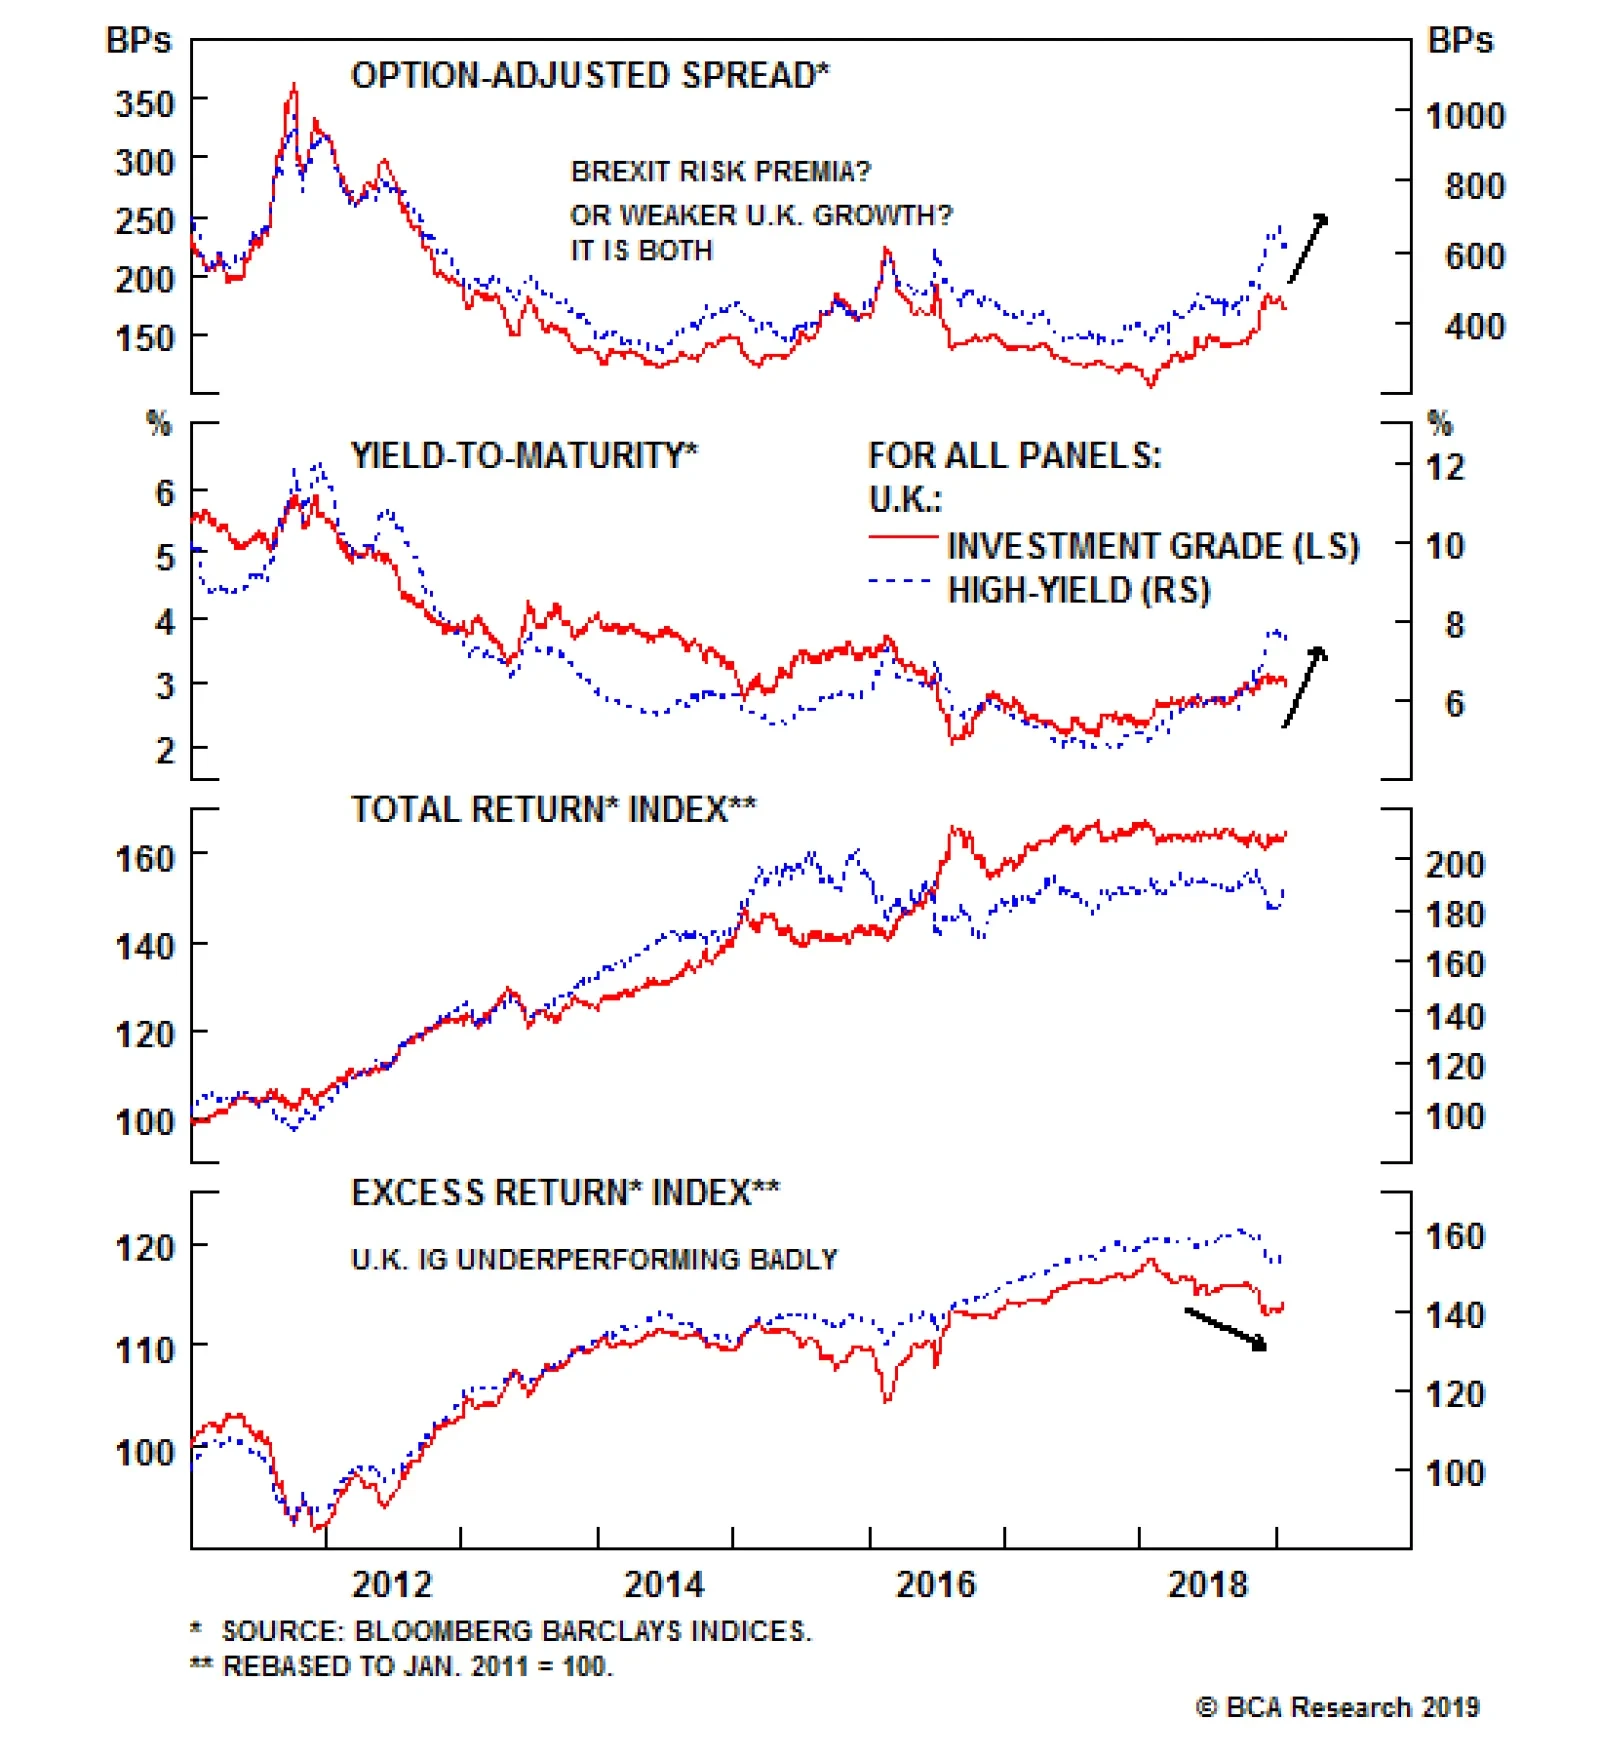
All the components of the U.K. CHM have contributed to this worsening trend. Even short-term liquidity, which had been in a powerful uptrend for almost a decade, has started to roll over. The cause for this deterioration can be reduced to one cause:…