Europe

Dear Client, Early next week, we will be sending you our BCA Outlook 2019 - our annual dialogue with the bearishly inclined Mr. X and his family. In this report, BCA editors will highlight the most impactful themes for the global economy next year, and the opportunities and risks they create for international asset markets. Next Friday, we will also send you our take on the implications of this discussion for the FX market. Best regards, Mathieu Savary, Vice President Foreign Exchange Strategy Highlights A bearish consensus is forming around the dollar for 2019 as U.S. growth is falling prey to global economic deterioration. However, slowing global growth and inflation create the best environment for the dollar, suggesting the greenback could perform very well in early 2019. While EUR/USD should trade below 1.10 before mid-2019, the dollar should be strongest against the AUD, the NZD and the SEK. The yen faces a trickier picture. With a low degree of conviction, we anticipate USD/JPY to depreciate; but with a high level of confidence, we foresee additional strength in the JPY against the AUD, the NZD and the SEK; EUR/JPY should move below 120. Close short CAD/NOK. Feature The end of the year is approaching, which means that like BCA, banks and research houses around the world are rolling out their major forecasts for the upcoming year. The near-uniform bearishness toward the greenback of the current vintage of forecasts has struck us. Our contrarian streak inclines us to re-assert our bullish dollar stance, but being contrarian for the sake of it is often the perfect recipe to lose money. Welcome To The Jungle A bearish tone on the dollar appears justified right now. Speculators hold near-record long bets on the dollar, yet U.S. economic data seem to finally be succumbing to the gravitational pull of slowing global economic activity. U.S. core inflation has disappointed, orders have been weak, capex intentions have softened, the Conference Board's leading economic indicator has rolled over, and financial conditions have tightened as junk bonds have sold off. This combination could easily generate the perfect recipe for the dollar to sell off. The dollar's strength has been rooted in the divergence of U.S. growth from a weak world economy (Chart I-1). As the narrative goes, without U.S. strength, the Federal Reserve will not be tightening policy anymore, and the dollar will sag. Interest rate markets are already on this page, as after the December meeting they only foresee one more rate hike over the coming two years. Chart I-1Will The Dollar Lose A Key Support?
Will The Dollar Lose A Key Support?
Will The Dollar Lose A Key Support?
Despite this tantalizing narrative, the dollar rarely weakens because of poor U.S. growth alone. To the contrary, dives in our diffusion index of 16 key U.S. economic variables are most often associated with a strengthening greenback (Chart I-2). The recent sharp fall in this diffusion index would actually point to an appreciating USD. Chart I-2The Plot Thickens
The Plot Thickens
The Plot Thickens
This relationship is obviously paradoxical. It exists because the dollar is not a normal currency: it is the premier reserve currency of the world. Resting at the center of the global financial system, the dollar is more sensitive to global growth and inflation conditions than to U.S. growth and policy alone. As Chart I-3 shows, the dollar's behavior is a function of where we stand in the global economic and inflation cycle. We looked at the performance of G-10 currencies versus the dollar since 1986, decomposing the period in four samples based on trends in global activity and global headline inflation. We observed the following patterns: When global growth is accelerating but inflation is decelerating, the dollar tends to weaken, especially against the very pro-cyclical AUD, NZD and SEK (Bottom right quadrant). This is often an environment observed in the early days of a business cycle recovery. When global growth and global inflation are both accelerating, the dollar also tends to weaken, but the pattern is much less clear than in the previous stage (Top right quadrant). This is generally a mid-cycle environment. When global growth is decelerating but global inflation is accelerating, the dollar weakens much more clearly than in the mid-cycle stage (Top left quadrant). In this stage, global growth has begun to decelerate but is still elevated. Risk assets are doing well, but some clouds are gathering on the horizon. European currencies perform best. The most distinct change in the dollar's behavior happens when both global growth and global inflation are decelerating (Bottom left quadrant). In this context, the dollar is strong across the board. This is an end-of-cycle environment where global growth is poor and inflation sags. Investors become very risk averse and they favor the dollar. Commodity currencies and Scandinavian currencies are the worst performers, while the yen is the best. We were surprised that the yen did not manage to appreciate during the periods described by the bottom-left quadrant. However, this is due to the long sample used (since 1986). Prior to the mid-1990s, the yen was a decidedly pro-cyclical currency. This taints the study's overall results. If we only use a shortened time span, the yen in fact appreciates in the last stage of the global business cycle. The yen is the only currency to experience such a sharp regime shift in its relationship to the global business cycle. Chart I-3The Dollar And The Global Business Cycle
Appetite For Destruction? FX Investing For Slowing Global Growth And Inflation
Appetite For Destruction? FX Investing For Slowing Global Growth And Inflation
Bottom Line: Dividing the business cycle into four periods shows that only when global growth and inflation are very weak can the dollar unequivocally rally. This is exactly what we would anticipate of a reserve currency. Investors flock to it when they are looking for safety. Moreover, since being the global reserve currency also means that most of the world's foreign-currency borrowing is in dollars, periods of tumult force debtors to repay their debt, prompting them to buy the greenback in the process. Finally, the low beta of the U.S. economy to the global industrial cycle only adds fuel to the fire, as it means that U.S. growth outperforms global growth when global activity deteriorates meaningfully. Paradise City Under this lens, the dollar's strength this year was rather impressive. We have seen global growth slow, but global inflation accelerate. This could have been a disastrous year for the dollar, but it was not. Markets have been sniffing out slower growth and its potentially deflationary impact; hence, the dollar has responded well. Moreover, the dollar started the year trading at a 5% discount to its fair value, and investors were massively short. Finally, as we have previously showed, the dollar is the epitome of momentum currencies within the G-10 space, and this year, our momentum measure flagged a very bullish signal for the dollar (Chart I-4).1 Chart I-4Momentum Has And Continues To Support The Greenback
Momentum Has And Continues To Support The Greenback
Momentum Has And Continues To Support The Greenback
While the dollar has already been strong, the next three to six months could generate considerably more dollar strength. The dollar may not be cheap anymore, but as we argued last week, it is not expensive either.2 Moreover, while investors are already very long the dollar - a source of concern for us - momentum still favors the greenback. Finally, the global economy might spend some time in the bottom-left quadrant described above where global growth and global inflation both decelerate - the quadrant where the dollar strengthens. Thus, both momentum and economics could line up to enhance the dollar's appeal. First, we have already highlighted that global growth is in the process of weakening. Under the weight of China's deleveraging efforts, of uncertainty surrounding global trade under the Trump administration, and of the tightening in EM financial conditions, global export growth has been flailing.3 Now, our global economic and financial advance/decline line shows that enough variables are pointing in a growth-negative direction that global industrial production - not just orders and surveys - is set to deteriorate sharply (Chart I-5). Chart I-5Global Growth Will Slow Materially In The First Half Of 2019
Global Growth Will Slow Materially In The First Half Of 2019
Global Growth Will Slow Materially In The First Half Of 2019
This message is confirmed by the OECD's leading economic indicator, which is falling faster than it was in late 2015. Most crucially, the very poor performance of EM carry trades financed in yen, which have been a reliable forecaster of global industrial activity, point to a sharp deterioration of our Global Nowcast (Chart I-6), an indicator that measures the evolution of global industrial activity while bypassing the long publishing lags inherent in global IP statistics. Chart I-6The Canaries Are Suffocating
The Canaries Are Suffocating
The Canaries Are Suffocating
Second, while global inflation has been on an uptrend, we expect it to soon relapse, potentially for six months or so. To begin with, we are already seeing some key global inflation measures soften. Recent U.S. core inflation releases have disappointed, Japan's GDP deflator has grown more negative, Germany's producer prices have decelerated, and both producer and core consumer prices in China are slowing sharply. If we are to believe financial markets, this development has further to run. The change in 10-year and 5-year/5-year forward U.S. inflation break-evens has collapsed, and the performance of U.S. industrial stocks relative to utilities suggest that global core inflation will soon decelerate noticeably (Chart I-7). Additionally, the annual total returns of EM equities relative to EM bonds, adjusted for their mutual volatility, has fallen, which normally also foreshadows a decline in underlying global inflation (Chart I-8). Chart I-7U.S. Financial Market Point To Slower Global Inflation...
U.S. Financial Market Point To Slower Global Inflation...
U.S. Financial Market Point To Slower Global Inflation...
Chart I-8...So Do EM Stocks And Bonds
...So Do EM Stocks And Bonds
...So Do EM Stocks And Bonds
The trend in some of the most important globally traded good prices is also very worrisome for inflation hawks, at least for the first half of 2019. Oil has fallen 26% since its October peak, but also, after rising nearly 90% from April to August, the Baltic Dry index has tumbled by nearly 45%. Another risk could exacerbate these deflationary forces: the Chinese yuan. The Chinese authorities are afraid of the potentially deeply negative impact on their economy of a trade war with the U.S. As a result, they have slowly been injecting monetary stimulus into the economy and are also adjusting fiscal policy to support the Chinese consumer. However, until now, these measures have not been enough to lift Chinese growth and investment. Chinese interest rates are thus likely to continue to lag behind U.S. rates. Deeper cuts to the reserve requirement ratio for commercial banks are also forthcoming. Historically, these developments have been associated with a weaker renminbi (Chart I-9). Chart I-9A Falling CNY Will Further Curtail Inflation
A Falling CNY Will Further Curtail Inflation
A Falling CNY Will Further Curtail Inflation
A softening CNY is deflationary for the world for three reasons: It decreases the purchasing power of China abroad; it cuts Chinese export prices; and it forces competitors to China to also lower their prices and let their currencies depreciate in order to maintain their own competitiveness in international markets. In other words, a falling yuan unleashes China's own deflationary forces onto the rest of the world. Bottom Line: While momentum has already been a tailwind for the dollar, now the global economy is likely to enter the quadrant where both growth and inflation decelerate. This means the greenback is likely to pick up an additional strong tailwind. Stay long the dollar. Nightrain Based on this analysis, the first half of 2019 could be very positive for the dollar. The Bottom left quadrant of Chart I-3 implies that EUR/USD is unlikely to suffer the greatest downside. Nonetheless, based on our preferred fair-value model for the euro - which is based on real short-rate differentials, yield curve slope differences, and the price of lumber relative to copper - the common currency needs to move below 1.1 before trading at a discount (Chart I-10). We expect the euro will settle between 1.10 and 1.05. Chart I-10EUR/USD Will Fall Below 1.1
EUR/USD Will Fall Below 1.1
EUR/USD Will Fall Below 1.1
If business cycle analysis is any guide, the dollar should shine most brightly against commodity currencies - the AUD and NZD in particular - and Scandinavian currencies. We closed our long NZD trades last week, and this week's analysis implies completely curtailing our positive bias toward the kiwi. Positive domestic economic results have lifted the AUD, but slowing global growth and inflation will hurt this very pro-cyclical economy. A key support for the expensive AUD will dissipate as quickly as it appeared. We had sold CAD/NOK, but this trade is not panning out. Global business cycle dynamics suggest that we should terminate this bet. Slowing global growth and inflation historically hurt the NOK more than the CAD. As Chart I-11 shows, under these circumstances, CAD/NOK does not depreciate, it appreciates. However, we remain committed to our long-term short AUD/CAD trade. This cross performs poorly in this quadrant of the global business cycle. This view is reinforced by the fact that Robert Ryan, BCA's head of commodities, continues to favor energy over base metals. Furthermore, the Canadian government unveiled C$14billion of corporate tax cuts this week, creating a marginal additional positive for the Canadian economy. We therefore do not expect AUD/CAD to break above the important technical resistance it currently faces. Instead, it is likely to embark on the last leg of a downtrend started in March 2017, which could culminate with AUD/CAD trading between 0.88 and 0.86 (Chart I-12). Chart I-11The Global Business Cycle Votes Nay To Short CAD/NOK, But Yea To Long AUD/CAD
Appetite For Destruction? FX Investing For Slowing Global Growth And Inflation
Appetite For Destruction? FX Investing For Slowing Global Growth And Inflation
Chart I-12Attractive Spot To Sell AUD/CAD
Attractive Spot To Sell AUD/CAD
Attractive Spot To Sell AUD/CAD
The yen is potentially the trickiest of all the currencies. At face value, the global business cycle analysis suggests the yen could depreciate against the dollar, but as we argued, this is an artefact of the long sample used in this analysis. A shorter sample would show the yen appreciating against the dollar. We are inclined to agree with this conclusion. Slowing global growth and inflation as well as a strong trade-weighted dollar could very well put a bid under the price of Treasury bonds over the next few months, especially as speculators are still large sellers of the whole U.S. government bond universe (Chart I-13). Since the yen remains broadly inversely correlated to Treasury yields, it may appreciate against the dollar over the coming three to six months. Chart I-13Extreme Positioning And A Poor Global Business Cycle Outlook Point To A Tactical Rally In Treasurys...
Extreme Positioning And A Poor Global Business Cycle Outlook Point To A Tactical Rally In Treasurys...
Extreme Positioning And A Poor Global Business Cycle Outlook Point To A Tactical Rally In Treasurys...
Our view has been and remains that the yen offers its most attractive reward-to-risk ratio on its crosses, not against the U.S. dollar. The business cycle analysis confirms that the yen has upside against all the other currencies when both global growth and inflation slows (Chart I-3, bottom left quadrant). The yen should, therefore, offer plentiful upside against the AUD, the NZD, the SEK and the NOK. Moreover, since the beginning of the year, a core view of this publication has been that EUR/JPY would depreciate4 - a trend that has materialized, albeit in a volatile fashion. Since the global business cycle is likely to put downward pressure on global yields for another three to six months, it should also push EUR/JPY lower (Chart I-14). Hence, a move in EUR/JPY below 120 is likely over the coming months. Chart I-14...Which Will Hurt EUR/JPY
...Which Will Hurt EUR/JPY
...Which Will Hurt EUR/JPY
Bottom Line: While EUR/USD could fall slightly below 1.1, the greenback is likely to experience its sharpest upside against the AUD, NZD, SEK and NOK. While selling CAD/NOK does not work when global growth and inflation decelerate, selling AUD/CAD does. The JPY is likely to experience more upside against the dollar, but the JPY is most attractive against commodity currencies and the euro. Mathieu Savary, Vice President Foreign Exchange Strategy mathieu@bcaresearch.com Footnotes 1 Please see Foreign Exchange Strategy Special Report, titled "Riding The Wave: Momentum Strategies In Foreign Exchange Markets", dated December 8, 2017, available at fes.bcaresearch.com 2 Please see Foreign Exchange Strategy Weekly Report, titled "Six Questions From The Road", dated November 16, 2018, available at fes.bcaresearch.com 3 Please see Foreign Exchange Strategy Weekly Report, titled "Clashing Forces: The Fed And EM Financial Conditions", dated October 19, 2018, available at fes.bcaresearch.com 4 Please see Foreign Exchange Strategy Weekly Report, titled "The Unstoppable Euro?", dated January 19, 2018, and Foreign Exchange Strategy Weekly Report, titled "The Yen's Mighty Rise Continues", dated February 16, 2018, available at fes.bcaresearch.com Currencies U.S. Dollar Chart II-1USD Technicals 1
USD Technicals 1
USD Technicals 1
Chart II-2USD Technicals 2
USD Technicals 2
USD Technicals 2
Recent data in the U.S. has been mixed: Capacity utilization came in above expectations, coming in at 78.4%. However, both initial jobless claims and continuing jobless claims surprised negatively, coming in at 224 thousand and 1.688 million. Finally, durable goods orders also disappointed expectations DXY has been roughly flat this week. Several indicators point to a slowdown on economic data. At face value this could imply that the dollar could fall. However, falling oil prices, point to a slowdown in global inflation. This factor, alongside slowing global growth has historically been very positive for the U.S. dollar. Thus, we maintain our long dollar position. Report Links: Six Questions From The Road - November 16, 2018 Updating Our Intermediate Timing Models - November 2, 2018 In Fall, Leaves Turn Red, The Dollar Turns Green - October 12, 2018 The Euro Chart II-3EUR Technicals 1
EUR Technicals 1
EUR Technicals 1
Chart II-4EUR Technicals 2
EUR Technicals 2
EUR Technicals 2
Recent data in the euro area has been mixed: Both core and headline inflation came in line with expectations, coming in at 1.1% and 2.2%, respectively. Headline inflation in Italy also came in line with expectations, at 1.6%. EUR/USD has risen by roughly 0.5% this week. Overall, we continue to be bearish on the euro, given that we expect an environment of declining growth and inflation, which usually is negative for EUR/USD. Moreover, large exposure to vulnerable emerging markets by European banks will continue to be a drag on how much the ECB can tighten policy. Report Links: Six Questions From The Road - November 16, 2018 Evaluating The ECB's Options In December - November 6, 2018 Updating Our Intermediate Timing Models - November 2, 2018 The Yen Chart II-5JPY Technicals 1
JPY Technicals 1
JPY Technicals 1
Chart II-6JPY Technicals 2
JPY Technicals 2
JPY Technicals 2
Recent data in Japan has been mixed: The All Industry Activity Index monthly change underperformed expectations, coming in at -0.9%. Meanwhile, national inflation ex-fresh food came in line with expectations at 1%. Finally, national inflation also came in line with expectations, coming in at 1.4%. USD/JPY has been flat this week. We remain positive on the trade-weighted yen, given that the continued slowdown in global growth, fueled by the dual tightening of policy by Chinese authorities and the Fed, will help safe haven currencies like the yen. Moreover, the current selloff in U.S. markets could also provide a boon for this currency if it forces the Fed to tamper its hawkishness. Report Links: Updating Our Intermediate Timing Models - November 2, 2018 Will Rising Wages Cause An Imminent Change In Policy Direction In Europe And Japan? - October 5, 2018 Rhetoric Is Not Always Policy - July 27, 2018 British Pound Chart II-7GBP Technicals 1
GBP Technicals 1
GBP Technicals 1
Chart II-8GBP Technicals 2
GBP Technicals 2
GBP Technicals 2
GBP/USD has risen by 0.9% this week. The market reacted positively to the draft of the Brexit agreement. Even if risks have begun to decline, the all clear for the pound has not been reached as political risks will continue to regularly inject doses of volatility into British assets. Moreover, the strength in the dollar should continue to weigh on cable. Report Links: Six Questions From The Road - November 16, 2018 Updating Our Intermediate Timing Models - November 2, 2018 Clashing Forces: The Fed And EM Financial Conditions - October 19, 2018 Australian Dollar Chart II-9AUD Technicals 1
AUD Technicals 1
AUD Technicals 1
Chart II-10AUD Technicals 2
AUD Technicals 2
AUD Technicals 2
AUD/USD has been flat this week. We are most negative on this currency within the G10, given that the AUD is highly sensitive to the Chinese industrial cycle, which will continue to slow down, as Chinese authorities keep cleaning credit excesses in the economy. Moreover, policy tightening by the Fed will provide a further headwind to cyclical plays like the AUD. We are short AUD/CAD within our portfolio, as we believe that global inflation will start to roll over. This deceleration in prices, coupled with slowing growth will provide a dangerous cocktail for this cross. Report Links: Updating Our Intermediate Timing Models - November 2, 2018 Policy Divergences Are Still The Name Of The Game - August 14, 2018 What Is Good For China Doesn't Always Help The World - June 29, 2018 New Zealand Dollar Chart II-11NZD Technicals 1
NZD Technicals 1
NZD Technicals 1
Chart II-12NZD Technicals 2
NZD Technicals 2
NZD Technicals 2
NZD/USD has been flat this week. While we were positive the NZD and capitalized on this view, we are becoming more cautious. We cannot rule out any further short-term upside, but on a six month basis, the NZD will likely experience heavy downside, as slowing global growth and inflation are major hurdles for this currency. Report Links: Updating Our Intermediate Timing Models - November 2, 2018 Clashing Forces: The Fed And EM Financial Conditions - October 19, 2018 In Fall, Leaves Turn Red, The Dollar Turns Green - October 12, 2018 Canadian Dollar Chart II-13CAD Technicals 1
CAD Technicals 1
CAD Technicals 1
Chart II-14CAD Technicals 2
CAD Technicals 2
CAD Technicals 2
USD/CAD has risen by 0.6% this week. The weakness in oil prices have caused the Canadian dollar to be one of the worst performing currencies in the G10 in recent weeks. We are reticent to be too bullish on the CAD, given that markets are now pricing in a BoC that will be more hawkish than the Fed. Nonetheless the CAD tends to outperform other commodity currencies when the global business cycle slows. Report Links: Updating Our Intermediate Timing Models - November 2, 2018 Clashing Forces: The Fed And EM Financial Conditions - October 19, 2018 Updating Our Long-Term FX Fair Value Models - June 22, 2018 Swiss Franc Chart II-15CHF Technicals 1
CHF Technicals 1
CHF Technicals 1
Chart II-16CHF Technicals 2
CHF Technicals 2
CHF Technicals 2
EUR/CHF has fallen by 0.7% this week. While global volatility can temporarily support the swiss france versus the euro, w continue to be bearish on the franc on a 12 to 18 months basis, given that Swiss growth and inflation remain too tepid for the SNB to hike policy rates. This point is confirmed by the recent rollover in industrial production. Moreover, the SNB will also have to intervene in currency markets if the franc becomes more expensive in response to the current risk-off environment. Report Links: Updating Our Intermediate Timing Models - November 2, 2018 Updating Our Long-Term FX Fair Value Models - June 22, 2018 Updating Our Intermediate Timing Models - May 18, 2018 Norwegian Krone Chart II-17NOK Technicals 1
NOK Technicals 1
NOK Technicals 1
Chart II-18NOK Technicals 2
NOK Technicals 2
NOK Technicals 2
USD/NOK has risen by 0.4% this week. Overall, we expect for the krone to have further downside as oil continues to fall while U.S. rates continue to rise. Moreover, if the fall in oil prices causes a large fall in inflation the krone could depreciate even more against the CAD, as this cross has historically fallen when this particular set of circumstances occur. Report Links: Updating Our Intermediate Timing Models - November 2, 2018 Clashing Forces: The Fed And EM Financial Conditions - October 19, 2018 Updating Our Long-Term FX Fair Value Models - June 22, 2018 Swedish Krona Chart II-19SEK Technicals 1
SEK Technicals 1
SEK Technicals 1
Chart II-20SEK Technicals 2
SEK Technicals 2
SEK Technicals 2
USD/SEK has been flat this week. Overall, we are bullish on the krona on a long-term basis. After all, the Riksbank is on the verge of beginning a tightening cycle, as imbalances in the Swedish economy are only growing more dangerous. The optimism on domestic factors is tempered by global risks. The krona tends to perform very poorly when global growth slows, as Sweden is very exposed to the gyrations of the global economy. Report Links: Updating Our Intermediate Timing Models - November 2, 2018 Updating Our Long-Term FX Fair Value Models - June 22, 2018 Updating Our Intermediate Timing Models - May 18, 2018 Trades & Forecasts Forecast Summary Core Portfolio Tactical Trades Closed Trades
Highlights The relative performance of developed market (DM) versus emerging market (EM) equities just corresponds to the relative performance of healthcare versus financials. On a six month horizon, DM will underperform EM. Within Europe, overweight Poland, Hungary and Czech Republic, but steer clear of energy-heavy Russia. Wait for the 10-year BTP yield to move closer to 3 percent before buying Italian assets, either in absolute or relative terms. Buy the pound on any sharp sell-offs during the Brexit psychodrama. Our medium-term expected value of pound/euro equals 1.18. Chart of the WeekDeveloped Vs. Emerging Markets = Healthcare Vs. Financials
Developed Vs. Emerging Markets = Healthcare Vs. Financials
Developed Vs. Emerging Markets = Healthcare Vs. Financials
Feature They say that to capture the Zeitgeist at any moment, all you need to do is name the top five companies in the world. So here are the top five companies in the developed equity markets (DM): Apple, Microsoft, Google, Amazon, and Facebook (Table I-1). Table I-1Developed Markets: Top 5 Companies
DM Versus EM, And Two European Psychodramas
DM Versus EM, And Two European Psychodramas
These five names do perfectly capture the spirit of our time and should not surprise you. Now look at the top five companies in the emerging equity markets (EM): Tencent, Taiwan Semiconductor, Samsung Electronics, Alibaba, and Naspers (Table I-2). Table I-2Emerging Markets: Top 5 Companies
DM Versus EM, And Two European Psychodramas
DM Versus EM, And Two European Psychodramas
What may surprise you is that technology titans dominate in EM markets too. In fact, the technology sector's weighting in EM, at 25 percent, is even larger than in DM, at 19 percent. If technology looms even larger in EM than in DM, what is the defining sector difference between the two regions? The answer is that emerging markets have almost no healthcare stocks, and an offsetting substantial overweighting to financials (Table I-3). Table I-3Developed Markets Versus Emerging Markets: Sector Weights
DM Versus EM, And Two European Psychodramas
DM Versus EM, And Two European Psychodramas
Developed Vs. Emerging Markets = Healthcare Vs. Financials The following is a very different way of looking at the DM versus EM investment decision and, as such, may differ from the BCA house view. As we have demonstrated time and time again on these pages, an equity market's dominant sector skew is of critical importance to investors (Chart I-2). This is because equity sector skews almost always drive regional and country relative performance. Crucially, this fundamental truth applies at the highest level too: the relative performance of DM versus EM. The Chart of the Week should leave you in absolutely no doubt that the relative performance of DM versus EM just corresponds to the relative performance of healthcare versus financials. Chart I-2Developed Versus Emerging Markets: Sector Weight Differences
DM Versus EM, And Two European Psychodramas
DM Versus EM, And Two European Psychodramas
Nevertheless, this striking observation raises a fascinating question: what is the direction of causality? Does healthcare versus financials drive DM versus EM, or in fact does DM versus EM drive healthcare versus financials? The answer is sometimes the former, and at other times the latter. For example, a major slump in emerging economies would undoubtedly drag down global equities. In the ensuing synchronized bear market, the more defensive healthcare sector would almost certainly outperform the financials, and under these circumstances the direction of causality would clearly be from DM versus EM to global sector performance. On the other hand, absent a major bear market, if a reappraisal of sector relative valuations and growth prospects caused a rotation in sector leadership, the causality would run in the other direction: from global sector performance to DM versus EM. Such a reappraisal of sector relative valuations and growth prospects appears to be underway at the moment, and is likely to persist for the next few months. This is because the very sharp down-oscillation in global credit growth which occurred from February through September has now clearly flipped into an up-oscillation. For investors, these oscillations in global credit growth provide excellent tactical opportunities because the oscillations are very regular and therefore predictable; and the cyclical versus defensive sector performance closely tracks the oscillations. So after healthcare's strong outperformance versus financials from February through September, sector relative performance has now flipped into a reverse configuration (Chart I-3). Chart I-3An Up-Oscillation In Global Credit Growth Technically Favours Financials
An Up-Oscillation In Global Credit Growth Technically Favours Financials
An Up-Oscillation In Global Credit Growth Technically Favours Financials
To be clear, this is likely a tactical opportunity lasting no more than six months or so. Nevertheless, from a DM versus EM perspective, it would imply a countertrend move within a structural trend - in which the outperformance of DM versus EM temporarily ends, or even flips into an underperformance (Chart I-4). Chart I-4An Up-Oscillation In Global Credit Growth Technically Favours EM
An Up-Oscillation In Global Credit Growth Technically Favours EM
An Up-Oscillation In Global Credit Growth Technically Favours EM
For European equity investors, the important implication is that developed Europe versus emerging Europe closely tracks broad DM versus broad EM (Chart I-5). Of course, 'emerging Europe' is a misnomer because Poland, Hungary, Czech Republic, and even Russia are developed economies and markets. Nevertheless, as they fall within the MSCI EM index, they tend to move with EM. Chart I-5Developed Europe Vs. Emerging Europe = Developed Markets Vs. Emerging Markets
Developed Europe Vs. Emerging Europe = Developed Markets Vs. Emerging Markets
Developed Europe Vs. Emerging Europe = Developed Markets Vs. Emerging Markets
The upshot is that on a tactical horizon, emerging Europe is likely to outperform developed Europe. However, given our high conviction view that non-energy commodities will continue to outperform energy, focus on Poland, Hungary and Czech Republic and steer clear of energy-heavy Russia. European Psychodrama 1: Italy Vs. The EU In the low-level game of chicken between Italy and the EU Commission over Italy's 2019 budget, the bond market will determine who swerves first. If the 10-year BTP yield rises and stays well above 4 percent, the weakened capital position of Italian banks from lower bond prices combined with deteriorating funding conditions will weigh on bank lending and economic growth. This will put pressure on the Italian government to swerve first and concede ground to the EU's demands. That said, it is hard to know the exact level of yields at which the government would reach its pain threshold. On the other hand, if the 10-year BTP yield falls and stays well below 3 percent, the bond market's insouciance would embolden the Italian government. Moreover, this apparent vote of confidence would be based on sound economics. Italy likely has a very high fiscal multiplier, meaning that a modest increase in its budget deficit to 2.4 percent would more than pay for itself through higher economic growth. Under these circumstances the EU would be under pressure to swerve first and give Italy some room for manoeuvre. The long-term investment opportunity is the Italy versus Spain sovereign 10-year yield spread. At 200 bps, the spread is at its all-time widest, and incongruous with the vanishing gap between the non-performing loans ratios in Italy and Spain. Nevertheless, our recommendation is to wait for the 10-year BTP yield to move closer to 3 percent before buying Italian assets, either in absolute or relative terms (Chart I-6). Chart I-6Remain Neutral Italian Assets Until The 10-Year BTP Yield Moves Closer To 3 Percent
Remain Neutral Italian Assets Until The 10-Year BTP Yield Moves Closer To 3 Percent
Remain Neutral Italian Assets Until The 10-Year BTP Yield Moves Closer To 3 Percent
European Psychodrama 2: Brexit In the psychodrama called Brexit, every new plot twist and turn has the potential to move the pound up or down by a few cents in a day. The next such major twist is the passage of the withdrawal bill through the U.K. parliament in early December. The ultra Brexiteer Conservative MPs and Northern Ireland Unionists will almost certainly vote against the agreement that Theresa May has forged with Brussels. This is because the agreement conjures up the Brexiteers' worst nightmare: a potentially indefinite customs union with the EU27, making it impossible for the U.K. to strike free trade deals with the rest of the world. Hence, for Theresa May to get her agreement through parliament, she will require the support of a substantial number of Labour MPs. But the substantial numbers just aren't there. The upshot is that she is likely to lose the vote, at which point the pound will tumble. For medium-term investors, this would be the moment to buy the pound, and we now explain why. On a six month horizon, the crucial question is: what will happen when the Article 50 process for the U.K. to leave the EU expires at 11pm on March 29, 2019? There are only three possibilities: 1. The U.K. doesn't leave the EU. At this advanced stage on the timeline, not leaving the EU on March 29 2019 effectively means an extension of the Article 50 process. This would require the U.K. to apply for an extension, and for the EU27 to agree to it. But realistically, the EU27 would only agree to it to facilitate a general election and/or a second referendum which could reverse Brexit. Probability = 45%. With the parliamentary arithmetic pointing to a rejection of May's Brexit deal as it stands, an amendment to the withdrawal bill forcing a second referendum, or a lost vote of no confidence in the government could lead to this outcome. Pound/euro = 1.20, because of the realistic prospect of reversing Brexit (Chart I-7). Chart I-7British Public Opinion On Brexit Is Shifting
Long Emerging Markets Vs. Developed Markets
Long Emerging Markets Vs. Developed Markets
2. The U.K. enters a transition period to leave the EU with a negotiated agreement. Theresa May's proposed withdrawal deal, or a variation of it, is approved by the U.K parliament (and the EU27) Probability = 45%. Appropriate amendments to the withdrawal agreement might sufficiently reduce the parliamentary rebellion. Pound/euro = 1.20 because the removal of the 'no deal' outcome would liberate the BoE to hike interest rates. 3. The U.K. crashes out of the EU with 'no deal'. Probability = 10%. This outcome would be the result of a gridlock in the U.K. parliament, with no majority formed for any Brexit strategy. Unlikely, but not impossible. Pound/euro = 1.00 because the U.K. economy would face months of severe disruption and uncertainty. Based on these three possible outcomes on March 29 2019, our expected value of pound/euro equals 1.18. Meaning that any sharp sell-off during the ongoing psychodrama constitutes a medium-term buying opportunity. Dhaval Joshi, Senior Vice President Chief European Investment Strategist dhaval@bcaresearch.com Fractal Trading Model* Supporting the thesis in the main body of this report, the 130-day fractal dimension of EM versus DM recently hit its lower bound, suggesting an oversold extreme and a likely countertrend move. For a short-term trade, position for a 2.5% profit with a symmetrical stop-loss. In other trades, long Portugal / short Hungary hit its stop-loss and is closed, leaving four open trades. For any investment, excessive trend following and groupthink can reach a natural point of instability, at which point the established trend is highly likely to break down with or without an external catalyst. An early warning sign is the investment's fractal dimension approaching its natural lower bound. Encouragingly, this trigger has consistently identified countertrend moves of various magnitudes across all asset classes. Chart I-8
Long Emerging Markets Vs. Developed Markets
Long Emerging Markets Vs. Developed Markets
The post-June 9, 2016 fractal trading model rules are: When the fractal dimension approaches the lower limit after an investment has been in an established trend it is a potential trigger for a liquidity-triggered trend reversal. Therefore, open a countertrend position. The profit target is a one-third reversal of the preceding 13-week move. Apply a symmetrical stop-loss. Close the position at the profit target or stop-loss. Otherwise close the position after 13 weeks. Use the position size multiple to control risk. The position size will be smaller for more risky positions. * For more details please see the European Investment Strategy Special Report "Fractals, Liquidity & A Trading Model," dated December 11, 2014, available at eis.bcaresearch.com Fractal Trading Model Recommendations Asset Allocation Equity Regional and Country Allocation Equity Sector Allocation Bond and Interest Rate Allocation Currency and Other Allocation Closed Fractal Trades Trades Closed Trades Asset Performance Currency & Bond Equity Sector Country Equity Indicators Bond Yields Chart II-1Indicators To Watch - Bond Yields
Indicators To Watch - Bond Yields
Indicators To Watch - Bond Yields
Chart II-2Indicators To Watch - Bond Yields
Indicators To Watch - Bond Yields
Indicators To Watch - Bond Yields
Chart II-3Indicators To Watch - Bond Yields
Indicators To Watch - Bond Yields
Indicators To Watch - Bond Yields
Chart II-4Indicators To Watch - Bond Yields
Indicators To Watch - Bond Yields
Indicators To Watch - Bond Yields
Interest Rate Chart II-5Indicators To Watch - Interest Rate Expectations
Indicators To Watch - Interest Rate Expectations
Indicators To Watch - Interest Rate Expectations
Chart II-6Indicators To Watch - Interest Rate Expectations
Indicators To Watch - Interest Rate Expectations
Indicators To Watch - Interest Rate Expectations
Chart II-7Indicators To Watch - Interest Rate Expectations
Indicators To Watch - Interest Rate Expectations
Indicators To Watch - Interest Rate Expectations
Chart II-8Indicators To Watch - Interest Rate Expectations
Indicators To Watch - Interest Rate Expectations
Indicators To Watch - Interest Rate Expectations
This past year has been a great one for the U.S. economy, particularly when compared to previous years in this cycle. However, the U.S. data has started to weaken lately. The corporate sector and housing market look most vulnerable. A strong dollar, higher…
Dear Client, Barring any major market developments, we will not be sending you a report next week. Instead, I will be working with my colleagues on BCA's Annual Outlook, which will be published on Monday, November 26. The outlook will feature a wide-ranging discussion with Mr. X and his daughter Ms. X on the key themes that we see shaping global markets in 2019. Best regards, Peter Berezin, Chief Global Strategist Highlights The stock market correction has further to run. We would turn more bullish if global equities were to drop another 8% from current levels. A mundane economic identity - savings minus investment equals the current account balance - provides deep market insight into the workings of the global economy. The U.S. economy is suffering from a shortage of savings, which will push up interest rates and the value of the dollar. In contrast, China has a surfeit of savings. Rectifying this will require a weaker yuan. The political impasse between the EU and Italy over next year's budget will be resolved. However, the fact that Italy lacks a readily available outlet for its excess private-sector savings could spell doom for the euro area down the road. Feature The Correction Ain't Over Our MacroQuant model continues to signal downside risks for global equities over the coming weeks (Chart 1). The model is flagging a deterioration in a variety of leading economic indicators, both in the U.S. and abroad, which tends to be bearish for stocks (Chart 2). Global financial conditions have also tightened since the summer due to the rise in government bond yields, higher credit spreads, and a firmer dollar. Chart 1MacroQuant* Model Suggests Caution Is Still Warranted
S-I=CA In The U.S., China, And Italy
S-I=CA In The U.S., China, And Italy
Chart 2Global Growth Indicators Are Deteriorating
Global Growth Indicators Are Deteriorating
Global Growth Indicators Are Deteriorating
Sentiment remains reasonably upbeat, a bearish contrarian indicator. The November Bank of America Merrill Lynch Global Fund Manager Survey revealed that a net 31% of managers were still overweight global stocks. Past major bottoms in 2008, 2011, 2012, and 2016 all saw equity allocations fall into underweight territory. Strikingly, EM allocations rose in November, with a net 13% of fund managers overweight the asset class. This is in stark contrast to 2015 when a net 30% of fund managers were underweight EM stocks. We do not expect the correction which began in October to morph into a full-fledged bear market. Nevertheless, the near-term path of least resistance for stocks remains to the downside. We would only upgrade global equities to overweight if the MSCI All-Country World index were to fall another 8% from current levels, consistent with a price of $64 on the ACWI ETF. At that level, the forward P/E on the index would be back to 2013 levels (Chart 3). Chart 3A Valuation Reset
A Valuation Reset
A Valuation Reset
A Key Macro Identity One of the first identities undergraduate economics students learn is S-I=CA: The difference between what a country saves and invests is equal to its current account balance.1 While it is easy to dismiss this identity as yet another abstract concept that only egghead economists would find interesting, it has real-world implications for investors of all stripes. To see this, it is useful to expand the identity a bit. Total savings is just the sum of private-sector and public-sector savings. Thus, we can write: Private-sector savings = fixed asset investment + government budget deficit + current account balance In other words, the savings that the private sector generates must either be recycled into investment, soaked up by the government through a budget deficit, or exported abroad via a current account surplus. This relationship always holds ex post. But what happens if it does not hold ex ante? Then "something" must adjust to make the relationship hold. In a normal environment, this "something" is interest rates. If there is a shortfall of private-sector savings - that is, if the right-hand side of the equation above exceeds the left-hand side - an increase in rates can restore the identity by encouraging private savings, discouraging investment, and potentially making it more difficult for the government to pursue an expansionary fiscal policy. Higher rates will also produce a stronger currency, leading to a deterioration in the current account balance. The exact opposite will happen if there is an excess of private-sector savings. What happens if there is excessive savings but the central bank cannot lower interest rates either because it lacks monetary independence - i.e., when a country has a currency peg - or because monetary policy is constrained by the zero lower bound on nominal short-term rates? In that case, employment will decline. One cannot save if one does not have a job that generates income. In practice, this can lead to a vicious circle where falling employment causes households to try to save more for precautionary reasons, while discouraging companies from investing in new capacity. The resulting increase in desired savings is likely to lead to further declines in employment. Keynes referred to this outcome as the paradox of thrift: A situation where one person's desire to save more leads to a collective decline in savings because aggregate income shrinks. Let's turn to what all this means for investors today. The U.S.: Trump's Fiscal Policy Is Inconsistent With His Trade Goals The IMF estimates that the U.S. cyclically-adjusted budget deficit will reach 5.6% of GDP next year. The results of the midterm elections are unlikely to change this outcome. While the takeover of the House of Representatives by the Democrats will preclude Congress from passing another round of tax cuts, our geopolitical strategists believe that there is a better than 50% chance that a bipartisan deal will be reached to increase infrastructure spending.2 They point out that Nancy Pelosi mentioned infrastructure five times during her election night address, without mentioning impeachment once. Recent data on U.S. capital spending has been on the soft side (Chart 4). Core capital goods orders have decelerated and capex intention surveys have come off their highs. Residential investment has also been weak, as reflected in declining housing starts and building permits. Chart 4Both Residential And Nonresidential Investment Have Softened
Both Residential And Nonresidential Investment Have Softened
Both Residential And Nonresidential Investment Have Softened
We would tend to fade the weakness in capital spending (Chart 5). The ISM industrial capacity utilization rate is near cycle highs. Rising wages will incentivize firms to substitute labor with capital, leading to more investment spending. The downside risk to home building is also limited, given that residential investment stands at only 3.9% of GDP, well below the high of 6.7% reached in 2005. If anything, the U.S. is not churning out enough fixed capital, as evidenced by the fact that the average age of the capital stock has risen swiftly over the past decade. As my colleague Doug Peta likes to say, you don't get hurt falling out of a basement window. Chart 5Running Out Of Spare Capacity
Running Out Of Spare Capacity
Running Out Of Spare Capacity
Meanwhile, the personal savings rate stands at over 6%, significantly higher than what one would expect based on its typical relationship with household net worth (Chart 6). Chart 6U.S. Household Savings Rate Is High Relative To Wealth
S-I=CA In The U.S., China, And Italy
S-I=CA In The U.S., China, And Italy
The identity described at the outset of this report implies that the trade balance will necessarily deteriorate if the savings rate falls, investment rises, and the budget deficit remains elevated. If President Trump strikes a trade deal with China, he will have no one to blame for a larger U.S. trade deficit. Hence, he has little incentive to make a deal. Protectionism remains popular in the U.S. Midwest, the battleground on which the next presidential election will be fought. Democrat Sherrod Brown won the Ohio Senate race by 6.4% - a state that Trump carried by 8.1% - on a highly protectionist platform. Trump simply cannot afford to go soft on one of his signature issues. China: What To Do With Excess Savings? The slowdown in Chinese growth this year has been concentrated in domestic demand (Chart 7). Exports have held up well. In fact, Chinese exports to the U.S. are up 13% in dollar terms in the first ten months of the year compared with the same period last year. Chart 7China's Domestic Economy Is Weakening
China's Domestic Economy Is Weakening
China's Domestic Economy Is Weakening
Unfortunately, judging from the steep drop in the export component of the Chinese manufacturing PMI, exports are likely to come under increasing pressure over the coming months (Chart 8). This makes it all the more important for the Chinese authorities to prop up domestic growth. Chart 8China's Export Outlook Is Dire
China's Export Outlook Is Dire
China's Export Outlook Is Dire
China has historically stimulated its economy through debt-financed fixed-investment spending (Chart 9). This made eminent sense when China needed more factories, infrastructure, and modern housing. However, now that China has all this in spades, it is looking for different stimulus options. Chart 9China: Debt And Capital Accumulation Have Gone Hand In Hand
China: Debt And Capital Accumulation Have Gone Hand In Hand
China: Debt And Capital Accumulation Have Gone Hand In Hand
Our formula reveals what those other options must be. If China wants to reduce investment spending to a more sustainable level, it must either boost consumption, increase the fiscal deficit, or raise net exports. Given a hostile export backdrop, it is therefore no surprise that the Chinese government has been cutting taxes, increasing social transfer payments, and letting the currency slide. The problem is that none of these other forms of stimulus are beneficial to the rest of the world, and in some cases, they may be quite detrimental. The rest of the world relies on Chinese investment, not Chinese consumption. Raw materials and capital goods comprise 80% of Chinese imports. China represents close to half of the world's demand for aluminum, copper, zinc, nickel, and steel (Chart 10). Whether it be services or manufactured goods, what Chinese households consume is generally produced in China. Chart 10China Is The Predominant Source Of Global Demand For Metals
China Is The Predominant Source Of Global Demand For Metals
China Is The Predominant Source Of Global Demand For Metals
A weaker yuan will make the Chinese economy more competitive, but at the expense of other emerging markets. A weaker yuan will also raise the price of imported goods, leading to a lower volume of imports. The implication is that both the magnitude and composition of China's stimulus may disappoint. This week's much weaker-than-expected credit and money data - new CNY loans clocked in at RMB 697 billion in October, well below consensus expectations of RMB 905 billion - validates this view. Italy: Getting To "Yes" Is The Easy Part The showdown between Italy's populist leaders and the EU continues. The Lega-Five Star coalition government promised big tax cuts and generous increases in social spending. It is loath to backtrack on its campaign pledges so soon after the election. As long as there is no contagion from Italy to the rest of Europe, the EU has no incentive to back off. While it will never admit it, the EU establishment would love nothing more than to humiliate the Italians in order to dissuade voters across Europe from electing populist politicians. In the end, we expect the Italian government to give in to the EU's demands. Business confidence has plunged (Chart 11). The economy is again teetering on the brink of recession. Italy's banking system would be technically insolvent if the ten-year BTP yield were to rise above 4% based on a mark-to-market accounting of Italian bank holdings of government debt. Chart 11Italy: Is The Economy Heading For Another Dip?
Italy: Is The Economy Heading For Another Dip?
Italy: Is The Economy Heading For Another Dip?
A political resolution to the ongoing crisis would provide short-term relief. However, it may not solve Italy's problems - indeed, it could exacerbate them. Italy's working-age population is shrinking (Chart 12). This has made companies reluctant to expand capacity. Meanwhile, households are busily saving for retirement. Their motivation to save more would only be amplified by the cuts to pension benefits that the previous caretaker government promised and that the EU is insisting be implemented. The overall private-sector financial balance - the difference between what the private sector saves and invests - reached a surplus of 5.1% of GDP in 2017 (Chart 13). Chart 12The Italian Workforce Is Shrinking
S-I=CA In The U.S., China, And Italy
S-I=CA In The U.S., China, And Italy
Chart 13Italy: Private Sector Saves Too Much And Spends Too Little
Italy: Private Sector Saves Too Much And Spends Too Little
Italy: Private Sector Saves Too Much And Spends Too Little
Our formula shows that counterbalancing this private-sector surplus will require a persistent government fiscal deficit or current account surplus. Italy's primary budget balance - its overall budget balance excluding interest payments - hit 1.7% of GDP in 2017 (Chart 14). This primary surplus is necessary to cover the 3.6% of GDP in interest payments that the government has to make, a number that will only rise if the ECB raises rates (hence, our high-conviction view that the ECB will have to keep rates low for years to come). Chart 14Italy Needs A Primary Budget Surplus
Italy Needs A Primary Budget Surplus
Italy Needs A Primary Budget Surplus
Italy runs a modest current account surplus of 2% of GDP. However, its current account balance would be far smaller, and perhaps even negative, if the economy were operating at full employment since stronger domestic demand would suck in more imports. Italy would love to copy Germany, a country which habitually over-saves but exports its excess savings to the rest of the world through a gargantuan 8% of GDP current account surplus. Alas, achieving a larger current account surplus would require either a currency depreciation or productivity-enhancing structural reforms. The former is impossible as long as Italy is a member of the euro area, while the latter has proven to be wishful thinking for as long as people have talked about it. We do not expect Italy to default on its debt or jettison the euro in the near term. But when the next synchronized global downturn arrives - probably in about two years or so - all hell could break loose. Concluding Thoughts An economy facing a shortfall in savings is one where desired spending exceeds income. When the economy has spare capacity, such a savings shortfall is a good thing; it means more demand, more employment, and ultimately, more income. However, once spare capacity is soaked up, a shortage of savings will lead to higher inflation. The U.S. finds itself in the latter situation today. The output gap is fully closed, but growth remains above trend. As we have discussed in past reports, the Fed is likely to raise rates more than the market expects.3 This will lead to higher Treasury yields and a stronger dollar. With that in mind, we are raising our end-year target on our long DXY trade recommendation from 98 to 100, implying another 3% increase from current levels. In the absence of offsetting Chinese stimulus, a stronger dollar will put further pressure on emerging markets. EM equities will likely bottom in the first half of next year once the dollar peaks and global growth stabilizes. Until then, investors should overweight DM stocks relative to their EM peers. Peter Berezin, Chief Global Strategist Global Investment Strategy peterb@bcaresearch.com 1 National savings, S, is equal to Y-C-G, where Y is national income and C and G are household and government consumption, respectively. Substituting this identity into the standard Y=C+I+G+X-M equation yields S-I=X-M. National income includes net foreign earnings. In this case, the trade balance, X-M, is equal to the current account balance. 2 Please see Geopolitical Strategy Special Report, "The 2020 U.S. Election: A "Way Too Soon" Forecast," dated November 7, 2018. 3 Please see Global Investment Strategy Weekly Report, "Bond Bears Maul Goldilocks," dated October 12, 2018; and "The Next U.S. Recession: Waiting For Godot?" dated October 5, 2018. Strategy & Market Trends Tactical Trades Strategic Recommendations Closed Trades
Highlights Global growth has not yet bottomed, this will provide additional support for the dollar. EUR/USD will be a buy once it dips below 1.1, as slowing global growth means that European activity will continue to lag behind the U.S. The dollar is not as expensive as simple metrics suggest. Fade any Sino-U.S. détente in Buenos Aires. The best vehicle to play a dollar correction remains the NZD. GBP volatility is peaking. Feature We have been on the road for the past two weeks, in the U.S. and in the Middle East. Exchanges with clients can reveal what the key narratives driving the markets are and where the walls of worries may lie. This week, we opted to share what have been the major questions plaguing clients minds. Question 1: Has Global Growth Bottomed? The short answer is no. While there are issues affecting Europe, such as Italian budget battles and idiosyncrasies in the German auto sector, the key impetus pushing global growth downward is China. The Chinese economy is slowing as Chinese policymakers are working to force indebtedness lower, and have therefore constrained access to credit, especially in the shadow banking system (Chart I-1). This has not changed. Chart I-1Chinese Policy Tightening In Action China's Deleveraging Is Not Over Yet
Chinese Policy Tightening In Action China's Deleveraging Is Not Over Yet
Chinese Policy Tightening In Action China's Deleveraging Is Not Over Yet
It is also true that Chinese policy makers have been trying to limit the downside to growth. They have injected liquidity in the banking system, let the renminbi depreciate, and allegedly, supported a stock market spiraling downward under the pressure of margin calls. Moreover, fiscal policy is being eased, with income tax cuts pointing to a desire to support household consumption, especially spending on services. But none of these policy actions seems to matter for the world economy, at least for now. China impacts global growth through its imports, and non-food commodities, investment goods, machinery equipment and transportation goods constitute 85% of total Chinese imports. These goods are levered to industrial activity and the Chinese investment cycle. The latter in turn is levered to the Chinese credit cycle (Chart I-2). Hence, as long as China tries to reign in credit growth, Chinese imports will be under pressure. Chart I-2Slowing Chinese Credit Impulse Means Slower Chinese Imports
bca.fes_wr_2018_11_16_s1_c2
bca.fes_wr_2018_11_16_s1_c2
What about the recent rebound in Chinese imports? Our China Strategist posits that it has been linked to front running of orders before the Trump tariffs enter into effect. The trend in credit growth remain poor. The October's money and credit numbers show that the China's total social financing grew at its slowest pace in 12 years, and money growth as well as traditional loan growth has also relapsed (Chart I-3). Hence, China doesn't have an appetite for credit yet. Chart I-3Chinese Credit Is Not Responding To Chinese Stimulus
Chinese Credit Is Not Responding To Chinese Stimulus
Chinese Credit Is Not Responding To Chinese Stimulus
It is hard to fully know why the country's appetite for credit is slowing despite the expanding list of small measures implemented by authorities to support economic activity. On the one hand, it seems that lenders are reluctant to lend. On the other, the private sector does not seems hungry to spend either. As BCA's Emerging Market Strategy service highlighted, even the Chinese consumer is displaying a declining marginal propensity to consume, and retail sales as well as car sales are declining (Chart I-4).1 This suggests that China will continue to act as an anchor on global growth for the time being. Chart I-4Chinese Households Are Cautious
Chinese Households Are Cautious
Chinese Households Are Cautious
Stresses outside of China also remain problematic for global growth. Emerging market financial conditions have tightened significantly. This will continue to act as a drag on global industrial activity (Chart I-5). In fact, the recent poor GDP numbers out of Germany and Japan, two nations highly levered to the global industrial cycle, confirm that the pain originating in the EM space is spreading around the globe. Chart I-5EM Financial Conditions Suggest Continued Downward Pressure On Growth
EM Financial Conditions Suggest Continued Downward Pressure On Growth
EM Financial Conditions Suggest Continued Downward Pressure On Growth
Ultimately, since the U.S. economy is a low beta economy, even if U.S. growth downshifts in response to shocks to global growth, it is likely to slow less than the rest of the world. This explains why the dollar exhibits little constant correlation with U.S. growth, but a tight negative relationship with global growth (Chart I-6). Chart I-6The Countercyclical Dollar
The Countercyclical Dollar
The Countercyclical Dollar
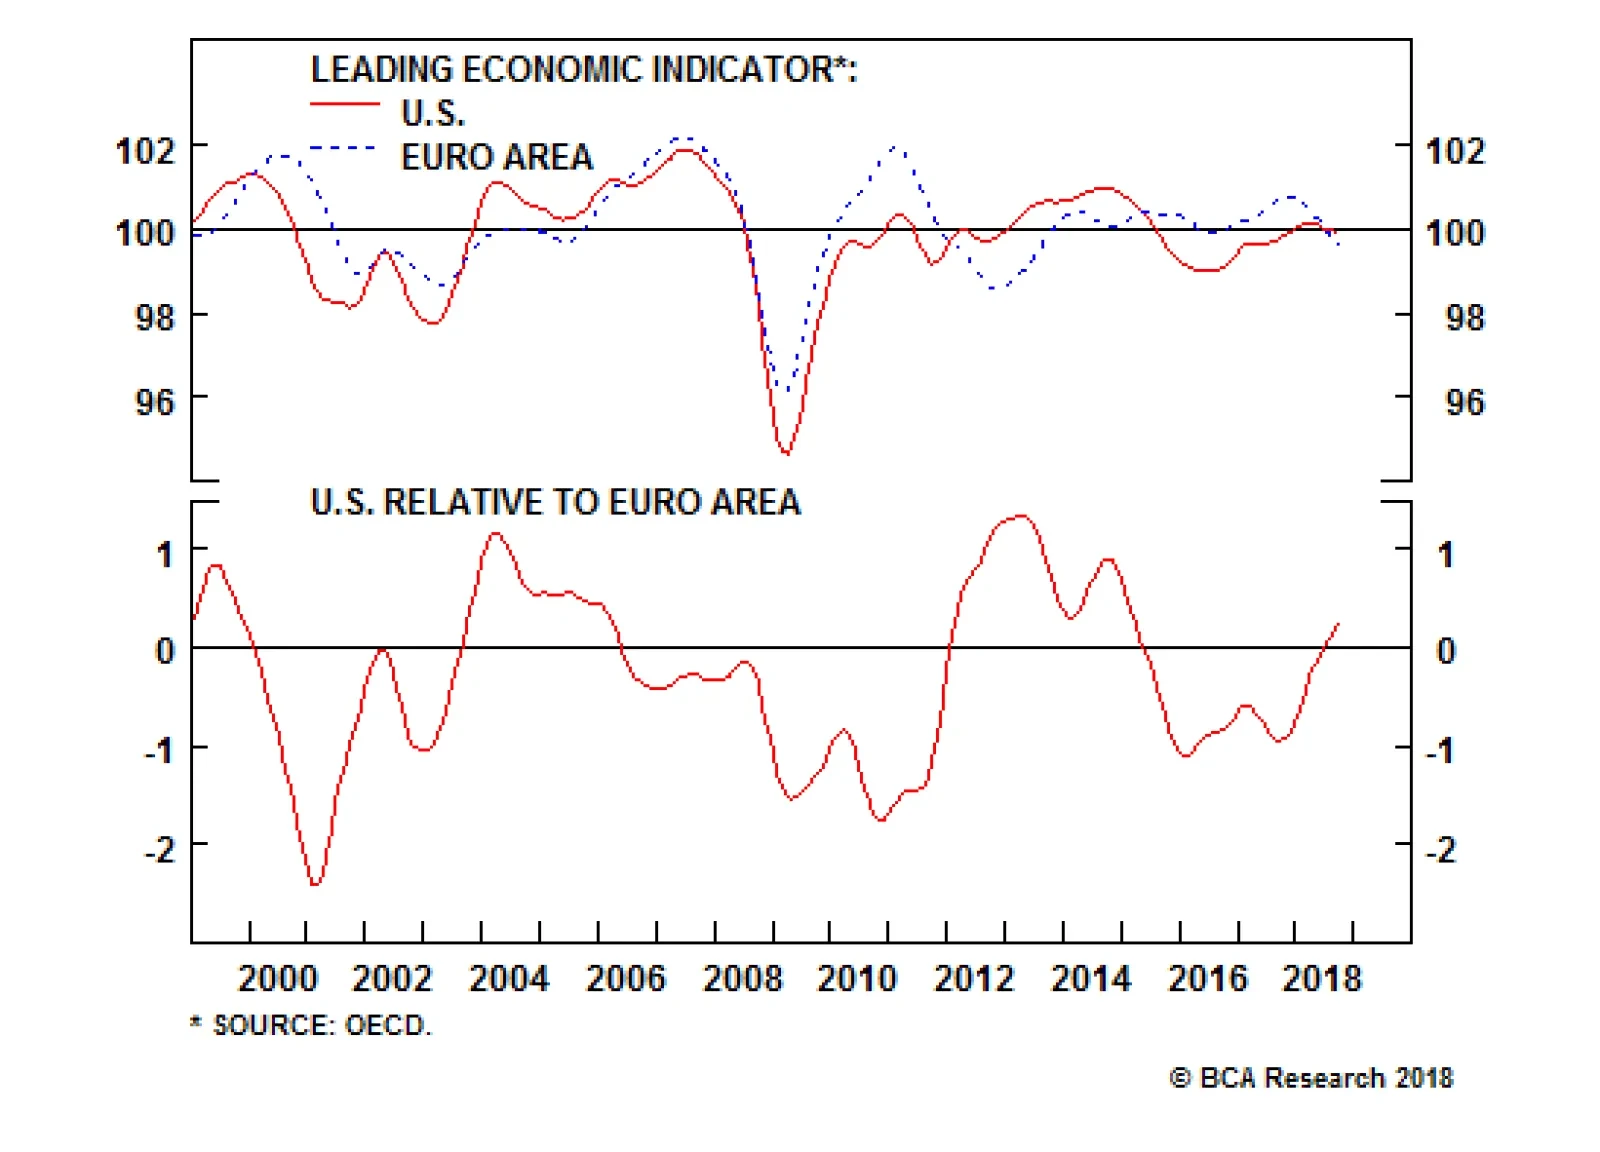
Hence, since we see little hope for an imminent bottom in global growth, additional dollar upside remains. Thus, we re-iterate our target for DXY at 100. Nevertheless, make no mistake, the easy gains in the greenback are behind us. The remainder of the rally will likely prove volatile. Question 2: Is The Growth Divergence Between The U.S. And The Euro Area Peaking? Will This Reverse The Dollar Rally? Economic data in the U.S. has begun to weaken, especially on the durable good orders and the housing fronts. Moreover, the recent core CPI data, which came in at 2.1%, was a disappointment. The strong dollar, higher interest rates, tighter financial conditions, and the potential hit to profits from falling oil prices all suggest that U.S. capex could slow. However, as Chart I-7 illustrates, Europe is slowing more than the U.S. Despite the rollover in the U.S. Leading Economic Indicator, the gap between the U.S. and the euro area LEI is in fact growing in favor of the U.S. This is because the U.S. is a low beta economy and it outperforms Europe when global growth slows, especially when the negative impulse emanates out of China (Chart I-8). Chart I-7U.S. Growth May Be Slowing, But It Is Still Outperforming...
U.S. Growth May Be Slowing, But It Is Still Outperforming...
U.S. Growth May Be Slowing, But It Is Still Outperforming...
Chart I-8...Especially If China Does Not Pick Up
...Especially If China Does Not Pick Up
...Especially If China Does Not Pick Up
Nonetheless, the Fed has already increased rates eight times this cycle and the market anticipates a bit more than two interest rate hikes in the U.S. over the next 12 months, while in Europe, rate expectations are much more muted. Will this slowdown in U.S. growth cause U.S. rate and yield differentials versus the euro area - which stand near historical highs - to fall, providing a welcome fillip for EUR/USD in the process (Chart I-9)? Chart I-9U.S. Spreads Are Wide
U.S. Spreads Are Wide
U.S. Spreads Are Wide
We doubt it. First, three deep structural problems still hamper Europe: Italy still faces challenging debt arithmetic if interest rates rise quickly, which means that Italy continues to teeter close to the hedge of a Eurosceptic drama. European banks are still much weaker than U.S. ones and have a large amount of EM exposure, limiting their capacity to handle higher rates. Europe is far from a true fiscal union, which means that the job of supporting growth lies much more heavily on monetary authorities than in the U.S. This forces the European Central Bank to stay more dovish than the Fed. Second, once the cost of currency hedging is taken into account, the spread between U.S. and European bonds yields becomes negative (Chart I-10)! This suggests that unhedged U.S. yields can rise further versus European ones as U.S. hedged yields are not attractive. This means that yields and interest rates in the U.S. can remain high or even rise relative to Europe, making it attractive to buy the greenback for investors willing to take on currency risk. Chart I-10U.S. Hedged Yields Are Low
U.S. Hedged Yields Are Low
U.S. Hedged Yields Are Low
Hence, we do not expect that the slowdown in U.S. growth will constitutes a major problem for the dollar. Instead, we are looking for EUR/USD to fall below 1.10 before buying the common currency again. Question 3: Is The Dollar Expensive? The answer to this question seems obvious. When looking at a simple purchasing-power parity model, the dollar does look very expensive (Chart I-11). However, valuing currencies is a much more complex question than just looking at PPP metrics. Once other factors are taken into account, the dollar trades in line with its long-term drivers (Chart I-12). The dollar might not be as expensive as PPP metrics suggest because the U.S. productivity growth is higher than in most other G10 nations, because neutral interest rates in the U.S. are structurally higher than in Europe or Japan, and because the U.S. current account deficit is stable despite a strong dollar as the U.S. morphs from an energy importer to an energy exporter. Chart I-11U.S. Dollar And PPP Is The Greenback Really This Expensive?
U.S. Dollar And PPP Is The Greenback Really This Expensive?
U.S. Dollar And PPP Is The Greenback Really This Expensive?
Chart I-12Maybe Not
Maybe Not
Maybe Not
On a short-term basis, there is no evident misalignment in the USD either. The DXY dollar index trades in line with our short-term metrics, suggesting that until now, the bulk of the dollar rally this year was a correction of its previous undervaluation (Chart I-13). Furthermore, the dollar tends to peak at higher degree of overvaluations, and, if U.S. growth continues to outperform the rest of the world, the fair value of the DXY could rise further. Chart I-13No Short-Term Misalignment
No Short-Term Misalignment
No Short-Term Misalignment
Question 4: Will Sino-U.S. Relations Improve After The Buenos Aires G20 Meeting? We are skeptical that Sino-U.S. relations will improve after the Buenos Aires meeting at the end of the month. The White House could delay the imposition of a third round of tariffs as well as the increase in the current tariff rate from 10% to 25%. Such actions would likely result in a temporary bounce back in risk assets and EM related plays as well as correction in the USD. However, President Trump has no incentive to make a full-blown trade deal with China right now. The midterm elections confirmed that the U.S. electorate is not pro-free trade and that the political apparatus in the U.S. is unified in fighting China. At the end of the day, China is a great scapegoat for the income inequality problem plaguing the U.S. Question 5: Will The Dollar Correct After Its Furious 2018 Rally? Our inclination is to think that there are short-term risks building up in the dollar, a topic we discussed at length three weeks ago.2 Namely, traders are now very long the dollar, and risk-on currencies have been rallying against the dollar despite the strength in the DXY. This suggests that the corners of the FX market most levered to global growth might be sniffing out a stabilization in global conditions. Indeed, the Chinese economic surprise index has improved (Chart I-14). While Chinese data has not meaningfully picked up, expectations toward China are very depressed. As such, a slowdown in the pace of deterioration could be interpreted as good news for global growth. The countercyclical dollar may correct. Chart I-14Are Expectations Toward China Too Depressed?
Are Expectations Toward China Too Depressed?
Are Expectations Toward China Too Depressed?
We have not played the dollar correction risk through selling DXY or buying EUR/USD. Instead, we have bought the NZD against both the USD and the GBP. The beaten down kiwi would be the currency most likely to rebound if global growth conditions were to surprise to the upside, even if temporarily. This has proved to be the right call. We remain positive on the NZD for the coming two months. However, from a risk management perpectives we are closing our long NZD/USD trade at 4.8% profit. However, we doubt that any dollar correction is likely to morph into a genuine bear market. If global growth conditions were indeed to improve, this would give more ammo for the Fed to hike in line with its "dots". The market knows that and would revise upward the modest 60 basis point of hikes currently anticipated over the coming 12 months. As such, the resultant increase in real rates would likely hurt the still-fragile EM economies and cause a renewed tightening in EM financial conditions. This would in turn lead to additional slowdown in global growth and would support the dollar. Hence, our current positive predisposition toward the kiwi is temporary in nature. Question 6: Has The Pound Bottomed, Will GBP-Volatility Recede Anytime Soon? In September, we warned that the pound did not compensate investors adequately for the political uncertainty surrounding Brexit risks.3 Specifically, we were most worried about British domestic politics, not the EU side of the negotiations. However, because we believed that ultimately, either soft Brexit or Bremain would ultimately prevail, we refrained from selling the pound outright. Instead, we recommended investors buy the GBP's volatility. Today, Prime Minister Theresa May is in danger as two additional ministers resigned from her cabinet after she presented the Brexit deal that was hammered out with Brussels. The risk of a new election or a hard-liner Brexit Tory replacing her is growing by the minute. Markets are once again clobbering the pound, and GBP implied volatility is trading at level last seen directly after the June 2016 referendum (Chart I-15). Chart I-15Close Long GBP Vol Bets
Close Long GBP Vol Bets
Close Long GBP Vol Bets
At current levels, the pound is now an attractive play for long-term investors. Additionally, while a new election is likely to cause more tremors into the pound, we are inclined to recommend investors close long GBP volatility trades as the British public is growing more disillusioned with Brexit. Our conviction is only growing that only the softest form of Brexit will be implemented. As a result, the risk-reward ratio from selling the pound or buying its volatility has now significantly deteriorated. We are closing our short GBP/NZD trade at a 6% profit in four weeks. Mathieu Savary, Vice President Foreign Exchange Strategy mathieu@bcaresearch.com Footnotes 1 Please see Emerging Markets Strategy Weekly Report, titled "On Domino Effects And Portfolio Outflows", dated November 15, 2018, available at ems.bcaresearch.com 2 Please see Foreign Exchange Strategy Weekly Report, titled "Risk To The Dollar View", dated October 26, 2018, available at fes.bcaresearch.com 3 Please see Foreign Exchange Strategy Special Report, titled "Assessing the Geopolitical Risk Premium In the Pound", dated September 7, 2018, available at fes.bcaresearch.com Currencies U.S. Dollar Chart II-1USD Technicals 1
USD Technicals 1
USD Technicals 1
Chart II-2USD Technicals 2
USD Technicals 2
USD Technicals 2
Recent data in the U.S. has been mixed: Both core inflation and core PCE came in below expectations, coming in at 2.1% and 1.6% respectively. However, Q3 GDP growth surprised to the upside, coming in at 3.5%. Moreover, nonfarm payrolls also came in above expectations, coming in at 250 thousand. The DXY index has been able to appreciate over the past three weeks. We maintain our bullish bias towards the dollar, given that despite its rise, this currency remains fairly valued. Moreover, we expect global growth to continue deaccelerating, as Chinese authorities continue to tighten. That being said, potential upside might be limited from current levels, as speculators are very long the dollar. Report Links: Updating Our Intermediate Timing Models - November 2, 2018 In Fall, Leaves Turn Red, The Dollar Turns Green - October 12, 2018 Policy Divergences Are Still The Name Of The Game - August 14, 2018 The Euro Chart II-3EUR Technicals 1
EUR Technicals 1
EUR Technicals 1
Chart II-4EUR Technicals 2
EUR Technicals 2
EUR Technicals 2
Recent data in the Euro area has been mixed: Core inflation increased and outperformed expectations, coming in at 1.1%. Moreover, Markit Services PMI also surprised to the upside, coming in at 53.7. However, Markit Manufacturing PMI surprised negatively, coming in at 52. EUR/USD has depreciated over that past three weeks. We remain bearish on the euro, given that we expect global growth to keep slowing, hurting export-driven economies like the euro area. Furthermore, Italian debt dynamics will continue to plague the Eurozone. That being said, if the euro were to fall below 1.1, we would tamper our bearishness. Report Links: Evaluating The ECB's Options In December - November 6, 2018 Updating Our Intermediate Timing Models - November 2, 2018 Will Rising Wages Cause An Imminent Change In Policy Direction In Europe And Japan? - October 5, 2018 The Yen Chart II-5JPY Technicals 1
JPY Technicals 1
JPY Technicals 1
Chart II-6JPY Technicals 2
JPY Technicals 2
JPY Technicals 2
Recent data in Japan has been mixed: The unemployment rate surprised positively, coming in at 2.3%. This measure also decreased from last month. However, housing starts yearly growth underperformed expectations, coming in at -1.5%. Moreover, overall household spending yearly growth also surprised negatively, coming in at -1.6%. Q2 GDP contracted and also came in below expectations, driven by poor capex growth. USD/JPY has also appreciated over the past three weeks. We remain positive on the trade-weighted yen, given that the continued slowdown in global growth, fueled by the dual tightening of policy by Chinese authorities and the Fed, will help safe haven currencies like the yen. Moreover, the current selloff in U.S. markets could also provide a boon for this currency if it forces the Fed to tamper its hawkishness. Report Links: Updating Our Intermediate Timing Models - November 2, 2018 Will Rising Wages Cause An Imminent Change In Policy Direction In Europe And Japan? - October 5, 2018 Rhetoric Is Not Always Policy - July 27, 2018 British Pound Chart II-7GBP Technicals 1
GBP Technicals 1
GBP Technicals 1
Chart II-8GBP Technicals 2
GBP Technicals 2
GBP Technicals 2
Recent data in the U.K. has been mixed: Average hourly earnings excluding bonus yearly growth surprised to the upside, coming in at 3.2%. However, core inflation underperformed expectations, coming in at 1.9%. Moreover, retail sales yearly growth also surprised negatively, coming in at 2.2%. After rising for the last three weeks, GBP/USD fell by over 1.5% on Thursday, after two ministers quit Theresa's May cabinet. While the headline risk remains large, especially as the U.K. could soon go through an election, we do not want to be greedy and our closing our long GBP-vol bets. We are also closing our short GBP/NZD bet. At current levels, GBP is now an attractive long-term play. Report Links: Updating Our Intermediate Timing Models - November 2, 2018 Clashing Forces: The Fed And EM Financial Conditions - October 19, 2018 Updating Our Long-Term FX Fair Value Models - June 22, 2018 Australian Dollar Chart II-9AUD Technicals 1
AUD Technicals 1
AUD Technicals 1
Chart II-10AUD Technicals 2
AUD Technicals 2
AUD Technicals 2
Recent data in Australia has been positive: Employment growth outperformed expectation, coming in at 32.8 thousand. Moreover, the participation rate also surprised to the upside, coming in at 65.6%. Finally, the unemployment rate also surprised positively, coming in at 5%. AUD/USD has risen by 3.39% the past 3 weeks. We are inclined to fade this rally as the poor outlook for the Chinese economy could soon transform these strong Australian economic results into much more disappointing numbers. Report Links: Updating Our Intermediate Timing Models - November 2, 2018 Policy Divergences Are Still The Name Of The Game - August 14, 2018 What Is Good For China Doesn't Always Help The World - June 29, 2018 New Zealand Dollar Chart II-11NZD Technicals 1
NZD Technicals 1
NZD Technicals 1
Chart II-12NZD Technicals 2
NZD Technicals 2
NZD Technicals 2
Recent data in New Zealand has been positive: Employment growth outperformed expectations, coming in at 1.1%. Moreover, the participation rate also surprise to the upside, coming in at 71.1%. Finally, the unemployment rate also surprised positively, coming in at 3.9%. NZD/USD has risen by more than 5.5% the past 3 weeks. The NZD continues to be one of our favorite currencies in the G10, given that rate expectations continue to be very low, even though economic data has strengthened. Moreover, food prices, dairies in particular have limited downside from here, especially as they are not very exposed to China's policy tightening. Report Links: Updating Our Intermediate Timing Models - November 2, 2018 Clashing Forces: The Fed And EM Financial Conditions - October 19, 2018 In Fall, Leaves Turn Red, The Dollar Turns Green - October 12, 2018 Canadian Dollar Chart II-13CAD Technicals 1
CAD Technicals 1
CAD Technicals 1
Chart II-14CAD Technicals 2
CAD Technicals 2
CAD Technicals 2
Recent data in Canada has been positive: The net change in employment outperformed expectations, coming in at 11.2 thousand. Moreover, housing starts also surprised to the upside, coming in at 206 thousand. Finally, the unemployment rate also surprised positively, coming in at 5.8%. USD/CAD has risen by 1.2% these past 3 weeks. The weakness in oil prices have caused the Canadian dollar to be one of the worst performing currencies in the G10 in recent weeks. We are reticent to be too bullish on the CAD, given that markets are now pricing in a BoC that will be more hawkish than the Fed. Report Links: Updating Our Intermediate Timing Models - November 2, 2018 Clashing Forces: The Fed And EM Financial Conditions - October 19, 2018 Updating Our Long-Term FX Fair Value Models - June 22, 2018 Swiss Franc Chart II-15CHF Technicals 1
CHF Technicals 1
CHF Technicals 1
Chart II-16CHF Technicals 2
CHF Technicals 2
CHF Technicals 2
Recent data in Switzerland has been negative: Real retail sales yearly growth came in significantly below expectations, coming in at -2.7%. Moreover, the SVME Purchasing Manager's Index also surprised to the downside, coming in at 57.4. Finally, the KOF leading Indicator also surprised negatively, coming in at 100.1. EUR/CHF has been flat in recent weeks. We continue to be bearish on the franc on a cyclical basis, given that inflationary forces in Switzerland remain too tepid for the SNB to hike policy rates. Moreover, the SNB will also have to intervene in currency markets if the franc becomes more expensive in response to the current risk-off environment. Report Links: Updating Our Intermediate Timing Models - November 2, 2018 Updating Our Long-Term FX Fair Value Models - June 22, 2018 Updating Our Intermediate Timing Models - May 18, 2018 Norwegian Krone Chart II-17NOK Technicals 1
NOK Technicals 1
NOK Technicals 1
Chart II-18NOK Technicals 2
NOK Technicals 2
NOK Technicals 2
Recent data In Norway has been mixed: Both headline and core inflation underperformed expectations, coming in at 3.1% and 1.6% respectively. Moreover, manufacturing output also surprised to the downside, coming in at -0.3%. However, registered unemployment surprised positively, coming in at 79.7 thousand. USD/NOK has risen by 1.5%, as falling oil prices have weighed heavily on the krone. We are bullish on the krone relative to the Canadian dollar, given that rate expectations in Canada are much more fully priced in Canada than they are in Norway, even though the inflationary backdrop is similar. Report Links: Updating Our Intermediate Timing Models - November 2, 2018 Clashing Forces: The Fed And EM Financial Conditions - October 19, 2018 Updating Our Long-Term FX Fair Value Models - June 22, 2018 Swedish Krona Chart II-19SEK Technicals 1
SEK Technicals 1
SEK Technicals 1
Chart II-20SEK Technicals 2
SEK Technicals 2
SEK Technicals 2
Recent data in Sweden has been mixed: Retail sales yearly growth outperformed expectations, coming in at 2.1%. Manufacturing PMI also outperformed expectations, coming in at 55. However, headline inflation surprised to the downside, coming in at 2.3%. USD/SEK has depreciated by roughly 1% for the past 3 weeks. Overall, we are bullish on the krona on a long-term basis. After all, the Riksbank is on the verge of beginning a tightening cycle, as imbalances in the Swedish economy are only growing more dangerous. With that being said, the krona could suffer if global growth slows further, as Sweden is very exposed to the gyrations of the global economy. Report Links: Updating Our Intermediate Timing Models - November 2, 2018 Updating Our Long-Term FX Fair Value Models - June 22, 2018 Updating Our Intermediate Timing Models - May 18, 2018 Trades & Forecasts Forecast Summary Core Portfolio Tactical Trades Closed Trades
Highlights Bond yields have trapped equities, and equities have trapped bond yields. The double-digit investment opportunities are within asset-classes. From a tactical perspective: Banks will outperform the broad market. EM will outperform DM. The Eurostoxx50 will briefly outperform the S&P500. Raw industrial commodities will outperform crude oil. Feature What has been the biggest driver of financial markets this year? Trade wars and the emerging market slowdown? The budget spat between Italy and the EU Commission? The U.S. mid-term elections? Or perhaps, central bank policy normalization? These are all sensible answers, and each one has generated endless output of commentary and analysis. But none of these tells the biggest story of 2018. Chart of the WeekIn 2018, Bond Yields Have Trapped Equities, And Equities Have Trapped Bond Yields
In 2018, Bond Yields Have Trapped Equities, And Equities Have Trapped Bond Yields
In 2018, Bond Yields Have Trapped Equities, And Equities Have Trapped Bond Yields
The Biggest Story Is Not Economics Or Politics... It Is Mathematics This year, the two largest five-day plunges in the global stock market - 6 percent in February and 7 percent in mid-October - resulted directly from the two largest five-day spikes in the global bond yield (Chart I-2 and Chart I-3). This simple observation reveals the biggest story in the financial markets this year: the hypersensitivity of the stock market to rising bond yields, and especially when the global 10-year yield approaches 2 percent - or equivalently 'the rule of 4': when the sum of the 10-year U.S. T-bond, German bund and Japanese government bond approaches 4 percent (Chart of the Week).1 Chart I-2Equities Plunged In February After A Spike In Bond Yields
Equities Plunged In February After A Spike In Bond Yields
Equities Plunged In February After A Spike In Bond Yields
Chart I-3Equities Plunged In October After A Spike In Bond Yields
Equities Plunged In October After A Spike In Bond Yields
Equities Plunged In October After A Spike In Bond Yields
With the global stock market now flat year-to-date, it follows that excluding these two five-day plunges, global equities would be comfortably higher even with the emerging market slowdown, trade war quarrels, and political spats. Meaning that this year's market action is not explained by economics or by politics. It is explained by mathematics, and specifically the great misunderstanding of investment risk. Previous reports have focused on this great misunderstanding, most recently Risk: The Great Misunderstanding Of Finance, to which we refer our readers. Here, we will just summarize:2 An investment's risk depends on the negative asymmetry of its short-term returns. At very low bond yields, bond returns develop the same negative asymmetry as equity returns. This means that equities lose their excess riskiness versus bonds, requiring equity valuations to experience a phase transition sharply higher. But when bond yields normalize, equities regain their excess riskiness versus bonds - and their valuations must suffer a phase transition sharply lower. This phase transition to sharply lower equity valuations is most pronounced when the global 10-year bond yield rises to 2 percent. This dynamic has proved to be the biggest driver of financial markets in 2018, and is likely to be the biggest driver in 2019 too. Essentially, higher bond yields can suddenly and viciously undermine the valuation support of equities, limiting the upside in the stock market (Chart I-4). In turn, a plunge in the stock market and other risk-assets threatens a disinflationary impulse, limiting the sustainable upside in bond yields. Chart I-4Equities Remain Richly Valued
Equities Remain Richly Valued
Equities Remain Richly Valued
In effect, bond yields have trapped equities, and equities have trapped bond yields (Chart I-5). The result is that in 2018 the global asset-classes: equities, bonds, commodities, and cash have all ended up going nowhere. Indeed, the global 30-year bond yield has been trapped since early 2017!3 Chart I-5The Global 30-Year Bond Yield Has Been Trapped For Two Years
The Global 30-Year Bond Yield Has Been Trapped For Two Years
The Global 30-Year Bond Yield Has Been Trapped For Two Years
The Double-Digit Investment Opportunities Are Within Asset-Classes Although the global asset-classes have ended up going nowhere this year (Chart I-6), 2018 has still provided double-digit investment opportunities. But to find these double-digit opportunities, you have to look below the main asset allocation decision to within the asset-classes, in sector, region and country allocation. Chart I-6In 2018, Global Asset-Classes Have Ended Up Going Nowhere
In 2018, Global Asset-Classes Have Ended Up Going Nowhere
In 2018, Global Asset-Classes Have Ended Up Going Nowhere
For example, until very recently: banks had underperformed the broad equity market by 10 percent globally and 25 percent in Europe; emerging market equities had underperformed developed market equities by 15 percent; the Eurostoxx50 had underperformed the S&P500 by 13 percent; and raw industrial commodities had underperformed crude oil by 30 percent. But in the last month or so, these strong trends have exhausted and even started to reverse: banks have started to outperform the market; the Eurostoxx50 has eked ahead of the S&P500; emerging market equities have retraced versus developed market equities; and raw industrial commodities have made up much lost ground on crude oil (Charts I-7 - Chart I-10). One important reason is that the sharp down-oscillation in global credit growth which was responsible for many of this year's intra asset-class trends has now clearly rebounded into an up-oscillation. Chart I-7Banks Have Started To Outperform
Banks Have Started To Outperform
Banks Have Started To Outperform
Chart I-8The Eurostoxx50 Is Starting To Outperform The S&P500
The Eurostoxx50 Is Starting To Outperform The S&P500
The Eurostoxx50 Is Starting To Outperform The S&P500
Chart I-9EM Has Started To Outperform DM
EM Has Started To Outperform DM
EM Has Started To Outperform DM
Chart I-10Industrial Commodities Are Starting To Outperform Crude Oil
Industrial Commodities Are Starting To Outperform Crude Oil
Industrial Commodities Are Starting To Outperform Crude Oil
Hence, we expect these trend reversals to continue in the coming months. From a tactical perspective only, this means: 1. Banks will outperform the broad market. 2. EM will outperform DM. 3. The Eurostoxx50 will briefly outperform the S&P500. 4. Raw industrial commodities will outperform crude oil. Such an inflection point can leave investors scratching their heads in confusion, because sector performances seem to conflict with the economic data releases. But the conflict is easily resolved. Though we are now in mid-November, the economic data releases - for example, German exports - are a lagging indicator, referring to a time in the past, September, when global credit growth might still have been in a down-oscillation. Whereas the financial markets - for example, bank equities' relative performance - are a contemporaneous indicator, sensing credit growth's switch to an up-oscillation in real-time. Always remember that market prices move on the marginal change in information and expectations. To be absolutely clear, we are not referring to the business cycle. We are referring to predictable oscillations in credit growth that occur within the business cycle, but which nevertheless create double-digit investment opportunities - such as bank equities' relative performance. The Importance Of 6-Month Credit Growth Still, several clients have asked about our choice of 6-month credit growth, as it appears to be an arbitrary period plucked out of thin air or, more cynically, 'data-mined'. In fact, our choice of 6-month growth has a rock-solid foundation in economic theory.4 For any item, if supply lags demand by a period t, then economic theory proves that both the quantity of the item and its price will experience oscillations with half-cycle length t. Clearly, bank credit is such an item whose supply does lag demand. For example, a mortgage is only allocated and released after a time-consuming process of checking collateral and creditworthiness. For bank credit in aggregate, the lag between demand and supply, and specifically final spending of the funds, averages six to eight months. Once you accept this fundamental truth, it follows that credit growth must also experience oscillations whose half-cycles last six to eight months. So we end with a very important investment lesson. If you only look at the conventionally examined year-on-year credit growth data, you will not see the predictable oscillations in 6-month credit growth. And if you do not look at 6-month credit growth, you will miss the double-digit investment opportunities that are always on offer (Chart I-11). Chart I-11A Sharp Down-Oscillation In Global Credit Growth Has Rebounded Into An Up-Oscillation
A Sharp Down-Oscillation In Global Credit Growth Has Rebounded Into An Up-Oscillation
A Sharp Down-Oscillation In Global Credit Growth Has Rebounded Into An Up-Oscillation
The choice is yours. Dhaval Joshi, Senior Vice President Chief European Investment Strategist dhaval@bcaresearch.com 1 We use the MSCI All Country World Index in local currency terms to capture the global stock market. 2 Negative asymmetry of returns means the possibility of larger short-term losses than short-term gains. Please see the European Investment Strategy Weekly Report, "Risk: The Great Misunderstanding Of Finance", October 25, 2018 available at eis.bcaresearch.com. 3 Please see the European Investment Strategy Weekly Report, "Trapped: Have Equities Trapped Bonds?", September 13, 2018 available at eis.bcaresearch.com. 4 Please see the European Investment Strategy Special Report, "The Cobweb Theory And Market Cycles", January 11, 2018 available at eis.bcaresearch.com. Fractal Trading Model* Palladium has outperformed nickel by 50% in the past three months, but this strong trend is nearing exhaustion according to its 65-day fractal dimension. Hence, this week's trade recommendation is long nickel/short palladium setting a profit target of 14% with a symmetrical stop-loss. For any investment, excessive trend following and groupthink can reach a natural point of instability, at which point the established trend is highly likely to break down with or without an external catalyst. An early warning sign is the investment's fractal dimension approaching its natural lower bound. Encouragingly, this trigger has consistently identified countertrend moves of various magnitudes across all asset classes. Chart I-12
Long Platinum / Short Nickel
Long Platinum / Short Nickel
The post-June 9, 2016 fractal trading model rules are: When the fractal dimension approaches the lower limit after an investment has been in an established trend it is a potential trigger for a liquidity-triggered trend reversal. Therefore, open a countertrend position. The profit target is a one-third reversal of the preceding 13-week move. Apply a symmetrical stop-loss. Close the position at the profit target or stop-loss. Otherwise close the position after 13 weeks. Use the position size multiple to control risk. The position size will be smaller for more risky positions. * For more details please see the European Investment Strategy Special Report "Fractals, Liquidity & A Trading Model," dated December 11, 2014, available at eis.bcaresearch.com Fractal Trading Model Recommendations Asset Allocation Equity Regional and Country Allocation Equity Sector Allocation Bond and Interest Rate Allocation Currency and Other Allocation Closed Fractal Trades Trades Closed Trades Asset Performance Currency & Bond Equity Sector Country Equity Indicators Bond Yields Chart II-1Indicators To Watch - Bond Yields
Indicators To Watch - Bond Yields
Indicators To Watch - Bond Yields
Chart II-2Indicators To Watch - Bond Yields
Indicators To Watch - Bond Yields
Indicators To Watch - Bond Yields
Chart II-3Indicators To Watch - Bond Yields
Indicators To Watch - Bond Yields
Indicators To Watch - Bond Yields
Chart II-4Indicators To Watch - Bond Yields
Indicators To Watch - Bond Yields
Indicators To Watch - Bond Yields
Interest Rate Chart II-5Indicators To Watch - Interest Rate Expectations
Indicators To Watch - Interest Rate Expectations
Indicators To Watch - Interest Rate Expectations
Chart II-6Indicators To Watch - Interest Rate Expectations
Indicators To Watch - Interest Rate Expectations
Indicators To Watch - Interest Rate Expectations
Chart II-7Indicators To Watch - Interest Rate Expectations
Indicators To Watch - Interest Rate Expectations
Indicators To Watch - Interest Rate Expectations
Chart II-8Indicators To Watch - Interest Rate Expectations
Indicators To Watch - Interest Rate Expectations
Indicators To Watch - Interest Rate Expectations
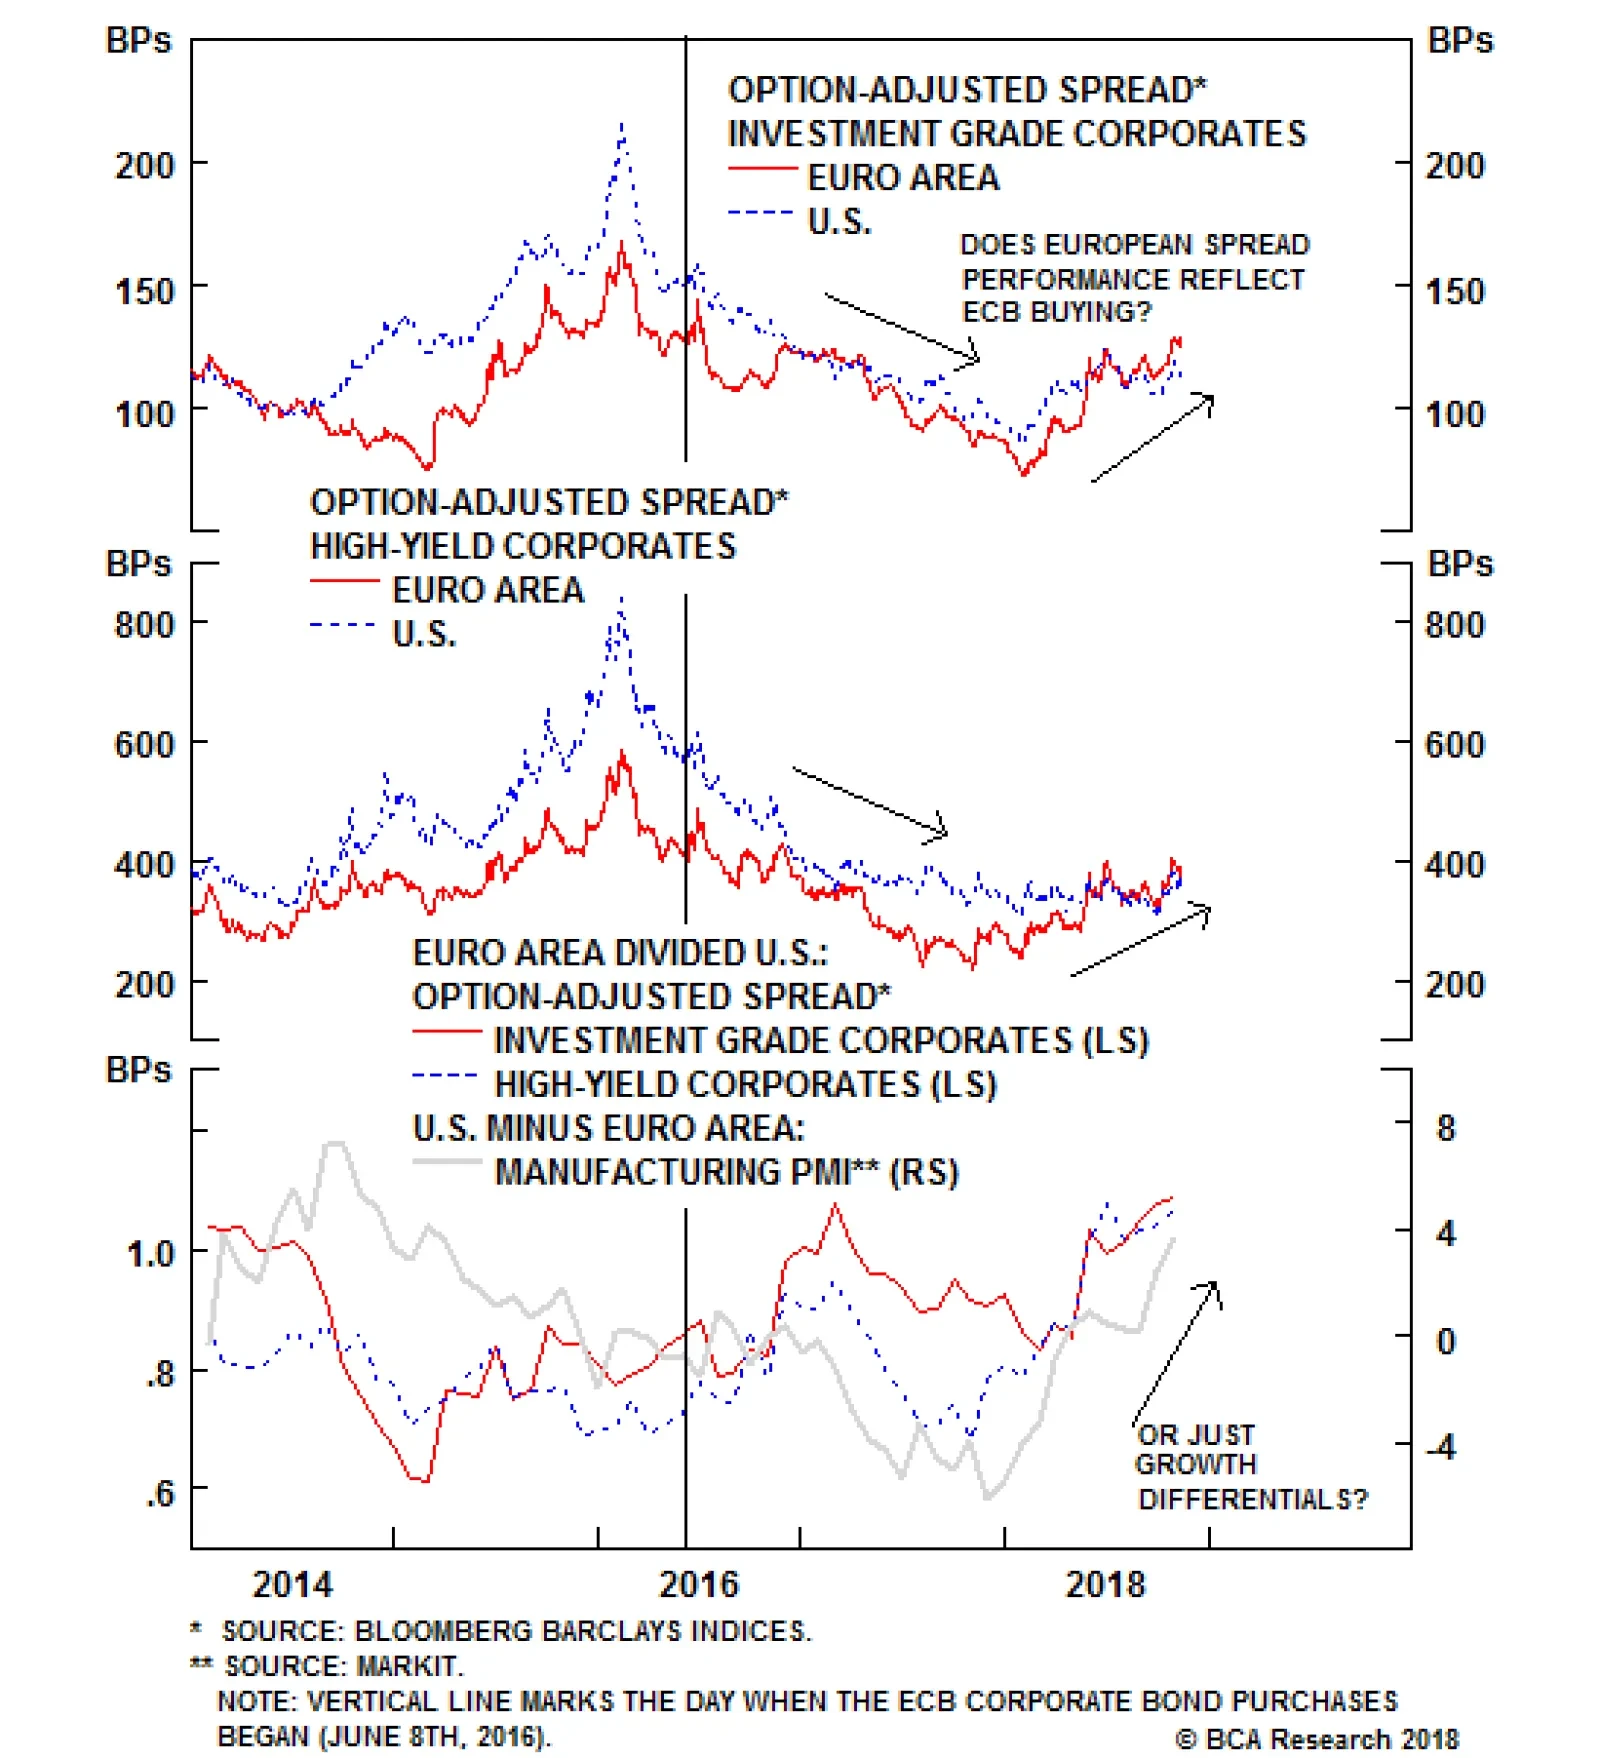
The ECB has been buying corporate bonds since 2016. The Corporate Sector Purchase Program (CSPP), as it is formally known, has been a targeted tool used by the ECB to ease financial conditions for euro area companies. This effect has occurred through three…
Highlights Falling Oil Prices & Bond Yields: Murky trends in global growth data, at a time of tight labor markets and gently rising inflation, are preventing a full recovery of risk assets after the October correction. A new concern is the falling price of oil, although this looks more corrective than a true change in trend. For now, maintain a cautious stance within global fixed income portfolios - neutral on corporate credit, below-benchmark on duration exposure. ECB Corporate Bond Purchases: The ECB is set to end the new buying phase of its Asset Purchase Program next month. This suggests that the best days in this cycle for European corporate credit are behind us, as the ECB will not treat its corporate bond purchases any differently than its government bond purchases. Both are going to stop. Remain underweight euro area corporate debt, both investment grade & high-yield. Feature Are Falling Oil Prices Telling Us Something About Global Growth? Thus far in November, global financial markets have reversed some of the steep losses incurred during the "Red October" correction. This has occurred for U.S. equities (the S&P 500 fell -8% last month but has risen +4% so far this month), U.S. corporate bonds (high-yield spreads widened +71bps last month and have tightened -19bps this month) and emerging market hard currency debt (USD-denominated sovereign spreads widened +27bps last month and have tightened -9bps this month). One market that has not rebounded, however, is oil. The benchmark Brent oil price fell -11% in October, but has fallen another -7% in November. This has been enough to nearly wipe out the entire +20% run-up seen in August and September. Global government bond yields have been very sensitive to swings in oil markets in recent years. Such a large decline in the oil price as has been seen of late would typically result in sharp drop in government bond yields, driven by falling inflation expectations. That correlation has been holding up in the major economies outside the U.S., where nominal yields and inflation expectations are lower than the levels seen before the October peak in oil prices. Nominal U.S. Treasury yields, by contrast, remain resilient, despite the fall in TIPS breakevens (Chart of the Week). This is because real Treasury yields have been climbing higher as investors acquiesce to the steady hawkish message from the Fed by making upward revisions to the expected path of U.S. policy rates. Chart of the WeekShifting Correlations
Shifting Correlations
Shifting Correlations
The biggest impediment holding back a full recovery of the October losses for global risk assets is uncertainty over the global growth outlook. While the U.S. economy continues to churn along at an above-trend pace, there are signs that tighter monetary policy is starting to have an impact. Both housing and capital spending have cooled, although not yet by enough to pose a terminal threat to the current long business cycle expansion. The outlook for growth outside the U.S. is far more muddled, adding to investor confusion. China has seen a clear growth deceleration throughout 2018, but the recent reads from imports and the Li Keqiang index suggest that growth may be stabilizing or even modestly re-accelerating (Chart 2). Our China strategists are not convinced that this is anything more than a ramping up of imports and production in advance of the full imposition of U.S. trade tariffs, especially with Chinese policymakers reluctant to deploy significant fiscal or monetary stimulus to boost growth. Chart 2Mixed Messages On Growth
Mixed Messages On Growth
Mixed Messages On Growth
A similar mixed read is evident in overall global trade data. World import growth has also slowed throughout 2018, but has shown some stabilization of late (second panel). A similar pattern can be seen in capital goods imports within the major developed economies. Our global leading economic indicator (LEI) continues to contract, but the pace of the decline has been moderating and our global LEI diffusion index - which measures the number of countries with a rising LEI versus those with a falling LEI - may be bottoming out (third panel). There are also large, and growing, divergences within the major developed economies. The manufacturing purchasing managers' indices (PMIs) for the euro area and the U.K. have been falling steadily since the start of the year, but the PMIs have recently ticked up in the U.S. and Japan (Chart 3). A similar pattern can be seen in the OECD LEIs, which have retreated from the latest cyclical peaks by far more in the U.K. (-1.6%) and euro area (-1.2%) than in the U.S. (-0.3%) and Japan (-0.6%). Chart 3Diverging Growth, Diverging Bond Yields
Diverging Growth, Diverging Bond Yields
Diverging Growth, Diverging Bond Yields
With such mixed messages from the macro data, investors understandably lack conviction. The backdrop does not look soft enough yet to threaten global profit growth and justify sharply lower equity prices and wider corporate bond spreads. Yet the growth divergences between the U.S. and the rest of the world are intensifying, creating a backdrop of rising U.S. real interest rates and a stronger U.S. dollar. That combination is typically toxic for emerging markets, but the impact of that would be muted this time if China were to indeed see a genuine growth reacceleration. This macro backdrop lines up with our current major fixed income investment recommendations. We suggest only a neutral allocation to global corporate bonds given the uncertainty over growth, but favoring the U.S. over Europe and emerging markets given the clearer evidence of a strong U.S. economy. At the same time, we continue to recommend below-benchmark overall portfolio duration exposure, but with regional allocations favoring countries where central banks will have difficulty raising interest rates (Japan, Australia, core Europe, the U.K.) versus nations where policymakers are likely to tighten monetary policy (U.S., Canada). However, the latest dip in oil should not be ignored. A more sustained breakdown of oil prices could force us to downgrade corporate bonds and raise duration exposure - if it were a sign that global growth was slowing and inflation expectations had peaked. The current pullback in oil has occurred alongside a decelerating trend in global economic data surprises, after speculators had ramped up long positions in oil and prices were stretched relative to the 200-day moving average (Chart 4). This suggests that the latest move has been corrective, and not a change in trend, although the burden of proof now falls on the evolution of global growth, both in absolute terms and relative to investor expectations. Chart 4Oil Correction Or Growth Scare?
Oil Correction Or Growth Scare?
Oil Correction Or Growth Scare?
Bottom Line: Murky trends in global growth data, at a time of tight labor markets and gently rising inflation, are preventing a full recovery of risk assets after the October correction. A new concern is the falling price of oil, although this looks more corrective than a true change in trend. For now, maintain a cautious stance within global fixed income portfolios - neutral on corporate credit, below-benchmark on duration exposure. European Corporates Are About To Lose A Major Buyer Last week, we published a Special Report discussing the ECB's options at next month's critical monetary policy meeting.1 One of our conclusions was that the central bank will deliver on its commitment to end the new purchases phase of its Asset Purchase Program (APP) at year-end. The bulk of the assets in the APP are government bonds, but the ECB has also been buying corporate debt in the APP since June 2016. The ECB is set to end those purchases at the end of December, to the likely detriment of euro area corporate bond returns. The Corporate Sector Purchase Program (CSPP), as it is formally known, has been a targeted tool used by the ECB to ease financial conditions for euro area companies. This has occurred through three main channels: tighter corporate bond spreads, greater access for companies to issue debt in the corporate primary market, and increased bank lending to non-financial corporations. The CSPP was intended to complement the ECB's other monetary stimulus measures, like negative interest rates and the buying of government debt. The first CSPP purchases were made on June 8, 2016. The euro area corporate bond market responded as expected, with investment grade spreads tightening from 128bps to 86bps by the end of 2017. There were spillovers into high-yield bonds, as well, with spreads falling -129bps over the same period (Chart 5). Since then, however, spreads have steadily widened and European corporates have underperformed their U.S. equivalents. This suggests that some of the relative performance of euro area credit may have simply reflected the relative strength of the euro area economy compared to the U.S. The greater acceleration of euro area growth in 2017 helped euro area corporates outperform U.S. equivalents, while the opposite has held true in 2018. Chart 5ECB Buying Does Not Control European Credit Spreads
ECB Buying Does Not Control European Credit Spreads
ECB Buying Does Not Control European Credit Spreads
The CSPP has operated with a defined set of rules governing the purchases. Bank debt was excluded, as were bonds rated below investment grade. Only debt issued by corporations established in the euro area were eligible for the CSPP, although bonds from euro-based companies with parents who were not based in the euro area were also eligible. The latest update on the holdings data from the ECB shows that there are just under 1,200 bonds in the CSPP portfolio. Yet despite the ECB's best efforts to maintain some degree of portfolio diversification, the impact of the CSPP on euro area corporate bond markets was fairly consistent across countries and sectors (Chart 6). Italy is the notable diverging country this year, as the rising risk premiums on all Italian financial assets have pushed corporate bond yields and spreads well above the levels seen in core Europe, even with the ECB owning some Italian names in the CSPP. Chart 6Spread Convergence During CSPP
Spread Convergence During CSPP
Spread Convergence During CSPP
There was also convergence of yields and spreads among credit tiers during the first eighteen months of the CSPP, with valuations on BBB-rated debt falling towards the levels on AA-rated and A-rated bonds (Chart 7). That convergence has gone into reverse in 2018, with BBB-rated spreads widening by +55bps year-to-date (this compares to a smaller +25bps increase in U.S. BBB-rated corporate spreads). A surge in the available supply of BBB-rated euro area bonds is a likely factor in that spread widening, as evidenced by the sharp rise in the market capitalization of the BBB segment of the Bloomberg Barclays euro area corporate bond index (top panel). Chart 7A Worsening Supply/Demand Balance For European BBBs?
A Worsening Supply/Demand Balance For European BBBs?
A Worsening Supply/Demand Balance For European BBBs?
More broadly, the CSPP has helped the ECB's goal of boosting the ability of European companies to issue debt in primary bond markets. Traditionally, European firms have used bank loans as their main source of borrowed funds, with only the largest firms being able to issue debt in credit markets. That has changed during the CSPP era. According to data from the ECB, gross debt issuance by euro area non-financial companies (NFCs) has risen by €104bn since the start of the CSPP, taking issuance back to levels not seen since 2014 (Chart 8). The bulk of the issuance has been in shorter-maturity bonds, but there has been a notable increase in the issuance of longer-dated debt since the CSPP began. Chart 8Bank Funding Versus Bond Funding
Bank Funding Versus Bond Funding
Bank Funding Versus Bond Funding
The ECB's role as a marginal buyer of bonds in the primary, or newly-issued, market has helped boost that gross issuance figure. The share of bonds that the ECB owns in the CSPP that was issued in the primary market has gone from 6% soon after the CSPP started to the current 18% (Chart 9). The growth in euro area non-financial corporate debt went from 6% to over 10% during the peak of the CSPP buying between mid-2016 and end-2017, but has since decelerated to 7%. At the same time, the annual growth in loans to NFCs, which was essentially zero during the first eighteen months of the CSPP, has accelerated to 2% over the course of 2018. Chart 9More Bank Loans, Less Debt Issuance
More Bank Loans, Less Debt Issuance
More Bank Loans, Less Debt Issuance
In other words, euro area companies had been substituting bank financing for bond financing in the CSPP "era", but have since shifted back towards bank loans in 2018. That shift in financing was most notable among CSPP-eligible companies, particularly those smaller firms that had not be able to issue debt in the primary market pre-CSPP, according to an ECB analysis conducted earlier this year.2 From the point of view of the investible euro area corporate bond market, however, even larger companies that have done that shift in bank financing to bond financing have seen no noticeable increase in aggregate corporate leverage. In Chart 10, we show our bottom-up version of our Corporate Health Monitor (CHM) for the euro area. This indicator is designed to measure the aggregate financial health of euro area companies using financial ratios incorporating actual data from individual companies. We separated out the list of companies used in that CHM that are currently held in the CSPP portfolio and created a "CSPP-only" version of the CHM (the blue lines in all panels). All issuers that were eligible for inclusion in the CSPP, but whose bonds were not actually purchased by the ECB, are used to create a "non-CSPP" CHM (the black dotted lines). Chart 10No Fundamental Changes From CSPP
No Fundamental Changes From CSPP
No Fundamental Changes From CSPP
As can be seen in the chart, there is no material difference in any of the ratios for bonds within or outside the CSPP. The one notable exception is short-term liquidity, where the ratios were much lower for names purchased by the ECB than for those that were not. This lends credence to the idea that the CSPP most helped firms that were more liquidity-constrained, likely smaller companies. The biggest change in any of the ratios has been in interest coverage, but that has been for both CSPP and non-CSPP issuers, suggesting a common factor outside of ECB buying - zero/negative ECB policy rates, ECB purchases of government bonds that helped reduce all European borrowing rates - has been the main driver of lowering interest costs. Looking ahead, the ECB is likely to stop the net new purchases of its CSPP program when it does the same for the full APP next month. All of which is occurring for the same reason - the euro area economy is deemed by the central bank to no longer need the support of large-scale asset purchases given a full employment labor market and gently rising inflation. As we discussed in our Special Report last week, the ECB has other options available to them if there is a reduction in euro area banks' capacity or willingness to lend, such as introducing a new Targeted Long-Term Refinancing Operation (TLTRO). Continuing with unconventional measures involving direct ECB involvement in financial markets, like buying corporate debt, is no longer necessary. Our euro area CHM suggests that there are no major problems with European corporate health that require a wider credit risk premium. We still have our reservations, however, about recommending significant euro area corporate bond exposure while the ECB is set to end its asset purchase program. New buyers will certainly come in to replace the lost demand from the elimination of CSPP purchases, but private investors will likely require higher yields and spreads than the central bank - especially if the current period of slowing euro area growth were to continue. Bottom Line: The ECB is set to end the new buying phase of its Asset Purchase Program next month. This suggests that the best days for European corporate debt for the current cycle are behind us, as the ECB will not treat its corporate bond purchases any different than its government bond purchases. Both are going to stop. Remain underweight euro area corporate debt, both investment grade and high-yield. Robert Robis, CFA, Senior Vice President Global Fixed Income Strategy rrobis@bcaresearch.com 1 Please see BCA Global Fixed Income Strategy/Foreign Exchange Strategy Special Report, "Evaluating The ECB's Options In December", dated November 6th 2018, available at gfis.bcareserach.com and fes.bcaresearch.com. 2 The ECB report on its CSPP program was published in the March 2018 edition of the ECB Economic Bulletin, which can be found here. https://www.ecb.europa.eu/pub/economic-bulletin/html/eb201804.en.html Recommendations The GFIS Recommended Portfolio Vs. The Custom Benchmark Index
Stubbornly Resilient Bond Yields
Stubbornly Resilient Bond Yields
Duration Regional Allocation Spread Product Tactical Trades Yields & Returns Global Bond Yields Historical Returns
Feature In the late 1980s, half of the global stock market capitalization resided in Japan Furthermore, almost a third of the Japanese stock market capitalization resided in banks. It followed that to have a view on the global stock market you had to have a view on Japanese banks. Indeed, in 1988, five of the ten largest companies in the world were Japanese banks. Less than ten years later, the weighting of Japanese banks in the global stock market had collapsed to less than one percent, rendering Japanese banks a largely irrelevant part of a global equity portfolio. In the new millennium, it was the turn of European banks to step into the limelight. By 2007, the proportion of the euro area's stock market capitalization in banks had ballooned to a quarter. And then, Europe followed in Japan's footsteps. Today, the weighting of banks in the Euro Stoxx has plunged to around a tenth. Could European banks now become a global investment irrelevance too (Feature Chart)? Feature ChartAre Europe's Banks Following In Japan's Footsteps?
Are Europe's Banks Following In Japan's Footsteps?
Are Europe's Banks Following In Japan's Footsteps?
European banks have performed very poorly. From their peak in 2007, a one dollar investment in euro area banks relative to the world index would now be worth just 15 cents. But Japanese banks have performed abysmally: from their peak in the late 1980s, a one dollar investment in Japanese banks relative to the world index would now be worth a pitiful 3 cents (Chart I-2 and Chart I-3).1 Chart 2Japan Dominated The Global Stock Market In The Late 1980s
Japan Dominated The Global Stock Market In The Late 1980s
Japan Dominated The Global Stock Market In The Late 1980s
Chart 3Banks Have Performed Abysmally
Banks Have Performed Abysmally
Banks Have Performed Abysmally
What turned Japanese bank shares from heroes to zeroes? Some people point to sky-high valuations: in the late 80s, Japanese bank dividend yields dropped below 0.5 percent (Chart I-4), and these high valuations clearly contributed to their subsequent poor investment performance. But this was not the main reason. Chart 4Japanese Banks Offered Miserly Dividend Yields
Japanese Banks Offered Miserly Dividend Yields
Japanese Banks Offered Miserly Dividend Yields
Banks' Lifeblood Is Credit Creation The main reason for the severe underperformance of Japanese banks was that they lost their lifeblood: credit creation. Put simply, if bank assets stop growing structurally, then it is impossible for bank revenues to grow structurally. But in Japan, it was worse: from the 1990s through the mid noughties, private sector indebtedness actually shrank from 220 percent to 160 percent of GDP, and this explains the bulk of the abysmal performance of bank equities (Chart I-5). Chart 5Banks' Lifeblood Is Credit Creation
Banks' Lifeblood Is Credit Creation
Banks' Lifeblood Is Credit Creation
The important lesson is that the structural outlook for bank equities depends first and foremost on the structural outlook for bank credit creation. This is especially true in Europe because the majority of credit intermediation occurs via the banking system rather than via the bond market. So how can we assess the structural outlook for bank credit creation? Basically by noting that there appears to be an upper limit at which all the good lending has been done. Additional bank credit then generates misallocation of capital and mal-investments. At which point, the economy and bank asset quality start to suffer, limiting any further increase in profitable lending. The precise point at which this happens is not set in stone, because high levels of public indebtedness, through 'crowding out', can pull down the limit of productive private indebtedness. And vice-versa. Nevertheless when private indebtedness, as a percentage of GDP, reaches the mid-200s, the evidence suggests that the scope for further growth becomes limited. On this basis, the outlook for bank asset growth in Europe is a mixed bag. In Switzerland, Sweden and Norway, private indebtedness already stands at 250 percent of GDP, implying that the stock of profitable bank assets is close to its upper limit (Chart I-6). Chart 6In Switzerland, Sweden And Norway, Private Indebtedness Is Very High
In Switzerland, Sweden And Norway, Private Indebtedness Is Very High
In Switzerland, Sweden And Norway, Private Indebtedness Is Very High
Meanwhile in the euro area, private indebtedness ratios in the Netherlands and Belgium are already well above 200 percent, and in France at 200 percent. On the other hand, the ratios in Germany and Italy - the largest and third largest euro area economies - are barely above 100 percent (Chart I-7). This bestows on them the honour of the lowest privately indebted major economies in the world (Chart I-8), with considerable theoretical capacity for bank asset growth. Admittedly, Italy has a high level of public indebtedness. Nevertheless, it is hard to deny that if the banking system in Italy could be unfrozen, there is great scope for economically productive lending. Chart 7In Germany And Italy, Private Indebtedness Is Very Low
In Germany And Italy, Private Indebtedness Is Very Low
In Germany And Italy, Private Indebtedness Is Very Low
Chart 8In Japan, Private Indebtedness Has Plunged
In Japan, Private Indebtedness Has Plunged
In Japan, Private Indebtedness Has Plunged
Having said all that, we now turn to something that bank investors everywhere in the world should fear: blockchain. Blockchain Is A Mortal Threat To Banks The internet's major innovation was to decentralize and democratize information. Before the internet, the creation, ownership and dissemination of information was a function centralized to privileged organizations: governments, media and entertainment companies. But after the internet, anybody and everybody could create, receive and share content - and this has proved to be a game changer for the governments, media and entertainment companies that previously owned and/or controlled the information. In the same way, blockchain's major innovation is to decentralize and democratize trust. The Economist even described blockchain as "the trust machine".2 It follows that blockchain will be a game changer for the privileged organizations whose raison d'être is to supply trust and integrity in transactions - essentially, those that act as a middleman. Clearly, one such privileged organization is the banking system, because the banking system is really nothing more than a middleman that provides trust and integrity in the transaction between the people with savings and the people who want to borrow those savings. Granted, banks also assess and price the credit risk of borrowers as well as provide a degree of insurance for savers. But with the prevalence of universal credit scoring systems and compensation schemes, there is a growing tendency to decentralize those functions too. Put simply, blockchain removes the need for a middleman. Until now, counterparties without an established trust relationship could only transact through a middleman who could add the trust and integrity overlay. But once each participant in the transaction trusts the blockchain itself, they no longer need to use a costly intermediary, like a bank. Therefore, just as the internet has revolutionized politics, media and entertainment, it is our very high conviction view that blockchain will revolutionize the way that money, assets and securities are held, transferred and accounted for. And the major casualty will be the banking system as we now know it. Investment Considerations The structural case for European banks is that Germany and Italy - the largest and third largest euro area economies - have considerable scope for bank credit expansion. The structural case against is that the other European economies have very limited scope for bank credit expansion. Furthermore, we confidently predict that within a decade blockchain will have decentralized and democratized financial intermediation, transforming it to something that is unrecognizable from today. Overall, this will not be a good thing for bank investors. With this in mind, German and Italian real estate and real estate equities are a much cleaner structural play on the potential for increased private indebtedness in those economies, whether intermediated by the banking system or not (Chart I-9 and Chart I-10). Chart 9The Evolution Of Private Indebtedness...
European Banks: The Case For And Against
European Banks: The Case For And Against
Chart 10...Drives The Real Estate Market
Drives The Real Estate Market
Drives The Real Estate Market
We end with another important lesson from Japan. Even in a three decade long bear market, the banks had the capacity for countertrend bursts of outperformance from oversold levels, sometimes by as much as 50 percent in a year. This is because even within a structural bear trend, there are cycles of excessive depression. European banks could be ripe for such a countertrend burst of outperformance. This year, European banks sank by 35 percent versus European healthcare. However, the sharp deceleration in global credit growth which dragged them down has now clearly reversed (Chart I-11). On this basis, the next six months could be a countertrend phase: a brief opportunity to own some European banks, at least relative to other equity sectors. Chart 11European Banks Are Ripe For A Burst Of Outperformance
European Banks Are Ripe For A Burst Of Outperformance
European Banks Are Ripe For A Burst Of Outperformance
Dhaval Joshi, Senior Vice President Chief European Investment Strategist dhaval@bcaresearch.com 1 Performances are calculated in common currency terms. 2 Please see 'the trust machine', The Economist, October 31, 2015.
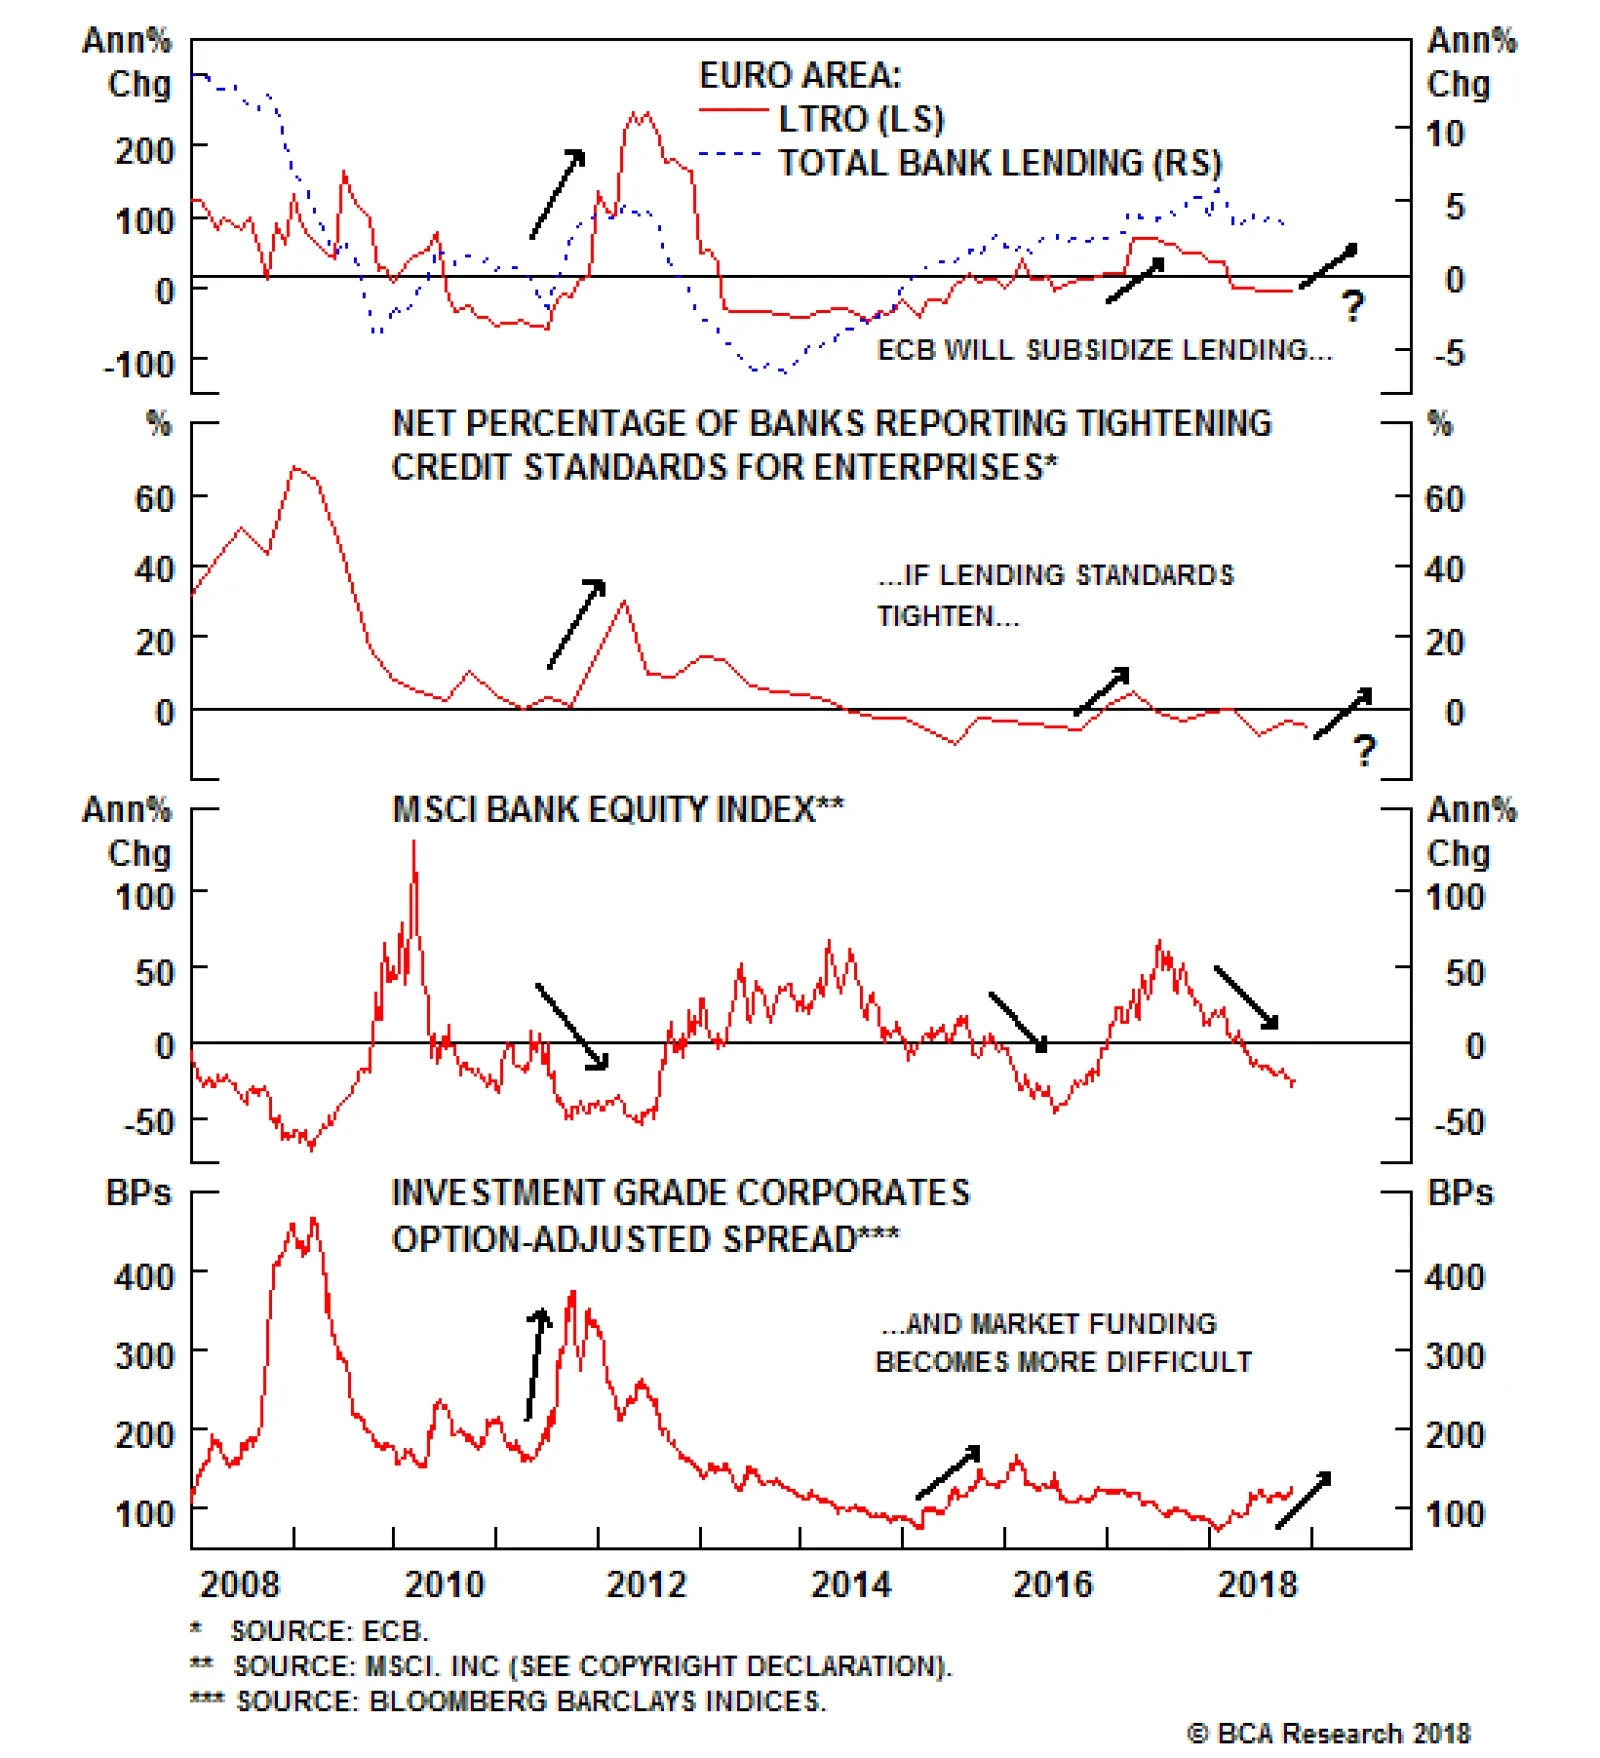
This is the most effective way to get European banks to extend credit to borrowers at lower interest rates, since the banks would be able to fund that borrowing via the TLTRO at a rate lower than market rates. In our view, a new TLTRO is the most effective…