Europe
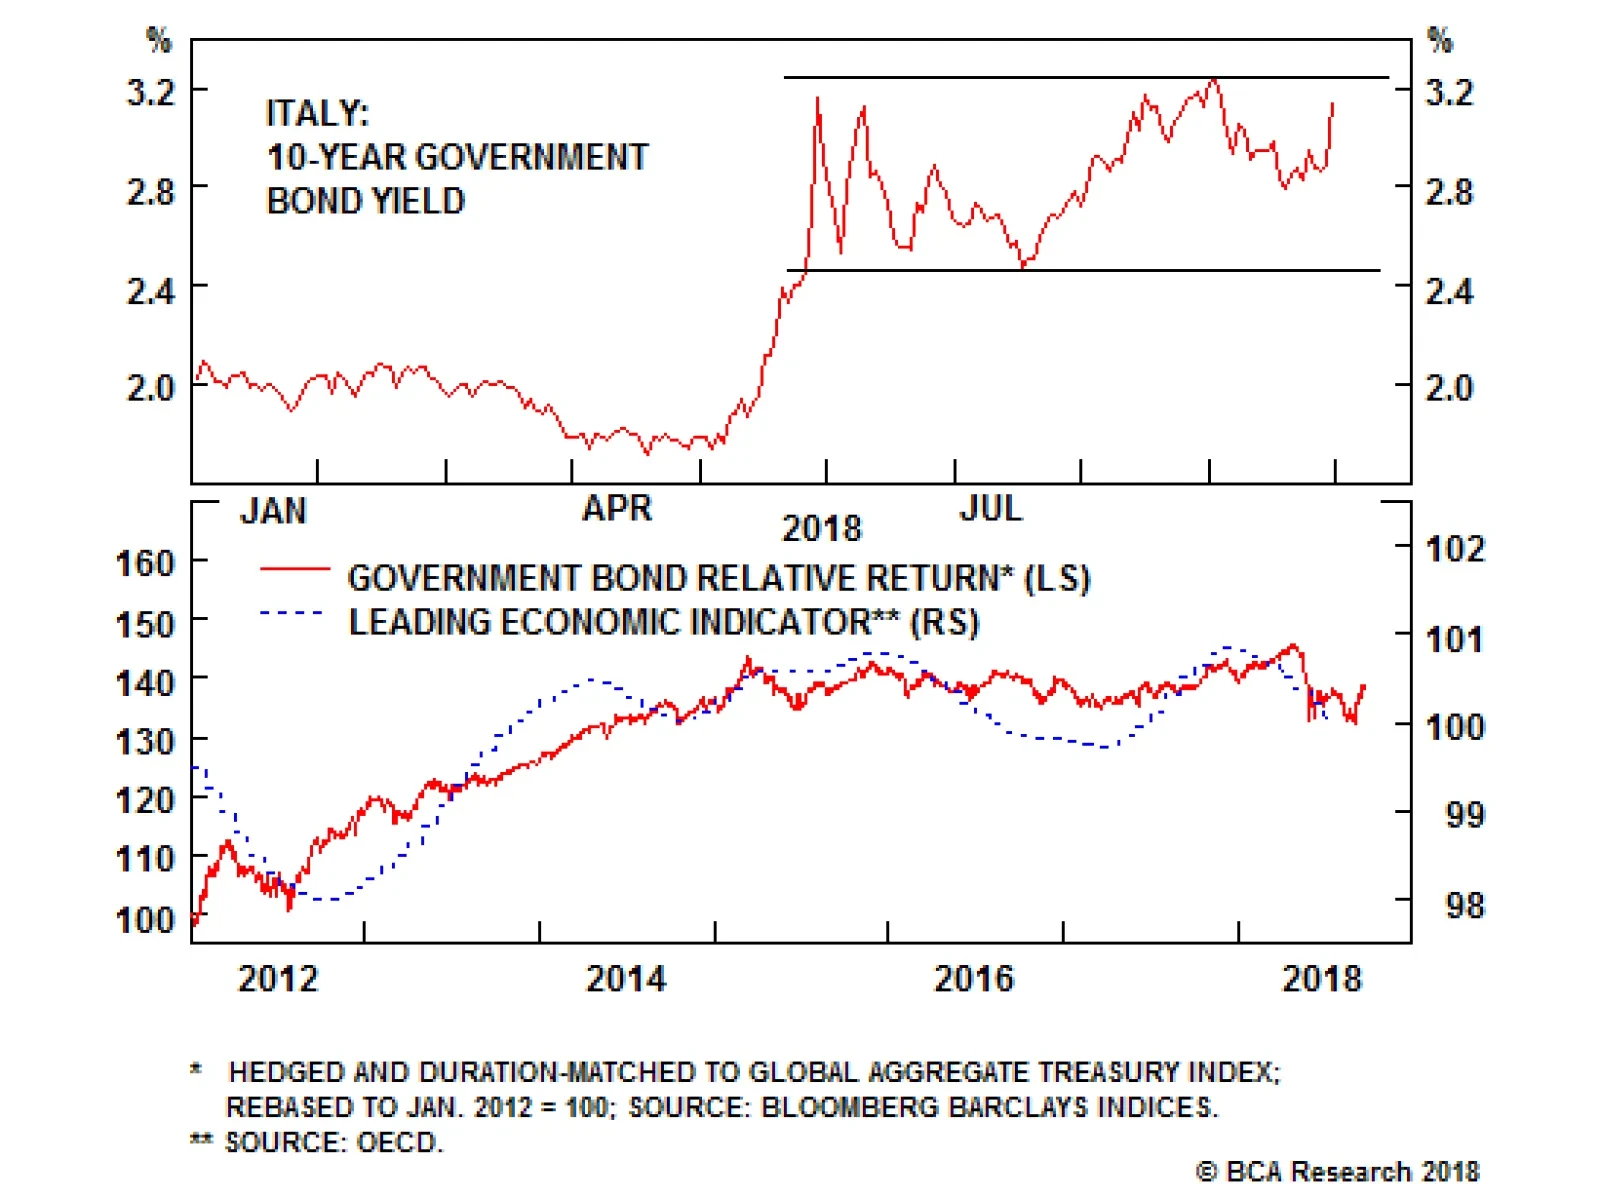
The Italian 10-year government bond yield jumped 25bps, returning to the upper end of the range that has prevailed since late May, while the Italian MIB equity index plunged -3.7% with some Italian banks suffering losses of as much as -9%. Given the size…
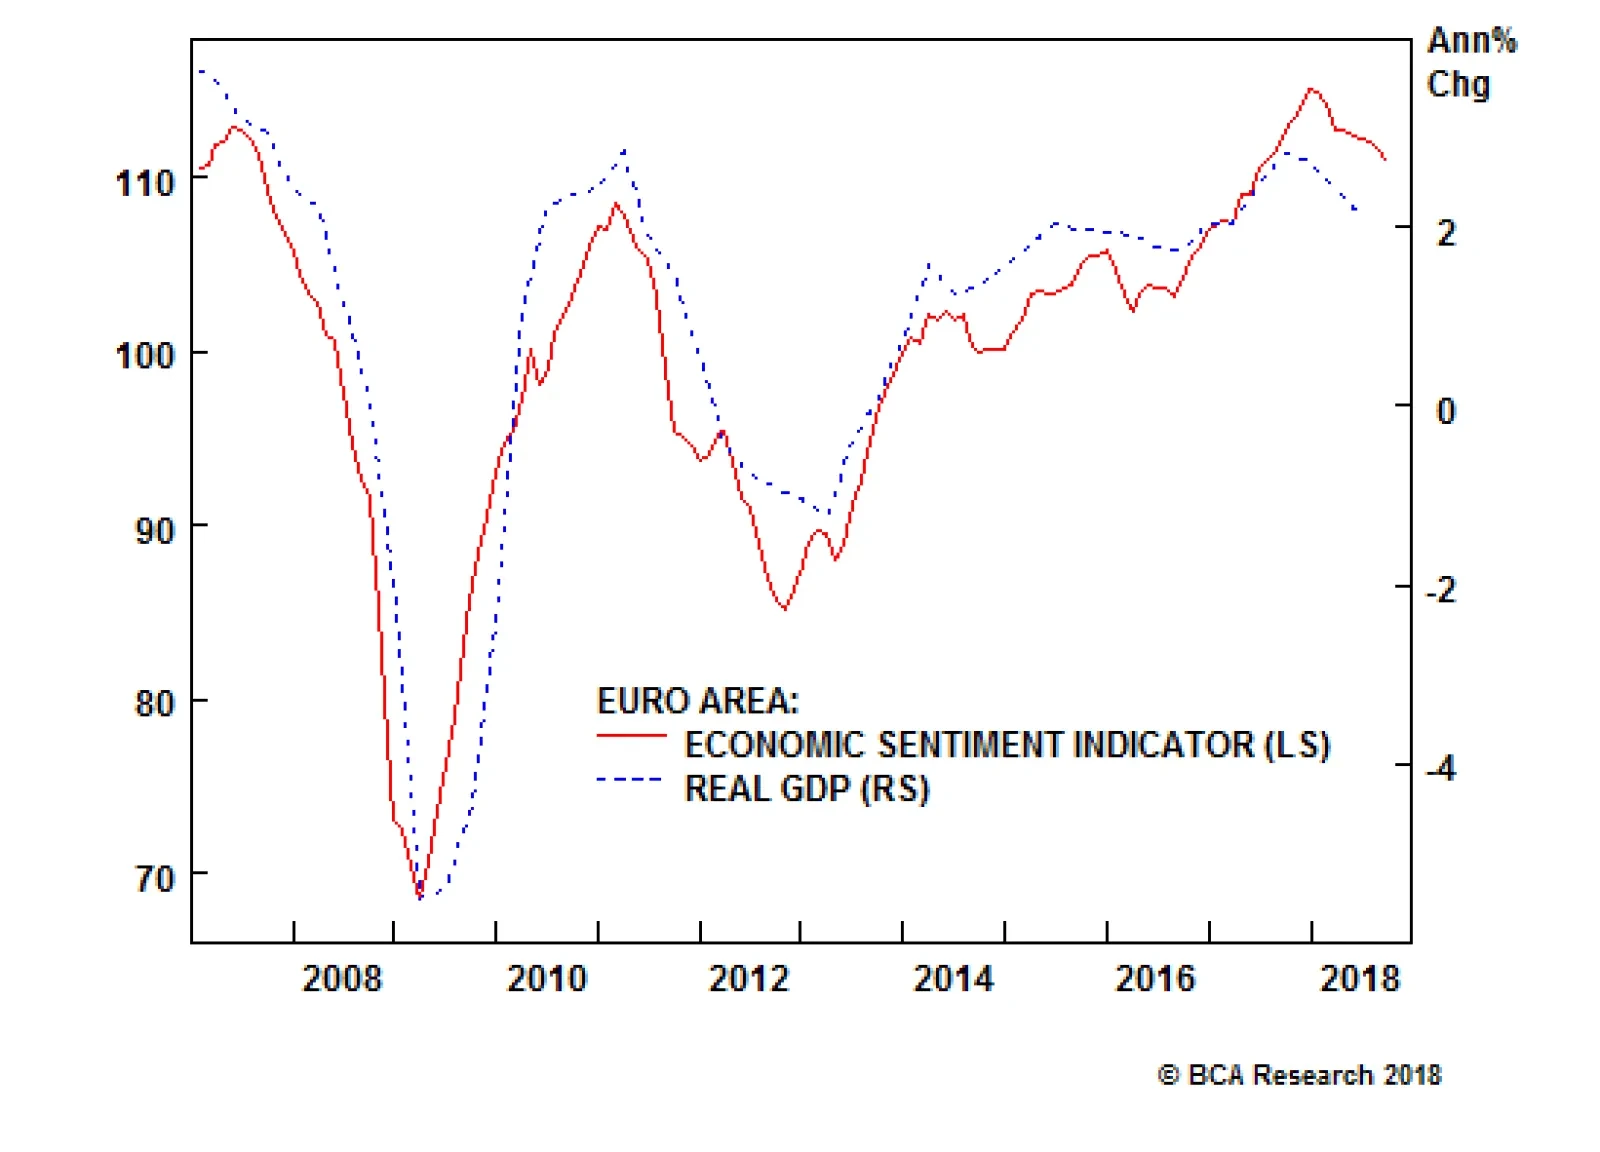
Although ECB President Mario Draghi sounded a more hawkish tone on the outlook for the euro area, the economic data have been under pressure for most of 2018, and the recently released European economic sentiment data show that pressures might not abate in…

Highlights The Global Golden Rule (GGR): The gap between market expectations of global central bank policy rates and realized interest rate outcomes is a reliable predictor of government bond returns. Thus, "getting the policymaker call right" is the key to outperformance for bond investors. Implied Government Bond Yields: Given the strong correlation between policy rate surprises and government bond yield changes, we can use the GGR to forecast yields one year from now based on our own assumptions of how many rate hikes (cuts) will be delivered versus what is discounted in money market yield curves. Total Return Forecasts: We can use implied government bond yield changes from the GGR to generate expected 12-month total returns for government bond indexes of different maturities, taking into account different rate hike assumptions for various central banks. Feature Chart 1Global Monetary Divergences?
Global Monetary Divergences?
Global Monetary Divergences?
This month marked the ten-year anniversary of the 2008 Lehman Brothers default, which set off a worldwide financial crisis and a massive easing of global monetary policy. Extraordinary measures - zero (or negative) interest rates, large-scale asset purchases and dovish forward guidance from policymakers - were all successful in suppressing both global bond yields and volatility over time, helping the global economy slowly heal from the crisis. Now, a decade later, such hyper-easy monetary policies are no longer required given low unemployment rates and rising inflation in the major developed economies. That can be seen today with the Federal Reserve shifting to "quantitative tightening" (letting bonds run off its swollen balance sheet) alongside steady rate hikes, the European Central Bank (ECB) set to stop net new buying of euro area bonds at year-end, and the Bank of Japan (BoJ) dramatically slowing its pace of asset purchases. BCA's Central Bank Monitors, which assess the cyclical pressure on policymakers to tighten or ease monetary policy, have collectively been calling for interest rate increases since the start of 2017. Yet our Central Bank Monetary Barometer, which measures the percentage of central banks that have tightened policy over the previous three months, shows that only 1 in 5 banks have actually delivered rate hikes of late (Chart 1). Thus, the risks are tilted towards more countries moving away from highly accommodative monetary conditions given tightening labor markets and rising inflation pressures. This now-global shift towards policy normalization has major implications for global bond investing. The focus is now returning back to more traditional drivers of government bond returns, like changes in central bank policy rates. We recently shared a Special Report published by our colleagues at our sister BCA service, U.S. Bond Strategy, describing a methodology they dubbed "The Golden Rule of Bond Investing".1 That report introduced a numerical framework that translates actual changes in the U.S. fed funds rate relative to market expectations into return forecasts for U.S. Treasuries. The historical results convincingly showed that investors who "get the Fed right" by making correct bets on changes in the funds rate versus expectations were very likely to make the right call on the direction of Treasury yields. In this Special Report, we extend that Golden Rule analysis to government bonds in the other major developed markets (DM). Our conclusion is that utilizing a "Global Golden Rule" (GGR) framework that links bond returns to unexpected changes in policy rates can help bond investors correctly forecast changes in non-U.S. bond yields. The report is set up in two sections. First, we illustrate how the GGR works and how it empirically tends to generally succeed over time for different DM bond markets. In the second section, we make use of the GGR to generate expected return forecasts for non-U.S. government bonds for a variety of interest rate "surprise" scenarios. ECB Policy Rate Surprises Dovish surprises from the ECB do reliably coincide with positive German government bond excess returns versus cash (Chart 2A). Chart 2AECB Policy Rate Surprise & Yields I
ECB Policy Rate Surprise & Yields I
ECB Policy Rate Surprise & Yields I
Chart 2BECB Policy Rate Surprise & Yields II
ECB Policy Rate Surprise & Yields II
ECB Policy Rate Surprise & Yields II
The 12-month ECB policy rate surprise and the 12-month change in the Bloomberg Barclays German Treasury index yield displays a strong positive correlation (Chart 2B). The excess returns during periods of dovish surprises is 14.4% on average and are positive 85% of the time. Hawkish surprises on the other hand, coincide with negative average excess returns of -1.5% (Chart 2C). In terms of total return, the picture is roughly the same except that under hawkish surprises, the average total return you would expect is now positive, given that it factors in coupon income (Chart 2D). Chart 2CGermany: Government Bond Index Excess Return & ECB Policy Rate Surprises (2004 - Present)
The Global Golden Rule Of Bond Investing
The Global Golden Rule Of Bond Investing
Chart 2DGermany: Government Bond Index Total Return & ECB Policy Rate Surprises (2004 - Present)
The Global Golden Rule Of Bond Investing
The Global Golden Rule Of Bond Investing
Table 1Germany: 12-Month Government Bond Index Returns And Rate Surprises (2004 - Present)
The Global Golden Rule Of Bond Investing
The Global Golden Rule Of Bond Investing
Looking ahead, the ECB should not deviate from its current dovish forward guidance of no interest rate hikes until at least the third quarter of 2019. That is somewhat consistent with the reading of the ECB monitor being almost equal to zero. Bank Of England (BoE) Policy Rate Surprises The GGR works well for the U.K. as can be seen in Chart 3A. Chart 3ABoE Policy Rate Surprise & Yields I
BoE Policy Rate Surprise & Yields I
BoE Policy Rate Surprise & Yields I
Chart 3BBoE Policy Rate Surprise & Yields II
BoE Policy Rate Surprise & Yields II
BoE Policy Rate Surprise & Yields II
The 12-month BoE policy rate surprise and the 12-month change in the Bloomberg Barclays U.K. Treasury index yield displays a strong positive correlation except for a major divergence in 1997-1998 (Chart 3B). Dovish surprises coincide with positive excess returns over cash 78% of the time and are on average equal to 6.2% over the full sample (Chart 3C and Chart 3D). As you would expect if the GGR applies, hawkish surprises coincide with negative excess returns. Chart 3CU.K.: Government Bond Index Excess Return & BoE Policy Rate Surprises (1993 - Present)
The Global Golden Rule Of Bond Investing
The Global Golden Rule Of Bond Investing
Chart 3DU.K.: Government Bond Index Total Return & BoE Policy Rate Surprises (1993 - Present)
The Global Golden Rule Of Bond Investing
The Global Golden Rule Of Bond Investing
Table 2U.K.: 12-Month Government Bond Index Returns And Rate Surprises (1993 - Present)
The Global Golden Rule Of Bond Investing
The Global Golden Rule Of Bond Investing
Looking ahead, outcomes will be biased toward dovish surprises over the next six months given the uncertain outcome of the U.K.-E.U. Brexit negotiations. Against that backdrop, the BoE will remain accommodative despite inflationary pressures building up. Bank Of Japan (BoJ) Policy Rate Surprises The GGR does not seem to work when it comes to the Japanese bond market. This reflects the fact that both the markets and the Bank of Japan (BoJ) have understood that chronic low inflation has required no changes in BoJ policy rates (Chart 4A, second panel). Chart 4ABoJ Policy Rate Surprise & Yields I
BoJ Policy Rate Surprise & Yields I
BoJ Policy Rate Surprise & Yields I
Chart 4BBoJ Policy Rate Surprise & Yields II
BoJ Policy Rate Surprise & Yields II
BoJ Policy Rate Surprise & Yields II
While the 12-month BoJ policy rate surprise and the 12-month change in the Bloomberg Barclays Japan Treasury index yield displayed a strong positive correlation pre-1998, the correlation has broken down since then (Chart 4B). Negative excess returns over cash both coincide with dovish and hawkish surprises, on average over time. Further, dovish surprises coincide with positive excess returns only 45% of the time (Chart 4C and Chart 4D). Chart 4CJapan: Government Bond Index Excess Return & BoJ Policy Rate Surprises (1994 - Present)
The Global Golden Rule Of Bond Investing
The Global Golden Rule Of Bond Investing
Chart 4DJapan: Government Bond Index Total Return & BoJ Policy Rate Surprises (1994 - Present)
The Global Golden Rule Of Bond Investing
The Global Golden Rule Of Bond Investing
Table 3Japan: 12-Month Government Bond Index Returns And Rate Surprises (1994 - Present)
The Global Golden Rule Of Bond Investing
The Global Golden Rule Of Bond Investing
Looking ahead, given that the BoJ will in all likelihood maintain its ultra-accommodative monetary policy stance in the near future, we do not expect the GGR to become more effective when applied to the Japanese bond market. Bank Of Canada (BoC) Policy Rate Surprises The GGR works relatively well for the Canadian bond market (Chart 5A). Chart 5ABoC Policy Rate Surprise & Yields I
BoC Policy Rate Surprise & Yields I
BoC Policy Rate Surprise & Yields I
Chart 5BBoC Policy Rate Surprise & Yields II
BoC Policy Rate Surprise & Yields II
BoC Policy Rate Surprise & Yields II
We observe a tight correlation between 12-month BoC policy rate surprises and the 12-month change in the Bloomberg Barclays Canada Treasury index yield, especially post-2010 (Chart 5B). Dovish surprises coincide with positive excess returns 81% of the time and 94% of the time if we look at total returns (Chart 5C and Chart 5D). Chart 5CCanada: Government Bond Index Excess Return & BoC Policy Rate Surprises (1993 - Present)
The Global Golden Rule Of Bond Investing
The Global Golden Rule Of Bond Investing
Chart 5DCanada: Government Bond Index Total Return & BoC Policy Rate Surprises (1993 - Present)
The Global Golden Rule Of Bond Investing
The Global Golden Rule Of Bond Investing
Table 4Canada: 12-Month Government Bond Index Returns And Rate Surprises (1993 - Present)
The Global Golden Rule Of Bond Investing
The Global Golden Rule Of Bond Investing
Looking ahead, the BoC will most likely continue to follow the tightening path of the Federal Reserve, admittedly with a lag. However, accelerating inflation at a time when there is no spare capacity in the Canadian economy suggests that the BoC could deliver more rate hikes than are already priced for the next 12 months. As shown in Table 4, hawkish surprises from the BoC do coincide with negative monthly excess returns of -2.8%. Reserve Bank Of Australia (RBA) Policy Rate Surprises The GGR applies extremely well to the Australian bond market (Chart 6A). Chart 6ARBA Policy Rate Surprise & Yields I
RBA Policy Rate Surprise & Yields I
RBA Policy Rate Surprise & Yields I
Chart 6BRBA Policy Rate Surprise & Yields II
RBA Policy Rate Surprise & Yields II
RBA Policy Rate Surprise & Yields II
The 12-month RBA policy rate surprise and the 12-month change in the Bloomberg Barclays Australia Treasury index yield displays the tightest correlation out of all the countries covered (Chart 6B). Dovish surprises coincide with positive excess returns 83% of the time and 96% of the time if we look at total returns (Chart 6C and Chart 6D). Turning to hawkish surprises, they reliably coincide with negative excess returns. Chart 6CAustralia: Government Bond Index Excess Return & RBA Policy Rate Surprises (1994 - Present)
The Global Golden Rule Of Bond Investing
The Global Golden Rule Of Bond Investing
Chart 6DAustralia: Government Bond Index Total Return & RBA Policy Rate Surprises (1994 - Present)
The Global Golden Rule Of Bond Investing
The Global Golden Rule Of Bond Investing
Table 5Australia: 12-Month Government Bond Index Returns And Rate Surprises (1994 - Present)
The Global Golden Rule Of Bond Investing
The Global Golden Rule Of Bond Investing
As can be seen on the bottom panel of Chart 6A, the RBA Monitor has been rapidly falling since 2016 and now stands in the "easier monetary policy" required. However, the RBA will likely have to see a rise in unemployment or a decline in realized inflation before it considers cutting rates, which raises a risk of "hawkish" surprises if the market begins to price in rate cuts. Reserve Bank Of New Zealand (RBNZ) Policy Rate Surprises The GGR works fairly well for Nez Zealand (NZ) government bonds (Chart 7A). Chart 7ARBNZ Policy Rate Surprise & Yields I
RBNZ Policy Rate Surprise & Yields I
RBNZ Policy Rate Surprise & Yields I
Chart 7BRBNZ Policy Rate Surprise & Yields II
RBNZ Policy Rate Surprise & Yields II
RBNZ Policy Rate Surprise & Yields II
12-month RBNZ policy rate surprises and the 12-month change in the Bloomberg Barclays NZ Treasury yield exhibit a decent correlation (Chart 7B). Unusually, NZ is the only bond market covered in this report where both dovish and hawkish surprises coincide with positive excess returns on average, although positive episodes are much less frequent for hawkish surprises than for dovish surprises; respectively 55% and 86% (Chart 7C and Chart 7D). Chart 7CNZ: Government Bond Index Excess Return & RBNZ Policy Rate Surprises (2000 - Present)
The Global Golden Rule Of Bond Investing
The Global Golden Rule Of Bond Investing
Chart 7DNZ: Government Bond Index Total Return & RBNZ Policy Rate Surprises (2000 - Present)
The Global Golden Rule Of Bond Investing
The Global Golden Rule Of Bond Investing
Table 6New Zealand: 12-Month Government Bond Index Returns And Rate Surprises (2000 - Present)
The Global Golden Rule Of Bond Investing
The Global Golden Rule Of Bond Investing
Looking ahead, the RBNZ has already provided forward guidance indicating that the Overnight Cash Rate (OCR) will most likely stay flat until 2020 - an assessment that we agree with, so the odds are against any policy surprises over at least the next 6-12 months. Using The Global Golden Rule To Forecast Government Bond Returns The practical application of the GGR is that it can be used as a framework for generating expected changes in yields and calculating total return forecasts for global government bond indices. The strong correlation demonstrated in the previous section between the 12-month policy rate surprises and the 12-month change in the average yield from the government bond indexes allows us to translate our "assumed" policy rate surprise over the next 12 months into expected changes in yields along the curve. With these expected yield changes, we can simply generate expected total returns using the following formula: Expected Total Return = Yield - (Duration*Expected Change In Yield) + 0.5*Convexity*E(DY2) E(DY2) = 1-year trailing estimate of yield volatility It is important to note that we would not give too much importance to what this analysis yields for longer-dated bonds. As shown in the Appendices, once we move into longer government bond maturities, the correlation between the policy rate surprise and the change in yields declines or even becomes non-existent for some countries. This result should not be surprising, as longer-term yields are driven by other factors besides simply changes in interest rate expectations. Inflation expectations, government debt levels and demand from longer-term investors like pension funds all can have a more outsized influence on the path of longer-term bond yields relative to the shorter-end. That results in much more uncertainty when it comes to the total return forecasts for long-dated maturities calculated with this framework. Practically speaking, we are not encouraging our readers to blindly follow that yield and return expectations generated by the GGR, even for bond markets where it clearly seems to be working over time. Rather, the GGR can be integrated in a larger asset-allocation framework for a global fixed-income portfolio by providing one possible set of bond market outcomes. On a total return basis, the results presented below, interpreted alongside the readings on the BCA Central Bank monitors, suggest that investors should be underweight core Euro Area (Germany, France and Italy), Australia and New Zealand while remaining overweight the U.K. and Canada over the next twelve months. As for Japan, given the likelihood that BoJ will leave its policy rate flat, the results hint at a neutral allocation. Jeremie Peloso, Research Analyst jeremie@bcaresearch.com Robert Robis, CFA, Senior Vice President Global Fixed Income Strategy rrobis@bcaresearch.com 1 Please see U.S. Bond Strategy Special Report, "The Golden Rule Of Bond Investing", dated July 24, 2018, available at usbs.bcaresearch.com. 2 Please see Global Fixed Income Strategy Weekly Report, "BCA Central Bank Monitor Chartbook: Divergences Opening Up," dated September 19, 2018, available at gfis.bcaresearch.com. Global Golden Rule: Germany In light of the forward guidance ECB President Mario Draghi has been providing to the markets, it appears that the most likely scenario over the next 12 months is for the ECB to keep interest rates on hold. Based on the strong relationships between 12-month ECB policy rate surprises and 12-month changes in yields along the curve (Appendix A), a flat interest rate scenario would be bond bearish for German government bonds especially at the short end of the curve with the 1-year German yield expected to rise by 16bps (Table 7A). Table 7AGermany: Expected Changes In Bund Yields Over The Next 12 Months (BPs)
The Global Golden Rule Of Bond Investing
The Global Golden Rule Of Bond Investing
Using the expected change in yields thus inferred by the policy rate surprise, the German government bond aggregate index is forecasted to return 0.45% over the next 12 months (Table 7B). Table 7BGermany: Government Bond Index Total Return Forecasts Over The Next 12 Months
The Global Golden Rule Of Bond Investing
The Global Golden Rule Of Bond Investing
Global Golden Rule: U.K. Markets are currently discounting only 21bps of rate hikes in the U.K. over the next year. Thus, even a scenario where the BoE delivers only a single 25bp rate hike would be bearish for U.K. Gilts, especially at the short-end of the curve. Applying the GGR, 1- and 3-year Gilt yields would be expected to rise by 20bps and 10bps respectively (Table 8A). Table 8AU.K.: Expected Changes In Gilt Yields Over The Next 12 Months (BPs)
The Global Golden Rule Of Bond Investing
The Global Golden Rule Of Bond Investing
Interpolating these expected yield changes, the 1-3 year government bond index total return forecast would be 0.46%. On the other hand, if the BoE prefers to keep rates on hold given the uncertainty of the Brexit outcome, that same 1-3 year government bond index is forecasted to deliver 0.97% of total return over the next 12 months (Table 9B). This is our current base case scenario for Gilts. Table 8BU.K.: Government Bond Index Total Return Forecasts Over The Next 12 Months
The Global Golden Rule Of Bond Investing
The Global Golden Rule Of Bond Investing
Global Golden Rule: Japan Despite many rumors to the contrary earlier this year, the base case view remains that the BoJ will not change its stance on monetary policy anytime soon. As such, the expected changes in JGB yields under a flat interest rate scenario over the next 12 months are close to zero at the short end of the curve and rather bond bullish at the longer end of the curve; for instance, the 30-year JGB yield would be expected to rally by 9bps (Table 9A). Table 9AJapan: Expected Changes In JGB Yields Over The Next 12 Months (BPs)
The Global Golden Rule Of Bond Investing
The Global Golden Rule Of Bond Investing
In that most likely scenario, the Japanese government bond index is forecasted to deliver 0.83% of total return over the next 12 months. In the event that the BoJ surprises the markets by delivering one rate hike of 25bps, it would be bond bearish for JGBs and the total return forecasts for the government bond indices would be negative, regardless of the maturity (Table 9B). Table 9BJapan: Government Bond Index Total Return Forecasts Over The Next 12 Months
The Global Golden Rule Of Bond Investing
The Global Golden Rule Of Bond Investing
Global Golden Rule: Canada Will the Bank of Canada follow the footsteps of the Fed? The markets certainly seem to think so, with more than three 25bps rate hikes priced in for next 12 months in the OIS curve. Table 10ACanada: Expected Changes In Government Bond Yields Over The Next 12 Months (BPs)
The Global Golden Rule Of Bond Investing
The Global Golden Rule Of Bond Investing
That scenario would be outright bearish for Canadian government bonds, with 1- and 2-year yields rising by 16bps and 21bps, respectively (Table 10A). In terms of total returns, the GGR framework forecasts that with 75bps of rate hikes, the Canadian government bond aggregate index would deliver a positive return of 2.35% (Table 10B). This is because 75bps of hikes are currently discounted in the Canadian OIS curve, thus it would neither be a hawkish nor dovish surprise. Table 10BCanada: Government Bond Index Total Return Forecasts Over The Next 12 Months
The Global Golden Rule Of Bond Investing
The Global Golden Rule Of Bond Investing
Global Golden Rule: Australia The RBA Monitor just dipped below the zero line, implying that easier monetary policy is required based on financial and economic data. Table 11A shows that a rate cut delivered by the RBA in the next 12 months would be bond bullish for Aussie yields, especially at the long end of the curve, where the 30-year Aussie bond yield would fall by 34bps. Table 11AAustralia: Expected Changes In Aussie Yields Over The Next 12 Months (BPs)
The Global Golden Rule Of Bond Investing
The Global Golden Rule Of Bond Investing
Of all the interest rate scenarios presented in Table 11B, the two rate cut scenarios would return the highest total returns. For instance, the Australian government bond aggregate index would return 2.80% and 3.90% in the event of one and two 25bps rate hikes, respectively. Table 11BAustralia: Government Bond Index Total Return Forecasts Over The Next 12 Months
The Global Golden Rule Of Bond Investing
The Global Golden Rule Of Bond Investing
Global Golden Rule: New Zealand Our view is that the Reserve Bank of New Zealand will stay on hold for a while longer, which is broadly the same message conveyed by the RBNZ Monitor being positive, but very close to 0. With that in mind, a flat interest rate scenario appears to be bond bearish for the NZ bond yields, except for the longer end of the curve (Table 12A). Table 12ANew Zealand: Expected Changes In NZ Yields Over The Next 12 Months (BPs)
The Global Golden Rule Of Bond Investing
The Global Golden Rule Of Bond Investing
Table 12BNew Zealand: Government Bond Index Total
The Global Golden Rule Of Bond Investing
The Global Golden Rule Of Bond Investing
For New Zealand, the government bond aggregate bond index is the only index provided by Bloomberg Barclays, as opposed to the other countries in our analysis where different maturities are given. In the flat interest rate scenario, the total return forecast for the overall index would be of 2.53% over the next 12 months. Appendix A: Germany Chart 1Change In 1-Year German Bund Yield##BR##Vs. 12-Month ECB Policy Rate Surprise
The Global Golden Rule Of Bond Investing
The Global Golden Rule Of Bond Investing
Chart 2Change In 2-Year German Bund Yield##BR##Vs. 12-Month ECB Policy Rate Surprise
The Global Golden Rule Of Bond Investing
The Global Golden Rule Of Bond Investing
Chart 3Change In 3-Year German Bund Yield##BR##Vs. 12-Month ECB Policy Rate Surprise
The Global Golden Rule Of Bond Investing
The Global Golden Rule Of Bond Investing
Chart 4Change In 5-Year German Bund Yield##BR##Vs. 12-Month ECB Policy Rate Surprise
The Global Golden Rule Of Bond Investing
The Global Golden Rule Of Bond Investing
Chart 5Change In 7-Year German Bund Yield##BR##Vs. 12-Month ECB Policy Rate Surprise
The Global Golden Rule Of Bond Investing
The Global Golden Rule Of Bond Investing
Chart 6Change In 10-Year German Bund Yield##BR##Vs. 12-Month ECB Policy Rate Surprise
The Global Golden Rule Of Bond Investing
The Global Golden Rule Of Bond Investing
Chart 7Change In 30-Year German Bund Yield##BR##Vs. 12-Month ECB Policy Rate Surprise
The Global Golden Rule Of Bond Investing
The Global Golden Rule Of Bond Investing
Appendix B: France Chart 8Change In 1-Year French OAT Yield##BR##Vs. 12-Month ECB Policy Rate Surprise
The Global Golden Rule Of Bond Investing
The Global Golden Rule Of Bond Investing
Chart 9Change In 2-Year French OAT Yield##BR##Vs. 12-Month ECB Policy Rate Surprise
The Global Golden Rule Of Bond Investing
The Global Golden Rule Of Bond Investing
Chart 10Change In 3-Year French OAT Yield##BR##Vs. 12-Month ECB Policy Rate Surprise
The Global Golden Rule Of Bond Investing
The Global Golden Rule Of Bond Investing
Chart 11Change In 5-Year French OAT Yield##BR##Vs. 12-Month ECB Policy Rate Surprise
The Global Golden Rule Of Bond Investing
The Global Golden Rule Of Bond Investing
Chart 12Change In 7-Year French OAT Yield##BR##Vs. 12-Month ECB Policy Rate Surprise
The Global Golden Rule Of Bond Investing
The Global Golden Rule Of Bond Investing
Chart 13Change In 10-Year French OAT Yield##BR##Vs. 12-Month ECB Policy Rate Surprise
The Global Golden Rule Of Bond Investing
The Global Golden Rule Of Bond Investing
Chart 14Change In 30-Year French OAT Yield##BR##Vs. 12-Month ECB Policy Rate Surprise
The Global Golden Rule Of Bond Investing
The Global Golden Rule Of Bond Investing
Appendix C: Italy Chart 15Change In 1-Year Italian Gov't Bond Yield##BR##Vs. 12-Month ECB Policy Rate Surprise
The Global Golden Rule Of Bond Investing
The Global Golden Rule Of Bond Investing
Chart 16Change In 2-Year Italian Gov't Bond Yield##BR##Vs. 12-Month ECB Policy Rate Surprise
The Global Golden Rule Of Bond Investing
The Global Golden Rule Of Bond Investing
Chart 17Change In 3-Year Italian Gov't Bond Yield##BR##Vs. 12-Month ECB Policy Rate Surprise
The Global Golden Rule Of Bond Investing
The Global Golden Rule Of Bond Investing
Chart 18Change In 5-Year Italian Gov't Bond Yield##BR##Vs. 12-Month ECB Policy Rate Surprise
The Global Golden Rule Of Bond Investing
The Global Golden Rule Of Bond Investing
Chart 19Change In 7-Year Italian Gov't Bond Yield##BR##Vs. 12-Month ECB Policy Rate Surprise
The Global Golden Rule Of Bond Investing
The Global Golden Rule Of Bond Investing
Chart 20Change In 10-Year Italian Gov't Bond Yield##BR##Vs. 12-Month ECB Policy Rate Surprise
The Global Golden Rule Of Bond Investing
The Global Golden Rule Of Bond Investing
Chart 21Change In 30-Year Italian Gov't Bond Yield##BR##Vs. 12-Month ECB Policy Rate Surprise
The Global Golden Rule Of Bond Investing
The Global Golden Rule Of Bond Investing
Appendix D: U.K. Chart 22Change In 1-Year Gilts Yield##BR##Vs. 12-Month BoE Policy Rate Surprise
The Global Golden Rule Of Bond Investing
The Global Golden Rule Of Bond Investing
Chart 23Change In 2-Year Gilts Yield##BR##Vs. 12-Month BoE Policy Rate Surprise
The Global Golden Rule Of Bond Investing
The Global Golden Rule Of Bond Investing
Chart 24Change In 3-Year Gilts Yield##BR##Vs. 12-Month BoE Policy Rate Surprise
The Global Golden Rule Of Bond Investing
The Global Golden Rule Of Bond Investing
Chart 25Change In 5-Year Gilts Yield##BR##Vs. 12-Month BoE Policy Rate Surprise
The Global Golden Rule Of Bond Investing
The Global Golden Rule Of Bond Investing
Chart 26Change In 7-Year Gilts Yield##BR##Vs. 12-Month BoE Policy Rate Surprise
The Global Golden Rule Of Bond Investing
The Global Golden Rule Of Bond Investing
Chart 27Change In 10-Year Gilts Yield##BR##Vs. 12-Month BoE Policy Rate Surprise
The Global Golden Rule Of Bond Investing
The Global Golden Rule Of Bond Investing
Chart 28Change In 30-Year Gilts Yield##BR##Vs. 12-Month BoE Policy Rate Surprise
The Global Golden Rule Of Bond Investing
The Global Golden Rule Of Bond Investing
Appendix E: Japan Chart 29Change In 1-Year Japanese JGB Yield##BR##Vs. 12-Month BoJ Policy Rate Surprise
The Global Golden Rule Of Bond Investing
The Global Golden Rule Of Bond Investing
Chart 30Change In 2-Year Japanese JGB Yield##BR##Vs. 12-Month BoJ Policy Rate Surprise
The Global Golden Rule Of Bond Investing
The Global Golden Rule Of Bond Investing
Chart 31Change In 3-Year Japanese JGB Yield##BR##Vs. 12-Month BoJ Policy Rate Surprise
The Global Golden Rule Of Bond Investing
The Global Golden Rule Of Bond Investing
Chart 32Change In 5-Year Japanese JGB Yield##BR##Vs. 12-Month BoJ Policy Rate Surprise
The Global Golden Rule Of Bond Investing
The Global Golden Rule Of Bond Investing
Chart 33Change In 7-Year Japanese JGB Yield##BR##Vs. 12-Month BoJ Policy Rate Surprise
The Global Golden Rule Of Bond Investing
The Global Golden Rule Of Bond Investing
Chart 34Change In 10-Year Japanese JGB Yield##BR##Vs. 12-Month BoJ Policy Rate Surprise
The Global Golden Rule Of Bond Investing
The Global Golden Rule Of Bond Investing
Chart 35Change In 30-Year Japanese JGB Yield##BR##Vs. 12-Month BoJ Policy Rate Surprise
The Global Golden Rule Of Bond Investing
The Global Golden Rule Of Bond Investing
Appendix F: Canada Chart 36Change In 1-Year Canadian Yield##BR##Vs. 12-Month BoC Policy Rate Surprise
The Global Golden Rule Of Bond Investing
The Global Golden Rule Of Bond Investing
Chart 37Change In 2-Year Canadian Yield##BR##Vs. 12-Month BoC Policy Rate Surprise
The Global Golden Rule Of Bond Investing
The Global Golden Rule Of Bond Investing
Chart 38Change In 3-Year Canadian Yield##BR##Vs. 12-Month BoC Policy Rate Surprise
The Global Golden Rule Of Bond Investing
The Global Golden Rule Of Bond Investing
Chart 39Change In 5-Year Canadian Yield##BR##Vs. 12-Month BoC Policy Rate Surprise
The Global Golden Rule Of Bond Investing
The Global Golden Rule Of Bond Investing
Chart 40Change In 7-Year Canadian Yield##BR##Vs. 12-Month BoC Policy Rate Surprise
The Global Golden Rule Of Bond Investing
The Global Golden Rule Of Bond Investing
Chart 41Change In 10-Year Canadian Yield##BR##Vs. 12-Month BoC Policy Rate Surprise
The Global Golden Rule Of Bond Investing
The Global Golden Rule Of Bond Investing
Chart 42Change In 30-Year Canadian Yield##BR##Vs. 12-Month BoC Policy Rate Surprise
The Global Golden Rule Of Bond Investing
The Global Golden Rule Of Bond Investing
Appendix G: Australia Chart 43Change In 1-Year Aussie Yield##BR##Vs. 12-Month RBA Policy Rate Surprise
The Global Golden Rule Of Bond Investing
The Global Golden Rule Of Bond Investing
Chart 44Change In 2-Year Aussie Yield##BR##Vs. 12-Month RBA Policy Rate Surprise
The Global Golden Rule Of Bond Investing
The Global Golden Rule Of Bond Investing
Chart 45Change In 3-Year Aussie Yield##BR##Vs. 12-Month RBA Policy Rate Surprise
The Global Golden Rule Of Bond Investing
The Global Golden Rule Of Bond Investing
Chart 46Change In 5-Year Aussie Yield##BR##Vs. 12-Month RBA Policy Rate Surprise
The Global Golden Rule Of Bond Investing
The Global Golden Rule Of Bond Investing
Chart 47Change In 7-Year Aussie Yield##BR##Vs. 12-Month RBA Policy Rate Surprise
The Global Golden Rule Of Bond Investing
The Global Golden Rule Of Bond Investing
Chart 48Change In 10-Year Aussie Yield##BR##Vs. 12-Month RBA Policy Rate Surprise
The Global Golden Rule Of Bond Investing
The Global Golden Rule Of Bond Investing
Appendix H: New Zealand Chart 49Change In 1-Year NZ Yield##BR##Vs. 12-Month RBNZ Policy Rate Surprise
The Global Golden Rule Of Bond Investing
The Global Golden Rule Of Bond Investing
Chart 50Change In 2-Year NZ Yield##BR##Vs. 12-Month RBNZ Policy Rate Surprise
The Global Golden Rule Of Bond Investing
The Global Golden Rule Of Bond Investing
Chart 51Change In 3-Year NZ Yield##BR##Vs. 12-Month RBNZ Policy Rate Surprise
The Global Golden Rule Of Bond Investing
The Global Golden Rule Of Bond Investing
Chart 52Change In 5-Year NZ Yield##BR##Vs. 12-Month RBNZ Policy Rate Surprise
The Global Golden Rule Of Bond Investing
The Global Golden Rule Of Bond Investing
Chart 53Change In 7-Year NZ Yield##BR##Vs. 12-Month RBNZ Policy Rate Surprise
The Global Golden Rule Of Bond Investing
The Global Golden Rule Of Bond Investing
Chart 54Change In 10-Year NZ Yield##BR##Vs. 12-Month RBNZ Policy Rate Surprise
The Global Golden Rule Of Bond Investing
The Global Golden Rule Of Bond Investing
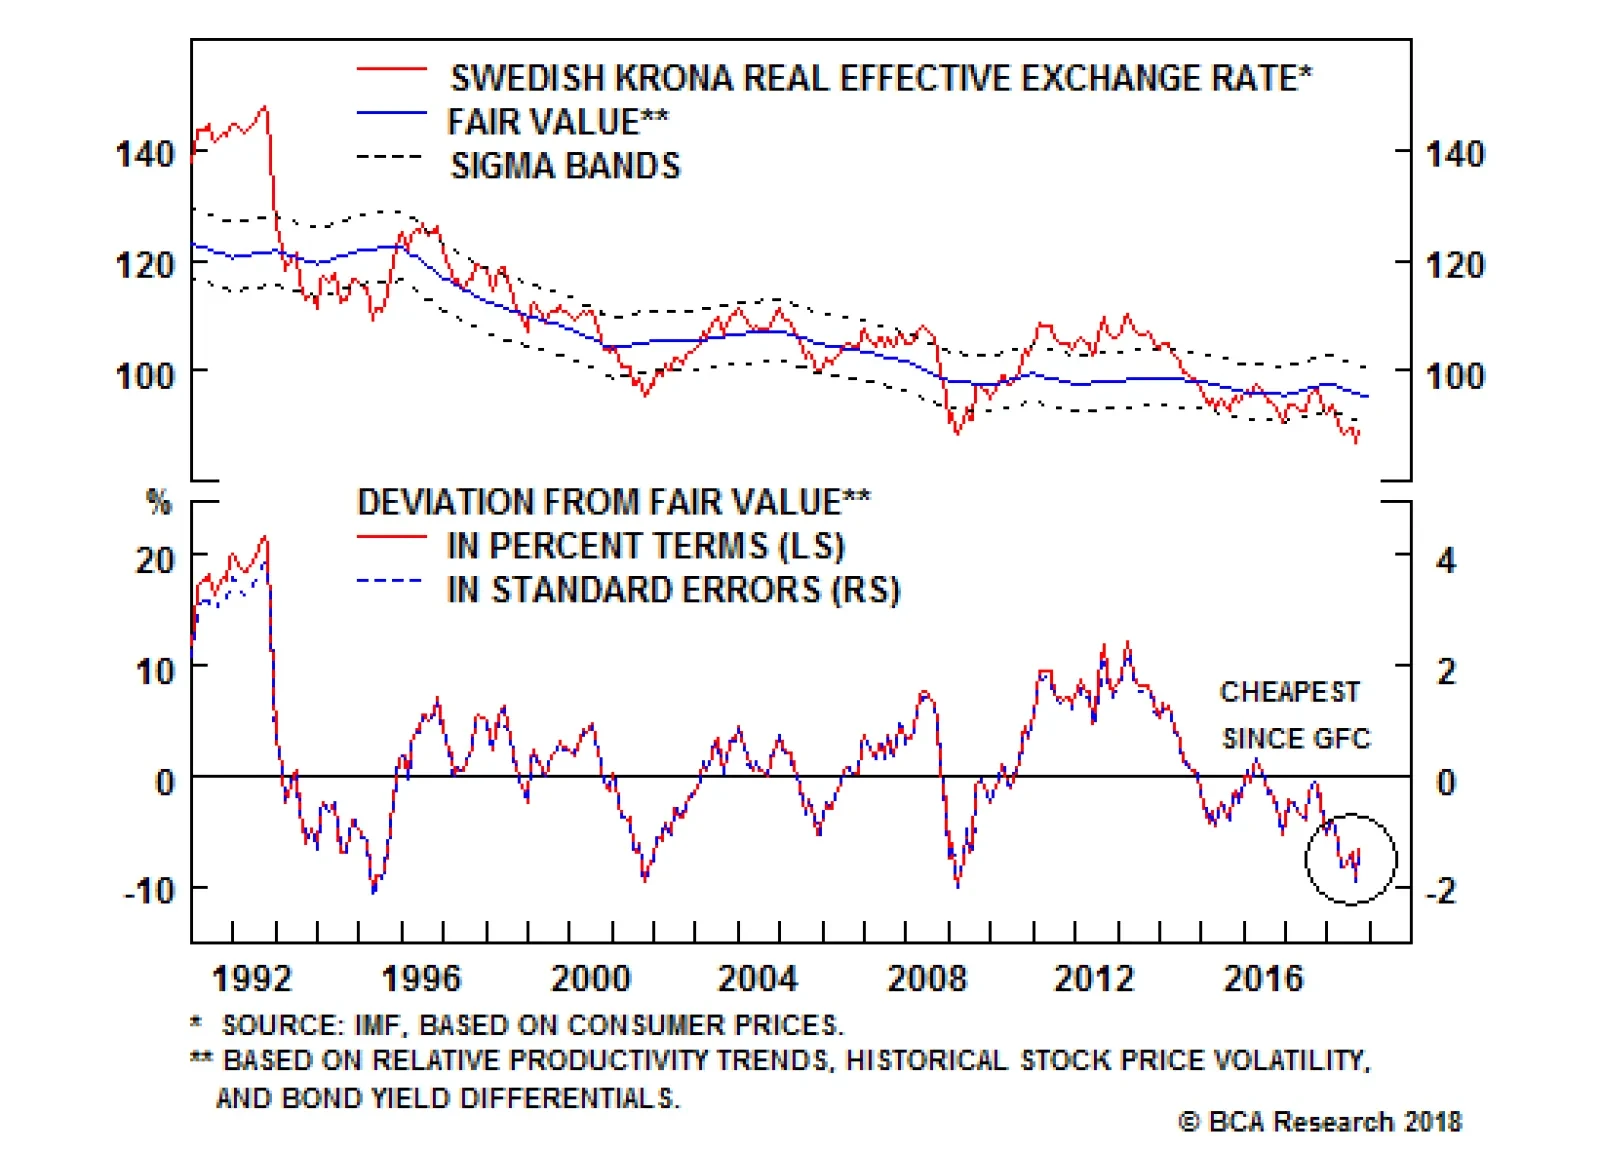
Our Foreign Exchange Strategy group believes the SEK is clearly cheap. The trade-weighted krona is trading at its cheapest levels relative to BCA’s long-term fair value since the Great Financial Crisis (see chart). The SEK is not only trading at a 32%…
Highlights The U.S. dollar is likely to correct further over the coming weeks. The CAD should benefit as it is cheap and oversold, and the inflationary back-drop warrants tighter monetary conditions. This will be a bear market rally, not the ultimate trough for the loonie. EUR/SEK should correct as the Riksbank will start tightening policy in December; a pause in the global growth slowdown should also give the cheap SEK a welcome boost. Cheap long-term valuations will not help the yen in the coming weeks; instead, falling Japanese inflation expectations and growing investor expectations of Chinese stimulus will weigh on the JPY. A better opportunity to buy the yen on its crosses will emerge later this year. EUR/CHF has upside over the coming months; the swissie needs additional global growth weakness to rally further. This is unlikely to happen for a few months. Feature Chart I-1DXY Correction Has Further To Run
DXY Correction Has Further To Run
DXY Correction Has Further To Run
By the middle of the summer, the dollar had hit massively overbought levels, which left it vulnerable to any signs of stabilization in global growth, especially if some key U.S. activity gauges began to soften (Chart I-1). This is exactly what is transpiring. As we highlighted last week, BCA's Global LEI Diffusion Index is rebounding, EM and Japanese exports are stabilizing and U.S. core inflation and building permits have disappointed. This bifurcation in the data suggests the dollar has more room to correct, as neither our Capitulation Index nor our Intermediate-Term Technical Indicator have hit technically oversold levels. Last week we also argued that this correction in the dollar is likely to prove a temporary reprieve, but that in the interim the euro and the Australian dollar were well placed to experience significant rebounds.1 This week, we explore if the same case can be built for the Canadian dollar, the Swedish krona, the yen and the Swiss Franc. CAD: The Bank of Canada Will Proceed Cautiously The first half of 2018 has not been kind to the Canadian dollar. A rout in EM assets, signs of softening global growth and tough rhetoric from the White House on trade generally and NAFTA and Canada in particular have conspired to create fertile grounds for loonie-selling. Since the end of June, the CAD has managed to regain some composure, rallying by 3.3% against the USD. Essentially, much bad news has been embedded in this currency, which now trades at a significant discount to BCA's estimate of its short-term fair value (Chart I-2). Moreover, speculators, who had been aggressively buying the CAD at the end of 2017, now hold large short positions in the currency (Chart I-2, bottom panel). This combination is now resulting in a situation where any pause in the USD's strength is being mirrored in CAD strength. Can this rebound continue? Canadian economic data sends a murky message. Canadian real GDP growth had overtaken that of the U.S., peaking at 3.6% in February last year. However, it is now below U.S. growth (Chart I-3). Canadian consumers have been the main source of the slowdown as Canadian capex growth is in line with the U.S. and the Trudeau government has been spending generously. Can this rebound continue? Canadian economic data sends a murky message. Canadian real GDP growth had overtaken that of the U.S., peaking at 3.6% in February last year. However, it is now below U.S. growth (Chart I-3). Canadian consumers have been the main source of the slowdown as Canadian capex growth is in line with the U.S. and the Trudeau government has been spending generously. Chart I-2No One Is Going Crazy For The Loonie
No One Is Going Crazy For The Loonie
No One Is Going Crazy For The Loonie
Chart I-3Canada: Growth Picture Is Mixed
Canada: Growth Picture Is Mixed
Canada: Growth Picture Is Mixed
The weakness in Canadian consumption partly reflects the underperformance of Canadian employment relative to the U.S. However, the slowdown in house prices has played a bigger role (Chart I-4). Canadian households are burdened by a debt load of 170% of disposable income. Now that mortgage rates are rising, Canadians are spending more than 14% of their disposable income servicing their debt, a burden last experienced in 2008 when mortgage rates were 220 basis points higher. Without the benefit of rapidly rising real estate assets, it is much more difficult for Canadian retail sales to grow at an 8.7% annual rate as they did three quarters ago. Despite these weaknesses, it is hard to justify that Canadian monetary conditions - as approximated by the slope of the yield curve, the level of real rates, and the trade-weighted CAD - should be as easy as they are today (Chart I-5). This is even truer when we take into account Canadian inflationary conditions. Chart I-4Canadian Consumers Have A Problem
Canadian Consumers Have A Problem
Canadian Consumers Have A Problem
Chart I-5Canadian Monetary Conditons Are Very Easy
Canadian Monetary Conditons Are Very Easy
Canadian Monetary Conditons Are Very Easy
The three inflation gauges targeted by the Bank of Canada stand between 1% and 3%, or at its objective. This means that the BoC's 1.5% policy rate is negative in real terms. Moreover, this inflationary pressure is unlikely to abate. The BoC estimates that the output gap has closed, and companies are running into growing capacity constraints (Chart I-6, top panel). Despite a correction last month, wages are in an uptrend, powered by growing and severe labor shortages (Chart I-6, bottom panel). Thanks to these conditions, we anticipate that the BoC will track the pace of rate increases by the Federal Reserve over the next 12 months. This is not very different from what is currently priced into Canadian money markets. Chart I-6Canadian Capacity Pressures Point To A Hawkish ##br##BoC Inflation Will Force The BoC's Hand
Canadian Capacity Pressures Point To A Hawkish BoC Inflation Will Force The BoC's Hand
Canadian Capacity Pressures Point To A Hawkish BoC Inflation Will Force The BoC's Hand
If the BoC does not disappoint, the combination of a cheap and oversold CAD should help the loonie rally against the USD, so long as the current stabilization in global growth continues. A move toward USD/CAD 1.26 is likely. The biggest risk to this view is that trade negotiations between the U.S. and Canada deteriorate further. While we do not anticipate an imminent breakthrough in these negotiations, we do not see much scope for significant deterioration in the relationship either. The energy market could prove to be another positive for the loonie. Bob Ryan, who leads BCA's Commodity and Energy Strategy service, argues that the oil market is currently very tight and vulnerable to supply disruptions.2 Under these circumstances, the removal of Iranian exports, tensions in Iraq, declining Nigerian production and Venezuela's cascading implosion all risk causing a melt-up in oil prices by the first half of 2019. This could help the CAD as well, even if the Canadian oil benchmark remains at a large discount to Brent. Longer-term, the upside in the CAD is likely to be capped. There is only one rate hike priced into the U.S. OIS curve from June 2019 to December 2020. We expect the Fed to hike rates by more than that. Meanwhile, the emerging softness in the Canadian household sector suggests it will be much more difficult for the BoC to keep following the Fed higher over that period. The CAD is not cheap enough to compensate for these long-term headwinds (Chart I-7). Bottom Line: On a short-term basis, the Canadian dollar is cheap and oversold. While the Canadian consumer has begun to disappoint, the inflationary pressures present in Canada should keep the BoC on track to follow the Fed and push rates higher over the coming 12 months. The CAD should therefore benefit from any USD weakness, with USD/CAD moving toward 1.26. Once the short-term undervaluation and oversold conditions are corrected, USD/CAD should rebound toward 1.40. Chart I-7We Like The CAD For Now, But The Rally Has A Limited Shelf Life
We Like The CAD For Now, But The Rally Has A Limited Shelf Life
We Like The CAD For Now, But The Rally Has A Limited Shelf Life
EUR/SEK Will Trade Heavy Any which way we cut it, the SEK is cheap. The trade-weighted krona is trading at its cheapest levels relative to BCA's long-term fair value since the Great Financial Crisis (Chart I-8). The SEK is not only trading at a 32% discount to its purchasing-power parity against the greenback, it is also trading at a 10% discount against its PPP relative to the euro. Chart I-8The SEK Is An Attractive Long-Term Buy...
The SEK Is An Attractive Long-Term Buy...
The SEK Is An Attractive Long-Term Buy...
The SEK is not only cheap on a long-term basis, it is also cheap on a short-term basis. This is most evident against the euro. Currently the SEK trades at a 7% discount to the euro according to our short term fair value model based on real rate differentials, commodity prices and global risk aversion. Historically, this kind of discount in the SEK has been followed by a prompt rebound (Chart I-9). Are there any catalysts to convert this good value into good returns? We see many. First, as was the case in Canada, Sweden's Monetary Gauge has not been at such easy levels since the Great Financial Crisis (Chart I-10). Meanwhile, the economy is also experiencing rising capacity pressures. The OECD's estimate of the output gap stands at 0.7% of GDP, and inflationary pressures are building, as evidenced by the Riksbank's Capacity Utilization measure (Chart I-11). Chart I-9...And A Short-Term One As Well
...And A Short-Term One As Well
...And A Short-Term One As Well
Chart I-10The Riksbank Is Too Easy
The Riksbank Is Too Easy
The Riksbank Is Too Easy
Chart I-11Swedish Inflation Has Upside
Swedish Inflation Has Upside
Swedish Inflation Has Upside
This set of circumstances suggests the Riksbank could start hiking rates as early as this coming December, well ahead of the European Central Bank. As a result, we project that Swedish real interest rates could rise further relative to the euro area. Historically, falling euro area / Swedish real interest rate spreads precede depreciations in EUR/SEK (Chart I-12). Chart I-12Real Rate Differentials Point To A Lower EUR/SEK
EUR/SEK AND REAL INTEREST RATE SPREAD*: EMU-SWEDEN FX.EURSEKTHEME Real Rate Differentials Point To A Lower EUR/SEK
EUR/SEK AND REAL INTEREST RATE SPREAD*: EMU-SWEDEN FX.EURSEKTHEME Real Rate Differentials Point To A Lower EUR/SEK
Chart I-13Chinese Liquidity Injections Point To A Lower EUR/SEK
Chinese Liquidity Injections Point To A Lower EUR/SEK
Chinese Liquidity Injections Point To A Lower EUR/SEK
The global context also points toward an imminent correction in EUR/SEK. The krona is much more pro-cyclical than the euro. This reflects the more volatile nature of the Swedish economy and the extraordinarily large role of trade in its GDP. EUR/SEK greatly benefited from the tightening in Chinese liquidity conditions, as evidenced by the widening between the 1-month and 1-week Chinese interbank rate (Chart I-13). EUR/SEK essentially sniffed out a slowdown in Chinese capex, a key source of ultimate demand for Swedish goods. However, now that the PBoC is injecting liquidity in the Chinese interbank system, EUR/SEK is likely to suffer. Moreover, the outperformance of Chinese infrastructure and real estate stocks in recent weeks also suggests the SEK could appreciate further against the EUR. The rally of risk assets on the day that U.S. President Donald Trump announced an additional 10% tariff on US$200 billion worth of Chinese exports further confirms that investors may be in the process of discounting additional stimulus out of China, which would further hurt EUR/SEK. To be clear, we have already noted that we do not anticipate the Chinese authorities to attempt to boost growth - we only expect them to limit the damage created by an intensifying trade war with the U.S. As a result, the positive impact of China on the krona should prove transitory. But for the time being, it could be enough to help correct the SEK's 7% discount to the euro. Since we anticipate the USD to continue to correct in the coming weeks, this also implies that USD/SEK possesses ample tactical downside. This negative EUR/SEK view is not without risks. The first comes from the fact that the Swedish current account surplus is now smaller than the euro area's, something not seen since the early 1990s. This is mitigated by the fact that Sweden's net international investment position is now 10% of GDP, while it used to be negative as recently as 2015. The euro area NIIP is still in negative territory. The second risk is that Swedish house prices have begun to contract in response to macroprudential measures. However, we believe that Sweden's inflationary backdrop is likely to dominate the Riksbank's reaction function. Bottom Line: The SEK is cheap against the dollar and the euro on both long-term and short-term metrics. As the Riksbank is set to lift rates in December, we expect EUR/SEK to decline significantly. Recent injections of liquidity by the PBoC and growing expectations among investors of Chinese stimulus could create additional downward impetus under both EUR/SEK and USD/SEK. This is a tactical view. We anticipate the reprieve in the global growth slowdown to be temporary. Once it resumes, the SEK will find it difficult to rally further. JPY: Down Now, Up Later Investors are well aware that the yen is one of the cheapest G10 currencies on a long-term basis. BCA's long-term fair value model shows that the real trade-weighted yen is trading at a 17% discount, close to its cheapest levels in 36 years. However, despite its prodigious long-term cheapness, the yen is not nearly as attractive when compared to its short-term determinants, which show a small premium in the price of the yen versus the dollar (Chart I-14). This means the direction of Japanese monetary policy and global growth will remain more important for the yen's price action over the coming months than its long-term cheapness. When it comes to growth, Japan is doing okay. We witnessed a decline in industrial production driven by foreign demand this summer, but domestic machinery orders are improving and export growth is finding a floor. Actually, BCA's real GDP model for Japan is suggesting that growth could re-accelerate significantly next quarter (Chart I-15). In our view, this improvement reflects the fact that business credit is once again growing after decades of hibernation. Chart I-14Is The JPY A Bargain? Long Term, Yes; Short Term, No!
Is The JPY A Bargain? Long Term, Yes; Short Term, No!
Is The JPY A Bargain? Long Term, Yes; Short Term, No!
Chart I-15Japanese Growth Doing Just Fine
Japanese Growth Doing Just Fine
Japanese Growth Doing Just Fine
However, we doubt this is enough to prompt any tightening in the Bank of Japan's policy. The most immediate problem facing the BoJ is that Japanese inflation expectations are in free fall (Chart I-16). Since the BoJ assigns the blame of low realized inflation on depressed inflation expectations, this aforementioned weakness, despite the yen's softness, guarantees that the BoJ will stay on the sidelines for much longer. After all, if any little shock can spur such a sharp impact on Japanese inflation expectations, despite an unemployment rate at 2.5% and an output gap at 0.8% of GDP, the BoJ has not anchored inflation expectations higher. Further reinforcing our bias that the BoJ is not set to tighten policy for many more quarters, the VAT is set to be increased to 10% in October 2019. The LDP leadership race is currently underway, and no one is mentioning postponing that hike. This suggests that significant fiscal tightening could emerge next year. The fact that the BoJ will continue to lag behind other global central banks forces us to be negative on the yen. However, could an external event push the yen higher, despite this absence of domestic support? A big downgrade in EM asset prices and global growth would do the trick. While we do think this is likely to happen over the next six to nine months, now does not appear to be the moment to implement such a bet. As we highlighted above, the deceleration in global growth seems to be pausing, and Chinese liquidity conditions have eased. Seven weeks ago, we introduced our China Play Index to track whether or not investors were discounting additional easing on the part of China.3 This indicator looks as if it is forming a base right now (Chart I-17), indicating that pro-growth plays could perform well over the coming weeks while countercyclical plays, like the yen, could perform poorly. Until this indicator begins a new down leg - something we anticipate for the backend of the year - the yen will remain under downward pressure against the dollar, the euro or the aussie. Chart I-16The BoJ's Problem
The BoJ's Problem
The BoJ's Problem
Chart I-17Chinese Plays Are Stabilizing
Chinese Plays Are Stabilizing
Chinese Plays Are Stabilizing
As a result, while we continue to expect more upside in the yen in the latter part of the year, for the time being we will remain on the sidelines as neither short-term valuations, monetary policy dynamics or the global growth environment point to an imminent rally in the yen. Bottom Line: The yen is an attractive long-term play as it displays prodigiously cheap long-term valuations. However, the short-term outlook is less favorable. The yen is not cheap enough based on our augmented interest rate differentials models, the BoJ will remain dovish for the foreseeable future, and an uptick in our China Play Index bodes poorly for countercyclical currencies like the yen. However, since we do expect that global growth will stabilize only on a temporary basis, we will look to open some long yen bets later this fall. Close Short EUR/CHF Trade Last March, we argued that EUR/CHF had more cyclical upside, but that bouts of volatility in global markets would cause periods of weaknesses in the cross.4 Based on this insight, we proceeded to sell EUR/CHF on April 6 as we worried that markets were set to price in a period of weakness in global growth.5 We closed this trade in August, but EUR/CHF kept falling. Now, is EUR/CHF more likely to rally or selloff in the coming quarter? We think a rebound is in the cards. First, the franc is once again highly valued, based on the Swiss National Bank's assessment. It is true that the SNB has not intervened to limit the franc's upside recently, but the CHF's strength is likely to short-circuit the increase in inflation that could have justified betting on the Swissie moving higher (Chart I-18). Ultimately, there is limited domestic inflationary pressures in Switzerland. Moreover, since the import penetration of goods and services in Switzerland is the highest of all the G10, imported deflation will soon be felt. Further, as Swiss labor costs remain very high internationally, the large improvement in full-time jobs witnessed this year is likely to peter off as Swiss businesses work to maintain their competitiveness. Second, the franc received an additional fillip this year as the breakup risk premium in Europe surged (Chart I-19). Every time investors perceive that the probability of a disintegration of the euro rises, they end up pouring money into stable Switzerland. Marko Papic, BCA's Geopolitical Strategy expert, believes that the euro break-up risk will continue to be a red herring in the coming few years. Investors will therefore price out this risk, pulling money out of Switzerland where interest rates remain 30 basis points below the euro area, and boosting EUR/CHF in the process. Chart I-18The Swissie's Strength Will Be Deflationary
The Swissie's Strength Will Be Deflationary
The Swissie's Strength Will Be Deflationary
Chart I-19If A Euro Break-Up Is A Red Herring...
If A Euro Break-Up Is A Red Herring...
If A Euro Break-Up Is A Red Herring...
Finally, if a temporary stabilization in global growth will hurt the yen, it will also hurt the Swiss franc. As a result, the stabilization in the China Play Index should support EUR/CHF. While we expect EUR/CHF to rally over the coming months, we worry that any such rebound will prove temporary. The current expansion in Chinese stimulus is only a passing phenomenon, and not one powerful enough to put a durable bottom under global growth and EM assets. Hence, while EUR/CHF could easily rally to 1.15, any such rebound should be faded. This move, if followed by a deterioration in our China Play Index, should be used to re-open EUR/CHF shorts. Bottom Line: The Swiss franc remains in a cyclical bear market, punctuated by occasional rallies against the euro when global growth sentiment sours. We just experienced such a rally in the Swissie, but it is ending as the deflationary impact of the CHF's rally will soon be felt. Moreover, the breakup risk premium in the euro is currently too large, and the pricing-in of slowing global growth is likely to take a breather. As a result, EUR/CHF is likely rally over the coming months. We will look to bet again on a CHF rally once the reprieve in global growth ends. Mathieu Savary, Vice President Foreign Exchange Strategy mathieu@bcaresearch.com 1 Please see Foreign Exchange Strategy Weekly Report, titled "Policy Divergence Are Still The Name Of The Game", dated September 14, 2018, available at fes.bcaresearch.com 2 Please see Commodity & Energy Strategy Weekly Report, titled "Odds Of Oil-Price Spike In 1H19 Rise; 2019 Brent Forecast Lifted $15 To $95/bbl", dated September 20, 2018, available at ces.bcaresearch.com 3 Please see Foreign Exchange Strategy Weekly Report, titled "The Dollar And Risk Assets Are Beholden To China's Stimulus", dated August 3, 2018, available at fes.bcaresearch.com Currencies U.S. Dollar Chart II-1USD Technicals 1
USD Technicals 1
USD Technicals 1
Chart II-2USD Technicals 2
USD Technicals 2
USD Technicals 2
Recent data in the U.S. has been mixed: Retail sales and retail sales ex autos yearly growth underperformed expectations, coming in at 0.1% and 0.3% respectively. Capacity utilization and building permits also surprised to the downside, coming in at 78.1% and 1.229 million respectively. However, Housing starts and the Michigan Consumer Sentiment Index surprised positively, coming in at 9.2% and 100.8 respectively. DXY has fallen by nearly 1% this week. Overall, we continue to be bullish on the dollar on a cyclical basis, as inflationary pressures inside the U.S. will force the Fed to hike more than the market expects. That being said, the slowdown in the dollar's momentum, the growing Chinese stimulus, and accumulating signs of stabilizing global economic activity are likely to further weigh on the dollar on a more immediate basis. We will monitor these factors closely in order to gauge whether or not this pullback will remain a garden-variety correction or something more serious. Report Links: Policy Divergences Are Still The Name Of The Game - August 14, 2018 The Dollar And Risk Assets Are Beholden To China's Stimulus - August 3, 2018 Rhetoric Is Not Always Policy - July 27, 2018 The Euro Chart II-3EUR Technicals 1
EUR Technicals 1
EUR Technicals 1
Chart II-4EUR Technicals 2
EUR Technicals 2
EUR Technicals 2
Recent data in the euro area has been positive: Labor costs growth outperformed expectations, coming in at 2.2%. Moreover, construction output yearly growth also surprised positively, coming in at 2.6%. Finally, both core and headline inflation came in line with expectations, at 1% and 2% respectively. EUR/USD has rallied by 1.1% this week We are bearish on the cyclical outlook for the euro, given that core inflation measures are continue to be too weak for the ECB to meaningfully change their dovish monetary policy stance. However, the current tactical rebound is likely to continue, as the weakness in the euro this year has eased financial conditions, which could lead to a temporary boon for the economy. Report Links: Policy Divergences Are Still The Name Of The Game - August 14, 2018 Time To Pause And Breathe - July 6, 2018 What Is Good For China Doesn't Always Help The World - June 29, 2018 The Yen Chart II-5JPY Technicals 1
JPY Technicals 1
JPY Technicals 1
Chart II-6JPY Technicals 2
JPY Technicals 2
JPY Technicals 2
Recent data in Japan has been mixed: Industrial production yearly growth surprised negatively, coming in at 2.2%. Moreover, capacity utilization also underperformed expectations, coming in at -0.6%. Finally, both export and import yearly growth outperformed expectations, coming in at 6.6% and 15.4% respectively. USD/JPY has been relatively flat this week. We are bearish on the yen on a structural basis, given that the economy continues to suffer from strong deflationary forces, which will force the Bank of Japan to keep their ultra-easy monetary policy. Report Links: Rhetoric Is Not Always Policy - July 27, 2018 Updating Our Long-Term FX Fair Value Models - June 22, 2018 Rome Is Burning: Is It The End? - June 1, 2018 British Pound Chart II-7GBP Technicals 1
GBP Technicals 1
GBP Technicals 1
Chart II-8GBP Technicals 2
GBP Technicals 2
GBP Technicals 2
Recent data in the U.K. has been positive: The retail price index yearly growth surprised to the upside, coming in at 3.5%. Moreover, both core and headline inflation outperformed expectations, coming in at 2.1% and 2.7% respectively. Finally, the DCLG House Price Index also surprised positively, coming in at 3.1%. GBP/USD has rallied by roughly 1.5% this week. The GBP's vol is likely to increase further going foirward, as very little political risks is priced into it. A practical strategy will be to lean against large weekly moves, both on the upside and downside. This strategy should be particularly profitable versus the euro. Report Links: Updating Our Long-Term FX Fair Value Models - June 22, 2018 Inflation Is In The Price - June 15, 2018 Updating Our Intermediate Timing Models - May 18, 2018 Australian Dollar Chart II-9AUD Technicals 1
AUD Technicals 1
AUD Technicals 1
Chart II-10AUD Technicals 2
AUD Technicals 2
AUD Technicals 2
Recent data in Australia has been positive: The participation rate surprised to the upside, coming in at 65.7%. Moreover, the total change in employment also outperformed expectations, coming in at 44 thousand. Finally, the house price index yearly growth also surprised positively, coming in at -0.6%. AUD/USD has risen by roughly 1.8% this week. We continue to be cyclically bearish on the Australian dollar, as the deleveraging campaign in China will weigh on demand for industrial metals, Australia's main export. Moreover, the AUD will also have downside against the CAD, as oil should continue to hold up relative to other commodities thanks to supply cuts from OPEC. That being said, the AUD's recent rebound is likely to continue on a short-term basis. Hence, investors already shorting the Aussie should consider buying hedges. Report Links: Policy Divergences Are Still The Name Of The Game - August 14, 2018 What Is Good For China Doesn't Always Help The World - June 29, 2018 Updating Our Long-Term FX Fair Value Models - June 22, 2018 New Zealand Dollar Chart II-11NZD Technicals 1
NZD Technicals 1
NZD Technicals 1
Chart II-12NZD Technicals 2
NZD Technicals 2
NZD Technicals 2
NZD/USD has rallied nearly 1.9% this week. We are negative on the New Zealand dollar on a structural basis due to the measures taken by the Ardern government, which include reducing immigration, and adopting_a dual mandate for the RBNZ. Both of these measures will weigh on the real neutral rate, which means that the RBNZ will have to hold rates lower than otherwise. However, on a more tactical basis, this cross could rally, thanks to the temporary stimulus by the Chinese authorities which will help risk assets. Report Links: Updating Our Long-Term FX Fair Value Models - June 22, 2018 Updating Our Intermediate Timing Models - May 18, 2018 Value Strategies In FX Markets: Putting PPP To The Test - May 11, 2018 Canadian Dollar Chart II-13CAD Technicals 1
CAD Technicals 1
CAD Technicals 1
Chart II-14CAD Technicals 2
CAD Technicals 2
CAD Technicals 2
Recent data in Canada has been mixed: Manufacturing shipments monthly growth outperformed expectations, coming in at 0.9%. However, capacity utilization surprised to the downside, coming in at 85.5%. Finally, the new house price index yearly growth was in line with expectations, coming in at 0.5% USD/CAD has depreciated by 1% this week. We remain bullish on the CAD among the dollar bloc currencies, given that inflationary pressures continue to be strong in Canada. Report Links: Updating Our Long-Term FX Fair Value Models - June 22, 2018 Inflation Is In The Price - June 15, 2018 Rome Is Burning: Is It The End? - June 1, 2018 Swiss Franc Chart II-15CHF Technicals 1
CHF Technicals 1
CHF Technicals 1
Chart II-16CHF Technicals 2
CHF Technicals 2
CHF Technicals 2
EUR/CHF has rallied by 0.5% this week. We continue to be bullish on this cross on a cyclical basis, as the Swiss economy is still too fragile for the SNB to remove its ultra-dovish monetary stance. Moreover, the recent appreciation in the franc that has taken place over the last four months should be very negative for inflation, as Switzerland is the country with the most imports as a percentage of demand in the G10, and thus the country with the most sensitive inflation to currency movements. Finally, on a tactical basis we are also bullish on this cross, as the recent easing of monetary policy by Chinese authorities should be weigh on safe heaven assets like the franc. Report Links: Updating Our Long-Term FX Fair Value Models - June 22, 2018 Updating Our Intermediate Timing Models - May 18, 2018 Value Strategies In FX Markets: Putting PPP To The Test - May 11, 2018 Norwegian Krone Chart II-17NOK Technicals 1
NOK Technicals 1
NOK Technicals 1
Chart II-18NOK Technicals 2
NOK Technicals 2
NOK Technicals 2
Yesterday, Norges Bank increased rates for the first time since 2011, yet the NOK was flat against a weak USD, and fell against the euro and the Swedish krona, suggesting that the hike was well anticipated by market participants. Despite this price action, USD/NOK has depreciated by 1.2% this week. We are positive on the NOK against other non-oil commodity currencies, as oil should outperform base metals in the current environment. After all, OPEC supply cuts and geopolitical risk in the Middle East should provide a boon for oil prices. On the other hand, while temporary easing is likely, the Chinese deleveraging campaign will continue once the Chinese economy has stabilized. Finally, the positive NIIP, and positive current account of the NOK should give it an additional advantage against the rest of the commodity currencies. Report Links: Updating Our Long-Term FX Fair Value Models - June 22, 2018 Updating Our Intermediate Timing Models - May 18, 2018 Value Strategies In FX Markets: Putting PPP To The Test - May 11, 2018 Swedish Krona Chart II-19SEK Technicals 1
SEK Technicals 1
SEK Technicals 1
Chart II-20SEK Technicals 2
SEK Technicals 2
SEK Technicals 2
Recent data in Sweden has been negative: Headline inflation underperformed expectations, coming in at 2%. Moreover, the unemployment rate increased from 6% in July to 6.1% on the August reading. USD/SEK has depreciated by almost 2.8% this week. We expect the Riksbank to begin tightening policy in December, as Swedish inflationary pressures remain strong. Moreover, the recent stimulus from the PBoC should put additional downward pressure on EUR/SEK, given the krona's more pro-cyclical profile than the euro. Finally, valuations also support the SEK, as the krona is cheap according to multiple measures. Report Links: Updating Our Long-Term FX Fair Value Models - June 22, 2018 Updating Our Intermediate Timing Models - May 18, 2018 Value Strategies In FX Markets: Putting PPP To The Test - May 11, 2018 Trades & Forecasts Forecast Summary Core Portfolio Tactical Trades Closed Trades
Highlights Prediction 1: A major financial downturn will trigger the next major economic downturn, and not the other way round. Prediction 2: The straw that will break the back of a fragile financial system will be the global long bond yield rising by 60 bps within a short space of time. But for those who can fine tune, the global long bond yield must rise a further 30-50 bps before reaching the tipping point for the global risk-asset edifice. Take short-term profits in the overweight position in 30-year government bonds. Take short-term profits in the underweight position in basic materials. Take short-term profits in the underweight positions in Italy (MIB) and Spain (IBEX) and overweight position in Denmark (OMX). Feature The twenty-first century has witnessed three major downturns: the first started in 2000; the second started in 2007 culminating in the Lehman crisis a year later; and the third started in 2011 (Chart of the Week). Today, we are going to stick our necks out and make two predictions about the century's fourth major downturn. Chart of the WeekThree Episodes When Equities Underperformed Bonds By 20 Percent Or More
Three Episodes When Equities Underperformed Bonds By 20 Percent Or More
Three Episodes When Equities Underperformed Bonds By 20 Percent Or More
A major financial downturn will trigger the fourth major economic downturn. The straw that will break the back of a fragile financial system will be the global long bond yield rising by 60 bps within a short space of time. Where The Consensus Is Very Wrong As investment strategists, our primary focus should be the financial markets rather than the economy. On this basis, we define a major downturn in terms of the markets: an episode in which equities underperform bonds by more than 20 percent over a period of more than six months.1 All the same, our market based definition of a major downturn perfectly captures the three occasions that the European economy went into recession or stagnation (Chart I-2). Does this mean that the economic downturns triggered the financial market downturns? No, quite the reverse. The onset of the three major financial downturns clearly preceded the onset of the three major economic downturns. Chart I-2Three Episodes When The Euro Area Economy ##br##Contracted Or Stagnated
Three Episodes When The Euro Area Economy Contracted Or Stagnated
Three Episodes When The Euro Area Economy Contracted Or Stagnated
On reflection, this is hardly surprising. The twenty-first century's major economic downturns have all resulted from financial market distortions and fragilities: the bubble valuations of the technology, media and telecom sectors in 2000 (Chart I-3); the mispricing of U.S. mortgages and credit in 2007 (Chart I-4); and the mispricing of euro area sovereign credit risk in 2011 (Chart I-5). Therefore, it makes perfect sense that the downturns in financial markets should precede the downturns in the economy, even when both are measured in real time. Chart I-3The Major Downturns Stemmed From##br## Financial Market Distortions: The Dot Com ##br##Bubble In 1999/2000...
The Major Downturns Stemmed From Financial Market Distortions: The Dot Com Bubble In 1999/2000...
The Major Downturns Stemmed From Financial Market Distortions: The Dot Com Bubble In 1999/2000...
Chart I-4...The Mispricing Of U.S. ##br##Mortgages And Credit##br## In 2007/2008...
...The Mispricing Of U.S. Mortgages And Credit In 2007/2008...
...The Mispricing Of U.S. Mortgages And Credit In 2007/2008...
Chart I-5...And The Mispricing Of Euro Area ##br##Sovereign Credit Risk##br## In 2010/2011
...And The Mispricing Of Euro Area Sovereign Credit Risk In 2010/2011
...And The Mispricing Of Euro Area Sovereign Credit Risk In 2010/2011
Today, the consensus overwhelmingly believes that an economic downturn will cause the next major downturn in financial markets. But history has taught us time and time again that the causality is much more likely to run the other way. Why not learn the lesson? So here's our first prediction: a major financial downturn will trigger the fourth major economic downturn, and not the other way round. This prediction raises some obvious questions: what could be the major fragility in financial markets, and what could fracture it? A Sharp Rise In Bond Yields Triggered The Last Three Major Downturns Look carefully at the financial market downturns that started in 2000, 2007 and 2011, and you will see another striking similarity. In each episode, the global long bond yield rose by 60 bps or more in the months that preceded the onset of the financial market downturn: April 1999 through January 2000 (Chart I-6); March through July 2007 (Chart I-7); and October 2010 through April 2011 (Chart I-8). This strongly suggests that the spike in the bond yield was the trigger for the subsequent major downturn in financial markets. Chart I-6A Sharply Rising Bond Yield Triggered ##br##The Major Downturn Of 2000
A Sharply Rising Bond Yield Triggered The Major Downturn Of 2000
A Sharply Rising Bond Yield Triggered The Major Downturn Of 2000
Chart I-7A Sharply Rising Bond Yield Triggered##br## The Major Downturn Of 2007 And 2008
A Sharply Rising Bond Yield Triggered The Major Downturn Of 2007 And 2008
A Sharply Rising Bond Yield Triggered The Major Downturn Of 2007 And 2008
Chart I-8A Sharply Rising Bond Yield Triggered ##br##The Major Downturn Of 2011
A Sharply Rising Bond Yield Triggered The Major Downturn Of 2011
A Sharply Rising Bond Yield Triggered The Major Downturn Of 2011
A sharp rise in bond yields is usually the straw that breaks the back of financial market fragilities, in (at least) one of three ways: it flushes out those actors that are reliant on cheap liquidity; it pressures interest rate sensitive sectors in the economy; and it weighs on the valuations of other assets such as equities, especially if those valuations are already extremely elevated. Which segues us neatly to the current fragility in the global financial system. As we wrote last week, the post-2008 global experiment with quantitative easing, and zero and negative interest rate policy has boosted the valuations of all risk-assets across all geographies across all asset-classes. And the total value of those global risk-assets is $400 trillion, equal to about five times the size of the global economy.2 We have also consistently highlighted that not only do the rich valuations of $400 trillion of risk-assets depend (inversely) on bond yields, but that this relationship is an exponential function.3 So here's our second prediction: the straw that will break the back of a fragile financial system will be the global long bond yield rising by 60 bps within a short space of time - just as it did in 2000, 2007 and 2011. But Bond Yields Haven't Gone Up Far Enough... Yet Now comes some bullish news, at least for those who can play shorter-term moves in the market. The global long bond yield has been trapped within a tight channel and is only 20 bps up from its recent low in April (Chart I-9). Therefore, it has the scope to rise a further 30-50 bps before reaching the tipping point for the global risk-asset edifice and unleashing a 'risk-off' phase. Chart I-9In 2018, The Bond Yield Has Not Risen Sharply...Yet
In 2018, The Bond Yield Has Not Risen Sharply...Yet
In 2018, The Bond Yield Has Not Risen Sharply...Yet
For those who want to fine tune their investment strategy, the journey up to that turning point would define a phase when many of this year's cyclical sector underperformances would end or even switch to a phase of modest outperformances. Bear in mind that the cyclical sector underperformances this year have been substantial: European banks have underperformed healthcare by 35 percent; global basic materials have underperformed the market by 10 percent; emerging market equities have underperformed developed market equities by 15 percent. So it is prudent to take some short-term profits, especially as these trends are likely to end, at least in the near term. Hence, three weeks ago we closed our underweight banks versus healthcare position, booking a tidy profit of 23 percent. Today, we are closing our underweight position in basic materials versus the market, booking a profit of 6 percent. In a similar vein, we are taking the modest profits in our overweight position in 30-year government bonds. Sector allocation has unavoidable implications for stock market allocation - because the mainstream stock market indexes all have dominant sector skews which determine their relative performances (Chart I-10). Chart I-10Italy Vs. Denmark = Banks Vs. Healthcare
Italy Vs. Denmark = Banks Vs. Healthcare
Italy Vs. Denmark = Banks Vs. Healthcare
On this basis, closing our underweight banks versus healthcare removes the justification for being underweight bank-dominant Italy (MIB) and Spain (IBEX) and the justification for being overweight healthcare-dominant Denmark (OMX). These three positions now move to neutral. While we consider our next shift, our European stock market allocation is temporarily reduced to just five positions. Overweight: France, Ireland, Switzerland. Underweight: Sweden, Norway. Finally, just to say that there will be no report next week as I will be attending our annual Investment Conference which is in Toronto this year. I look forward to seeing some of you there. Dhaval Joshi, Senior Vice President Chief European Investment Strategist dhaval@bcaresearch.com 1 Based on the relative performance of the MSCI All Country World Index versus the JP Morgan Global Government Bond Index, both in local currency terms. 2 Please see the European Investment Strategy Weekly Report 'Trapped: Have Equities Trapped Bonds?' September 13 2018 available at eis.bcaresearch.com. 3 Please see the European Investment Strategy Weekly Report 'The Rule Of 4 For Equities And Bonds' August 2 2018 available at eis.bcaresearch.com. Fractal Trading Model* This week, we note that the very strong recent outperformance of U.S. telecoms versus U.S. autos is technically extended, reaching a fractal dimension that has previously signalled the start of a countertrend move. Hence, the recommended trade is short U.S. telecoms, long U.S. autos. Set a profit target of 9% with a symmetrical stop-loss. For any investment, excessive trend following and groupthink can reach a natural point of instability, at which point the established trend is highly likely to break down with or without an external catalyst. An early warning sign is the investment's fractal dimension approaching its natural lower bound. Encouragingly, this trigger has consistently identified countertrend moves of various magnitudes across all asset classes. Chart I-11
U.S. Telecom VS. Autos
U.S. Telecom VS. Autos
The post-June 9, 2016 fractal trading model rules are: When the fractal dimension approaches the lower limit after an investment has been in an established trend it is a potential trigger for a liquidity-triggered trend reversal. Therefore, open a countertrend position. The profit target is a one-third reversal of the preceding 13-week move. Apply a symmetrical stop-loss. Close the position at the profit target or stop-loss. Otherwise close the position after 13 weeks. Use the position size multiple to control risk. The position size will be smaller for more risky positions. * For more details please see the European Investment Strategy Special Report "Fractals, Liquidity & A Trading Model," dated December 11, 2014, available at eis.bcaresearch.com Fractal Trading Model Recommendations Equities Bond & Interest Rates Currency & Other Positions Closed Fractal Trades Trades Closed Trades Asset Performance Currency & Bond Equity Sector Country Equity Indicators Bond Yields Chart II-1Indicators To Watch - Bond Yields
Indicators To Watch - Bond Yields
Indicators To Watch - Bond Yields
Chart II-2Indicators To Watch - Bond Yields
Indicators To Watch - Bond Yields
Indicators To Watch - Bond Yields
Chart II-3Indicators To Watch - Bond Yields
Indicators To Watch - Bond Yields
Indicators To Watch - Bond Yields
Chart II-4Indicators To Watch - Bond Yields
Indicators To Watch - Bond Yields
Indicators To Watch - Bond Yields
Interest Rate Chart II-5Indicators To Watch - Interest Rate Expectations
Indicators To Watch - Interest Rate Expectations
Indicators To Watch - Interest Rate Expectations
Chart II-6Indicators To Watch - Interest Rate Expectations
Indicators To Watch - Interest Rate Expectations
Indicators To Watch - Interest Rate Expectations
Chart II-7Indicators To Watch - Interest Rate Expectations
Indicators To Watch - Interest Rate Expectations
Indicators To Watch - Interest Rate Expectations
Chart II-8Indicators To Watch - Interest Rate Expectations
Indicators To Watch - Interest Rate Expectations
Indicators To Watch - Interest Rate Expectations
Highlights In this Weekly Report, we present our semi-annual chartbook of the BCA Central Bank Monitors. The message now conveyed by the Monitors is that divergences between the cyclical pressures faced by the individual central banks are growing larger. This is occurring within some countries, where the growth and inflation indicators are trending in opposite directions. This is also visible across countries, with not every Monitor calling for rate hikes - a significant shift from the coordinated backdrop seen in 2017 (Chart of the Week). Chart of the WeekFrom Convergence To Divergence In The BCA Central Bank Monitors
From Convergence To Divergence In the BCA Central Bank Monitors
From Convergence To Divergence In the BCA Central Bank Monitors
The combined message from the Monitors is that the slower pace of global growth seen in 2018 has not been enough put a serious dent in inflation pressures stemming from a dearth of spare capacity in most major countries. Perhaps that changes if a full-blown U.S.-China trade war develops, or if the tensions in emerging markets spill over more broadly into global financial conditions, but that remains to be seen. Add it all up, and a below-benchmark stance on overall global duration exposure remains appropriate. Feature An Overview Of The BCA Central Bank Monitors Chart 2CB Monitor Divergence = Bond Yield Divergence
CB Monitor Divergence = Bond Yield Divergence
CB Monitor Divergence = Bond Yield Divergence
The BCA Central Bank Monitors are composite indicators designed to measure the cyclical growth and inflation pressures that can influence future monetary policy decisions. The economic data series used to construct the Monitors are not the same for every country, but the list of indicators generally measure the same things (i.e. manufacturing cycles, domestic demand strength, commodity prices, labor market conditions, exchange rates, etc). The data series are standardized and combined to form the Monitors. Readings above the zero line for each Monitor indicate pressures for central banks to raise interest rates, and vice versa. Through the nexus between growth, inflation, and market expectations of future interest rate changes, the Monitors do exhibit broad correlations to government bond yields in the Developed Markets (Chart 2). Our current recommended country allocation for global government bonds reflects the trends seen in the Central Bank Monitors - underweighting countries were the Monitors are most elevated (the U.S., Canada) in favor of regions where the Monitors are lower (Australia, Japan, euro area, New Zealand). In each BCA Central Bank Monitor Chartbook, we include a new chart for each country that we have not shown previously. In this edition, we show the Monitors plotted against the relative returns for each country versus the overall Bloomberg Barclays Global Treasury index (shown inversely in the charts so that a rising line means underperformance versus the benchmark index). Fed Monitor: Still On A Gradual Rate Hike Path Our Fed Monitor remains in the "tight money required" zone, signalling that the cyclical backdrop justifies additional Fed rate hikes (Chart 3A). Resilient U.S. growth, a dearth of spare capacity and an acceleration of both wage growth and core inflation are all consistent with a U.S. economy starting to overheat and requiring tighter monetary policy (Chart 3B). Chart 3AU.S.: Fed Monitor
U.S.: Fed Monitor
U.S.: Fed Monitor
Chart 3BU.S. Inflation On The Rise
U.S. Inflation On The Rise
U.S. Inflation On The Rise
The growth and inflation components of the Fed Monitor have both accelerated since our last Central Bank Monitor Chartbook was published back in April. Most notably, the inflation component has blasted through the zero line to the highest level since 2008 (Chart 3C). The financial conditions component has retreated from very elevated (i.e. growth-supportive) levels, mostly due to the stronger U.S. dollar but also because of wider corporate credit spreads seen since the start of 2018. Importantly, the financial conditions component has not tightened enough to offset the impact on the Monitor from faster growth and inflation. Chart 3CAll Fed Monitor Components Now Above Zero
All Fed Monitor Components Now Above Zero
All Fed Monitor Components Now Above Zero
Recent comments from senior Fed officials (Chair Jay Powell and Governor Lael Brainard) have indicated that the Fed is less confident in its own estimates of the full-employment NAIRU or the appropriate neutral level of the funds rate. Our read on this is that the Fed will instead continue to raise the funds rate at a gradual 25bp per quarter pace until there are signs that U.S. monetary policy has become tight (i.e. an inverted yield curve, wider credit spreads, softer U.S. economic data). Until then, the message sent by the Fed Monitor is to remain underweight U.S. Treasuries with below-benchmark duration, as market pricing of expectations for both the funds rate and inflation remain too low (Chart 3D). Chart 3DU.S. Treasury Underperformance Will Continue - Stay Underweight
U.S. Treasury Underperformance Will Continue - Stay Underweight
U.S. Treasury Underperformance Will Continue - Stay Underweight
BoE Monitor: Brexit Uncertainty Trumps Inflation Pressures The BoE Monitor remains in the "tighter money required" zone as it has since late 2015 (Chart 4A). Despite that persistent signal, the BoE has kept monetary policy at highly accommodative levels, only raising the base rate 50bps over the past year. The BoE Monetary Policy Committee remains torn between signs that inflation risks are tilted to the upside and the downside risks to U.K. growth from an uncertain Brexit outcome. The U.K. unemployment rate is well below NAIRU with an output gap that is now estimated to be closed (Chart 4B). Yet realized inflation has peaked, with core inflation drifting back below 2%. Wages are finally starting to grow in real terms, which the BoE cites as an important factor underpinning consumer spending, but the pace remains modest. Chart 4AU.K.: BoE Monitor
U.K.: BoE Monitor
U.K.: BoE Monitor
Chart 4BNo Spare Capacity, Yet Has Inflation Peaked?
No Spare Capacity, Yet Has Inflation Peaked?
No Spare Capacity, Yet Has Inflation Peaked?
Looking at the breakdown of our BoE Monitor, both the growth and inflation sub-components of the indicator have recently reaccelerated (Chart 4C). Yet U.K. leading economic indicators continue to decline and dampened business confidence measures reflect the heightened uncertainty over the future relationship between the U.K. and the European Union. Chart 4CBoth Growth & Inflation Components Are Boosting The BoE Monitor
Both Growth & Inflation Components Are Boosting The BoE Monitor
Both Growth & Inflation Components Are Boosting The BoE Monitor
The performance of U.K. Gilts has diverged from the Monitor since the 2016 Brexit vote (Chart 4D), as the BoE has been more worried about Brexit than inflation and has stayed accommodative. Stay overweight U.K. Gilts within global government bond portfolios, even with the more bearish signal implied by our BoE Monitor, given the weakening trend in leading economic indicators and persistent Brexit uncertainty. Chart 4DBrexit Uncertainty Preventing More BoE Hikes - Stay Overweight Gilts
Brexit Uncertainty Preventing More BoE Hikes - Stay Overweight Gilts
Brexit Uncertainty Preventing More BoE Hikes - Stay Overweight Gilts
ECB Monitor: No Pressure To Hike Rates Quickly Post-QE Our European Central Bank (ECB) Monitor has fallen sharply since we last published this Chartbook back in April, and it now sits below the zero line (Chart 5A). The growth deceleration in the first half of the year from the rapid pace seen in 2017 is the main reason for this move, as inflation pressures have not subsided (Chart 5B). Chart 5AEuro Area: ECB Monitor
Euro Area: ECB Monitor
Euro Area: ECB Monitor
Chart 5BEuro Area At Full Capacity
Euro Area At Full Capacity
Euro Area At Full Capacity
ECB President Mario Draghi noted last week that the plan remains in place to end the net new buying phase of the ECB's Asset Purchase Program at the end of 2018. Policymakers' have grown more confident that their inflation forecasts will be met as most measures of euro area wage growth (and headline inflation) have accelerated to 2% over the past year. It remains to be seen if those expectations are too optimistic, as the growth component of our ECB Monitor remains well below the zero line, while the inflation component is no longer rising (Chart 5C). Chart 5CGrowth Component Dragging Down The ECB Monitor
Growth Component Dragging Down The ECB Monitor
Growth Component Dragging Down The ECB Monitor
For now, we recommend a neutral stance on core euro area government bonds with an underweight posture on Peripheral sovereign debt as a way to manage these conflicting trends. The overall performance of euro area bonds versus global benchmarks has followed the pace of the ECB's bond-buying since 2015, and not the pressures suggested by our ECB Monitor (Chart 5D), suggesting a bearish stance as the bond buying ends. Yet from a more bullish perspective, the mixed message on growth and lack of immediate pressures on core inflation (still at 1%) imply that the ECB will not deviate from its current dovish forward guidance of no interest rate hikes until at least September 2019. Chart 5DECB Will Not Hike Rates Quickly After QE Ends - Stay Neutral Core European Bonds
ECB Will Not Hike Rates Quickly After QE Ends - Stay Neutral Core European Bonds
ECB Will Not Hike Rates Quickly After QE Ends - Stay Neutral Core European Bonds
BoJ Monitor: Too Soon To Consider Policy Changes Our Bank of Japan (BoJ) Monitor has stayed just barely in the "tighter money required" zone since last October, due mostly to growing inflation pressures (Chart 6A). Yet with the Japanese labor market now as tight as it has been in decades, headline and core CPI inflation are only at 0.9% and 0.3% respectively, well below the BoJ's 2% target (Chart 6B). Chart 6AJapan: BoJ Monitor
Japan: BoJ Monitor
Japan: BoJ Monitor
Chart 6BInflation Pressures Slowly Building In Japan
Inflation Pressures Slowly Building In Japan
Inflation Pressures Slowly Building In Japan
Japanese firms appear to finally be reacting to the tightness of the labor market, however, as wage growth has accelerated in recent months. The pick-up in wages has helped boost inflation expectations, both of which are part of the inflation component of the BoJ Monitor that is now at the highest level since 2008 (Chart 6C). However, the growth component just rolled over and now sits at the zero line, as the Japanese economy has lost some momentum. Chart 6CInflation Boosting BoJ Monitor
Inflation Boosting BoJ Monitor
Inflation Boosting BoJ Monitor
We continue to recommend an overweight stance on JGBs, based on our view that the BoJ will maintain hyper-easy monetary policy settings - especially compared to the rest of the developed markets - until there is much higher realized inflation in Japan. JGBs have indeed been outperforming over the past year, even with the less dovish signal sent by the BoJ Monitor (Chart 6D). Yet the absolute level of the Monitor remains around zero, suggesting that no policy changes should be expected. That means no upward adjustment of the BoJ's 0% yield target on 10-year JGBs or major further reductions in the annual pace of BoJ JGB buying (even though the central bank is hitting capacity constraints as it now owns close to ½ of all outstanding JGBs). Chart 6DBoJ In No Hurry To Turn Hawkish - Stay Overweight JGBs
BoJ In No Hurry To Turn Hawkish - Stay Overweight JGBs
BoJ In No Hurry To Turn Hawkish - Stay Overweight JGBs
BoC Monitor: Rate Hikes - More To Come The Bank of Canada (BoC) Monitor has stayed in "tighter money required" since the beginning of 2017 and is now well above the zero line (Chart 7A). The BoC has been following our BoC Monitor, hiking rates by a cumulative 100bps since July 2017. Chart 7ACanada: BoC Monitor
Canada: BoC Monitor
Canada: BoC Monitor
Chart 7BAn Overheating Canadian Economy?
An Overheating Canadian Economy?
An Overheating Canadian Economy?
The BoC has been responding to the growing inflation pressure in Canada. There is no evidence that spare economic capacity exists, while realized inflation is near the upper bound of BoC's target range of 1-3% (Chart 7B). There is a growing divergence between the growth and inflation subcomponents of the BoC Monitor, with the latter decelerating over the past several months. That was due to a combination of slowing Chinese import demand and the imposition of trade tariffs on Canada by the Trump administration (Chart 7C). Yet the domestic economy remains in good shape, with the overall indicator from the BoC's Business Outlook Survey at the highest level since 2010. Chart 7CInflation Component Boosting BoC Monitor
Inflation Component Boosting BoC Monitor
Inflation Component Boosting BoC Monitor
We continue to recommend an underweight stance on Canadian government bonds, as the relative performance has broadly followed the path of the BoC Monitor over the past three years (Chart 7D). The BoC tends to follow the policy actions of the Fed with a short lag, thus our bearishness on Canadian government bonds is related to our more hawkish views on the Fed. Yet the surge in Canadian inflation, at a time when the economy has no spare capacity, suggests that there are good domestic reasons to expect more rate hikes from the BoC over the next year than what is currently discounted by markets. Chart 7DBoC Not Done Yet - Stay Underweight Canadian Bonds
BoC Not Done Yet - Stay Underweight Canadian Bonds
BoC Not Done Yet - Stay Underweight Canadian Bonds
RBA Monitor: Easier Policy Needed The Reserve Bank of Australia (RBA) monitor has rapidly fallen below the zero line for the first time since 2016, and now indicates that easier monetary policy is required (Chart 8A). This stands out from the more stable trajectory of the rest of the BCA Central Bank Monitors. Unlike most other developed countries, there is still excess capacity in the Australian economy. Australia's output gap has not closed while the current unemployment rate is just at the OECD's NAIRU estimate of 5.3%. Headline and core inflation are at the low end of the RBA's 2-3% target and struggling to gain much upward momentum (Chart 8B). Chart 8AAustralia: RBA Monitor
Australia: RBA Monitor
Australia: RBA Monitor
Chart 8BMinimal Inflation Pressure In Australia
Minimal Inflation Pressure In Australia
Minimal Inflation Pressure In Australia
While both the growth and inflation components of the RBA Monitor have fallen, the biggest decline has come from the inflation side (Chart 8C). The sluggishness of Australia's economy is due to the slow growth of consumer spending and a big deceleration in exports related to softer Chinese demand. On inflation, excess labor market slack, with an underemployment rate close to 8.5%, is the main factor explaining soft wage growth and overall sluggish inflation. Chart 8CInflation Component Weighing On RBA Monitor
Inflation Component Weighing On RBA Monitor
Inflation Component Weighing On RBA Monitor
Our highest conviction country allocation call this year has been to overweight Australian Government bonds, and we see no need to change that given the bullish signal from our RBA Monitor (Chart 8D). It would likely take a rise in unemployment, a renewed decline in realized inflation or a big external shock for the RBA to actually cut rates as our Monitor suggests, but the signal is still bullish for Australian debt on a relative basis. Chart 8DRBA A Long Way From A Hike - Stay Overweight Australian Government Bonds
RBA A Long Way From A Hike - Stay Overweight Australian Government Bonds
RBA A Long Way From A Hike - Stay Overweight Australian Government Bonds
RBNZ Monitor: Policy On Hold For A While Longer The Reserve Bank of New Zealand (RBNZ) Monitor is currently just above the zero line, indicating that tighter monetary policy is required (although just barely) (Chart 9A). This is consistent with the mixed messages in the New Zealand economic data. For example, there is no spare capacity in the economy according to estimates of the output and employment gaps, yet both headline and core inflation have decelerated to the lower end of the RBNZ's 1-3% target band (Chart 9B). Chart 9ANew Zealand: RBNZ Monitor
New Zealand: RBNZ Monitor
New Zealand: RBNZ Monitor
Chart 9BNo Spare Capacity In NZ, But No Inflation Either
No Spare Capacity In NZ, But No Inflation Either
No Spare Capacity In NZ, But No Inflation Either
Looking at the components of the RBNZ Monitor, the growth factors have continued to plunge whereas the inflation factors have been increasing (from below zero) since the start of 2018 (Chart 9C). New Zealand's economic growth has slowed because of softer consumer spending and weaker housing activity, the latter of which is related to lower net immigration. Yet business confidence is falling, both the manufacturing and services PMIs have also declined, and export growth has cooled thanks to weaker growth from China and Australia. Meanwhile, the uptick in the inflation components has not yet translated into any broader improvement in realized inflation that would cause the RBNZ to take a more hawkish turn. Chart 9CConflicting Trends Within The RBNZ Monitor
Conflicting Trends Within The RBNZ Monitor
Conflicting Trends Within The RBNZ Monitor
We continue to recommend an overweight stance on New Zealand Government Bonds, in line with the bullish signal sent by our RBNZ Monitor (Chart 9D). The RBNZ has already provided forward guidance indicating that the Overnight Cash Rate (OCR) will stay unchanged until 2020, and it will take some time before there is evidence that the recent hook down in inflation is nothing more than a temporary blip. Chart 9DRBNZ To Remain On Hold - Stay Long New Zealand Bonds
RBNZ To Remain On Hold - Stay Long New Zealand Bonds
RBNZ To Remain On Hold - Stay Long New Zealand Bonds
Robert Robis, CFA, Senior Vice President Global Fixed Income Strategy rrobis@bcaresearch.com Ray Park, CFA, Research Analyst ray@bcaresearch.com Recommendations The GFIS Recommended Portfolio Vs. The Custom Benchmark Index
BCA Central Bank Monitor Chartbook: Divergences Opening Up
BCA Central Bank Monitor Chartbook: Divergences Opening Up
Duration Regional Allocation Spread Product Tactical Trades Yields & Returns Global Bond Yields Historical Returns
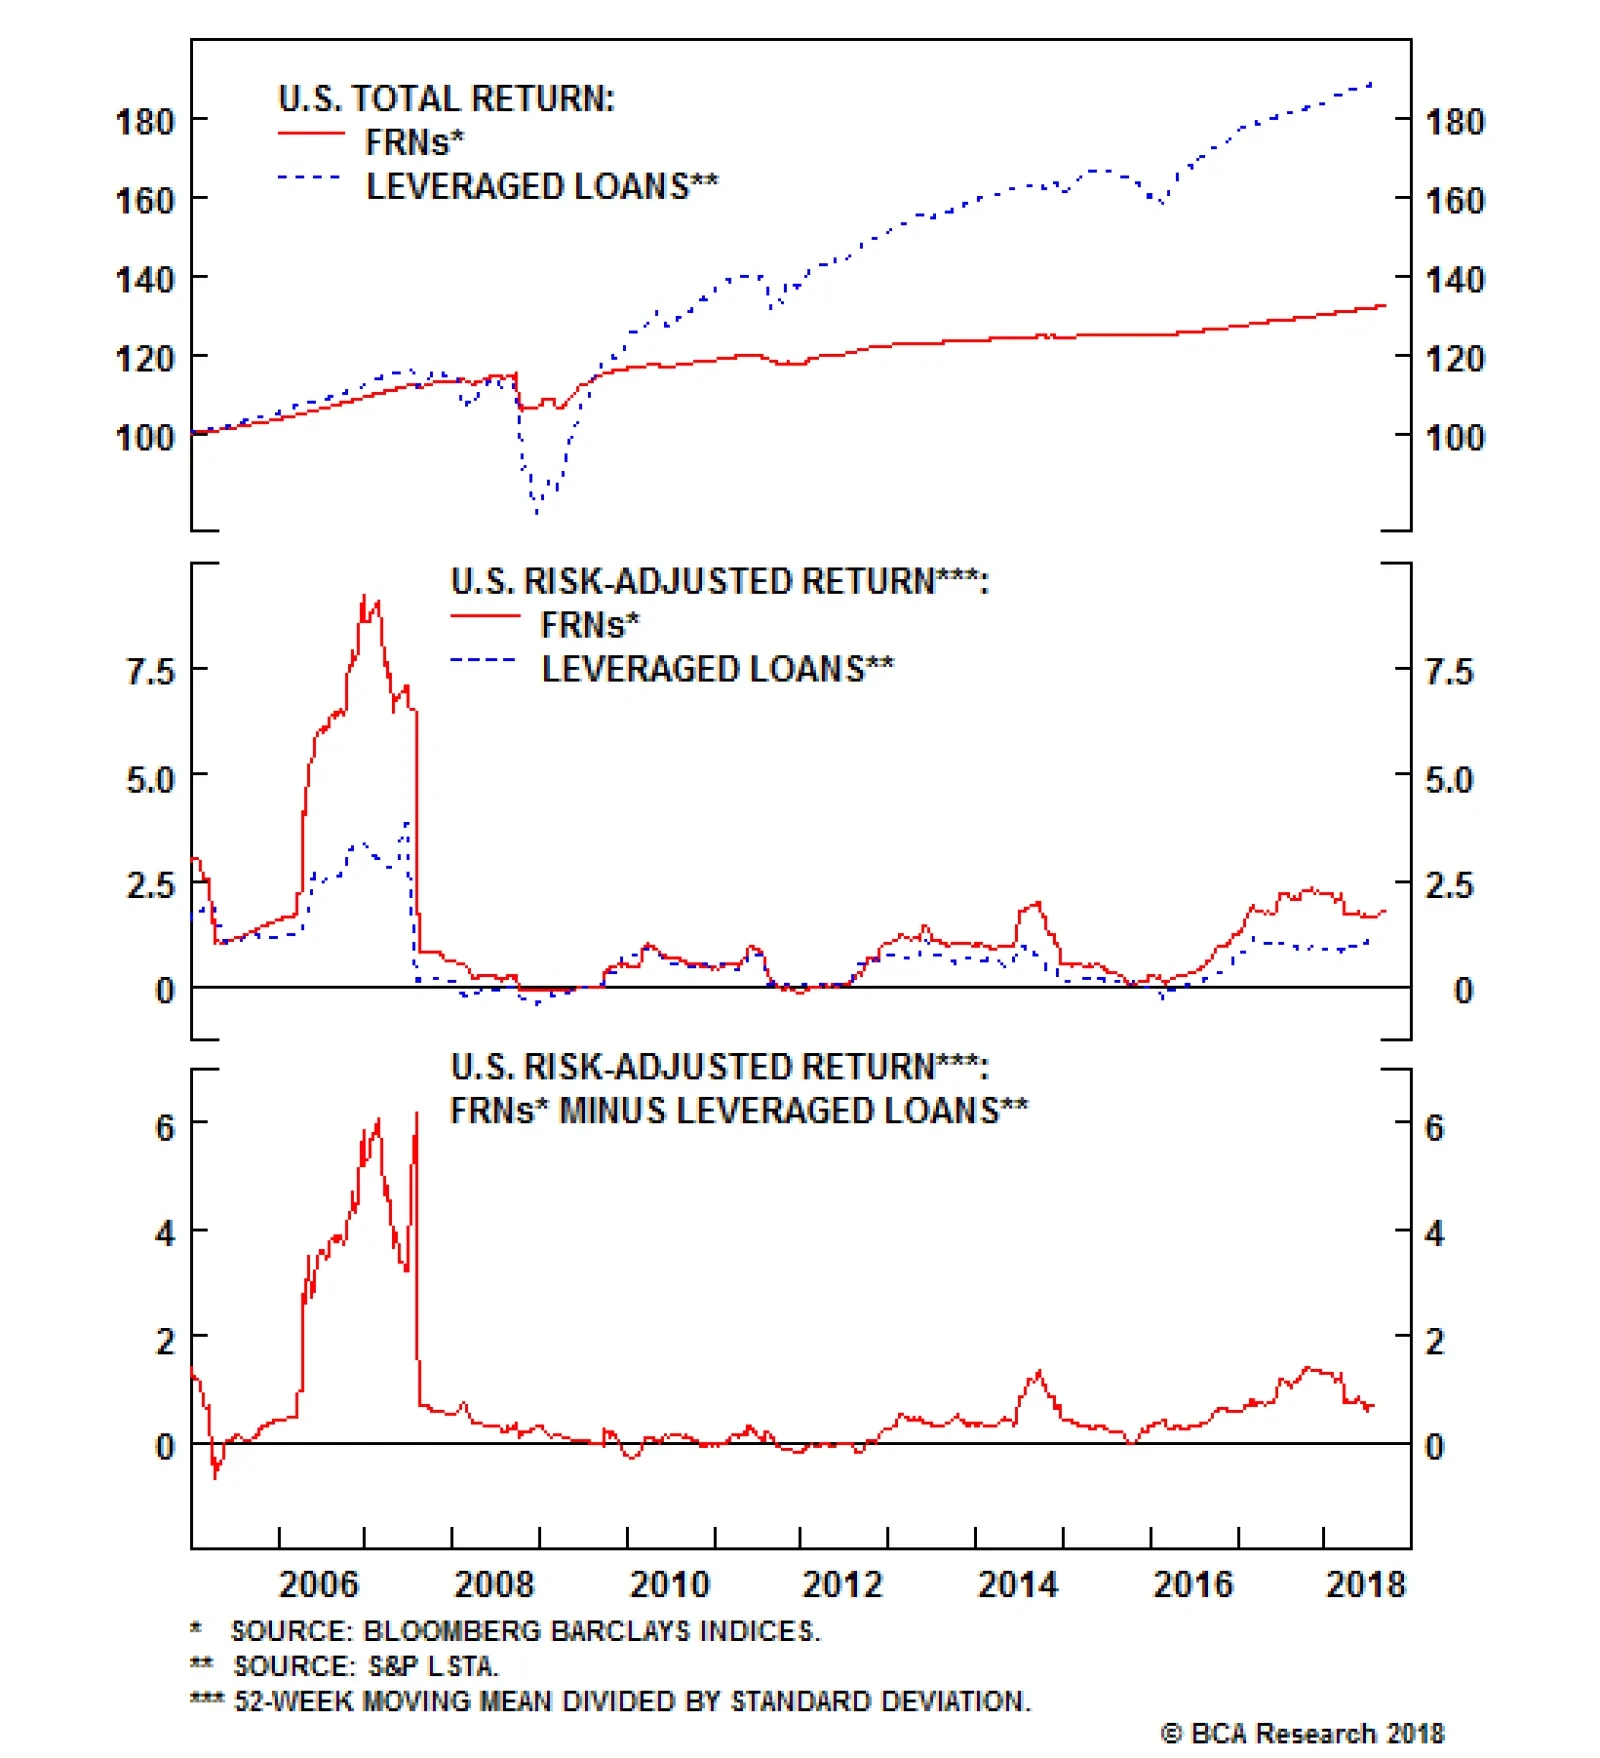
Leveraged loans tend to be senior to an issuer's traditional corporate bonds, and are collateralized by a pledge of the issuer's assets. However, secured does not mean safe. Even though like FRNs bank loans share the same feature of having "floating coupon…
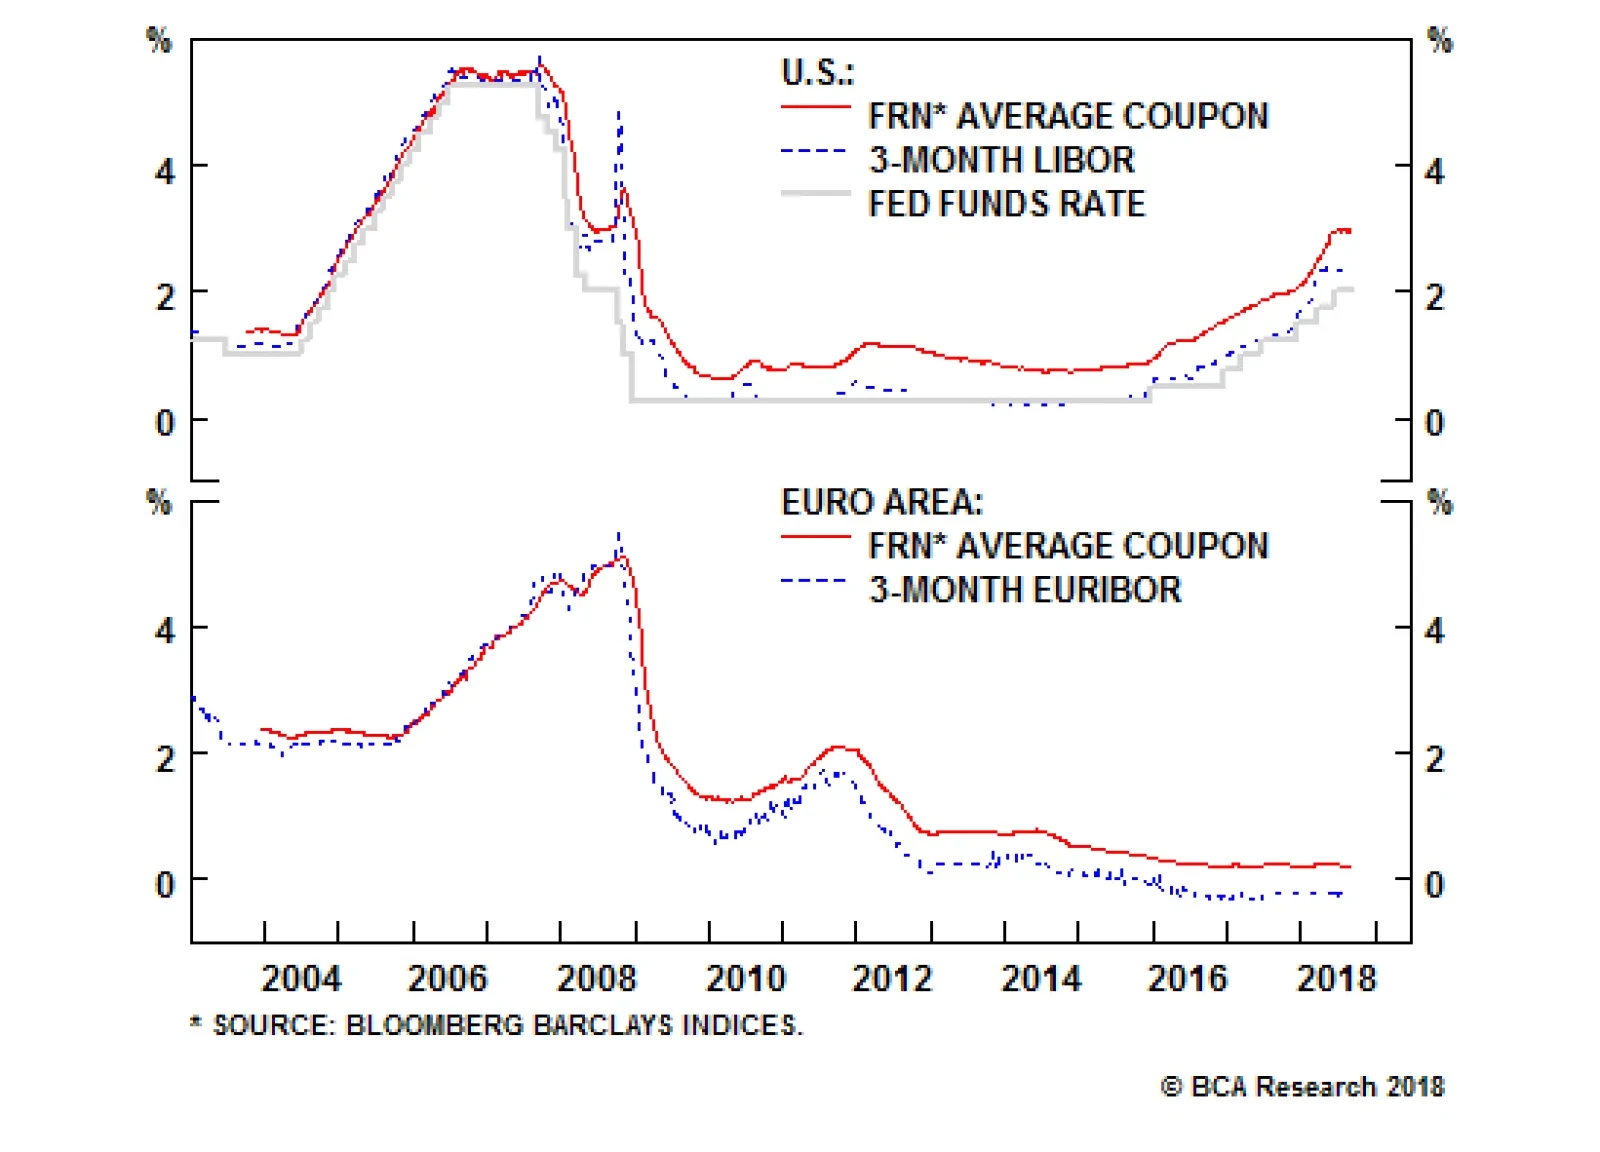
One potential solution for investors in a rising inflation and rate environment is to get exposure to Floating-Rate Notes (FRN). An FRN offers coupon payments that float or adjust periodically based on a predetermined benchmark rate. Typical benchmarks in…
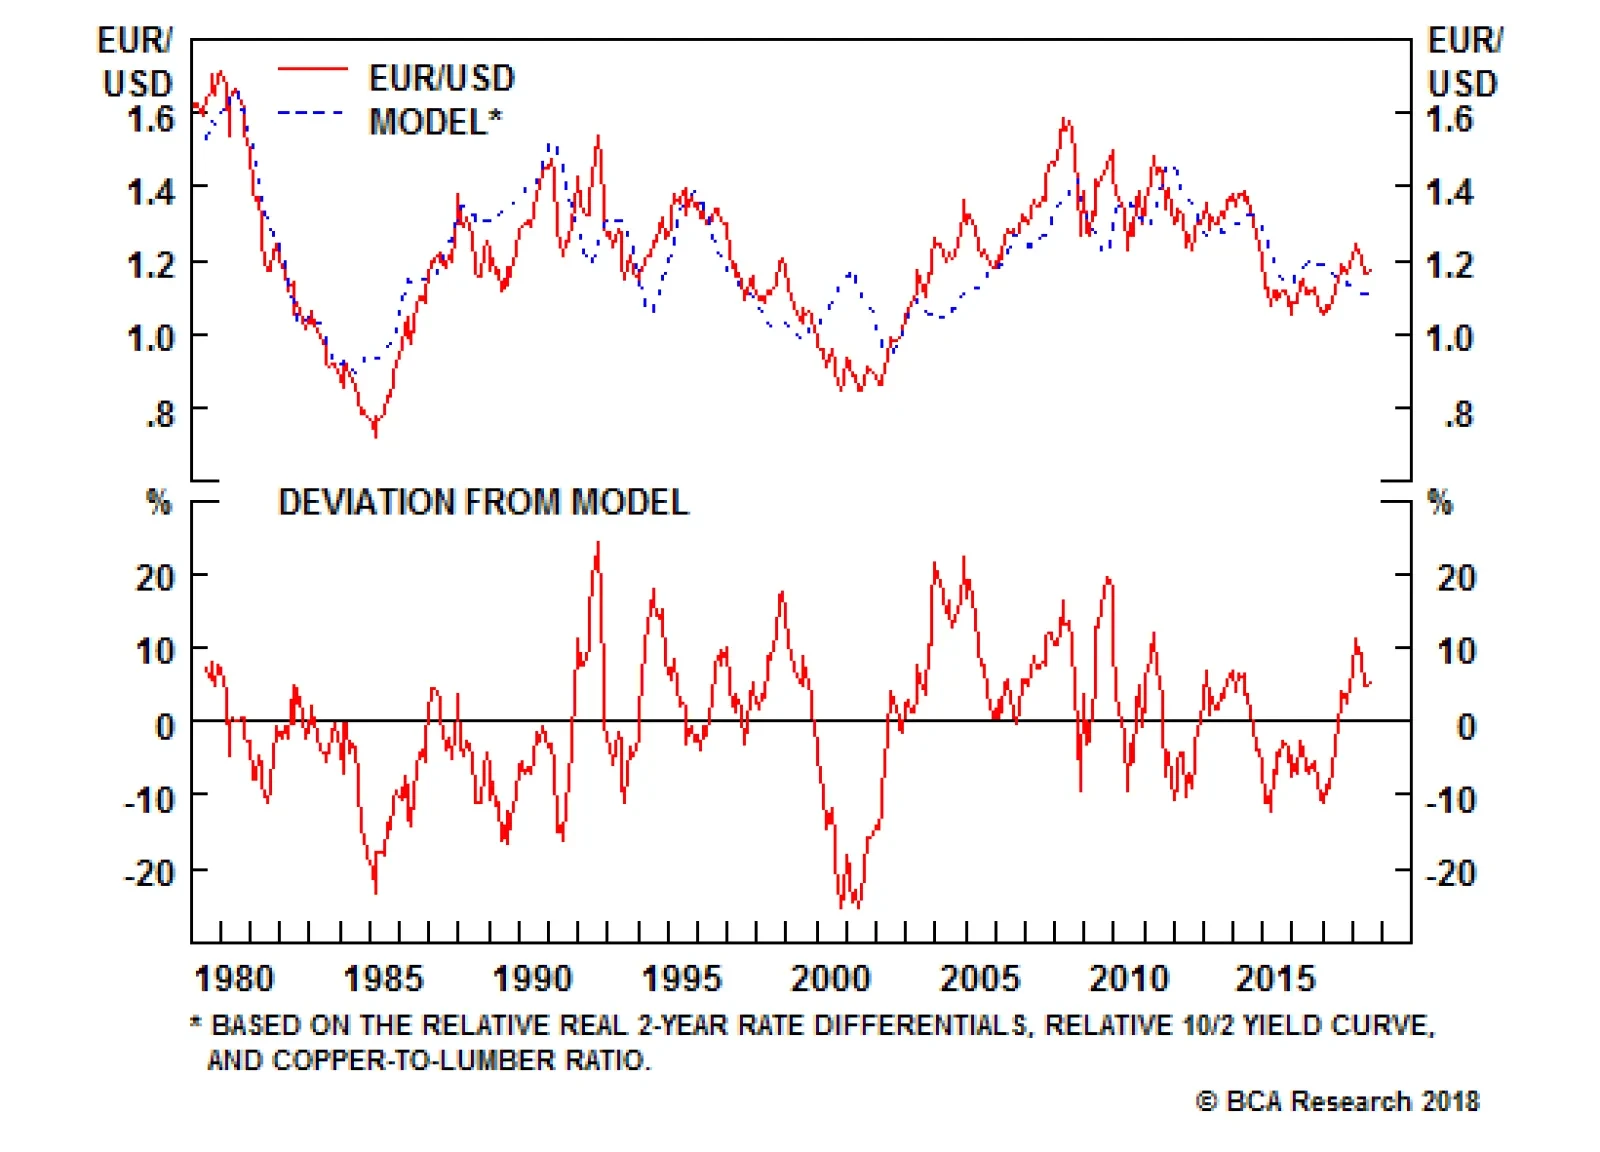
The euro has recently benefited from easing Italian political risk. The populist Five Star Movement / Lega Nord coalition is backing away from a budget confrontation with Brussels, as Italy's minister of finance wants a 2% budget deficit and its Deputy Prime…