Europe

Deflationary pressures and weak core Europe growth support CE3 bond longs as rate cuts loom. The Czech and Hungarian central banks held rates steady at 3.5% and 6.5% this week, following Poland’s earlier decision to keep rates unchanged at 5.25%. While citing…
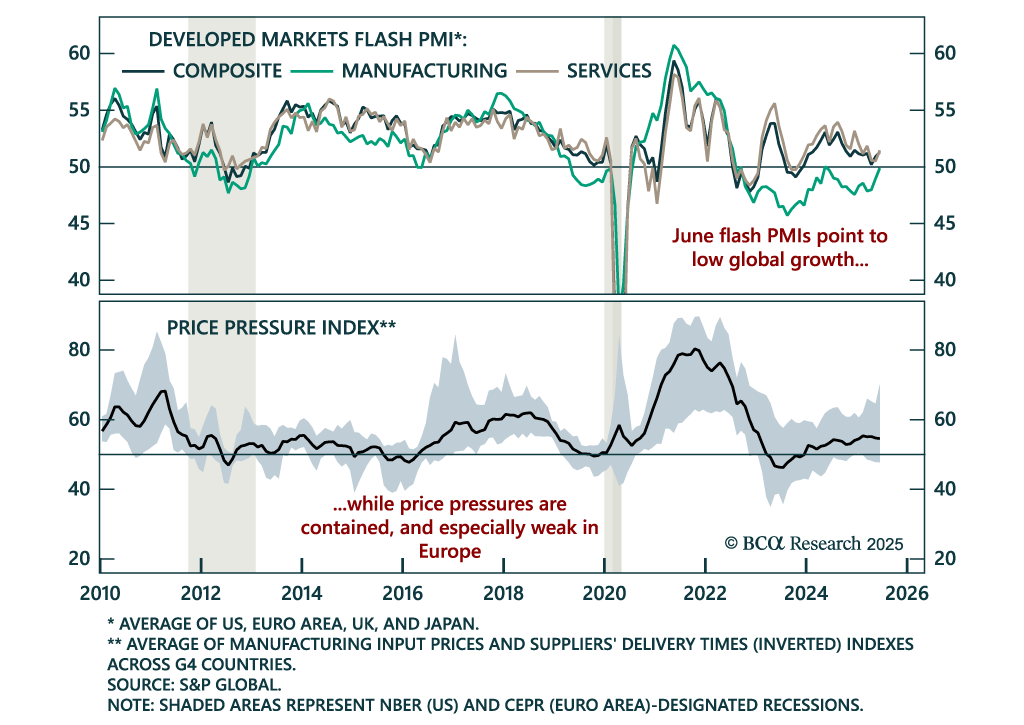
June PMIs confirm low global growth and support a long duration stance as price pressures remain contained. The flash PMIs were mixed across DMs: Sideways in the US and euro area, but firmer in the UK and Japan. Yet the overall message remains one of subdued…
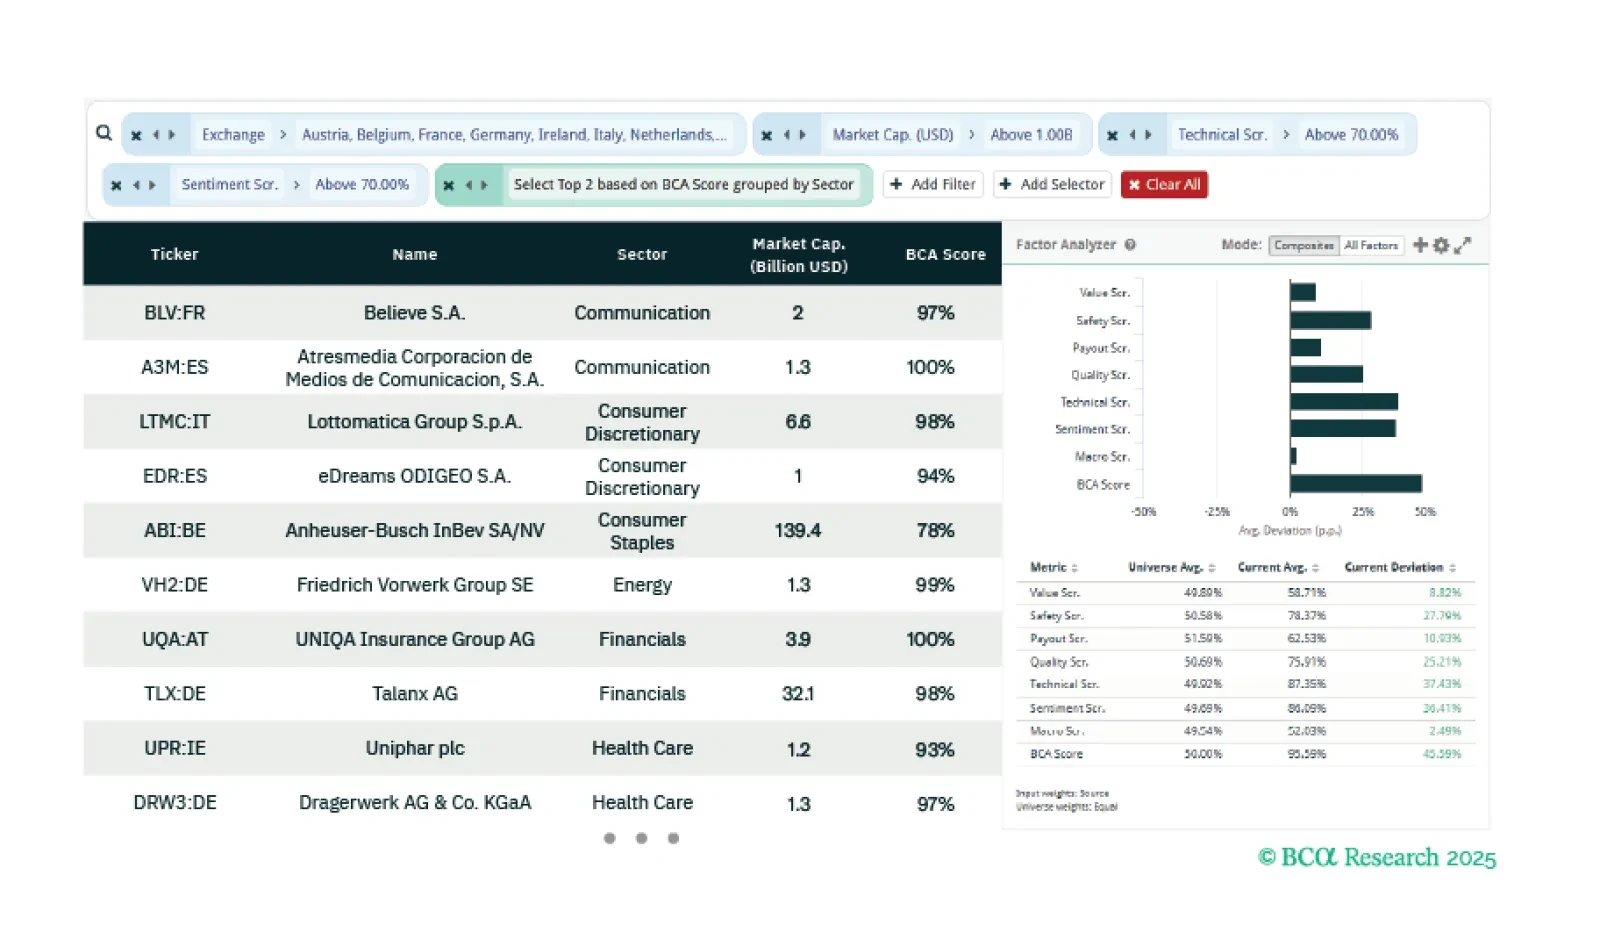
This week our three screeners explore: Equity trades across the Euro Zone focusing on Technicals and Sentiment; US Oil, Gas and Fuel stocks; and European Small Caps.
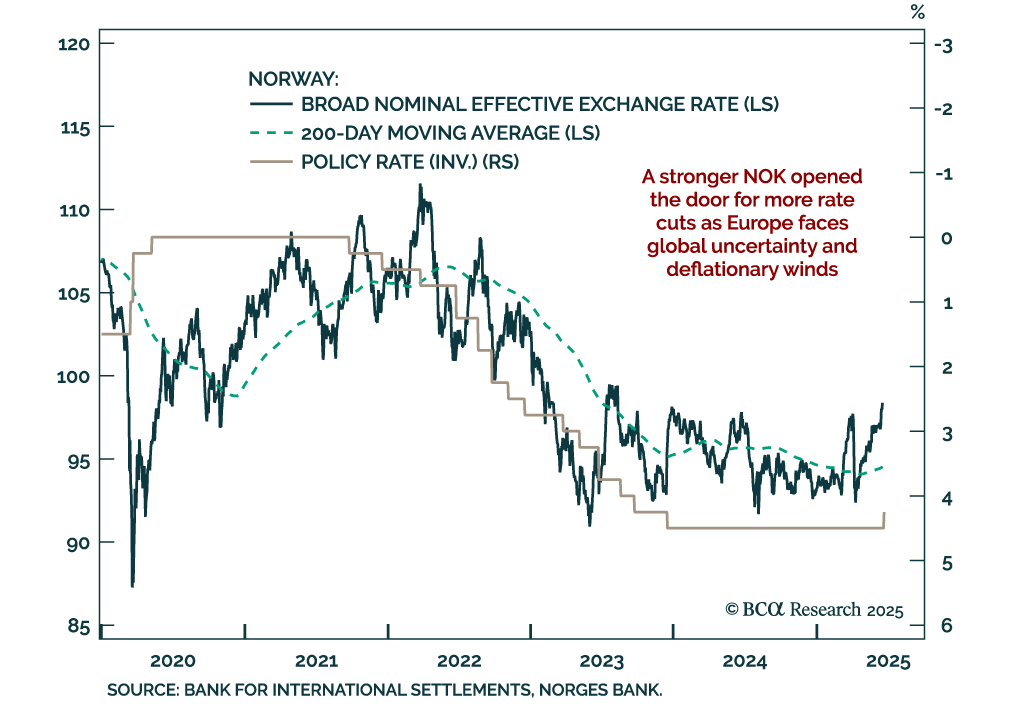
A stronger Norwegian krone has opened the door to more rate cuts, making Norwegian government bonds more attractive. Our Chart Of The Week comes from Jeremie Peloso, European Strategist. With its surprise 25 basis point cut, the Norges Bank made its first…

UK disinflation and labor market softening support our overweight in Gilts and short GBP trade. UK CPI came in slightly hotter than expected in May, with headline inflation at 3.4% y/y (vs. 3.5% in April) and core CPI meeting expectations at 3.5%, down from…
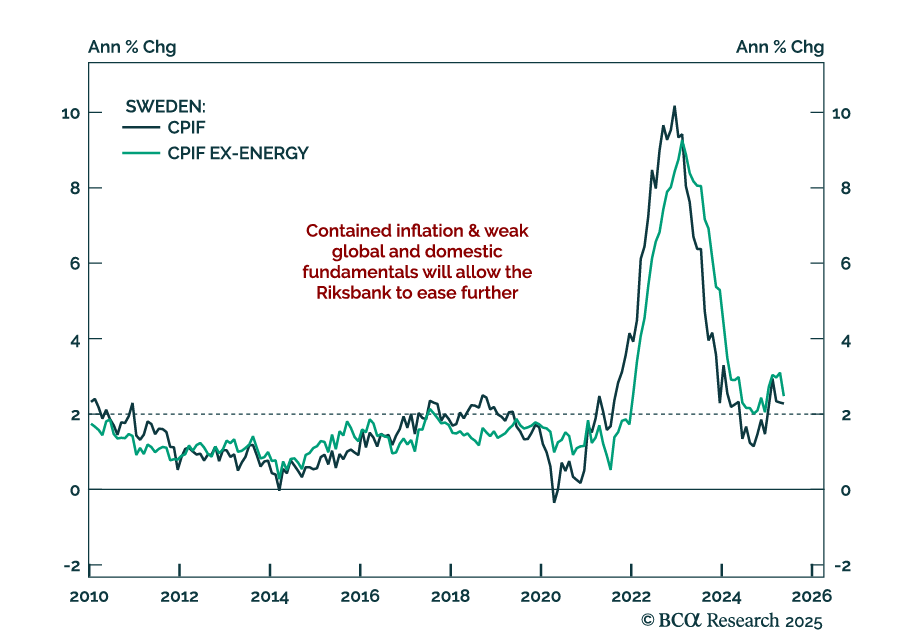
Sweden’s economic fragility and disinflation support further easing, reinforcing our long SEK rates and NOK/SEK trades. The Riksbank cut rates by 25 bps to 2.0% and projected an additional cut, consistent with prior OIS pricing. Forecasts for both headline…
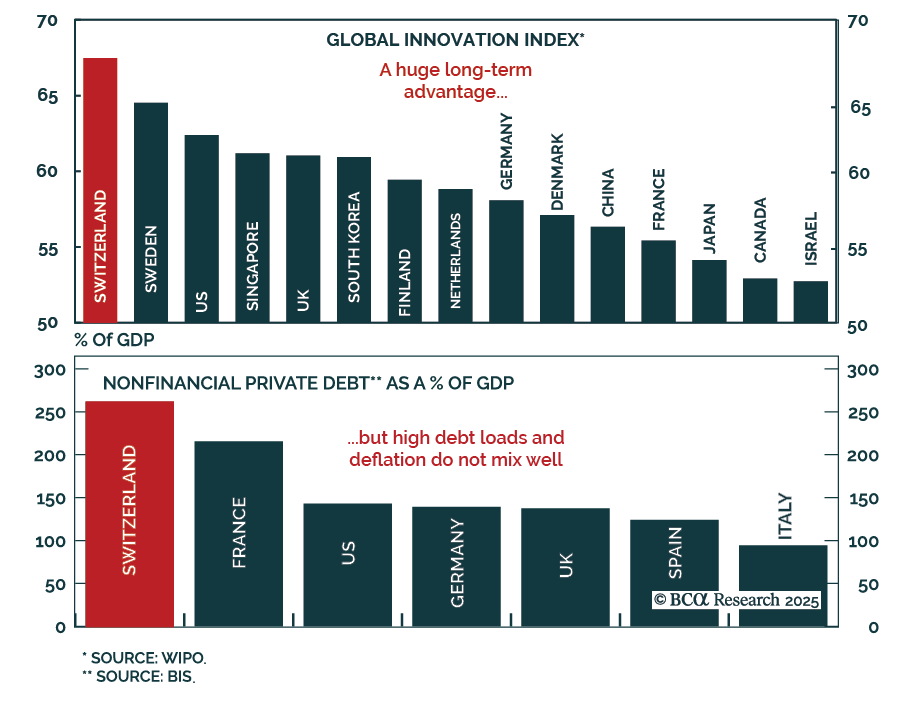
Our European Investment strategists believe Switzerland is no longer a tactical haven and recommend underweighting CHF and Swiss equities in favor of Swiss bonds. The country retains strong structural fundamentals: High productivity, innovation, robust…
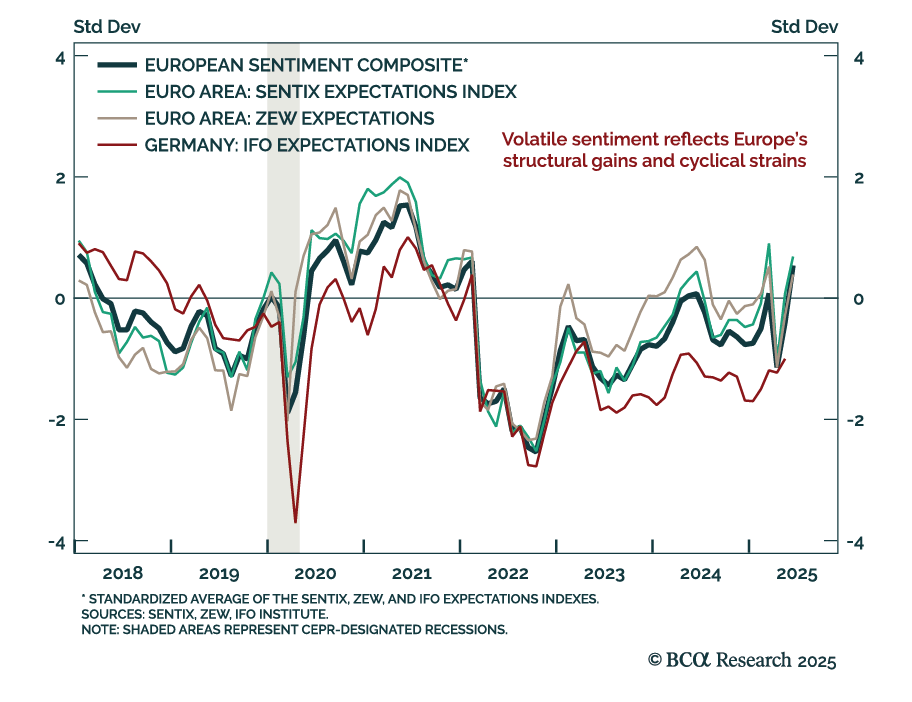
ZEW expectations jumped in May, but underlying macro fragility supports a cautious stance on eurozone assets. The ZEW expectations index for the euro area rose to 35.3 from 11.6, with Germany also beating expectations. The current situation component improved…
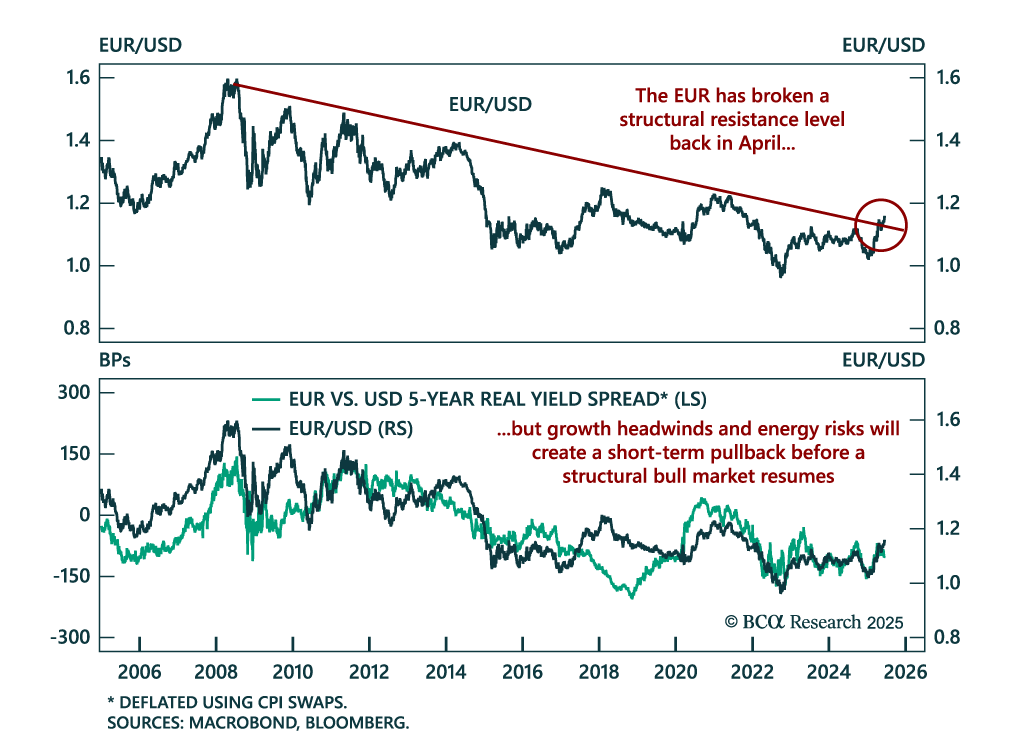
Short term euro upside is limited despite a structural bull case, as fragile growth, easing ECB policy, and geopolitical risks cap further gains. EUR/USD broke above structural resistance in April amid optimism over German stimulus and US political…
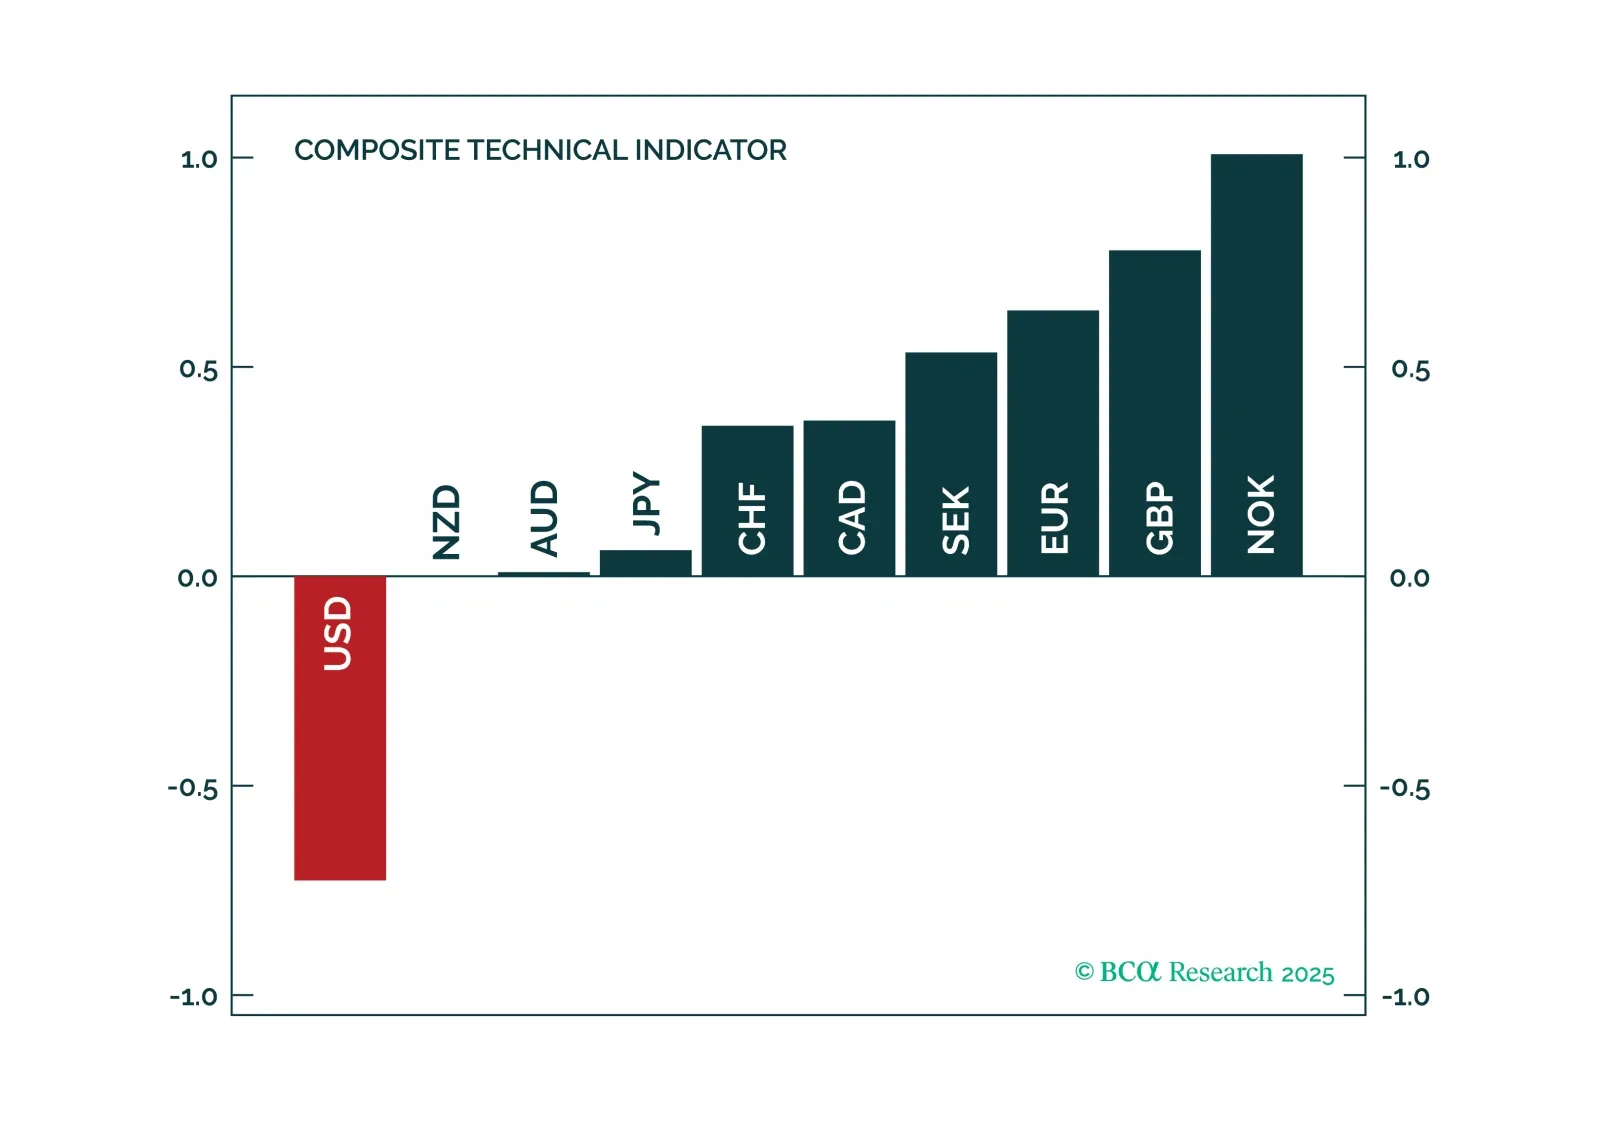
In this FX note, we provide a rationale for why it is important to pay attention to technical indicators, while still keeping your eyeball on the structural factors that drive currencies. This report answers the following questions: 1. Should you buy or sell the USD over a three-to-six month period from the pure lens of our proven technical indicators and 2. What are the best tactical cross trades among currencies.