Europe
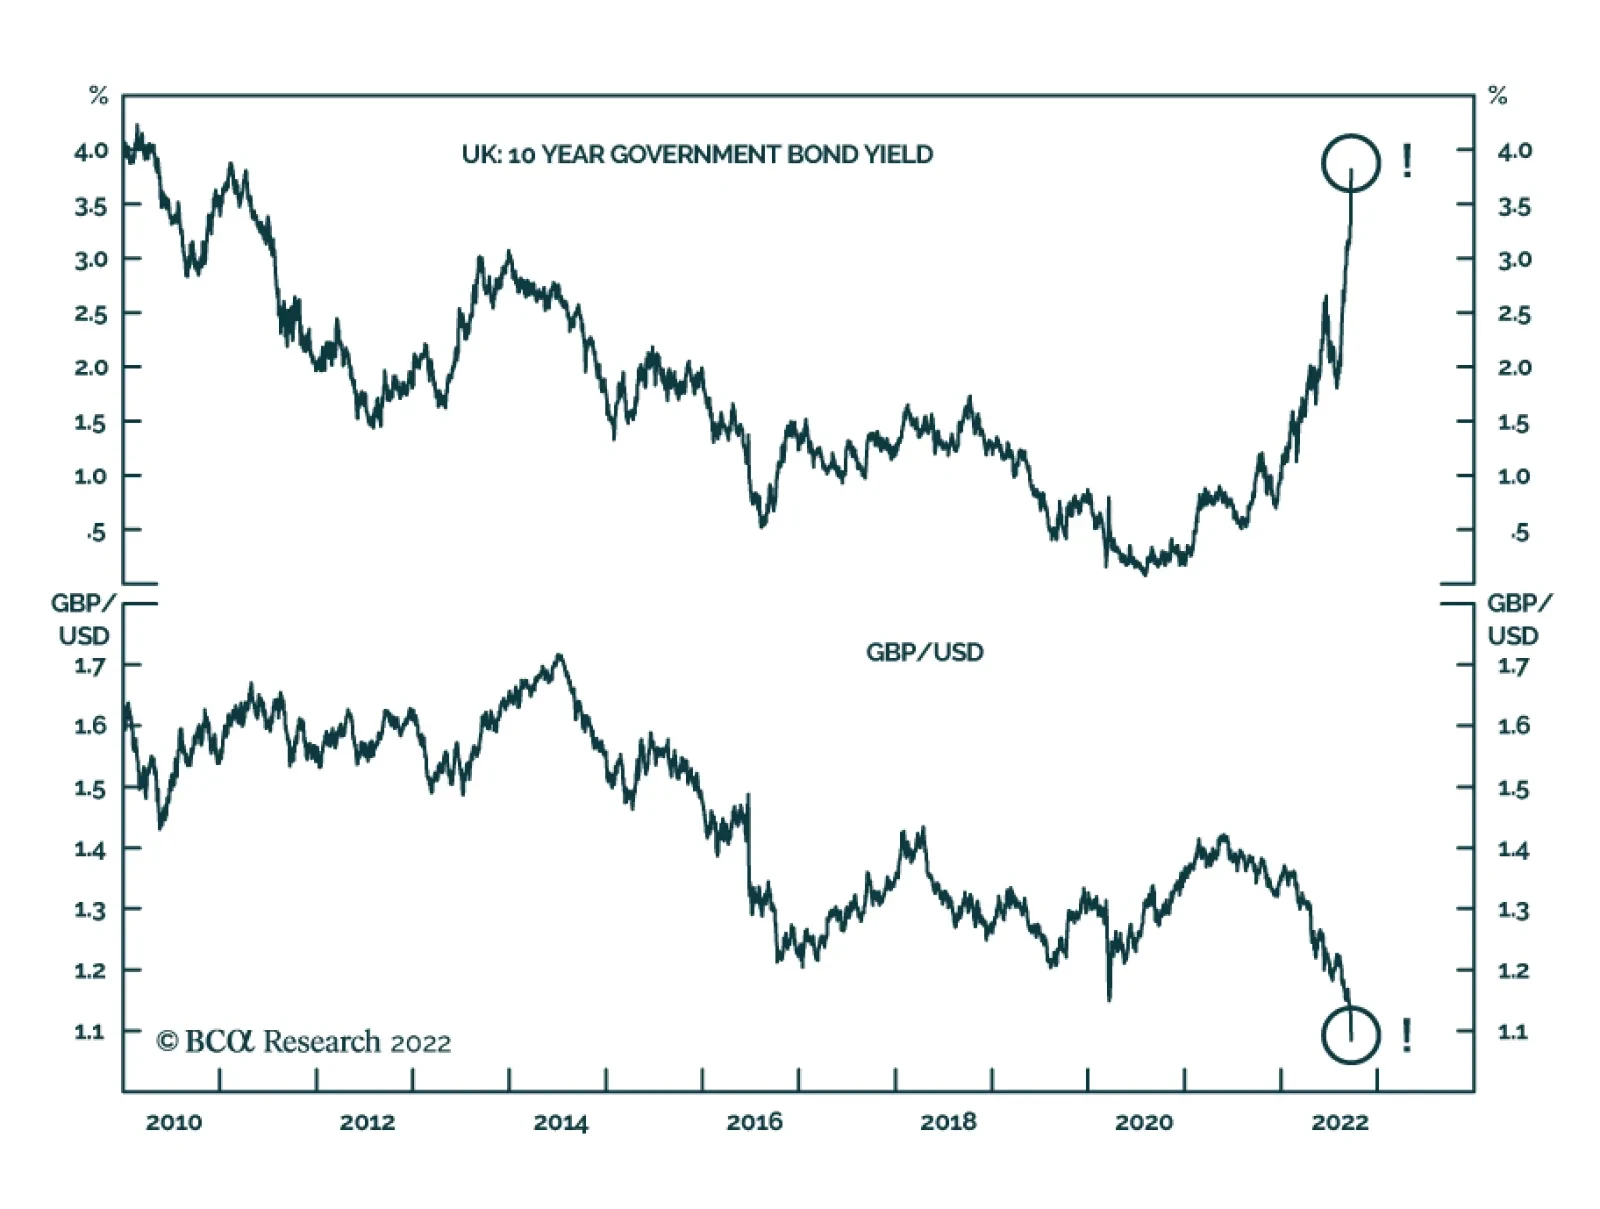
In its post-meeting statement on Thursday, the Bank of England highlighted that the MPC is prepared to “respond forcefully” to any changes to the inflationary outlook. On Friday, the new UK government unveiled a massive debt-financed package which includes…

Listen to a short summary of this report Executive Summary Sales & Profit Margins: The Two Propellers That Powered The Post-GFC US Rally
What Has Driven US Outperformance Post-GFC And Can This Persist?
What Has Driven US Outperformance Post-GFC And Can This Persist?
US equity markets underperformed the global benchmark by 10% over 2000-08. Since then, the US has outperformed the global benchmark by about 170%. So, what has driven the US’ chartbusting performance in the post-GFC period? If we break down the US’ price performance into three parts – namely price-to-earnings ratio, net profit margins, and sales – then it becomes clear that growth in the latter two elements played a key role in driving US outperformance in the post-GFC era. Can the US’ outperformance relative to global markets persist going forward? It appears unlikely that the US’ high profit margins can sustain these levels of growth going forward. Distinct from the mean reversion argument, the US’ high profit margins are unusually concentrated amongst a fistful of firms. US firms may also find it challenging to maintain high sales growth as US GDP growth slows and given that America’s antitrust philosophy may soon undergo a once-in-a-generation change. Finally, it is worth noting that ‘sector composition’ effects played a significant role in driving US outperformance over 2008-22. Given that we expect outperforming sectors like Tech to become underperformers, this effect could become weaker going forward, thereby subverting another source of the US’ outperformance. Bottom Line: Forecasting is a tenuous science but given that the two prime propellers of the US’ performance engine are likely to confront headwinds going forward, investors should consider reducing allocations to US equities over a longer term, strategic horizon. Dear Client, I am meeting clients in Asia this week while also working on our Fourth Quarter Strategy Outlook, which will be published next week, followed by my webcast the week after. In lieu of our regular report this week, you are receiving a Special Report from my colleague, Ritika Mankar, discussing the sources of US equity outperformance over the past 14 years and the likely path ahead. Best Regards, Peter Berezin, Chief Global Strategist US Stock Market Dominance – It Wasn’t Always This Way Let us assume that you could travel back in time, and today was December 31, 2008. On this day you know that US and Japanese equity markets have underperformed the global benchmark (Chart 1). You also know that Europe (i.e., EU-27) has done marginally better than the US, while Emerging Markets (EM) have been the star outperformer. Let us further assume that by close of play today you have to deploy US$10bn across these four equity markets (across the US, Europe, Japan, and EM). As if the task of taking this decision on the last day of this historic year was not enough, let us assume that the funds you invest must be locked in until the fall of 2022. Finally, let us add one more condition to this task – let us suppose that you have no idea how markets would perform over the 2008-22 period, but you have perfect foresight about how the nominal GDP of these four regions would look like in 2022. Specifically, you know that EM GDP will have a terrific run between 2008 to 2022, US GDP will increase but by a far less impressive degree, European GDP will grow only slightly, and Japan’s GDP would be lesser in 2022 than it was in 2008 (Chart 2). Chart 1US Equities Underperformed The Global Benchmark By 10% Over 2000-08
US Equities Underperformed The Global Benchmark By 10% Over 2000-08
US Equities Underperformed The Global Benchmark By 10% Over 2000-08
Chart 2EM GDP Has More Than Doubled Since The GFC
What Has Driven US Outperformance Post-GFC And Can This Persist?
What Has Driven US Outperformance Post-GFC And Can This Persist?
Chart 3US Equities Outperformed The Global Benchmark By About 170% Over 2008-22YTD
US Equities Outperformed The Global Benchmark By About 170% Over 2008-22YTD
US Equities Outperformed The Global Benchmark By About 170% Over 2008-22YTD
If you were to take an investment decision based only this information, what is certain is that the fund you manage would underperform by a painful degree. This is because we now know that even though US markets had poor momentum in 2008, and the US’ GDP expansion paled relative to EM, US equity markets outperformed global markets by a wide margin since 2008 (Chart 3). On the other hand, despite positive momentum and high GDP growth, EM emerged as a distant second-best performer. Japan miraculously made it to third place despite a contraction in nominal GDP, and finally Europe ended up being the worst performer. If market momentum and GDP growth cannot explain these market movements, then what drove the US' outstanding performance in the post-GFC period? In this Special Report, we delve into answering this question in detail. The purpose of peeling the onion of the US' performance is simple – we hope to extract the insights that investors need to construct alpha-generating portfolios, in a world where forward time travel is not a possibility (yet). The US’ Performance Has Been Powered More By Earnings, Less By Valuations The two basic building blocks of any equity index are its earnings and its price-to-earnings ratio. The former captures the fundamentals backing an index, while the latter quantifies the valuation element. Breaking down the US’ performance into these two parts shows that earnings have been the prime factor that have propelled the rise of US equity markets in the post-GFC era (Chart 4). That earnings have been an important driver of the US’ outperformance becomes even more apparent when US earnings are compared to that of other major markets. For instance, the steep expansion in US earnings contrasts with the situation across the Atlantic. In Europe, earnings have trended lower relative to the global benchmark since 2008 and an increase in relative valuations has helped lend a floor to the index (Chart 5). The earnings report card for Japan and EM, on the other hand, have been surprisingly similar as earnings failed to rise meaningfully in both these geographies in the post-GFC period (Chart 6 and 7). Chart 4Earnings Have Played A Key Role In Propelling The Post-GFC US Rally
What Has Driven US Outperformance Post-GFC And Can This Persist?
What Has Driven US Outperformance Post-GFC And Can This Persist?
Chart 5European Equities Supported More By Valuation Multiples
What Has Driven US Outperformance Post-GFC And Can This Persist?
What Has Driven US Outperformance Post-GFC And Can This Persist?
Chart 6Earnings Growth Has Been Unimpressive In Japan Too
What Has Driven US Outperformance Post-GFC And Can This Persist?
What Has Driven US Outperformance Post-GFC And Can This Persist?
Chart 7Earnings Have Trended Lower In EM Since 2008
What Has Driven US Outperformance Post-GFC And Can This Persist?
What Has Driven US Outperformance Post-GFC And Can This Persist?
In summary, the US' price-to-earnings ratio has had a meaningful role in driving US outperformance in the post-GFC period (Chart 8), but earnings expansion has played an outsized role (Chart 9). Chart 8Relative Valuation Multiples Have Played A Key Role In Supporting European Markets
What Has Driven US Outperformance Post-GFC And Can This Persist?
What Has Driven US Outperformance Post-GFC And Can This Persist?
Chart 9Earnings Expansion In The US Has Been Phenomenal
What Has Driven US Outperformance Post-GFC And Can This Persist?
What Has Driven US Outperformance Post-GFC And Can This Persist?
In fact, the growth in earnings in the US in the post-GFC era has been so noteworthy that if US equity market prices were to be broken down into its two building blocks i.e., earnings and price-to-earnings ratio, then the lion’s share of US equity market prices today would be attributed to its earnings (Chart 10). Expectedly, this contrasts with the situation in Europe where equity market prices have managed to stay afloat owing to a re-rating in its price-to-earnings ratio (Chart 11). These attribution analysis numbers are not meant to be taken literally, but rather, reflect the relative role played by earnings and price-to-earnings ratios in supporting the prices of regional indices. Chart 10US Equities: Supported More By Earnings
What Has Driven US Outperformance Post-GFC And Can This Persist?
What Has Driven US Outperformance Post-GFC And Can This Persist?
Chart 11EU Equities: More Reliant On Multiples
What Has Driven US Outperformance Post-GFC And Can This Persist?
What Has Driven US Outperformance Post-GFC And Can This Persist?
The Unsung Hero Behind The US’ Outperformance - Record Sales Expansion The index of a region can also be envisaged as the product of three elements, namely: (1) its price-to-earnings ratio; (2) its net profit margins; and (3) its sales. In other words: Price = (Price / Earnings) x (Earnings / Sales) x (Sales) While the US' healthy earnings tend to attract disproportionate investor attention, this formulation shows how a surge in US sales was the bigger driver of US outperformance (Chart 12). US profit margins experienced a sharp surge relative to global profit margins over the 2008-12 period, but then this parameter flatlined. US sales, on the other hand, have managed to register a steady march upwards over the entirety of the post-GFC period. The growth in sales of listed American corporations has in fact been so remarkable that a grand total of ten American firms now have annual sales of over $200 billion – which marks an all-time high for the US (Chart 13). Chart 12Post-GFC US Rally Powered By Record Sales Expansion
What Has Driven US Outperformance Post-GFC And Can This Persist?
What Has Driven US Outperformance Post-GFC And Can This Persist?
Chart 13The US Is Home To Ten Firms With Revenues Of +$200bn
What Has Driven US Outperformance Post-GFC And Can This Persist?
What Has Driven US Outperformance Post-GFC And Can This Persist?
Furthermore, the US’ lead on sales today is meaningful not only by its own historical standards, but by cross-country standards too. The rise in US sales has meant that the US is now home to half of the twenty largest listed corporations globally (Table 1). Conversely, Europe and Japan, despite being the third and fourth largest economies of the world, respectively, together account for only three names on this list. Notably however, Emerging Markets have managed to punch above their weight and are home to six of the top twenty firms by sales globally. Table 1The US Today Dominates The Global List Of Top 20 Firms By Revenue
What Has Driven US Outperformance Post-GFC And Can This Persist?
What Has Driven US Outperformance Post-GFC And Can This Persist?
The steep rise in America’s sales in the post-GFC world is also unique because no other major market has experienced such a clear upward move in sales as the US has. Europe and Japan in fact saw their sales-per-share trend downwards in the post-GFC period (Chart 14 and Chart 15). Emerging markets were the only other major global market where sales-per-share managed to stay steady relative to the global benchmark (Chart 16). Chart 14Europe’s Sales Have Trended Lower Post-GFC
What Has Driven US Outperformance Post-GFC And Can This Persist?
What Has Driven US Outperformance Post-GFC And Can This Persist?
Chart 15Japan’s Sales Also Trended Lower Post-GFC
What Has Driven US Outperformance Post-GFC And Can This Persist?
What Has Driven US Outperformance Post-GFC And Can This Persist?
Finally, thanks to the high growth in US sales, the contribution of sales to US equity prices is far higher than the contribution of its net profit margins or its price-to-earnings ratio (Chart 17). This once again is in sharp contrast to a market like Europe, where only a smidgeon of the European equity prices pie can be attributed to its sales. Chart 16EM Sales Have Expanded Marginally Post-2008
What Has Driven US Outperformance Post-GFC And Can This Persist?
What Has Driven US Outperformance Post-GFC And Can This Persist?
Chart 17The Main Engine That Powers US Markets Is ‘Sales’
What Has Driven US Outperformance Post-GFC And Can This Persist?
What Has Driven US Outperformance Post-GFC And Can This Persist?
Chart 18US Profit Margins Have Also Been Expanding Steadily Post-GFC
What Has Driven US Outperformance Post-GFC And Can This Persist?
What Has Driven US Outperformance Post-GFC And Can This Persist?
Distinct from the role played by growing sales, the US’ stellar post-GFC performance has also been powered by growing profit margins. It is notable that the US has experienced an unusually strong upward movement in its profit margins in the post-GFC period (Chart 18). Japan is the only other region which has seen its profit margins expand post-GFC, with both Europe and EM having experienced a fall in profit margins from the levels seen in 2008. A Quick Note On Dividends: The US Lags On Dividend Yields But Leads On Buybacks Thus far we have focused on the returns generated by the US market relative to the world and the factors that drove US outperformance since the GFC. If one were to focus on the dividend yield component, then it is notable that the US lags its peers on this front. Post-GFC, the first major cresting of dividend yields globally took place in 2009-10. Then the next major move down in yields took place in 2020 (Chart 19). While globally, yields have now recovered from this last dip, the US finds itself lagging on this metric which matters for pension funds that rely on annuities (Chart 20). Not only have dividend yields in the US almost halved since the GFC, but the gap between dividend yields offered by the US and other markets has widened over the last few years. Europe however has managed to stay the undisputed leader when it comes to dividend yields through most of the 21st century. Chart 19Global Dividend Yields Have Recovered From The Post-2020 Fall
What Has Driven US Outperformance Post-GFC And Can This Persist?
What Has Driven US Outperformance Post-GFC And Can This Persist?
Chart 20US Lags Global Markets On Dividend Yields
What Has Driven US Outperformance Post-GFC And Can This Persist?
What Has Driven US Outperformance Post-GFC And Can This Persist?
Chart 21Pace Of Buybacks In The US Has Been Meaningful
Pace Of Buybacks In The US Has Been Meaningful
Pace Of Buybacks In The US Has Been Meaningful
Notably, however, while the US lags its peers on dividend yields, it leads when it comes to buybacks. The latter is evident from the fact that proxy measures of shares outstanding have trended lower in the US in the post-GFC period, as compared to the rest of the world (Chart 21). Finally, it is important to note that both the growth in dividends-per-share as well as the absolute level of dividends in the US has been high. This parameter has increased by 2.4 times since 2008 and US dividends in absolute terms are nearly 5 times that of Europe’s dividends today. The only reason why dividend yields have stayed low despite this is because US equity prices have had a stellar run in the post-GFC period. Can This Extent Of US Outperformance Persist? Having delved into the drivers of the US’ performance, we now know that a record expansion in sales and net profit margins have driven its outstanding performance in the post-GFC era. This in turn means that the probability of the US continuing to outperform over the next few years will be closely linked to its ability to maintain a lead on these two parameters. So how is the US positioned with respect to both these factors? The US’ High Profit Margins Appear Unsustainable, For A Wide Range Of Reasons We have established the fact that expanding profit margins have been a supporting driver of the US’ outperformance in the post-GFC period. Now, the consensus view is that US profit margins are extraordinarily high and that they will eventually come down to earth. The logic for this argument is often grounded in mean reversion. We have also previously highlighted that most of the increase in US profit margins has occurred due to rising margins within the tech sector and the accompanying increase in the market cap weight of tech within benchmark indices. Chart 22US High Profit Margins Are Concentrated Amongst Top Firms
What Has Driven US Outperformance Post-GFC And Can This Persist?
What Has Driven US Outperformance Post-GFC And Can This Persist?
Aside from these reasons, two more factors could lead to the compression of US profit margins over the next few years. Firstly, it is worth noting that the US' high profit margins are unusually concentrated amongst a handful of firms. While the US as a market is characterized by high margins at the headline level, profit margins of companies below the top tier are notably lower than that of the top tier (Chart 22). If profit margins were uniformly high across the US listed space and the divergence was low, then the probability of sustaining elevated margins would have been higher. But given that the US uniquely suffers from a high profit margin concentration problem, the probability of the sustainability of US high profit margins appears lower. Secondly, history suggests that in the globalized world that we live in, any region’s profit margins fail to persist above the global average beyond a maximum of 15 years (Table 2). This makes sense and is in line with economic theory which suggests that when profitability in a particular market is excessive, then new firms will enter this space, increase competition, and thereby exert downward pressure on the incumbents’ profit margins. Table 2Regional Profit Margins Seldom Persist Above The Global Average Beyond 15 Years
What Has Driven US Outperformance Post-GFC And Can This Persist?
What Has Driven US Outperformance Post-GFC And Can This Persist?
Given that US profit margins have now persisted above global levels for almost 13 years, if history were to repeat itself, then it appears highly likely that US profit margins would trend towards the global average over the next 2 years. US Sales Growth: A Peak Appears Nigh We now know that the rapid sales expansion experienced by US firms has been the prime driver of the US stock market outperformance since the GFC. However, the prognosis for this variable also appears shaky for the US. Chart 23US GDP And Sales Tend To Move In Lockstep
What Has Driven US Outperformance Post-GFC And Can This Persist?
What Has Driven US Outperformance Post-GFC And Can This Persist?
The key macro variable which has the tightest theoretical link to the sales generated by the companies in a country is the country’s nominal GDP. Even as companies headquartered in the US end up selling to the global economy, history suggests that the link between the US’ nominal GDP and the sales generated by listed American firms are closely linked (Chart 23). Given that the pace of US nominal GDP growth is set to slow over the next few years (relative to both its past and relative to other major economies), US companies’ sales growth could end up slowing too (Chart 24). Also, given that the US revenue-to-nominal GDP ratio is already elevated, it is likely that even as the US’ nominal GDP keeps growing, the pace of conversion of this GDP into revenues will stay the same or may even diminish over the coming decade. Chart 24US GDP Growth Is Set To Slow
What Has Driven US Outperformance Post-GFC And Can This Persist?
What Has Driven US Outperformance Post-GFC And Can This Persist?
Then from a bottom-up perspective, we are also of the view that the US economy’s ability to spawn mega-sized companies (by sales) may become increasingly compromised over the next decade. This is because a peculiar stagnation is in the works in the middle tier of American firms, which tend to become the mega-sized corporations of tomorrow. Finally, the US' antitrust philosophy is likely to undergo a once-in-a-generation change under the Biden administration. This could mean that America’s mega-scaled firms (which have had a free run up until now) could end-up baiting regulatory attention, restricting their ability to grow sales. US Price Performance: Strong Sector Effects Are Unlikely To Persist Chart 25Sector Composition Effect: Strongest For The US
What Has Driven US Outperformance Post-GFC And Can This Persist?
What Has Driven US Outperformance Post-GFC And Can This Persist?
Lastly, it is worth noting that the price performance of the broad US equity index subverts the role played by “sector composition” in driving the US' outperformance. The fact that returns generated by the US benchmark are higher than the returns generated by a hypothetical US index which weights all sectors equally suggests that “sector composition” effects had a meaningful role in driving US outperformance. In fact, as compared to other major markets, the sector composition effect is the most prominent for the US (Chart 25). Another way of quantifying the role of sector effects is to compare the US’ market cap expansion relative to a global benchmark after removing the market cap of top-performing sectors. Expectedly, US outperformance relative to the global benchmark over the post-GFC period gets substantially reduced if the market cap of the three top-performing sectors (namely Information Technology, Consumer Discretionary, and Health Care) is adjusted for (Chart 26). To complicate matters, the sector composition effect in the US has been unwinding but remains high (Chart 27). Given that we expect outperforming sectors like Tech to turn into underperformers, the sector constitution effect in the US could weaken going forward, thereby subverting another source of US outperformance. Chart 26Extent Of US Outperformance Weakens Sans Tech, Consumer Discretionary, And Health Care
What Has Driven US Outperformance Post-GFC And Can This Persist?
What Has Driven US Outperformance Post-GFC And Can This Persist?
Chart 27Sector Composition Effect In The US Remains High
What Has Driven US Outperformance Post-GFC And Can This Persist?
What Has Driven US Outperformance Post-GFC And Can This Persist?
Investment Conclusions The prime drivers of US outperformance relative to the global benchmark in the post-GFC period have been ascendant sales and rising net profit margins. Forecasting is a tenuous science but given that both these propellers of the US equity market engine are set to face headwinds, investors should consider reducing allocations to US equities over a longer term, strategic horizon. Ritika Mankar, CFA Editor/Strategist Ritika.Mankar@bcaresearch.com
As expected, the Bank of England raised the Bank Rate by 50bps to 2.25% on Thursday. Three of the nine MPC members preferred a more aggressive 75bp hike, while one member favored a more modest 25bp increase. The BoE noted that the recently announced Energy…
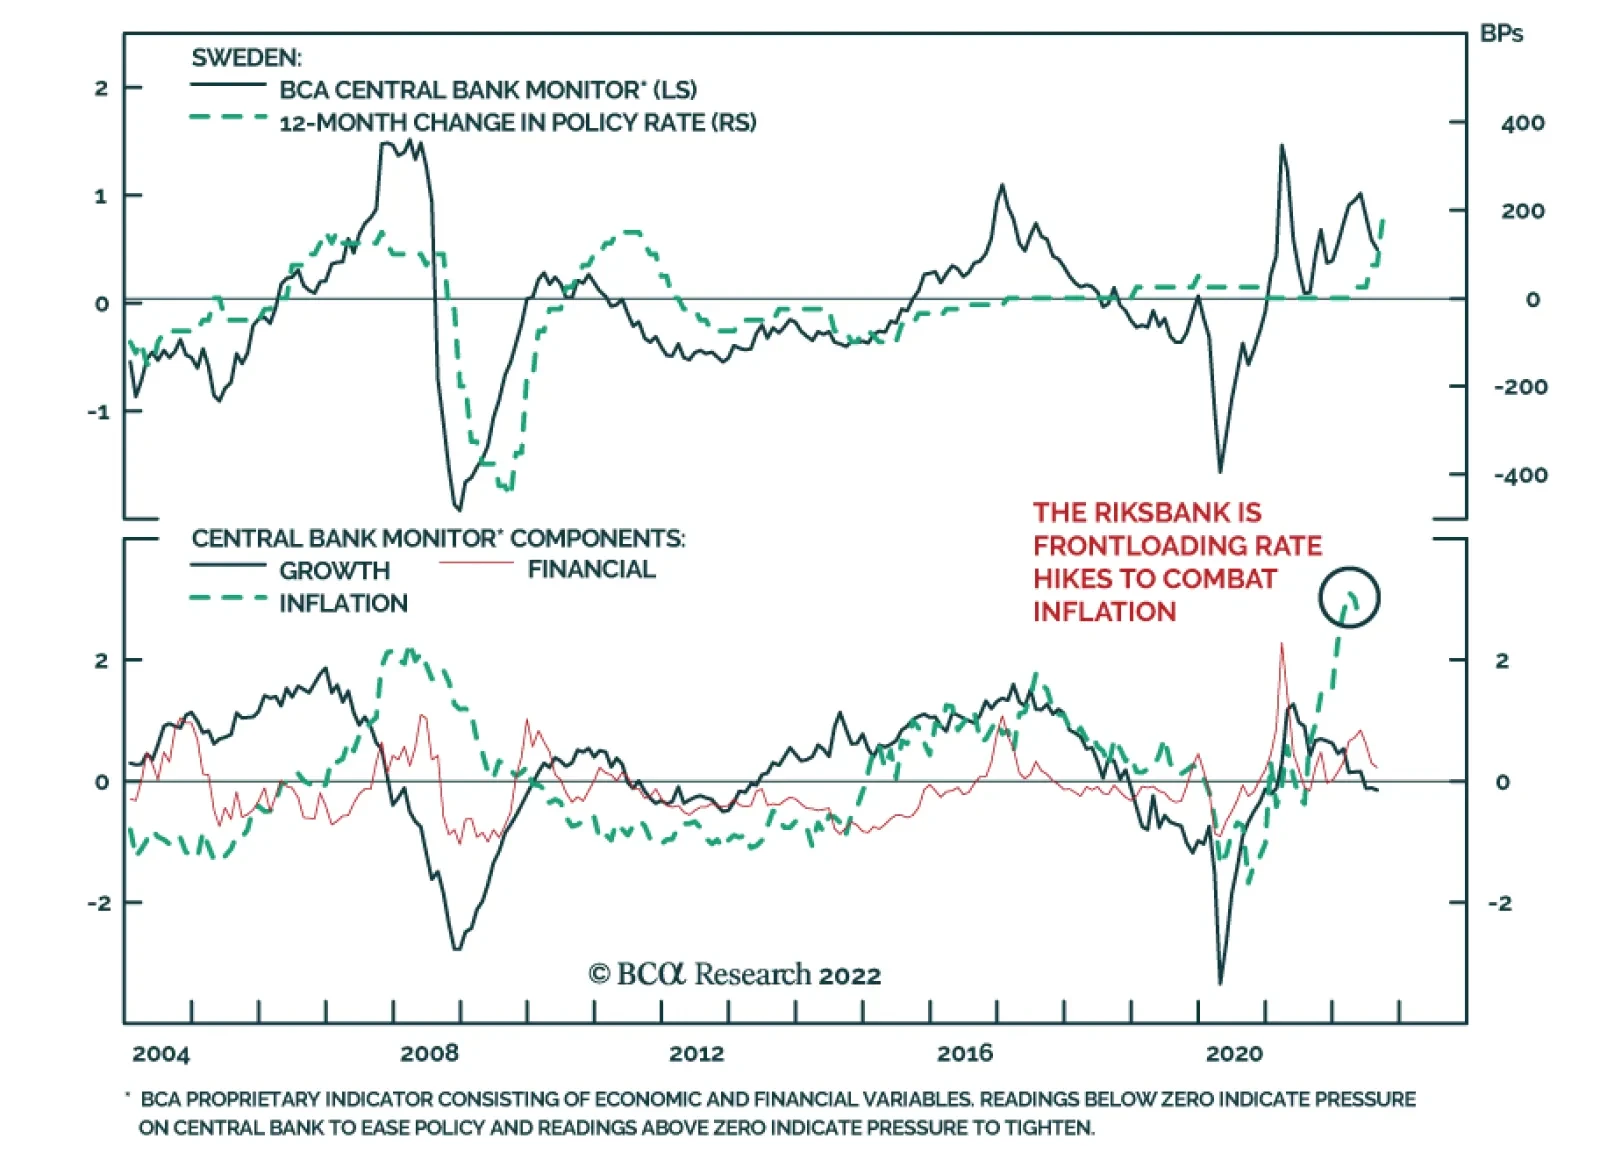
Sweden’s Riksbank hiked its policy rate by a full percentage point to 1.75% on Tuesday, a more aggressive move than the 75bp hike anticipated by the consensus. The central bank also revised up its policy rate forecast. It now expects the policy rate to…
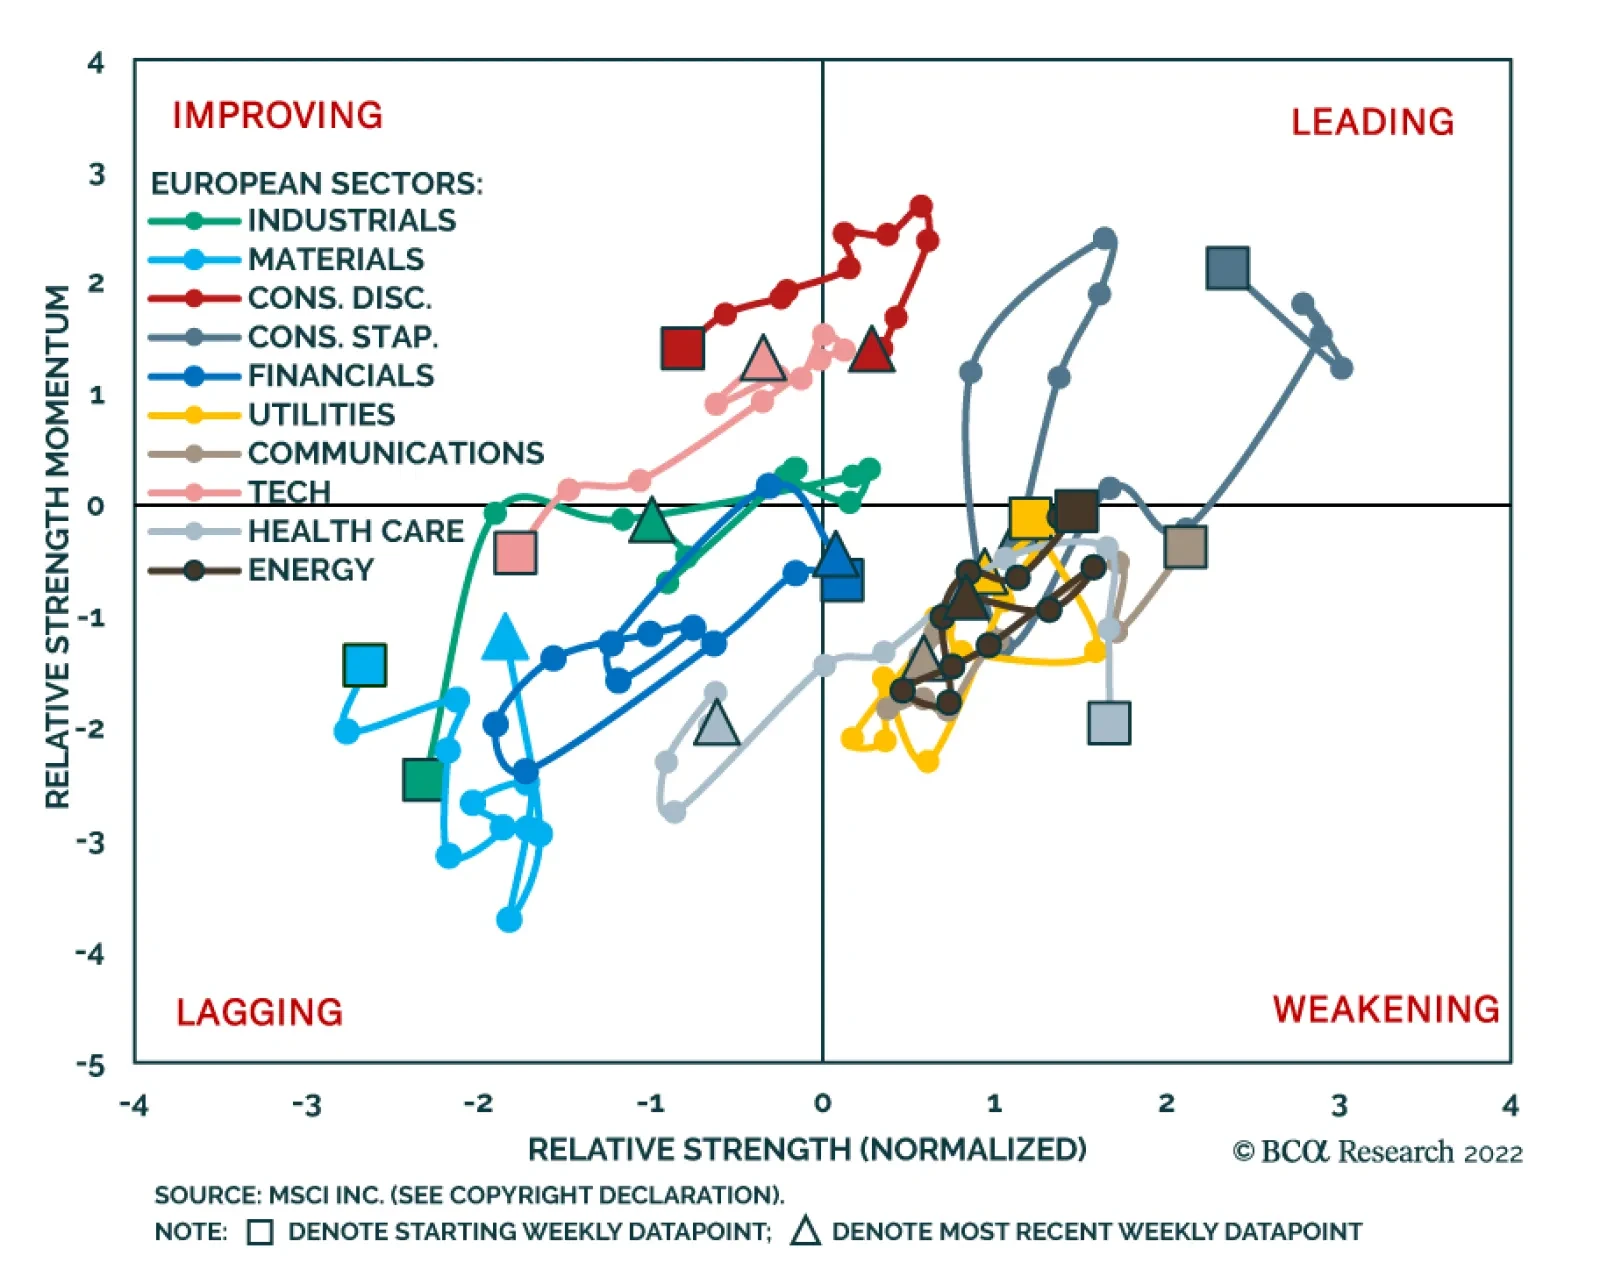
BCA Research’s European Investment Strategy service’s Rotation Maps framework suggests that the Euro Area energy sector stands out as a good underweight candidate in equity portfolios over the next twelve months, especially relative to industrials. The…
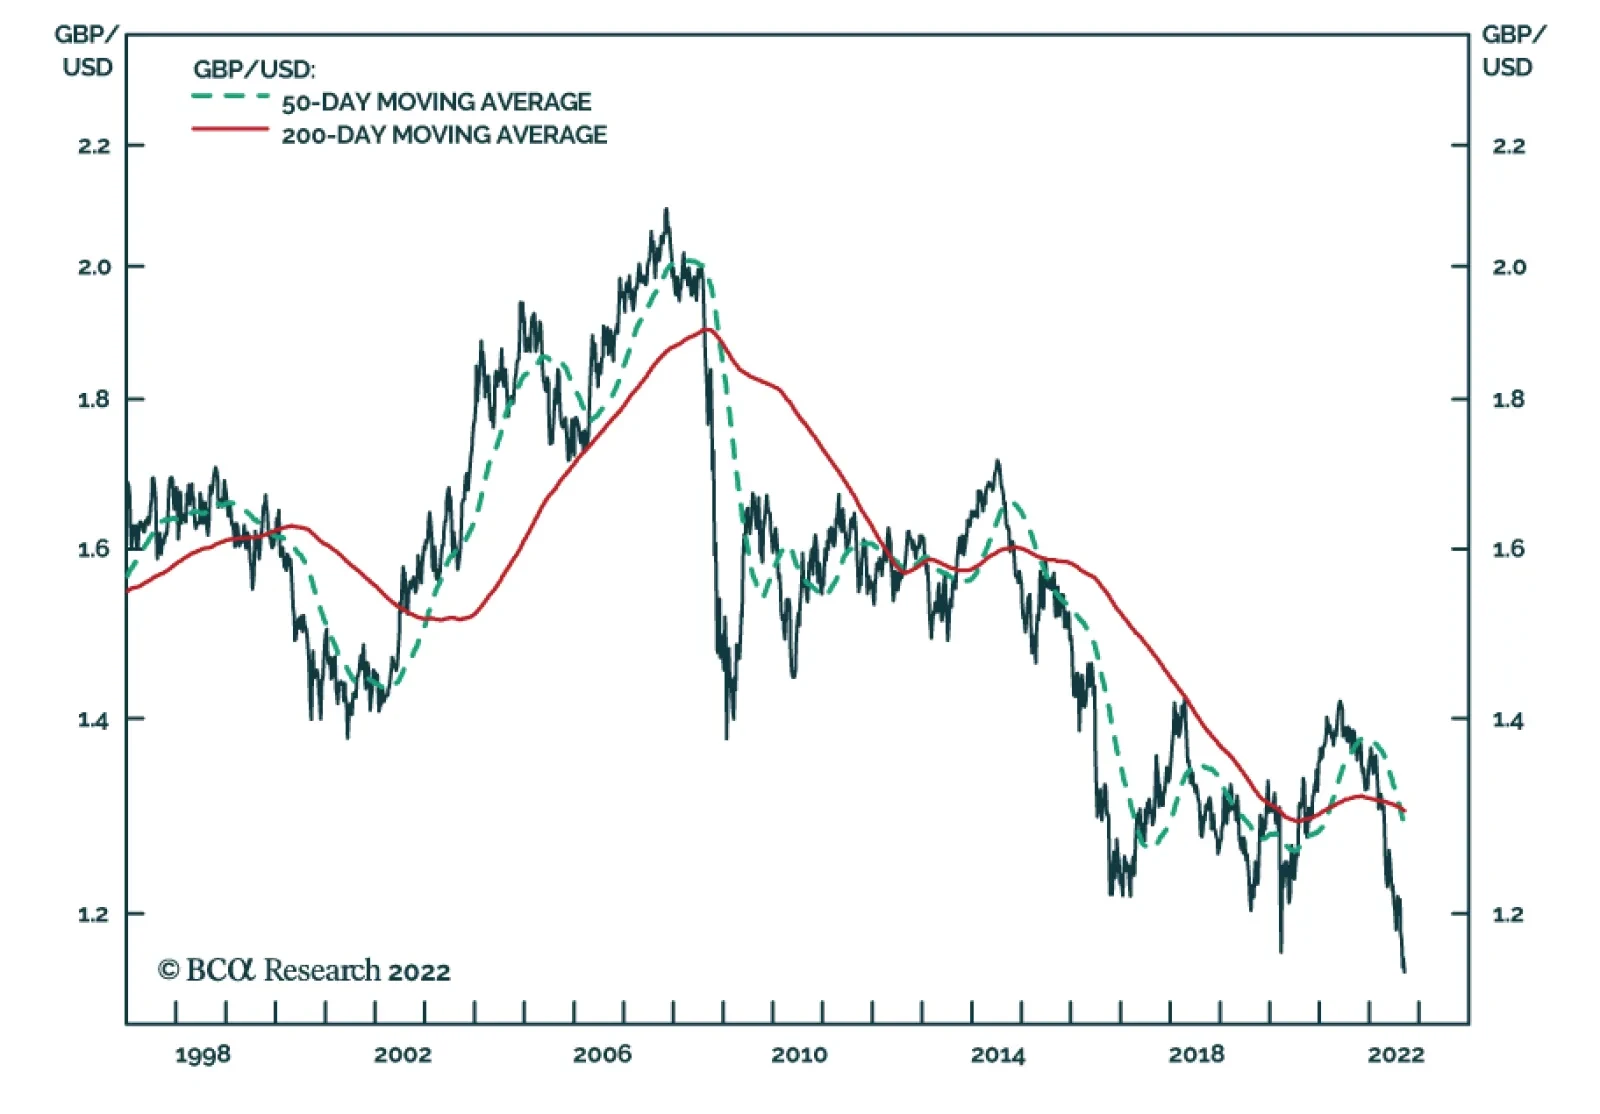
Cable fell below 1.14 in intra-day trading on Friday (incidentally, the 30th anniversary of Black Wednesday). Though it recovered some of the losses, it ended the week at a 37-year low. New evidence that the UK economy is struggling was the proximate cause…
Executive Summary The US inflation surprise increases the odds of both congressional gridlock and recession, which increases uncertainty over US leadership past 2024 and reduces the US’s ability to lower tensions with China and Iran. Despite the mainstream media narrative, the Xi-Putin summit reinforces our view that China cannot reject Russia’s strategic partnership. The potential for conflict in Taiwan forces China to accept Russia’s overture. For the same reason the US and China cannot re-engage their economies sustainably, even if Biden and Xi somehow manage to reduce tensions after the midterm elections and twentieth national party congress. Russia could reduce oil exports as well as natural gas, intensifying the global energy shock. Ukraine’s counter-offensive and Europe’s energy diversification increase the risk of Russian military and economic failure. The Middle East will destabilize anew and create a new source of global energy supply disruptions. US-Iran talks are faltering as expected. Russian Oil Embargo Could Deliver Global Shock
Xi-Putin Summit, Ukraine Offensive, Iran Tensions
Xi-Putin Summit, Ukraine Offensive, Iran Tensions
Asset Initiation Date Return LONG GLOBAL DEFENSIVES / CYCLICALS EQUITIES 2022-01-20 19.1% Bottom Line: Stay long US stocks, defensive sectors, and large caps. Avoid China, Taiwan, eastern Europe, and the Middle East. Feature Several notable geopolitical developments occurred over the past week while we met with clients at the annual BCA Research Investment Conference in New York. In this report we analyze these developments using our geopolitical method, which emphasizes constraints over preferences, capabilities over intentions, reality over narrative. We also draw freely from the many valuable insights gleaned from our guest speakers at the conference. China Cannot Reject Russia: The Xi-Putin Summit In Uzbekistan Presidents Xi Jinping and Vladimir Putin are meeting in Uzbekistan as we go to press and Putin has acknowledged China’s “questions and concern” about the war in Ukraine.1 They last met on February 4 when Xi gave Putin his blessing for the Ukraine invasion, promising to buy more Russian natural gas and to pursue a “no limits” strategic partnership (meaning one that includes extensive military cooperation). The meeting’s importance is clear from both leaders’ efforts to make it happen. Putin is leaving Russia despite rising domestic criticism over his handling of the Ukraine war and European energy war. Ukraine is making surprising gains in the battlefield, particularly around Kharkiv, threatening Russia’s ability to complete the conquest of Donetsk and the Donbas region. Meanwhile Xi is leaving China for the first time since the Covid-19 outbreak, despite the fact that he is only one month away from the most important political event of his life: the October 16 twentieth national party congress, where he hopes to clinch another five, ten, or fifteen years in power, expand his faction’s grip over the political system, and take over Mao Zedong’s unique title as chairman of the Communist Party. We do not yet know the full outcome of the Uzbek summit but we do not see it as a turning point in which China turns on Russia. Instead the summit reinforces our key point to investors all year: China cannot reject Russia. Russia broke energy ties with Europe and is fighting a proxy war with NATO. The Putin regime has lashed Russia to China’s side for the foreseeable future. China may not have wanted to move so quickly toward an exclusive relationship but it is not in a position to reject Russia’s diplomatic overture and leave Putin out to dry. The reason is that China is constrained by the US-led world order and like Russia is attempting to change that order and carve a sphere of influence to improve its national security. Beijing’s immediate goal is to consolidate power across the critical buffer territories susceptible to foreign interests. It has already consolidated Tibet, Xinjiang, Hong Kong, and to some extent the South China Sea, the critical approach to Taiwan. Taiwan is the outstanding buffer space that needs to be subjugated. Xi Jinping has taken it upon himself to unify China and Taiwan within his extended rule. But Taiwanese public opinion has decisively shifted in favor of either an indefinite status quo or independence. Hence China and Taiwan are on a collision course. Regardless of one’s view on the likelihood of war, it is a high enough chance that China, Taiwan, the US, and others will be preparing for it in the coming years. Chart 1US Arms Sales To Taiwan
Xi-Putin Summit, Ukraine Offensive, Iran Tensions
Xi-Putin Summit, Ukraine Offensive, Iran Tensions
The US is attempting to increase its ability to deter China from attacking Taiwan. It believes it failed to deter Russia from invading Ukraine – and Taiwan is far more important to US economy and security than Ukraine. The US is already entering discussions with Taiwan and other allies about a package of severe economic sanctions in the event that China attacks – sanctions comparable to those imposed on Russia. The US Congress is also moving forward with the Taiwan Policy Act of 2022, which will solidify US support for the island as well as increase arms sales (Chart 1).2 Aside from China's military preparation – which needs to be carefully reviewed in light of Russia’s troubles in Ukraine and the much greater difficulty of invading Taiwan – China must prepare to deal with the following three factors in the event of war: 1. Energy: China is overly exposed to sea lines of communication that can be disrupted by the United States Navy. Beijing will have to partner with Russia to import Russian and Central Asian resources and attempt to forge an overland path to the Middle East (Chart 2). Unlike Russia, China cannot supply its own energy during a war and its warfighting capacity will suffer if shortages occur or prices spike. 2. Computer Chips: China has committed at least $200 billion on a crash course to build its own semiconductors since 2013 due to the need to modernize its military and economy and compete with the US on the global stage. But China is still dependent on imports, especially for the most advanced chips, and its dependency is rising not falling despite domestic investments (Chart 3). The US is imposing export controls on advanced microchips and starting to enforce these controls on third parties. The US and its allies have cut off Russia’s access to computer chips, leading to Russian shortages that are impeding their war effort. Chart 2China’s Commodity Import Vulnerability
Xi-Putin Summit, Ukraine Offensive, Iran Tensions
Xi-Putin Summit, Ukraine Offensive, Iran Tensions
Chart 3China's Imports Of Semiconductors
China's Imports Of Semiconductors
China's Imports Of Semiconductors
3. US Dollar Reserves: China is still heavily exposed to US dollar assets but its access will be cut off in the event of war, just as the US has frozen Russian, Iranian, Venezuelan, and Cuban assets over the years. China is already diversifying away from the dollar but will have to move more quickly given that Russia had dramatically reduced its exposure and still suffered severely when its access to dollar reserves was frozen this year (Chart 4). Where will China reallocate its reserves? To developing and importing natural resources from Russia, Central Asia, and other overland routes. Chart 4China's US Dollar Exposure
China's US Dollar Exposure
China's US Dollar Exposure
Russia may be the junior partner in a new Russo-Chinese alliance but it will not be a vassal. Russia has resources, military power, and regional control in Central Asia that China needs. Of course, China will maintain a certain diplomatic distance from Russia because it needs to maintain economic relations with Europe and other democracies as it breaks up with the United States. Europe is far more important to Chinese exports than Russia. China will play both sides and its companies will develop parallel supply chains. China will also make gestures to countries that feel threatened by Russia, including the Central Asian members of the Shanghai Cooperation Organization (SCO). But the crucial point is that China cannot reject Russia. If the Putin regime fails, China will be diplomatically isolated, it will lose an ally in any Taiwan war, and the US will have a much greater advantage in attempting to contain China in the coming years and decades. Russo-Chinese Alliance And The US Dollar Many investors speculate that China’s diversification away from the US dollar will mark a severe downturn for the currency. This is of course possible, given that Russia and China will form a substantial anti-dollar bloc. Certainly there can be a cyclical downturn in the greenback, especially after the looming recession troughs. But it is harder to see a structural collapse of the dollar as the leading global reserve currency. The past 14 years have shown how global investors react to US dysfunction, Russian aggression, and Chinese slowdown: they buy the dollar! The implication is that a US wage-price spiral, a Russian détente with Europe, and a Chinese economic recovery would be negative for the dollar – but those stars have not yet aligned. Related Report Geopolitical StrategyThe Geopolitical Consequences Of The Ukraine War The reason China needs to diversify is because it fears US sanctions when it invades Taiwan. Hence reducing its holdings of US treasuries and the dollar signals that it expects war in future. But will other countries rush into the yuan and yuan-denominated bonds if Xi is following in Putin’s footsteps and launching a war of choice, with damaging consequences for the economy? A war over Taiwan would be a global catastrophe and would send other countries plunging into the safe-haven assets, including US assets. Nevertheless China will diversify and other countries will probably increase their yuan trade over time, just as Russia has done. This will be a cyclical headwind for the dollar at some point. But it will not knock the US off the premier position. That would require a historic downgrade in the US’s economic and strategic capability, as was the case with the United Kingdom after the world wars. China will continue to stimulate the economy after the party congress. A successful Chinese and global economic rebound next year – and a decision to pursue “jaw jaw” with the US and Taiwan rather than “war war” – would be negative for the dollar. Hence we may downgrade our bullish dollar view to neutral on a cyclical basis before long … but not yet and not on a structural basis. Bottom Line: Favor the US dollar and the euro over the Chinese renminbi and Taiwanese dollar. Underweight Chinese and Taiwanese assets on a structural basis. Ukraine’s Counter-Offensive And A Russian Oil Embargo Ukraine launched a counter-offensive against Russia in September and achieved significant early victories. Russians fell back away from Kharkiv, putting Izyum in Ukrainian hands and jeopardizing Russia’s ability to achieve its war aim of conquering the remaining half of Donetsk province and thus controlling the Donbas region of eastern Ukraine. Russian positions also crumbled west of the Dnieper river, which was always an important limit on Russian capabilities (Map 1). Map 1Status Of Russia-Ukraine War: The Ukrainian Counter-Offensive (September 15, 2022)
Xi-Putin Summit, Ukraine Offensive, Iran Tensions
Xi-Putin Summit, Ukraine Offensive, Iran Tensions
Some commentators, such as Francis Fukuyama in the Washington Post, have taken the Ukrainian counter-offensive as a sign that the Ukrainians will reconquer lost territory and Russia will suffer an outright defeat in this war.3 If Russia cannot conquer the Donbas, its control of the “land bridge” to Crimea will be unsustainable, and it may have to admit defeat. But we are very skeptical. It will be extremely difficult for Ukrainians to drive the Russians out of all of their entrenched positions. US military officials applauded Ukraine’s counter-offensive but sounded a cautious note. The chief problem is that neither President Putin nor the Russian military can afford such a defeat. They will have to double down on the Donbas and land bridge. The war will be prolonged. Ultimately we expect stalemate, which will be a prelude to ceasefire negotiations. But first the fighting will intensify and the repercussions for global economy and markets will get worse. Russia’s war effort is also flagging because Europe is making headway in finding alternatives for Russian natural gas. Russia has cut off flows through the Nord Stream pipeline to Germany, the Yamal pipeline to Poland, and partially to the Ukraine pipeline system, leaving only Turkstream operating normally. Yet EU gas storage is in the middle of its normal range and trending higher (Chart 5). Chart 5Europe Handling Natural Gas Crisis Well … So Far
Xi-Putin Summit, Ukraine Offensive, Iran Tensions
Xi-Putin Summit, Ukraine Offensive, Iran Tensions
Of course, Europe’s energy supply is still not secure. Cold weather could require more heating than expected. Russia has an incentive to tighten the gas flow further. Flows from Algeria or Azerbaijan could be sabotaged or disrupted (Chart 6). Chart 6Europe’s NatGas Supply Still Not Secure
Xi-Putin Summit, Ukraine Offensive, Iran Tensions
Xi-Putin Summit, Ukraine Offensive, Iran Tensions
Chart 7Europe Tipping Into Recession Anyway
Europe Tipping Into Recession Anyway
Europe Tipping Into Recession Anyway
Russia’s intention is to inflict a recession on Europe so that it begins to rethink its willingness to maintain a long-term proxy war. Recession will force European households to pay the full cost of the energy breakup with Russia all at once. Popular support for war will moderate and politicians will adopt more pragmatic diplomacy. After all they do not have an interest in prolonging the war to the point that it spirals out of control. Clearly the economic pain is being felt, as manufacturing expectations and consumer confidence weaken (Chart 7). Europe’s resolve will not collapse overnight. But the energy crisis can get worse from here. The deeper the recession, the more likely European capitals will try to convince Ukraine to negotiate a ceasefire. However, given Ukraine’s successes in the field and Europe’s successes in diversification, it is entirely possible that Russia faces further humiliating setbacks. While this outcome may be good for liberal democracies, it is not good for global financial markets, at least not in the short run. If Russia is backed into a corner on both the military and economic fronts, then Putin’s personal security and regime security will be threatened. Russia could attempt to turn the tables or lash out even more aggressively. Already Moscow has declared a new “red line” if the US provides longer-range missiles to Ukraine. A US-Russia showdown, complete with nuclear threats, is not out of the realm of possibility. Russia could also start halting oil exports, as it has threatened to do, to inflict a major oil shock on the European economy. Investors will need to be prepared for that outcome. Bottom Line: Petro-states have geopolitical leverage as long as global commodity supplies remain tight. Investors should be prepared for the European embargo of Russian oil to provoke a Russian reaction. A larger than expected oil shock is possible given the risk of defeat that Russia faces (Chart 8). Chart 8Russian Oil Embargo Could Deliver Global Shock
Xi-Putin Summit, Ukraine Offensive, Iran Tensions
Xi-Putin Summit, Ukraine Offensive, Iran Tensions
US-Iran Talks Falter Again This trend of petro-state geopolitical leverage was one of our three key views for 2022 and it also extends to the US-Iran nuclear negotiations, which are faltering as expected. Tit-for-tat military action between Iran and its enemies in the Persian Gulf will pick up immediately – i.e. a new source of oil disruption will emerge. If global demand is collapsing then this trend may only create additional volatility for oil markets at first, but it further constrains the supply side for the foreseeable future. It is not yet certain that the talks are dead but a deal before the US midterm looks unlikely. Biden could continue working on a deal in 2023-24. The Democratic Party is likely to lose at least the House of Representatives, leaving him unable to pass legislation and more likely to pursue foreign policy objectives. The Biden administration wants the Iran deal to tamp down inflation and avoid a third foreign policy crisis at a time when it is already juggling Russia and China. The overriding constraints in this situation are that Iran needs a nuclear weapon for regime survival, while Israel will attack Iran as a last resort before it obtains a nuclear weapon. Yes, the US is reluctant to initiate another war in the Middle East. But public war-weariness is probably overrated today (unlike in 2008 or even 2016) and the US has drawn a hard red line against nuclear weaponization. Iran will retaliate to any US-Israeli aggression ferociously. But conflict and oil disruptions will emerge even before the US or Israel decide to launch air strikes, as Iran will face sabotage and cyber-attacks and will need to deter the US and Israel by signaling that it can trigger a region-wide war. Chart 9If US-Iran Talks Fail, Iraq Will Destabilize Further
If US-Iran Talks Fail, Iraq Will Destabilize Further
If US-Iran Talks Fail, Iraq Will Destabilize Further
Recent social unrest in Iraq, where the nationalist coalition of Muqtada al-Sadr is pushing back against Iranian influence, is only an inkling of what can occur if the US-Iran talks are truly dead, Iran pushes forward with its nuclear program, and Israel and the US begin openly entertaining military options. The potential oil disruption from Iraq presents a much larger supply constraint than the failure to remove sanctions on Iran (Chart 9). A new wave of Middle Eastern instability would push up oil prices and strengthen Russia’s hand, distracting the US and imposing further pain on Europe. It would not strengthen China’s hand, but the risk itself would reinforce China’s Eurasian strategy, as Beijing would need to prepare for oil cutoffs in the Persian Gulf. Iran’s attempts to join the Shanghai Cooperation Organization should be seen in this context. Ultimately the only factor that could still possibly convince Iran not to make a dash for the bomb – the military might of the US and its allies – is the same factor that forces China and Russia to strengthen their strategic bond. The emerging Russo-Chinese behemoth, in turn, acts as a hard constraint on any substantial reengagement of the US and Chinese economies. The US cannot afford to feed another decade of Chinese economic growth and modernization if China is allied with Russia and Central Asia. Of course, we cannot rule out the possibility that the Xi and Biden administrations will try to prevent a total collapse of US-China relations in 2023. If China is not yet ready to invade Taiwan then there is a brief space for diplomacy to try to work. But there is no room for long-lasting reengagement – because the US cannot simply cede Taiwan to China, and hence China cannot reject Russia, and Russia no longer has any options. Bottom Line: Expect further oil volatility and price shocks. Sell Middle Eastern equities. Favor North American, Latin American, and Australian energy producers. Investment Takeaways Recession Risks Rising: The inflation surprise in the US in August necessitates more aggressive Fed rate hikes in the near term, which increases the odds of rising unemployment and recession. US Policy Uncertainty Rising: A recession will greatly increase the odds of US political instability over the 2022-24 cycle and reduce the incentive for foreign powers like Iran or China to make concessions or agreements with the US. European Policy Uncertainty Rising: We already expected a European recession. Russia’s setbacks make it more likely that it will adopt more aggressive military tactics and economic warfare. Chinese Policy Uncertainty Rising: China will continue stimulating next year but its economy will suffer from energy shocks and its stimulus is less effective than in the past. It will likely increase economic and military pressure on Taiwan, while the US will increase punitive measures against China. It is not clear that it will launch a full scale invasion of Taiwan – that is not our base case – but it is possible so investors need to be prepared. Long US and Defensives: Stay long US stocks over global stocks, defensive sectors over cyclicals, and large caps over small caps. Buy safe-havens like the oversold Japanese yen. Long Arms Manufacturers: Buy defense stocks and cyber-security firms. Short China and Taiwan: Favor the USD and EUR over the CNY. Favor US semiconductor stocks over Taiwanese equities. Favor Korean over Taiwanese equities. Favor Indian tech over Chinese tech. Favor Singaporean over Hong Kong stocks. Matt Gertken Chief Geopolitical Strategist mattg@bcaresearch.com Footnotes 1 Tessa Wong and Simon Fraser, “Putin-Xi talks: Russian leader reveals China's 'concern' over Ukraine,” BBC, September 15, 2022, bbc.com. 2 US Senate Foreign Relations Committee, “The Taiwan Policy Act of 2022,” foreign.senate.gov. 3 Greg Sargent, “Is Putin facing defeat? The ‘End of History’ author remains confident,” Washington Post, September 12, 2022, washingtonpost.com. Strategic Themes Open Tactical Positions (0-6 Months) Open Cyclical Recommendations (6-18 Months) Regional Geopolitical Risk Matrix
Listen to a short summary of this report Executive Summary GIS Projection For The EUR/USD
It’s Time To Buy The Euro
It’s Time To Buy The Euro
We went long the euro early last week, as EUR/USD hit our buy limit price of $0.99. Despite a near cut-off of Russian gas imports, European gas inventories have reached 84% of capacity – above the 80% target that the EU set for November 1st. The latest meteorological forecasts suggest that Europe will experience a warmer-than-normal winter. This will cut heating usage, likely making gas rationing unnecessary. Currencies fare best in loose fiscal/tight monetary environments. This is what Europe faces over the coming months, as governments boost income support for households and businesses, while ramping up spending on energy infrastructure and defense. For its part, the ECB has started hiking rates. Since mid-August, interest rate differentials have moved in favor of the euro at both the short and long end. Rising inflation expectations make it less likely that the ECB will be able to back off from its tightening campaign as it did in past cycles. A hawkish Fed is the biggest risk to our bullish EUR/USD view. We expect US inflation to trend lower over the coming months, before reaccelerating in the second half of 2023. However, as the August CPI report highlights, the danger is that any dip in inflation proves to be shallower and shorter-lived than previously anticipated. Bottom Line: Although significant uncertainty remains, the risk-reward trade-off favors being long EUR/USD. Our end-2022 target is $1.06. Dear Client, I will be meeting clients in Asia next week while also working on our Fourth Quarter Strategy Outlook, which will be published at the end of the month. In lieu of our regular report next Friday, you will receive a Special Report from my colleague, Ritika Mankar, discussing the sources of US equity outperformance over the past 14 years and the likely path ahead. Best Regards, Peter Berezin, Chief Global Strategist It’s Just a Clown Chart 1Investors Are Bullish The Dollar, Not The Euro
Investors Are Bullish The Dollar, Not The Euro
Investors Are Bullish The Dollar, Not The Euro
The scariest part of a horror movie is usually the one before the monster is revealed. No matter how good the special effects, the human brain can always conjure up something more frightening than anything Hollywood can dream up. Investors have been conjuring up all sorts of cataclysmic scenarios for the upcoming European winter. In financial markets, the impact has been most visible in the value of the euro, which has tumbled to parity against the US dollar. Only 23% of investors are bullish the euro at present, down from a peak of 78% in January 2021 (Chart 1). Conversely, 75% of investors are bullish the US dollar. More than half of fund managers cited “long US dollar” as the most crowded trade in the latest BofA Global Fund Manager Survey (“long commodities” was a distant second at 10%). As we discuss below, the outlook for the euro may be a lot better than most investors realize. While my colleagues, Chester Ntonifor, BCA’s chief FX strategist, and Mathieu Savary, BCA’s chief European strategist, are not quite ready to buy the euro just yet, we all agree that EUR/USD will rise over the long haul. Cutting Putin Loose Natural gas accounts for about a quarter of Europe’s energy supply. Prior to the Ukraine war, about 40% of that gas came from Russia (Chart 2). With the closure of the NordStream 1 pipeline, that number has fallen to 9% (some Russian gas continues to enter Europe via Ukraine and the TurkStream supply route). Yet, despite the deep drop in Russian natural gas imports, European natural gas inventories are up to 84% of capacity – roughly in line with past years and above the EU’s November 1st target of 80% (Chart 3). Chart 2Despite A Sharp Drop In Imports Of Russian Natural Gas…
It’s Time To Buy The Euro
It’s Time To Buy The Euro
Chart 3...Europeans Managed To Stock Up On Natural Gas For The Winter Season
...Europeans Managed To Stock Up On Natural Gas For The Winter Season
...Europeans Managed To Stock Up On Natural Gas For The Winter Season
Europe has been able to achieve this feat by aggressively buying natural gas on the open market. While this has caused gas prices to soar, it sets the stage for a retreat in prices in the months ahead. European spot natural gas prices have already fallen from over €300/Mwh in late August to €214/Mwh, and the futures market is discounting a further decline in prices over the next two years (Chart 4). Chart 4The Futures Market Is Discounting A Further Decline In Natural Gas Prices
It’s Time To Buy The Euro
It’s Time To Buy The Euro
Chart 5Futures Prices Of Energy Commodities Provide Some Limited Information On Where Spot Prices Are Heading
It’s Time To Buy The Euro
It’s Time To Buy The Euro
Follow the Futures? Futures prices are not a foolproof guide to where spot prices are heading. As Chart 5 illustrates, the correlation between the slope of the futures curve and subsequent changes in spot prices in energy markets is quite low. Nevertheless, future spot returns do tend to be negative when the curve is backwardated, as it is now, especially when assessed over horizons of around 12-to-18 months (Table 1). Table 1Energy Commodity Spot Price Returns Tend To Be Negative When The Futures Curve Is Backwardated
It’s Time To Buy The Euro
It’s Time To Buy The Euro
Our guess is that European natural gas prices will indeed fall further from current levels. The latest meteorological forecasts suggest that Europe will experience a milder-than-normal winter (Chart 6). This is critical considering that natural gas accounts for over 40% of EU residential heating use once electricity and heat generated in gas-fired plants are included (Chart 7). Chart 6Meteorological Models Suggest Above-Normal Temperatures In Europe This Winter
It’s Time To Buy The Euro
It’s Time To Buy The Euro
Chart 7Natural Gas Is An Important Source Of Energy For Heating Homes In The EU
It’s Time To Buy The Euro
It’s Time To Buy The Euro
A warm winter would bolster the euro area’s trade balance, which has fallen into deficit this year as the energy import bill has soared (Chart 8). An improving balance of payments would help the euro. Europe is moving quickly to secure new sources of energy supply. In less than one year, Europe has become America’s biggest overseas market for LNG (Chart 9). A new gas pipeline linking Spain with the rest of Europe should be operational by next spring. Chart 8Soaring Energy Costs Have Pushed The Euro Area Trade Balance Into Deficit
Soaring Energy Costs Have Pushed The Euro Area Trade Balance Into Deficit
Soaring Energy Costs Have Pushed The Euro Area Trade Balance Into Deficit
Chart 9Europe Is America's Largest LNG Customer
It’s Time To Buy The Euro
It’s Time To Buy The Euro
In the meantime, Germany is building two “floating” LNG terminals. It has also postponed plans to mothball its nuclear power plants and has restarted its coal-fired power plants, a decision that even the German Green Party has supported. France is aiming to boost nuclear capacity, which had fallen below 50% earlier this summer. Électricité de France has pledged to nearly double daily production by December. For its part, the Dutch government has indicated it will raise output from the massive Groningen natural gas field if the energy crisis intensifies. Fiscal Policy to the Rescue On the policy front, European governments are taking steps to buttress household balance sheets during the energy crisis, with nearly €400 billion in support measures announced so far (and surely more to come). Although these support measures will be offset with roughly €140 billion of windfall profit taxes on the energy sector, the net effect will be to raise budget deficits across the region. However, following the old adage that one should “finance temporary shocks but adjust to permanent ones,” a temporary spike in fiscal support may be just what the doctor ordered. The last thing Europe needs is a situation where energy prices fall next year, but the region remains mired in recession as households seek to rebuild their savings. Such an outcome would depress tax revenues, likely leading to higher government debt-to-GDP ratios. Get Ready For a V-Shaped Recovery Stronger growth in the rest of the world should give the euro area a helping hand. That would be good news for the euro, given its cyclical characteristics (Chart 10). The European economy is especially leveraged to Chinese growth. It is likely that the authorities will loosen the zero-Covid policy once the Twentieth Party Congress concludes next month, and new anti-viral drugs and possibly an Omicron-specific booster shot become widely available later this year. That should help jumpstart China’s economy. More stimulus will also help. Chart 11 shows that EUR/USD is highly correlated with the Chinese credit/fiscal impulse. Chart 10The Euro Is A Cyclical Currency
The Euro Is A Cyclical Currency
The Euro Is A Cyclical Currency
Chart 11EUR/USD Is Highly Correlated With The Chinese Credit & Fiscal Impulse
EUR/USD Is Highly Correlated With The Chinese Credit & Fiscal Impulse
EUR/USD Is Highly Correlated With The Chinese Credit & Fiscal Impulse
All this suggests that the prevailing view on European growth is too pessimistic. Even if Europe does succumb to a technical recession in the months ahead, it is likely to experience a V-shaped recovery. That will provide a nice tailwind for the euro. Loose Fiscal/Tight Monetary Policies: The Winning Combo for Currencies Chart 12Fiscal Policy Has Eased Structurally In The Euro Area More Than In Other Advanced Economies
It’s Time To Buy The Euro
It’s Time To Buy The Euro
A tight monetary and loose fiscal policy has historically been the most bullish combination for currencies. Recall that the US dollar soared in the early 1980s on the back of Paul Volcker’s restrictive monetary policy and Ronald Reagan’s expansionary fiscal policy, the latter consisting of huge tax cuts and increased military spending. While not nearly on the same scale, the euro area’s current configuration of loose fiscal/tight monetary policies bears some resemblance to the US in the early 1980s. Even before the war in Ukraine began, the IMF was forecasting a much bigger swing towards expansionary fiscal policy in the euro area than in the rest of the world (Chart 12). The war has only intensified this trend, triggering a flurry of spending on energy and defense – spending that is likely to persist for most of this decade. The ECB’s Reaction Function After biding its time, the ECB has joined the growing list of central banks that are hiking rates. On September 8th, the ECB jacked up the deposit rate by 75 bps. Investors expect a further 185 bps in hikes through to September 2023. While US rate expectations have widened relative to euro area expectations since the August US CPI report (more on that later), the gap is still narrower than it was on August 15th. Back then, investors expected euro area 3-month rates to be 233 bps below comparable US rates in June 2023. Today, they expect the gap to be only 177 bps (Chart 13). Real long-term bond spreads, which conceptually at least should be the more important driver of currency movements, have also moved in the euro’s favor. In the past, ECB rate hikes were swiftly followed by cuts as the region was unable to tolerate even moderately higher rates. While this very well could happen again, the odds are lower than they once were, at least over the next 12 months. Chart 13Interest Rate Differentials Have Moved In Favor Of The Euro Since Mid-August
Interest Rate Differentials Have Moved In Favor Of The Euro Since Mid-August
Interest Rate Differentials Have Moved In Favor Of The Euro Since Mid-August
Chart 14Euro Area: Inflation Expectations Have Risen Briskly
Euro Area: Inflation Expectations Have Risen Briskly
Euro Area: Inflation Expectations Have Risen Briskly
For one thing, median inflation expectations three years ahead in the ECB’s monthly survey have risen briskly (Chart 14). The Bundesbank’s own survey paints an even more alarming picture, with median expected inflation over the next five years having risen to 5% from 3% in mid-2021 (Chart 15). Expected German inflation over the next ten years stands at a still-elevated 4%. Whether this reflects Germans’ heightened historical sensitivity to inflation risks is unclear, but it is something the ECB cannot ignore. Structurally looser fiscal policy has raised the neutral rate of interest in the euro area, giving the ECB more leeway to lift rates. A narrowing in competitiveness gaps across the currency bloc has also mitigated the need for the ECB to set rates based on the needs of the weakest economies in the region. Chart 16 shows that collectively, unit labor costs among the countries most afflicted by the sovereign debt crisis a decade ago have completely converged with Germany. Chart 15German Inflation Expectations Are Elevated
German Inflation Expectations Are Elevated
German Inflation Expectations Are Elevated
Chart 16Europe's Periphery Has Closed The Competitiveness Gap With Germany
Europe's Periphery Has Closed The Competitiveness Gap With Germany
Europe's Periphery Has Closed The Competitiveness Gap With Germany
While Italy is still a laggard in the competitiveness rankings, the ECB’s new Transmission Protection Instrument (TPI) – which allows the central bank to buy sovereign debt with less stringent conditionality than under the Outright Monetary Transactions (OMT) program – should keep a lid on sovereign spreads. This, in turn, will allow the ECB to raise rates more than it otherwise could. Hawkish Fed is the Biggest Risk to Our Bullish EUR/USD View Chart 17Supplier Delivery Times Have Fallen Sharply
Supplier Delivery Times Have Fallen Sharply
Supplier Delivery Times Have Fallen Sharply
Tuesday’s hotter-than-expected August US CPI report pulled the rug from under the euro’s incipient rally, pushing EUR/USD back to parity. We have been flagging the risks of high inflation for several years (see, for example, our February 19, 2021 report, 1970s-Style Inflation: Yes, It Could Happen Again). Our thesis is that inflation will follow a “two steps up, one step down” pattern. We are probably near the top of those two steps now, with the next leg for inflation likely to be to the downside, driven by ebbing pandemic-related supply side-dislocations. Perhaps most notably, supplier delivery times have fallen sharply in recent months (Chart 17). These pandemic-related dislocations extend to the housing rental market. Rent inflation dropped after rent moratoriums were put in place, only to rebound forcefully once the moratoriums were lifted and the labor market tightened. Although official measures of rent inflation will remain elevated for some time, owing to lags in how they are constructed, timelier data on new rental units coming to market already point to a sharp decline in rent inflation (Chart 18). This is something that the Fed is sure to notice. Ironically, falling inflation could sow the seeds of its own demise. Nominal wage growth is currently very elevated, yet because of high inflation, real wages are still shrinking. As inflation comes down, real wage growth will turn positive. This will lift consumer sentiment, helping to buoy consumption (Chart 19). A pickup in consumer spending will cause the economy to overheat again, leading to a second wave of inflation in the back half of 2023. Chart 18Timelier Measures Of Rent Inflation Have Rolled Over
Timelier Measures Of Rent Inflation Have Rolled Over
Timelier Measures Of Rent Inflation Have Rolled Over
Chart 19Falling Inflation Will Boost Real Wages And Consumer Confidence
Falling Inflation Will Boost Real Wages And Consumer Confidence
Falling Inflation Will Boost Real Wages And Consumer Confidence
As we discussed in our August 18th Special Report Dispatches From The Future: From Goldilocks To President DeSantis, the Fed will respond to this second inflationary wave by hiking the Fed funds rate to 5%. This will temporarily push up the value of the dollar, a process that will only stop once the US falls into recession in 2024 and the Fed is forced to cut rates again. Our projected rollercoaster ride for EUR/USD is depicted in Chart 20. We see the euro rising to $1.06 by year-end, peaking at $1.11 in the spring of 2023, falling back to $1.05 by late 2023, and then beginning a prolonged rally in 2024. Chart 20GIS Projection For The EUR/USD
It’s Time To Buy The Euro
It’s Time To Buy The Euro
Chart 21The Dollar Is Very Overvalued Against The Euro Based On PPP
The Dollar Is Very Overvalued Against The Euro Based On PPP
The Dollar Is Very Overvalued Against The Euro Based On PPP
Chart 21 shows that the dollar is 30% overvalued against the euro based on its Purchasing Power Parity (PPP) exchange rate. Thus, there is significant long-term upside to EUR/USD. Implications for Other Currencies and Regional Equity Allocation Chart 22Stock Markets Outside The US Tend To Fare Best When The Dollar Is Weakening
Stock Markets Outside The US Tend To Fare Best When The Dollar Is Weakening
Stock Markets Outside The US Tend To Fare Best When The Dollar Is Weakening
The strengthening in the euro that we envision over the next six months or so will be part of a broad-based dollar decline. While BCA’s Foreign Exchange Strategy service sees more upside for the euro than the pound, GBP/USD will likely follow the same trajectory as EUR/USD. The yen is one of the cheapest currencies in the world and should finally gain some traction. If China abandons its zero-Covid policy and increases fiscal support for its economy, the RMB and other EM currencies should strengthen. Stock markets outside the US tend to fare best when the dollar is weakening. This includes Europe. As Chart 22 illustrates, there is a close correlation between EUR/USD and the relative performance of European versus US stocks. Thus, an above-benchmark exposure to international markets is appropriate during the coming months. Peter Berezin Chief Global Strategist peterb@bcaresearch.com Follow me on LinkedIn & Twitter Global Investment Strategy View Matrix
It’s Time To Buy The Euro
It’s Time To Buy The Euro
Special Trade Recommendations Current MacroQuant Model Scores
It’s Time To Buy The Euro
It’s Time To Buy The Euro
Executive Summary At the margin, the European Union’s proposed €140 billion “windfall profits” tax on electricity providers not using natural gas to generate power will blunt the message markets are sending to consumers to conserve energy, by distributing this windfall to households to offset higher energy costs. A “solidarity contribution” from oil, gas and coal producers – an Orwellian rendering of “fossil-fuel tax” – will reduce capex at a time when it is needed to expand supply. These measures – the direct fallout of the EU’s failed Russia-engagement policy – will compound policy uncertainty in energy markets, which also will discourage investment in new supply. Efforts to contain energy prices of households and firms in the UK will be borne by taxpayers, who will be left with a higher debt load in the wake of the government’s programs to limit energy costs, and higher taxes to service the debt. EU Still At Risk To Russia Gas Cutoff
EU Energy Markets: "Not Fit For Purpose" For A Reason
EU Energy Markets: "Not Fit For Purpose" For A Reason
Bottom Line: The EU and UK governments are inserting themselves deeper into energy markets, which will distort fundamentals and prices, leaving once-functioning markets “unfit for purpose.” This likely will reduce headline inflation beginning in 3Q22 by suppressing energy prices, and will discourage conservation and capex. Energy markets will remain tight as a result. We were stopped out of our long the COMT ETF with a loss of 5.4% and our XOP ETF with a gain of 24.6%. We will re-open these positions at tonight’s close with 10% stop-losses. Feature The EU is attempting to address decades of failed policy – primarily its Ostpolitik change-through-trade initiative vis-à-vis Russia – in a matter of months.1 This policy was brought to a crashing halt earlier this year by Russia’s invasion of Ukraine, which led to an economic war pitting the EU and its NATO allies against Russia. This conflict is playing out most visibly in energy markets. For investors, the most pressing issue in the short term center around the trajectory of energy prices – primarily natural gas, which, unexpectedly, has become the most important commodity in the world: It sets the marginal cost of power in the EU; forces dislocations in oil and coal markets globally via fuel substitution, and drives energy and food inflation around the world higher by increasing space-heating fuel costs and fertilizer costs. These effects are unlikely to disappear quickly, especially in the wake of deeper government involvement in these markets. The EU is dealing with its energy crisis by imposing taxes on power generators and hydrocarbons producers. It is proposing a €140 billion “windfall profits” tax on electricity providers not using natural gas to generate power, and is advancing a “solidarity contribution” from oil, gas and coal producers – an Orwellian rendering of a “fossil-fuel tax. Lastly, the EU will mandate energy rationing to stretch natural gas supplies over the summer and winter heating season. The tax hikes under consideration will reduce capex at a time when it is needed to expand supply. Related Report Commodity & Energy StrategyOne Hot Mess: EU Energy Policy The UK is taking a different route v. the EU, by having the government absorb the cost of stabilizing energy prices for households and firms directly on its balance sheet. Beginning 1 October, annual energy bills – electricity and gas – will be limited to £2,500. The government is ready to provide support for firms facing higher energy costs out of a £150 billion package that still lacks formal approval via legislation to be dispensed. This obviously has businesses concerned.2 Over the medium to long term, this economic war will realign global energy trade – bolstering the US as the world’s largest energy exporter, and cementing the alliance of China-Russia energy trade. Whether this ultimately evolves into a Cold War standoff remains an open question. EU Policy Failures And The Power Grid’s Limitations Chart 1Russia Plugged The Gap In EU Energy Supply
EU Energy Markets: "Not Fit For Purpose" For A Reason
EU Energy Markets: "Not Fit For Purpose" For A Reason
In addition to its failed Russia policy, the EU’s aggressive support of renewable energy disincentivized domestic fossil fuel production and forced an increased reliance on imports – with a heavy weighting toward Russian hydrocarbons – instead. Once Russia stopped playing the role of primary energy supplier to the EU, the bloc’s energy insecurity became obvious (Chart 1). The EU’s current power-pricing system is forcing households and industries to bear the brunt of energy insecurity and high natgas prices resulting from poor energy policy design.3 And it forces the government to tax energy suppliers – with “windfall profits” taxes ostensibly meant to capture economic rents, as officials are wont to describe the taxes – to fund consumer-support programs. While REPowerEU aims to alleviate the bloc’s energy insecurity by importing non-Russian LNG and increasing renewable energy’s share in the energy mix, both alternatives face bottlenecks, which could delay their implementation. This could keep energy markets in the EU tight over the medium term, until additional LNG capacity comes online in the US and elsewhere. Renewable electricity is not as reliable as electricity generated by fossil fuels on the current power grid, which needs to be constantly balanced to avoid cascading failure. This means power consumed must equal power supplied on a near-instantaneous basis to avoid grid failure. However, given its reliance on variable weather conditions, renewable energy by itself cannot keep the grid balanced, primarily due to the lack of utility-scale storage for renewable power. Battery-storage technology and green-hydrogen energy can be used in conjunction with other renewables to balance the power grid, but they still are nascent technologies and not yet scalable to the point where they can replace hydrocarbon energy sources. Furthermore, the continued addition of small-scale renewables-based power generation located further away from demand centers – cities and industrial complexes – will continue to increase the complexity and scale of the power grid.4 Realizing the importance of incumbent power sources and the infrastructure requirements to diversify away from Russian fuels, the EU labelled investments in natural gas and nuclear power as green investments in July.5 Of the two energy sources, natural gas will likely play a larger role in ensuring the bloc’s energy security over the next 3-5 years, given the polarized views on nuclear power.6 In its most recent attempt to stabilize power prices, the EU plans to redirect “inframarginal” power producers’ windfall profits to households and businesses, provided those producers do not generate electricity using natgas. The Commission did not suggest capping Russian natgas prices since that could be divisive among EU member states, and could further jeopardize the bloc’s energy security. The redistribution of the windfall profits taxes is coupled with calls for mandatory electricity demand reductions in member states. We are unsure of the net effect of these directives on physical power and natural gas balances. However, government interference will feed into the policy uncertainty surrounding electricity and natural gas markets. EU Storage Continues To Build Against all odds, the EU has been aggressively building gas in storage (Chart 2), as demand from Asia has been low during the summer months (Chart 3). This has allowed high Dutch Title Transfer Facility (TTF) prices – the European natgas benchmark – to lure US LNG exports away from Asia (Chart 4). According to Refinitiv data, US exports of LNG to Europe increased 74% y/y to a total of over 1,370 Bcf for the first half of 2022. Chart 2Europe Has Been Aggressively Building Gas Storage
EU Energy Markets: "Not Fit For Purpose" For A Reason
EU Energy Markets: "Not Fit For Purpose" For A Reason
Chart 3US LNG Exports To Asia Dropped In H1 2022
US LNG Exports To Asia Dropped In H1 2022
US LNG Exports To Asia Dropped In H1 2022
Chart 4High TTF Prices Attract US LNG
EU Energy Markets: "Not Fit For Purpose" For A Reason
EU Energy Markets: "Not Fit For Purpose" For A Reason
Since Russian gas flows to Asian states have not been completely cut off, this will reduce ex-EU demand for US LNG, providing much needed breathing room for international LNG markets. However, as the pre-winter inventory-injection period in Asia continues, there is an increasing likelihood the spread between Asian and European gas prices narrows. This could incentivize US producers to export more fuel to Asia, slowing the EU’s build-up of gas storage. US plans to increase LNG export capacity will alleviate current tightness in international gas markets over the medium term, as new export facilities are expected to begin operations by 2024, and be fully online by 2025 (Chart 5). Until US LNG exports increase, global natgas markets will continue to remain tight and prices will be volatile. Chart 5US LNG Export Capacity Projected To Rise
EU Energy Markets: "Not Fit For Purpose" For A Reason
EU Energy Markets: "Not Fit For Purpose" For A Reason
Russia’s Asian Gas Pivot Since the energy crisis began, China has accelerated the rate at which it imports discounted Russian LNG.7 Russia is aiming to increase gas exports to China to replace the sales lost to the EU following its invasion of Ukraine. Russia recently signed a deal with China to increase gas flows by an additional 353 Bcf per year, with both states agreeing to settle this trade in yuan and rouble to circumvent Western currencies, primarily the USD. Additionally, the Power of Siberia pipeline is expected to reach peak transmission capacity of ~ 1,340 Bcf per year by 2025. Chart 6China Will Not Want All Eggs In One Basket
EU Energy Markets: "Not Fit For Purpose" For A Reason
EU Energy Markets: "Not Fit For Purpose" For A Reason
Adding to the China-Russia gas trade is the planned Power of Siberia 2 pipeline, which will have an annual expected capacity of 1,765 Bcf. This will move gas to China from western Siberia via Mongolia, and is expected to come into service by 2030; construction is scheduled to begin in 2024. This will redirect gas once bound toward the EU to China. Russia’s ability to develop and construct the required infrastructure to pivot gas exports to China and the rest of Asia will be hindered by Western sanctions, as international private companies walk away from Russian projects and international investment in that state decline. This is a deeper consequence of the sanctions imposed by the US and its allies, as it denies Russia the capital, technology and expertise needed to fully develop its resource base. On China’s side, even if both Power of Siberia pipelines are developed to operate at full capacity, the world’s largest natgas importer may be wary of becoming overly reliant on Russia for a significant proportion of its gas (and oil) imports. China has developed a diversified network of natgas suppliers, which, as the experience of the EU demonstrates, is the best way to avoid energy-supply shocks (Chart 6). Investment Implications We expect natural gas price volatility to remain elevated over the next 2-3 years. EU governments’ interference with the natgas and power markets' structure and pricing mechanisms – be it via natgas price caps or skimming gas suppliers’ profits – will distort price signals, detaching them from fundamental gas balances. This will perpetuate the energy crisis currently plaguing the EU, by encouraging over-consumption of gas and reducing capex via taxes and levies on profitable companies operating below the market’s marginal cost curve. As a result of the dislocations caused by Russia’s invasion of Ukraine, dislocations in natural gas trade flows will continue, forcing markets to find work-arounds to replace lost Russian pipeline exports in the short-to-medium term. The EU will become more reliant on US LNG supplies, and will – over the next 2-3 years – have to outbid Asian states for supplies. Trade re-routing will take time and likely will lead to sporadic, localized shortages in the interim. The US is the largest exporter of LNG at present, but, by next year, it’s export capacity will max out. It will only start to increase from 2024, reaching full capacity by 2025. While higher export capacity from the world’s largest LNG supplier will help alleviate tight markets, in the interim, global gas prices, led by the TTF will remain elevated and volatile. The EU still receives ~ 80mm cm /d of pipeline gas from Russia, or ~ 7.4% of 2021 total gas consumption on an annual basis (Chart 7). A complete shut-off of Russian gas flows to the EU means the bloc would face even more difficulty refilling storage in time for next winter. This would keep the energy- and food-driven components of inflation high, and constrain aggregate demand in the EU generally. Chart 7EU Still At Risk To Russia Gas Cutoff
EU Energy Markets: "Not Fit For Purpose" For A Reason
EU Energy Markets: "Not Fit For Purpose" For A Reason
We continue to expect global natural gas markets to remain tight this year and next. We also expect natural gas prices to remain extremely volatile – particularly in winter (November – March), when weather will dictate the evolution of price levels. We were stopped out of our long the COMT ETF with a loss of 5.4% and our XOP ETF with a gain of 24.6%. We remain bullish commodities generally and oil in particular, and will re-open these positions at tonight’s close with 10% stop-losses. Robert P. Ryan Chief Commodity & Energy Strategist rryan@bcaresearch.com Ashwin Shyam Research Analyst Commodity & Energy Strategy ashwin.shyam@bcaresearch.com Paula Struk Research Associate Commodity & Energy Strategy paula.struk@bcaresearch.com Commodities Round-Up Energy: Bullish US distillate and jet-fuel stocks recovered slightly in the week ended 9 September 2022, rising by 4.7mm barrels to just over 155mm barrels, according to the US EIA. Distillate inventories – mostly diesel fuel and heating oil – stood at 116mm barrels, down 12% y/y. At 39.2mm barrels, jet fuel stocks are 7% below year-earlier levels. Refiners are pushing units to build distillates going into winter, in order to meet gas-to-oil switching demand in Europe and the US. Distillate inventories have been under pressure for the better part of the summer on strong demand. This is mostly driven by overseas demand. Distillate demand fell by 492k b/d last week, which helped domestic inventories recover. Year-on-year distillate demand was down 1.6% in the US. Ultra-low sulfur diesel prices delivered to the NY Harbor per NYMEX futures specification are up 50% since the start of the year (Chart 8). Base Metals: Bullish On Monday Chile’s government launched a plan to boost foreign investments, which includes providing copper miners with a 5-year break from the ad-valorem tax proposed in a new mining royalty. The plan however does not provide relief from the tax on operating profits, which are also part of the royalty. According to Fitch, the originally planned mining royalty would have significantly depleted copper miners’ profits, disproportionately impacting smaller operators, which cannot avail themselves of the benefits of economies of scale. In a sign that higher taxes spooked bigger players as well, in mid-July, BHP stated that it would reconsider investment plans in Chile if the state proceeded with the mining royalty in its original format. Ags/Softs: Neutral In its September WASDE, the USDA adjusted its supply and demand estimates for soybeans, and made substantial changes to new-crop 2022/23 US production estimates. This reduced acreage and yields by 2.7% from the previous August 2022 forecast. Ukraine’s soybean production was increased in the USDA's estimate. The USDA's soybean projections also include lower ending stocks, which are reduced from 245 million bushels to 200 million bushels. This is 11% below than 2021 levels for beans. The USDA's 2021/22 average price for soybeans remains at $14.35/bu, unchanged from last month but $1.05/bu above the 2021/22 average price (Chart 9). Chart 8NY Harbor ULSD Price Going Down
NY Harbor ULSD Price Going Down
NY Harbor ULSD Price Going Down
Chart 9Soybean Prices Going Down
Soybean Prices Going Down
Soybean Prices Going Down
Footnotes 1 For a discussion of the EU’s past policy mistakes which laid the foundation for current crisis, please see One Hot Mess: EU Energy Policy, which we published on May 26, 2022. It is available at ces.bcaresearch.com. 2 Please see UK business warned of delay to state energy support, published by ft.com on September 13, 2022. 3 The current EU power pricing system is set up so that the most expensive power generator – currently plants using natgas – set the price for the entire electricity market. This system was put in place to incentivize renewably generated power, however, the EU does not have the required infrastructure and technology to be reliant solely on green electricity. 4 For a more detailed discussion on power grid stability, and how renewables will affect it, please ENTSO-E’s position paper on Stability Management in Power Electronics Dominated Systems: A Prerequisite to the Success of the Energy Transition. According to estimates by WindEurope and Hitachi Energy, Europe will need to double annual investments in the power grid to 80 billion euros over the next 30 years to prepare the power grid for renewables. 5 For our most recent discussion on the infrastructure requirements of pivoting away from Russian piped gas, please see Natgas Markets: The Eye Of The Storm, which we published on June 9, 2022. It is available at ces.bcaresearch.com. 6 In 2021, nuclear power constituted majority of France’s energy mix at 36% and had nearly the lowest share for Germany at 5%. In response to the current energy crisis, Germany has opted to restart coal power plants and only keep nuclear plants on standby, signaling that the EU’s largest energy consumer would prefer to use coal despite its carbon emissions target. 7 According to Bloomberg, China signed a tender to receive LNG from Russia’s Sakhalin-2 project through December at nearly half the cost of the spot gas rates at the time. Investment Views and Themes New, Pending And Closed Trades WE WERE STOPPED OUT OF OUR LONG THE COMT ETF WITH A LOSS OF 5.4% AND OUR XOP ETF WITH A GAIN OF 24.6%. WE WILL RE-OPEN THESE POSITIONS AT TONIGHT’S CLOSE WITH 10% STOP-LOSSES. Strategic Recommendations Trades Closed in 2022
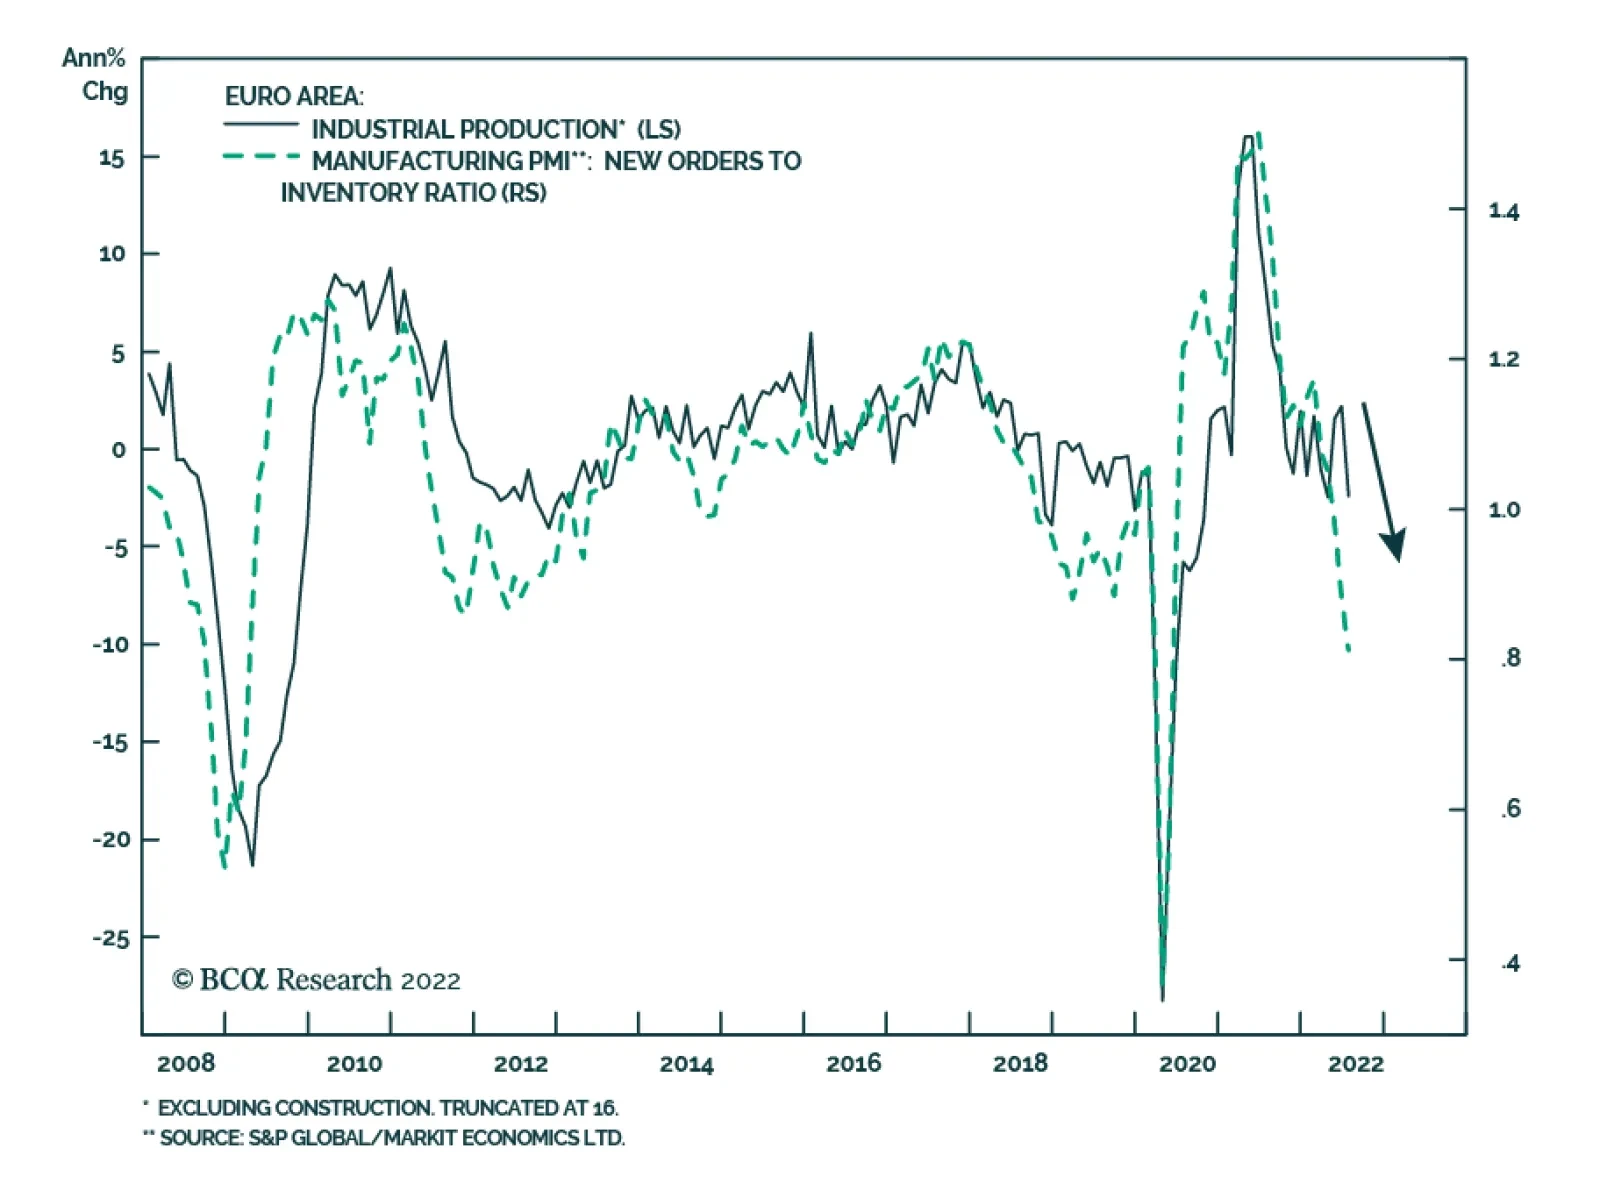
Eurozone industrial production contracted by a larger-than-expected 2.3% m/m in July following a 1.1% increase in June. Capital goods and durable consumer goods led the July decline. Going forward, the outlook for the European economy remains pessimistic.…