Europe

Executive Summary Our negative view on the summer rally is coming to fruition, with equities falling back on the negative geopolitical, macro, and monetary environment. China is easing policy ahead of its full return to autocratic government this fall. Yet the Fourth Taiwan Strait Crisis has only just begun. Tensions can still deal nasty surprises to global investors. It is essential to verify that relations will thaw after the US midterm and Chinese party congress is critical. Russia continues to tighten energy supply as predicted. Ukraine’s counter-offensive is pushing back the time frame of a ceasefire deeper into next year. Putin may declare victory and quit while he is ahead – but Russia will not be forced to halt its invasion until commodity prices fall significantly. Sweden’s election will not interfere with its NATO bid; Australia’s new government will not re-engage with China; Malaysia’s election will be a positive catalyst; South Africa’s political risks are reawakening; Brazil’s risks are peaking; Turkey remains a leading candidate for a negative “black swan” event. China’s Confluence Of Domestic And Foreign Political Risk
China's Confluence Of Domestic And Foreign Political Risk
China's Confluence Of Domestic And Foreign Political Risk
Asset Initiation Date Return LONG GLOBAL DEFENSIVES / CYCLICALS EQUITIES 2022-01-20 17.4% Bottom Line: Investors should stay defensive in the short run until recession risks and geopolitical tensions abate. Feature Last week we visited clients across South Africa and discussed a broad range of global macro and geopolitical issues. In this month’s GeoRisk Update we relate some of the key points in the context of our market-based quantitative risk indicators. While we were traveling, US-Iran negotiations reached a critical phase. A deal is said to be “closer” but we remain pessimistic (we still give 40/60 odds of a deal). The important point for investors is that the supply side of global oil markets will remain tight even if a deal is somehow agreed, whereas it will get much tighter if a deal is not agreed. China’s rollout of 1 trillion yuan ($146 billion) in new fiscal stimulus and rate cuts (5 bps cut to 1-year Loan Prime Rate and 15 bps cut to 5-year LPR) is positive on the demand side and supports our key view in our 2022 annual outlook that China would ease policy ahead of the twentieth national party congress. However, it is still the case that China is not providing enough stimulus to generate a new cyclical rally. Second quarter US GDP growth was revised slightly upwards but was still negative. Russia tightened control of European energy, as expected, increasing the odds of a European recession. Europeans are getting squeezed by rising energy prices, rising interest rates, and weak external demand. China Eases Policy Ahead Of Return To Autocracy China is facing acute political risk in the short term but it is also delivering more stimulus to try to stabilize the economy ahead of the twentieth national party congress this fall (Chart 1). The People’s Bank of China cut the benchmark lending rate by (1-year LPR) by 5 basis points, while authorities unveiled fiscal spending worth 1 trillion renminbi. Chart 1China's Confluence Of Domestic And Foreign Political Risk
China's Confluence Of Domestic And Foreign Political Risk
China's Confluence Of Domestic And Foreign Political Risk
After the party congress, the regime is likely to “let 100 flowers bloom,” i.e. continue with a broad-based policy easing to secure the recovery from the Covid-19 shock. This will include loosening social restrictions and aggressive regulations against industrial sectors like the tech sector. It should also include some diplomatic improvements, especially with Europe. But it is only a short term (12-month) trend, not a long-term theme. Related Report Geopolitical StrategyRoulette With A Five-Shooter China’s return to autocratic government under General Secretary Xi Jinping is a new, negative, structural factor and is nearly complete. Xi is highly likely to secure another decade in power and promote his faction of Communist Party stalwarts and national security hawks. The period around the party congress will be uncertain and dangerous. The exact makeup of the next Politburo could bring some surprises but there is very little chance that Xi and his faction will fail to consolidate power. The nomination of an heir-apparent is possible but of limited significance since Xi will not step down anytime soon or in a regular, predictable manner. Larger stimulus combined with power consolidation could spur greater risk appetite around the world, as it would portend a stabilization of growth and policy continuity. However, China’s underlying problems are structural. The manufacturing and property bust can be delayed but not reversed. China’s foreign policy will continue to get more aggressive due to domestic vulnerability, prompting foreign protectionism, export controls, sanctions, saber-rattling, and the potential for military conflict. Bottom Line: Investors should use any rally in Chinese assets over the coming 12 months as an opportunity to sell and reduce exposure to China’s historic confluence of political and geopolitical risk. Fourth Taiwan Strait Crisis Only Beginning The Fourth Taiwan Strait Crisis has only just begun. The previous three crises ranged from four to nine months in duration. The current crisis cannot possibly abate until November at earliest. Taiwan’s political risk will stay high and we would not buy any relief rally until there is a firm basis for believing tensions have fallen (Chart 2). Chart 2Taiwan: The Fourth Taiwan Strait Crisis
Taiwan: The Fourth Taiwan Strait Crisis
Taiwan: The Fourth Taiwan Strait Crisis
If this year’s crisis were driven by US and Chinese domestic politics – the US midterm election and China’s party congress – then both Presidents Biden and Xi Jinping would already have achieved what they want and could proceed to de-escalate tensions by the end of the year – i.e. before somebody really gets hurt. The two leaders could hold a bilateral summit in Asia in November and agree to uphold the one China policy and status quo in the Taiwan Strait. We have given a 40% chance to this scenario, though we would still remain pessimistic about the long-term outlook for Taiwan. But if this year’s crisis is driven by a change in US and Chinese strategic thinking as a result of Russia’s invasion of Ukraine and China’s rising domestic instability, then there will not be a quick resolution on Taiwan. The crisis would grow next year, increasing the risk of aggression or miscalculation. We have given a 60% probability to this scenario, of which full-scale war comprises 20 percentage points. Bottom Line: Our geopolitical risk indicator for Taiwan spiked and Taiwanese equities rolled over relative to global equities as we expected. However, our oldest trade to capture the high long-term risk of a war in the strait – long Korea / short Taiwan – has performed badly despite the crisis. South Korea: China Stimulus A Boon But Not Geopolitics US-China rivalry – and the thawing of Asia’s once-frozen conflicts – is also manifest on the Korean peninsula, where the limited détente between the US and North Korea negotiated by President Donald Trump and Kim Jong Un has fallen apart. South Korea’s situation is not as risky as Taiwan’s but it is nevertheless less stable than it appears (Chart 3). Chart 3South Korea: Lower Geopolitical Risk Than Taiwan
South Korea: Lower Geopolitical Risk Than Taiwan
South Korea: Lower Geopolitical Risk Than Taiwan
South Korea resumed its full-scale joint military exercise with the US, the Ulchi Freedom Shield, from August 22 to September 1. The drills involve amphibious operations and a carrier strike group. Full-scale drills were scaled down or cancelled under the Trump and Moon Jae-In administrations with the hopes of facilitating diplomacy and reducing tensions on the peninsula. North Korea was to discontinue ballistic missile tests and threats to the United States. But after the 2020 election neither Washington nor Pyongyang considered itself bound by this agreement. This year the US went forward with Ulchi Freedom even though regional tensions were sky-high because of House Speaker Nancy Pelosi’s visit to Taiwan and the De-Militarized Zone in Korea. The US is flagging its regional interests and power bases. North Korea is increasing the frequency of missile tests this year and is likely to conduct an eighth nuclear test. On August 17, it fired two cruise missiles towards the Yellow Sea. Pyongyang does not want to be ignored amid so many other geopolitical crises. It is emboldened by the fact that Russia and China will not be voting with the US for another round of sanctions at the United Nations Security Council due to the war in Ukraine and tensions over Taiwan. On August 11, South Korea responded to China’s insistence that the new government should abide by the “Three No’s,” i.e. three negatives that the Moon administration allegedly promised China: no additional deployments of the US’s Terminal High-Altitude Area Defense (THAAD) system, no Korean integration into US-led missile defense, and no trilateral military alliance with the US and Japan. Korea’s Foreign Minister Park Jin told reporters upon his return from China that the three no’s were “neither an agreement nor a promise.” South Korea’s new and conservative President Yoon Suk-yeol is unpopular and gridlocked at home but he is using the opportunity to reassert Korean national interests, including the US military alliance. Tension with the North and cold relations with China are coming at a time when the economy is slowing down. Korean GDP grew by 0.7% in Q2 2022 on a quarter-on-quarter basis, supported by household and government spending, while exports and investments shrank. Roughly a quarter of Korean exports go to China, its biggest trading partner. Korean exports to China have suffered due to China’s economic woes but cold relations could bring new economic sanctions, as China has hit South Korea before over THAAD. With the Yoon administration planning to bring the fiscal deficit back to below 3% of GDP next year, and a broader backdrop of weak Chinese and global demand, it is hard to find bright corners in the Korean economy in the near term. With Yoon’s basement level approval rating, he will resort to foreign policy to try to revive his political capital. Saber rattling and tough talk with North Korea and China will increase tensions in an already hot region – geopolitical risk is bound to stay high on the back of the Taiwan crisis. Bottom Line: On a relative basis, due to the ironclad US security guarantee, South Korea is safer than Taiwan. Investors wanting exposure to Chinese economic stimulus, electric vehicles, and semiconductors should go long South Korea. But some volatility is likely because the North’s eighth nuclear test will occur in the context of high and rising regional tensions. Australia: Stimulus Is Positive But No “Thaw” With China Australia is blessed with strong geopolitical fundamentals but it is seeing a drop in national security and economic security due to the deterioration of China relations. Domestic political turmoil is one of the consequences (Chart 4). Most recently Australia has been roiled by the revelation that former Prime Minister Scott Morrison secretly ran five ministries during the pandemic: the ministries of Home, Treasury, Finance, Resources, and Health. Chart 4Australian Geopolitical Risk Limited
Australian Geopolitical Risk Limited
Australian Geopolitical Risk Limited
After an investigation and review by the Solicitor General Stephen Donaghue, Morrison’s action was determined to be legal, although highly inappropriate and inconsistent with the principles of responsible governance. Morrison’s appointments to these ministries were approved by the Governor General but the announcement or publication of appointments has always been the prerogative of the government of the day. One might think that this investigation is merely politically motivated but the Solicitor General is an apolitical position unlike the Attorney General, and Donaghue had been serving with Morrison, guiding him about the constitutionality of a vaccine mandate during the pandemic. The new Labor Party government of Prime Minister Anthony Albanese has vowed to be more transparent and will seek to enshrine a transparency measure into the law. Its political capital will improve, which is helpful for its ability to achieve its chief election promises. With the change of the government, it was hoped that there would be a thaw in the Australia-China relationship. China is Australia’s largest export destination and it erected boycotts against certain Australian exports in 2020 in response to Prime Minister Morrison’s inquiry into the origin of Covid-19. Hence Australia’s new defense minister, Richard Marles, met with his Chinese counterpart, General Wei Fenghe, on the sideline of the Shangri-La Dialogue in Singapore in June, which rekindled the hope that a thaw might happen. Yet a thaw is unlikely for strategic reasons, as highlighted by the Fourth Taiwan Strait Crisis, the Biden administration’s retention of former President Trump’s tariffs, and Australia’s fears of China’s rising influence in the Pacific Islands. The US and Australia are preparing for a long-term policy of containing China’s ambitions. A few days after his election, Prime Minister Albanese flew to Tokyo to attend a meeting of the Quadrilateral Security Dialogue (the Quad), sending a signal that there will be policy continuity with respect to Australian foreign policy. On May 26, Chinese fighter jets flew closely to an Australian surveillance plane on its routine operation and released aluminum chaffs that were ingested by the P8’s engines. An Australian warship, the HMAS Parramatta, was tracked by a People’s Liberation Army nuclear power submarine and multiple aircrafts on its way back from Vietnam, Korea, and Japan as part of its regional presence deployment in June. Currently Australia is hosting the Pitch-Black military exercise, with 17 countries participating. This exercise will last for three weeks – focusing on air defense and aerial refueling. It will also see the German air force with 13 military aircrafts deployed to the Indo-Pacific region for the very first time. They will be stopping in Japan after the exercise. As Australia’s policy towards China is unlikely to change, geopolitical risk will remain elevated. On the economic front, Australia’s misery index is at the highest point since 2000, with an unemployment rate at 3% and inflation at 6%. GDP growth in the first quarter was 0.8% compared to 3.6% in Q4 2021, propped up by government and household consumption while investment and exports contracted. The good news for the government is that it is inheriting this negative backdrop and can benefit from cyclical improvements in the next few years. Since the Labor government lacks a single-party majority in the Senate (where it must rely on the Greens and independents), it will be difficult for the government to raise new taxes. So far, Albanese has indicated that the budget to be tabled in October will focus on pre-election promises, which includes childcare, healthcare, and energy reforms. At worst, Australian government spending will stay flat, but it is unlikely to shrink considering Labor’s narrow control of the House of Representatives. Australian equities have not outperformed those of developed market peers despite high industrial metal prices. The stock market’s weak performance is attributable to the stumbling Chinese economy (Chart 5). Australian exports to China in June are still down 14% from June of last year. Chinese economic woes will be a headwind to Aussie growth and equity markets until next year, when Chinese stimulus efforts reach their full effect. Chart 5Australian Equities Have Yet to Benefit from Industrial Metal Prices
Australian Equities Have Yet to Benefit from Industrial Metal Prices
Australian Equities Have Yet to Benefit from Industrial Metal Prices
On the other hand, the value of Australian natural gas and oil exports in June grew by 118% and 211% respectively (Chart 6), compared to June of last year. Chart 6Geopolitics: A Boon and Bane to Aussie Growth
Geopolitics: A Boon and Bane to Aussie Growth
Geopolitics: A Boon and Bane to Aussie Growth
Bottom Line: As China will continue stimulating the economy and global energy markets will remain tight, investors should look for opportunities in Aussie energy and materials stocks. Malaysia Closes A Chapter … And Opens A Better One? Rarely do we get to revisit our positive outlook on Malaysia – a Southeast Asian state with an ability to capitalize on the US break-up with China. On August 23, the embattled ex-prime minister of Malaysia, Najib Razak, lost his final appeal at the Federal Court in Putrajaya after being found guilty in 2020 for abuse of power, criminal breach of trust, and money laundering tied to Malaysia’s sovereign wealth fund, 1MDB. The high court instructed that he serves his 12-years prison sentence immediately, becoming the first prime minister to be imprisoned in the country’s 60-years plus of history. Political risk has weighed on the Malaysian economy for almost a decade starting with the contentious 2013 general election, which saw the collapse of non-Malay voter support for the ruling party. Then came the 2015 Wall Street Journal bombshell about 1MDB, and then the 2018 general election that resulted in Malaysia’s first change of government since independence. The pandemic also led to political crisis in 2020. Each crisis resulted in a successive weakening of animal spirits and ever lower investments, resulting in Malaysia’s loss of competitiveness (Chart 7). Malaysia’s cheap currency was unable to increase its competitiveness, due to the low investments in the economy, and reflected higher political risks in the country (Chart 8). Chart 7Political Risk Undermines Competitiveness
Political Risk Undermines Competitiveness
Political Risk Undermines Competitiveness
Chart 8Cheap Currency Reflects Political Risk
Cheap Currency Reflects Political Risk
Cheap Currency Reflects Political Risk
Nonetheless this entire saga has proved that Malaysia’s legal system is independent and that its political system is capable of holding policymakers accountable. The next general election will come in a matter of months and recent state elections bodes well for the institutional ruling party, the United Malay National Organization (UMNO), and its coalition, Barisan Nasional. The coalition is managing to claw back support from the Malay and non-Malay voters. The opposition had the bad luck of ruling during the pandemic and its rocky aftermath, which has helped to rehabilitate the traditional ruling party. We have long seen Malaysia as a potential opportunity. But we would advise investors to wait until the new election is held and a new government takes power before buying Malaysian equities. With the conclusion of its decade-long 1MDB saga, we would turn more bullish if the next election produces a sizeable and enduring majority, if the use of racial and sectarian rhetoric tones down, and if the governing coalition pursues pro-competitiveness policies. Bottom Line: Structurally, Malaysia is one of the largest exporters of semiconductors and will benefit from the US’s shift away from China and attempt to reconstruct supply chains so they run through the economies of allies and partners. Russia: Escalating To De-Escalate? Russia increased the number of active military personnel in a move that points to an escalation of the conflict with Ukraine and the West, even as Ukraine wages a counter-offensive against Russia in Crimea and elsewhere. The time frame for a ceasefire has been pushed further into next year. As long as the war escalates, European energy relief will be elusive. Our risk indicators will rise again (Chart 9). Chart 9Russia: Geopolitical Risk To Rise Again, Ceasefire Pushed Back Into Next Year
Russia: Geopolitical Risk To Rise Again, Ceasefire Pushed Back Into Next Year
Russia: Geopolitical Risk To Rise Again, Ceasefire Pushed Back Into Next Year
Ukraine will not be able to drive Russians out of territory in which they are entrenched. It would need a coalition of western powers willing to go on the offense, which will not happen. Russia is also threatening to cut off the Zaporizhzhia nuclear power plant, ostensibly removing one-fifth of Ukraine’s electricity. Once the Ukrainian counter-offensive grinds to a halt, a stalemate will ensue, incentivizing ceasefire talks – but not until then. The Europeans will have to support Ukraine now but will become less and less inclined to extend the war as they get hit with recession. Russia says it is prepared for a long war but that kind of rhetoric is necessary for propaganda purposes. The truth is that Russia does not have great success with offensive wars. Russia usually suffers social instability in the aftermath. The best indicator for the duration of the war is probably the global oil price: If it collapses for any reason then Russia’s war machine will fall short of funds and the Kremlin will probably have to accept a ceasefire. This what happened in 2014-15 with the Minsk Protocols. Putin will presumably try to quit while he is ahead, i.e. complete the conquest and shift to ceasefire talks, while commodity prices are still supportive and Europe is economically weak. If commodity prices fall, Russia’s treasury dries up while Europe regains strength. So while military setbacks can delay a ceasefire, Russia should be seen as starting to move in that direction. The deal negotiated with Turkey and the United Nations to ship some grain from Odessa is not reliable in the short run but does show the potential for future negotiations. However, a high conviction on the timing is not warranted. Also, the US and Russia could enter a standoff over the US role in the war, or NATO enlargement, at any moment, especially ahead of the US midterm election. Bottom Line: Ukraine’s counteroffensive and Russia’s tightening of natural gas exports increases the risk to global stability and economic growth in the short run, even if it is a case of “escalating tensions in order to de-escalate” later when ceasefire talks begin. Italy: Election Means Pragmatism Toward Russia Italy’s election is the first large crack in the European wall as a result of Russia’s cutoff of energy. The party best positioned for the election – the right-wing, anti-establishment party called the Brothers of Italy – will have to focus on rebooting Italy’s economy once in power. This will require pragmatism toward Russian and its natural gas. Regardless of whether a right-wing coalition obtains a majority or the parliament is hung, Italian political risk will stay high in the short run (Chart 10). Chart 10Italy: Election Brings Uncertainty, Then Economic Stimulus
Italy: Election Brings Uncertainty, Then Economic Stimulus
Italy: Election Brings Uncertainty, Then Economic Stimulus
Although the center-left Democratic Party (PD) is narrowing the gap with the Brothers of Italy in voting intentions, it is struggling to put together an effective front against the right-wing bloc. After its alliance with the centrist Azione party and +Europa party broke down, PD’s chance of winning has become even slimmer. Even if the alliance revives, the center-left bloc still falls short of the conservative parties. Together, the right-wing parties account for just 33% of voting intentions (Democrats at 23%, Greens and Left Alliance at 3%, Azione and +Europa at 7%). By contrast, the right-wing bloc has a significant lead, with 46% of the votes (Brothers of Italy at 24%, Lega at 14%, Forza Italia at 8%). They also have the advantage of anti-incumbency sentiment amid a negative economic backdrop. Unless some sudden surprises occur, a right-wing victory is expected, with Giorgia Meloni becoming the first female prime minister in Italy’s history. This has been our base case scenario for the past several months. But what does a right-wing government mean for the financial markets? In an early election manifesto published in recent weeks, the conservative alliance pledged full adhesion to EU solidarity and dropped their previous euroskepticism. This helps them get elected and is positive for investors. However, there are also clouds on the horizon: In the same manifesto, the right-wing parties pledged to lower taxes for families and firms, increase welfare, and crack down on immigration. These programs will add to Italy’s huge debt pile and eventually lead to conflicts with the ECB and other EU institutions. In the manifesto, they stated that if elected, they would seek to amend conditions of Italy’s entitlement to the EU Recovery Fund, as the Russia-Ukraine war has changed the context and priorities significantly. This could potentially put the EU’s grants and cheap loans at risk. Under the Draghi government, Italy has secured about 67 billion euros of EU funds. According to the schedule, Italy will receive a further 19 billion Euros recovery funds in the second half of 2022, if it meets previously agreed upon targets. The new government will try to accept the funds and then make any controversial policy changes. On Russia, the conservative parties claimed that Italy would not be the weak link within EU. They pledged respect for NATO commitments, including increasing defense spending. Both Meloni and her Brothers of Italy have endorsed sending weapons to support Ukraine. Still, we think that due to Italy’s historical link with Russia and the need to secure energy supplies, the new government would be more pragmatic toward Russia. On China, Meloni has stressed that Italy will look to limit China’s economic expansion if the right-wing alliance wins. She stated that “Russia is louder at present and China is quieter, but [China’s] penetration is reaching everywhere.” China will want to use diplomacy to curb this kind of thinking in Europe. Meloni also stated that she would not seek to pursue the Belt and Road Initiative pact that Italy signed with China in 2019. In short, we stand firm on our recommendation of underweighting Italian assets at least until a new government is formed. Europe Gets Its Arm Twisted Further The United Kingdom is going through a severe energy, water, and inflation crisis – on top of the long backlog at the National Health Service – as it stumbles through the aftermath of Covid-19 and Brexit. The Conservative Party’s leadership contest is a distraction – political risk will not subside after it is resolved. The new Tory leader will lack a direct popular mandate but the party will want to avoid an early election in the current economic context, creating instability. The looming attempt at a second Scottish independence referendum will also keep risks high, as the outcome this time may be too close to call (Chart 11). Chart 11UK: Tory Leaders A Sideshow, Risks Will Stay High
UK: Tory Leaders A Sideshow, Risks Will Stay High
UK: Tory Leaders A Sideshow, Risks Will Stay High
Germany saw Russia halt natural gas flows through Nord Stream 1 as the great energy cutoff continues. As we have argued since April, Russia’s purpose is to pressure the European economies so that they are more conducive to a ceasefire in Ukraine. Germany will evolve quickly and will improve its energy security faster than many skeptics expect but it cannot do it in a single year. The ruling coalition is also fragile, even though elections are not due anytime soon (Chart 12). Chart 12Germany: Geopolitical Risk Still Rising
Germany: Geopolitical Risk Still Rising
Germany: Geopolitical Risk Still Rising
France’s political risk will also remain high (Chart 13), as domestic politics will be reckless while President Emmanuel Macron and his allies only control 43% of the National Assembly in the aftermath of this year’s election (Chart 14). Chart 13France: Lower Geopolitical Risk Than Germany
France: Lower Geopolitical Risk Than Germany
France: Lower Geopolitical Risk Than Germany
Chart 14Macron Will Focus On Foreign Policy
Odds And Ends (A GeoRisk Update)
Odds And Ends (A GeoRisk Update)
Spain is likely to see its coalition destabilized and early elections, much like Italy this year (Chart 15). Chart 15Spain: Early Elections Likely
Spain: Early Elections Likely
Spain: Early Elections Likely
Sweden, along with Finland, will be joining NATO, which became clear back in April. In this sense it is at the center of Russia’s conflict with the West over NATO enlargement, so we should take a quick look at the Swedish general election on September 11. Currently the left-wing and right-wing blocs are neck and neck in the polls. While the current Social Democrat-led government may well fall from power, Sweden’s new pursuit of NATO membership is unlikely to change. The right-wing parties in Sweden are in favor of joining NATO. The two parties that oppose NATO membership are the left-wing Green and Left Party. The Social Democrats were pro-neutrality until the invasion of Ukraine and since May have spearheaded Swedish accession to NATO. The pro-neutrality bloc currently holds 43 seats in the 349-seats Riksdag. It has a supply-and-confidence arrangement with the current government and is currently polling at 13%. If it was willing and able to derail Sweden’s NATO bid, it would already have happened. So the general election in Sweden is unlikely to stop Sweden from joining. However, Russia does not want Sweden to join and the entire pre- and post-election period is ripe for “black swan” risks and negative surprises. One thing that could change with the election is Sweden’s immigration policy. The Social Democrats are pro-immigration (albeit pro-integration), while the right-wing bloc is less so. Sweden has received a great many asylum seekers since the Syrian refugee crisis in 2015 and will be receiving more from Ukraine and Russia (Chart 16). Chart 16Asylum Seekers to Surpass 2015 Refugee Crisis
Asylum Seekers to Surpass 2015 Refugee Crisis
Asylum Seekers to Surpass 2015 Refugee Crisis
Our Foreign Exchange Strategist Chester Ntonifor points out that the increase in asylum seekers could augment Swedish labor force and increase its potential growth in the long run, while in the short run it could increase demand in the domestic economy. But an increase in demand could also exacerbate inflation in Sweden, especially considering how much the Riksbank is behind the curve vis-à-vis the ECB. Our European Investment Strategy recommends shorting EUR/SEK as Sweden is less vulnerable to Russian energy sanctions. Sweden produces most of its energy from renewable sources. Relative to Europe, Canada faces a much more benign political and geopolitical environment (Chart 17). However, within its own context, it will continue to see more contentious domestic politics as interest rates rise on a society with high household debt and property prices. The post-Covid-19 period will undermine the Justin Trudeau government over time, though it is not facing an election anytime soon. Canada continues to benefit from North America’s geopolitical advantage, though quarrels with China will continue, including over Taiwan, and should be taken seriously. Aside from any China shocks we expect Canadian equities to continue to outperform most global bourses. Chart 17Canada: Low Geopolitical Risk But Not Happy
Canada: Low Geopolitical Risk But Not Happy
Canada: Low Geopolitical Risk But Not Happy
South Africa: The Calm Before The Storm South Africa’s economy remains in a low growth trap, which is contributing to rising political risk (Chart 18). Electricity shortages continue to dampen economic activity. Other structural issues like 33.9% unemployment, worsening social imbalances, and a split in the ruling party threaten to cause negative policy surprises. Chart 18South Africa: Institutional Ruling Party At Risk
South Africa: Institutional Ruling Party At Risk
South Africa: Institutional Ruling Party At Risk
The South African economy has failed to translate growth outcomes into meaningful economic development, leaving low-income households (the median voter) increasingly disenfranchised, burdened, and constrained. Last year’s civil unrest was fueled by economic hardships that persist today. Without a significant and consistent bump to growth, social and political risks will continue to rise. Low-income households remain largely state dependent. Fiscal austerity has already begun to unwind, well before the 2024 election, in a bid to shore up support and quell rising social pressures (Chart 19). Chart 19South Africa: Fiscal Easing Ahead Of 2024 Vote
South Africa: Fiscal Easing Ahead Of 2024 Vote
South Africa: Fiscal Easing Ahead Of 2024 Vote
The fact that the social scene is relatively quiet for now should not be seen as a sign of underlying stability. For example, two of the largest trade unions led a nationwide labor strike last week – while we visited clients in the country! – but failed to “shut down” the country as advertised. Labor union constituents noted the ANC’s economic failures, demanded immediate economic reform, and advocated for a universal basic income grant. This action blew over but the election cycle is only just beginning. Looking forward to the election, President Cyril Ramaphosa’s ANC is still viewed more favorably than the faction led by ex-President Jacob Zuma, but Ramaphosa has suffered from corruption allegations recently that have detracted attention from his anti-corruption and reform agenda and highlighted the party’s shortcomings once again. The ANC’s true political rival, the far-left Economic Freedom Fighters (EFF), have so far failed to capitalize on the weak economic backdrop. The EFF is struggling with leadership battles, thus failing to attract as many soured ANC voters as otherwise possible. If the Economic Freedom Fighters refocus and install new leadership, namely a leader that better reflects the tribal composition of the country, the party will become a greater threat to the ANC. But the overall macro backdrop is a powerful headwind for the ANC’s ability to retain a parliamentary majority. Global macro tailwinds that supported local assets in the first half of the year are experiencing volatility due to China’s sluggish growth and now stimulus efforts. Cooling metals prices and slowing global growth have weighed on the rand and local equity returns. But now China is enacting more stimulus. China is South Africa’s largest trading partner, so the decision to ease policy is positive for next year, even though China’s underlying structural impediments will return in subsequent years. This makes it hard to predict whether South Africa’s economic context will be stable in the lead-up to the 2024 election. As long as China can at least stabilize in the post-pandemic environment in 2023, the ANC will not face as negative of a macro environment in 2024 as would otherwise be the case. Investors will need to watch the risk of political influence on the central bank. Recently the ANC resolved to nationalize the central bank. Nationalization is mostly about official ownership but a change in the bank’s mandate was also discussed. However, to change the bank’s mandate from an inflation target to an unemployment target, the ANC would need to change the constitution. Constitutional change requires a two-thirds vote in parliament, a margin the ANC does not hold. Constitutional change will become increasingly difficult if the ANC sheds more support in the 2024 general election, as expected. Bottom Line: Stay neutral on South Africa until global and Chinese growth stabilize. Political risk is rising ahead of the 2024 election but it is not necessarily at a tipping point. Brazil And Turkey: Election Uncertainty Prevails We conclude with two brief points on Brazil and Turkey, which both face important elections – Brazil immediately and Turkey by June 2023. Both countries have experienced different forms of instability as emerging middle classes face economic disappointment, which has led to political challenges to liberal democracy. Brazil – President Jair Bolsonaro’s popular support is rallying into the election, as expected, but it would require a large unexpected shift to knock former President Lula da Silva off course for re-election this October (Chart 20). Brazil’s first round vote will be held on October 2. If Lula falls short of the 50% majority threshold, then a second round will be held on October 30. Bolsonaro faces an uphill battle because his general popularity is weak – his support among prospective voters stands at 35% compared to Lula at 44% today and Lula at 47% when he left office in 2010. Meanwhile the macroeconomic backdrop has worsened over the course of his four-year term. Bolsonaro will contest the election if it is close so Brazil could face significant upheaval in the short run. Chart 20Brazil: Risk Will Peak Around The Election
Brazil: Risk Will Peak Around The Election
Brazil: Risk Will Peak Around The Election
Turkey – President Recep Erdogan’s approval rating has fallen to 41%, while his disapproval has risen to 54%. It is a wonder his ratings did not collapse sooner given that the misery index is reaching 88%, with headline inflation at 78%. Having altered the constitution to take on greater presidential powers, Erdogan will do whatever it takes to stay in power, but the tide of public opinion is shifting and his Justice and Development Party is suffering from 21 years in power. Erdogan could interfere with NATO enlargement, the EU, Syria and refugees, Greece and Cyprus, North Africa and Libya, or Israel in a way that causes negative surprises for Turkish or even global investors. Turkey will be a source of “black swan” risks at least until after the general election slated for June 2023 (Chart 21). Chart 21Turkey: A Source Of 'Black Swans'
Turkey: A Source Of 'Black Swans'
Turkey: A Source Of 'Black Swans'
We will revisit each these markets in greater detail soon. Matt Gertken Chief Geopolitical Strategist mattg@bcaresearch.com Jesse Anak Kuri Associate Editor Jesse.Kuri@bcaresearch.com Guy Russell Senior Analyst GuyR@bcaresearch.com Yushu Ma Research Analyst yushu.ma@bcaresearch.com Strategic Themes Open Tactical Positions (0-6 Months) Open Cyclical Recommendations (6-18 Months) Regional Geopolitical Risk Matrix Geopolitical Calendar
The German Ifo Business Climate Index edged down to 88.5 in August, from 88.7, above expectations of a stronger deterioration to 86.8. The current situation and expectations sub-components ticked down 0.2 points and 0.1 points, respectively, also beating…
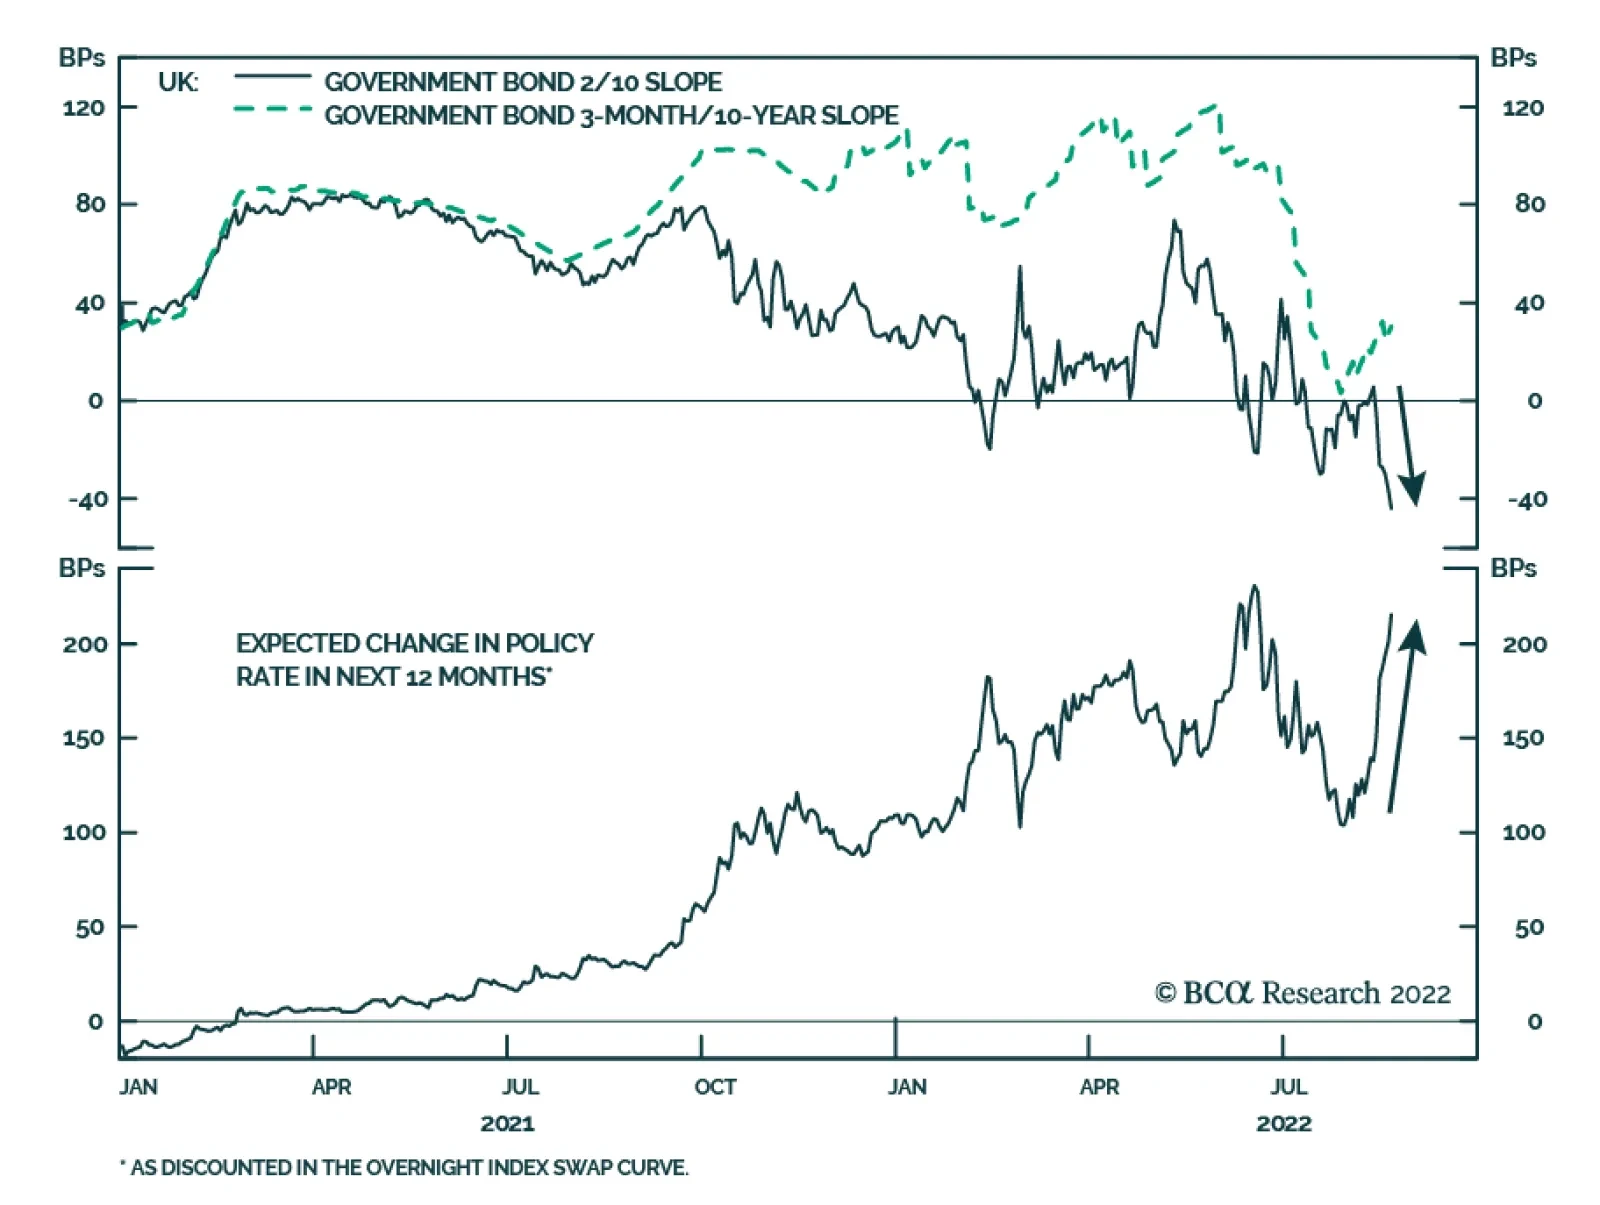
UK Gilts have been selling off sharply since the beginning of August. The yield on the 10-year UK government bond is now over 80bps higher than it was at the start of the month. The move has been even more pronounced at the shorter end of the yield curve.…
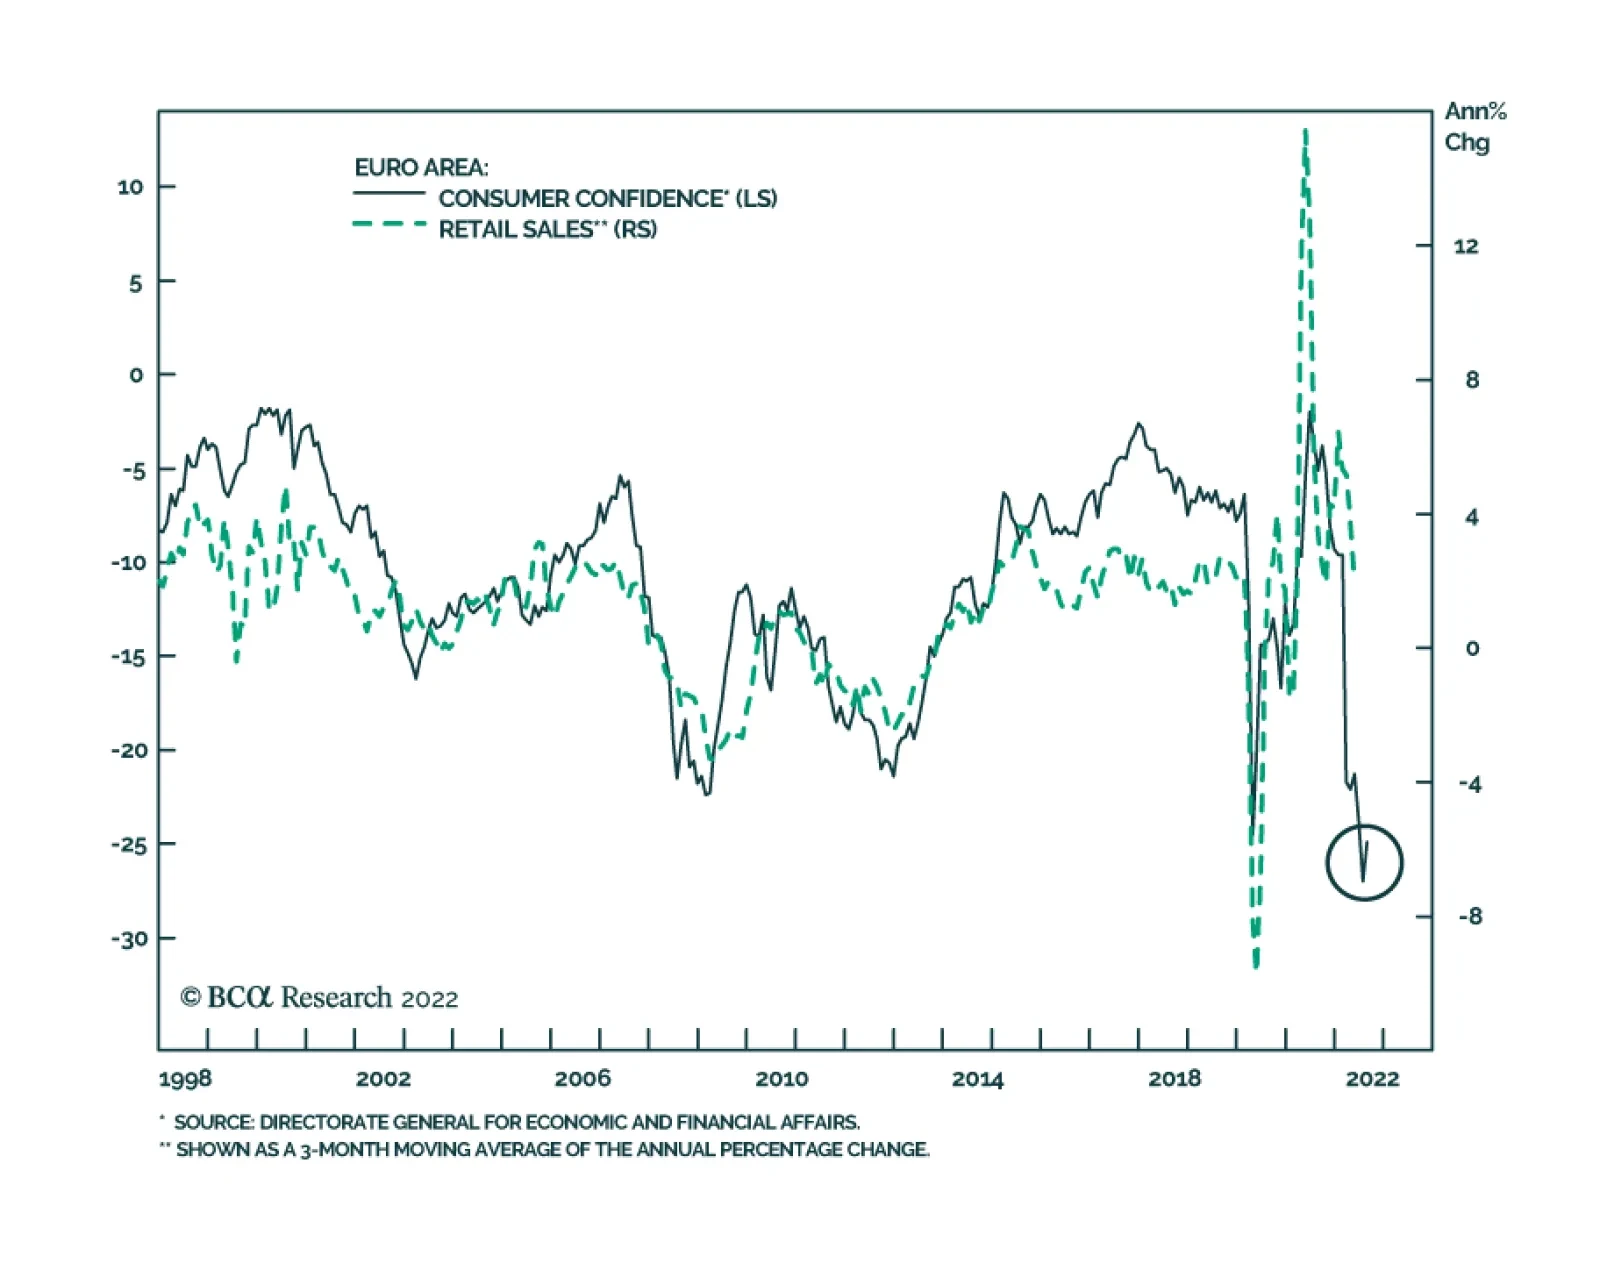
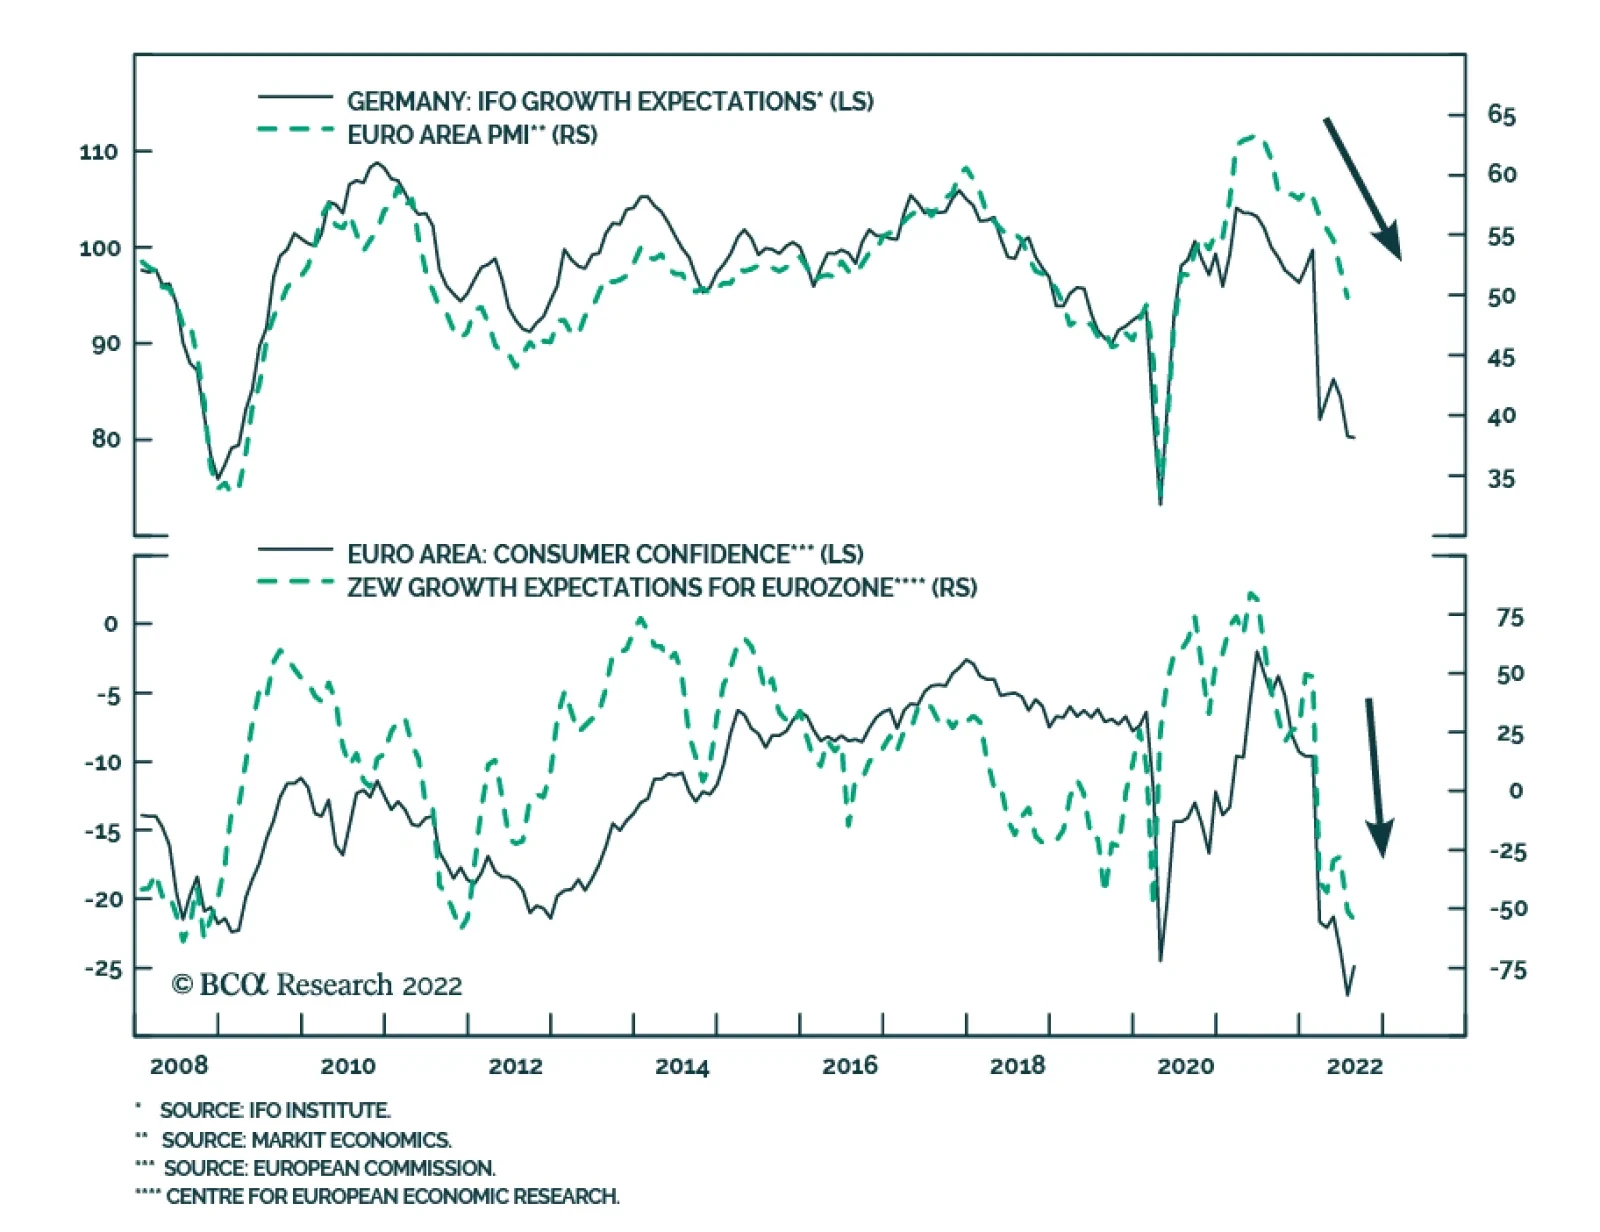
The flash release of the European Commission’s Eurozone consumer confidence in August provides preliminary evidence that sentiment may be in the process of bottoming. It ticked up by 2.1 points to -24.9, surprising expectations of a further deterioration. …
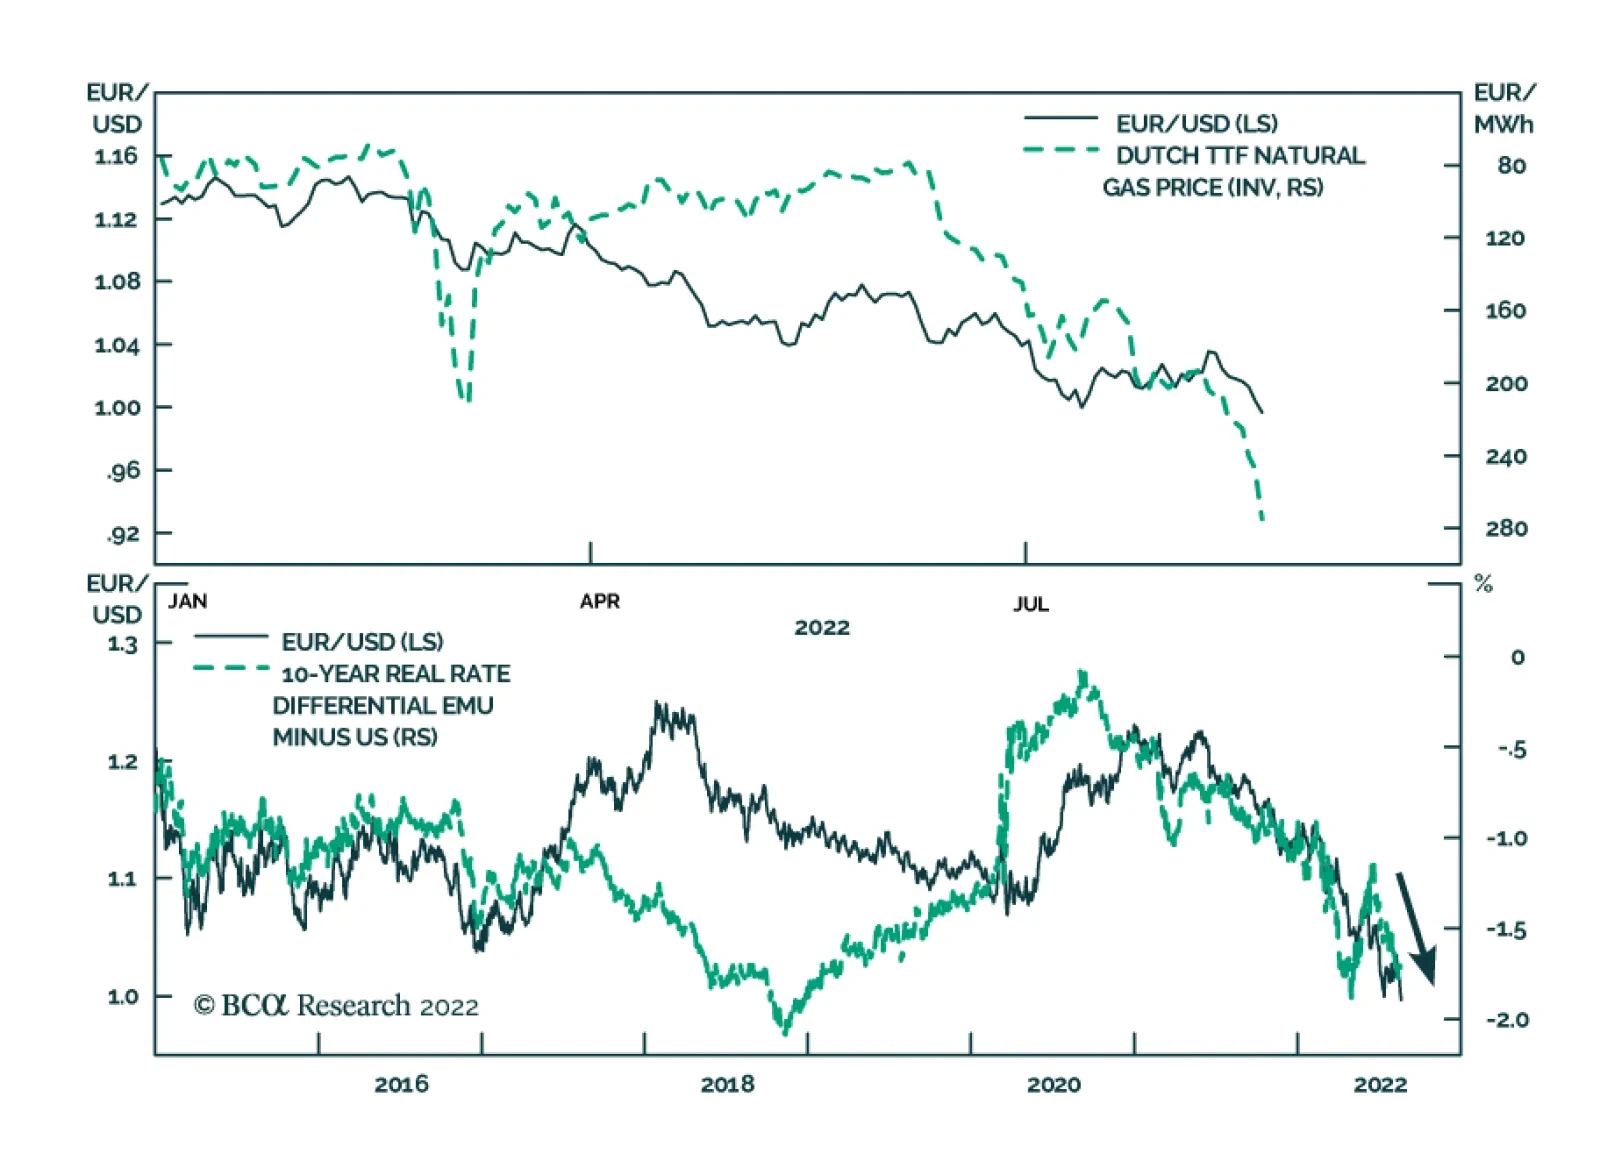
After a brief reprieve since mid-July, EUR/USD has once again broken down over the past week, falling below parity on Monday. The euro’s unrelenting decline over the past year has made it an attractive buy on a valuation basis. Our FX strategists’…
Executive Summary Definitions Matter
Definitions Matter
Definitions Matter
Year-to-date, cyclical stocks have underperformed their defensive counterparts. It is difficult to quantify this underperformance precisely considering the divergence in definitions of what makes a sector cyclical or defensive. We offer a novel way to classify sectors based on a combination of equity beta coefficients and correlations with global macro and financial variables. Importantly, we acknowledge the importance of granularity by looking at the GICS2 sectors. This new approach leads to a cyclicals/defensives equity performance that is superior and more in line with the global economic cycle. Bottom Line: A proper definition of what constitutes a cyclical and a defensive equity sector is essential – whether a recession is around the corner and investors adopt a more defensive portfolio tilt or markets are just responding to what might simply be a mid-cycle slowdown. Investors around the globe are holding their breath over two questions: Has inflation peaked? And will the US and Europe enter a recession? A peak in inflation may be enough to avoid a hard landing, as it would allow the Federal Reserve and the ECB to moderate their policy tightening. However, if inflation is not peaking, central banks will be forced to engineer recessions. Related Report European Investment StrategyPlenty Of Risks For Cyclical Stocks In turn, the answers to these questions will determine how cyclical equities perform relative to defensives. So far, the underperformance of cyclical sectors relative to defensives has mostly reflected a valuation squeeze. But if a recession takes place, relative profits will drive the next phase of this market cycle. For now, European defensive sectors are likely to retain the upper hand until EM/China economic activity recovers enough to provide a lift to cyclical sectors, and/or the US dollar rally reverses course on a sustained basis. Chart 1Definitions Matter
Definitions Matter
Definitions Matter
Despite their recent rebound, Euro Area cyclical stocks have underperformed relative to their defensive counterparts over the past nine months. However, quantifying this underperformance depends on how one defines cyclicals and defensives (Chart 1). The aim of this Special Report is to address this issue. There is no perfect way to define a sector as a cyclical or a defensive. In this piece, we review the generally accepted definitions. We draw two conclusions from our assessment; (i) the GICS1 sectors are too broad to get an accurate representation of cyclicals/defensives, and (ii) the use of only one indicator of cyclicality, such as the OECD Composite Leading Indicator (LEI), is lacking. We propose a different approach, which looks at the GICS2 sectors and applies an average of the market beta and the correlations to a set of global macro as well as financial variables sensitive to the global economy. This novel approach leads to a cyclicals/defensives equity performance that is more properly aligned with the global economic cycle. Challenging the Accepted Approach Each of the definitions of the cyclicals/defensives split has its own merit. For example, our own preferred definition of cyclical equities excludes the tech sector, because it sports a negative correlation with interest rates. Finance theory posits that companies (or sectors) may be categorized based on how they perform in different phases of the business cycle. Consequently, cyclical companies should perform better in the first stages of a new business cycle (especially coming out of a recession) and defensive companies should shine during downturns. Table 1Definitions Matter
Revisiting Cyclicals Versus Defensives
Revisiting Cyclicals Versus Defensives
MSCI defines cyclical and defensive sectors by measuring the correlation between sectors’ relative annual performance to the annual change in the OECD Composite Leading Indicator (LEI) of the corresponding region.1 Table 1 presents the current MSCI classification. There are two issues with this approach. First, results differ substantially depending on the sample period (Table 2). GICS1 sectors match their definitions when using the full history available (from 1995 to present). However, on shorter samples, starting for example from 2005 or 2015, the correlations do not necessarily support the current MSCI classification; the communication services sector correlates negatively with the Euro Area OECD LEI from 2005 to present,2 while the energy sector displays a positive correlation since 2015. Table 2Cyclicality Changes Over Time
Revisiting Cyclicals Versus Defensives
Revisiting Cyclicals Versus Defensives
Looking at the five-year moving correlation of the relative performance of European sectors to the annual change in OECD LEI, four things stand out (Chart 2). First, the energy sector displays a positive correlation, meaning that it behaves as a cyclical. Second, it is not clear that communication services should be labeled a cyclical sector. Third, although tech has on average displayed a five-year moving correlation with activity of around 0.5, it is increasingly behaving like a defensive sector. And fourth, over the past 20 years, all sectors have at one point or another moved from a positive (negative) correlation to a negative (positive) one. Chart 2Cyclicality Is Not Static
Cyclicality Is Not Static
Cyclicality Is Not Static
The second issue with the MSCI approach is the use of the OECD LEIs. While the OECD LEIs are satisfactory at capturing the peaks and troughs in economic activity, we have some concerns over relying on this measure alone to label a sector as cyclical or defensive. Many of the country’s LEIs already include stock prices. Moreover, academic studies have found that the LEIs performed worse than some of their single component indicators, but displayed more accuracy – that is, fewer false signals. In particular, financial components used in some of the country’s LEIs, such as interest rates, spreads, and credit indicators, proved to be better classifiers of both growth and business cycles than the overall LEIs. Chart 3Global Growth Sensitivity
Global Growth Sensitivity
Global Growth Sensitivity
Finally, many (if not most) of the components of the LEIs are domestic variables. As a result, they may not properly reflect how the global economic and trade cycles affect an economy such as that of the Euro Area. In fact, the correlation between the relative performance of Euro Area cyclicals versus defensives and the annual change in the US and Global LEIs is similar to the correlation between the cyclical/defensive split and the Euro Area LEI (Chart 3).3 Reclassifying Cyclicals And Defensives We may draw two conclusions from our earlier assessment; (i) the GICS1 sectors are too broad to secure an accurate definition of cyclicals/defensives, and (ii) the use of only one indicator of cyclicality, such as the OECD LEI, is insufficient. Granularity Holds The Key Many industries or sectors have experienced profound changes over the past decades. Industries evolve and new ones emerge that may disrupt the status quo. For instance, today’s tech sector shares few similarities with its past-self twenty years ago. Chart 4AMore Granularity Needed (I)
More Granularity Needed (I)
More Granularity Needed (I)
Without getting to the company level, many GICS2 sectors already exhibit characteristics deviating substantially from those of the GICS1 sectors of which they are a part (Chart 4A & 4B). Most noticeably: Within industrials: commercial and professional services (9% weight) have a negative correlation with the LEI of -0.23 (Chart 4A, top panel). Within consumer discretionary: the correlation of the retailing sector with the LEI (15% weight) went from 0.75 in the early 2010s to -0.5 in 2018 and has since been trending toward 0 (Chart 4A, third panel). Within tech: software and services (46% weight) sport a negative moving correlation of -0.25, and highlight that this sector has effectively become akin to “digital utilities.” Meanwhile, technology hardware and equipment display a correlation close to 0 (Chart 4A, fourth panel). Chart 4BMore Granularity Needed (II)
More Granularity Needed (II)
More Granularity Needed (II)
Within communication services: telecommunication services (78% weight) still behave like a defensive sector, and it appears that the cyclicality of the GICS1 sector is driven by media and entertainment stocks (Chart 4B, top panel). Within consumer staples: food beverage and tobacco (53% weight) now display a positive correlation of 0.1 with the LEI, whereas it used to have a -0.8 correlation until 2018 (Chart 4B, second panel). Within energy: GICS2 sectors have displayed positive correlations since 2015 (Chart 4B, third panel). For the remaining GICS1 sectors, namely materials, financials, utilities, and healthcare, except for large swings observed in the past, their respective GICS2 sub-sectors currently display correlation coefficients sharing the same sign as their broader aggregates. Thus, adding granularity by looking at the GICS2 sector level instead of the GICS1 classification when creating cyclical and defensive baskets offers a more accurate picture. Good Old Beta Is the market itself the best indicator of a stock’s cyclicality? The returns on the stocks of cyclical (defensive) sectors should reflect high (low) correlation with the market index’s returns. Table 3A presents the beta coefficients obtained from linearly regressing the monthly equity returns of European GICS1 sectors on the monthly equity returns of the All-Country World benchmark. We run into the same issue of getting different results based on the sample period. Historically, the energy sector has had a beta coefficient below 1, but, from 2005, its beta has risen to 1.12. Meanwhile, communication services has a beta coefficient below 1 across all three sample periods selected. Table 3AGICS1 Beta Coefficients
Revisiting Cyclicals Versus Defensives
Revisiting Cyclicals Versus Defensives
We perform the same exercise at the European GICS2 sector level (Table 3B). The results reify the benefit of additional granularity when defining cyclicals and defensives. Table 3BGICS2 Beta Coefficients
Revisiting Cyclicals Versus Defensives
Revisiting Cyclicals Versus Defensives
Combining Correlations With Macro And Financial Variables While stock prices are certainly anticipatory, at times they can also decouple from the business cycle. Equity markets and stock indices are becoming more concentrated, which means that measuring cyclicality through beta alone is no longer sufficient. We complement the use of the beta coefficients with a composite measure of cyclicality based on correlations with global macro and financial variables. We select the following global macro variables (Chart 5A): Global Manufacturing PMI Global Industrial Production G3 Capital New Orders Global Exports Chart 5AGlobal Macro Variables Selected
Global Macro Variables Selected
Global Macro Variables Selected
Chart 5BFinancial Variables Selected
Financial Variables Selected
Financial Variables Selected
And we opt for the following high-frequency financial variables (Chart 5B): Trade-weighted USD: The cyclicals-to-defensives ratio and the trade-weighted US dollar display a robust negative correlation. A strong dollar both tightens global financial conditions and indicates weaker economic growth. GS Commodity Price Index: Commodity prices reflect both global supply and demand dynamics. Strong economic activity usually lifts commodity prices, while a slowdown hurts commodity demand. US 10-year Treasury Yield: The relationship with the US 10-year Treasury yield is somewhat more complex. At the beginning of a new business cycle, higher yields reflect reflation and usually correlate with an outperformance of cyclical equities. However, if yields rise too much, they start hurting growth prospects and end up damaging cyclicals. If they fall, it usually reflects increasing growth fears, which is negative for cyclical shares. Junk Spreads: US high-yield corporate bond spreads and the cyclicals/defensives ratio have a strong negative correlation. Widening junk spreads coincide with the end of the business cycle when fears of rising default risk precede a recession. Although these financial variables are highly anticipatory, they are also prone to whipsaws. Consequently, they must be viewed in conjunction with macro variables. We also compute the five-year moving correlations between monthly equity returns of European sectors relative to the ACW benchmark and the two sets of macro and financial variables (Table 4A & 4B). The results are broadly consistent between the long-term correlations with macro and financial variables, as well as with the beta coefficients,4 which comforts us into using a simple average of the three. Table 4ACombining Coefficients For GICS1 Sectors
Revisiting Cyclicals Versus Defensives
Revisiting Cyclicals Versus Defensives
Table 4BCombining Coefficients For GICS2 Sectors
Revisiting Cyclicals Versus Defensives
Revisiting Cyclicals Versus Defensives
At the GICS1 sector level, our new approach indicates that the energy sector should be treated as a cyclical, not a defensive. In fact, it displays more cyclicality than the tech sector. Communication services should also be defined as cyclicals, although it is less of a clear cut than for the other sectors since the adjusted beta coefficient is the culprit behind the negative sign. Taking a closer look at the GICS2 sector level once again provides valuable insight. The computed mean correlation for cyclical GICS2 sectors is 0.34, with a variance of 0.04 and standard deviation of 0.2. For defensive GICS2 sectors, the computed mean correlation is -0.23, with a variance of 0.02 and a standard deviation of 0.13. Assessing This New Approach Having reclassified the GICS2 sectors as cyclicals or defensives, the next step is to assess how this approach performs compared to the MSCI definition of cyclicals/defensives. To do so, we use the average coefficients displayed on Table 4B to create a dynamic basket of cyclicals and defensives GICS2 sectors. These baskets are weighted by market capitalization and are updated monthly. Chart 6New Baskets Of Cyclicals/Defensives
New Baskets Of Cyclicals/Defensives
New Baskets Of Cyclicals/Defensives
Chart 6 shows how the novel cyclical vs. defensives performs over time in the Euro Area relative to the other definitions. Next, we perform a simple back-testing exercise to assess the performance over time of the new cyclicals-to-defensives ratio, with the Global Manufacturing PMI as a control variable. A superior definition of cyclicals vs. defensives should lead to a better performance of cyclicals when the PMI is above its 50 boom/bust line and improving, and to a better performance of defensives when the PMI is below 50 and deteriorating. We look at coincident equity returns (Table 5A). Overall, the results indicate that our new approach is superior and more accurate, both on a 3- and 12-month time horizon. This is especially true when the global economy is deteriorating. When the PMI is below 50 and falling, our basket of defensives outperforms our basket of cyclicals on average by 20% on a 12-month horizon, compared to 14% using the MSCI definition. Table 5AAssessing The Performance (I)
Revisiting Cyclicals Versus Defensives
Revisiting Cyclicals Versus Defensives
The subsequent performance of cyclicals relative to defensives following certain thresholds for the PMI also reinforces our new approach (Table 5B). Interestingly, our new basket of defensives is the only one to outperform cyclicals twelve months after the Global Manufacturing PMI deteriorated over several months and is below 50. Table 5BAssessing The Performance (II)
Revisiting Cyclicals Versus Defensives
Revisiting Cyclicals Versus Defensives
Bottom Line: We are introducing a new approach to defining cyclical versus defensive equities. GICS1 sectors are too broad to achieve an accurate definition of cyclicality. However, the GICS2 classification offers the necessary level of granularity to do so. Moreover, we broaden the set of variables used to determine whether a GICS2 sector is cyclical or defensive. This new approach offers tighter links with the state of the global economy when selecting cyclical or defensive portfolio biases. For now, since EM economies and China remain under duress and the USD has yet to roll over clearly, we maintain our preference for defensive stocks over their cyclical counterparts within equity portfolios. Jeremie Peloso, Editor/Strategist JeremieP@bcaresearch.com Amr Hanafy Associate Editor AmrH@bcaresearch.com Mathieu Savary, Chief European Strategist Mathieu@bcaresearch.com Footnotes 1 Applied Research MSCI, “Index Performance in Changing Economic Environments,” 2014, p. 4. 2 Admittedly, communications services – formerly known as telecommunication services – was removed from the list of defensive sectors and classified as a cyclical one following the 2018 GICS structure adjustment. 3 In the remainder of the report, the relative equity performance of European sectors is measured against the ACW index. 4 We normalized the beta coefficients to have a mean of zero, to be comparable with correlation coefficients.
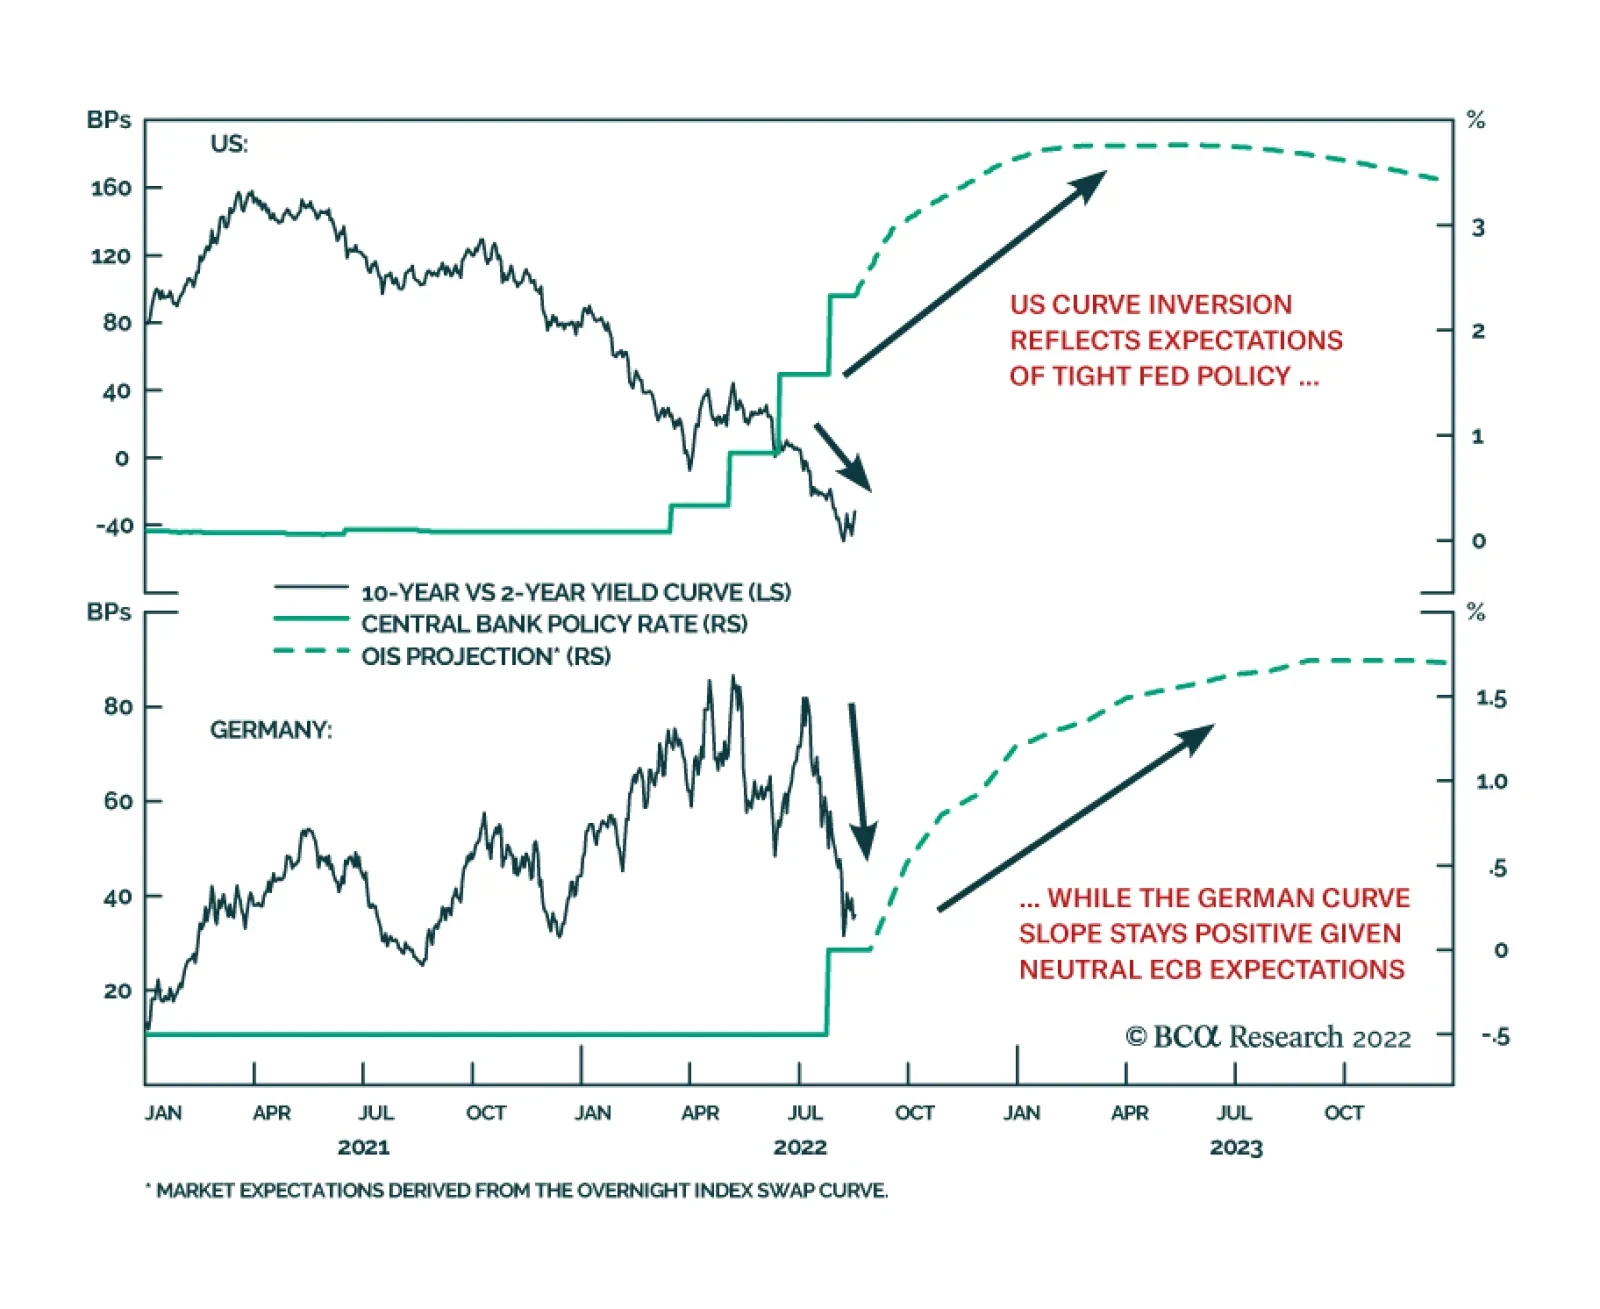
As of Thursday’s close, the 2-year/10-year US Treasury curve is inverted, with the 10-year yield trading -35bps below the 2-year yield. In Europe, there is no inversion, with the 10-year German yield trading 37bps above the 2-year yield. Why the…
Listen to a short summary of this report. Executive Summary Euro Bulls Are Evaporating
Euro Bulls Are Evaporating
Euro Bulls Are Evaporating
The euro is likely to undershoot in the near term, as the winter months approach and economic volatility in Europe rises. However, much of the euro’s troubles are well understood and discounted by financial markets. This suggests a floor closer to parity for the EUR/USD. Unlike many other developed economies, the fiscal drag in the eurozone is likely to be minimal for the rest of this year and early next year. The forces pressuring equilibrium rates lower in the periphery are slowly dissipating. That should lift the neutral rate of interest in the entire eurozone. China’s zero Covid-19 policy along with property market troubles has weighed heavily on the euro, but that could change. RECOMMENDATIONS INCEPTION LEVEL inception date RETURN Long EUR/GBP 0.846 2021-10-15 -0.13 Short EUR/JPY 141.20 2022-07-07 2.46 Bottom Line: The euro tends to be largely driven by pro-cyclical flows, which will be a positive when risk sentiment picks up. Meanwhile, making a structural case for the euro is easy when it comes to valuation. According to our in-house PPP models, an investor who buys the euro today can expect to make 6% a year over the next decade, should the euro mean revert to fair value and beyond. Our current stance is more measured because investors could see capitulation selling in the coming months. Feature Chart 1Two Decades After The Creation Of The Euro
Two Decades After The Creation Of The Euro
Two Decades After The Creation Of The Euro
The creation of the euro was an ambitious project. It began with a simple idea – let’s create the biggest monetary union and everything else will follow, not least, economic might. Over the last two decades, the euro has survived, but its ambitions have been jolted by various crises. Today, the euro is sitting around where it was at the initiation of the project (Chart 1). That has been a tremendous loss in real purchasing power for many of its citizens. Given that we are back to square one, this report examines the prospects for the euro from the lens of its original ambitions, while navigating the economic and geopolitical landscape today. Surviving The Winter Chart 2A European Recession Is Well Priced In
A European Recession Is Well Priced In
A European Recession Is Well Priced In
Winter will be tough for eurozone citizens. But how tough? In our view, less than what the euro is pricing in. According to the ZEW sentiment index, the eurozone manufacturing PMI should be around 45 today, but sits at 49.8. The euro, which has been tracking the ZEW index tick-for-tick has already priced in a deep recession, worse than the 2020 episode (Chart 2). Bloomberg GDP growth consensus forecasts for the eurozone are still penciling in 2.8% growth for 2022, down from a high of 4%. For 2023, forecasts have hit a low of 0.8%. It is certainly possible that euro area growth undershoots this level, which will cause a knee jerk sell off in the euro. However, much of the euro’s troubles are well understood and discounted by financial markets. Natural gas storage is already close to 80%, the EU’s target, to help the eurozone navigate the winter. Coal plants are firing on all cylinders, and Germany has decided to delay the closure of its nuclear power plants. It is true that electricity prices are soaring, but part of the story has been weather-related, notably a heat wave across Europe, falling water levels along the Rhine that has delayed coal shipments, and lower wind speeds that have affected renewable energy generation. France is also having problems with nuclear power generation, due to little availability of water for cooling reactors. Looking ahead, energy markets are already discounting a steep fall in prices from the winter energy cliff (Chart 3). If that turns out to be true, it will be a welcome fillip for eurozone growth. First, it will ease the need for the ECB to tighten policy aggressively, and second, it will boost real incomes, which will support spending. This is not being discussed in financial markets today. Chart 3AFutures Markets Suggest The Energy Crunch Will Ebb
Futures Markets Suggest The Energy Crunch Will Ebb
Futures Markets Suggest The Energy Crunch Will Ebb
Chart 3CFutures Markets Suggest The Energy Crunch Will Ebb
Futures Markets Suggest The Energy Crunch Will Ebb
Futures Markets Suggest The Energy Crunch Will Ebb
Chart 3BFutures Markets Suggest The Energy Crunch Will Ebb
Futures Markets Suggest The Energy Crunch Will Ebb
Futures Markets Suggest The Energy Crunch Will Ebb
Fiscal Policy To The Rescue? Unlike many other developed economies, the fiscal drag in the eurozone is likely to be minimal for the rest of this year and early next year (Chart 4). As funds from the next generation EU plan are being disbursed into strategic sectors, including renewable energy, Europe’s productive capital base will also improve. This is likely to have a huge multiplier effect on European growth. Chart 4AThe Fiscal Drag In The Eurozone Could Be Minimal
The Fiscal Drag In The Eurozone Could Be Minimal
The Fiscal Drag In The Eurozone Could Be Minimal
Chart 4BThe Fiscal Drag In The Eurozone Could Be Minimal
The Fiscal Drag In The Eurozone Could Be Minimal
The Fiscal Drag In The Eurozone Could Be Minimal
Taking a bigger-picture view, what has become evident in recent years is stronger solidarity among eurozone countries, both economically and politically. Related Report Foreign Exchange StrategyMonth In Review: Inflation Is Still Accelerating Globally Economically, the standard dilemma for the eurozone was that interest rates were too low for the most productive nation, Germany, but too expensive for others, such as Spain and Italy. As such, the euro was often caught in a tug of war between a rising equilibrium rate of interest for Germany, but a very low neutral rate for the peripheral countries. The good news is that for the eurozone, a lot of this internal rupture has been partly resolved. Labor market reforms have seen unit labor costs in Greece, Ireland, Portugal and Spain collectively contract since 2008. This has effectively eliminated the competitiveness gap with Germany, accumulated over the last two decades (Chart 5). Italy remains saddled with a rigid and less productive workforce, but the overall adjustments have still come a long way to close a key fissure plaguing the common currency area. The result has been a collapse in peripheral borrowing spreads, relative to Germany (Chart 6). Ergo, interest payments as a share of GDP are now manageable. It is true that Italy remains a basket case but the ECB’s Transmission Protection Instrument (TPI) will ensure that peripheral spreads remain well contained and a liquidity crisis (in Italy) does not morph into a solvency one. Chart 5The Periphery Is Now Competitive
The Periphery Is Now Competitive
The Periphery Is Now Competitive
Chart 6Peripheral Spreads Are Still Contained In Real Terms
Peripheral Spreads Are Still Contained In Real Terms
Peripheral Spreads Are Still Contained In Real Terms
Beyond the adjustment in competitiveness, productivity among eurozone countries might also converge. Our European Investment Strategy colleagues suggest that the neutral rate is still wide between Germany and the periphery. That said, gross fixed capital formation in the periphery has been surging relative to core eurozone members (Chart 7). If this capital is deployed in the right sectors, it will have two profound impacts. First, the neutral rate of interest in the eurozone will be lifted from artificially low levels. The proverbial saying is that a chain is only as strong as its weakest link. This means that if the forces pressuring equilibrium rates lower in the periphery are slowly dissipating, that should lift the neutral rate of interest in the entire eurozone. Over a cyclical horizon, this should be unequivocally bullish for the euro. Second, and more importantly, economic solidarity among eurozone members will help ensure the survival of the euro, over the next decade and beyond. Chart 7The Periphery Could Become More Productive
The Periphery Could Become More Productive
The Periphery Could Become More Productive
Trading The Euro The above analysis suggests long-term investors should be buying the euro today. However, the long run can be a very long time to be offside. Our trading strategy is as follows: Over the next 6 months, stay neutral to short the euro. The economic landscape for the eurozone remains fraught with risk. This is a typical recipe for a currency to undershoot. Eurozone banks are very sensitive to economic conditions in the eurozone, and ultimately the performance of the euro, and the signal from bank shares remains negative (Chart 8). Chart 8European Banks Are Not Part Of The Agenda Watch Eurozone Banks
European Banks Are Not Part Of The Agenda Watch Eurozone Banks
European Banks Are Not Part Of The Agenda Watch Eurozone Banks
Investors have been cutting their forecasts for the euro but have not yet capitulated. Bets are that the euro will be at 1.10 by the end of next year, and 14% higher in two years. A bottom will be established when investors cut their forecasts below current spot prices (Chart 9). This corroborates with data from net speculative positions that have yet to hit rock bottom. Chart 9Euro Bulls Are Evaporating
Euro Bulls Are Evaporating
Euro Bulls Are Evaporating
Real interest rates in the euro area are still plunging across the curve, relative to the US. The two-year real yield has hit a cyclical low. Five-year, 10-year and 30-year real yields are also falling. Historically, the euro tends to trend higher when interest rate differentials are moving in favor of the eurozone (Chart 10). Chart 10AReal Rates Are Dropping In The Euro Area
Real Rates Are Dropping In The Euro Area
Real Rates Are Dropping In The Euro Area
Chart 10BReal Rates Are Dropping In The Euro Area
Real Rates Are Dropping In The Euro Area
Real Rates Are Dropping In The Euro Area
Hedging costs have risen tremendously, as the forward market (like investors) is already pricing in an appreciation in the euro. The embedded two-year return for EUR investors is circa 4%, in line with the carry costs (Chart 11). In real terms, the returns are closer to 9% to compensate for much higher inflation expectations in the eurozone. Higher hedging costs will dissuade foreign investors from gobbling up European assets on a hedged basis. Chart 11A 5% Rally In The Euro Is Already Anticipated
A 5% Rally In The Euro Is Already Anticipated
A 5% Rally In The Euro Is Already Anticipated
In short, the euro is likely to enter a capitulation phase. Our sense is that that it will push EUR/USD below parity, towards 0.98. Below that level, we believe the risk/reward profile will become much more attractive for both short- and longer-term investors. Signals From External Demand Chart 12The Euro Is Increasingly Dependant On Chinese Data
The Euro Is Increasingly Dependant On Chinese Data
The Euro Is Increasingly Dependant On Chinese Data
The eurozone is a very open economy. Exports of goods and services represented 51% of euro area GDP in 2021. This means that what happens with external demand, especially in the US, the UK and China, matters for European growth (Chart 12). Of all its major export partners, China is the biggest question mark. China’s zero Covid-19 policy along with property market troubles has weighed heavily on the euro. Historically, the Chinese credit impulse has been a good coincident indicator for EUR/USD. Lately, that relationship has decoupled (Chart 13A). We favor the view that the credit transmission mechanism in China is merely delayed, rather than broken. For one, a rising Chinese credit impulse usually leads European exports, and this time should be no different. Chinese bond markets are also becoming more liberalized, and as such are a key signal for financial conditions in China. For over a decade, easing financial conditions have usually been a good signal that import demand is about to improve (Chart 13B). This is good news for European export demand. The bottom line is that investors are currently too pessimistic on Europe’s growth prospects at a time when a few green shoots are emerging for external demand. That may not save the euro in the near term but will be a welcome fillip for euro bulls when it does undershoot. Chart 13AThe Muse For The Euro Is Chinese Data
The Muse For The Euro Is Chinese Data
The Muse For The Euro Is Chinese Data
Chart 13BThe Muse For The Euro Is Chinese Data
The Muse For The Euro Is Chinese Data
The Muse For The Euro Is Chinese Data
Concluding Thoughts Chart 14The Goldilocks Case For The Euro
The Goldilocks Case For The Euro
The Goldilocks Case For The Euro
The euro tends to be largely driven by pro-cyclical flows. Fortunately for investors, European equities remain unloved, given that they are trading at some of the cheapest cyclically adjusted price-to-earnings multiples in the developed world. Analysts are aggressively revising up their earnings estimates for eurozone equities, relative to the US. They might be wrong in the near term, but over a 9-to-12-month horizon, this has been a good leading indicator for the euro. Making a structural case for the euro is easy when it comes to valuation. According to our in-house PPP models, an investor who buys the euro today can expect to make 6% a year over the next decade, should the euro mean revert to fair value and beyond (Chart 14). Meanwhile, beyond the winter months, inflation could come crashing back to earth in the eurozone, which will provide underlying support for the fair value of the currency. Our near-term stance is more measured because investors are only neutral the euro, and risk reversals are not yet at a nadir. This is particularly relevant given that Europe still has a war in its backyard, with the potential of generating more market volatility ahead. Given this confluence of factors, we have chosen to play euro via two channels: Long EUR/GBP: As we argued last week, the UK has a bigger stagflation problem compared to the eurozone. This trade is also a bet on improving economic fundamentals between the eurozone and the UK, as well as a bet on policy convergence between the two economies. Short EUR/JPY: The yen is even cheaper than the euro. In a risk-off environment, EUR/JPY will sell off. In a risk-on environment, the yen can still benefit since it is oversold. Meanwhile, investors remain bullish EUR/JPY. Long EUR/USD: We will go long the euro if it breaks below 0.98. Chester Ntonifor Foreign Exchange Strategist chestern@bcaresearch.com Trades & Forecasts Strategic View Cyclical Holdings (6-18 months) Tactical Holdings (0-6 months) Limit Orders Forecast Summary
Dispatches From The Future: From Goldilocks To President DeSantis
Listen to a short summary of this report. Executive Summary Back From The Future: An Investor’s Almanac
Dispatches From The Future: From Goldilocks To President DeSantis
Dispatches From The Future: From Goldilocks To President DeSantis
Stocks will rally over the next six months as recession risks abate but then begin to swoon as it becomes clear the Fed will not cut rates in 2023. A second wave of inflation will begin in mid-2023, forcing the Fed to raise rates to 5%. The 10-year US Treasury yield will rise above 4%. While financial conditions are currently not tight enough to induce a recession, they will be by the end of next year. In the past, the US unemployment rate has gone through a 20-to-22 month bottoming phase. This suggests that a recession will start in early 2024. The US dollar will soften over the next six months but then get a second wind as the Fed is forced to turn hawkish again. Over the long haul, the dollar will weaken, reflecting today’s extremely stretched valuations. Bottom Line: Investors should remain tactically overweight global equities but look to turn defensive early next year. Somewhere in Hilbert Space I have long believed that anything that can possibly happen in financial markets (as well as in life) will happen. Sometimes, however, it is useful to focus on a “base case” or “modal” outcome of what the world will look like. In this week’s report, we do just that, describing the evolution of the global economy from the perspective of someone who has already seen the future unfold. September 2022 – Goldilocks! US headline inflation continues to decline thanks to lower food and gasoline prices (Chart 1). Supply-chain bottlenecks ease, as evidenced by falling transportation costs and faster delivery times (Chart 2). Most measures of economic activity bottom out and then begin to rebound. The surge in bond yields earlier in 2022 pushed down aggregate demand, but with yields having temporarily stabilized, demand growth returns to trend. The S&P 500 moves up to 4,400. Chart 1ALower Food And Gasoline Prices Will Drag Down Headline Inflation (I)
Lower Food And Gasoline Prices Will Drag Down Headline Inflation (I)
Lower Food And Gasoline Prices Will Drag Down Headline Inflation (I)
Chart 1BLower Food And Gasoline Prices Will Drag Down Headline Inflation (II)
Lower Food And Gasoline Prices Will Drag Down Headline Inflation (II)
Lower Food And Gasoline Prices Will Drag Down Headline Inflation (II)
October 2022 – Europe’s Prospects of Avoiding a Deep Freeze Improve: Economic shocks are most damaging when they come out of the blue. With about half a year to prepare for a cut-off of Russian gas, the EU responds with uncharacteristic haste: Coal-fired electricity production ramps up; the planned closure of Germany’s nuclear power plants is postponed; the French government boosts nuclear capacity, which had been running at less than 50% earlier in 2022; and, for its part, the Dutch government agrees to raise output from the massive Groningen natural gas field after the EU commits to establishing a fund to compensate the surrounding community for any damage from increased seismic activity. EUR/USD rallies to 1.06. November 2022 – Divided Congress and Trump 2.0: In line with pre-election polling, the Democrats retain the Senate but lose the House (Chart 3). Markets largely ignore the outcome. To no one’s surprise, Donald Trump announces his candidacy for the 2024 election. Over the following months, however, the former president has trouble rekindling the magic of his 2016 bid. His attacks on his main rival, Florida governor Ron DeSantis, fall flat. At one rally in early 2023, Trump’s claim that “Ron is no better than Jeb” is greeted with boos. Chart 2Supply-Chain Pressures Are Easing
Supply-Chain Pressures Are Easing
Supply-Chain Pressures Are Easing
Chart 3Democrats Will Lose The House But Retain The Senate
Dispatches From The Future: From Goldilocks To President DeSantis
Dispatches From The Future: From Goldilocks To President DeSantis
December 2022 – China’s “At Least One Child Policy”: The 20th Party Congress takes place against the backdrop of strict Covid restrictions and a flailing housing market. In addition to reaffirming his Common Prosperity Initiative, President Xi stresses the need for actions that promote “family formation.” The number of births declined by nearly 30% between 2019 and 2021 and all indications suggest that the birth rate fell further in 2022 (Chart 4). Importantly for investors, Xi says that housing policy should focus not on boosting demand but increasing supply, even if this comes at the expense of lower property prices down the road. Base metal prices rally on the news. Chart 4China's Baby Bust
China's Baby Bust
China's Baby Bust
January 2023 – Putin Declares Victory: Faced with continued resistance by Ukrainian forces – which now have wider access to advanced western military technology – Putin declares that Russia’s objectives in Ukraine have been met. Following the playbook in Crimea and the Donbass, he orders referenda to be held in Zaporizhia, Kherson, and parts of Kharkiv, asking the local populations if they wish to join Russia. The legitimacy of the referenda is immediately rejected by the Ukrainian government and the EU. Nevertheless, the Russian military advance halts. While the West pledges to maintain sanctions against Russia, the geopolitical risk premium in oil prices decreases. February 2023 – Credit Spreads Narrow Further: At the worst point for credit in early July 2022, US high-yield spreads were pricing in a default rate of 8.1% over the following 12 months (Chart 5). By late August, the expected default rate has fallen to 5.2%, and by January 2023, it has dropped to 4.5%. Perceived default risks decline even more in Europe, where the economy is on the cusp of a V-shaped recovery following the prior year’s energy crunch. Chart 5The Spread-Implied Default Rate Has Room To Fall If Recession Fears Abate
The Spread-Implied Default Rate Has Room To Fall If Recession Fears Abate
The Spread-Implied Default Rate Has Room To Fall If Recession Fears Abate
March 2023 – Wages: The New Core CPI? US inflation continues to drop, but a heated debate erupts over whether this merely reflects the unwinding of various pandemic-related dislocations or whether it marks true progress in cooling down the economy. Those who argue that higher interest rates are cooling demand point to the decline in job openings. Skeptics retort that the drop in job openings has been matched by rising employment (Chart 6). To the extent that firms have been converting openings into new jobs, the skeptics conclude that labor demand has not declined. In a series of comments, Jay Powell stresses the need to focus on wage growth as a key barometer of underlying inflationary pressures. Given that wage growth remains elevated, market participants regard this as a hawkish signal (Chart 7). The 10-year Treasury yield rises to 3.2%. The DXY index, having swooned from over 108 in July 2022 to just under 100 in February 2023, moves back to 102. After hitting a 52-week high of 4,689 the prior month, the S&P 500 drops back below 4,500. Chart 6Drop In Job Openings Is Matched By Rise In Employment
Drop In Job Openings Is Matched By Rise In Employment
Drop In Job Openings Is Matched By Rise In Employment
Chart 7Wage Growth Remains Strong
Wage Growth Remains Strong
Wage Growth Remains Strong
April 2023 – Covid Erupts Across China: After successfully holding back Covid for over three years, the dam breaks. When lockdowns fail to suppress the outbreak, the government shifts to a mitigation strategy, requiring all elderly and unvaccinated people to isolate at home. It helps that China’s new mRNA vaccines, launched in late 2022, prove to be successful. By early 2023, China also has sufficient supplies of Pfizer’s Paxlovid anti-viral drug. Nevertheless, the outbreak in China temporarily leads to renewed supply-chain bottlenecks. May 2023 – Biden Confirms He Will Stand for Re-Election: Saying he is “fit as a fiddle,” President Biden confirms that he will seek a second term in office. Little does he know that the US will be in a recession during most of his re-election campaign. Chart 8Consumer Confidence And Real Wages Tend To Move Together
Consumer Confidence And Real Wages Tend To Move Together
Consumer Confidence And Real Wages Tend To Move Together
June 2023 – Inflation: The Second Wave Begins: The decline in inflation between mid-2022 and mid-2023 sows the seeds of its own demise. As prices at the pump and in the grocery store decline, real wage growth turns positive. Consumer confidence recovers (Chart 8). Household spending, which never weakened that much to begin with, surges. The economy starts to overheat again, leading to higher inflation. After having paused raising rates at 3.5% in early 2023, the Fed indicates that further hikes may be necessary. The DXY index strengthens to 104. The S&P 500 dips to 4,300. July 2023 – Tech Stock Malaise: Higher bond yields weigh on tech stocks. Making matters worse, investors start to worry that many of the most popular US tech names have gone “ex-growth.” The evolution of tech companies often follows three stages. In the first stage, when the founders are in charge, the company grows fast thanks to the introduction of new, highly innovative products or services. In the second stage, as the tech company matures, the founders often cede control to professional managers. Company profits continue to grow quickly, but less because of innovation and more because the professional managers are able to squeeze money from the firm’s customers. In the third stage, with all the low-lying fruits already picked, the company succumbs to bureaucratic inertia. As 2023 wears on, it becomes apparent that many US tech titans are entering this third stage. August 2023 – Long-term Inflation Expectations Move Up: Unlike in 2021-22, when long-term inflation expectations remained well anchored in the face of rising realized inflation, the second inflation wave in 2023 is accompanied by a clear rise in long-term inflation expectations. Consumer expectations of inflation 5-to-10 years out in the University of Michigan survey jump to 3.5%. Whereas back in August 2022, the OIS curve was discounting 100 basis points of Fed easing starting in early 2023, it now discounts rate hikes over the remainder of 2023 (Chart 9). The 10-year yield rises to 3.8%. The 10-year TIPS yield spikes to 1.2%, as investors price in a higher real terminal rate. The S&P 500 drops to 4,200. The financial press is awash with comparisons to the early 1980s (Chart 10). Chart 9The Markets Expect The Fed To Cut Rates By Over 100 Basis Points Starting In 2023
The Markets Expect The Fed To Cut Rates By Over 100 Basis Points Starting In 2023
The Markets Expect The Fed To Cut Rates By Over 100 Basis Points Starting In 2023
Chart 10The Early-1980s Playbook
The Early-1980s Playbook
The Early-1980s Playbook
October 2023 – Hawks in Charge: After a second round of tightening, featuring three successive 50 basis-point hikes, the Fed funds rate reaches a cycle peak of 5%. The 10-year Treasury yield gets up to as high as 4.28%. The 10-year TIPS yield hits 1.62%. The DXY index rises to 106. The S&P 500 falls to 4,050. November 2023 – Housing Stumbles: With mortgage yields back above 6%, the US housing market weakens anew. The fallout from rising global bond yields is far worse in some smaller developed economies such as Canada, Australia, and New Zealand, where home price valuations are more stretched (Chart 11). Chart 11Rising Rates Will Weigh On Developed Economies With Pricey Housing Markets
Rising Rates Will Weigh On Developed Economies With Pricey Housing Markets
Rising Rates Will Weigh On Developed Economies With Pricey Housing Markets
January 2024 – Unemployment Starts to Rise: After moving sideways since March 2022, the US unemployment rate suddenly jumps 0.2 percentage points to 3.6%, with payrolls contracting for the first time since the start of the pandemic. The 22-month stretch of a flat unemployment rate is broadly in line with the historic average (Table 1). Table 1In Past Cycles, The Unemployment Rate Has Moved Sideways For Nearly Two Years Before A Recession Began
Dispatches From The Future: From Goldilocks To President DeSantis
Dispatches From The Future: From Goldilocks To President DeSantis
February 2024 – The US Recession Begins: Although there was considerable debate about whether the US was entering a recession at the time, in early 2025, the NBER would end up declaring that February 2024 marked the start of the recession. The 10-year yield falls back below 4% while the S&P 500 drops to 3,700. Lower bond yields are no longer protecting stocks. March 2024 – The Fed Remains in Neutral: Jay Powell says further rate hikes are unwarranted in light of the weakening economy, but with core inflation still running at 3.5%, the Fed is in no position to ease. April 2024 – The Global Recession Intensifies: The US unemployment rate rises to 4.7%. The economic downdraft is especially sharp in America’s neighbor to the north, where the Canadian housing market is in shambles. Back in June 2022, the Canadian 10-year yield was 21 basis points above the US yield. By April 2024, it is 45 basis points below. Europe and Japan also fall into recession. Commodity prices continue to drop, with Brent oil hitting $60/bbl. May 2024 – The Fed Cuts Rates: Reversing its position from just two months earlier, the Federal Reserve cuts rates for the first time since March 2020, lowering the Fed funds rate from 5% to 4.5%. The Fed funds rate will ultimately bottom at 2.5%, below the range of 3.5%-to-4% that most economists will eventually recognize as neutral. August 2024 – Republican National Convention: Unwilling to spend much of his own money on the campaign, and with most donations flowing to DeSantis, Trump’s bid to reclaim the White House fizzles. While the former president never formally bows out of the race, the last few months of his primary campaign end up being a nostalgia tour of his past accomplishments, interspersed with complaints about all the ways that he has been wronged. In the end, though, Trump makes a lasting imprint on the Republican party. During his acceptance speech, in typical Trumpian style, Ron DeSantis attacks Joe Biden for “eating ice cream while the economy burns” and declares, to thunderous applause, that “Americans are sick and tired of having woke nonsense hurled in their faces and then being dared to deny it at the risk of losing their jobs.” Chart 12The Dollar Is Very Overvalued
The Dollar Is Very Overvalued
The Dollar Is Very Overvalued
October 2024 – The Stock Market Hits Bottom: While the unemployment rate continues to rise for another 12 months, ultimately reaching 6.4%, the S&P troughs at 3,200. The 10-year Treasury yield settles at 3.1% before starting to drift higher. The US dollar, which began to weaken anew after the Fed starts cutting rates, enters a prolonged bear market. As in past cycles, the dollar is unable to defy the gravitational force from extremely stretched valuations (Chart 12). November 2024 – President DeSantis: Against the backdrop of rising unemployment, uncomfortably high inflation, and a sinking stock market, Ron DeSantis cruises to victory in the 2024 presidential election. Unlike Trump, DeSantis deemphasizes corporate tax cuts and deregulation during his presidency, focusing instead on cultural issues. With the Democrats still committed to progressive causes, big US corporations discover that for the first time in modern history, neither of the two major political parties are willing to champion their interests. Peter Berezin Chief Global Strategist peterb@bcaresearch.com Follow me on LinkedIn & Twitter Global Investment Strategy View Matrix
Dispatches From The Future: From Goldilocks To President DeSantis
Dispatches From The Future: From Goldilocks To President DeSantis
Special Trade Recommendations Current MacroQuant Model Scores
Dispatches From The Future: From Goldilocks To President DeSantis
Dispatches From The Future: From Goldilocks To President DeSantis
Executive Summary Russia’s Crude Oil Output Will Fall
EU Russian Oil Embargoes, Higher Prices
EU Russian Oil Embargoes, Higher Prices
Russia will have to lower oil production to ensure output it hasn’t placed with non-EU buyers does not tax its limited storage facilities, ahead of the bloc’s December 5 embargo. The EU’s insurance/reinsurance ban on ships carrying Russian material also commences in December. It will profoundly affect Russian output, if fully implemented. Russian and Chinese firms will expand ship-to-ship transfers on the high seas, along with external processing and storage services to mask crude and product exports. The EU embargos will force Russia to shut in ~ 1.6mm b/d of output by year-end, rising to 2mm b/d in 2023, by our reckoning. Gas-to-oil switching in Europe will boost distillate and residual fuel demand by ~ 800K b/d this winter. Chinese policymakers will be compelled to deploy greater fiscal and credit support to reverse weakening GDP. Tighter monetary policy in DM economies will dampen aggregate demand. Bottom Line: EU embargoes on Russian oil imports will significantly tighten markets, and lift Brent to $119/bbl by year-end. This has a 60% chance of being offset by ~ 1mm b/d of Iranian oil exports in 2023, in our estimation. We are maintaining our Brent forecast at $110/bbl on average for this year, and $117/bbl next year. WTI will trade $3-$5/bbl lower. At tonight’s close we are re-establishing our long COMT ETF position. Risks remain to the upside. Feature Chart 1Russia’s Crude Oil Output Will Fall
EU Russian Oil Embargoes, Higher Prices
EU Russian Oil Embargoes, Higher Prices
Following an unexpected increase in production during June and July, Russia will have to begin reducing its oil output ahead of the implementation of the EU’s embargo on its seaborne crude oil imports, which kicks on December 5. EU, UK and US shipping insurance and reinsurance sanctions also are scheduled to be implemented in December. If fully implemented, ~ 2.3mm b/d of seaborne imports of Russian crude oil will be excluded from EU markets by year-end. Come February, another 800k b/d of refined products will be embargoed. On the back of these lost sales, and production that cannot be loaded on ships due to insurance/reinsurance bans, we expect Russian production to fall ~ 2mm b/d by the end of next year (Chart 1).1 As noted in previous research, a goodly chunk of Russian crude continues to go to China and India. Together, these two states accounted for just over 40% of Russia’s crude sales last month – ~ 1.9mm b/d of a total of ~ 4.5mm b/d. This is down from just under 45.5% in May, according to Reuters. Both China and India have benefited from discounted prices of ~ 30% vs. Brent, which is a powerful inducement to buy. Asia accounts for more than half of Russia’s seaborne crude oil sales, according to Bloomberg data. Related Report Commodity & Energy StrategyTighter Oil Markets On The Way Whether China and India can maintain these purchases depends on whether ships taking oil to them can get their cargoes insured. Both states have domestic insurance providers, and, in the case of the latter, long-standing trade relationships going back decades. Other Asian economies do not have such financial infrastructure. Still, this is a high concentration of sales to two buyers. In addition, press reports indicate China spent $347mm to secure tankers to conduct high-risk ship-to-ship (STS) transfers of Russian crude in the Atlantic Ocean.2 Similar STS transfers have been used to move ~ 1.2mm b/d of Iranian and Venezuelan crude oil, most of which ends up in China, according to Lloyds. Base Case Sees Markets Balance In our base case analysis, markets remain relatively balanced going into winter. On the supply side, we expect core OPEC 2.0 – the Kingdom of Saudi Arabia (KSA) and the United Arab Emirates (UAE) – to continue to provide crude to the markets subject to their spare-capacity constraints (Chart 2, top panel). KSA likely will be producing close to 11mm b/d by year-end – vs its current output of 10.6mm b/d output presently – and the UAE will be close to 3.5mm b/d, vs 3.1mm b/d at present. KSA’s max capacity is 12mm b/d, while the UAE’s is 4mm b/d; both will want to maintain spare capacity to offset unexpected exogenous supply shocks next year. These two states account for most of the spare capacity in the world (Chart 3). The rest of OPEC 2.0 will continue to struggle to maintain its production, which makes the core producers’ spare capacity critically important (Chart 2, bottom panel). Chart 2Core OPEC 2.0 Will Increase Supply
EU Russian Oil Embargoes, Higher Prices
EU Russian Oil Embargoes, Higher Prices
Chart 3Spare Capacity Concentrated In Core OPEC 2.0
EU Russian Oil Embargoes, Higher Prices
EU Russian Oil Embargoes, Higher Prices
Outside of OPEC 2.0, we are expecting the largest contribution to global supply will continue to come from US shale production (Chart 4). Shale-oil output in the top 5 US basins is expected to increase ~540K b/d this year, and next. This will take shale output to slighly above 7.5mm b/d and account for 76% of Lower 48 production in the States this year. Next year, we are expecting US Lower 48 production to rise 700K b/d, and for total US crude output to go to 12.8mm b/d, a new record. Chart 4US Remains Top Non-OPEC 2.0 Supplier
US Remains Top Non-OPEC 2.0 Supplier
US Remains Top Non-OPEC 2.0 Supplier
This winter we are expecting an uptick in oil demand – particularly for distillates like gasoil and diesel in Europe, as EU firms switch from natural gas to oil on the margin. We expect this will add 800K b/d of demand over the winter months (November through March), which will lift our overall demand estimate 150k b/d this year, and 20K b/d next year – +2.19mm b/d vs +2.04mm b/d, and 1.82mm b/d vs. 1.80mm b/d next year. Chinese year-on-year oil demand growth remains negative. January-July 2022 demand was 15.24mm b/d vs 15.34mm b/d in 2021, continuing a string of y/y contractions. The two other major economic pillars of global oil demand – the US and Europe – show positive y/y growth of 800K b/d each over the same period. Global demand in 1H22 recovered to 98% of its pre-COVID-19 level – even with China’s negative y/y growth – while supply recovered to 96% of its pre-pandemic level, according to the International Energy Forum (IEF). Over most of the forecast period, we estimate global balances will continue to show the level of supply below that of demand, which will lead to continued physical deficits (Chart 5). Refined-product inventories increased by 34mm barrels in 1H22, while crude-oil stocks fell 23mm barrels. Global crude and product inventories are ~ 460mm barrels below their five-year average, which includes pandemic demand destruction, the IEF reported. We continue to expect inventories to remain below their 2010-14 average, which we prefer to track – it excludes the market-share wars of 2015-17 and that of 2020, and the pandemic’s effects on inventories (Chart 6). This will revive the backwardation in Brent and WTI prices, particularly if the loss of Russian barrels is larger than we expect this year and next. This could be dampened if the US resumes its SPR releases after they’ve run their course in October. Chart 5Global Market Balanced, But Slight Deficits Will Persist
Global Market Balanced, But Slight Deficits Will Persist
Global Market Balanced, But Slight Deficits Will Persist
Chart 6OECD Inventories Below 5Y Average
OECD Inventories Below 5Y Average
OECD Inventories Below 5Y Average
Investment Implications Our analysis indicates markets are mostly balanced going into winter (Table 1). That said, the balance of risks remains to the upside ahead of the EU’s embargoes on Russian crude and product imports, and the EU/UK/US insurance/reinsurance bans on providing cover for vessels carrying Russian material. This all is highly contingent on the extent to which the EU and its allies follow through on these punitive actions imposed on Russia in retaliation for its invasion of Ukraine. Table 1BCA Global Oil Supply - Demand Balances (MMb/d, Base Case Balances) To Dec23
EU Russian Oil Embargoes, Higher Prices
EU Russian Oil Embargoes, Higher Prices
The removal from the market of some 2mm b/d of Russian oil production due to the various EU embargoes – even if it is offset by the return of 1mm b/d of Iranian exports on the back of a deal with the US – will push crude oil prices higher and inventories lower (Chart 7).3 Chart 7Brent Price Expectation Unchanged, But Demand Shifts To Winter
Brent Price Expectation Unchanged, But Demand Shifts To Winter
Brent Price Expectation Unchanged, But Demand Shifts To Winter
Given these views, we remain long the oil and gas producer XOP ETF, which is up 19.5% since we re-established it on July 5, and, at tonight’s close, will be re-establishing our COMT ETF, to take advantage of higher energy and commodity prices and increasing backwardation in oil markets as inventories draw. Robert P. Ryan Chief Commodity & Energy Strategist rryan@bcaresearch.com Ashwin Shyam Research Analyst Commodity & Energy Strategy ashwin.shyam@bcaresearch.com Paula Struk Research Associate Commodity & Energy Strategy paula.struk@bcaresearch.com Commodities Round-Up Energy: Bullish US distillate inventories – diesel and heating oil mostly – were up less than 1% for the week ended 12 August 2022, according to the US EIA. US distillate inventories stood at 112mm barrels. This did nothing to reverse the deep drawdown in distillate inventories of 18.5% y/y, which, along with European stocks, refiners are attempting to rebuild going into the 2022-23 winter. We expect natgas-to-oil switching this winter to add 800k b/d of demand to the market over the Nov-Mar winter season. Most of this demand will be for distillates, in our view, given its dual use as a fuel for industrial applications and household space-heating. Distillate demand could be higher this winter, if a La Niña produces colder-than-normal temperatures. The US Climate Prediction Center gives the odds of such an outcome 60% going into the 2022-23 winter. This would lift ultra-low-sulfur diesel futures in the US and gasoil futures in Europe higher as inventories draw (Chart 8). Base Metals: Bullish Copper prices dropped on weaker-than-expected Chinese macroeconomic data for July, although the fall was bounded by the People’s Bank of China’s decision to cut interest rates. According to US CFTC data, copper trading volumes are lower than pre-pandemic levels, as hedge funds' net speculative positions turned negative beginning in May and have mostly remained in the red since then. Low trading volumes will result in copper prices being highly susceptible to macroeconomic events, especially those occurring in China. Precious Metals: Neutral Gold prices are facing difficulty overcoming market expectations of high interest rates for the rest of this year (Chart 9). The bearish influence of tightening monetary policy and a strong USD has the upper hand on the supportive effect of recession risks, inflation, and geopolitical uncertainty for gold prices. Recent strength in US stock markets - which historically is inversely correlated with gold prices - following better-than-expected earnings, also contributed to recent gold price weakness. Chart 8
EU Russian Oil Embargoes, Higher Prices
EU Russian Oil Embargoes, Higher Prices
Chart 9
Investors Expect Fed Tightening To Give Way To An Easing Cycle In 2023
Investors Expect Fed Tightening To Give Way To An Easing Cycle In 2023
Footnotes 1 Please see Oil: It Ain't Over Till It's Over, which we published 11 August 2022, for additional discussion. NB: We discuss the differences between our view and that of our Geopolitical Strategy service regarding a deal between the US and Iran, which returns 1mm b/d of crude oil exports to the market. We give 60% odds to such a deal, while our colleagues at the GPS service assign a 40% probability to it. In our base case modeling presented herein, we expect these barrels to return to the market by 2Q23, perhaps sooner. 2 Please see Anonymous Chinese shipowner spends $376m on tankers for Russian STS hub published by Lloyd’s List 9 August 2022. The report notes, “All the ships are aged 15 years or older, precluding them from chartering by most oil majors, as well being unable to secure conventional financing, suggesting the beneficial owner is cash rich. The high seas logistics network offers scant regulatory and technical oversight as crude cargoes loaded on aframax tankers from Baltic Russian ports are transferred to VLCCs mid-Atlantic for onward shipment to China. One cargo has been tracked to India.“ 3 Please see Oil: It Ain't Over Till It's Over, which we published 11 August 2022, for additional discussion. NB: We discuss the differences between our view and that of our Geopolitical Strategy service regarding a deal between the US and Iran, which returns 1mm b/d of crude oil exports to the market. We give 60% odds to such a deal, while our colleagues at the GPS service assign a 40% probability to it. In our base case modeling presented herein, we expect these barrels to return to the market by 2Q23, perhaps sooner. Investment Views and Themes Strategic Recommendations Trades Closed in 2022