Europe
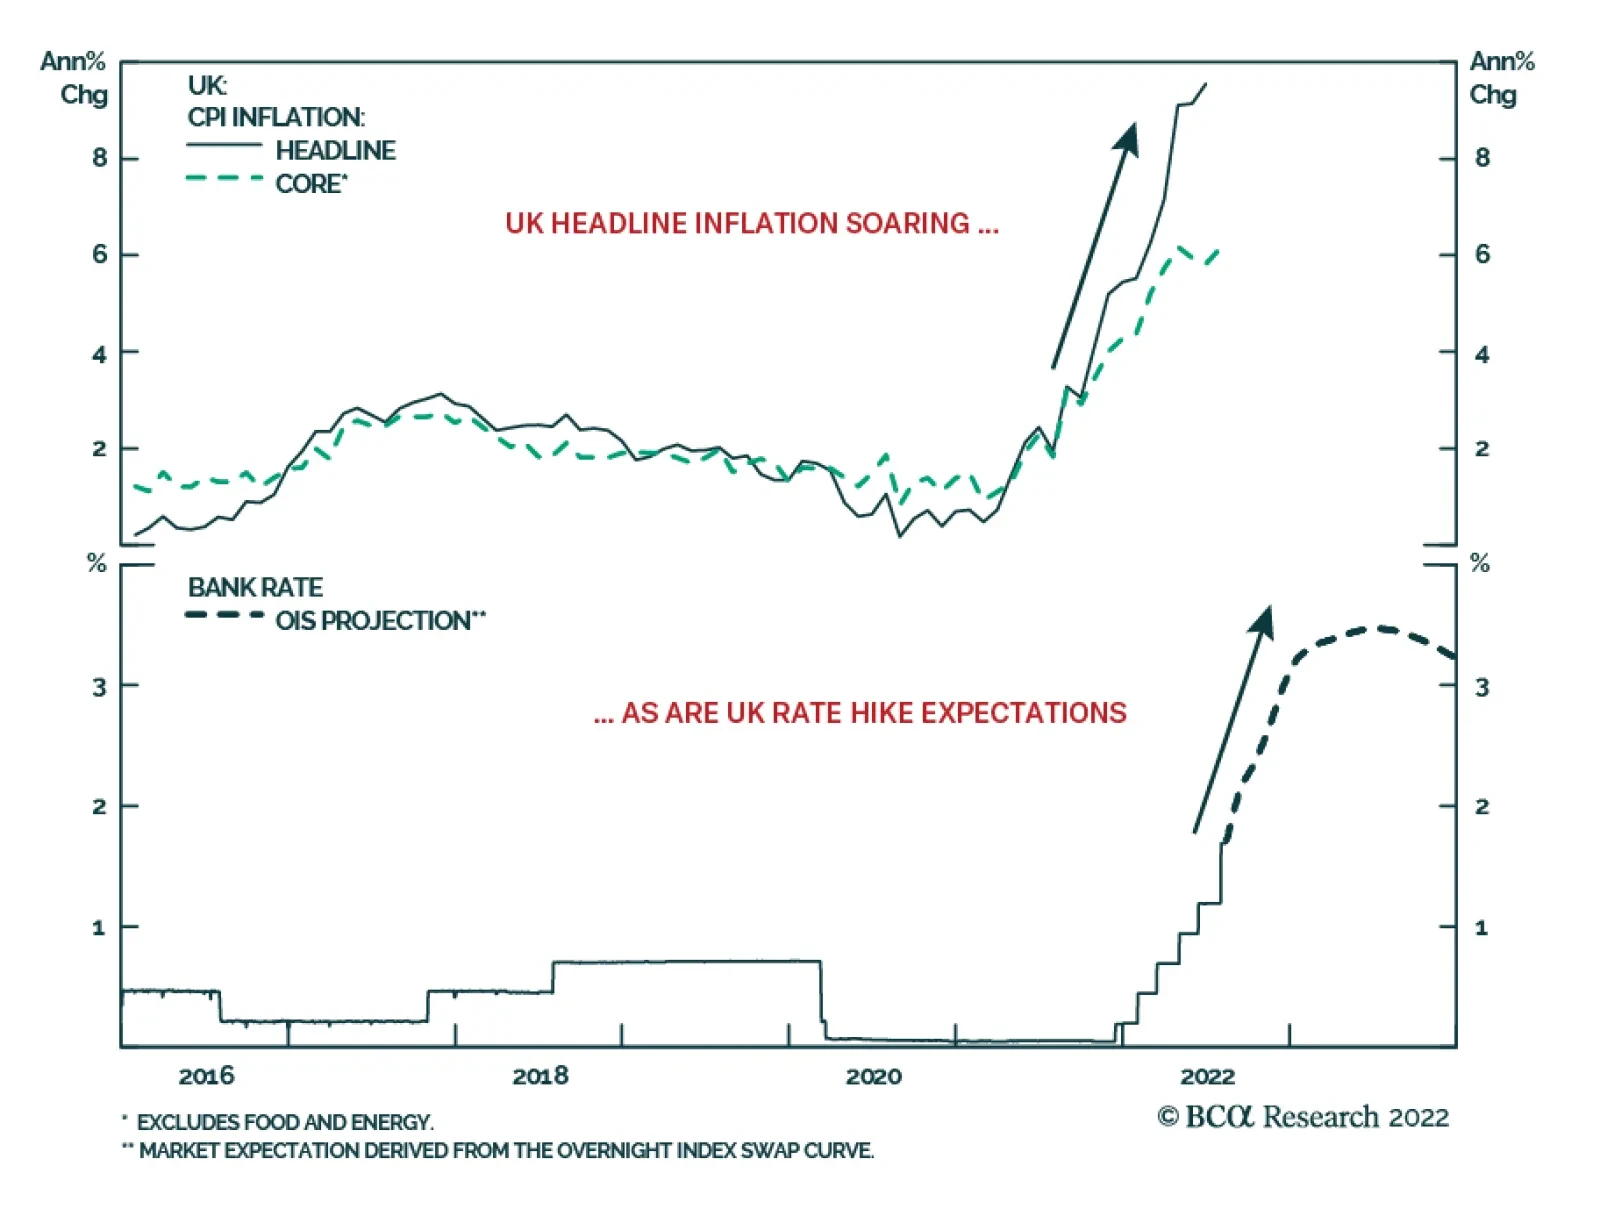
The July UK CPI data released on Wednesday showed an acceleration of year-over-year headline inflation into double-digit territory at 10.1%, up from 9.4% in June and beating market expectations. Higher food and energy prices were the largest contributors, but…
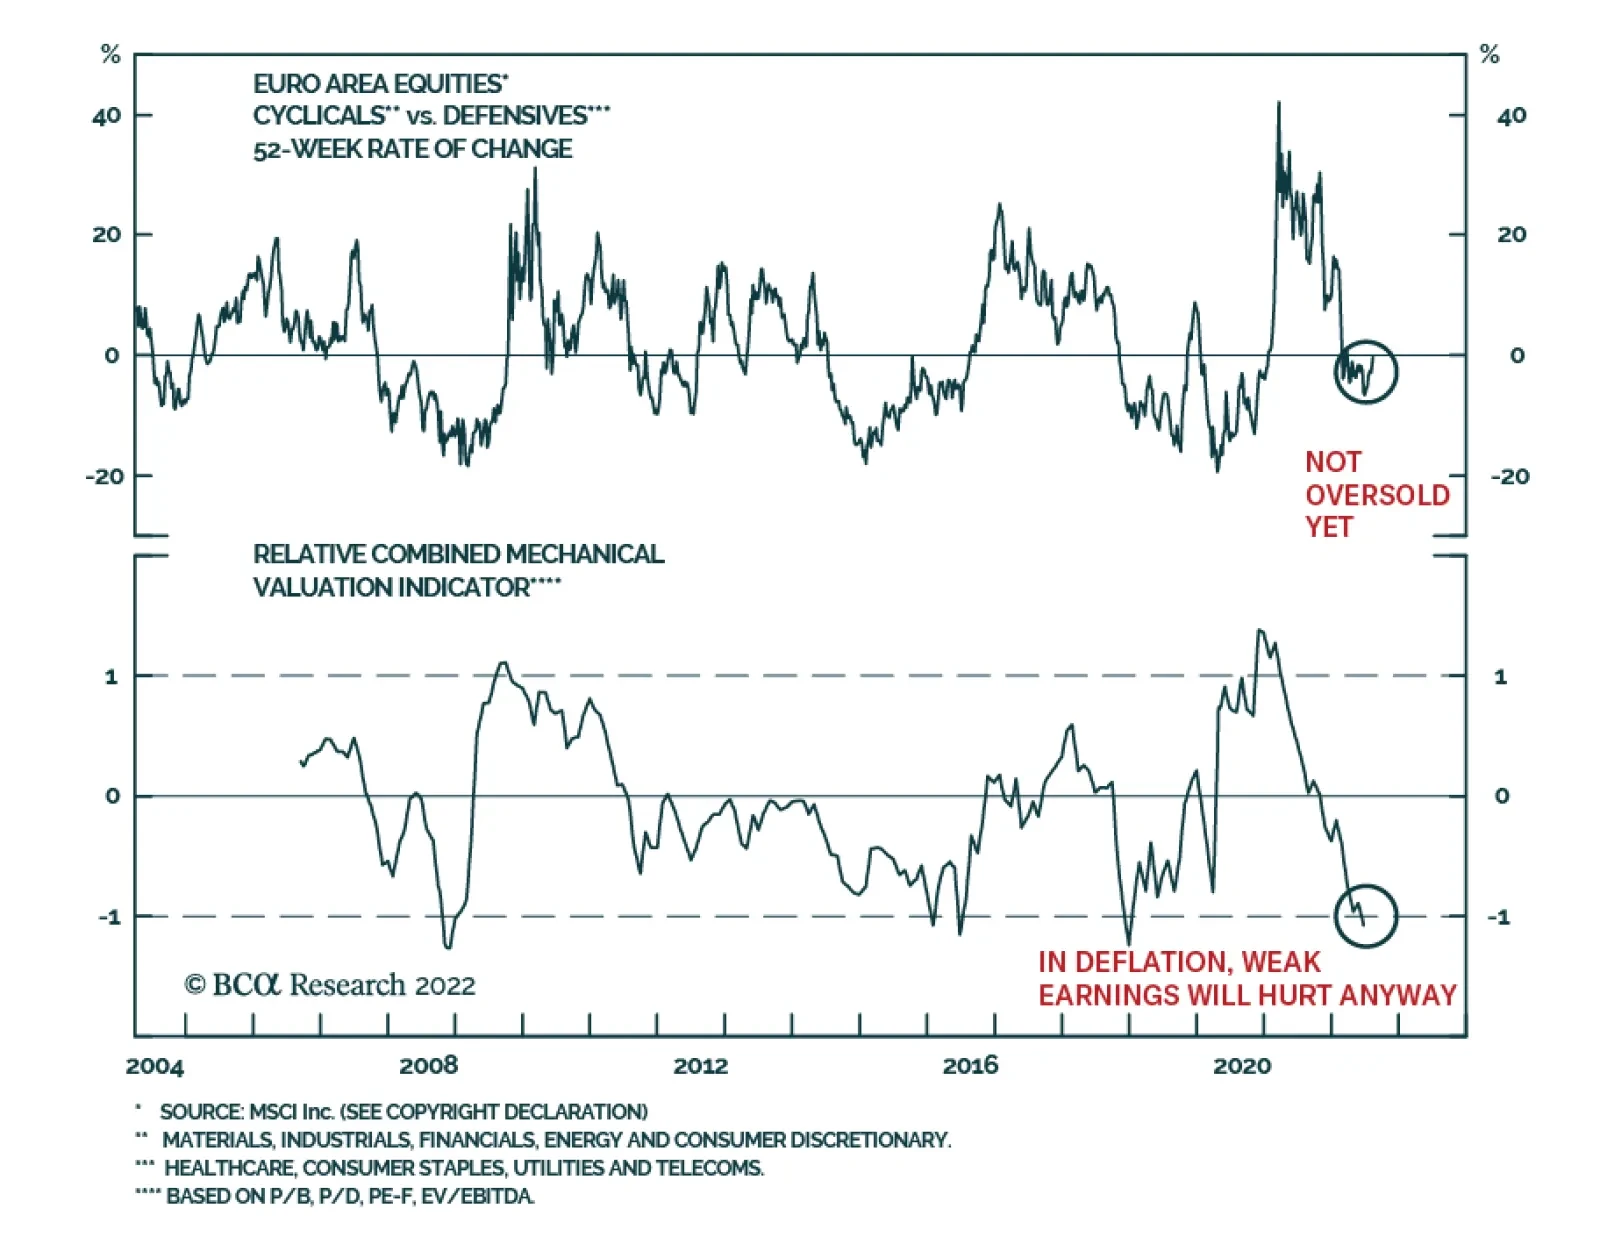
According to BCA Research’s European Investment Strategy service, the risk of deflation is greater than investors currently appreciate, which would be especially painful for European equities. European equities are more cyclical than their US counterparts,…

Executive Summary Then And Now
Then And Now
Then And Now
Investors are fixated on inflation; for now, the peak in US CPI is a positive for global stocks. However, this tailwind could easily transform into fear if inflation becomes deflation. The risk of deflation is greater than investors currently appreciate. In the early 1920s, the policy-driven inflation of World War One quickly morphed into a violent deflationary shock, which prompted a severe bear market. Even in the absence of the gold standard, many contemporary factors parallel those that were apparent before 1921. As a result, if commodity prices do not stabilize by year-end, investors will start to worry about deflation. This fear could prompt another sell-off in stocks, which would be particularly painful in Europe. Buy protection against deflation while it is cheap by selling EUR/JPY. Continue to favor defensive over cyclical equities. Bottom Line: The deflation risk for 2023 is greater than the investment community currently appreciates. While it remains a tail risk, it is an underpriced one. As a result, investors should use the current rebound in stocks to buy protection against deflation. Last week, the NASDAQ entered a new bull market following a decline in US inflation. European stocks have rallied too, albeit considerably less so, only rising 12.5% since their July 5th low. We have participated in this rally, having taken a more constructive view on European equities and other risk assets since our return from a trip visiting clients in Europe. Related Report European Investment StrategyQuestions From The Road The decline in US inflation is likely to remain a tailwind for global equities in the near future. The pandemic-related factors that spiked inflation in the past quarters are ebbing, and commodity inflation is decreasing. However, BCA’s US bond strategists expect this window to be short-lived. Labor market tightness and strong rents suggest that core CPI will stabilize around 4%. Nonetheless, as long as this window is open, stocks should remain bid. Investors expecting the demise of this current rebound continue to pin their view on stubborn inflation. While sticky inflation is an undeniable risk, it is a threat well understood by the market. However, another danger lurks, which is much less appreciated by investors: deflation. Investors currently underestimate its odds, when deflation could prove even more damaging to the market than sticky inflation. Remembering 1921 Chart 1The 1921 Bear Market
The 1921 Bear Market
The 1921 Bear Market
The most famous period of deflation in US economic history is the Great Depression. This is not, however, an appropriate parallel. The 1921 recession, at which time deflation hit a historical low of 16% per annum, is the more direct potential equivalent to today. It was accompanied by a 47% crash in the market that brought the Shiller P/E to five (Chart 1, top panel). At the end of WWI, the stock market experienced a rapid rally, with the Dow Jones jumping 58% from its low in March 1918 to its peak in November 1919. In that time frame, inflation was robust, with headline CPI averaging 16% between 1917 and 1920. Inflation was high because of a combination of factors: The war had forced a substantial loosening of fiscal policy with the Federal debt rising from 2.7% of GDP in 1916, before the entry of the US in the conflict, to 32.9% in 1921. The money supply experienced an unprecedented surge. At the beginning of the war, the US was a neutral party and European powers purchased large quantities of US goods. The resulting trade surplus pushed the US stock of gold from $1.5bn in 1914 to $2.6bn in 1920. Meanwhile, to help finance the government’s wartime expenditures, the newly created Federal Reserve expanded its banknote issuance and its claims on the banking system, which meant that Fed money rose from 21% of high-power money in April 1917 to 59% by November 1918. As a result of these two concurrent trends, the money supply doubled between 1916 and June 1920. The Fed was slow to remove the accommodation. The New York discount rate, which had fallen from 6% to 4% as war broke out in Europe, was only increased to 4.75% in the Spring of 1918 and stayed there until January 1920. The global economy was facing potent supply constraints. Large swaths of the European capital stock had been destroyed by the war, at the same time as the US economy had been redesigned to supply military goods, not consumer goods. As a result, inflation remained perky in 1919 and 1920, despite the end of the conflict. The fiscal and monetary supports suddenly ended in 1920, and the economy entered a vicious contraction that caused industrial production to plunge by 36% in 1921 and deflation to hit 16% (Chart 1, second and third panel). The fiscal easing suddenly shifted toward fiscal rectitude under the administration of Warren Harding, which greatly hurt domestic demand in 1921. Additionally, the inflow of gold from the war period morphed into outflow, as European powers enjoyed trade surpluses after their currencies fell 60% to 30% against the dollar between 1919 and the start of 1921. Moreover, the Fed increased the discount rate to 6% in 1920 and cut back the ratio of Fed money to gold, which caused M2 to swing from a 20% growth annual growth rate in Q1 1920 to a 7% contraction in Q3 1921. Simultaneously, corporate borrowing rates soared (Chart 1, fourth and fifth panel) The shock of stagflation and the associated deep output contraction caused the Dow Jones to collapse by 47% from late 1919 to August 1921. The market only stabilized once deflationary pressures ebbed, after the Fed had cut back the discount rate to 6% and around the same time when commodity prices began to firm up. By the end of the bear market, the reconstituted S&P 500 was trading at a cyclically-adjusted P/E of 5.2, and profits had fallen 81% from their 1916 peak. Bottom Line: The 1921 bear market was one of the most violent of the twentieth century. It was caused by an economic contraction and deep deflation that engulfed the US economy after the monetary and fiscal support of WWI had been removed. It only ended once deflationary forces began to ebb, after commodity prices found a floor. What Are The Parallels? At first glance, the parallels between 1921 and today seem negligible. Yes, inflation was raging in 1920, but deflation was a direct consequence of the gold standard that forced a rapid contraction in high-powered money, especially as gold fled the US in 1921. Chart 2Inflationary Fiscal And Monetary Policy
Inflationary Fiscal And Monetary Policy
Inflationary Fiscal And Monetary Policy
The similarities, however, are remarkable too. As a result of the COVID-19 pandemic, the economy was subjected to similar conditions as that of the US around WWI. The US economy witnessed a massive explosion of fiscal stimulus that pushed the Federal deficit from 5% in 2019, to 10% and 6% of GDP in 2020 and 2021, respectively. Moreover, the Federal Reserve generated extremely accommodative monetary conditions during and after the pandemic, when its balance sheet more than doubled and M2 grew by 41% (Chart 2). Additionally, the global economy has witnessed extraordinary supply-side disruptions that have added to inflationary pressures created by the extreme push to aggregate demand from fiscal and monetary policy.1 Chart 3The Money Supply Is Contracting
The Money Supply Is Contracting
The Money Supply Is Contracting
However, as in 1921, these forces are moving in the opposite direction. The fiscal thrust in the US was deeply negative in 2021 and 2022, when fiscal policy subtracted 4% and 2% from GDP growth, respectively. Moreover, the Fed’s policy tightening campaign is exceptionally aggressive. The Fed has increased rates by 2.25% in five months, and, based on the OIS curve, will push up interest rates by an additional 1.3% by the year-end (Chart 3). As a result, the recent contraction in M2 has further to run, even if the US economy is not constrained by its golden tethers (Chart 3, bottom panel). Between 1920 and 1921, investors had trouble judging how far the Fed would tolerate money contraction, which is again the case. Chart 4The Dollar Is Deflationary
The Dollar Is Deflationary
The Dollar Is Deflationary
While the gold standard has been dissolved, the recent wave of dollar strength creates deflationary forces that are similar to the bullion anchor in the 1920s. In the US, the strength in the dollar is limiting imported inflation. US import prices have rolled over, a trend likely to continue. Once converted in USD, Chinese PPI is almost contracting today, which is no small matter when China is the marginal supplier of goods for the world (Chart 4). A strong dollar is deflationary for the global economy, not just that of the US. A rising greenback hurts commodity prices and also tightens global liquidity conditions. Already, the dollar-based liquidity is contracting and EM FX reserves – which are a form of high-powered money similar to gold flows in the 1920s – are tanking, even after adjusting for the confiscation of Russian reserves in the wake of the Ukrainian conflict (Chart 4, bottom panel). To defend their currencies as the dollar rallies, EM central banks are forced to tighten policy, which hurts their domestic economies. This phenomenon is also visible in advanced economies. The weak euro has played a role inching the ECB toward aggressive rate hikes, while the Riksbank and the Swiss National Bank are both lifting interest rates to fight the inflationary impact of their currencies falling against the greenback. Global supply constraints are also defusing. The price of shipping commodities and goods around the world is declining meaningfully (Chart 5). Meanwhile, deliveries by suppliers are accelerating globally, which is contributing to a very rapid easing of our indicator of US Supply Constraints (Chart 5, bottom panel). Beyond these parallels with the early 1920s, demand is already weakening globally. Hampered by the current rise in living costs, households have begun to reduce the volume of goods they purchase, while companies have maintained robust production schedules. As a result, inventories are swelling around the world (Chart 6). Historically, the best cure for elevated inventories is lower prices. Chart 5Easing Supply Constraints
Easing Supply Constraints
Easing Supply Constraints
Chart 6Inventories And Weak Demand Are Deflationary
Inventories And Weak Demand Are Deflationary
Inventories And Weak Demand Are Deflationary
Bottom Line: There is no guarantee that deflation will become the prevailing force in the global economy. However, the risk is there—and this threat is woefully underappreciated by the investment community. At this current juncture, investors are welcoming lower commodity prices as they take the edge off ebullient inflation. However, if commodity prices do not stabilize by year-end, then investors will begin to worry about deflation. As the 1921 experience showed, deflation is very painful for stocks because it is so negative for profits. While the absence of the gold standard means that the deep deflation of 1921 is extremely unlikely, a period of deflation would nonetheless have a very negative impact on stocks, since they trade at 29 times cyclically-adjusted earnings, not 6.2 times, as was the case in November 1919. What Does This Mean For European Assets? A bout of global deflation would be especially painful for European equities. European equities are more cyclical than their US counterparts, which means that they often underperform when global growth is weak and global export prices of manufactured goods are falling (Chart 7). In other words, a deflationary shock in the US would be felt more acutely in the European market than in that of the US. Additionally, the euro would likely weaken further. Already, the European money impulse (the change in M1 flows) is contracting, which augurs poorly for European economic activity (Chart 8). The addition of a deflationary shock to the weak domestic backdrop would prompt further outflows from Europe, which would hurt the euro even more. Chart 7European Stocks Hate Deflationary Busts
European Stocks Hate Deflationary Busts
European Stocks Hate Deflationary Busts
Chart 8European Activity Is Weak
European Activity Is Weak
European Activity Is Weak
Chart 9A Value Trap?
A Value Trap?
A Value Trap?
Finally, with respect to the European cyclicals-to-defensive ratio, our Combined Mechanical Valuation Indicator suggests that European cyclicals have purged their overvaluation relative to their defensive counterparts (Chart 9). However, in previous deflationary outbreaks such as those in 1921 or the 1930s, cyclicals deeply underperformed defensive equities, no matter how cheap they became. This time around, we would expect the same outcome from cyclicals. Moreover, even if investors do not price in a deflationary risk early next year, European cyclicals remain hampered by the deceleration in the Chinese economy and the energy rationing that will hit Europe this winter. As a result, we continue to fade any rebound in the European cyclicals-to-defensives ratio. Bottom Line: Even if a deflationary shock is a risk that is more likely to emanate from the US, European markets will not be immune. The European economy is already weak, and the cyclicality of European equities creates greater vulnerability to deflation. Thus, while deflation in 2023 is a tail risk, investors should use the current rebound in global risk assets to buy protection cheaply. Selling EUR/JPY and favoring defensive European markets continue to make sense in light of this risk. Mathieu Savary, Chief European Strategist Mathieu@bcaresearch.com Footnotes 1Another similarity is that the Spanish Flu was decimating the population from late WWI to 1921. Tactical Recommendations Cyclical Recommendations Structural Recommendations
Listen to a short summary of this report. Executive Summary Chart 1The Dollar Has Broken Below The First Line Of Support
The Dollar Has Broken Before The First Line Of Support
The Dollar Has Broken Before The First Line Of Support
The softer CPI print in the US boosted growth plays and pushed the DXY index below its 50-day moving average (Feature Chart). This suggests CPI numbers will remain the most important print for currency markets in the coming weeks and months. If US inflation has peaked, then the market will price a less aggressive path for Fed interest rates, which will loosen support for the dollar. At the same time, other G10 central banks are still seeing accelerating inflation. This will keep them on a tightening path. This puts the DXY in a tug of war. On the downside, the Fed could turn less hawkish. On the other hand, currencies such as the EUR, GBP and even SEK face high inflation but deteriorating growth. This will depress real rates. Within this context, the most attractive currencies are those with relatively higher real rates, and a real prospect of a turnaround in growth. NOK and AUD stand out as potential candidates. Our short EUR/JPY trade has been performing well in this context. Stick with it. RECOMMENDATIONS INCEPTION LEVEL inception date RETURN Short EUR/JPY 141.20 2022-07-21 3.29 Bottom Line: Our recommended strategy is a neutral dollar view over the next three months, until it becomes clear inflation has peaked and global growth has bottomed. Feature The DXY index peaked at 108.64 on July 14 and has dropped to 105.1 as we go to press. There have been two critical drivers of this move. First, the 10-year US Treasury yield has fallen from 3.5% to 2.8%. With this week’s all important CPI release, which showed a sharp deceleration in the headline measure, bond yields may well stabilize at current levels for a while. Second, the drop in energy prices has boosted the JPY, SEK and EUR, which are heavily dependent on imported energy. Related Report Foreign Exchange StrategyA Montreal Conversation On FX Markets Another development has been happening in parallel – as US inflation upside surprises have crested, so has the US price impulse relative to its G10 counterparts (Chart 1). To the extent that this eases market pricing of a hawkish Fed (relative to other G10 central banks), it will continue to diminish upward pressure on the dollar. Much will depend on the incoming inflation prints both in the US, and abroad. With the DXY having broken below its 50-day moving average, the next support level is at 103.6. This is where the 100-day moving average lies, which the dollar tested twice this year before eventually bouncing higher (Chart 2). The next few sections cover the important data releases over the last month in our universe of G10 countries, and implications for currency strategy. What is clear is that most foreign central banks are committed to their tightening campaign, which argues for a neutral stance towards the DXY for now. Chart 1US Inflation Momentum Has Rolled Over
US Inflation Momentum Has Rolled Over
US Inflation Momentum Has Rolled Over
Chart 2The Dollar Has Broken Below The First Line Of Support
The Dollar Has Broken Below The First Line Of Support
The Dollar Has Broken Below The First Line Of Support
US Dollar: Consolidation Chart 3The Conditions For A Fed Hike Remain In Place
The Conditions For A Fed Hike Remain In Place
The Conditions For A Fed Hike Remain In Place
The dollar DXY index is up 10% year to date. Over the last month, the DXY index is down 2.1% (panel 1). Incoming data continues to make the case for a strong dollar. Job gains are robust. In June, the US added 372K jobs. The July release was even stronger at 528K jobs. This pushed the unemployment rate to a low of 3.5% (panel 2). Wages continue to soar. Average hourly earnings came in at 5.2% year-on-year in July. The Atlanta Fed wage growth tracker continues to edge higher across all income cohorts (panel 3). The June CPI print was above expectations at 9.1% for headline, with core at 5.9%. The July print for headline that came out this week was 8.5%, below expectations of 8.7%. At 5.9%, the core measure is still well above the Fed’s target (panel 4). June retail sales remained firm, but consumer sentiment continues to weaken. While the University of Michigan current conditions index increase from 53.8 to 58.1 in June, this is well below the January 2020 level of 115. Correspondingly, the Conference Board consumer confidence index fell from 98.7 to 95.7 in July. On June 17, the Fed increased interest rates by 75bps, as expected. The US entered a second consecutive quarter of GDP growth contraction in Q2, falling by an annualized 0.9%. The ISM manufacturing index was flat in July suggesting Q3 GDP is not starting on a particularly strong foot. The Atlanta Fed Q3 GDP growth tracker is, however, printing 2.5%. Unit labor costs are soaring, rising 10.8% in Q2. This is sapping productivity growth, which fell 4.6% in Q2. The key for the dollar’s outlook is the evolution of US inflation and the labor market. For now, inflation remains sticky, and wages are rising. Meanwhile, labor market conditions remain robust. This will keep the Fed on a tightening path in the near term. We initially went short the DXY index but were stopped out. We remain neutral in the short term, though valuation keeps us bearish over a long-term horizon. The Euro: A European Hard Landing Chart 4The Euro Is At Recession Lows
The Euro Is At Recession Lows
The Euro Is At Recession Lows
The euro is down 9.2% year to date. Over the last month, the euro is up 2.7%, having faced support a nudge below parity. Incoming data continues to suggest weak economic conditions, with a stagflationary undertone: The ZEW Expectations Survey for July was at -51.1, the lowest reading since 2011 (panel 1). The current account remains in a deficit, at -€4.5bn in May. Consumer confidence continues to plunge. The July reading of -27 is the worst since the 2020 Covid-19 crisis (panel 2). Despite the above data releases, the ECB surprised markets by raising rates 50bps. CPI continues to surprise to the upside. The preliminary CPI print for July came in at 8.9%, well above the previous 8.6% print. PPI in the euro area was at 35.8% in June, a slight decline from the May reading (panel 3). The German Ifo business expectations index fell to 80.3 in July. Historically, that has been consistent with a manufacturing PMI reading of 45 (panel 4). The Sentix confidence index stabilized in August but remains very weak at -25.2. This series tends to be trending, having peaked in July last year. We will see if the next few months continue to show stabilization. The ECB mandate dictates that it will continue to fight soaring inflation. As such, it may have no choice but to generate a Eurozone-wide recession. This is the key risk for the euro since it could push EUR/USD below parity again. We continue to sell the EUR/JPY cross. In a risk-off environment, EUR/JPY will collapse. In a risk-on environment, like this week, the yen can still benefit since it is oversold. Meanwhile, investors remain overwhelmingly bearish (panel 5). The Japanese Yen: Quite A Hefty Rally Chart 5Some Green Shoots In Japan
Some Green Shoots In Japan
Some Green Shoots In Japan
The Japanese yen is down 13.4% year-to-date, the worst performing G10 currency (panel 1). Over the last month, the yen is up 3.3%. Incoming data in Japan has been worsening as the rising number of Covid-19 cases is hitting mobility and economic data. According to the Eco Watcher’s survey, sentiment among small and medium-sized Japanese firms deteriorated in July. Current conditions fell from 52.9 to 43.8. The outlook component also declined from 47.6 to 42.8. Machine tool order momentum, one of our favorite measures of external demand, continues to slow. Peak growth was at 141.9% year-on-year in May last year. The preliminary reading from July was at 5.5% (panel 2). Labor cash earnings came in at 2.2% year-on-year, a positive sign. Household spending also rose 3.5%. Rising wages could keep inflation momentum rising in Japan (panel 3). On that note, the Tokyo CPI report for July was also encouraging, with an increase in the core-core measure from 1% to 1.2%. The Tokyo CPI tends to lead nationwide measures. The labor market remains robust. Labor demand exceeds supply by 27%. The Bank of Japan kept monetary policy on hold on July 20th, a policy move that makes sense given incoming data. The BoJ still views a large chunk of inflation in Japan as transitory. For inflation to pick up, wages need to rise. While they are rising, inflation expectations remain well anchored, suggesting little rationale for the BoJ to shift (panel 4). That said, the yen is extremely cheap after being the best short this year (panel 5). British Pound: Coiled Spring Below 1.20? Chart 6Cable Is Vulnerable
Cable Is Vulnerable
Cable Is Vulnerable
The pound is down 9.8% year to date. Over the last month, the pound is up by 2.5%. Sterling broke below a soft floor of 1.20, but quickly bounced back and is now sitting at 1.22, as sentiment picked up (panel 1). We find the UK to have an even bigger stagflation problem than the eurozone. CPI came in at 9.4% in June. The RPI came in at 11.8%. PPI was at 24%. All showed an acceleration from the month of May (panel 2). Nationwide house price inflation has barely rolled over unlike other markets, increasing from 10.7% in June to 11% in July. The Rightmove national asking price was 9.3% higher year-on-year in July, compared to 9.7% in June (panel 3). Meanwhile, mortgage approvals have been in steady decline over the last two years, which points toward stagflation. Retail sales excluding auto and fuel fell 5.9% year-on-year in June, the weakest reading since the Covid-19 crisis. Consumer confidence is lower than in 2020 (panel 4). Trade data continues to be weak, which has dipped the current account towards decade lows (panel 5). The external balance is the biggest driver of the pound, given the huge deficit. The above environment has put the BoE in a stagflationary quagmire. Last week, they raised rates by 50 bps suggesting inflation is a much more important battle than growth. Politically, the resignation of Prime Minister Boris Johnson, and broader difficulties for the Conservative Party, is fueling sterling volatility. We are maintaining our long EUR/GBP trade as a bet that at 1.03, the euro has priced in a recession (well below the 2020 lows), but sterling has not. On cable, 1.20 will prove to be a long-term floor but it will be volatile in the short term. Australian Dollar: A Contrarian Play Chart 7Relatively Solid Domestic Conditions In Australia
Relatively Solid Domestic Conditions In Australia
Relatively Solid Domestic Conditions In Australia
The AUD is down 2.3% year-to-date. Over the last month, the AUD is up 5.3%. AUD is fast approaching its 200-day moving average. If that is breached, it could signal that the highs of this year, above 76 cents, are within striking distance (panel 1). Inflation is accelerating in Australia. In Q2, the inflation reading was 6.1%, while the trimmed-mean and weighted-median measures were above the central bank’s 1-3% band (panel 2). As a result, the RBA stated the benchmark rate was “well below” the neutral rate. It increased rates by an additional 50bps in August, lifting the official cash rate to 1.85%. Further rate increases are likely. There are a few reasons for this. First, labor market conditions are the most favorable in decades. In June, unemployment reached 3.5%, its lowest level in 50 years, against a consensus of 3.8% (panel 3). The participation rate also increased to 66.8% in June from 66.7%, which has pushed the underutilization rate to multi-decade lows (panel 4). Despite this, consumer confidence continued its decline in August, dropping to 81.2 from 83.8. A pickup in Covid-19 cases and high consumer prices are the usual suspects. Beyond the labor market, monetary policy seems to be having the desired effect. Demand appears to be slowing as retail sales grew 0.2% month-on-month in June from 0.9%. Home loan issuance declined by 4.4% in June, driven by a 6.3% decline in investment lending. House price growth continued to decline in July, particularly in densely populated regions like Sydney and Melbourne. The manufacturing sector remains strong, with July PMI coming in at 55.7, suggesting the RBA might just be achieving a soft landing in Australia. The external environment was largely favorable for the AUD in June, as the trade balance increased substantially by A$17.7bn with commodities rallying early in the month. However, commodity prices are rolling over. The price of iron for example, is down 24% from its peak in June. This will likely weigh on the trade balance going forward (panel 5). A weakening external environment are near-term headwinds for the AUD, but we will be buyers on weakness (panel 6). New Zealand Dollar: Least Preferred G10 Currency Chart 8Near-Term Risks To NZD
Near-Term Risks To NZD
Near-Term Risks To NZD
The NZD is down 6.1% this year. Over the last month, it is up 5% (panel 1). The Reserve Bank of New Zealand raised its official cash rate (OCR) in July by 50bps to 2.5%, in line with market expectations. Policymakers maintained their hawkish stance and guided towards increased tightening until monetary conditions can bring inflation within its target range of 1-3%. Inflation rose in Q2 to 7.3% from a 7.1% forecast, largely driven by rising construction and energy prices (panel 2). As of the latest data, monetary policy appears to be continuing to have the desired effect on interest rate sensitive parts of the economy. REINZ home sales declined 38.1% year-on-year in June. Home price growth continues to roll over (panel 3). The external sector continues to slow. Dairy prices, circa 20% of exports, saw a 12% drop in early August after remaining flat in July. The 12-month trailing trade balance remains in deficit. This is most likely due to a substantial slowdown in Chinese economic activity, given that China is an important trade partner with New Zealand. What is important is that the RBNZ’s “least regrets” approach seems to be working. Despite a cooling economy, sentiment seems to be stabilizing. ANZ consumer confidence improved to 81.9 in July from 80.5. Business confidence also improved to -56.7 from -62.6 (panel 4). Ultimately, the NZD is driven by terms of trade, as well as domestic conditions (panels 1 and 5). Thus, short-term headwinds from a deteriorating external sector do not make us buyers of the currency for now, though a rollover in the dollar will help the kiwi. Canadian Dollar: Lower Oil, Hawkish BoC Chart 9The BoC Will Stay On A Hawkish Path
The BoC Will Stay On A Hawkish Path
The BoC Will Stay On A Hawkish Path
The CAD is down 1.2% year to date. Over the last month, it is up 1.8%. The Canadian dollar did not fully catch up to oil prices on the upside. Now that crude is rolling over, CAD remains vulnerable, unless the dollar continues to stage a meaningful decline (panel 1). Canadian data has been rather mixed over the last month. For example: There have been two consecutive months of job losses. This is after a string of positive job reports. In July, Canada lost 31K jobs. In June, it lost 43K. The reasons have been mixed, from women dropping out of the labor force, to lower youth participation (the participation rate fell), but this is a trend worth monitoring (panel 2). CPI growth remains elevated and is accelerating both on headline and core measures(panel 3). Building permits and housing starts have started to roll over, as house price inflation continues to lose momentum. June housing starts were at 274K from 287.3K. June building permits also fell 1.5% month-on-month though annual inflation is still outpacing house price growth (panel 4). The Canadian trade balance is improving, hitting a multi-year high of C$5.05 bn in June. This has eased the need for foreign capital inflows. The BoC raised rates 100bps in July, the biggest interest rate increase in one meeting among the G10. Unless the labor market continues to soften, the BoC will continue to focus on inflation, which means more rate hikes are forthcoming. The OIS curve is pricing a peak BoC rate of 3.6% in 9 months (panel 5). Two-year real rates are still higher in the US compared to Canada. And the loonie has lost the tailwind from strong WCS oil prices. As such, unless the dollar softens further, the loonie will remain in a choppy trading pattern like most of this year. Swiss Franc: A Safe Haven Chart 10The Franc Will Remain Strong Against The Euro For Now
The Franc Will Remain Strong Against The Euro For Now
The Franc Will Remain Strong Against The Euro For Now
CHF is down 3.2% year-to-date and up 4.3% in the past month. The Swiss franc has been particular strong against the euro, with EUR/CHF breaching parity (panel 1). Switzerland remains an island of relative economic stability in the G10. Although slowing, the manufacturing PMI was a healthy 58 in July. The trade surplus was up to CHF 2.6bn in June, despite a strong franc. While most European countries are preparing for a tough winter with energy rationing, prospects for Switzerland, which derives only 13% of its electricity from natural gas, look more favorable. Still, as a small open economy, Switzerland is feeling the impact of global growth uncertainty. The KOF leading indicator dropped to 90.1 in August with a sharp decline in the manufacturing component. This broader measure suggests the relative resilience of the manufacturing sector might not last long (panel 2). Consumer confidence also fell to the lowest level since the onset of the pandemic. Swiss headline inflation stabilized at 3.4% in July. The core measure rose slightly to the SNB’s 2% target (panel 3). The UBS real estate bubble index rose sharply in Q2, suggesting inflation is not only an imported problem. Labor market conditions also remain tight, with the unemployment rate at 2%, a two-decade low. The SNB will continue to embrace currency strength while inflation risks persist (panel 4), as can be seen by the decline in sight deposits and FX reserves (panel 5). The market is still pricing in another 50 bps hike in September although August inflation data that comes out before the meeting will likely be critical for that decision. CHF is one of the most attractive currencies in our ranking. Despite the recent outperformance, CHF is still down year-to-date against the dollar. A rise in safe-haven demand, and a possible energy crunch in winter will be supportive, especially against the euro. Norwegian Krone: Oil Fields Are A Jewel Chart 11NOK Will Reap Dividends From Energy Exports
NOK Will Reap Dividends From Energy Exports
NOK Will Reap Dividends From Energy Exports
NOK is down 7.4% year-to-date and up 7.1% over the last month. It is also up 4.2% versus the euro, despite softer oil prices (panel 1). Inflation in Norway continues to accelerate. In July, CPI grew 6.8% year-on-year, above the market consensus and the Norges Bank’s forecast. Underlying inflation jumped sharply to an all-time high of 4.5%, compared to the Bank’s 3.2% forecast made just over a month ago (panel 2). These figures are adding pressure on the central bank to increase the pace of interest rate hikes, with 50bps looking increasingly likely at the meetings in August and September. NOK jumped on the inflation news. The housing market is starting to show signs of slowing with prices down 0.2% on the month in July, the first decrease since December. This, together with household indebtedness (panel 3), makes the task of policy calibration challenging. Our bias is that a persistently tight labor market and strong wage growth (panel 4) will allow the bank to focus on inflation. Economic activity remains robust in Norway but is softening. The manufacturing PMI fell to 54.6 in July, while industrial production was down 1.7% month-over-month in June. Consumer demand remains frail with retail sales and household consumption flat in June from the previous month. On a more positive note, trade surplus remains near record levels and is likely to stay elevated as high European demand for Norwegian energy is likely to last at least through the winter (panel 5). As global risk sentiment picked up, the krone became the best performing G10 currency over the past month. If the risk appetite reverses, the currency is likely to feel some turbulence. Swedish Krona: Cheap, But No Catalysts Yet Chart 12SEK = EUR On Steroids
SEK = EUR On Steroids
SEK = EUR On Steroids
SEK is down 10% year-to-date and up 5.6% over the past month. The vigorous rebound highlights just how oversold the Swedish krona is (panel 1). The Swedish economy grew 1.4% in Q2 from the previous three months, rebounding from a 0.8% contraction in the first quarter. This is impressive, given high energy prices and a slowdown in global economic activity. Going forward, growth is likely to slow. In July, the services and manufacturing PMIs declined, and consumer confidence fell sharply to the lowest reading in almost 30 years. Retail sales were down 1.2% month-on-month in June. The housing market is also feeling the pain of rising borrowing costs (panel 2). The Riksbank’s latest estimate sees a 16% decline in prices by the end of next year. For now, inflation is still accelerating in Sweden. CPIF, the Riksbank’s preferred measure, increased from 7.2% to 8.5% in June. Headline inflation rose from 7.3% to 8.7% (panel 3). Headline inflation is likely to decline in July, given the drop in the price component of the PMIs, but inflation will remain well above target. This will keep real rates weak (panel 4). This suggests that the Riksbank is facing the same conundrum as the ECB: accelerate policy tightening and tip the economy towards recession or remain accommodative and risk inflation becoming more entrenched. Our bias is that the Riksbank is likely to frontload rate hikes as currently priced in the OIS curve, with a 50 bps hike in September, ahead of major labor union wage negotiations (panel 5). Much like the NOK, the Swedish krona rebounded strongly in the past month on global risk-on sentiment. Fundamentally, the krona remains more vulnerable to external shocks due to higher energy dependency and a strong dollar. Chester Ntonifor Foreign Exchange Strategist chestern@bcaresearch.com Artem Sakhbiev Research Associate artem.sakhbiev@bcaresearch.com Thierry Matin Research Associate thierry.matin@bcaresearch.com Trades & Forecasts Strategic View Cyclical Holdings (6-18 months) Tactical Holdings (0-6 months) Limit Orders Forecast Summary
Executive Summary Oil Markets Remain Tight
Oil Markets Remain Tight
Oil Markets Remain Tight
US and Iranian negotiators received an EU proposal for reviving the Iran nuclear deal on Monday, which could return ~ 1mm b/d of oil to markets. The EU’s embargo of Russian seaborne crude imports, which commences December 5, will remove 90% of seaborne imports of Russian crude (~ 2.3mm b/d) by year-end. In February 2023, another 800k b/d of refined products will be embargoed. December also will usher in insurance and reinsurance sanctions on shipping Russian oil – arguably the strongest sanctions the EU, UK and US can impose. Without those Iranian barrels, the determination of the EU, UK and US to enforce a Russian oil embargo will be suspect. We give odds of 60% to a US-Iran deal getting done in the near term. Our Geopolitical Strategy maintains the likelihood of a deal is 40% at best. Bottom Line: Oil markets are pricing in the likelihood of large energy supply dislocations over the next couple of months. The evolution of prices hinges upon the degree to which the EU’s embargo on Russian oil imports is implemented. A revived Iran nuclear deal with the West would offset some of the embargoed Russian oil. Even so, oil balances still will remain tilted to deficit conditions in 2023. We continue to expect Brent will move above our 2022 $110/bbl expectation by 4Q22, and average $117/bbl next year. Feature US and Iranian negotiators received a proposal from EU negotiators for reviving the Iran nuclear deal on Monday.1 If the US and Iran can agree, the door opens for 1mm b/d of Iranian oil to return to markets. These barrels are becoming increasingly important to the EU, especially following the suspension of southerly flows of oil on Russia’s Druzhba pipeline due to a payment dispute.2 Brent popped ~ $1.50/bbl Tuesday morning as the Druzhba news broke, and the backwardation in the forward market increased (Chart 1). Brent gave back these early gains by the end of trading, following news a Hungarian refiner transferred the fee required to use the Ukrainian section of the pipeline.3 Chart 1Oil Markets Remain Tight
Oil Markets Remain Tight
Oil Markets Remain Tight
Complicated Motives On All Sides The EU obviously has an interest in freezing Iran’s nuclear program and accessing more Iranian fossil fuels while it is locked in an energy struggle with Russia – hence the its proposal to revive the Iran nuclear deal. However, the US and Iranian positions are more complicated. Iranian’s Supreme Leader Ali Khamenei has an interest in removing the US’s economic sanctions – and in obtaining deliverable nuclear weapons, notes Matt Gertken, BCA Research’s chief geopolitical strategist. Khamenei’s plan is to develop a nuclear weapon so that Iran can deter any aggression from a future US administration or the Abraham alliance. This is the path to regime survival, power succession, and national security. Hence Iran will not freeze its nuclear program over the long run. But Khamenei may wish to buy time while the Democrats still run the White House. Chart 2KSA, UAE Preserving Spare Capacity
Oil: It Ain't Over Till It's Over
Oil: It Ain't Over Till It's Over
We’ve noted repeatedly the Biden administration has been pressing the Kingdom of Saudi Arabia (KSA) and the United Arab Emirates (UAE) – the only states in OPEC 2.0 able to raise output and maintain production at higher levels – to increase output for the better part of this year. These efforts yielded only a 100k b/d production increase earlier this month. KSA and the UAE insist they are close to the maximum levels of oil they can supply to the market, given their current production and the need to maintain minimal spare capacity (Chart 2).4 KSA’s max capacity is 12mm b/d. The Kingdom will be producing at or slightly above 11mm b/d later this year to offset declines in non-core OPEC 2.0 production. KSA’s trying to get its max capacity to 13mm b/d, but that will take until 2027, according to the state oil company ARAMCO. UAE’s max capacity is 4mm b/d. It will be producing at or close to 3.5mm b/d this year, and after that they’ll want to hang on to that last bit as spare capacity. UAE’s trying to get its spare capacity to 5mm b/d, but that’s going to take until 2030, according to its state oil company ADNOC. There’s an increasing risk to the Russian output arising from the EU embargo scheduled to take effect December 5, and sanctions on providing insurance and reinsurance to ships carrying Russian material. If the EU/UK/US embargo is successful and results in Russia being forced to shut in 2mm b/d by the end of next year, per our expectation, KSA and UAE spare capacity will not cover the loss of production, and falling output within OPEC 2.0. Given these dynamics – and the expectation at least some of the sanctions will stick after Dec. 5 – KSA and UAE have to hang on to those last barrels to be able to meet the increasingly likely loss of Russian shut-in production. Additional spare capacity is not available in the US shales, or in any of the other producing provinces outside OPEC 2.0 sufficient to cover the loss of Russian barrels. Indeed, output from OPEC 2.0 outside the core producers has been trending lower for years (Chart 3).5 Complicating a deal with Iran is the possibility it could re-open the breach between the US and KSA. If KSA wanted to express its displeasure with a US-Iran deal it wouldn’t need to do much to re-balance the market: If the Kingdom does not offset production losses by the rest of OPEC 2.0, or step up to cover, e.g., Libyan production – now back on the market with just under 500k b/d – global supply falls and prices rise, all else equal.6 Chart 3KSA, UAE Are Core OPEC 2.0
Oil: It Ain't Over Till It's Over
Oil: It Ain't Over Till It's Over
Our Geopolitical Strategy gives 40% odds of an Iran deal and 60% odds that negotiations fall apart (or drag on without resolution). We make the odds higher – 60% chance of success – given the compelling interest of the Biden administration to get more oil into the market going into midterms in November, and a general interest in the West to offset potential losses of Russian volumes to sanctions that kick in in December. The difference in these views hinges on what Iran will do, as the Biden administration is seeking a deal. Sanctions Kicking In In December The EU is set to roll into its embargo of Russian oil imports on December 5. If fully implemented, ~ 2.3mm b/d of seaborne imports of Russian crude oil will be excluded from EU markets by year-end. Beginning in February, another 800k b/d of refined products will be embargoed. EU, UK and US shipping insurance and reinsurance sanctions also are set to kick in in December. These arguably are the strongest sanctions available to the West in its effort to take Russian oil and refined products off the market (no insurance means no shipping). The EU recently relaxed sanctions on buying and transporting Russian crude oil, which will allow additional volumes of oil to be purchased and transported to end-use markets.7 While this will let a little more Russian oil into the market in the near term, we believe it opens the possibility of additional exceptions being made by the EU to make more oil available, if prices move sharply higher on the back of increasing supply scarcity. The EU and US are looking a bit wobbly on the insurance and reinsurance bans due to kick in in December.8 If they relax or forego these sanctions in some fashion, more Russian crude and products will flow to market in 4Q22 than currently is anticipated. This would undermine US efforts to secure a price cap on Russian oil sales. Slower sanction enforcement is a path available to Biden that does not involve bowing to Iran’s various demands. Some, but not all, of the Russian volumes lost to EU exports will continue to be scooped up by China and India, which have become the largest buyers of Russian oil following the sanctions imposed by the West after the invasion of Ukraine.9 India loaded 29.5mm barrels of Russian crude in July – a record – while China loaded 18.1mm barrels. These levels likely will fall, but these two states will remain big buyers of Russian crude and products going forward. Household Budgets Will Remain Strained High energy prices – particularly for gasoline and diesel fuel – and falling real incomes have eaten into US household budgets, and are a key factor for Biden’s low approval ratings (Chart 4). July US CPI was unchanged from June and was 8.5% higher y-o-y. While the gasoline price index dropped from June, it remained one of the main contributors to the high energy index. (Chart 5).10 Based on the sharp increase in gasoline prices over the first six months of this year, we estimate the cost of running a car is 50% higher in 1H22 vs. 1H21 in the US. Chart 4Wealth Destruction Key To Low Biden Approval
Oil: It Ain't Over Till It's Over
Oil: It Ain't Over Till It's Over
Chart 5Energy Driving High US Prices
Oil: It Ain't Over Till It's Over
Oil: It Ain't Over Till It's Over
US gasoline and distillate prices have rolled over since mid-June, driven by high refined-product prices, which weakened demand, and fear of global recession as central banks tighten monetary policy. Higher Russian crude output in 1H22 – up 3.6% to ~ 10.1mm b/d – partly contributed to weaker product prices. However, this trend likely will reverse: Russian crude output in 2Q22 was down 1.1% y/y to 9.7mm b/d, based on our estimates. We expect prices of gasoline and diesel fuel to remain at elevated levels, given low inventories (Chart 6), and a second consecutive year of lower US refining capacity (Chart 7). Higher crude oil prices brought about by Russian oil and product embargoes will feed into these refined product prices, pushing them higher. Chart 6Low Product Stocks…
Oil: It Ain't Over Till It's Over
Oil: It Ain't Over Till It's Over
Chart 7…And Refining Capacity Are Bullish For Petrol Products
Oil: It Ain't Over Till It's Over
Oil: It Ain't Over Till It's Over
There is scope for an increase in gasoline demand over the rest of the driving season, while elevated US and overseas distillate demand will support diesel and heating oil prices. The eurozone’s record high inflation in July was driven by energy prices (Chart 8), indicating high energy prices are a problem for households worldwide. According to the Household Electricity Price Index, residential electricity prices in EU capitals were more than 70% higher in 1H22 y/y. The IMF expects high fuel prices will increase EU households’ share of energy expenditure by 7% in 2022.11 In response to high energy prices, governments are enacting policies such as price caps and direct transfers to lower the damage to household wealth.12 An unintended consequence of this will be high prices for longer, as consumers will not register the signal the market is sending via higher prices to encourage lower demand. This will result in continued draws on inventories. Chart 8High Energy Prices Responsible For Eurozone Inflation
High Energy Prices Responsible For Eurozone Inflation
High Energy Prices Responsible For Eurozone Inflation
Investment Implications With EU sanctions scheduled to become effective December 5, oil markets are focused on supply measures that could sharply reduce Russian oil exports. This makes the US-Iran negotiations to revive the Iran nuclear deal critically important. Agreement to restore the deal could return 1mm b/d of oil to markets at a time when supplies are at risk of contracting sharply going into 2023. Failure to restore these volumes will tighten supply significantly if the EU’s embargo of Russian oil imports is successful. We give the restoration of the Iran nuclear deal a 60% chance of success. In and of itself, the return of Iranian oil exports will not offset all of the potential loss of Russian crude oil exports to the EU. That said, the evolution of crude oil prices hinges upon the degree to which the EU’s embargo on Russian oil imports is implemented. There's a subtle point to be aware of in the evolution of US-Iran negotiations: The Biden administration could just turn a blind eye to Iranian crude sales, without agreeing to revive the nuclear deal being negotiated. Signing a deal, on the other hand, would be more positive for supply than merely not contesting Iranian's renewed exports of 1mm b/d of crude. It is worthwhile bearing in mind that the point of the deal is that Iran pauses its nuclear program, which reduces war risk in the medium term, or as long as deal is in force. Reducing the level of agita in the region, at least for a couple of years, is a net benefit. Our geopolitical strategist Matt Gertken notes, "If Iranians sign a deal, then they are endorsing Biden and the Democratic Party for 2024, meaning they want a Democratic White House in the US through 2028. There would be no reason to sign it unless you plan to implement at least through 2024." We remain bullish oil, and continue to expect Brent to trade above $110/bbl on average this year, and $117/bbl next year. We remain long the XOP ETF to retain our exposure to oil and gas E+Ps. Robert P. Ryan Chief Commodity & Energy Strategist rryan@bcaresearch.com Ashwin Shyam Research Analyst Commodity & Energy Strategy ashwin.shyam@bcaresearch.com Paula Struk Research Associate Commodity & Energy Strategy paula.struk@bcaresearch.com Commodities Round-Up Energy: Bullish The EIA expects US natural gas inventories to finish the injection season at ~ 3.5 Tcf – 6% below the five-year average – at the end of October (Chart 9). LNG exports are expected to average 11.2 Bcf/d, which, if realized, will be 14% over 2021 levels. The EIA increased its estimate of LNG exports on the back of an earlier-than-expected return of Freeport LNG exports. For 2023, the EIA expects US LNG exports will average 12.7 Bcf/d. Close to 70% of the 57 bcm of US LNG exports are being shipped to Europe, where it is helping offset the cutoff of Russian gas supplies following the war in Ukraine. In 1H22, the US became the world’s largest exporter of LNG. Dry gas production in the US is expected to average just under 97 Bcf/d in 2022, a 3% increase over 2021 levels. Base Metals: Bullish Total Chinese copper imports for July were up 9.3% at ~464kt for July, despite economic weakness and a property market slowed by companies' payment defaults and lower consumer confidence in real estate groups. Copper in SHFE warehouses were at 35kt which is 65% lower y/y as of the week ending August 5th, while stocks in China’s copper bonded inventories were 40% lower y/y at 262kt for the month of June. Low copper prices and Chinese stocks, and high imports indicate that the world’s largest copper consumer is capitalizing on weak prices to restock low inventories. Precious Metals: Bullish The World Gold Council reported gold ETF outflows for the third consecutive month in July at 80.1 tons (Chart 10) due to low gold prices, a strong USD and a hawkish Fed. The latest July US CPI data was unchanged from June, as high prices due to pandemic induced supply chain bottlenecks eased. Inflation remains well above target. Despite the mildly positive inflation data, we expect the Fed to hike interest rates again in September. The magnitude of this hike will depend on the August US CPI and employment prints, given the Fed’s data dependency. By year-end, if the Russian oil embargo and insurance bans on shipping vessels are implemented in their current form, high crude oil prices will feed into inflation, and the Fed will be forced to remain aggressive. Chart 9
Oil: It Ain't Over Till It's Over
Oil: It Ain't Over Till It's Over
Chart 10
Oil: It Ain't Over Till It's Over
Oil: It Ain't Over Till It's Over
Footnotes 1 Please see Agreement on nuclear deal within reach but obstacles remain published by politico.com on August 8, 2022. 2 Please see Russia suspends oil exports via southern leg of Druzhba pipeline due to transit payment issues published by reuters.com on August 9, 2022. 3 Please see Oil drops on Druzhba pipeline news and U.S. inflation expectations published by reuters.com on August 10, 2022. According to the International Association of Oil Transporters, the Druzhba pipeline capacity is ~ 1.3mm b/d. In July, its southern leg supplying Hungary, the Czech Republic and was carrying ~ 230k b/d, according to OilX, a satellite service monitoring oil and shipping movements globally. 4 Please see Tighter Oil Markets On The Way, which we published on July 21, 2022, for additional detail. 5 Please see footnote #4. 6 The background factor in this situation is Russia’s involvement in Libya’s civil disorder. We noted in our July 14, 2022 report Russia Pulls Oil, Gas Supply Strings: “Sporadic force majeure declarations and output losses in Libya, where Russian mercenaries actively support Khalifa Haftar’s Libyan National Army (LNA), continue to make supply assessments difficult.” 7 Please see How the EU Will Allow a Slight Increase in Russian Oil Exports published by Bloomberg.com on August 1, 2022. 8 Please see US warns of surge in fuel costs as it renews push for Russian oil price cap published by ft.com on July 26, 2022. 9 Please see Russian crude prices recover on strong India, China demand, and Column-Russian crude is more reliant on India and China, but signs of a peak: Russell | Reuters, published by reuters.com on August 7 and August 9, 2022. 10 After fuel oils, the 44% y-o-y increase in the gasoline price index was the largest contributor to the increase in the energy index. 11 Please see Surging Energy Prices in Europe in the Aftermath of the War: How to Support the Vulnerable and Speed up the Transition Away from Fossil Fuels, published by the IMF on July 29, 2022. 12 For an example of such policy, please see State aid: Commission approves Spanish and Portuguese measure to lower electricity prices amid energy crisis Investment Views and Themes Strategic Recommendations Trades Closed in 2022
Listen to a short summary of this report. Executive Summary The Euro And The Chinese Credit Impulse
The Euro And The Chinese Credit Impulse
The Euro And The Chinese Credit Impulse
The US dollar has bounced off its 50-day moving average. In the recent past, that had led to a period of cyclical strength. The yen rally can be explained by the decline in Treasury yields and the fall in energy prices. Where next for the yen will depend on the time horizon. For investors trying to time the bottom, the euro is not yet a buy, but the common currency is incredibly cheap. Much depends on global/Chinese growth (Feature Chart). One of the key drivers of the dollar is volatility, and the correlation with the MOVE index. Less uncertainty will ease safe-haven demand. Stay short EUR/JPY and CHF/JPY. Remain long EUR/GBP. Maintain a limit sell on CHF/SEK at 10.76. RECOMMENDATIONS inception date RETURN Short EUR/JPY 2022-07-21 3.68 Bottom Line: We are tactically neutral the dollar but will be sellers on strength. Questions And Answers Chart 1Currencies And Yield Differentials
Currencies And Yield Differentials
Currencies And Yield Differentials
It is rare that we receive clients in our Montreal office. This has obviously been doubly the case due to the pandemic and the general hassle of travel nowadays. But when we do, it is a delight. In this week’s report, we got asked a few difficult questions on a tea date. The most important was not surprisingly the dollar view, but also our highest conviction trades in FX markets. We enjoyed the conversation and the intellectual debate, so we thought we would share this with our clients. Hopefully, this answers some of the most pressing questions. We have sliced this into as brief and concise a conversation as we could. Question: It is hard not to notice the steep decline in the dollar over the last few weeks. Should we fade this decline or lean into it? That is a tough question, but our educated guess is to fade it for now. That said, longer-term asset allocators should really be looking at buying extremely cheap G10 currencies on any declines. The drivers of dollar downside have been clear. First, long-term interest rates in the US have fallen substantially. The US 10-year Treasury yield has fallen from 3.5% to 2.7%. In real terms, they have also declined. The 10-year TIPS yield has fallen from 0.85% to 0.23%. On a relative basis, the market is also pricing in that the Fed will cut interest rates next year much faster than other central banks. More simply put, 2-year real bond yields in the US are rolling over, relative to the euro area and Japan, the biggest components of the DXY index (Chart 1). Related Report Foreign Exchange StrategyHow Deep A Recession Is The Dollar Pricing In? Specific to Japan and the euro area, there has also been another critical factor – the decline in energy import costs. Germany’s trade balance improved markedly in June (Chart 2). This has been the first genuine improvement in a year. There is also discussion to extend the life of existing nuclear power plants, which will help assuage energy import costs. In Japan, trade balance data comes out on Monday next week, so we will see what it reveals. But what has been clear is a political drive to restart nuclear power and wean the Japanese economy off its dependence on oil and gas (Chart 3). Japanese prime minister Fumio Kishida has been very vocal about this in recent speeches. Chart 2Euro Area And Japanese Trade Balances Are Improving
Euro Area And Japanese Trade Balances Are Improving
Euro Area And Japanese Trade Balances Are Improving
Chart 3A Nuclear Renaissance In Japan?
A Nuclear Renaissance In Japan?
A Nuclear Renaissance In Japan?
Turning to the more important part of your question, should we fade the decline or lean into it? We are of two minds on this to be honest, and here is why. The DXY has bounced off its 50-day moving average, which has been a sign in the past that the rally is not over (Chart 4). Our Geopolitical and Commodity & Energy colleagues are telling us not to trust the decline in oil prices. Our bond strategists think US yields are heading higher, with a whisper floor of 2.5%. Chart 4The DXY Has Support At The 50-Day Moving Average
The DXY Has Support At The 50-Day Moving Average
The DXY Has Support At The 50-Day Moving Average
Given these crosscurrents, there are many better opportunities that exist in FX at the crosses, rather than playing the dollar outright. But of course, the dollar call is critical. We would be neutral over the next three-to-six months but be incremental sellers of the dollar on strength. Question: Okay, neutral dollar for now, but bearish long term. We tend to consider longer-term investments as well, and we are confused about the euro, but even more so about the yen. Would you buy the yen today? If so, why? Our starting point for many currencies is valuation. On this basis, the yen is incredibly cheap. So, if you have a five-to-ten-year horizon, you can unlock incredible value in Japan, simply on a buy-and-hold basis. Our in-house curated model shows that the yen is at a multi-general low in value terms (Chart 5). Currencies mean-revert. Consider this for a minute – we are not equity experts, but Toyota trades at a P/E of 10.75, while Tesla trades at a P/E of 109.15. And yes, Toyota has electric cars. Chart 5The Japense Yen Is Incredibly Cheap
The Japense Yen Is Incredibly Cheap
The Japense Yen Is Incredibly Cheap
Chart 6The Yen Is A Favorite Short
The Yen Is A Favorite Short
The Yen Is A Favorite Short
It is true that a winner-takes-all mantra can be attributed to Tesla’s valuation over Toyota, but our colleagues in the Global Investment Strategy are telling us this era is over. As such, at a 40% discount, the yen is a long-term buy in our books. Interestingly, nobody likes the yen, at least by our preferred measure – net speculative positions. It is one of the most shorted G10 currencies (Chart 6). A cheap currency that is the most shorted ranks quite well in our evaluation of bargains in currency markets. Given my discussion above about the dollar, we have played the yen at the crosses. We are short EUR/JPY and CHF/JPY. On the euro, Japanese car manufacturers are simply becoming more competitive than their eurozone or US counterparts. This is not only related to the car industry, but according to the OECD, EUR/JPY is expensive on a purchasing power parity basis (Chart 7). Meanwhile, a short EUR/JPY trade is a perfect hedge for a pro-cyclical portfolio. The DXY index has historically traded in perfect inverse correlation to the euro-yen exchange rate (Chart 8). This suggests the collapse in the yen, relative to the euro, is very much overdone. In a risk-off environment, EUR/JPY will sell off. Meanwhile, there are also fundamental reasons to suggest that the yen should trade higher vis-à-vis the euro. Chart 7Remain Short ##br##EUR/JPY
Remain Short EUR/JPY
Remain Short EUR/JPY
Chart 8The DXY And EUR/JPY Usually Track Each Other
The DXY And EUR/JPY Track Each Other EUR/JPY And The DXY: Unsustainable Gap
The DXY And EUR/JPY Track Each Other EUR/JPY And The DXY: Unsustainable Gap
Question: Okay, let’s switch to the euro. I know you are short EUR/JPY, which has been working out well in the last few days. But the euro touched parity and I get a sense that it has bottomed. You have often mentioned that the euro has priced in one of the deepest recessions in the eurozone. I am surprised you are not trumpeting this currency and a once-in-a-lifetime buying opportunity. We agree somewhat with your conclusion but not the premise. Let’s consider the narrative over the last few months in the media. The first was that eurozone inflation will never catch up to the US, because the economy was structurally weak. Well, it did, albeit due to an exogenous shock. So, among a ranking of stagflationary candidates, the euro area is a top contender. If you believe in the idea that currencies are driven by real interest rates, rising inflation, and falling growth are an anathema for the exchange rate. When we typically have doubts about the euro area economy, and the outlook for its financial markets, we consult with our European Investment Strategy colleagues. We did just that and Mathieu Savary, who heads the service, mentioned two things: one – Chinese import volumes are imploding. For net creditor nations, this is a negative as their source of income is waning. The euro area falls into that category. The second thing to consider is that the dollar is a momentum currency. So is the euro. We mentioned earlier that the dollar bounced off its 50-day moving average, which explains euro weakness in recent trading days. In the end, Mathieu and the FX team did not really disagree, but I highlighted two charts to track. The euro tracks the Chinese credit impulse due to the importance of Chinese import demand for the euro area. It looks like our measure of that impulse has bottomed (Chart 9). If it has, you buy the euro on a long-term view. Relatedly, financial conditions are easing in China. As the Chinese bond market becomes more open and liberalized, bond yields become a financial conditions valve. That has been the case and has perfectly tracked the propensity for imports in the last few years (Chart 10). Chart 9The Euro And The Chinese Credit Impulse
The Euro And The Chinese Credit Impulse
The Euro And The Chinese Credit Impulse
Chart 10Financial Conditions Are Easing In China
Financial Conditions Are Easing In China
Financial Conditions Are Easing In China
In short, we will buy the euro if it touches parity, and even more so below parity with a 5–10-year view, but we think EUR/USD could touch 0.95 in the near term. I guess what we are saying is that a 5%-7% move is big in FX markets, but a 26% move (the undervaluation of the euro) is a whale. We do not see the catalyst for a whale in our current compass. Question: We have talked about the yen and the euro. I do not want to get into the pound, Australian dollar, and other currencies as you have told me your team has upcoming reports on those. But the Chinese yuan is very important in my investment portfolio. Any ideas on its next move? USD/CNY topped out near 6.8 in May. Since then, it has been in a trading range despite the DXY breaking to multi-decade highs (Chart 11). When a pattern like this emerges, it is always useful to revisit fundamentals. Those fundamentals are real interest rate differentials. We care about the yuan because China is a big trading partner of the US. As such, it is also a huge weight in the broad trade-weighted dollar index. China has huge problems, especially related to the property market, which need to be resolved. Bond yields have also collapsed. But the real interest rate in China is very attractive (Chart 12). It is also important to consider that if the dollar is the global safe haven, that means that the yuan could be becoming the haven in Asia. So, yuan downside is not a big risk for our long-term dollar bearish call. That said, we will be short CNY versus the yen, but not the dollar. Chart 11The RMB Has Been Relatively Resilient
The RMB Has Been Relatively Resilient
The RMB Has Been Relatively Resilient
Chart 12The RMB Has Undershot Real Rate Differentials
The RMB Has Undershot Real Rate Differentials
The RMB Has Undershot Real Rate Differentials
Question: I think I could sit with you all morning to discuss other aspects of FX, but I respect you have a tight stop due to the BLU meeting. Any concluding thoughts? I have one. Very often, we debate with our colleagues about capital flows. The dollar rises (in general), as capital inflows accelerate into the US and vice versa. It is often said that getting the dollar call right gets everything else right. So, if you can predict the path of the dollar, the performance of, say, US versus non-US equities becomes easy. Chart 13The Dollar And Earnings Revisions
The Dollar And Earnings Revisions
The Dollar And Earnings Revisions
We agree that the dollar is a real-time indicator of relative fundamentals. But here is one important observation: relative earnings revisions are deteriorating in the US vis-à-vis other countries (Chart 13). That has historically had an impact on exchange rates, as it affects equity capital flows. If the Federal Reserve also cut rates next year as the market is predicting, that will also be a negative for bond inflows. We think the global economy will avoid a deep recession, and that will allow growth to pick up outside the US. When the euro area and China bottom, then the dollar will truly peak, as capital flows to these economies will accelerate. So we are watching relative earnings and bond yield differentials closely. Chester Ntonifor Foreign Exchange Strategist chestern@bcaresearch.com Trades & Forecasts Strategic View Cyclical Holdings (6-18 months) Tactical Holdings (0-6 months) Limit Orders Forecast Summary
The Bank of England hiked interest rates by 50bps on Thursday, lifting the bank rate to 1.75% with the majority (8-1) of the MPC voting in favor of the outsized increase. Revisions to the forecast indicate that the central bank is facing a challenging task.…
Counterpoint’s August schedule: Next week, I am travelling to see clients in Australia, New Zealand, and Singapore, so we will send you a report on China’s 20th National Party Congress written by our Chief Geopolitical Strategist, Matt Gertken. Given that the outlook for the $100 trillion Chinese real estate market is crucial for the global economy and markets, Matt’s insights will be very interesting. Then on August 18, I will host the monthly Counterpoint webcast, which I hope you can join. We will then take a week’s summer holiday and return with a report on September 1. Executive Summary In the topsy-turvy recession of 2022, real wages have collapsed. This means profits have stayed resilient and firms have not laid off workers. Making this recession a ‘cost of living crisis’ rather than a ‘jobs crisis’. If inflation comes down slowly, then the ‘cost of living crisis’ will persist. But if inflation comes down quickly while wage inflation remains sticky, firms will lay off workers to protect their profits, turning the ‘cost of living crisis’ into a ‘jobs crisis’. Either way, this will keep a choke on consumer spending, and particularly the spending on goods, which is likely to remain in recession. Meanwhile, until mortgage rates move meaningfully lower, housing investment will also remain in recession. The double choke on growth means that the bear market in the 30-year T-bond is likely over. This suggests that the bear market in stock market valuations is also over, but that ‘cyclical value’ is now vulnerable to profit downgrades. Hence, equity investors should stick with ‘defensive growth’, specifically healthcare and biotech. Fractal trading watchlist: GBP/USD and Hungarian versus Polish bonds. In The 2008 Recession, Real Wage Rates ##br##Went Up So Employment Went Down…
In The 2008 Recession, Real Wage Rates Went Up So Employment Went Down...
In The 2008 Recession, Real Wage Rates Went Up So Employment Went Down...
…But In The 2022 Recession, Real Wage Rates##br##Went Down So Employment Went Up!
...But In The 2022 Recession, Real Wage Rates Went Down So Employment Went Up!
...But In The 2022 Recession, Real Wage Rates Went Down So Employment Went Up!
Bottom Line: The bear market in the 30-year T-bond and stock market valuations is likely over, but equity investors should stick with ‘defensive growth’, specifically healthcare and biotech. Feature The US economy has just contracted for two consecutive quarters, meeting the rule-of-thumb definition of a recession. Other major economies are likely to follow. Yet many economists and strategists are in denial. This cannot be a ‘proper’ recession, they say, because the economy remains at full employment. But the recession-deniers are wrong. It is a recession, albeit it is a ‘topsy-turvy’ recession in which employment remains high (so far) because real wage rates have collapsed, circumventing the need for lay-offs. This contrasts with a typical recession when real wage rates remain high, forcing the need for lay-offs.1 The Topsy-Turvy Recession Of 2022 When do firms lay off workers? The answer is, when they need to protect their profits. Profits are nothing more than revenues minus costs, and in a typical recession revenues slow much faster than the firms’ biggest cost, the wage bill. In this event, the only way that firms can protect their profits is to lay off workers. Chart I-1 confirms that every time that nominal sales have shrunk relative to wage rates, the unemployment rate has gone up. Without exception. Chart I-1Unemployment Goes Up Whenever Firms' Wage Rates Rise Faster Than Their Revenues...
Unemployment Goes Up Whenever Firms' Wage Rates Rise Faster Than Their Revenues...
Unemployment Goes Up Whenever Firms' Wage Rates Rise Faster Than Their Revenues...
But what happens during a recession in which nominal sales do not shrink relative to wage rates? In this event, profits stay resilient, so firms do not need to lay off workers. Welcome to the topsy-turvy recession of 2022! In the topsy-turvy recession of 2022, there has been much greater inflation in consumer prices and nominal sales than in nominal wage rates (Chart I-2). The result is that real wage rates have collapsed, profits have stayed resilient, and firms have not needed to lay off workers… so far. Chart I-2...But In The 2022 Recession, Wage Rates Have Risen Slower Than Revenues, So Unemployment Hasn't Gone Up
...But In The 2022 Recession, Wage Rates Have Risen Slower Than Revenues, So Unemployment Hasn't Gone Up
...But In The 2022 Recession, Wage Rates Have Risen Slower Than Revenues, So Unemployment Hasn't Gone Up
In a typical recession, the pain falls on the minority of workers who lose their jobs, as well as on profits. Paradoxically, for the majority that keep their jobs, real wages go up. This is because sticky wage inflation tends to hold up more than collapsing price inflation. For example, in the 2008 recession, the real wage rate surged by 4 percent (Chart I-3), and in the 2020 recession it rose by 2 percent. Chart I-3In The 2008 Recession, Real Wage Rates Went Up So Employment Went Down...
In The 2008 Recession, Real Wage Rates Went Up So Employment Went Down...
In The 2008 Recession, Real Wage Rates Went Up So Employment Went Down...
Yet in the 2022 recession, the real wage rate has shrunk by 4 percent, meaning that the pain of the recession has fallen on all of us (Chart I-4). In one sense therefore, this recession is ‘fairer’ because ‘we’re all in it together’. This is confirmed by the current malaise being characterised not as a ‘jobs crisis’, but as a ‘cost of living crisis’. In another sense though, the recession is unfair because the pain has not been shared by corporate profits, which have remained resilient… so far. Chart I-4...But In The 2022 Recession, Real Wage Rates Went Down So Employment Went Up!
...But In The 2022 Recession, Real Wage Rates Went Down So Employment Went Up!
...But In The 2022 Recession, Real Wage Rates Went Down So Employment Went Up!
The crucial question is, what happens next? Using the US as our template, wage rates are growing at 5-6 percent, and this growth rate is typically stickier than sales growth. Assuming inflation drifts lower, nominal sales growth will also drift lower from its current 7 percent clip, meaning that it could soon dip below sticky wage growth. Once the growth in firms’ revenues has dipped below that in nominal wage rates, profits will finally keel over. To repeat, profits are nothing more than revenues minus costs, where the biggest cost is the wage bill (Chart I-5).2 Chart I-5Profits Are Nothing More Than Revenues Minus Costs
Profits Are Nothing More Than Revenues Minus Costs
Profits Are Nothing More Than Revenues Minus Costs
At this point, the downturn will become more conventional. To protect profits, firms will be forced to lay off workers who will bear the pain of the downturn alongside falling profits. Meanwhile, with inflation easing, real wage growth for the majority that keep their jobs will turn positive. But to repeat, this is the typical pattern in a recession. Accelerating real wage rates are entirely consistent with a contracting economy as we witnessed in both 2008 and 2020. As Two Huge Imbalances Correct, Demand Will Be Pegged Back All of this assumes that real demand will remain under pressure, so the question is what is pegging back real demand? The answer is: corrections in two huge imbalances in the global economy. A breakdown of the -1.3 percent contraction in the US economy reveals these two corrections:3 Spending on goods, which contributed -1.2 percent Housing investment, which contributed -0.7 percent. These corrections are not over. As we presciently explained back in February in A Massive Economic Imbalance, Staring Us In The Face: “The pandemic overspend on goods constitutes one of the greatest imbalances in economic history. An overspend on goods is corrected by a subsequent underspend; but an underspend on services is not corrected by a subsequent overspend. The pandemic overspend on goods constitutes one of the greatest imbalances in economic history. This unfortunate asymmetry means that the recent overspend on goods at the expense of services makes the economy vulnerable to a recession. And the risk is exacerbated by central banks’ intentions to hike rates in response to inflation” (Chart I-6). Chart I-6The Pandemic Overspend On Goods Constitutes One Of The Greatest Imbalances In Economic History
The Pandemic Overspend On Goods Constitutes One Of The Greatest Imbalances In Economic History
The Pandemic Overspend On Goods Constitutes One Of The Greatest Imbalances In Economic History
Then, in The Global Housing Boom Is Over, As Buying Becomes More Expensive Than Renting, we identified a second major imbalance that is starting to correct. Specifically, the global housing boom of the past decade, which has doubled the worth of global real estate to $370 trillion, was predicated on ultra-low mortgage rates that made buying a home more attractive than renting. But in many parts of the world now, buying a home has become more expensive than renting (Chart I-7). Disappearing US and European homebuyers combined with a flood of home-sellers will weigh on home prices and housing investment – at least until policymakers are forced to bring down mortgage rates (Chart I-8 and Chart I-9). Chart I-7Buying A Home Has Become More Expensive Than Renting!
Buying A Home Has Become More Expensive Than Renting!
Buying A Home Has Become More Expensive Than Renting!
Chart I-8Homebuyers Have Disappeared...
Homebuyers Have Disappeared...
Homebuyers Have Disappeared...
Chart I-9...While Home-Sellers Are Flooding The Market
...While Home-Sellers Are Flooding The Market
...While Home-Sellers Are Flooding The Market
Meanwhile, as Chinese policymakers try and gently let the air out of the $100 trillion Chinese real estate market, a collapse in Chinese property development and construction activity will have negative long-term implications for commodities, emerging Asia, and developing countries that produce raw materials. More Investment Conclusions In addition to the long-term investment conclusions just described, we can draw some shorter-term conclusions: If inflation comes down slowly, then the current ‘cost of living crisis’, which is pummelling everyone’s real incomes, will persist. But if inflation comes down quickly while wage inflation remains sticky, firms will be forced to lay off workers to protect their profits, turning the ‘cost of living crisis’ into a ‘jobs crisis’. Either way, this will keep a choke on consumer spending, and particularly the spending on goods, which is likely to remain in recession. Meanwhile, until mortgage rates move meaningfully lower, housing investment will also remain in recession. Equityinvestors should stick with ‘defensive growth’, specifically healthcare and biotech. This double choke on growth is likely to keep a lid on ultra-long bond yields, even if central banks need to hike short-term rates more than expected to slay inflation. Our proprietary fractal analysis confirms that the sell-off in the 30-year T-bond is likely over (Chart I-10). Chart I-10The Bear Market In The 30-Year T-Bond Is Likely Over
The Bear Market In The 30-Year T-Bond Is Likely Over
The Bear Market In The 30-Year T-Bond Is Likely Over
For the stock market, this suggests that the valuation bear market is now over, but that ‘cyclical value’ sectors are now vulnerable to profit downgrades. Hence, equity investors should stick with ‘defensive growth’, specifically healthcare and biotech. Fractal Trading Watchlist This week we noticed that the sudden 20 percent collapse of Hungarian versus Polish 10-year bonds, has reached the point of short-term fractal fragility that suggests an imminent rebound. Hence, we are adding this to our watchlist. Go long GBP/USD. But our trade is GBP/USD. UK political risk is diminishing, the BoE is likely to be as, or more, hawkish than the Fed, and the 260-day fractal structure of GBP/USD is at the point of fragility that has signalled major turning points in 2014, 15, 16, 18 and 21 (Chart I-11). Accordingly the recommendation is long GBP/USD, setting the profit target and symmetrical stop-loss at 5 percent. Chart I-11Go Long GBP/USD
Go Long GBP/USD Go Long GBP/USD
Go Long GBP/USD Go Long GBP/USD
Expect Hungarian Bonds To Rebound
Expect Hungarian Bonds To Rebound
Expect Hungarian Bonds To Rebound
Chart 1CNY/USD At A Potential Turning Point
CNY/USD At A Potential Turning Point
CNY/USD At A Potential Turning Point
Chart 2Expect Hungarian Bonds To Rebound
Expect Hungarian Bonds To Rebound
Expect Hungarian Bonds To Rebound
Chart 3Copper's Selloff Has Hit Short-Term Resistance
Copper's Selloff Has Hit Short-Term Resistance
Copper's Selloff Has Hit Short-Term Resistance
Chart 4US REITS Are Oversold Versus Utilities
US REITS Are Oversold Versus Utilities
US REITS Are Oversold Versus Utilities
Chart 5CAD/SEK Is Reversing
CAD/SEK Is Reversing
CAD/SEK Is Reversing
Chart 6Financials Versus Industrials Has Reversed
Financials Versus Industrials Has Reversed
Financials Versus Industrials Has Reversed
Chart 7The Outperformance Of Resources Versus Biotech Has Ended
The Outperformance Of Resources Versus Biotech Has Ended
The Outperformance Of Resources Versus Biotech Has Ended
Chart 8The Outperformance Of Resources Versus Healthcare Has Ended
The Outperformance Of Resources Versus Healthcare Has Ended
The Outperformance Of Resources Versus Healthcare Has Ended
Chart 9FTSE100 Outperformance Vs. Euro Stoxx 50 Is Vulnerable To Reversal
FTSE100 Outperformance Vs. Euro Stoxx 50 Is Vulnerable To Reversal
FTSE100 Outperformance Vs. Euro Stoxx 50 Is Vulnerable To Reversal
Chart 10Netherlands' Underperformance Vs. Switzerland Has Ended
Netherlands' Underperformance Vs. Switzerland Has Ended
Netherlands' Underperformance Vs. Switzerland Has Ended
Chart 11The Sell-Off In The 30-Year T-Bond At Fractal Fragility
The Sell-Off In The 30-Year T-Bond At Fractal Fragility
The Sell-Off In The 30-Year T-Bond At Fractal Fragility
Chart 12The Sell-Off In The NASDAQ Is Approaching Fractal Fragility
The Sell-Off In The NASDAQ Is Approaching Fractal Fragility
The Sell-Off In The NASDAQ Is Approaching Fractal Fragility
Chart 13Food And Beverage Outperformance Is Exhausted
Food And Beverage Outperformance Is Exhausted
Food And Beverage Outperformance Is Exhausted
Chart 14German Telecom Outperformance Has Started To Reverse
German Telecom Outperformance Has Started To Reverse
German Telecom Outperformance Has Started To Reverse
Chart 15Japanese Telecom Outperformance Vulnerable To Reversal
Japanese Telecom Outperformance Vulnerable To Reversal
Japanese Telecom Outperformance Vulnerable To Reversal
Chart 16ETH Is Approaching A Possible Capitulation
ETH Is Approaching A Possible Capitulation
ETH Is Approaching A Possible Capitulation
Chart 17The Strong Trend In The 18-Month-Out US Interest Rate Future Has Ended
The Strong Trend In The 18-Month-Out US Interest Rate Future Has Ended
The Strong Trend In The 18-Month-Out US Interest Rate Future Has Ended
Chart 18The Strong Downtrend In The 3 Year T-Bond Has Ended
The Strong Downtrend In The 3 Year T-Bond Has Ended
The Strong Downtrend In The 3 Year T-Bond Has Ended
Chart 19A Potential Switching Point From Tobacco Into Cannabis
A Potential Switching Point From Tobacco Into Cannabis
A Potential Switching Point From Tobacco Into Cannabis
Chart 20Biotech Is A Major Buy
Biotech Is A Major Buy
Biotech Is A Major Buy
Chart 21Norway's Outperformance Has Ended
Norway's Outperformance Has Ended
Norway's Outperformance Has Ended
Chart 22Cotton Versus Platinum Has Reversed
Cotton Versus Platinum Has Reversed
Cotton Versus Platinum Has Reversed
Chart 23Switzerland's Outperformance Vs. Germany Is Exhausted
Switzerland's Outperformance Vs. Germany Is Exhausted
Switzerland's Outperformance Vs. Germany Is Exhausted
Chart 24USD/EUR Is Vulnerable To Reversal
USD/EUR Is Vulnerable To Reversal
USD/EUR Is Vulnerable To Reversal
Chart 25The Outperformance Of MSCI Hong Kong Versus China Has Ended
The Outperformance Of MSCI Hong Kong Versus China Has Ended
The Outperformance Of MSCI Hong Kong Versus China Has Ended
Chart 26A Potential New Entry Point Into Petcare
A Potential New Entry Point Into Petcare
A Potential New Entry Point Into Petcare
Chart 27US Utilities Outperformance Vulnerable To Reversal
US Utilities Outperformance Vulnerable To Reversal
US Utilities Outperformance Vulnerable To Reversal
Chart 28The Outperformance Of Oil Versus Banks Is Exhausted
The Outperformance Of Oil Versus Banks Is Exhausted
The Outperformance Of Oil Versus Banks Is Exhausted
Dhaval Joshi Chief Strategist dhaval@bcaresearch.com Footnotes 1 The best measure of wage rates is the employment cost index (ECI) because it includes all forms of compensation including benefits and bonuses. 2 In fact, stock market profits are even more cyclical because, as well as wages, there are other sticky deductions from revenues such as interest and taxes. 3 All expressed as annualised rates. Fractal Trading System Fractal Trades
Welcome To The Topsy-Turvy Recession Of 2022!
Welcome To The Topsy-Turvy Recession Of 2022!
Welcome To The Topsy-Turvy Recession Of 2022!
Welcome To The Topsy-Turvy Recession Of 2022!
6-12 Month Recommendations Structural Recommendations Closed Fractal Trades Indicators To Watch - Bond Yields Chart II-1Indicators To Watch - Bond Yields - Euro Area
Indicators To Watch - Bond Yields - Euro Area
Indicators To Watch - Bond Yields - Euro Area
Chart II-2Indicators To Watch - Bond Yields - Europe Ex Euro Area
Indicators To Watch - Bond Yields - Europe Ex Euro Area
Indicators To Watch - Bond Yields - Europe Ex Euro Area
Chart II-3Indicators To Watch - Bond Yields - Asia
Indicators To Watch - Bond Yields - Asia
Indicators To Watch - Bond Yields - Asia
Chart II-4Indicators To Watch - Bond Yields - Other Developed
Indicators To Watch - Bond Yields - Other Developed
Indicators To Watch - Bond Yields - Other Developed
Indicators To Watch - Interest Rate Expectations Chart II-5Indicators To Watch - Interest Rate Expectations
Indicators To Watch - Interest Rate Expectations
Indicators To Watch - Interest Rate Expectations
Chart II-6Indicators To Watch - Interest Rate Expectations
Indicators To Watch - Interest Rate Expectations
Indicators To Watch - Interest Rate Expectations
Chart II-7Indicators To Watch - Interest Rate Expectations
Indicators To Watch - Interest Rate Expectations
Indicators To Watch - Interest Rate Expectations
Chart II-8Indicators To Watch - Interest Rate Expectations
Indicators To Watch - Interest Rate Expectations
Indicators To Watch - Interest Rate Expectations
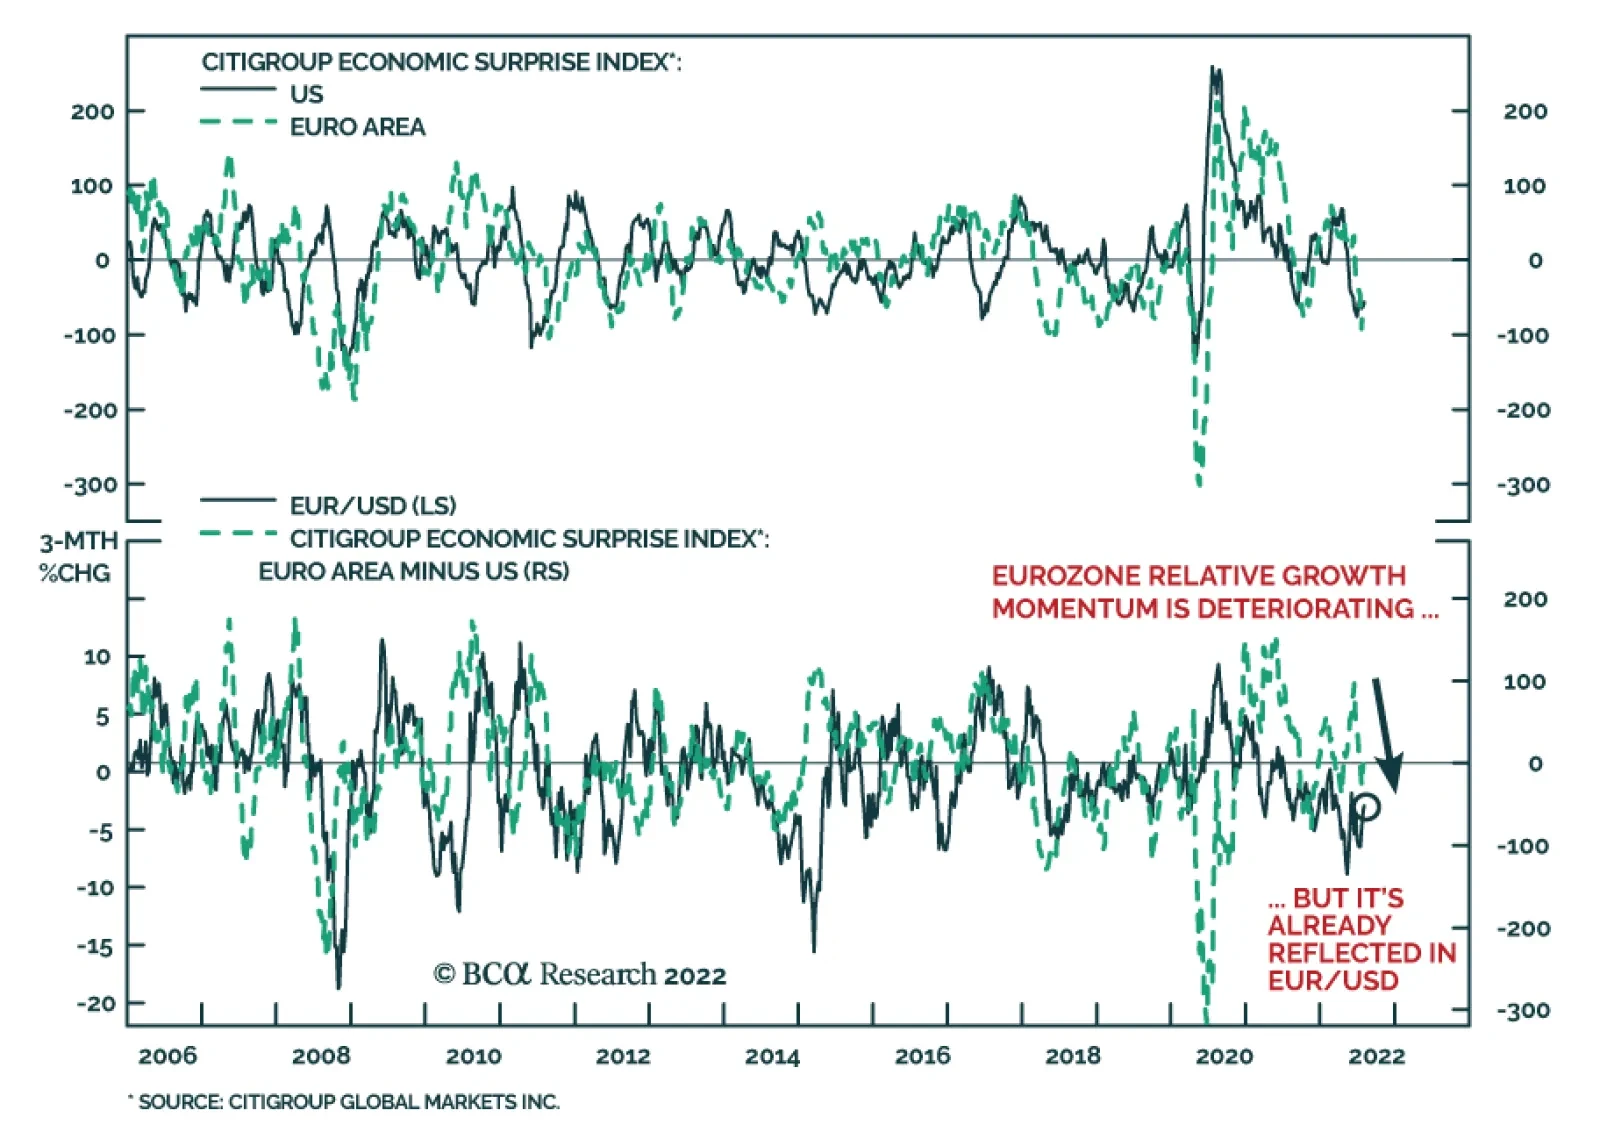
The Citigroup economic surprise indices for the US and the Euro Area are both deep in negative territory. Although the US index was first to cross below 0 in mid-May, the Eurozone measure turned negative towards the end of June and has recently been…
Listen to a short summary of this report. Executive Summary Investors Are Pricing In A Much More Aggressive Tightening Cycle Than At The Start Of The Year
Investors Are Pricing In A Much More Aggressive Tightening Cycle Than At The Start Of The Year
Investors Are Pricing In A Much More Aggressive Tightening Cycle Than At The Start Of The Year
Following last week’s sharp post-FOMC rally, we shifted our 12-month equity recommendation from overweight to neutral. We expect stock prices to rise further during the remainder of the year as US recession risks abate, but then to give up most of their gains early next year as it becomes clear that the Fed has no intention of cutting rates and may even need to raise rates. We have more conviction that US growth will hold up over the next 12 months than we do that inflation will fall as fast as the Fed expects or the breakevens imply. These varying degrees of conviction stem from the same reason: The neutral rate of interest in the US is higher than widely believed. A high neutral rate implies that it may take significant monetary tightening to slow the economy. That reduces the risk of a recession in the near term, but it raises the risk that inflation will remain elevated. A recession is now our base case for the euro area. However, we expect the European economy to bounce back early next year, as gas supplies increase and fiscal policy turns more stimulative. The euro has significant upside over the long haul. Bottom Line: Stocks will continue to recover over the coming months before facing renewed pressure early next year. We are retaining our tactical (3-month) overweight on global equities but are shifting our 12-month recommendation to neutral. Taking Some Chips Off the Table Following last week’s sharp post-FOMC rally, we shifted our cyclical 12-month equity recommendation from overweight to neutral. This note lays out the key considerations in a Q&A format. Q: Have any of your underlying views about the economy changed recently or has the market simply moved towards pricing in your benign outlook? A: Mainly the latter. While we continue to see a higher-than-normal risk of a US recession over the next 12 months, our baseline (60% odds) remains no recession. Q: Many would say that we are in a recession already. A: While two consecutive quarters of negative growth does not officially constitute a recession, it is correct to say that every time real GDP has contracted for two quarters in a row, the NBER has ultimately deemed that episode a recession (Chart 1). Chart 1In The Past, Two Consecutive Quarters Of Negative Growth Have Always Coincided With A Recession
In The Past, Two Consecutive Quarters Of Negative Growth Have Always Coincided With A Recession
In The Past, Two Consecutive Quarters Of Negative Growth Have Always Coincided With A Recession
That said, one should keep two things in mind. First, preliminary GDP estimates are subject to significant revisions. According to our calculations, there is a 35% chance that real GDP growth in Q2 will ultimately be revised into positive territory (Chart 2). Even Q1 may eventually show positive growth. Real Gross Domestic Income (GDI), which conceptually should equal GDP, rose by 1.8% in Q1. Chart 2After Further Revisions, It Is Possible That GDP Growth Ends Up Being Positive In Q2 2022
Shifting Into Neutral: A Q&A
Shifting Into Neutral: A Q&A
Second, every single US recession has seen an increase in the unemployment rate (Chart 3). So far, that has not happened, and there is good reason to think it will not happen for some time: There are 1.8 job openings per unemployed worker (Chart 4). For the foreseeable future, most people who lose their jobs will be able to walk across the street to find a new one. Chart 3Recessions And Spikes In The Unemployment Rate Go Hand-In-Hand
Recessions And Spikes In The Unemployment Rate Go Hand-In-Hand
Recessions And Spikes In The Unemployment Rate Go Hand-In-Hand
Chart 4A High Level Of Job Openings Creates A Moat Around The Labor Market
A High Level Of Job Openings Creates A Moat Around The Labor Market
A High Level Of Job Openings Creates A Moat Around The Labor Market
Chart 5Spending On Durable Goods Has Been Normalizing Without Derailing The Economy
Spending On Durable Goods Has Been Normalizing Without Derailing The Economy
Spending On Durable Goods Has Been Normalizing Without Derailing The Economy
Q: Aren’t other measures of economic activity such as the ISM, consumer confidence, and homebuilder sentiment all signaling that a major slowdown is in progress? A: They are but we should take them with a grain of salt. The composition of consumer spending is shifting from goods to services. This is weighing on manufacturing output. As Chart 5 shows, goods spending has already retraced two-thirds of its pandemic surge, with no ill effects on the labor market. Consumer confidence tends to closely track real wages (Chart 6). Despite an extraordinarily tight labor market, real wages have been shrinking all year. As supply-chain bottlenecks abate, inflation will fall, allowing real wages to rise. This will bolster consumer confidence and spending. Falling gasoline prices will also boost disposable incomes. Prices at the pump have fallen for seven straight weeks and the futures market is pointing to further declines in the months ahead (Chart 7). Chart 6Falling Inflation Will Boost Real Wages And Consumer Confidence
Falling Inflation Will Boost Real Wages And Consumer Confidence
Falling Inflation Will Boost Real Wages And Consumer Confidence
Chart 7The Futures Market Points To Further Declines In Gasoline Prices
The Futures Market Points To Further Declines In Gasoline Prices
The Futures Market Points To Further Declines In Gasoline Prices
It is also critical to remember that the Fed is trying to slow the economy by tightening monetary policy. At the start of the year, investors expected the Fed funds rate to be 0.9% in early 2023. Today, they expect it to be 3.4% (Chart 8). Chart 8Investors Are Pricing In A Much More Aggressive Tightening Cycle Than At The Start Of The Year
Investors Are Pricing In A Much More Aggressive Tightening Cycle Than At The Start Of The Year
Investors Are Pricing In A Much More Aggressive Tightening Cycle Than At The Start Of The Year
Chart 9Housing Activity Should Recover Now That Mortgage Rates Have Stabilized
Housing Activity Should Recover Now That Mortgage Rates Have Stabilized
Housing Activity Should Recover Now That Mortgage Rates Have Stabilized
Rising rate expectations curb aggregate demand. This temporarily leads to lower growth. However, once rate expectations stabilize – and demand resets to a lower level – growth will tend to return to trend. The 6-month mortgage yield impulse has already turned up. This suggests that housing and other interest-rate sensitive parts of the economy will begin to recover by the end of the year (Chart 9). Admittedly, if the unemployment rate rises in response to lower aggregate demand, this could set off a vicious circle where higher unemployment leads to less spending, leading to even higher unemployment. However, as noted above, given that the current starting point is one where labor demand already exceeds labor supply by a wide margin, the odds of a such a labor market doom loop are much lower than during past downturns. Q: Does the question of whether we officially enter a recession or not really matter that much? A: It is a matter of degree. As Chart 10 shows, macroeconomic factors are by far the most important determinant of equity returns over medium-term horizons of about 12 months. As a rule of thumb, bear markets almost always coincide with recessions (Chart 11). Chart 10Macro Forces Are An Important Driver Of Equity Returns On Cyclical Horizons
Macro Forces Are An Important Driver Of Equity Returns On Cyclical Horizons (I)
Macro Forces Are An Important Driver Of Equity Returns On Cyclical Horizons (I)
Chart 11Equity Bear Markets And Recessions Go Hand-In-Hand
Equity Bear Markets And Recessions Go Hand-In-Hand
Equity Bear Markets And Recessions Go Hand-In-Hand
Chart 12Soaring Energy Prices Have Boosted Earnings Estimates This Year
Soaring Energy Prices Have Boosted Earnings Estimates This Year
Soaring Energy Prices Have Boosted Earnings Estimates This Year
Q: Are you surprised that earnings estimates have not come down faster this year as economic risks have intensified? A: Most analysts have not baked in a recession in their forecasts, so from that perspective, if our baseline scenario of no recession does not pan out, earnings estimates will almost certainly come down (Chart 12). That said, the bar for major downward earnings revisions is quite high. This is partly because we think that if a recession does occur, it is likely to be a mild one. It is also because earnings are reported in nominal terms. In contrast to real GDP, nominal GDP grew by 6.6% in Q1 and 7.8% in Q2. Q: Let’s turn to interest rates. Why do you think the Fed will not cut rates next year as markets are discounting? A: It all boils down to the neutral rate of interest. In past reports, we made the case that the neutral rate in the US is higher than widely believed. The fact that job vacancies are so plentiful provides strong evidence in favor of our thesis. If the neutral rate were low, the labor market would not have overheated. But it did, implying that monetary policy must have been exceptionally accommodative. The good news for investors is that a high neutral rate implies that the Fed is unlikely to induce a recession by raising rates in accordance with its dot plot. That reduces the risk of a recession in the near term. The bad news is that a high neutral rate will essentially preclude the Fed from cutting rates next year. The economy will simply be too strong for that. Worse still, if the Fed is too slow in bringing rates to neutral, inflation – which is likely to fall over the coming months as supply-chain pressures ease – could reaccelerate at some point next year. That could force the Fed to start hiking rates again. Chart 13Real Yields Have Scope To Rise Further
Real Yields Have Scope To Rise Further
Real Yields Have Scope To Rise Further
Q: What is your estimate for the neutral rate in the US? A: In the past, we have written that the neutral rate in the US is around 3.5%-to-4%. However, I must admit, I’m not a big fan of this formulation. Real rates matter more for economic growth than nominal rates, and long-term rates matter more than short-term rates. Thus, a better question is what level of real long-term bond yields is consistent with stable inflation and full employment. Based on research we have published in the past, my best bet is that the neutral long-term real bond yield is between 1.5%-and-2%. That is substantially above the 10-year TIPS yield (0.27%) and the 30-year TIPS yield (0.79%) (Chart 13). Given that the yield curve is inverted, the Fed may have to raise policy rates well above 4% in order to drag up the long end of the curve. It is a bit like how oil traders say you need to lift spot crude prices in order to push up long-term futures prices when the oil curve is backwardated. Chart 14Investors Expect Inflation To Fall Rapidly Over The Next Few Years
Shifting Into Neutral: A Q&A
Shifting Into Neutral: A Q&A
Q: So presumably then, you would favor a short duration position in fixed-income portfolios? A: Yes, if the whole yield curve shifts higher, you will lose a lot less money in short-term bonds than in long-term bonds. Relatedly, we would overweight TIPS versus nominal bonds. The TIPS market is pricing in a very rapid decline in inflation over the next few years (Chart 14). The widely followed 5-year, 5-year forward TIPS inflation breakeven rate is trading at 2.28%, toward the bottom end of the Fed’s comfort zone of 2.3%-to-2.5%.1 Q: What about credit? A: US high-yield bonds are pricing in a default rate of 6.1% over the next 12 months. This is up from an expected default rate of 3.8% at the start of the year and is significantly higher than the trailing 12-month default rate of 1.4%. In a typical recession, high-yield default rates rise above 8% (Chart 15). Thus, spreads would probably increase if the US entered a recession. That said, it is important to keep in mind that many corporate borrowers took advantage of very low long-term yields over the past few years to extend the maturity of their debt. Only 7% of US high-yield debt, and less than 1% of investment-grade debt, held in corporate credit ETFs matures in less than two years. This suggests that the default cycle, if it were to occur, would be less intense and more elongated than previous ones. Chart 15High-Yield Bonds Are Pricing In Higher Default Rates
High-Yield Bonds Are Pricing In Higher Default Rates
High-Yield Bonds Are Pricing In Higher Default Rates
On balance, we recommend a modest overweight to high-yield bonds within fixed-income portfolios. Chart 16High Energy Prices Are Weighing On The European Economy
High Energy Prices Are Weighing On The European Economy
High Energy Prices Are Weighing On The European Economy
Q: Let’s turn to non-US markets. The dollar has strengthened a lot against the euro this year as the economic climate in Europe has soured. Can Europe avoid a recession? A: Probably not. European natural gas prices are back near record highs and business surveys increasingly point to recession (Chart 16). That said, the nature of Europe’s recession could turn out to be quite different from what many expect. There are a few useful parallels between the predicament Europe finds itself in now and what the global economy experienced early on during the pandemic. Just like the Novel coronavirus, as it was called back then, represented an external shock to the global economy, the partial cut-off in Russian energy flows represents an external shock to the European economy. Policymakers in advanced economies responded to the pandemic by showering their economies with various income-support measures. European governments will react similarly to the energy crunch. In fact, the political incentive to respond generously is even greater this time around because the last thing European leaders want is for Putin to succeed in his efforts to destabilize the region. For its part, the ECB will set an extremely low bar for buying Italian bonds and the debt of other vulnerable economies. Just like the world eventually deployed vaccines, Europe is taking steps to inoculate itself from its dangerous addiction to Russian energy. The official REPowerEU plan seeks to displace two-thirds of Russian natural gas imports by the end of the year. While some aspects of the plan are probably too optimistic, others may not be optimistic enough. For example, the plan does not envision increased energy production from coal-fired plants, which is something that even the German Green Party has now signed on to. The euro is trading near parity to the dollar because investors expect growth in the common-currency bloc to remain depressed for an extended period of time. If investors start to price in a more forceful recovery, the euro will rally. Q: China’s economy remains in the doldrums. Could that undermine your sanguine view on the global economy? A: China’s PMI data disappointed in July, as anxiety over the zero-Covid policy and a sagging property market continued to weigh on activity (Chart 17). We do not expect any change to the zero-Covid policy until the conclusion of the Twentieth Party Congress later this year. After that, the government is likely to ease restrictions, which will help to reignite growth. Chart 17The Zero-Covid Policy And Slumping Property Market Are Weighing On Chinese Economic Activity
The Zero-Covid Policy And Slumping Property Market Are Weighing On Chinese Economic Activity
The Zero-Covid Policy And Slumping Property Market Are Weighing On Chinese Economic Activity
Chart 18China Faces A Structural Decline In The Demand For Housing
China Faces A Structural Decline In The Demand For Housing
China Faces A Structural Decline In The Demand For Housing
The property market has probably entered a secular downturn (Chart 18). If a weakening property market were to cause a banking crisis, similar to what happened in the US and parts of Europe in 2008, this would destabilize the global economy. However, we doubt that this will happen given the control the government has over the banking system. In contrast, a soft landing for the Chinese real estate market might turn out to be a welcome development for the global economy, as less Chinese property investment would keep a lid on commodity prices, thus helping to ease inflationary pressures. Peter Berezin Chief Global Strategist peterb@bcaresearch.com Follow me on LinkedIn & Twitter Footnotes 1 The Federal Reserve targets an average inflation rate of 2% for the Personal Consumption Expenditures (PCE) index. The TIPS breakeven is based on the CPI index. Due to compositional differences between the two indices, CPI inflation has historically averaged 30-to-50 basis points higher than PCE inflation. This is why the Fed effectively targets a CPI inflation rate of 2.3%-to-2.5%. View Matrix
Image
Special Trade Recommendations Current MacroQuant Model Scores
Shifting Into Neutral: A Q&A
Shifting Into Neutral: A Q&A