Europe

Dear client, There will be no regular bulletin from the European Investment Strategy team next week to allow us to take some time off. We will return to our regular publishing schedule on August 15, 2022. Kind regards, The European Investment Strategy team Executive Summary Global Headwinds For Europe
Global Headwinds For Europe
Global Headwinds For Europe
Ahead of our summer break, we review our EIS main themes for the remainder of the year. We expect European growth to be poor in the latter half of 2022, but a recession toward the new year will be shallow. European inflation is set to crest in the fall. While the ECB will only modestly underwhelm the current €STR curve pricing, the TPI will be activated. European equities have entered a bottoming process, but cyclicals will continue to underperform defensive equities in the short-term. European investment grade credit is more attractive than local equities and US investment grade debt. The euro is also in a bottoming process, but near-term downside risk remains considerable. Bottom Line: European stocks are in the process of forming a bottom; yet, the economic softness will prevent cyclical shares from outperforming their defensive counterparts. Additionally, European IG debt offers more attractive risk-adjusted returns than equities in the near-term. Finally, the euro still faces potent front-loaded headwinds, despite a seductive long-term outlook. The month of August is starting, which often corresponds to a period of lower volumes on the markets, since a large percentage of the financial industry goes on vacation for the summer. This year, those vacations are even more merited than usual, as the first seven months of the year have been particularly tumultuous. Chart 1Deteriorating European Growth
Deteriorating European Growth
Deteriorating European Growth
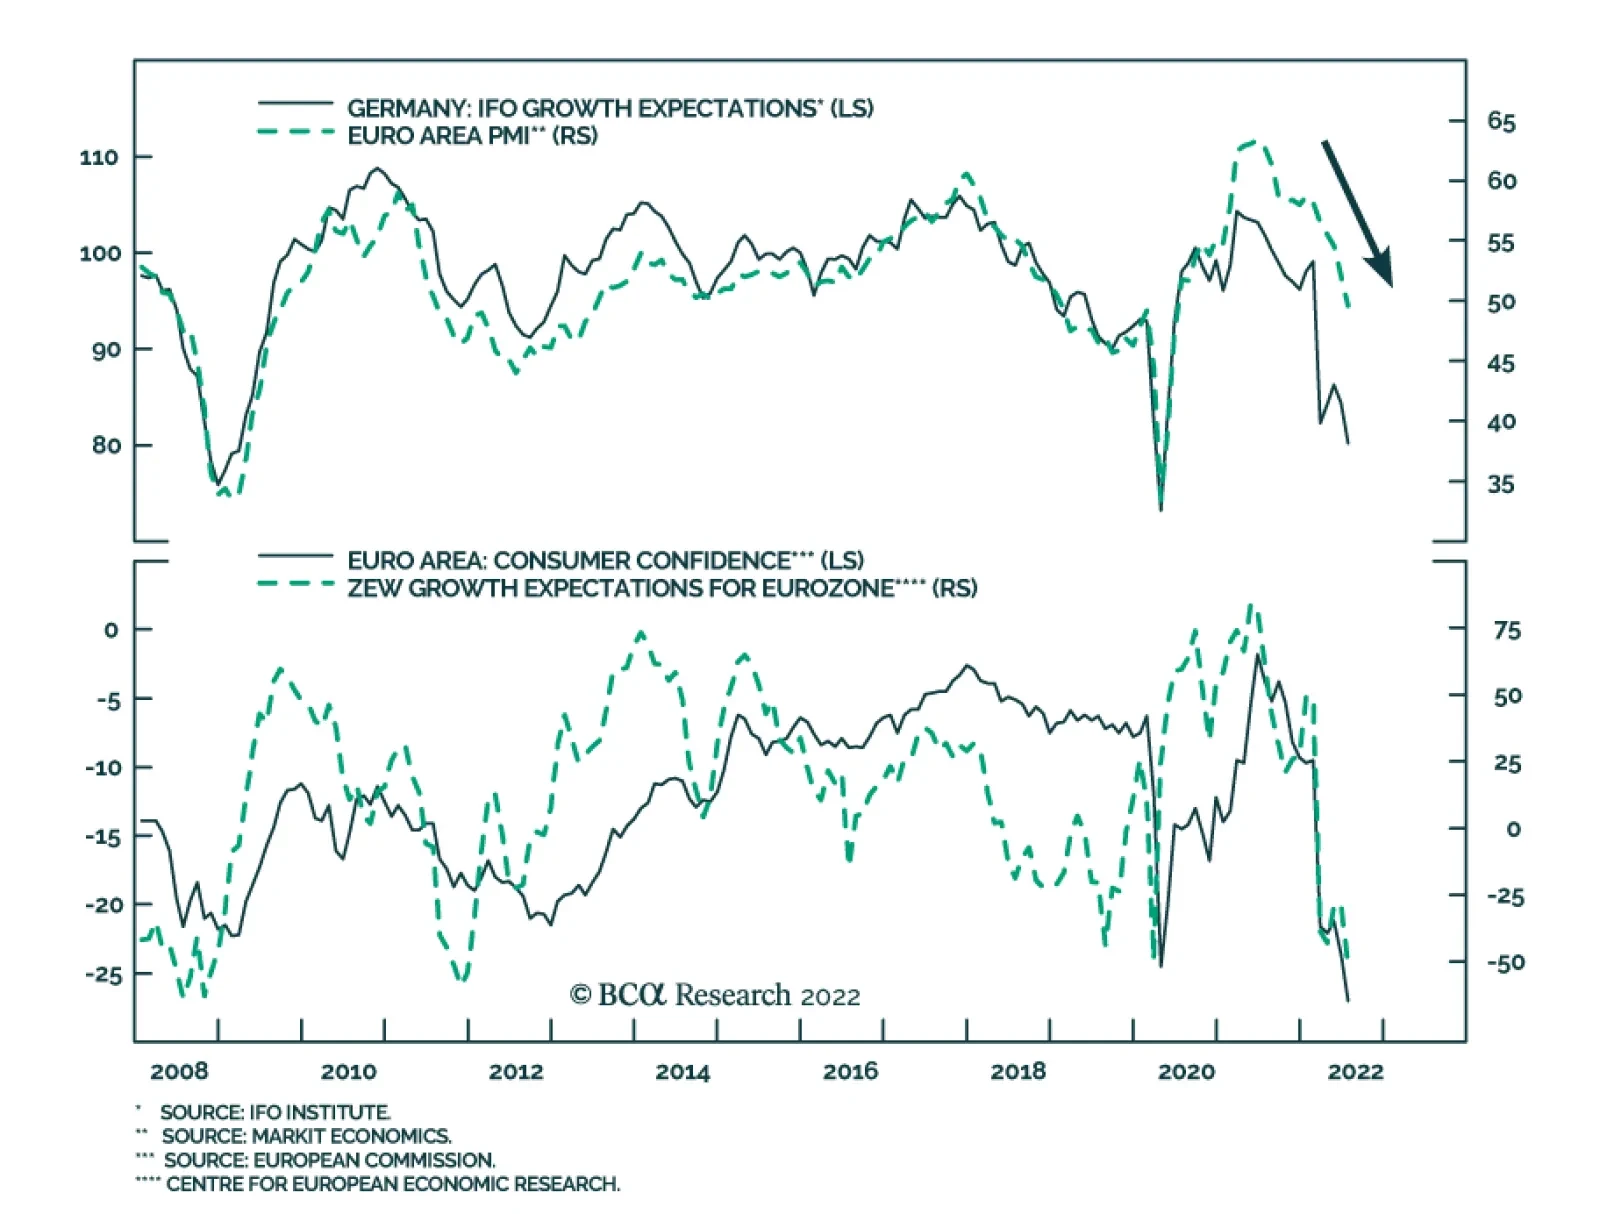
So far, the European economy has experienced a rare set of consecutive shocks. First, inflation has jumped to its highest level since the euro was introduced 23 years ago. This inflationary shock, however, does not reflect booming demand, as it is accompanied by a sharp economic growth slowdown and thus has a strong connotation of stagflation. PMIs have fallen below the 50 boom/bust line and the growth expectations component of the Ifo survey is now firmly at recessionary levels (Chart 1). Ultimately, what Europe faces is an inward shift in the supply curve caused by a sudden curtailment of energy flows from Russia. Chart 2A Tough First Half of 2022
A Tough First Half of 2022
A Tough First Half of 2022
Second, and largely because of this inflationary shock, the policy backdrop is in upheaval. On July 21, 2022, the ECB increased interest rates for the first time in eleven years and delivered its first 50 bps hike in more than two decades. At last, negative interest rates are not the determinant feature of Eurozone rates. Yet, despite the end of this longstanding policy distortion, the euro cannot catch a break and has tested parity. Meanwhile, German yields hit 1.9% in June, inflicting a YTD loss of 13% on their holders, and Italian spreads have blown up, raising the specter of financial fragmentation in Europe (Chart 2). Third, the environment has also been rough for equity investors. The pan-European Euro STOXX and the Eurozone Euro STOXX 50 have entered into bear markets, falling 23% and 24% respectively from their January 5 peak to their trough on July 5, 2022 (Chart 2, bottom panel). At this juncture, we will review our main themes for the remainder of the year, which also gives us an opportunity to align our recommendations with our core views. Key Views For The Remainder Of The Year We continue to expect European growth in the latter half of the year to be weak, probably around 0%. Too many hurdles are mounting. We continue to witness signs that global growth is deteriorating. The slowdown in manufacturing activity is not a phenomenon unique to Europe. Global inventories are rising in the manufacturing and retail sectors, which is likely to reduce global industrial production in the coming quarters. As a result, global trade and European exports are set to weaken further (Chart 3). Moreover, the global credit impulse is contracting rapidly in response to tightening monetary conditions. This, too, will weigh on global trade, and thus, on export-oriented nations like Europe. Chart 3Global Headwinds For Europe
Global Headwinds For Europe
Global Headwinds For Europe
Chart 4Households Aren't Alright
Households Aren't Alright
Households Aren't Alright
Inside Europe, the household sector’s malaise is deepening further, as highlighted by crashing consumer confidence (Chart 4). This degeneration reflects the hit to real income caused by elevated inflation, but it has been compounded by rising borrowing costs and falling financial asset prices. Chart 5Running Out Of Gas
Running Out Of Gas
Running Out Of Gas
Meanwhile, the risks from the energy market remain most salient and could even force a contraction in output somewhere between Q4 2022 and Q1 2023. Russian natural gas flows are minimal and are unlikely to rebound enough to allow for the hoped-for build-up in natural gas inventories by the winter (Chart 5). As a result, to keep the lights on, European countries will have to rely on a combination of coal power and energy cuts. Nonetheless, BCA’s commodity and energy strategists estimate that the 14GW of coal-fired generation capacity announced so far and the 15% cut in demand pushed by the European Commission will allow Europe to limp along this winter and avoid the nightmare scenarios delineated by the Bundesbank four months ago. Ultimately, we expect European economic activity to rebound rapidly in the second quarter of 2023. European governments will not sit idly by when their economies are suffering from a major drag caused by a conflict. Households and the sectors that will be most affected by energy rationing (industrials, such as chemicals and cement) will receive help. Thus, fiscal policy will remain accommodative. Moreover, any production curtailed during the winter will be postponed, which means that activity will likely rebound sharply once the weather warms up. On the inflation front, we continue to see a peak in inflation in the coming months. Commodity inflation is peaking and supply-side constraints are ebbing, which will lessen overall inflation (Chart 6). Additionally, the current weakening demand in Europe, tighter financial conditions, and slowing money supply growth are all consistent with a slowdown in inflation (Chart 7). Chart 6Weaker Commodity Inflation
Weaker Commodity Inflation
Weaker Commodity Inflation
Chart 7Domestic Conditions Becoming Disinflationary
Domestic Conditions Becoming Disinflationary
Domestic Conditions Becoming Disinflationary
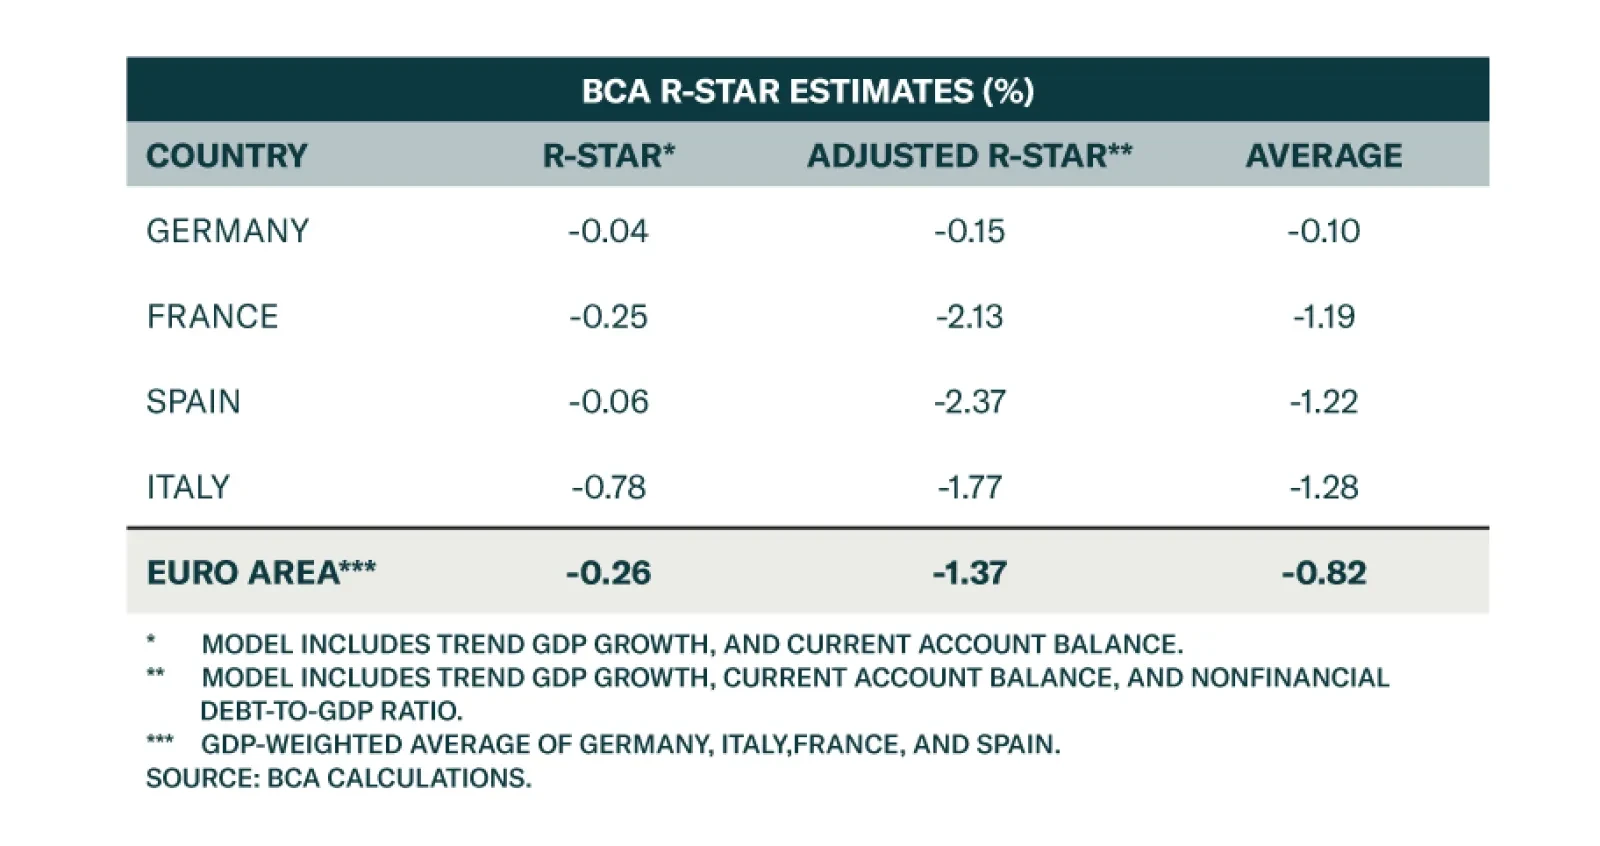
Regarding monetary policy, the ECB wants to hike — and hike it will. Our base case scenario calls for a 50bps hike in September, but risks are skewed to the downside because of the weakening economic activity. We also expect two 25bps interest rate increases in October and December, which is somewhat under the €STR curve pricing, but only marginally so (Chart 8). However, we do expect the Transmission Protection Instrument (TPI) to be activated in the fall to facilitate higher policy rates because of the vast difference in r-star between Germany and the periphery. Chart 8A Tad To High
A Tad To High
A Tad To High
For government bonds, since we foresee a small dovish surprise by the ECB as well as lower inflation, we anticipate slightly more downside for German Bund yields for the rest of the year. Italian government bonds remain risky in the near-term as market participants test the ECB’s resolve regarding the TPI and Italian politics remain in a state of flux. However, the eventual ECB purchases render them an attractive bet in medium- to long-term portfolios. Despite the slowdown in activity, European equities have already entered a bottoming process. They are cheap and their multiples are already consistent with deep stagflation fears (Chart 9, top panel). Moreover, earnings revisions are already contracting (Chart 9, bottom panel). The collapse in the euro, however, is providing a potent counterweight to economic weaknesses and is allowing European firms to beat analyst expectations. This positive view on the aggregate stock level does not translate yet into an overweight stance on cyclical equities versus defensive ones. Lower inflation and potentially lower global yields help defensive stocks, not cyclical ones. Meanwhile, the Chinese economy continues to struggle with the impact of Beijing’s zero-COVID policy and the disarray in the housing market. These forces suggest that European cyclicals could suffer further underperformance in the coming months (Chart 10), especially if European activity and global trade remain under stress. Additionally, the risks caused by the energy market will continue to warrant a discount in European cyclical equities. Chart 9The Bottoming Process For Stock Has Begun
The Bottoming Process For Stock Has Begun
The Bottoming Process For Stock Has Begun
Chart 10Cyclicals Are Still Handicapped
Cyclicals Are Still Handicapped
Cyclicals Are Still Handicapped
Chart 11IG Prices In A Recession Already
IG Prices In A Recession Already
IG Prices In A Recession Already
European credit, especially investment-grade corporate, offers more appealing risk-adjusted returns than equities. Valuations in the IG space are clearly discounting a severe recession, with the 12-month breakeven spreads in their 80th historical percentile (Chart 11). Meanwhile, the combination of shallower than-once-feared recession with continued fiscal support and further ECB buying will help spreads narrow. As a result, we continue to favor IG to increase risk exposure in Europe. We also favor European IG debt over their US counterparts, especially on a USD hedge basis. The euro remains at a complex juncture. As we wrote three weeks ago, EUR/USD is increasingly attractive for long-term holders. It is cheap and a turnaround in growth next year will help this pro-cyclical currency. However, in the near-term, the euro must cope with the negative impact of China’s growth weakness, Europe’s more pronounced recession risk relative to the US, and the evolving threat of a severe energy crunch. As a result, we continue to see a very fat left tail in EUR/USD in the near-term and prefer the CHF to other European currencies as a vehicle to garner exposure to Europe. Bottom Line: European growth will remain challenged in the near-term, but a severe recession will be avoided. With inflation also peaking this fall, European stocks are in the process of forming a bottom; yet, economic softness will prevent cyclical shares from outperforming their defensive counterparts. Additionally, European IG debt offers more attractive risk-adjusted returns than equities in the near-term. Finally, the euro still faces potent front-loaded headwinds, despite a seductive long-term outlook. Consequently, investors should favor the CHF to gain exposure to European currencies. House Cleaning We take this opportunity to restate our view for the remainder of the year, and to clean up our recommendation and focus on those most aligned with the aforementioned views. The trades from our rotation framework are not impacted, as they are not linked to our key views. Tactical Trades We keep the following tactical trades on the books: Neutral stance on cyclicals relative to defensives: This trade is aligned with our worries that weak global growth will continue to hurt the performance of cyclical equities. Long German / short Italian industrials: This is an uncorrelated trade that benefits from the extreme valuation discount of German industrials relative to their southern counterparts. Moreover, the German economy is faring better than that of Italy, while German financial and monetary conditions are looser than those in Italy. Long Swiss equities / short Eurozone defensives: This is another uncorrelated trade. Swiss stocks are pricey and defensive. However, they are less exposed to the energy rationing this winter than their Eurozone counterparts. Moreover, this position is an implicit bet on a weaker EUR/CHF. Long / short basket based on Combined Mechanical Valuation Indicator: This is another uncorrelated trade, based strictly on the most extreme signals from our CMVI methodology. It is a risk averse approach that focuses on buying assets discounting the worst outcome and buying those pricing in some excessively optimistic scenarios. Short European tech firms / long European healthcare shares: This is a defensive trade that seeks to avoid taking a directional bet on the performance of high duration stocks relative to the market. It corresponds to our worry about cyclicals relative to defensives Combined Mechanical Valuation Indicator Top 20: This position is similar to our country-selected CMVI trade, but here, it picks the most extreme signals in terms of valuation among 2,000+ sectoral trades across nine European countries. Short European consumer discretionary / long telecom services: This is another defensive trade that is supported by valuations and that benefits from the negative impact on real household income of inflation. It will also gain if energy prices additionally increase and further hurt discretionary spending. Overweight Spanish and Italian bonds: This position has now become a cyclical bet. Italian and Spanish bonds could suffer some additional near-term volatility; however, the upcoming activation of the ECB’s TPI will cause these spreads to widen, offering investors the opportunity to enjoy a much higher yield than Bunds and capital gains as well. Long Eurozone Investment Grade corporate: We are moving this position to become a cyclical trade. It is a direct bet on our positive stance on European IG corporates. Sell EUR/JPY: This trade is a play on the near-term downside risk to the euro. Cyclical Trades: We keep the following cyclical trades on the books: Underweight French consumer discretionary stocks relative to the French equity benchmark: The overbought and expensive status of the entire French stock benchmark comes from the consumer discretionary sector. These stocks are treated as growth stocks; however, the decline in global consumer confidence is historically associated with a vanishing premium for this sector. Long Swedish Industrials / short Eurozone and US industrials: This is a sector neutral trade that avoids overexposure to cyclicals. Instead, it takes advantage of the fact that Swedish industrials have a higher return on assets and profit margins than that of their competitors in the Eurozone and the US. Moreover, the SEK is particularly cheap, which boosts the competitiveness of Swedish industrial equities. Favor Eurozone aerospace & defense stocks relative to the benchmark: Defense stocks are our favorite sector at the moment. They benefit from both European re-armament and from the need for power projection in a multipolar world. Favor Eurozone aerospace & defense stocks relative to industrials: Industrials are likely to see their valuation premium diminish once inflation recedes. They currently trade as an inflation hedge because of their comparatively robust pricing power. Meanwhile, defense equities benefit from the structural tailwind described above. Favor Spanish over Italian equities: Spain’s competitiveness has improved considerably relative to the rest of the Eurozone, notably relative to Italy. Importantly, Spain’s political risk is currently lower than that of Italy. Underweight German Bunds within European fixed-income portfolios: This trade is similar to our overweight stance on Italian and Spanish bonds. Overweight Gilts within European fixed-income portfolios: The British economy is weak, which constraints the ability of the BoE to push up rates as much as what is priced into the SONIA curve. Short EUR/SEK: This trade is being move to a structural position. The Swedish economy is more cyclical than that of Europe, but Sweden is less at risk than the Eurozone from Russia’s energy curtailments. Moreover, Swedish returns on assets are superior to those of the Euro Area, which is positive for the currency on a long-term basis. Mathieu Savary, Chief European Strategist Mathieu@bcaresearch.com Tactical Recommendations Cyclical Recommendations Structural Recommendations
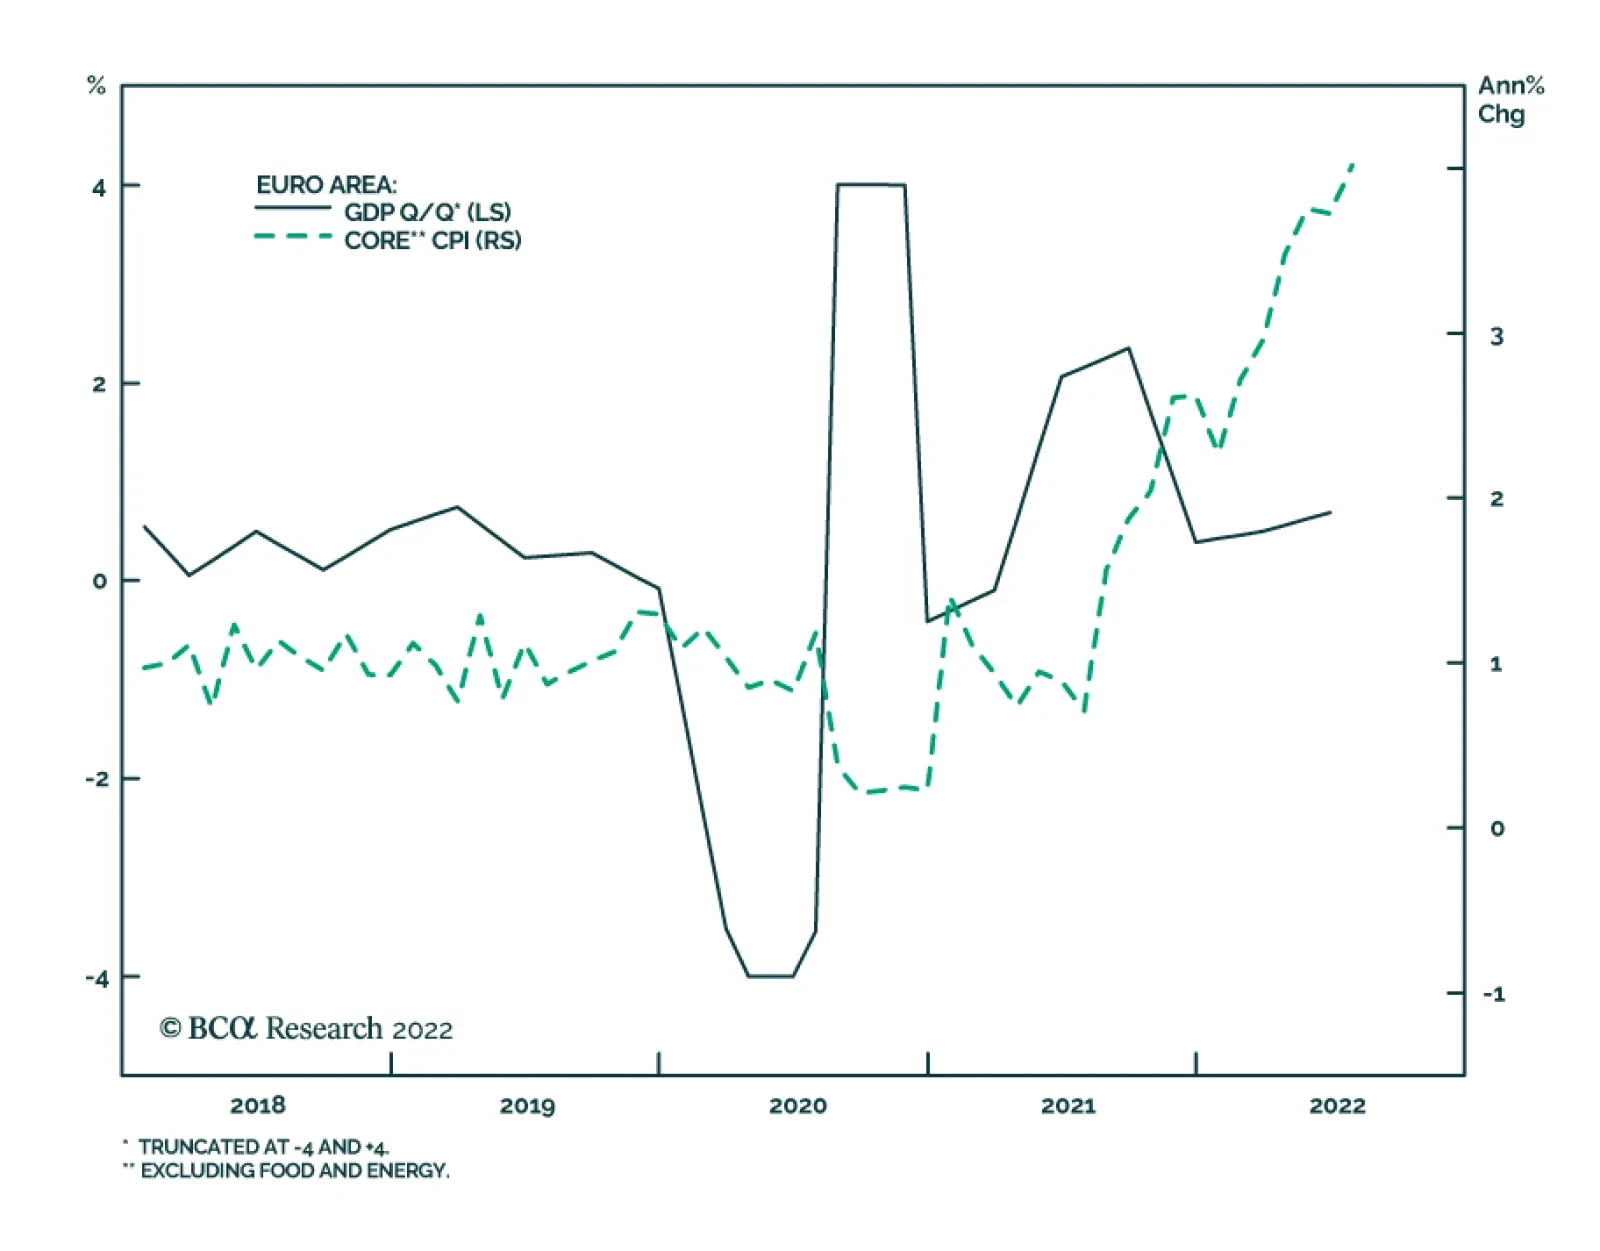
Preliminary estimates indicate that Euro Area GDP growth accelerated from 0.5% q/q in Q1 to 0.7% q/q in Q2, significantly better than the 0.2% anticipated. Notably, France’s GDP expanded by 0.5% q/q following a surprise contraction in Q1 while Spain and…
Listen to a short summary of this report. Executive Summary US Lead On Mega-Sized Firms: Is A Peak Nigh?
America's Lead On Mega-Sized Companies: Is A Peak Nigh?
America's Lead On Mega-Sized Companies: Is A Peak Nigh?
The US has been the star protagonist of global equity markets for decades. It offers investors the rare combination of a big economy and a large universe of mega-sized listed companies. In fact, the overwhelming majority of the top 20 largest firms globally by revenue today are American. But can the US maintain this degree of presence on this list over the next decade? We think that this is unlikely. For starters, a decline in the US’s footprint could be driven by the fact that there is a peculiar stagnation in the works in the middle tier of American firms. Given that this tier acts as a talent pool for big firms, a stagnation here could mean that the US spawns fewer super-sized firms. The high market share commanded by big American firms could also end up being a liability. This dominance could bait regulatory attention, thereby affecting these firms’ growth prospects. Finally, slowing GDP growth in the US, as compared to its Asian peers, will prove to be another headwind that American firms must contend with. What should strategic investors do to prepare for this tectonic shift? We recommend reducing allocations to US equities over the long run since the US’s weight in global indices will peak soon (or may have already peaked). Bottom Line: Irrespective of what the Fed does (or does not do), the US’s footprint in the global league tables of big firms by revenue will weaken over the next decade. Strategic investors can profit from this change by reducing allocations to US equities while increasing allocations to China as well as a basket of countries including Korea, Japan, Taiwan, and Germany. Dear Client, This week, we are sending you a Special Report by Ritika Mankar, CFA, who will be writing occasional special reports for the Global Investment Strategy service on a variety of topical issues. Ritika makes the case that the US economy’s ability to spawn mega-sized companies may become increasingly compromised over the next decade. We will return to our regular publishing schedule next week. Best Regards, Peter Berezin, Chief Global Strategist US: Home To The Largest Number Of Big Listed Firms 2022 has been a turbulent year for US markets so far. But it is worth bearing in mind that the US has been the star protagonist of global equity markets for decades. This is because the US has offered investors a near-perfect trifecta constituting of: (1) A mega-sized economy; (2) A large universe of mega-sized listed companies; and (3) A track record of market outperformance. Specifically: Largest Economy: For over a century now, the US has been the largest economy in the world – a title it is expected to defend over the next few years (Chart 1). Large Listed Companies: The US’s high nominal GDP has also translated into high sales growth for its listed space. This, in turn, powered a great rise in the American equity market’s capitalization (Chart 2). In fact, the US’s market cap is so large today that it exceeds the cumulative market cap of the next four largest economies in the world, by a wide margin. So unlike Germany or China (which have large economies but small markets), the US has a large economy and is also home to some of the largest, most liquid stocks globally. Chart 1The US Will Remain The World’s Largest Economy For The Next Few Years
America's Lead On Mega-Sized Companies: Is A Peak Nigh?
America's Lead On Mega-Sized Companies: Is A Peak Nigh?
Chart 2The Listed Universe In The US Has Grown From Strength To Strength
America's Lead On Mega-Sized Companies: Is A Peak Nigh?
America's Lead On Mega-Sized Companies: Is A Peak Nigh?
Chart 3Growing Sales In The US Have Powered Its Outperformance Over The Past Decade
Growing Sales In The US Have Powered Its Outperformance Over The Past Decade
Growing Sales In The US Have Powered Its Outperformance Over The Past Decade
Long History of Outperformance: And most importantly, the US market has a strong track record of outperformance. US markets have outperformed global benchmarks over the past decade thanks largely to the rapid sales growth seen by American firms (Chart 3). Notwithstanding the US’s star role in global markets thus far, in this report we highlight that the US’s heft will likely decline over the next decade. The Fed may or may not administer recession-inducing rate hikes in 2022. But irrespective of what the Fed does over the next 12-to-24 months, the US’s loss of influence in global equity markets appears certain because it will be driven by structural forces. Chart 4US Lead On Mega-Sized Firms: Is A Peak Nigh?
America's Lead On Mega-Sized Companies: Is A Peak Nigh?
America's Lead On Mega-Sized Companies: Is A Peak Nigh?
Firstly, while behemoths such as Apple and Amazon have been attracting record investor attention, it is worth noting that the next tier of mid-sized American companies is no longer thriving as it used to. The reason why this matters is because history suggests that the pool of mid-sized companies acts as a superset for the big companies of tomorrow. So, if this talent pool is not booming today in the US, then there is likely to be repercussions tomorrow. Secondly, the US’s largest firms will have to contend with two structural headwinds over the next decade, namely increased regulatory attention and slowing growth. To complicate matters for American firms, competitors in Asia will not have this albatross around their neck. Hence, the US may remain the largest economy of the world a few years from now but is unlikely to be home to as many big, listed companies as it is today (Chart 4). The rest of this report quantifies the strength of these forces, and then concludes with actionable investment ideas. Trouble In The Talent Pool Chart 5The US Is Home To Nearly A Dozen Mega-Sized Firms Today
America's Lead On Mega-Sized Companies: Is A Peak Nigh?
America's Lead On Mega-Sized Companies: Is A Peak Nigh?
2021 produced a special milestone for the American economy. This was the first year that ten listed American firms1 surpassed $200 billion in annual revenues (firms we refer to as ‘Big Shots’ from here on) (Chart 5). The US has been a global leader when it came to the size of its economy for decades, but last year it also became home to the largest number of big, listed corporations (Table 1). American Big Shots were striking both in terms of their number as well as their scale. In fact, such was their scale that the combined revenue of these ten Big Shots now exceeded the nominal GDP of major economies like India (Chart 6). Table 1The US Today Dominates The Global List Of Top 20 Firms
America's Lead On Mega-Sized Companies: Is A Peak Nigh?
America's Lead On Mega-Sized Companies: Is A Peak Nigh?
Chart 6The Revenues Of US Big Shot Firms Are Comparable To India’s Nominal GDP!
America's Lead On Mega-Sized Companies: Is A Peak Nigh?
America's Lead On Mega-Sized Companies: Is A Peak Nigh?
While the world has been captivated by the size that the US’s Big Shots have achieved (as well as the ideas of their unconventional founders), few have noticed that the talent pool for tomorrow’s Big Shots is no longer burgeoning. History suggests that most Big Shot firms tend to emerge from firms belonging to a lower revenue tier. For instance, Amazon and Apple, which have revenues in the range of $350-to-$500 billion today, were mid-sized firms a decade ago with revenues in the vicinity of $50-to-$100 billion (Chart 7). Chart 7Most Big Shots Today Were The Mid-Sized Firms Of Yesterday
America's Lead On Mega-Sized Companies: Is A Peak Nigh?
America's Lead On Mega-Sized Companies: Is A Peak Nigh?
This is why it is worrying that all is not well in the US’s ecosystem of mid-sized firms. If we define firms with annual revenues of $50-to-$200 billion as ‘core’ firms, then their share in the total number of American firms has stagnated over the past decade (Chart 8). Even the revenue share accounted for by core firms has been fading (Chart 9). This phenomenon contrasts with the situation in China, where the mid-sized firms’ cohort has been growing over the last decade (Charts 10 and 11). Chart 8Share Of Mid-Sized Firms In The US Has Stagnated
America's Lead On Mega-Sized Companies: Is A Peak Nigh?
America's Lead On Mega-Sized Companies: Is A Peak Nigh?
Chart 9The Revenue Share Of US Mid-Sized Firms Is Also Falling
America's Lead On Mega-Sized Companies: Is A Peak Nigh?
America's Lead On Mega-Sized Companies: Is A Peak Nigh?
Chart 10Share Of Mid-Sized Firms In China Is Expanding
America's Lead On Mega-Sized Companies: Is A Peak Nigh?
America's Lead On Mega-Sized Companies: Is A Peak Nigh?
Chart 11The Revenue Share Of Chinese Mid-Sized Firms Is Rising
America's Lead On Mega-Sized Companies: Is A Peak Nigh?
America's Lead On Mega-Sized Companies: Is A Peak Nigh?
Japan’s experience also suggests that when the mid-sized firms’ ecosystem weakens, the pipeline of future potential mega-cap companies get affected. In Japan, the proportion of core firms (Chart 12), as well as their revenue share (Chart 13), has not been growing as is the case, say, in China. And this is perhaps why, despite being the third-largest economy in the world today, Japan is home to only one listed mega-sized corporation with revenues of over $200 billion (Toyota).
Image
Chart 13The Revenue Share Of Japanese Mid-Sized Firms Has Plateaued
America's Lead On Mega-Sized Companies: Is A Peak Nigh?
America's Lead On Mega-Sized Companies: Is A Peak Nigh?
The US May Have Hit Peak Oligopolization The fact that ten Big Shot firms (i.e., firms with annual revenues of over $200 billion) exist in the US today is remarkable. After all, the number of Big Shot firms in the US today exceeds the total number of Big Shots in the next four largest economies of the world combined (Chart 14). Chart 14The US Today Is The Global Hub For Mega-Sized Companies
America's Lead On Mega-Sized Companies: Is A Peak Nigh?
America's Lead On Mega-Sized Companies: Is A Peak Nigh?
So why will the US’s leadership in this area come under pressure going forward? One reason is that the large size of American firms could itself become a liability. Specifically: Public Backlash Against The US’s Big Shots: The ten Big Shot firms of the US today account for more than a fifth of the revenue generated by all firms that constitute the MSCI US index (Chart 15). Also, the number of Big Shot firms, as a share of total firms, is high in the US (Chart 16). Chart 15Big Shots Account For More Than A Fifth Of Revenues Generated By The US Listed Space
America's Lead On Mega-Sized Companies: Is A Peak Nigh?
America's Lead On Mega-Sized Companies: Is A Peak Nigh?
Chart 16A Large Proportion Of Firms In The US Are Very Big
America's Lead On Mega-Sized Companies: Is A Peak Nigh?
America's Lead On Mega-Sized Companies: Is A Peak Nigh?
Notably, market leaders across a range of key sectors in the US account for an unusually large chunk of the sector’s revenues. Financials, Information Technology, and Consumer Discretionary together account for about half of the US equity market index’s weight. The dominant firm in each of these three sectors (as defined by MSCI) accounts for 15%-to-25% of that sector’s revenue (Chart 17). Market power usually benefits investors. But too much market power can be a problem. The growing oligopolization of the US economy has caused public dissatisfaction over the influence of corporations in the US to hit a multi-year high (Chart 18). Over 60% of Americans want major US corporations to have less influence. It is for this reason that the record scale acquired by American firms could prove to be an issue. American mega-scaled firms’ high market shares will provide them with pricing power, but this very power will end up baiting regulatory attention and anti-trust lawsuits which, in turn, will restrict their future growth rates. The fact that the US Federal Trade Commission (FTC) today is headed by a leader who wants to return the FTC to its trust-busting origins, and made her name by writing a paper arguing for Amazon to be broken up,2 is indicative of which way the wind is blowing. Chart 17Market Leaders In The US Are Too Big
America's Lead On Mega-Sized Companies: Is A Peak Nigh?
America's Lead On Mega-Sized Companies: Is A Peak Nigh?
Chart 18Public Dissatisfaction With US Big Shot Firms Is High And Rising
America's Lead On Mega-Sized Companies: Is A Peak Nigh?
America's Lead On Mega-Sized Companies: Is A Peak Nigh?
Interestingly, the speed at which the US restricts the market power of big firms will determine how quickly the US’s mid-sized firms begin to flourish again, thereby setting the stage for the US to spawn a new generation of big firms. Besides the growing regulatory risks for the US’s big firms, three other technical factors will end up slowing the pace at which the US can generate large firms, namely: Slowing GDP Growth: Since the US is a large and mature economy, the pace of its growth is bound to slow (Chart 19). Besides the deceleration in the US’s growth rate relative to its own past, it is projected to end up being lower than that of major economies like China. Chart 19US GDP Growth Is Set To Slow
America's Lead On Mega-Sized Companies: Is A Peak Nigh?
America's Lead On Mega-Sized Companies: Is A Peak Nigh?
Big Business ≠ Big GDP Growth: While GDP growth receives a fillip when small firms grow, the high pricing power that very large firms command can end up constraining an economy’s growth rate. This is because large firms can charge monopolistic prices, thereby restraining demand. Secondly, mega-sized firms may actively invest in manipulating institutions to block upstarts,3 a dynamic that can restrict productivity growth as well. Chart 20The Revenue-To-Nominal GDP Ratio Is Already Elevated In The US
America's Lead On Mega-Sized Companies: Is A Peak Nigh?
America's Lead On Mega-Sized Companies: Is A Peak Nigh?
Approaching Revenue Saturation: A cross-country comparison suggests that the revenue-to-nominal GDP ratio in the US is high1 (Chart 20). Only Japan has a superior ratio, which is likely to be an aberration rather than the norm (owing to Japanese firms’ unique tendency to prioritize revenues over profitability). Given that the US revenue-to-nominal GDP ratio is already elevated, it is likely that even as the US’s nominal GDP keeps growing, the pace of conversion of this GDP into revenues will stay the same or may even diminish over the coming decade. Prepare For A Brave New World “German judges…first read a description of a woman who had been caught shoplifting, then rolled a pair of dice that were loaded so every roll resulted in either a 3 or a 9. As soon as the dice came to a stop, the judges were asked whether they would sentence the woman to a term in prison greater or lesser, in months, than the number showing on the dice…On average, those who had rolled a 9 said they would sentence her to 8 months; those who rolled a 3 said they would sentence her to 5 months; the anchoring effect was 50%.” – Daniel Kahneman, Thinking, Fast and Slow (Farrar, Straus and Giroux, 2011) The US has been the largest economy in the world and has also been able to nurture some of the largest mega-scaled companies of today. Such is the might and size of these firms that it is impossible to imagine a world where American firms’ leadership could be disrupted. Moreover, it is mentally easier to extrapolate the US’s lead today into the future. It may even seem like there is no other alternative to the US since Japan’s economy has been stagnating, Europe lacks innovation, and the political environment in China is contentious. Also, it is true that the US today is the undisputed leader when it comes to qualitative factors such as the ability to attract top global talent, its education system, and its legal system. However, the case can be made that this belief (that the US’s lead on mega-sized companies will spill into the next decade) runs the risk of becoming a Kahneman-esque anchoring bias. This is because: History Suggests That Upsets Are The Norm: History suggests that the evolution of the top 20 global firms (by revenue) has been a story of upsets. For instance, Europe’s hold over this list in the 2000s was striking by all accounts (Chart 21). Back then, it would have been almost blasphemous to question Europe’s lead (Chart 22). But today firms from three Asian island-countries account for more companies on this list than all of pre-Brexit Europe put together. Chart 21In The 2000s, Europe Was The Epicenter Of Global Mega-Sized Firms
America's Lead On Mega-Sized Companies: Is A Peak Nigh?
America's Lead On Mega-Sized Companies: Is A Peak Nigh?
Chart 22How The Mighty Can, And Do, Fall
America's Lead On Mega-Sized Companies: Is A Peak Nigh?
America's Lead On Mega-Sized Companies: Is A Peak Nigh?
China’s Disadvantages < Its Competitive Advantages: Despite its political baggage, China has the most formidable capability today to displace the US’s leadership position on the league tables of top 20 global firms by revenue. This is because China has a thriving ecosystem of core firms (Chart 11) and is set to grow at a faster clip than the US over the next five years (Chart 19). Moreover, while the Chinese government’s tolerance for large tech giants could remain low, the establishment could be keen to grow firms in the industrials as well as financials space for the sake of common prosperity. EM Listed Space Can Catch Up: The listed space in the US has developed at an exceptionally fast pace relative to its peers. The gap between US nominal GDP and listed space parameters is low (Chart 20), while the gap is wider for countries like Germany, China, and several other EMs. Even in a ceteris paribus situation where nominal GDPs were to stay static, an increase in the size of the listed universe in other countries can adversely affect the US’s current footprint. So, what can investors do to prepare for this coming tectonic shift? We recommend reducing allocations to US equities since the US’s weight in global indices will peak soon. It is worth noting that this strategic investment recommendation dovetails nicely with our earlier view that strategic investors should rotate out of US stocks. Currently, about half of the 20 largest firms globally by revenue are American (Map 1). Owing to the dynamics listed above, the number of American firms in the global league of top 20 could fall from this high level to 7 or 8 over the coming decade. Given that this change is indicative of things to come, we would urge investors to reduce allocations to US equities in a global portfolio over a strategic horizon. A confluence of micro and macro factors is likely to result in the US’s weight in global indices to crest sooner rather than later. Map 1Could The Global Epicenter Of Big Firms Drift Eastwards Over The Next Decade?
America's Lead On Mega-Sized Companies: Is A Peak Nigh?
America's Lead On Mega-Sized Companies: Is A Peak Nigh?
In fact, US equities’ weight in a global index like the MSCI ACWI could have already peaked (Chart 23) and could fall by 500-to-600bps over the next decade if the last year’s trend is extrapolated into the future. As regards to sectors, health care appears to be the key industry where the US’s footprint could weaken (Table 2). Chart 23Loss Of US Influence Will Create Space For Underrepresented Markets To Grow
America's Lead On Mega-Sized Companies: Is A Peak Nigh?
America's Lead On Mega-Sized Companies: Is A Peak Nigh?
Table 2China’s Weight In Top 20 Firms Is Set To Grow
America's Lead On Mega-Sized Companies: Is A Peak Nigh?
America's Lead On Mega-Sized Companies: Is A Peak Nigh?
As the US cedes its leadership position, we expect the global epicenter of mega-sized listed corporates to drift eastwards (Map 1). Specifically: China: Currently, less than a quarter of the 20 largest firms globally by revenue are Chinese (Map 1). It is highly likely that the number of Chinese firms in the global list of top 20 firms will increase. China should be able to spawn more mega-sized companies since it already has a cache of promising large and mid-sized companies. Chinese companies will also benefit from the high growth rate of China’s domestic economy. From a sectoral perspective, financials and industrials appear to be two sectors where China’s footprint could grow the most (Table 2). Asia Ex-China: Asian countries like Korea, Taiwan, and Japan could potentially end up growing their weight in global equity indices by becoming home to more than one company that makes it to the global league tables of large companies. Besides the high GDP growth rate on offer in their domestic markets (Chart 20), firms in these countries could increase scale by feeding a stimulus-fueled industrial boom in the US. Additionally, these Asian countries have a competitive advantage when it comes to high-tech manufacturing capabilities (Chart 24). This will ensure that they will accrue any offshore opportunities that arise. Taiwan has the potential to grow its presence in the Information Technology space, given its innate competitive advantages (Chart 24) and the positive structural outlook for global semiconductor demand. In the case of India, it is worth noting that the country’s influence in the world economy will be ascendant over the next decade as its growing middle class flexes its muscles. Despite this, the probability of an Indian firm making an appearance among the largest firms of the world is low given the unusually small size of Indian companies today. Europe: Distinct from the Asian countries listed above, Germany could benefit from the industrial boom in the US given its capabilities when it comes to high-end manufacturing (Chart 24). Even as we believe that oil faces a bleak future on a structural basis, if a commodities supercycle were to take hold over the next decade, then the UK and France could improve their presence in global equity benchmarks given that Europe is home to some large firms in the energy sector. A commodities supercycle will also end up benefiting China and the US, since some large energy producers are also located in these countries. Chart 24Korea, Japan, And Germany Have An Edge In Manufacturing, While Taiwan, Japan, And China Have An Edge In Semiconductors
America's Lead On Mega-Sized Companies: Is A Peak Nigh?
America's Lead On Mega-Sized Companies: Is A Peak Nigh?
Appendix The Methodology The starting point for most country-level economic analyses tends to be a country’s nominal GDP. But as market economists we realized that some key advantages could be unlocked by focusing on ‘revenues’ generated by the listed universe of a country. These advantages include: Investment Focus: As compared to nominal GDP which ends up picking up signals about the health of the listed ‘and’ unlisted firms in any country, focusing on listed firms’ revenues allows us to home-in on the health of the listed space. This is a valuable merit since the listed space is what public equity investors can buy into. For example, India is the fifth largest economy of the world and is also one of the fastest growing economies globally. But India is also characterized by a listed space where the largest companies have revenues of only around $100 billion. This makes India less investable than countries like Taiwan or South Korea that have far smaller nominal GDPs as compared to India but are home to firms with revenue of around $200 billion. Taking note of this difference - between the size of a country’s nominal GDP and the size of investable firms in a country - is key for our clients. Focus On Cause, Not Effect: It is fashionable today in the financial press to focus on the daily changes in market capitalization of assets (and non-assets too). But it is critical to note that the market cap of a stock or the price of a security is a dependent variable. Revenue, on the other hand, is a key independent variable that influences prices. So, a focus on forecasting movement in revenues of companies in a country ten years down the line, can be a more fruitful exercise for strategic investors. Steady And Stable: Revenue generated by a firm, is also a superior measure as compared to the market capitalization of a firm because the latter can be volatile. Whilst it could be argued that earnings of a company as a variable also offer stability and influence prices, earnings suffer from one drawback which is that it is a function of revenues as well as costs. Revenues of companies on the other hand have a direct theoretical link to the nominal GDP of a country. So, to rephrase a popular adage - market cap is vanity, nominal GDP is sanity, but revenue is king. This is the reason why in this Special Report, we analyze investment opportunities through the lens of revenues generated by listed firms in some of the largest economies of the world. We do so by focusing on the constituents of MSCI Country Indices (Equity) for major world economies in 2021. Ritika Mankar, CFA Editor/Strategist ritika.mankar@bcaresearch.com Footnotes 1 Based on MSCI ACWI data for 2021. 2 Kiran Stacey, “Washington vs Big Tech: Lina Khan’s battle to transform US antitrust,” ft.com, August 2021. 3 Kathy Fogel, Randall Morck, and Bernard Yeung, “Big Business Stability And Economic Growth: Is What’s Good For General Motors Good For US?”, NBER Working Paper No. 12394, nber.org, July 2006.
Executive Summary Italy’s right-wing alliance, led by Brothers of Italy, will likely outperform in the upcoming election. The new government will prioritize the economy, posing a risk to the EU’s united front against Russia. It is conducive to an eventual ceasefire, which is marginally positive for risk assets in 2023. We recommend investors underweight Italian assets on a tactical basis. China’s political risks will remain elevated until Xi consolidates power this fall, positive news will come after, if at all. Geopolitical risk in the Taiwan Strait will remain high and persistent until China and the US reach a new understanding. Separately, we are booking a 9% gain on our long US equities relative to UAE equities trade. Italy: GeoRisk Indicator
Italy: GeoRisk Indicator
Italy: GeoRisk Indicator
Tactical Recommendation Inception Date Return LONG US / UAE EQUITIES (CLOSED) 2022-03-11 9.0% Bottom Line: Italy’s political turmoil suggests a more pragmatic policy toward Russia going forward. Europe’s energy cutoff will also motivate governments to negotiate with Russia. Feature In this report we update our GeoRisk Indicators, with a special focus on Italy’s newest political turmoil. Italy Over the past several months, we have argued that Italy was a source of political risk within the European Union and that the market underestimated the probability of an early Italian election. In the past two weeks, this forecast has become a reality (Chart 1). Chart 1Italy: GeoRisk Indicator
Italy: GeoRisk Indicator
Italy: GeoRisk Indicator
The grand coalition under Prime Minister Mario Draghi had fulfilled its two main purposes – to distribute EU recovery funds and secure an establishment politician in the Italian presidency. At the same time, headline inflation hit 8.5% in June, the highest since 1986, even as the Italian and global economy slowed down, Italian government bonds sold off, and Russia induced an energy crisis. The stagflationary economic environment is biting hard and the different coalition members are looking to their individual interests ahead of election season. On July 14, Giuseppe Conte, the former prime minister, pulled its populist Five Star Movement (M5S) out of Mario Draghi’s national unity government, triggering a new round of political turmoil in Italy. Draghi’s first resignation was rejected by Italian President Mattarella later that day. However, on July 21, the League and Forza Italia also defected from the grand coalition. After Draghi’s plan of reviving the coalition collapsed, President Mattarella accepted his resignation and called for a snap election to be held on September 25, ten months ahead of the original schedule. Based on the latest public opinion polls, right-wing political parties are well-positioned for the upcoming election. The far-right Brothers of Italy is now the front runner in the election race and is expected to win around 23% of the votes. Another far-right party, the League, is the third most popular party, with nearly 15% support despite a drop in support during its time within the grand coalition. In addition, the center-right Forza Italia receives 8.5% of the support. Together, the right-wing conservative bloc amounts to 46.5% of voting intentions. There is still positive momentum for Brothers of Italy to harvest more support given that they are the flag-bearer for anti-incumbent sentiment amid the stagflationary economy. By contrast, the left-wing parties – the Democrats, the Left, and the Greens – only command about 27%. The possibility of an extended left-wing coalition, even with the inclusion of the M5S, is looking slim. On July 25, Enrico Letta, the leader of the Democratic Party, publicly expressed his anger against party leader Giuseppe Conte and ruled out any electoral pact with the M5S because of the recent political chaos they caused. He stressed that the Democratic Party would seek ties with parties that had remained loyal to Draghi’s national unity. However, there are not many parties left for the Democrats to partner with. Apart from the Left and the Greens, the Democrats’ best chance would be the center-left Action Party and Italia Viva, which is led by Matteo Renzi, who served as the secretary of the Democratic Party from 2013 to 2018. However, these four parties are small and will not enable the Democrats to form a government. Courting M5S is the Democrats’ only chance to set up an alternative to the right-wing bloc, but that will require the election to force the two parties together. Related Report Geopolitical StrategyLe Pen And Other Hurdles (GeoRisk Update) The Democratic Party was the biggest supporter of Draghi’s government, while the Brothers of Italy were the sole major opposition. Thus the September 25 election will be a race between these two major parties. Both are expected to outperform current polling, as they will attract the most supporters from each side. The other right-wing parties, Forza Italia and the League, will at least perform in line with their polling, while the other left-wing parties will underperform. In the meantime, M5S’ popularity will continue to decline – the party is bruised over its role in Draghi’s coalition and divided over how to respond to the Ukraine war. Foreign policy is a major factor in this election. Italy has the highest share of citizens in the Eurozone who support solving the Russia-Ukraine conflict through peaceful dialogue (52% versus the Eurozone average of 35%). Italy has long maintained pragmatic relations with Russia, including the Putin administration, as it imported 40% of its natural gas from there prior to 2022. The EU is struggling to maintain a united front against Russia, and war policy will be a key focal point among the different parties. Draghi and the Democratic Party are the strongest supporters of the EU’s oil embargo on Russia and decision to send arms to support Ukraine. On the other side, the right-wing Forza Italia and the League have been more equivocal due to their traditional friendship with Russia. What’s more important is the stance of the Brothers of Italy on Russia, as it is the largest party now and will probably lead a right-wing government after the election. On July 27, the three right-wing parties struck a deal to officially form an alliance in the upcoming election and whichever party wins the most votes would determine the next prime minister if the alliance wins. This deal puts Giorgia Meloni, the leader of Brothers of Italy, one step closer to becoming Italy’s first female PM. Giorgia Meloni, unlike her right-wing peers, has endorsed Draghi’s hawkish stance towards Russia. Recently, she stressed that Italy would keep sending arms to Ukraine if her party forms a government after the election. However, Meloni’s speech could be a tactical move to win the election more than an unshakeable policy position. First, like the other two right-wing parties, the Brothers of Italy have had close connections with Russia. After the 2018 Russian presidential election, Meloni congratulated Putin and claimed his victory was “the unequivocal will of Russians.” In addition, she is close to Prime Minister Viktor Orban of Hungary and National Rally leader Marine Le Pen of France, both of whom have criticized the EU’s decision to provide military support to Kyiv. Hence her sharp change of stance this year seems calculated to avoid accusations of being pro-Russian. But that does not preclude a more pragmatic approach to Russia once in office. Second, Meloni has compromised other far-right positions to broaden her voter base. She has reversed the party’s original anti-EU stance and claimed it does not seek to leave the EU, as most European anti-establishment parties have had to do in order to make themselves electable. Being the only female in the election race, Meloni also pledged to protect women’s access to safe abortions in Italy, also a softer stance than before. Even if the Brothers of Italy distance themselves from some unpopular right-wing positions, including on Ukraine, they probably cannot form a government on their own. They will need to court Forza Italia and the League. These two parties prefer a more pragmatic approach to Russia and a peaceful resolution to the war. Thus while it will be hard to find a middle ground on the issue of Ukraine, the election will likely prevent Italy from taking a more confrontational stance toward Russia. It will probably do the opposite. Consider the context in which the next Italian government will operate. Russia declared on July 25 that it will further reduce natural gas supplies to Europe through Nord Stream 1, as we expected, bringing pipeline flows to 20% of its full capacity. Energy prices will go up even as European economic activity and industry will suffer greater strains. If Meloni is elected as the new prime minister this September, she will have to keep talking tough on Russia while simultaneously seeking a solution to soaring energy prices and economic crisis. This solution will be diplomacy – unless Russia seeks to expand its invasion all the way to Moldova. A right-wing victory is the most likely outcome based on opinion polling, the negative cyclical economy, and the underlying structural factors supporting populism in Italy that we have monitored for years. Such a coalition will not be pro-Russian but it will be pragmatic and focused on salvaging Italy’s economy, which means it will be highly inclined toward diplomacy. If Russia halts its military advance – does not attempt to conquer southwestern Ukraine to Moldova – then this point will be greatly reinforced. Italy will become a new veto player within the European Union when it comes to any major new sanctions on Russia. While Europeans will continue diversifying their energy mix away from Russia, it will be much harder for the EU to implement a natural gas embargo in the coming years if Italy as well as Hungary oppose it. Even if we are wrong, and the Democratic Party or other left-wing parties surprise to the upside in the election, the new coalition will most likely have to focus on mitigating the economic crisis and thus pursuing diplomacy with Russia. That is, as long as Russia pushes for a ceasefire after it achieves its military aims in Donetsk, the last holdout within the south-southeastern territories Russia is trying to conquer. Bottom Line: Due to persistent political uncertainty, we recommend investors underweight Italian stocks and bonds at least until a new government takes shape, which could take months even after the election. However, government bonds will remain vulnerable if a right-wing coalition assumes power, since it will pursue loose fiscal policies and will eschew structural reforms. Overall Italy’s early elections will lead to a new government that is focused on short-term economic growth, likely including pragmatism toward Russia. From an investment point of view that will not be a negative development, though much depends on whether Russia expands its invasion or declares victory after Donetsk. Russia Market-based measures of Russian geopolitical risk are rebounding after subsiding from peak levels hit during the invasion of Ukraine in February (Chart 2). Chart 2Russia: GeoRisk Indicator
Russia: GeoRisk Indicator
Russia: GeoRisk Indicator
Russia’s continued tightening of natural gas supplies (and food exports) this week is precisely what we predicted would happen despite a wave of wishful thinking from investors over the past month. The optimists claimed that Russia would resume Nord Stream 1 pipeline flows after a regular “maintenance” period. They also said that Canada’s cooperation in resolving some “technical” issues around turbines would stabilize natural gas supply. The truth is that Russia is seeking to achieve its war aims in Ukraine. Until it has achieved its aims, it will use a range of leverage, including tightening food and energy supplies. Most likely Russia will halt the advance after completing the conquest of the Donbas region and land-bridge to Crimea. Then it will seek to legitimize its conquests through a ceasefire agreement. However, it could launch a new phase of the war to try to take Odessa and Transniestria, which would cement European resolve, even in Italy, and trigger a new round of sanctions. Bottom Line: Russia faces a fork in the road once it completes the conquest of Donetsk. Most likely it will declare victory and start pushing for a ceasefire late this year or early next year. Movement toward a ceasefire would reduce geopolitical risk for global financial markets in 2023. But there is still a substantial risk that Russia could expand the invasion to eastern Moldova, which would escalate the overarching Russia-West conflict and sustain the high level of geopolitical risk for markets. China Chinese political and geopolitical risk will continue to rise and the bounce in Chinese relative equity performance is faltering as we expected (Chart 3). Chart 3China: GeoRisk Indicator
China: GeoRisk Indicator
China: GeoRisk Indicator
China’s leaders will hold their secretive annual meeting at Beidaihe in August ahead of the critical Communist Party national congress this fall. General Secretary Xi Jinping is attempting to cement himself as the paramount leader in China, comparable to Chairman Mao Zedong, transforming China’s governance from that of single-party rule to single-person rule. The reversion to autocratic government is coinciding with a historic economic slowdown consisting of cyclical factors (weak domestic demand, weakening foreign demand, draconian Covid-19 restrictions) and structural factors (labor force contraction, property sector bust, social change and unrest). Both Xi and US President Biden face major domestic political challenges in the coming months with the party congress and the US midterm election. Hence they are holding talks to try to stabilize relations. But we do not think they will succeed. China cannot reject Russia’s strategic overture, while the US cannot afford to re-engage with a China that is partnering with Russia in a challenge to the liberal-democratic world order. In addition, US policies are erratic and the US cannot credibly promise China that it will not pursue a containment strategy even if China offers trade concessions. Bottom Line: China-related political and geopolitical risks will remain very high until at least after the twentieth party congress. At that point we expect President Xi to loosen a range of policies to stabilize the economy and foreign trade relations. These policies may bring positive news in 2023, though China’s biggest macroeconomic and geopolitical problems remain structural in nature and we remain underweight Chinese assets. Taiwan For many years we have warned of a “fourth Taiwan Strait crisis” due to the unsustainable geopolitical situation between China, Taiwan, and the United States. After the war in Ukraine we argued that the US would try to boost its strategic deterrence around Taiwan, since it failed to deter Russia from invading Ukraine, but that the increased commitment to Taiwan would in fact provoke China (Chart 4). Chart 4Taiwan: GeoRisk Indicator
Taiwan: GeoRisk Indicator
Taiwan: GeoRisk Indicator
Until the US and China reach a new understanding over Taiwan, we argued that the region would be susceptible to rising tensions and crisis points that would send investors fleeing from risky assets, especially risky regional assets. It is possible that we have arrived at this crisis now, with House Speaker Nancy Pelosi making preparations to visit Taiwan, China pledging “forceful” countermeasures if she does, President Biden suggesting that the US military thinks Pelosi should not visit, and Biden and Xi preparing for a phone conversation. In essence China is giving an ultimatum and setting a new bar, and a very low bar, for taking some kind of action on Taiwan, i.e. the mere visit of a US House speaker, which has happened before (House Speaker Newt Gingrich in 1997). China’s purpose is to lay the groundwork for preventing the US from upgrading Taiwan relations in any more substantial way, whether political or military. If the Biden administration calls off the Pelosi visit, then American relations with Taiwan will have been curtailed, at least for this administration. If Biden goes forward with the visit, then Beijing will need to respond with an aggressive show of force to prevent any future president from repeating the exercise or building on it. And if this show threatens US personnel or security, a full-blown diplomatic or military crisis could ensue. While we doubt it would lead to full-scale war, it could lead to a frightening confrontation. Biden may want to stabilize relations with China, since he is primarily focused on countering Russia, but his options are limited. China cannot save him from inflation but it can solidify the public perception that he is weak. Hence he is more likely to maintain his administration’s hawkish approach. Biden’s approval rating is 38% and his party faces a drubbing in the midterm elections. A confrontation with Russia, China, Iran, or anyone else would likely help his party by producing a public rally around the flag. Any unilateral concessions will merely strengthen Xi’s power consolidation at the party congress, which is detrimental to US interests. Only if the Biden administration pursues a dovish policy of re-engagement that is subsequently confirmed by the 2024 presidential election will there be potential for a substantial US-China economic re-engagement. We are pessimistic. Bottom Line: Taiwan-related geopolitical risk will rise in the short run. If there is a new US-China understanding over Taiwan, then regional and global geopolitical risk will decline over the medium term. But we remain short Taiwanese assets. Investment Takeaways Investors should remain defensively positioned until the US midterm election ends with congressional gridlock; the Chinese party congress is over and Xi Jinping launches a broad pro-growth policy; and Russia starts pushing for a ceasefire in Ukraine. We also expect that markets will need to get over new, unexpected oil supply shocks arising from the failure of US-Iran nuclear negotiations, which remains off the radar and therefore a source of negative surprises. Any US-Iran nuclear deal would be a major positive surprise that postpones this risk for a few years. Having said that, we are booking a 9% gain on our long US versus UAE equity trade for technical reasons. Democrats have reached a deal to pass a budget reconciliation bill in an effort to mitigate midterm election losses. This development reinforces the 65% odds of passage that we have maintained for this bill’s passage in our US Political Strategy reports since last year. Yushu Ma Research Analyst yushu.ma@bcaresearch.com Matt Gertken Chief Geopolitical Strategist mattg@bcaresearch.com Appendix UK Chart 5UK: GeoRisk Indicator
United Kingdom: GeoRisk Indicator
United Kingdom: GeoRisk Indicator
Germany Chart 6Germany: GeoRisk Indicator
Germany: GeoRisk Indicator
Germany: GeoRisk Indicator
France Chart 7France: GeoRisk Indicator
France: GeoRisk Indicator
France: GeoRisk Indicator
Spain Chart 8Spain: GeoRisk Indicator
Spain: GeoRisk Indicator
Spain: GeoRisk Indicator
Canada Chart 9Canada: GeoRisk Indicator
Canada: GeoRisk Indicator
Canada: GeoRisk Indicator
Australia Chart 10Australia: GeoRisk Indicator
Australia: GeoRisk Indicator
Australia: GeoRisk Indicator
Korea Chart 11Korea: GeoRisk Indicator
Korea: GeoRisk Indicator
Korea: GeoRisk Indicator
Brazil Chart 12Brazil: GeoRisk Indicator
Brazil: GeoRisk Indicator
Brazil: GeoRisk Indicator
Turkey Chart 13Turkey: GeoRisk Indicator
Turkey: GeoRisk Indicator
Turkey: GeoRisk Indicator
South Africa Chart 14South Africa: GeoRisk Indicator
South Africa: GeoRisk Indicator
South Africa: GeoRisk Indicator
Strategic Themes Open Tactical Positions (0-6 Months) Open Cyclical Recommendations (6-18 Months) Regional Geopolitical Risk Matrix "Batting Average": Geopolitical Strategy Trades Geopolitical Calendar
Executive Summary EU Will Prioritize Natgas Storage
Energy Security Rolls Over EU's ESG Agenda
Energy Security Rolls Over EU's ESG Agenda
Russia’s reduction in natural gas flows through the Nord Stream 1 (NS1) pipeline to 20% of capacity will test the EU’s ability to keep the lights on going into winter. The EU’s plan to voluntarily reduce natgas consumption by 15% has a higher likelihood of becoming mandatory, following Russia’s cut in NS1 flows. Coal-fired generation in the EU will come online sooner on the back of the NS1 cutoff. This will allow more natgas supplies to be directed to storage injection ahead of winter. Global natgas supplies will remain tight until 2025, as liquified natural gas (LNG) export capacity is developed ex-EU. Bottom Line: EU energy security will be paramount going into the winter, particularly if Russia keeps gas flows through NS1 at or below 20% of capacity going into winter. Russia most likely is seeking a significant reduction or the complete elimination of EU oil sanctions, which were imposed after it invaded Ukraine. If fully enacted, the EU’s embargo will remove more than 3mm b/d of Russian oil exports to the continent by 1Q23. The EU’s coal reserves and its 15% cut in demand could allow the bloc to get through the winter without a massive recession. If, as we believe, these measures are successful, a strong rally in European equities and bonds could ensue. Feature Following Russia’s halving of NS1 gas flows to 20% of capacity yesterday – taking shipments to ~ 33mm cm/d – the EU will be forced to increase its reliance on coal-fired electricity generation sooner than expected, to ensure as much natgas as possible is directed to filling storage ahead of the coming winter. And it will have to count on high levels of cooperation in reducing natgas demand between August and March by 15%.1 There is nothing that more dramatically illustrates the bind the EU finds itself in than rolling over its ESG agenda to ensure it has sufficient gas supplies to heat homes, hospitals and other critical services over the course of the coming winter. Russia’s cutoff of NS1 supplies is being done to focus EU member states on their precarious energy position just as they are scrambling to fill natgas storage. The sense of urgency in this effort is heightened by relatively high odds (67%) of another La Niña event, which usually is accompanied by colder-than-normal winter temperatures in the Northern Hemisphere.2 Russia appears to be seeking a significant reduction or the complete elimination of EU oil import sanctions, which were imposed after it invaded Ukraine. If fully enacted as approved, this will embargo more than 3mm b/d of Russian oil exports to the continent by 1Q23. The EU was Russia’s largest oil customer prior to the sanctions being approved.3 Russia Deploys Its Gas Weapon The EU is aiming to have 80% of its gas storage capacity filled by November, to ensure it has sufficient supplies for the coming winter (Chart 1).4 Achieving this target will prove difficult and uncertain, since it hinges on 1) gas flows from Russia not dropping precariously low or completely cutting off; 2) higher non-Russian flows; and 3) reduced gas consumption, which, as we noted above, likely will become mandatory. We ran different simulations altering these variables to see how inventories could move for the rest of 2022 and into the winter (Chart 2). Chart 1EU Will Prioritize Natgas Storage
Energy Security Rolls Over EU's ESG Agenda
Energy Security Rolls Over EU's ESG Agenda
Chart 2The EU Could Face A Cold Winter
The EU Could Face A Cold Winter
The EU Could Face A Cold Winter
In the simulations, if a variable changes more than we expect – e.g. Russian supplies drop by more than projected – one or both of the other variables will need to adjust to ensure the EU can sufficiently fill gas storage. This adjustment is not guaranteed, since all three variables will likely not move in accordance with policymakers’ expectations, especially gas flows from Russia as it seeks to imperil the bloc’s energy security. On the supply side, Russian flows can drop with little or no warning, while non-Russian supplies will need to remain ~ 30-35% higher relative to 2021, for the rest of the year to get natgas inventories to or slightly above 80%. On the demand side, the EU deal to cut gas consumption by 15% over the course of August-March was accepted with caveats for some member states. The debate and member states’ dissatisfaction over the initial agreement signals states may not implement this policy until they must, which could be too little too late. Of course, a complete cutoff of natural gas flows on the NS1 pipeline would result in inventories being pulled much harder and earlier, and likely would induce further rationing measures. This would produce a sharper economic contraction, since coal-fired generation and other energy usage likely would have maxed out prior to the sharp fall-off in natgas storage. Higher Coal Usage Buys EU Time Global natural gas markets are expected to remain tight into 2025, given the 5-year lead times required to develop LNG capacity export capacity.5 This is forcing EU member states – particularly Austria, France, Germany and the Netherlands – to place an additional 14 GW of coal-fired generation capacity into its reserve fleet in the event of a complete cutoff of Russian supplies.6 Fossil fuels accounted for 34% of EU generation in 2021, or 1,069 TWh. The largest share of this generation was accounted for by coal (Chart 3). Fossil fuels and renewables provide the largest shares of electricity generation overall in the EU (Chart 4). Chart 3Coal Folded Back Into EU Power Stack
Energy Security Rolls Over EU's ESG Agenda
Energy Security Rolls Over EU's ESG Agenda
The EU would like to see its natgas inventories 80% full by November. This translates to ~ 3.2 TCF of natgas in storage, which would put inventories at the higher end of the 5-year range for November. That’s a big assumption, but it does indicate why the combination of higher coal usage and – critically – the 15% cut in demand (vs. five-year average demand) in our simulations is so important. Together, these measures mean the EU will save almost 1.3 TCF of storage gas from August – March. This assumes, of course, that EU member states pull their weight on the conservation front in this economic war with Russia. If everything goes according to plan for the EU (scenario 2 in the Chart 2), then March 2023 inventories will be at the level of 2.5 Tcf. Compared to last year, that means inventories will be 1.3 Tcf higher. Of course that’s impossible to forecast, but there are realistic outcomes close to this outcome. Chart 4Fossil Fuels, Renewables Provide Most Of EU’s Power
Energy Security Rolls Over EU's ESG Agenda
Energy Security Rolls Over EU's ESG Agenda
Investment Implications The EU and Russia are at a critical juncture as winter approaches. Our analysis indicates the EU can – using its coal reserves and getting full buy-in on the 15% conservation measures adopted this week – weather this storm without experiencing a massive recession. Markets will be watching this evolution carefully. By late January or early February, it will be apparent how well the EU managed this challenge. If, as we believe, these measures are successful, we could expect a strong rally in European equities and bonds. Robert P. Ryan Chief Commodity & Energy Strategist rryan@bcaresearch.com Ashwin Shyam Research Analyst Commodity & Energy Strategy ashwin.shyam@bcaresearch.com Paula Struk Research Associate Commodity & Energy Strategy paula.struk@bcaresearch.com Commodities Round-Up Energy: Bullish The US became the largest exporter of LNG in 1H22 with outbound shipments averaging 11.2 Bcf/d, according to the EIA (Chart 5). US liquefaction peak capacity is estimated at 13.9 Bcf/d, with average capacity at 11.4 Bcf/d. The EU and UK are receiving most of the US LNG, which averaged 7.3 Bcf/d, or 64% of total exports over the January-May 2022 interval. Over 1H22, US exports accounted for close to half of the 15 Bcf/d imported by the EU and UK, making it the largest single exporter to Europe. Export volumes were dented in June with the loss of volumes from the Freeport LNG facility in Texas; this is expected to be restored by year-end. We are expecting exports to Europe to remain strong in the wake of the Russia-Ukraine war, especially as demand from Europe to replace Russian supplies stays strong. Base Metals: Bullish Chinese property stocks rallied on news that the government created a $44.4 billion fund to help alleviate the state’s property sector woes. Housing accounts for ~ 30% of copper consumption in China, and the fund should provide positive price action for the red metal in the face of slowing global growth this year and next. We remain bullish copper on the back of supply disruptions in Peru; increasing concern higher taxes in Chile will no longer support returns to miners that are sufficient to encourage capex, and extremely low global copper inventories, which have remained more than 25% below year-ago levels for more than a year (Chart 6). We will be updating our copper view next week. Ags/Softs: Neutral Russia and Ukraine signed a deal brokered by Turkey and the United Nations aimed at allowing some 22mm tons of grain exports from Ukraine, and some Russian grain and fertilizers to transit the Black Sea to end-use markets. These grain supplies are critically important to Middle East and North African markets. However, it could take weeks for Ukrainian ports to be cleared of mines and other obstacles – and, importantly, for a true cessation in Russian attacks on Black Sea port facilities – to resume operations.7 Chart 5
Energy Security Rolls Over EU's ESG Agenda
Energy Security Rolls Over EU's ESG Agenda
Chart 6
Global Copper Inventories Rebuilding But Still Down Y/Y
Global Copper Inventories Rebuilding But Still Down Y/Y
Footnotes 1 Please see EU allows get-out clause in Russian gas cut deal - BBC News, published by bbc.co.uk on July 27, 2022. 2 Please see the US Climate Prediction Center's most recent forecast, posted on July 14, 2022. 3 lease see Higher Gasoline, Diesel Prices Ahead, for discussion of the embargo on Russian crude and product imports to the EU. Our assessment was published on June 2, 2022, and is available at ces.bcaresearch.com. 4 As of July 25, EU natgas inventories were ~ 67% full at 2.5 TCF. 5 The IEA estimates growth in global LNG supply will slow over its five-year 2021-25 forecast horizon, due to low capex, and COVID-19-induced delays. Please see the IEA’s Gas Market Report, Q3-2022. 6 Please see Coal is not making a comeback: Europe plans limited increase, published by the European think tank Ember on July 13, 2022. 7 Please see Ukraine, Russia Sign Black Sea Grain Export Deal published by University Of Illinois, July 22, 2022. Investment Views and Themes Strategic Recommendations Trades Closed In 2022
The Global Investment Strategy service tactically downgraded equities in February but then upgraded them in May. The decision to upgrade equities to overweight in May was clearly premature, as stocks fell significantly in June. However, the rally in July has brought stocks back above the level where we upgraded them. Hence, we are using this opportunity to shift our recommended equity allocation back to neutral. While our base case forecast still foresees no recession in the US over the next 12 months, the risks to this view have increased. In Europe, we see a recession as more likely than not. China’s economy will remain under pressure due to Covid lockdowns, a shift in global spending away from manufactured goods, and a weakening property market. Even if the US avoids a recession, this could prove to be a bittersweet outcome for stocks: While earnings will hold up, the Fed is unlikely to cut rates next year, as markets are currently discounting. Real bond yields, which have already risen steeply this year, will rise further, weighing on equity valuations. Time to Take Some Chips Off the Table The consensus view among investors these days seems to be that the US is heading into a recession (or may already be in one), which will cause stocks to fall during the remainder of the year as earnings estimates are slashed. Looking out to 2023, most investors expect stocks to recover as the Fed begins to cut rates. I have the opposite view. While the risks to growth have increased, the US will probably avoid a recession over the next 12 months. This will allow stocks to rise modestly from current levels into year-end. However, as we enter 2023, it will become obvious that the Fed has no reason to cut rates. This could cause stocks to give up some of their gains, thus producing a fairly flat profile for equities over a 12-month horizon. In past reports, we have argued that the neutral rate of interest – the interest rate consistent with full employment and stable inflation – is higher than widely believed in the US. The nice thing about a high neutral rate is that it insulates the economy from tighter monetary policy: Even if the Fed raises rates to 3.8% next year, as the dots are currently forecasting, that will only put rates in the middle of our fair value range of 3.5%-to-4% for the US neutral rate. The downside of a high neutral rate is that eventually, investors will need to value stocks using a higher discount rate. The 10-year TIPS yield has already increased from -0.97% at the start of the year to +0.36% today. It will rise to 1%-to-1.5% by the middle of 2023. A higher-than-expected neutral rate also raises inflation risks because it could cause the Fed to inadvertently keep monetary policy too loose. Inflation is likely to fall significantly over the coming months as supply-chain bottlenecks ease. However, this decline in inflation could sow the seeds of its own demise: As inflation falls, real wage growth – which is now negative – will turn positive. Rising real wages will booster consumer confidence and spending. A reacceleration in inflation in the second half of next year could prompt the Fed to start hiking rates again in late 2023, thus producing a recession not in 2022 but in 2024. Outside the US, the outlook is more challenging. In Europe, a recession is more likely than not in the second half of the year. We expect the recession to be fairly short-lived, with European governments moving aggressively to mitigate the fallout from gas shortages through various income support schemes for the private sector. Chinese growth should rebound in the second half of the year. However, the specter of future lockdowns, the shift in global spending away from manufactured goods towards services, and the weakening property sector will continue to weigh on activity. We will have much more to say about this view change early next week. In the meantime, please review our report from last week entitled “The Downside Of A Soft Landing” for further color on some of the points made in this short bulletin. Tomorrow, my colleague Ritika Mankar will be sending you a Special Report making the case that the US economy’s ability to spawn mega-sized companies may become increasingly compromised over the next decade. Peter Berezin Chief Global Strategist peterb@bcaresearch.com Follow me on LinkedIn & Twitter.
BCA Research’s European Investment Strategy service concludes that BTPs have become attractive for long-term rather than short-term investors. The differences between the neutral rates across the Eurozone are the key factor limiting how far and how fast…
The German Ifo Business Climate Index fell to a 23-month low of 88.6 in July from 92.2, against expectations of a milder deterioration. The current assessment and expectations sub-indices both fell by 1.7 and 5.2 points, respectively. Moreover, the weakness…
Executive Summary The ECB finally exited negative interest rates last week. In exchange for higher rates, the doves received an ambitious anti-fragmentation tool, the TPI. The ECB deposit rate is likely to reach between 1% and 1.5% by the summer of 2023. The ECB’s number one problem remains the widely different neutral rates across the Eurozone’s largest economies. Our r-star estimates suggest that the German neutral rate is significantly above that of Spain, Italy, and even France. This divergence in r-star means that the TPI will be activated, but its presence alone is not enough to tame the peripheral bond markets when the ECB hikes rates. While the near-term remains fraught with risks, BTPs are increasingly attractive for long-term investors. The TPI also creates a bullish long-term backdrop for the euro. Many R-Star In The European Sky
ECB Policy: One Size Doesn’t Fit All
ECB Policy: One Size Doesn’t Fit All
Bottom Line: Diverging neutral rates across the Eurozone’s main economies will impair the ECB’s ability to normalize interest rates over the next twelve months without also activating the new anti-fragmentation tool, the TPI. BTPs have become attractive for long-term rather than short-term investors. Last week, the European Central Bank (ECB) increased interest rates by 50bps, the first hike in eleven years and the third time in its history that it has tightened policy by such a large increment. In exchange for this abrupt end to negative interest rates, the doves on the Governing Council (GC) extracted the creation of the Transmission Protection Instrument (TPI), a new facility designed to limit fragmentation risk on sovereign bond yields in the Eurozone. These two moves raise three key questions: Will the ECB continue to increase rates this aggressively in the coming months? Have peripheral spreads peaked? Will the threat of TPI buying be enough to put a ceiling on spreads, or will the ECB actually need to activate the program in the coming months? To answer these questions, we evaluate where r-star (the neutral real rate of interest) stands in the four largest Euro Area economies. While there is scope for the ECB to push policy rates higher, the wide differences in r-star across European nations indicate that the TPI will need to be activated to stabilize peripheral bond markets, most importantly, Italian government debt. This makes BTPs attractive for long-term investors, although near-term volatility will remain elevated as the markets test the ECB’s resolve. What Happened? Related Report European Investment StrategyLooking Beyond Europe’s Inflation Peak In terms of interest rates, the most important conclusion from last’s week policy meeting was that forward guidance has been abandoned. The ECB is now fully data dependent, and each policy meeting will be a live one. Another rate hike is certain for the September meeting, ranging from 25bps to potentially 75bps if the ECB wishes to further “front-load” tightening. The single guiding principle will be the outlook for inflation. Chart 1Incoming Inflation Peak
Incoming Inflation Peak
Incoming Inflation Peak
We do expect inflation to peak soon in the Eurozone, mostly because of the decline in the commodity impulse and slowing food inflation (Chart 1). Additionally, the one-month impulse of our Trimmed-Mean CPI is weakening. However, as of June, headline and core inflation stand at 8.6% and 3.7%, respectively. Inflation is unlikely to slow enough by the September meeting to prompt the ECB to forecast inflation falling below its 2% target by 2024. In this context, our base case remains that the GC will opt for a 50bps hike in September. Beyond September, we expect the ECB to revert to 25bps rate hikes and the policy rate to settle between 1% and 1.5% by the summer of 2023, which is broadly in line with the current pricing of the €STR curve (Chart 2). We are somewhat less hawkish than the market for the month of October, because we expect inflation to roll over this fall. Moreover, the European economy continues to decelerate, as highlighted by the declines in the ZEW growth expectations and the PMIs (Chart 3). This deceleration will allow the ECB to revise down its inflation outlook over time. Chart 2Appropriate Pricing
Appropriate Pricing
Appropriate Pricing
Chart 3Growth Is Slowing
Growth Is Slowing
Growth Is Slowing
The announcement of the TPI was the other crucial development from the last ECB meeting. The TPI was unanimously supported. In addition, its asset purchases will be unlimited, and the GC will have much discretion with respect to its implementation. These are three important features that give it ample credibility. However, the program has yet to be activated. Chart 4PEPP Reinvestment Doing Little
PEPP Reinvestment Doing Little
PEPP Reinvestment Doing Little
We do not share the optimism of the GC members who believe that the TPI’s existence alone will narrow peripheral spreads without the ECB having to purchase a single bond. The market will have to figure out what the GC deems as “unwarranted” and “disorderly” moves, especially in a context in which the Draghi government has collapsed and Italy’s commitment to reform will be challenged exactly as interest rates begin to rise. Moreover, the flexible re-investment of PEPP redemptions has not prevented BTP/Bund spreads from widening (Chart 4). As a result, we expect the market to test the ECB’s resolve over the coming weeks, which is likely to result in volatility and wider spreads until the TPI is activated. Bottom Line: Last week’s ECB meeting was a seminal moment. The ECB not only abandoned eight years of negative rates in one go, but it also implemented an ambitious program that aims to restrict peripheral spreads, albeit with some near-term volatility. European policy rates are set to rise to between 1% and 1.5% by the summer of 2023. In Search Of A Neutral Rate During Thursday’s press conference, President Christine Lagarde refused to respond to a question about the neutral rate of interest in Europe. We have sympathy for her predicament. The ECB’s biggest problem is that there is not one neutral interest rate for the entire euro area, but nineteen individual neutral rates for each Eurozone country, with wild differences among them.1 The differences between the neutral rates across the Eurozone are the key factor limiting how far and how fast the ECB may increase rates. It is also the main reason why the ECB resorts to an alphabet soup of non-interest rate policy measures (APP, PEPP, LTRO and, now, TPI) to maintain appropriate monetary conditions across the bloc. But exactly how wide are the differences between the neutral rates? To answer this question, we expand on the methodology developed by Holston, Laubach and Williams (HLW) from the San Francisco Fed to estimate the neutral real interest rate – or “r-star” - in Germany, France, Italy, and Spain. These are the four largest economies in the Euro Area, accounting for 70% of its GDP. Specifically, we run regressions between the real interest rates in those countries versus trend GDP growth and current account balances, which approximates the savings-investment balance. Mimicking the HLW methodology, the inflation expectations used to extract real interest rates from nominal short rates reflect an adaptative framework whereby inflation expectations are a function of the ten-year moving average core CPI. Our methodology produces estimates of r-star that range from 0% in Germany, to -0.8% in Italy, or a GDP-weighted average of -0.3% for the Eurozone (Table 1). When incorporating last week’s ECB rate hike, Europe’s real deposit rate falls to -1.2% if we use the smoothing procedure from HLW to compute inflation expectations, or -3.7% if we use current core CPI. In either case, policy remains accommodative for everyone. Table 1Many R-Star In The European Sky
ECB Policy: One Size Doesn’t Fit All
ECB Policy: One Size Doesn’t Fit All
We also ran a second set of estimates for r-star, which includes total nonfinancial debt-to-GDP. The logic reflects the notion that adverse debt dynamics was a key force behind the 2011/12 European sovereign debt crisis, which obligated the ECB to reverse course after pushing up the repo rate twice in 2011. Moreover, heavy debt loads not only constrain the ability of various countries to withstand higher rates, but they are also linked to misallocated capital and are therefore likely to depress trend GDP growth over time compared to countries with lighter debt loads. This adjustment changes the picture considerably. While Germany’s real neutral rate of interest remains around 0%, those of Italy and Spain plunge to -1.8% and -2.4%, respectively. France has also experienced a large decline in its r-star to -2.1% in response to the heavy debt load carried by its private and public sectors. Using this method, the GDP-weighted Euro Area r-star falls to -1.4% (Table 1). So which version of the model is more accurate? We believe the most realistic estimate for r-star in each of the four countries is the simple average of both the unadjusted and the debt-adjusted r-star. This implies that the inflation-adjusted neutral rate is close 0% in Germany, -1.2% in France, -1.2% in Spain and -1.3% in Italy (Table 1). Are those results consistent with reality? A country-by-country evaluation suggests that this ranking is correct. To arrive at this judgment, we evaluated each country based on the following four dimensions: Private sector debt accumulation since 2010. If policy is particularly easy for one country, the private sector will be incentivized to take on debt at a more rapid pace than if monetary conditions were tighter. House price appreciation since 2010. Housing is the part of the economy most sensitive to monetary conditions. Larger real estate price gains will materialize in economies where monetary policy is particularly loose. Profit growth since 2010. Easy monetary policy will subsidize corporate profitability, either through faster domestic activity or a cheaper exchange rate (or both). Unemployment rate. The unemployment rate is a crude measure of slack in the economy. An easier policy setting in one country will reduce the unemployment rate compared to a country where policy rates are high relative to r-star. Germany Chart 5Loosest Monetary Conditions In Germany
Loosest Monetary Conditions In Germany
Loosest Monetary Conditions In Germany
Germany exhibits all the evidence of monetary policy being much more accommodative for that country than the other four countries, for the following reasons: Since 2010, German private debt has been expanding much faster than the average of the four countries (Chart 5, top panel). Germany is experiencing the fastest house price appreciation (Chart 5, second panel). Germany’s profits have grown much faster (Chart 5, third panel). Germany’s unemployment rate stands at only 3%, compared to an average rate of 8% for the four nations together (Chart 5, bottom panel). France Chart 6French Monetary Conditions Are Tighter
French Monetary Conditions Are Tighter
French Monetary Conditions Are Tighter
France is a mixed bag. Monetary policy has been easy for France, but the French economy lags Germany on three of the four aforementioned dimensions: Since 2010, French private debt is growing at the fastest pace of the four economies studied, outpacing even that of Germany (Chart 6, top panel). While French house prices have grown slightly faster than the average of the four nations, they lagged German real estate prices (Chart 6, second panel). While French profits have also bested the average of the four nations, they nonetheless trail German profits (Chart 6, third panel). France’s unemployment rate is in line with the average of the four countries under observation (Chart 6, bottom panel). Spain For most of the period following 2010, Spain has suffered from the scars of the disastrous deleveraging that was required in the wake of the sovereign debt crisis. Its trend growth collapsed, and the ECB’s common policy was never as accommodative as it was for its northern neighbors. However, in recent years, the Spanish economy seems to be catching up, a result of the impact of previous structural reforms and the improved competitiveness brought about by collapsing real unit labor costs: Chart 7Spain Still Grapples With Problems
Spain Still Grapples With Problems
Spain Still Grapples With Problems
Since 2010, Spanish private debt has contracted by 20% compared to a 33% expansion for the European average (Chart 7, top panel). Spanish real estate prices have also lagged far behind those of the other countries put together (Chart 7, second panel). However, since 2015, Spanish house prices have begun to recover, and they are now moving at the same pace as the Euro Area average. Spanish profit growth remains weak compared to the average of the four countries studied in this report (Chart 7, third panel). The Spanish unemployment continues to tower at 13%, well above the average of the four largest Euro Area economies (Chart 7, bottom panel). Italy Italy has a similar profile to that of Spain. While its worst performance is solidly in the rear-view mirror, the recent period of easy monetary policy has allowed for some recovery. Nonetheless, Italy still lags far behind other Eurozone countries, which suggests that policy in Italy is not nearly as accommodative as in the rest of the Eurozone. Chart 8Italy Shows Little Improvements
Italy Shows Little Improvements
Italy Shows Little Improvements
Burdened by very large nonperforming loans, the Italian banking sector has been unable to provide adequate credit to the Italian private sector, which already had a limited appetite for debt. As a result, since 2010, Italian private credit has lagged far behind the European average (Chart 8, top panel). Italian real estate prices have not recovered meaningfully from their contraction between 2011 and 2019. Consequently, Italian housing prices lag substantially behind the average of the largest Euro Area countries (Chart 8, second panel). Italian profits remain weak (Chart 8, third panel). While not as elevated as the Spanish unemployment rate, at 8%, Italy’s rate is comparable to the four-country average (Chart 8, bottom panel). Generalizations These observations about individual countries confirm that Germany’s r-star is significantly higher than those of Spain and Italy. When compared to France, the German r-star is also higher, but the gap is much narrower than that between Germany and the two southern nations. The recent ECB Euro Area Bank Lending Survey confirms that France’s r-star is well below that of Germany. French lending standards are tightening as fast as those in Italy (Chart 9). In effect, France’s heavy private sector debt load is proving to be a burden as the ECB begins to tighten policy, which implies a lower French r-star. Chart 9Lending Standard Are Tightening Most In France And Italy
ECB Policy: One Size Doesn’t Fit All
ECB Policy: One Size Doesn’t Fit All
Bottom Line: Among the four largest economies in the Eurozone, a modeling exercise based on the HWL approach reveals that there is a large gap in neutral real interest rates, with Germany on one side around 0%, and Italy, Spain, and even France on the other side with r-star estimates ranging between -1.2% and -1.3%. A survey of current economic activity in these four nations confirms the results from the modeling exercise. Investment Implications The main consequence of the differing r-star across the Eurozone is that the ECB will need to remain an active player in the sovereign bond market. The German, Dutch, and Baltic economies are overheating, and policy needs to be tightened. This means that the ECB will continue to hike rates over the coming months. However, it cannot raise rates much more before they become problematic in Italy, Spain, and even France. Thus, the ECB will activate the TPI in the coming months in order to ease monetary conditions in those economies relative to the stronger group by limiting policy-induced increases in bond yields. In fact, using the r-star estimates adjusted for the debt-to-GDP ratios, the ECB would need to absorb roughly 30% of the Italian total debt to bring Italy’s r-star closer to Germany’s levels. This will not happen, which means that in the foreseeable future, Italy will not be able to withstand the levels of interest rate needed to cool down the German economy. Nonetheless, the TPI can help the ECB in fine-tuning monetary conditions across the Eurozone as it hikes policy rates. For now, Italian bonds are likely to remain volatile until the TPI is activated, especially considering the political situation in Italy, where the outlook for structural reform seems compromised by political uncertainty. This volatility will result in the activation of the TPI before year-end. Once the TPI is activated, BTP/Bund spreads are likely to move back toward 100bps, the level historically consistent with the ECB’s involvement in the sovereign debt market during the APP/PEPP era. The activation of the TPI will also be a positive development for the European corporate bond market, especially investment grade bonds. In last week’s post-conference press release, the ECB revealed that the TPI will also be able to buy private issuer securities. Thus, the ECB is likely to return as a potential buyer in this market. Moreover, investment grade bonds already price in a European recession and therefore offer a large value cushion with 12-month breakeven spreads trading in their 79th historical percentile (Chart 10). We especially like European investment grade corporate bonds relative to US ones on a USD-hedged basis. Relative valuations are in favor of Europe, and the ECB is not tightening policy as much as the Fed. Related Report European Investment StrategyTo Parity And Beyond The euro will ultimately benefit from the activation of the TPI. The narrowing of both sovereign and corporate spreads resulting from the program represents a very bullish development for EUR/USD (Chart 11), especially because the ECB will likely sterilize the bonds purchased under the program (i.e. the ECB’s balance sheet will not expand because of the TPI). The TPI will also allow the ECB to deliver higher interest rates, which further supports the euro. Nonetheless, we continue to see substantial (roughly 20%) odds of a break below parity in the near-term, especially if wider BTP-Bund spreads in the coming three months are the key catalyst behind the TPI’s activation. Chart 10Eurozone IG Debt Is Attractive
Eurozone IG Debt Is Attractive
Eurozone IG Debt Is Attractive
Chart 11The TPI Will Help The Euro, Eventually
The TPI Will Help The Euro, Eventually
The TPI Will Help The Euro, Eventually
Finally, last week’s policy development is unlikely to affect the absolute performance of European stocks. European equities remain mostly impacted by the fluctuations in global stock prices and the shifting probability of a recession in Europe this winter in response to the evolving energy crisis on the continent. European equities are inexpensive, and the probability of a recession is declining as a result of the resumption of natural gas flows from Russia. Crucially, the broadening trend toward coal utilization this winter and the growing list of deals that Europe is striking to secure non-Russian gas supplies suggest the impact of Russian cutoffs this winter could be more limited than once feared. Moreover, we expect European governments to hose their economies with stimulus if a crisis does emerge, which would both limit the depth of the crisis and prompt a rapid rebound in activity once winter ends. However, the inattention of the ECB to recession risks suggests that European equities could lag US equities in the near term. Bottom Line: The differences in r-star across Europe mean that the ECB will be forced to activate the TPI before year-end in order to hike interest rates further. Practically, this means that medium- to long-term investors should overweight Italian bonds at the current level of spreads. Short-term investors should remain on the sidelines; the political situation in Italy is still dangerous, and speculators are likely to test the ECB’s resolve. This also means that the euro is attractive as a long-term play, but it still carries large left-tail risk in the near term. While investors should favor European investment-grade bonds in USD-hedged terms relative to the US, European equities are likely to continue to suffer headwinds compared to US stocks. Mathieu Savary, Chief European Strategist Mathieu@bcaresearch.com Footnotes 1 In fact, it will soon be 20 r-star since Croatia will join the euro on January 1, 2023.
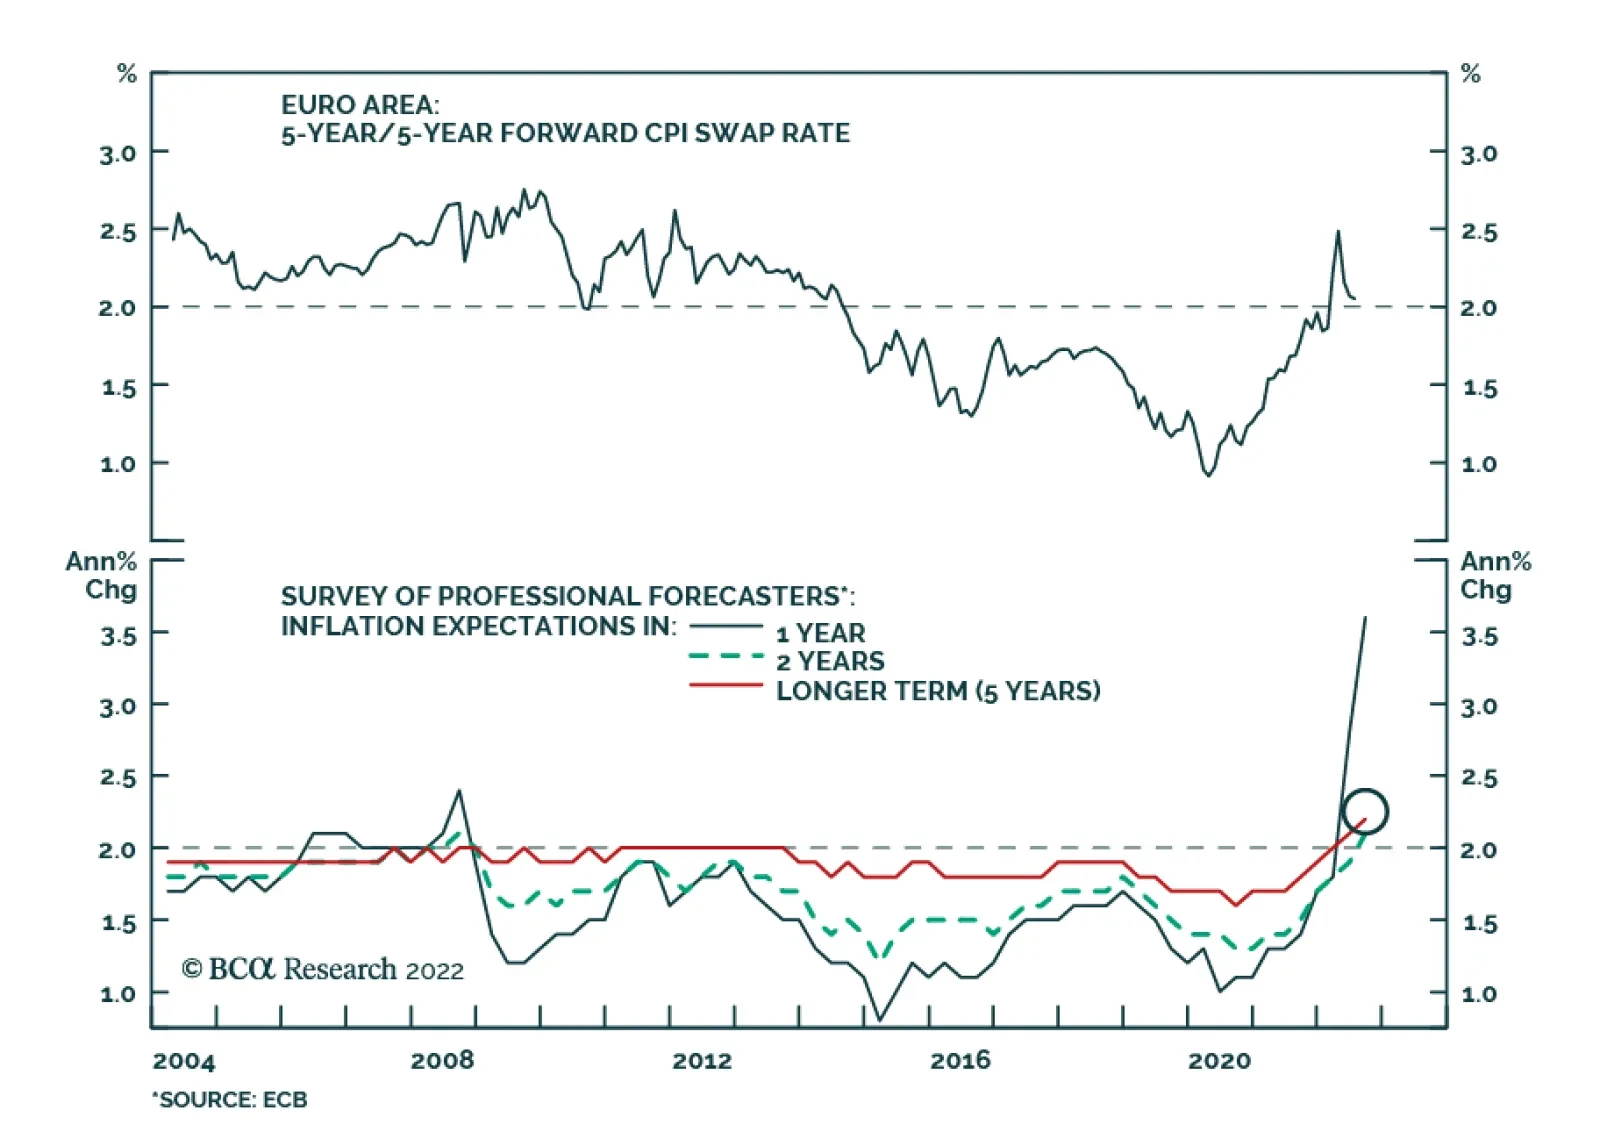
The ECB is in somewhat of a pickle. Prices are surging, which has prompted the central bank to start its rate hike cycle with a bang on Thursday – raising rates by an outsized 50bps. However, these price pressures ultimately reflect the ramifications of the…