Europe
The ECB is in somewhat of a pickle. Prices are surging, which has prompted the central bank to start its rate hike cycle with a bang on Thursday – raising rates by an outsized 50bps. However, these price pressures ultimately reflect the ramifications of the…

Listen to a short summary of this report. Executive Summary The odds of a recession in the US are lower than widely perceived. The probability of a recession is higher in Europe, although this week’s partial resumption of gas flows through the Nord Stream 1 pipeline, along with increased use of coal-fired power plants, should soften the blow. Chinese growth should rebound in the second half of the year. However, the specter of future lockdowns, the shift in global spending away from manufactured goods towards services, and the weakening property sector will continue to weigh on activity. With the Twentieth Party Congress slated for later this year, it is increasingly likely that the authorities will open up a firehose of stimulus. Fading recession risks will buoy stocks in the near term. However, a brighter economic outlook also means that the Fed, and several other central banks, may see little need to cut policy rates in 2023, as the markets are currently discounting. The end result is that government bond yields will rise from current levels, implying that stock valuations will not return to last year’s levels even if a recession is averted. After Rapidly Raising Rates, Markets Expect Some DM Central Banks To Start Easing Next Year
The Downside Of A Soft Landing
The Downside Of A Soft Landing
Bottom Line: We recommend a modest overweight on global equities for now but would turn neutral if the S&P 500 were to rise above 4,050. Dear Client, I am delighted to announce that Ritika Mankar, CFA, has joined the Global Investment Strategy team. Ritika will be writing occasional special reports on a variety of topical issues. Next week, she will make the case that the US economy’s ability to spawn mega-sized companies may become increasingly compromised over the next decade. Best regards, Peter Berezin, Chief Global Strategist The Case for a Soft Landing in the US Chart 1Cyclicals Underperformed Defensives As Recession Risks Intensified
Cyclicals Underperformed Defensives As Recession Risks Intensified
Cyclicals Underperformed Defensives As Recession Risks Intensified
Over the last few months, investors have become concerned that the Fed and many other central banks will need to engineer a recession in order to bring inflation down to more comfortable levels. While these fears have abated over the past trading week, they still continue to dominate market action (Chart 1). We place the odds of a US recession at about 40%. This is arguably more optimistic than the consensus view. According to Bank of America, the majority of fund managers saw recession as likely in this month’s survey. Not surprisingly, investors consider recession to be a major risk for equities over the next 12 months (Chart 2). Chart 2Many Investors Now See Recession As Baked In The Cake
The Downside Of A Soft Landing
The Downside Of A Soft Landing
Even if a recession does occur, we have contended that it will likely be a mild one, perhaps so mild that it will be difficult to distinguish it from a soft landing. A number of things make a soft landing in the US more probable than in the past: Labor supply has scope to increase. The labor participation rate is still 1.2 percentage points below its pre-pandemic level, two-thirds of which is due to decreased participation among workers under the age of 55 (Chart 3). The share of workers holding multiple jobs is also below its pre-pandemic level (Chart 4). The number of multiple job holders has been rising briskly lately. That is one reason why job growth in the payroll survey – which double counts workers if they hold more than one job – has been stronger than job growth in the household survey. Increased labor supply would obviate the need for the Fed to take drastic actions to curtail labor demand in its effort to restore balance to the labor market. Chart 3Labor Supply Has Scope To Rise
Labor Supply Has Scope To Rise
Labor Supply Has Scope To Rise
Chart 4The Number Of Multiple Job Holders Is Still Below Pre-Pandemic Levels
The Number Of Multiple Job Holders Is Still Below Pre-Pandemic Levels
The Number Of Multiple Job Holders Is Still Below Pre-Pandemic Levels
A high level of job openings creates a moat around the labor market. There are almost two times as many job openings as there are unemployed workers in the US (Chart 5). Many firms are likely to pull job openings before they cut jobs in response to a slowing economy. A high level of job openings will also allow workers who lose their jobs to find employment more quickly than usual, thus limiting the rise in so-called frictional unemployment. It is worth noting that the job openings rate has declined from a record 7.3% in March to a still-high 6.9% in May, with no change in the unemployment rate over this period. Chart 5A High Level Of Job Openings Creates A Moat Around The Labor Market
A High Level Of Job Openings Creates A Moat Around The Labor Market
A High Level Of Job Openings Creates A Moat Around The Labor Market
A steep Phillips curve implies that only a modest increase in unemployment may be necessary to knock down inflation towards the Fed’s target. Just as was the case in the 1960s, the Phillips curve has proven to be kinked near full employment (Chart 6). Unlike in the late 1960s, however, when rising realized inflation caused long-term inflation expectations to reset higher, expectations have remained well anchored this time around (Chart 7). Chart 6The Phillips Curve Is Kinked At Very Low Levels Of Unemployment
The Downside Of A Soft Landing
The Downside Of A Soft Landing
Chart 7Long-Term Inflation Expectations Are Well Anchored
Long-Term Inflation Expectations Are Well Anchored
Long-Term Inflation Expectations Are Well Anchored
The unwinding of pandemic and war-related dislocations should push down inflation. A recent study by the San Francisco Fed estimates that about half of May’s PCE inflation print was the result of supply-side disturbances (Chart 8). While the ongoing war in Ukraine and the threat of another Covid wave in China will continue to unsettle global supply chains, these problems should fade over time. Falling inflation would allow real wages to start rising again. This would bolster confidence, making a soft landing more likely (Chart 9). Chart 8Supply Factors Explain Half Of The Increase In Prices Over The Past Year
The Downside Of A Soft Landing
The Downside Of A Soft Landing
Chart 9Positive Real Wage Growth Will Bolster Consumer Confidence
Positive Real Wage Growth Will Bolster Consumer Confidence
Positive Real Wage Growth Will Bolster Consumer Confidence
A lack of major financial imbalances makes the US economy more resilient to economic shocks. As a share of disposable income, US household debt is 34 percentage points below its 2008 peak (Chart 10). Relative to net worth, household debt is at multi-decade lows. About two-thirds of mortgages carry a FICO score above 760 compared to only one-third during the housing bubble (Chart 11). Non-mortgage consumer credit also remains in good shape, as my colleague Doug Peta elaborated in this week’s US Investment Strategy report. While corporate debt has risen over the past decade, the ratio of corporate debt-to-assets today is still below where it was during the 1990s. Moreover, thanks to stronger corporate profitability, the interest coverage ratio is near an all-time high (Chart 12). Chart 10AUS Household Debt Is Not Especially High Anymore (I)
US Household Debt Is Not Especially High Anymore (I)
US Household Debt Is Not Especially High Anymore (I)
Chart 10BUS Household Debt Is Not Especially High Anymore (II)
US Household Debt Is Not Especially High Anymore (II)
US Household Debt Is Not Especially High Anymore (II)
Chart 11FICO Scores For Residential Mortgages Have Improved Considerably Since The Pre-GFC Housing Bubble
The Downside Of A Soft Landing
The Downside Of A Soft Landing
Chart 12Corporate Balance Sheets Are In Decent Shape
Corporate Balance Sheets Are In Decent Shape
Corporate Balance Sheets Are In Decent Shape
Chart 13Tight Supply Limits The Downside Risks To Housing
Tight Supply Limits The Downside Risks To Housing
Tight Supply Limits The Downside Risks To Housing
Just like the US does not suffer from major financial imbalances, it does not suffer from any major economic imbalances either. The homeowner vacancy rate is near a record low, which should put a floor under residential investment (Chart 13). Outside of investment in intellectual property, which is not especially sensitive to the business cycle, nonresidential investment is still below pre-pandemic levels and not much above where it was as a share of GDP during the Great Recession (Chart 14). Spending on consumer durable goods has retraced four-fifths of its pandemic surge, with little ill-effect on aggregate employment (Chart 15). Chart 14Outside Of IP, Nonresidential Investment Is Still Low
Outside Of IP, Nonresidential Investment Is Still Low
Outside Of IP, Nonresidential Investment Is Still Low
Chart 15Spending On Durable Goods Has Been Normalizing Without Derailing The Economy
Spending On Durable Goods Has Been Normalizing Without Derailing The Economy
Spending On Durable Goods Has Been Normalizing Without Derailing The Economy
Europe: A Deep Freeze Will Likely Be Avoided Chart 16Russia Can Potentially Cause Significant Economic Damage In The EU If It Closes The Taps
The Downside Of A Soft Landing
The Downside Of A Soft Landing
The macroeconomic picture is less benign outside the US. Four years ago, German diplomats laughed off warnings that their country had become dangerously dependent on Russian energy. They are not laughing anymore. German industry, just like industry across much of Europe, is facing a major energy crunch. The IMF estimates that output losses associated with a full Russian gas shutoff over the next 12 months could amount to as much as 2.7% of GDP in the EU (Chart 16). In Central and Eastern Europe, output could shrink by 6%. Among the major economies, Germany and Italy are the most at risk. Fortunately, Europe is finally stepping up to the challenge. The highly ambitious REPowerEU plan seeks to displace two-thirds of Russian gas by the end of 2022. The plan does not include any additional energy that could be generated by increased usage of coal-fired power plants, a strategy that the European political establishment (including the German Green Party!) has only recently begun to champion. It is possible that EU leaders felt the need to generate a crisis mentality to justify the decision to burn more coal. Dire warnings about how Europe is prepared to ration gas also send a message to Russia that the EU is ready to suffer in order to thwart Putin’s despotic regime. Whether Europe actually follows through is a different story. It is worth noting that the Nord Stream 1 pipeline resumed operations this week after Germany received, over Ukrainian objections, a repaired turbine from Canada. The resumption of partial flows through the pipeline, along with increased fiscal support for households and firms, reduces the risks of a “deep freeze” recession in Europe. The unveiling of the ECB’s new Transmission Protection Instrument (TPI) this week should also help anchor sovereign credit spreads across the euro area. While the exact conditions under which the TPI will be engaged have yet to be fleshed out, we expect the terms to be fairly liberal, reflecting not only the lessons learned from last decade’s euro debt crisis, but also to serve as a powerful bulwark against Putin’s efforts to destabilize the EU economy. China: Government’s Growth Target Looks Increasingly Unrealistic Stronger growth in China would help European exporters (Chart 17). Chinese real GDP grew by just 0.4% in the second quarter from a year earlier as the economy was battered by Covid lockdowns. Activity should pick up in the second half of the year, but at this point, the government’s 5.5% growth target looks completely unachievable. The specter of future lockdowns, the shift in global spending away from manufactured goods towards services, and the weakening Chinese property sector are all weighing on the economy (Chart 18). Chart 17European Exporters Would Welcome A Stronger Chinese Economy
European Exporters Would Welcome A Stronger Chinese Economy
European Exporters Would Welcome A Stronger Chinese Economy
The authorities will likely seek to stimulate the economy by allowing local governments to bring forward $220 billion in bond issuance that had been originally slated for 2023. The problem is that land sales – the main source of local government revenue – have collapsed. Worried about the ability of local governments to service their obligations, both retail investors and banks have shied away from buying local government debt. Chart 18A Slowing Property Market And Covid Lockdowns Have Been Weighing On The Chinese Economy
A Slowing Property Market And Covid Lockdowns Have Been Weighing On The Chinese Economy
A Slowing Property Market And Covid Lockdowns Have Been Weighing On The Chinese Economy
Meanwhile, the inability of property developers to secure adequate financing to complete construction projects has left a growing number of home buyers in the lurch. In most cases, these properties were purchased off-the-plan. Understandably, home buyers have balked at the prospect of having to make mortgage payments on properties that they do not possess. With the Twentieth Party Congress slated for later this year, it is increasingly likely that the authorities will open up a firehose of stimulus, including increased assistance for property developers and banks, as well as income-support measures for households. While such measures will not address China’s myriad structural problems, they will help keep the economy afloat. Equity Valuations in a Soft-Landing Scenario A few weeks ago, the consensus view was that stocks would tumble in the second half of the year as the global economy fell into recession but would then rally in 2023 as central banks began lowering rates. We argued the opposite, namely that stocks would likely rebound in the second half of the year as the economy outperformed expectations but would then face renewed pressure in 2023 as it became clear that the Fed and several other central banks had no reason to cut rates (Chart 19). Chart 19After Rapidly Raising Rates, Markets Expect Some DM Central Banks To Start Easing Next Year
The Downside Of A Soft Landing
The Downside Of A Soft Landing
Chart 20Real Rates Have Jumped This Year
Real Rates Have Jumped This Year
Real Rates Have Jumped This Year
In a baseline scenario where a recession is averted, we argued that the S&P 500 could rise to 4,500 (60% odds). In contrast, we noted that the S&P 500 could fall to 3,500 in a mild recession scenario (30% odds) and to 2,900 in a deep recession scenario (10% odds). It is worth stressing that even at 4,500, the S&P 500 would still be 11% lower in real terms than it was on January 4th. At the stock market’s peak in January, the 10-year TIPS yield stood at -0.91%, while the 30-year TIPS yield stood at -0.27%. Today, they stand at 0.58% and 0.93%, respectively (Chart 20). If real rates do not return to their prior lows, it is unlikely that equity valuations will return to their prior highs. This limits the upside for stocks, even in a soft-landing scenario. The sharp rally in stocks over the past week has priced out some of this recession risk, moving equity valuations closer towards what we regard as fair value. As we noted last week, we will turn neutral on equities if the S&P 500 were to rise above 4,050. As we go to press, we are only 1.3% from that level. Peter Berezin Chief Global Strategist peterb@bcaresearch.com Follow me on LinkedIn & Twitter Global Investment Strategy View Matrix
The Downside Of A Soft Landing
The Downside Of A Soft Landing
Special Trade Recommendations Current MacroQuant Model Scores
The Downside Of A Soft Landing
The Downside Of A Soft Landing
The ECB took a big step in normalizing monetary policy on Thursday. It hiked interest rates for the first time in 11 years, raising the deposit rate by 50bps to zero. The central bank noted that upside risks to inflation and support from its toolkit (PEPP as…
Executive Summary Upside Oil Price Risk Dominates
Upside Oil Price Risk Dominates
Upside Oil Price Risk Dominates
Despite global recession fears and uncertainty over Russia’s retaliation for the EU embargo against its exports, oil markets will continue to tighten. After breaching $15/bbl in June, the Dec22 vs Dec23 Brent backwardation – our preferred seasonal indicator for inventory tightness – is back above $10/bbl and rising. There is an increasing risk Russia will cut crude output, if G7 states impose a price cap on its oil sales. Our modeling indicates the loss of an additional 2mm b/d of Russian output vs our base case beginning in 4Q22 would lift prices above $220/bbl by 4Q23. On the downside, our modeling indicates the loss of 2mm b/d of demand vs our base case – i.e., essentially wiping out this year’s expected growth – would push average Brent prices toward $60/bbl next year. Our base case forecast for Brent crude oil is unchanged. We expect 2022 Brent to average $110/bbl, and for 2023 prices to average $117/bbl. WTI will trade $3-$4/bbl below Brent. Bottom Line: We expect markets to continue to tighten as the EU embargo of Russia oil progresses. A price cap on Russian oil sales could lead to a production cut that takes prices above $220/bbl by 4Q23. An economic collapse could push Brent toward $60/bbl. Risks remain skewed to the upside. Our base case Brent price forecast remains unchanged: $110/bbl on average this year and $117/bbl in 2023. Feature The global oil market is tightening even with China demand restrained by its zero-Covid-19 tolerance policy, and parts of Europe almost surely facing recession if Russian pipeline gas supplies are cut off or tighten significantly between now and the approach of winter. Upside price risk dominates, in our view. Our Brent price forecast remains unchanged, averaging $110/bbl this year and $117/bbl in 2023. Markets remain tight: Oil supply will remain below demand, which will force inventories to draw (Chart 1). Related Report Commodity & Energy StrategyRecession Unlikely To Batter Oil Prices This will push Brent into a steeper backwardation going into year-end, forcing the Dec22 v Dec23 Brent spread higher (Chart 2). High levels of backwardation – i.e., prompt-delivery futures trading above deferred-delivery futures – is how inventory tightness manifests itself: Refiners are willing to pay more for prompt delivery than deferred delivery, because they need oil now to meet demand. This is occurring despite weaker demand coming out of China and EU states, as the latter begins to ration energy supplies ahead of the coming winter. Chart 1Inventories Will Tighten
Inventories Will Tighten
Inventories Will Tighten
Chart 2Markets Will Backwardate Further
Markets Will Backwardate Further
Markets Will Backwardate Further
Russia Risk Is Increasing The supply-side risks that we outlined in last week's report — chiefly the risk Russia will unilaterally cut oil supply if a price cap is imposed by G7 states led by the US – remain in place. We expect the EU to follow through on its commitment to phase out all Russian oil and refined product imports in 2H22 and 1Q23. The EU formally agreed to cut 90% of its Russian oil imports by the end of this year. The EU’s goal is to be completely out of ~ 2.3mm b/d of seaborne crude oil imports and 800k b/d of pipeline imports this year. In 1Q23, the EU will be reducing its refined product imports (e.g., diesel fuel) from Russia as well. Russia will lose more than 4mm b/d of crude and product exports to the EU as a result of these embargoes. We continue to expect the cutoffs in EU exports will result in Russia being forced to shut in 1.6mm b/d of production this year and another 500k b/d next year. In our base case, we expect this to take Russian crude production down from more than 10.5mm b/d prior to its invasion of Ukraine to something close to 8.0mm b/d by the end of next year. Spare capacity remains tight. Almost all of OPEC 2.0’s spare capacity is in the Kingdom of Saudi Arabia (KSA) and the United Arab Emirates (UAE). These are the only two OPEC 2.0 states that are able to increase production and maintain it at higher levels for an indefinite period of time. Despite repeated pleas from the US, these states continue to indicate they do not see the need to sharply increase oil production, even after US President Joe Biden made a trip to the region last week to ask them in person to do so. With ~ 2-3mm b/d of spare capacity available – the exact level is not public knowledge – digging into spare capacity now would leave nothing in the tank, so to speak, to meet another supply shock (e.g., a unilateral cut-off of Russian supplies in response to a G7 price cap on oil sales). KSA, as a matter of policy, maintains a minimal level of spare capacity (1.0 – 1.5mm b/d) to handle unforeseen supply shocks. In addition, the OPEC 2.0 agreement to return production removed from the market during the COVID-19 pandemic agreed last July, and the US release of 1mm b/d of inventories out of its Strategic Petroleum Reserve (SPR) both expire in September.1 The US SPR has not indicated it will extend its release of inventory beyond September. Markets will tighten. The return of barrels from OPEC 2.0 is largely moot, since only KSA and the UAE – which we dub Core OPEC 2.0 – have been able to consistently raise output since the July 2021 agreement to return barrels to the market. The other OPEC 2.0 member states – the “Other Guys” – have consistently missed their production quotas this past year (Chart 3). Lastly, the odds of the US and Iran reaching a rapprochement continue to fade, almost to the point of vanishing. Iran reportedly will supply Russia with drones for its war in Ukraine. This indicates the Iranian government has all but capitulated on reviving its nuclear deal with the US, which would have brought an additional 1mm b/d back on the market.2 Outside of OPEC 2.0, we expect US production in the Lower 48 states ex-US Gulf will increase 0.8mm b/d this year, and 0.75mm b/d next year, given price levels and the shape of the WTI forward curve (Chart 4). This is mostly unchanged from previous production expectations. Chart 3Lower OPEC 2.0 Production ex-KSA, UAE
Tighter Oil Markets On The Way
Tighter Oil Markets On The Way
Chart 4Capital Discipline Drives US Shale Production Growth
Capital Discipline Drives US Shale Production Growth
Capital Discipline Drives US Shale Production Growth
We continue to expect US shale-oil producers will maintain capital discipline, and will continue to prioritize shareholder interests by returning capital to investors via share buybacks and strong dividend distributions. Besides, boosting output over the balance of this year is becoming increasingly difficult, given oil-services equipment shortages and lack of capital.3 In our base case, we continue to anticipate demand will rise by 2.0mm b/d this year and 1.8mm b/d next year. This is lower than our estimates at the start of the year by close to 3mm b/d. This is all down to the sharp GDP growth slowdown forecast by the World Bank last month, which pushed our oil-demand estimates lower.4 Oil demand continues to grow, albeit it slowly, which, against a backdrop of tightening supplies, means the risk to prices remains to the upside. In our base case, the supply-demand fundamentals are largely balanced (Chart 5). These fundamentals (Table 1) are driving our forecast for $110/bbl Brent this year and $117/bbl next year (Chart 6). Chart 5Markets Remain Finely Balanced
Markets Remain Finely Balanced
Markets Remain Finely Balanced
Chart 6Brent Backwardation Will Steepen
Brent Backwardation Will Steepen
Brent Backwardation Will Steepen
Table 1BCA Global Oil Supply - Demand Balances (MMb/d, Base Case Balances) To Dec23
Tighter Oil Markets On The Way
Tighter Oil Markets On The Way
Uncertain Evolutions: Between $60 And $220/bbl We have noted the heightened uncertainty surrounding our oil-price expectations, which makes forecasting more tentative than usual.5 This week, we consider larger supply and demand shocks via econometric simulations to at least define possible price paths consistent with our assumptions and modeling. To the upside, we estimate a 2mm b/d loss of output resulting from a cutoff of Russian crude oil production. Relative to the status quo ante – i.e., prior to Russia’s invasion of Ukraine in February – this would remove a total of ~ 4mm b/d of Russian production from the market (2mm in our base case plus an additional 2mm b/d). Our modeling indicates this could push prices above $220/bbl by 4Q23, depending on how the additional 2mm b/d production cut is implemented – i.e., suddenly or staged pro-rata (Chart 7).6 This high-price scenario would be difficult for markets to adjust to, given the short-term inelasticity of global oil demand. In its wake, we would expect demand destruction on a large scale. Chart 7Upside Oil Price Risk Dominates
Upside Oil Price Risk Dominates
Upside Oil Price Risk Dominates
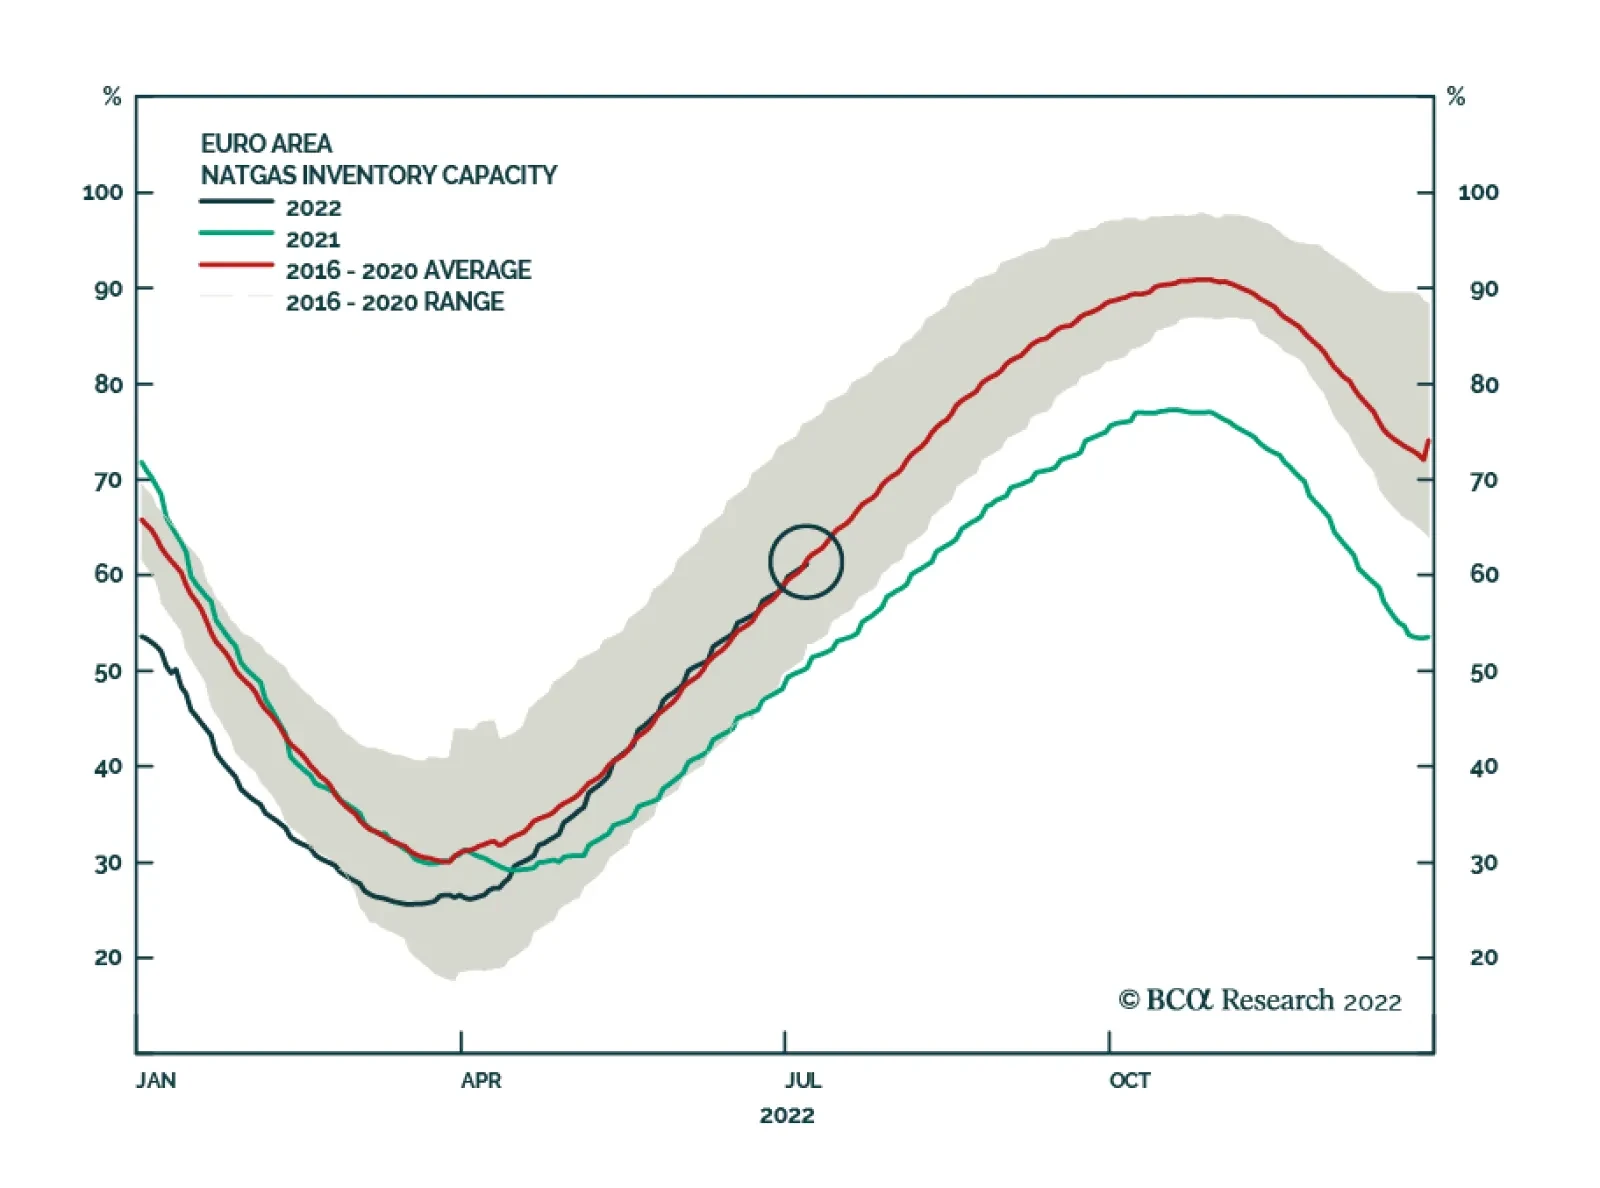
On the downside, we simulate a sharp contraction in oil consumption that removes an additional 2mm b/d of demand vs our base case – i.e., essentially wiping out this year’s expected growth. This would push average 2023 prices toward $60/bbl in our modeling. Losing this much demand would amount to a global economic collapse. A deep global recession cannot be ruled out, as markets have been reminding us over the past couple of weeks. However, the downside risks are not as pronounced as the upside risks in our estimation. There has not been an excessive accumulation of inventory in the OECD, as Chart 1 indicates. In the non-OECD economies, inventory accumulation in China appears to be intentional and policy driven. In addition, the supply response to sharply lower prices would be met by sharply lower production by KSA and the UAE, along with the US shale-oil producers over the course of a couple of months. This would arrest the down leg a demand shock produced in previous oil-price collapses when production was not as flexible, and inventories adjusted with longer lags. Economic growth in the EU could slow in some but not all of the member states, according to recent IMF estimates.7 The US may slow, and is at risk to a hard landing due to poorly calibrated Fed tightening. This could usher in a deep recession. However, the US also might even benefit from the EU going into recession, since it is not as resource constrained as the EU. Lastly, the EU’s been getting ready for this Russian energy cut-off and has lined up alternative energy sources (LNG and coal mostly). In addition, states already have begun asking their citizens to conserve energy, particularly natural gas. This forced conservation can achieve significant energy savings and is not new to the world: It was demonstrated by Japan after the Fukushima disaster in 2011 and the US in the late 1970s. Investment Implications Our base case oil-price forecast remains $110/bbl and $117/bbl on average for this year and next. Simulations of uncertain prices evolutions – i.e., evolutions we cannot attach a probability to at present – indicate upside price risk is dominant. This inclines us to remain long oil equities via the XOP ETF. We were tactically long 4Q22 and 1Q23 TTF futures until stop losses on both trades were elected on July 15th, generating returns of 89.6% and 83.1% respectively. Robert P. Ryan Chief Commodity & Energy Strategist rryan@bcaresearch.com Ashwin Shyam Research Analyst Commodity & Energy Strategy ashwin.shyam@bcaresearch.com Paula Struk Research Associate Commodity & Energy Strategy paula.struk@bcaresearch.com Commodities Round-Up Energy: Bullish Markets will await the conclusion of maintenance on the Nord Stream 1 (NS1) pipeline scheduled for this week. We continue to expect a cut-off of Russian natgas shipments to Europe, in addition to the 60% of volumes that already have been cut. In its latest GDP forecasts, the IMF expects EU GDP growth of 2.9% and 2.5% in 2022 and 2023, respectively. In and of itself, this would support our expectation for oil prices averaging $110/bbl and $117/bbl this year and next, as it is in line with the GDP forecast expected by the World Bank, which drives our forecasts. However, EU GDP still could contract in response to a complete shut-off of Russian gas imports in 2H22, particularly if it is sudden and prompts the EU to go to Phase 3 of its energy emergency plan and invoke gas rationing. EU gas inventories continue to build going into winter (Chart 8). Markets are critically dialed in to how the inventory builds ahead of winter proceed following NS1 maintenance: If it is delayed for technical reasons the storage fill rate will slow. Base Metals: Bullish China formally created a state-backed company to oversee all of its iron ore imports and overseas ore assets on Tuesday. The purpose of this company is to wrest pricing power away from iron ore suppliers – most of which are based in Australia – and reduce its reliance on Australian iron ore imports. A single buying entity will effectively create a monopsony, since China imports ~70% of global iron ore to supply its steel making industry, the largest in the world. Precious Metals: Bullish We have tactically downgraded our gold view on the back of continued USD strength. Reports of civil unrest in China – which was forecast by BCA’s Geopolitical Strategy - arising from the unfolding mortgage crisis likely will boost demand for gold, but it will boost demand for USD even more, in our view (Chart 9). We are closely monitoring this situation, along with possible increases in systemic financial risk in Chinese banks, which also would support USD demand. We remain strategically bullish gold. Chart 8
Tighter Oil Markets On The Way
Tighter Oil Markets On The Way
Chart 9
Nominal Broad US Dollar Index Going Up
Nominal Broad US Dollar Index Going Up
Footnotes 1 Please see OPEC+ agrees oil supply boost after UAE, Saudi reach compromise and U.S. to sell up to 45 mln bbls oil from reserve as part of historic release published by reuters.com on July 19, 2021 and June 14, 2022, respectively. OPEC 2.0 is our moniker for the producer coalition led by KSA and Russia; it also is referred to as OPEC+ in the media. 2 This could presage an unravelling of the status quo in the Middle East, as our colleagues at BCA Research’s Geopolitical Strategy highlight in their most recent report Questions From The Road published on July 15, 2022. 3 Please see Fracking Growth ‘Almost Impossible’ This Year, Halliburton Says, published by bloomberg.com on July 19, 2022. 4 Please see Recession Unlikely To Batter Oil Prices, which we published on June 16, 2022. It is available at ces.bcaresearch.com. 5 Running simulations is a good way to identify risks and at least have an intuition for where prices might go given difference evolutions of fundamentals. Please see Russia Pulls Oil, Gas Supply Strings for discussions and simulations of prices in response to different supply and shocks we ran last week. 6 The timing and depth of the shocks we simulate here are not assigned a probability to express our view of their likelihood. This reflects our belief that these are highly uncertain outcomes. That said, having an intuition for what to expect should the markets evolve in such a way as to create a probability one of these outcomes has become likely is useful. 7 The smaller EU economies are most at risk to sharp economic downturns from a cutoff in Russian gas exports, according to the IMF. The Fund estimates that in “Hungary, the Slovak Republic and the Czech Republic—there is a risk of shortages of as much as 40 percent of gas consumption and of gross domestic product shrinking by up to 6 percent.” Please see How a Russian Natural Gas Cutoff Could Weigh on Europe’s Economies published by the IMF on July 19, 2022. Investment Views and Themes Recommendations We were stopped out of our Long 4Q22 TTF Futures trade on July 15, with a return of 89.6%. We were stopped out of our Long 1Q23 TTF Futures trade on July 15, with a return of 83.1%. Strategic Recommendations Trades Closed in 2022
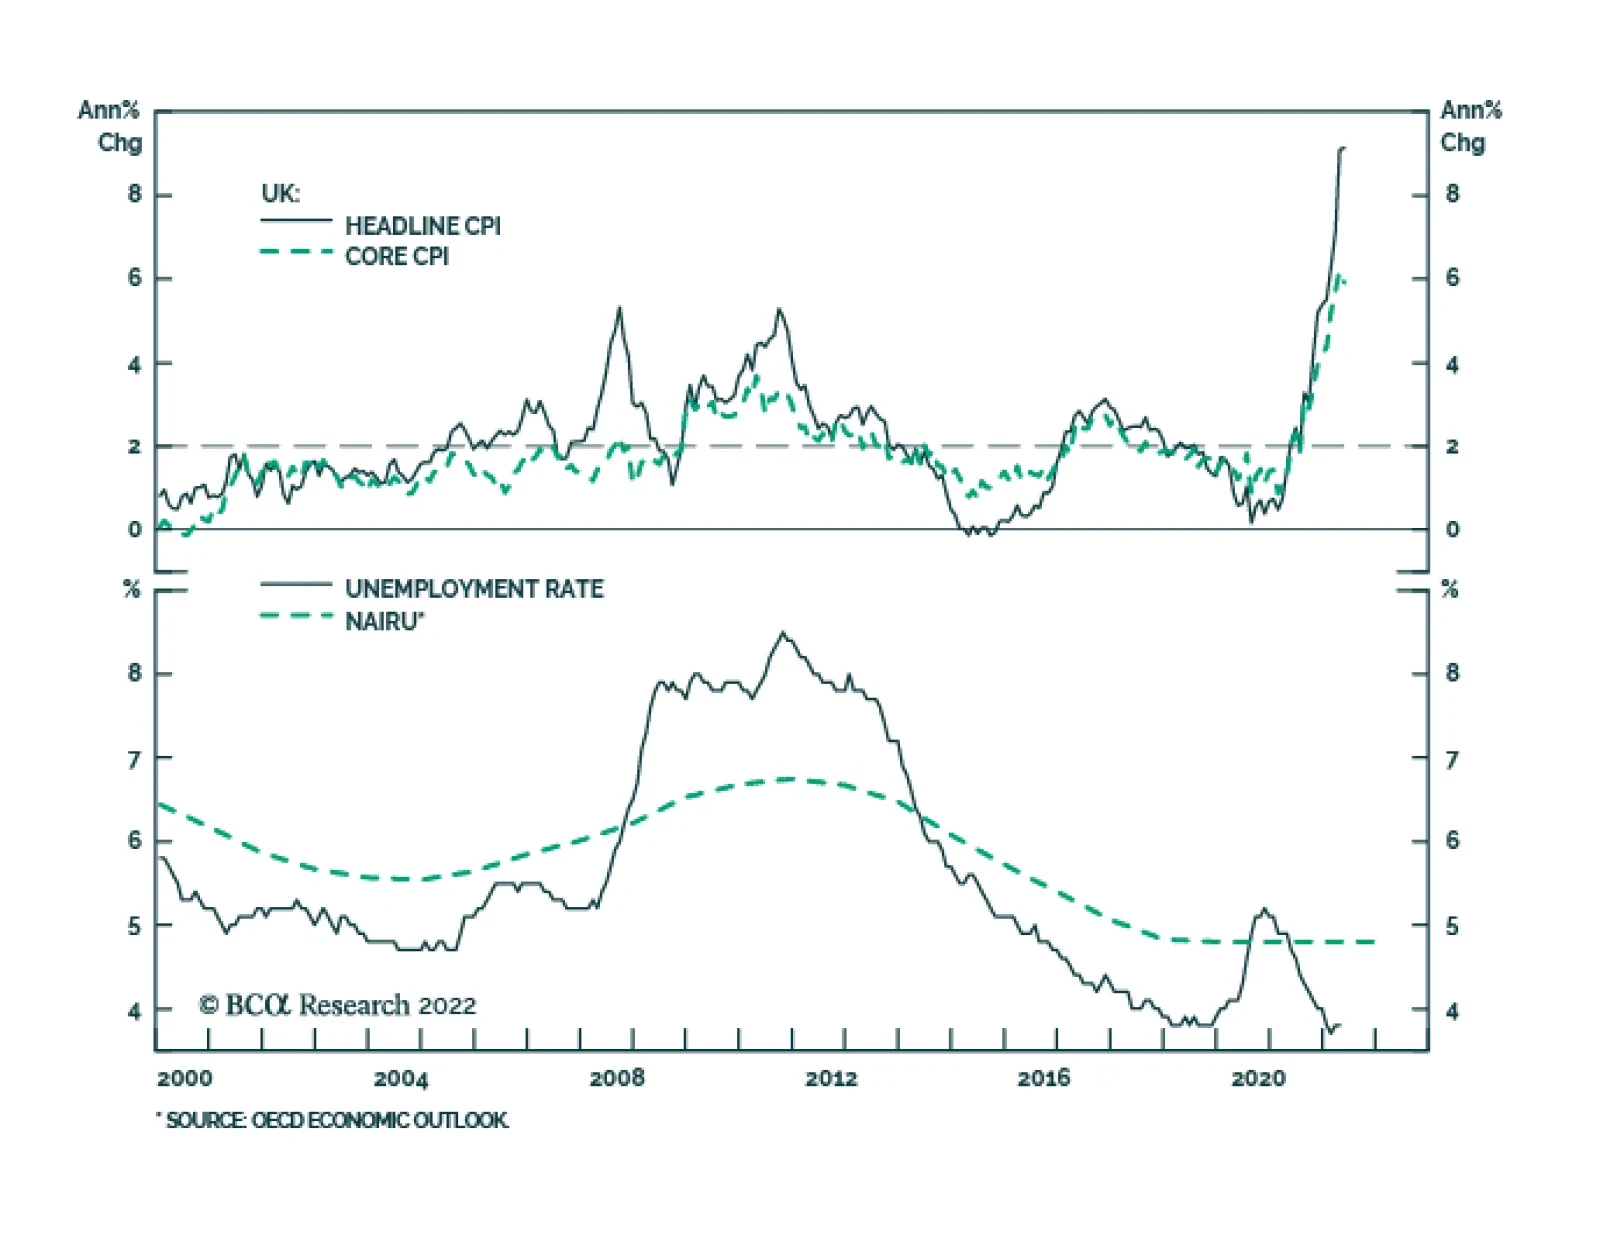
UK headline CPI inflation reached a fresh four-decade high of 9.4% y/y in June, following 9.1% in May and slightly above the anticipated 9.3%. Gasoline and food continue to be the largest drivers of headline CPI. However, the core inflation measure which…
Flows through the Nord Stream 1 pipeline which transports Russian natural gas to Germany have been halted since July 11 for scheduled maintenance. Although Thursday marks the end of this annual maintenance period, there is still uncertainty about the…
The energy crisis remains a headwind to the eurozone economy, raising the possibility that Europe will need to ration electricity this winter. Indeed, the European Commission’s measure of consumer confidence slumped this year and is now broadly in line with…
Listen to a short summary of this report. Executive Summary The TIPS Market Foresees A Sharp Deceleration In Inflation
What If The TIPS Are Right?
What If The TIPS Are Right?
TIPS breakevens are pointing to a rapid decline in US inflation over the next two years. If the TIPS are right, the Fed will not need to raise rates faster than what is already discounted over the next six months. Falling inflation will allow real wages to start rising again. This will bolster consumer confidence, making a recession less likely. The surprising increase in analyst EPS estimates this year partly reflects the contribution of increased energy profits and the fact that earnings are expressed in nominal terms while economic growth is usually expressed in real terms. Nevertheless, even a mild recession would probably knock down operating earnings by 15%-to-20%. While a recession in the US is not our base case, it is for Europe. A European recession is likely to be short-lived with the initial shock from lower Russian gas flows counterbalanced by income-support measures and ramped-up spending on energy infrastructure and defense. We are setting a limit order to buy EUR/USD at 0.981. Bottom Line: Stocks lack an immediate macro driver to move higher, but that driver should come in the form of lower inflation prints starting as early as next month. Investors should maintain a modest overweight to global equities. That said, barring any material developments, we would turn neutral on stocks if the S&P 500 were to rise above 4,050. US CPI Surprises to the Upside… Again Investors hoping for some relief on the inflation front were disappointed once again this week. The US headline CPI rose 1.32% month-over-month in June, above the consensus of 1.1%. Core inflation increased to 0.71%, surpassing consensus estimates of 0.5%. The key question is how much of June’s report is “water under the bridge” and how much is a harbinger of things to come. Since the CPI data for June was collected, oil prices have dropped to below $100/bbl. Nationwide gasoline prices have fallen for four straight weeks, with the futures market pointing to further declines in the months ahead. Agriculture and metals prices have swooned. Used car prices are heading south. Wage growth has slowed to about 4% from around 6.5% in the second half of last year. The rate of change in the Zillow rent index has rolled over, albeit from high levels (Chart 1). The Zumper National Rent index is sending a similar message as the Zillow data. All this suggests that inflation may be peaking. The TIPS market certainly agrees. It is discounting a rapid decline in US inflation over the next few years. This week’s inflation report did little to change that fact (Chart 2). Chart 1Some Signs That Inflation Has Peaked
Some Signs That Inflation Has Peaked
Some Signs That Inflation Has Peaked
Chart 2Investors Expect Inflation To Fall Rapidly Over The Next Few Years
What If The TIPS Are Right?
What If The TIPS Are Right?
TIPS Still Siding with Team Transitory If the TIPS market is right, this would have two important implications. First, the Fed would not need to raise rates more quickly over the next six months than the OIS curve is currently discounting (although it probably would not need to cut rates in 2023 either, given our higher-than-consensus view of where the US neutral rate lies) (Chart 3). The second implication is that real wages, which have declined over the past year, will start rising again as inflation heads lower. Falling real wages have sapped consumer confidence. As real wage growth turns positive, confidence will improve, helping to bolster consumer spending (Chart 4). To the extent that consumption accounts for nearly 70% of the US economy – and other components of GDP such as investment generally take their cues from consumer spending – this would significantly raise the odds of a soft landing. Chart 3The Fed Is Signaling That It Will Raise Rates To Almost 4% In 2023
The Fed Is Signaling That It Will Raise Rates To Almost 4% In 2023
The Fed Is Signaling That It Will Raise Rates To Almost 4% In 2023
Chart 4Positive Real Wage Growth Will Provide A Boost To Consumer Confidence
Positive Real Wage Growth Will Provide A Boost To Consumer Confidence
Positive Real Wage Growth Will Provide A Boost To Consumer Confidence
Chart 5Long-Term Inflation Expectations Remain Well Anchored
Long-Term Inflation Expectations Remain Well Anchored
Long-Term Inflation Expectations Remain Well Anchored
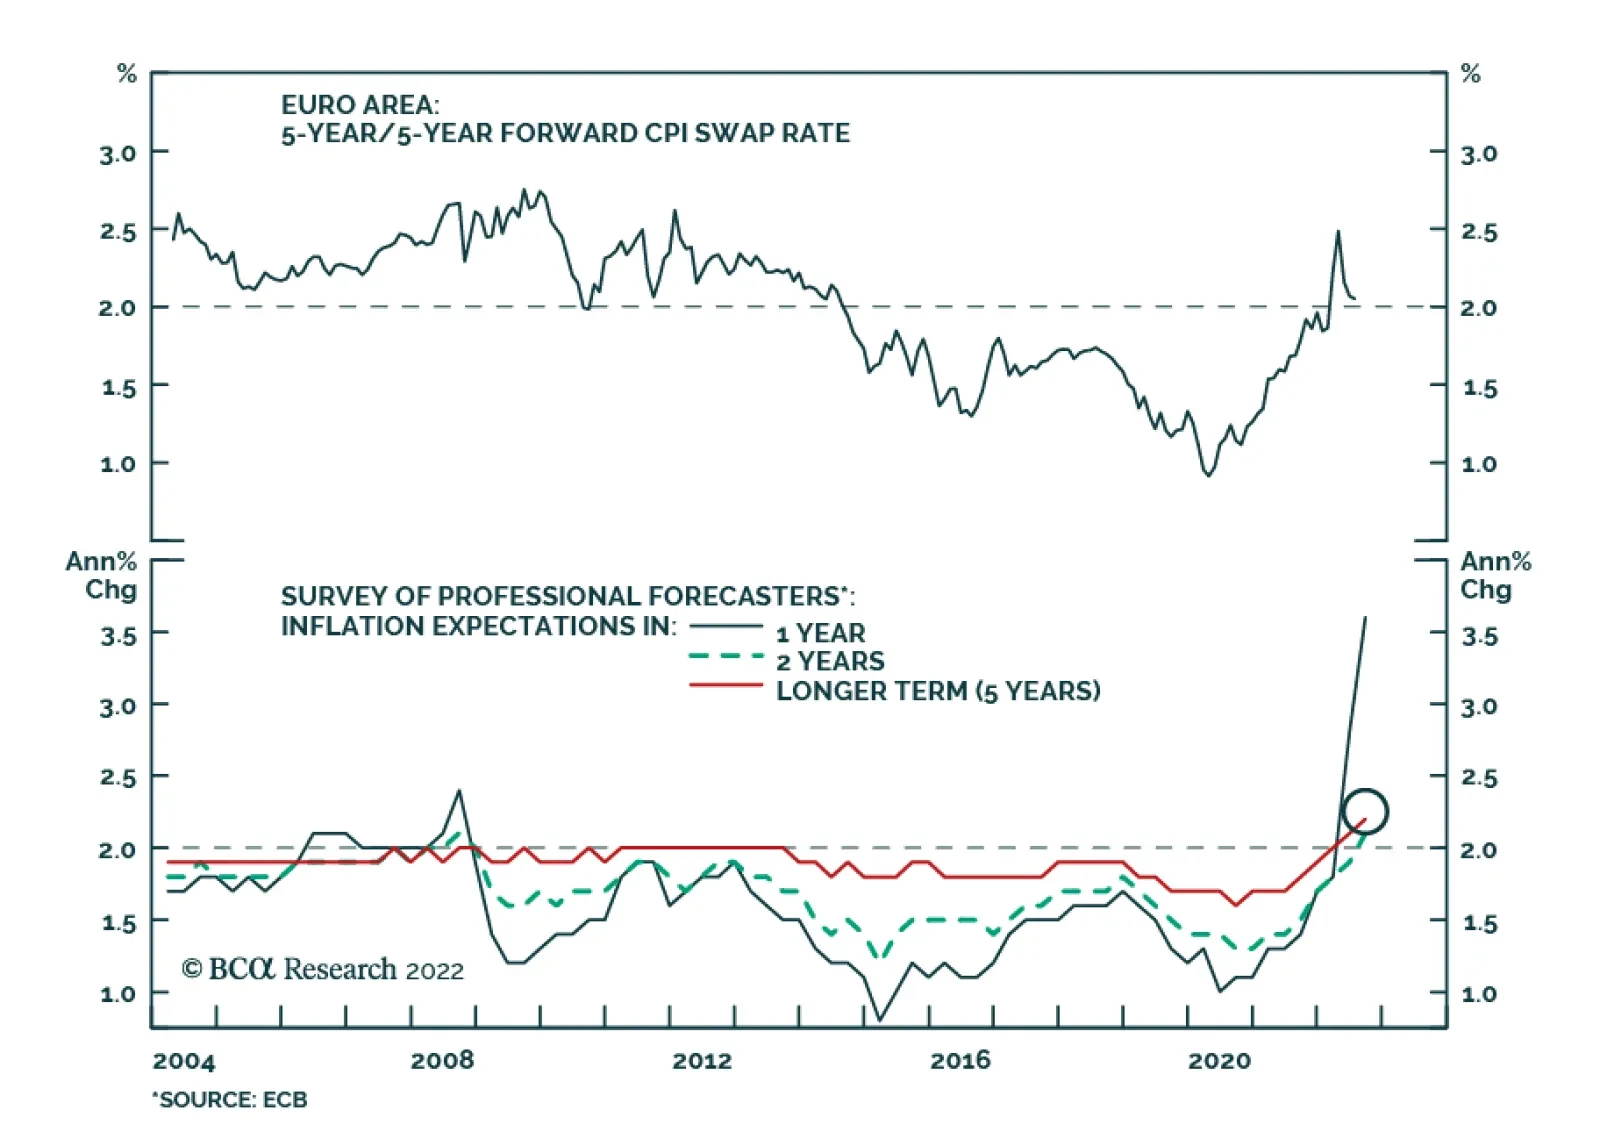
Of course, the TIPS market could be wrong. Bond traders do not set prices and wages. Businesses and workers, interacting with each other, ultimately determine the direction of inflation. Yet, the view of the TIPS market is broadly in sync with the view of most households and businesses. Expected inflation 5-to-10 years out in the University of Michigan survey has risen since the pandemic began, but at about 3%, it is close to where it was for most of the period between 1995 and 2015 (Chart 5). As we pointed out in our recently published Third Quarter Strategy Outlook, and as I discussed in last week’s webcast, the fact that long-term inflation expectations are well anchored implies that the sacrifice ratio – the amount of output that must be forgone to bring down inflation by a given amount — may be quite low. This also raises the odds of a soft landing. Investors Now See Recession as the Base Case Our relatively sanguine view of the US economy leaves us in the minority camp. According to recent polling, more than 70% of US adults expect the economy to be in recession by year-end. Within the investment community, nearly half of retail traders and three-quarters of high-level asset allocators expect a recession within the next 12 months (Chart 6). Chart 6Many Investors Now See Recession As Baked In The Cake
What If The TIPS Are Right?
What If The TIPS Are Right?
Reflecting the downbeat mood among investors, bears exceeded bulls by 20 points in the most recent weekly poll by the American Association of Individual Investors (Chart 7). A record low percentage of respondents in the New York Fed’s Survey of Consumer Expectations believes stocks will rise over the next year (Chart 8). Chart 7Bears Exceed The Bulls By A Wide Margin
Bears Exceed The Bulls By A Wide Margin
Bears Exceed The Bulls By A Wide Margin
Chart 8Households Are Pessimistic On Stocks
Households Are Pessimistic On Stocks
Households Are Pessimistic On Stocks
Resilient Earnings Estimates Admittedly, while sentiment on the economy and the stock market has soured, analyst earnings estimates have yet to decline significantly. In fact, in both the US and the euro area, EPS estimates for 2022 and 2023 are higher today than they were at the start of the year (Chart 9). What’s going on? Part of the explanation reflects the sectoral composition of earnings. In the US, earnings estimates for 2022 are up 2.4% so far this year. Outside of the energy sector, however, 2022 earnings estimates are down 2.2% year-to-date and down 2.9% from their peak in February (Chart 10). Chart 9US And European EPS Estimates Are Up Year-To-Date
US And European EPS Estimates Are Up Year-To-Date
US And European EPS Estimates Are Up Year-To-Date
Another explanation centers on the fact that earnings estimates are expressed in nominal terms while GDP growth is usually expressed in real terms. When inflation is elevated, the difference between real and nominal variables can be important. For example, while US real GDP contracted by 1.6% in Q1, nominal GDP rose by 6.6%. Gross Domestic Income (GDI), which conceptually should equal GDP but can differ due to measurement issues, rose by 1.8% in real terms and by a whopping 10.2% in nominal terms in Q1. Chart 10Soaring Energy Prices Have Boosted Earnings Estimates
Soaring Energy Prices Have Boosted Earnings Estimates
Soaring Energy Prices Have Boosted Earnings Estimates
How Much Bad News Has Been Discounted? Historically, stocks have peaked at approximately the same time as forward earnings estimates have reached their apex. This time around, stocks have swooned well in advance of any cut to earnings estimates (Chart 11). At the time of writing, the S&P 500 was down 25% in real terms from its peak on January 3. Chart 11Unlike In Past Cycles, Stocks Peaked Well Before Earnings
What If The TIPS Are Right?
What If The TIPS Are Right?
This suggests that investors have already discounted some earnings cuts, even if analysts have yet to pencil them in. Consistent with this observation, two-thirds of investors in a recent Bloomberg poll agreed that analysts were “behind the curve” in responding to the deteriorating macro backdrop (Chart 12). Chart 12Most Investors Expect Analyst Earnings Estimates To Come Down
What If The TIPS Are Right?
What If The TIPS Are Right?
Nevertheless, it is likely that stocks would fall further if the economy were to enter a recession. Even in mild recessions, operating profits have fallen by about 15%-to-20% (Chart 13). That is probably a more severe outcome than the market is currently discounting. Chart 13Even A Mild Recession Could Significantly Knock Down Earnings Estimates
Even A Mild Recession Could Significantly Knock Down Earnings Estimates
Even A Mild Recession Could Significantly Knock Down Earnings Estimates
Subjectively, we would expect the S&P 500 to drop to 3,500 over the next 12 months in a mild recession scenario where growth falls into negative territory for a few quarters (30% odds) and to 2,900 in a deep recession scenario where the unemployment rate rises by more than four percentage points from current levels (10% odds). On the flipside, we would expect the S&P 500 to rebound to 4,500 in a scenario where a recession is completely averted (60% odds). A probability-weighted average of these three scenarios produces an expected total return of 8.3% (Table 1). This is enough to warrant a modest overweight to stocks, but just barely. Barring any material developments, we would turn neutral on stocks if the S&P 500 were to rise above 4,050. Table 1A Scenario Analysis For The S&P 500
What If The TIPS Are Right?
What If The TIPS Are Right?
What’s the Right Framework for Thinking About a European Recession? Whereas we would assign 40% odds to a recession in the US over the next 12 months, we would put the odds of a recession in Europe at around 60%. With a recession in Europe looking increasingly probable, a key question is what the nature of this recession would be. The pandemic may provide a useful framework for answering that question. Just as the pandemic represented an external shock to the global economy, the disruption to energy supplies, stemming from Russia’s invasion of Ukraine, represents an external shock to the European economy. In the initial phase of the pandemic, economic activity in developed economies collapsed as millions of workers were forced to isolate at home. Over the following months, however, the proliferation of work-from-home practices, the easing of lockdown measures, and ample fiscal support permitted growth to recover. Eventually, vaccines became available, which allowed for a further shift to normal life. Just as it took about two years for vaccines to become widely deployed, it will take time for Europe to wean itself off its dependence on Russian natural gas. Earlier this year, the IEA reckoned that the EU could displace more than a third of Russian gas imports within a year. The more ambitious REPowerEU plan foresees two-thirds of Russian gas being displaced by the end of 2022. In the meantime, some Russian gas will be necessary. Canada’s decision over Ukrainian objections to return a repaired turbine to Germany for use in the Nord Stream 1 gas pipeline suggests that a full cutoff of Russian gas flows is unlikely. Chart 14The Euro Is 26% Undervalued Against The Dollar Based On PPP
The Euro Is 26% Undervalued Against The Dollar Based On PPP
The Euro Is 26% Undervalued Against The Dollar Based On PPP
During the pandemic, governments wasted little time in passing legislation to ease the burden on households and businesses. The European energy crunch will elicit a similar response. Back when I worked at the IMF, a common mantra in designing lending programs was that one should “finance temporary shocks but adjust to permanent ones.” The current situation Europe is a textbook example for the merits of providing income support to the private sector, financed by temporarily larger public deficits. The ECB’s soon-to-be-launched “anti-fragmentation” program will allow the central bank to buy the government debt of Italy and other at-risk sovereign borrowers without the need for a formal European Stability Mechanism (ESM) program, provided that the long-term debt profile of the borrowers remains sustainable. Get Ready to Buy the Euro All this suggests that Europe could see a fairly brisk rebound after the energy crunch abates. If the euro area recovers quickly, the euro – which is now about as undervalued against the dollar as anytime in its history (Chart 14) – will soar. With that in mind, we are setting a limit order to buy EUR/USD at 0.981. Peter Berezin Chief Global Strategist peterb@bcaresearch.com Follow me on LinkedIn & Twitter Global Investment Strategy View Matrix
What If The TIPS Are Right?
What If The TIPS Are Right?
Special Trade Recommendations Current MacroQuant Model Scores
What If The TIPS Are Right?
What If The TIPS Are Right?
Executive Summary China's Unemployment
Questions From The Road
Questions From The Road
Over the past week we have been visiting clients along the US west coast. In this report we hit some of the highlights from the most important and frequently asked questions. Xi Jinping is seizing absolute power just as the country’s decades-long property boom turns to bust. He will stimulate the economy but Chinese stimulus is less effective than it used to be. The US and Israel are underscoring their red line against Iranian nuclear weaponization. If Iran does not freeze its nuclear program, the Middle East will begin to unravel again. The UK’s domestic instability is returning, with Scotland threatening to leave the union. Brexit, the pandemic, and inflation make a Scottish referendum a more serious risk than in the past. Shinzo Abe’s assassination makes him a martyr for a vision of Japan as a “normal country” – i.e. one that is not pacifist but capable of defending itself. Japan’s rearmament, like Germany’s, points to the decline of the WWII peace settlement and the return of great power competition. Bottom Line: Investors need a new global balance to be achieved through US diplomacy with Russia, China, and Iran. That is not forthcoming, as the chief nations face instability at home and a stagflationary global economy. Feature The world is becoming less stable as stagflation combines with great power competition. Global uncertainty is through the roof. From a macroeconomic perspective, investors need to know whether central banks can whip inflation without triggering a recession. From a geopolitical perspective, investors need to know whether Russia’s conflict with the West will expand, whether US-China and US-Iran tensions will escalate in a damaging way, and whether domestic political rotations in the US and China this fall will lead to more stable and productive economies. China: What Will Happen At The Communist Party Reshuffle? General Secretary Xi Jinping will cement another five-to-10 years in power while promoting members of his faction into key positions on the Politburo and Politburo Standing Committee. By December Xi will roll out a pro-growth strategy for 2023 and the government will signal that it will start relaxing Covid-19 restrictions. But China’s structural problems ensure that this good news for global growth will only have a fleeting effect. China’s governance is shifting from single-party rule to single-person rule. It is also shifting from commercially focused decentralization to national security focused centralization. Xi has concentrated power in himself, in the party, and in Beijing at the expense of political opponents, the private economy, and outlying regions like Hong Kong, the South China Sea, and Xinjiang. The subordination of Taiwan is the next major project, ensuring that China will ally with Russia and that the US and China cannot repair or deepen their economic partnership. Related Report Geopolitical StrategyWill China Let 100 Flowers Bloom? Only Briefly. Xi and the Communist Party began centralizing political power and economic control shortly after the Great Recession. At that time it became clear that a painful transition away from export manufacturing and close relations with the United States was necessary. The transition would jeopardize China’s long-term economic, social, political, and geopolitical stability. The Communist Party believed it needed to revive strongman leadership (autocracy) rather than pursuing greater liberalization that would ultimately increase the odds of political revolution (democratization). The Xi administration has struggled to manage the country’s vast debt bubble, given that total debt standing has surged to 287% of GDP. The global pandemic forced the government to launch another large stimulus package, which it then attempted to contain. Corporate and household deleveraging ensued. The property and infrastructure boom of the past three decades has stalled, as the regime has imposed liquidity and capital requirements on banks and property developers to try to avoid a financial crisis. Regulatory tightening occurred in other sectors to try to steer investment into government-approved sectors and reduce the odds of technological advancement fanning social dissent. China’s draconian “zero Covid” policy sought to limit the disease’s toll, improve China’s economic self-reliance, and eliminate the threat of social protest during the year of the twentieth party congress. But it also slammed the brakes on growth. China is highly vulnerable to social instability for both structural and cyclical reasons. Chinese social unrest was our number one “Black Swan” for this year and it is now starting to take shape in the form of angry mortgage owners across the country refusing to make mortgage payments on houses that were pre-purchased but not yet built and delivered (Chart 1). Chart 1China: Mortgage Payment Boycott
Questions From The Road
Questions From The Road
The mortgage payment boycott is important because it is stemming from the outstanding economic and financial imbalance – the property sector – and because it is a form of cross-regional social organization, which the Communist Party will disapprove. There are other social protests emerging, including low-level bank runs, which must be monitored very closely. Local authorities will act quickly to stop the spread of the mortgage boycott. But unhappy homeowners will be a persistent problem due to the decline of the property sector and industry. China’s property sector looks uncomfortably like the American property sector ahead of the 2006-08 bust. Prices for existing homes are falling while new house prices are on the verge of falling (Chart 2). While mortgages only make up 15% of bank assets, and household debt is only 62% of GDP, households are no longer taking on new debt (Chart 3). Chart 2China's Falling Property Prices
China's Falling Property Prices
China's Falling Property Prices
Chart 3China's Property Crisis
China's Property Crisis
China's Property Crisis
Chart 4China's Unemployment
China's Unemployment
China's Unemployment
Most likely China’s property sector is entering the bust phase that we have long expected – if not, then the reason will be a rapid and aggressive move by authorities to expand monetary and fiscal stimulus and loosen economic restrictions. That process of broad-based easing – “letting 100 flowers bloom” – will not fully get under way until after the party congress, say in December. Unemployment is rising across China as the economy slows, another point of comparison with the United States ahead of the 2008 property collapse (Chart 4). Unemployment is a manipulated statistic so real conditions are likely worse. There is no more important indicator. China’s government will be forced to ease policy, creating a positive impact on global growth in 2023, but the impact will be fleeting. Bottom Line: The underlying debt-deflationary context will prevail before long in China, weighing on global growth and inflation expectations on a cyclical basis. Middle East: Why Did Biden Go And What Will He Get? President Biden traveled to Israel and now Saudi Arabia because he wants Saudi Arabia and the Gulf Arab members of OPEC to increase oil production to reduce gasoline prices at the pump for Americans ahead of the midterm elections (Chart 5). Chart 5Biden Goes To Israel And Saudi Arabia
Biden Goes To Israel And Saudi Arabia
Biden Goes To Israel And Saudi Arabia
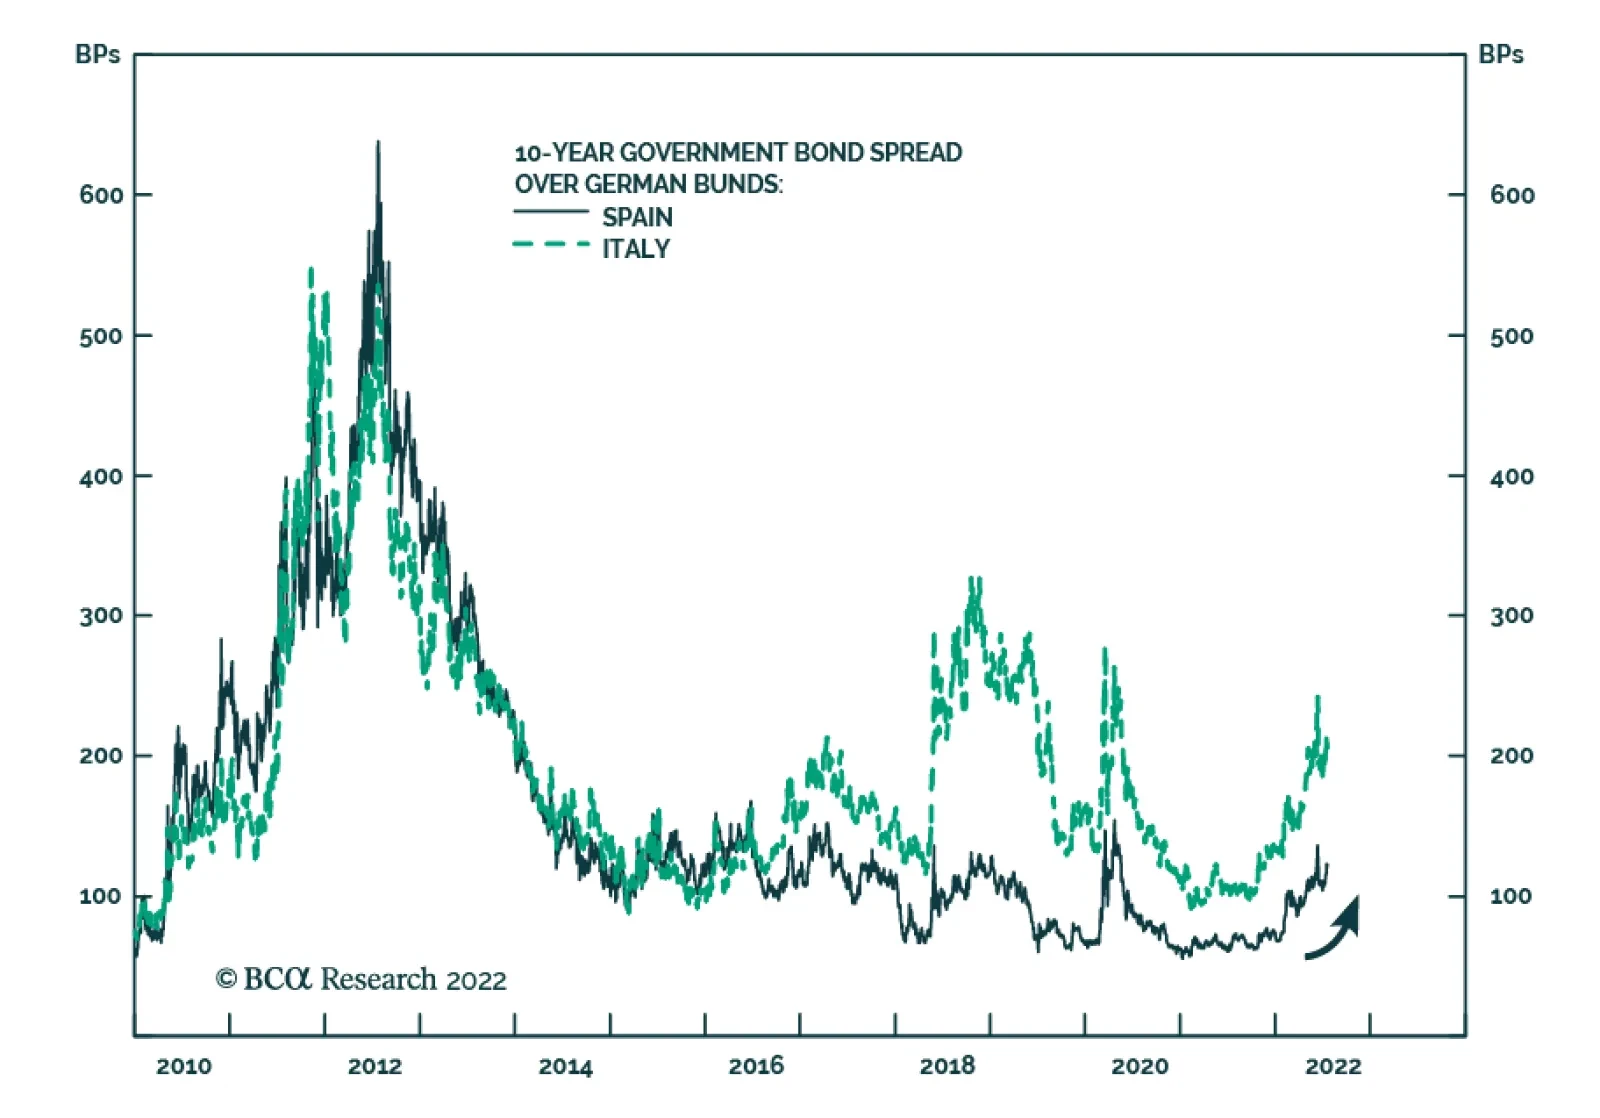
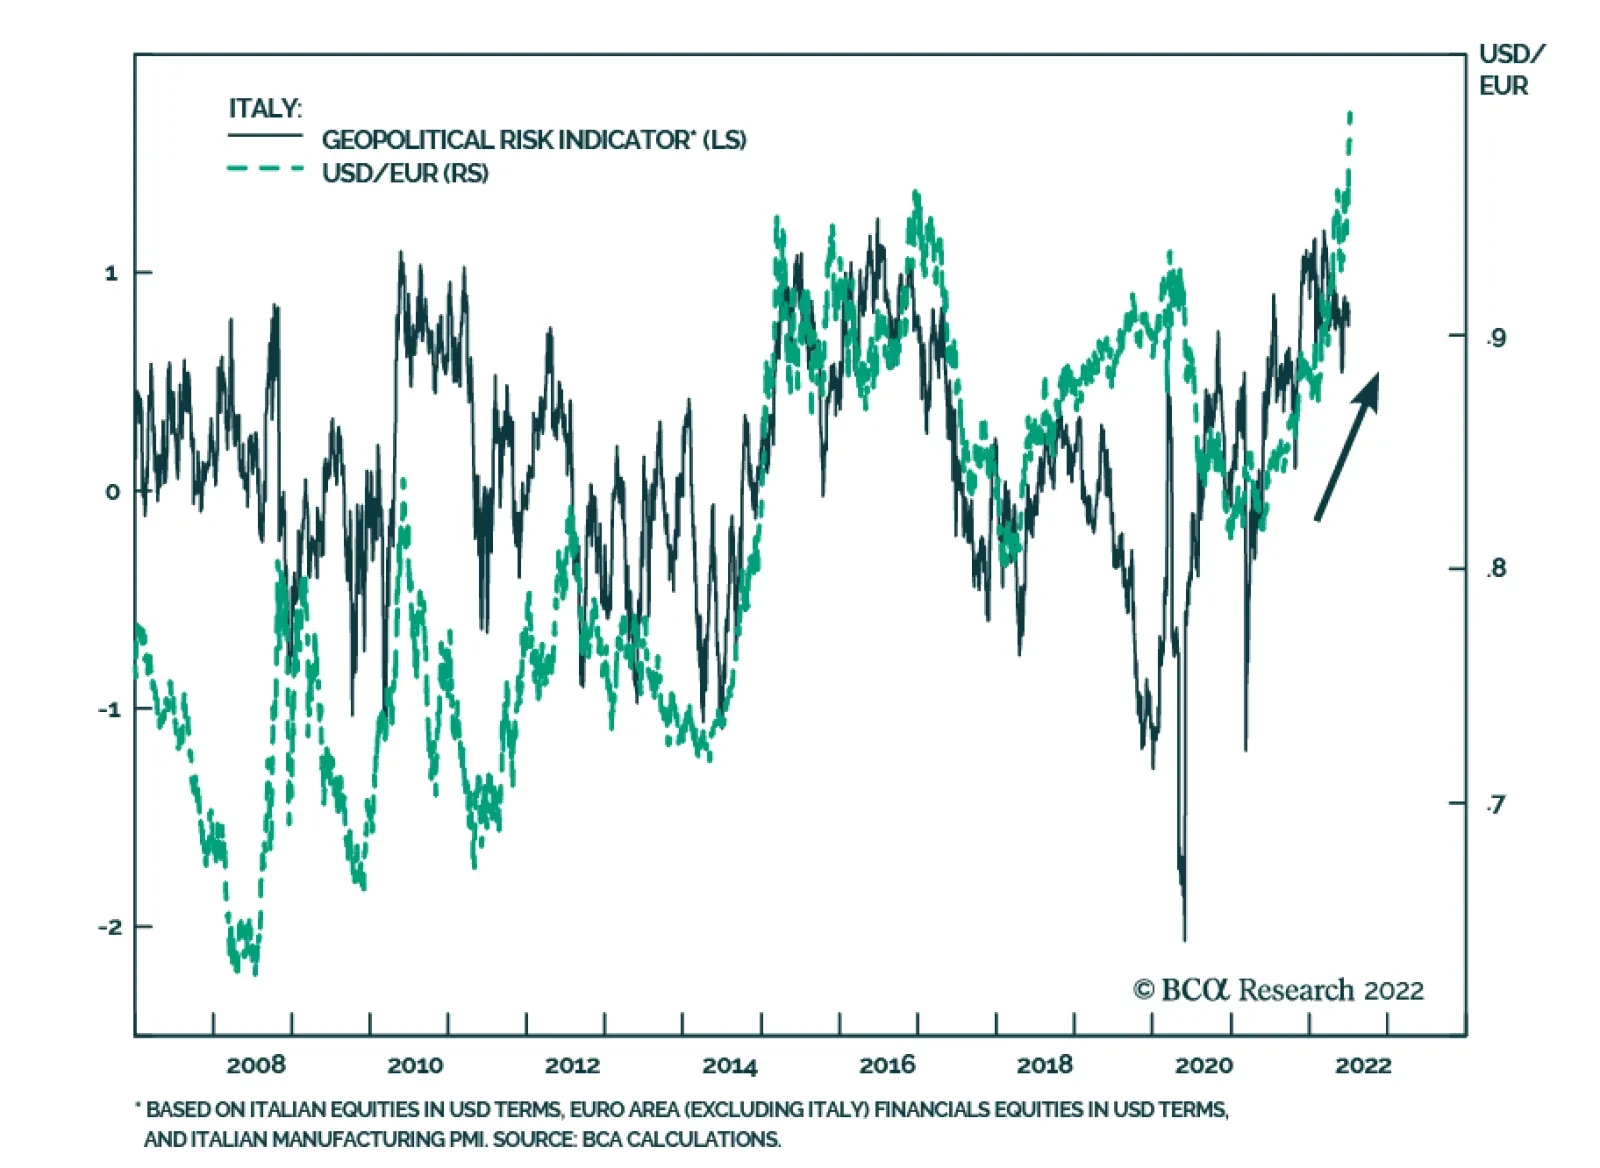
True, fears of recession are already weighing on prices, but Biden embarked on this mission before the growth slowdown was fully appreciated and he is not going to lightly abandon the anti-inflation fight before the midterm election. Biden also went because one of his top foreign policy priorities – the renegotiation of the 2015 nuclear deal with Iran – is falling apart. The Iranians do not want to freeze their nuclear program because they want regime survival and security. While Biden is offering a return to the 2015 deal, the conditions that produced the deal are no longer applicable: Russia and China are not cooperating with the US and EU to isolate Iran. Russia is courting Iran, oil prices are high and sanction enforcement is weak (unlike 2015). The Iranians now know, after the Trump administration, that they cannot trust the Americans to give credible security guarantees that will last across parties and administrations. The war in Ukraine also underscores the weakness of diplomatic security guarantees as opposed to a nuclear deterrent. Hence the joint US and Israeli declaration that Iran will never be allowed to obtain nuclear weapons. The good news is that this kind of joint statement is precisely what needed to occur – the underscoring of the red line – to try to change Ayatollah Ali Khamenei’s calculus regarding his drive to achieve nuclear breakout. In 2015 Khamenei gave diplomacy a chance to try to improve the economy, stave off social unrest, prepare the way for his eventual leadership succession process, and secure the Islamic Republic. The bad news is that Khamenei probably cannot make the same decision this time, as the hawkish faction now runs his government, the Americans are unreliable, and Russia and China are offering an alternative strategic orientation. The Saudis will pump more oil if necessary to save the global business cycle but not at the beck and call of a US president. The drop in oil prices reduces their urgency. The Americans can reassure the Saudis and Israel as long as the deal with Iran is not going forward. That looks to be the case. But then the US and Israel will have to undertake joint actions to underline their threat to Iran – and Iran will have to threaten to stage attacks across the region so as to deter any attack. Bottom Line: If a US-Iran deal does not materialize at the last minute, Middle Eastern instability will revive and a new source of oil supply constraint will plague the global economy. We continue to believe a US-Iran deal is unlikely, with only 40% odds of happening. Europe: Will Russia Turn Back On The Natural Gas? Russia’s objective in cutting off European natural gas is to inflict a recession on Europe. It wants a better bargaining position on strategic matters. Therefore we assume Russia will continue to squeeze supplies from now through the winter, when European demand rises and Russian leverage will peak. If Russia allows some flow to return, then it will be part of the negotiating process and will not preclude another cutoff before winter. It is possible that Russia is merely giving Europe a warning and will revert back to supplying natural gas. The problem is that Russia’s purpose is to achieve a strategic victory in Ukraine and in negotiations over NATO’s role in the Nordic countries. Russia has not achieved these goals, so natural gas cutoff will likely continue. Russia also hopes that by utilizing its energy leverage – while it still has it – it will bring forward the economic pain of Europe’s transition away from reliance on Russian energy. In that case European countries will experience recession and households will begin to change their view of the situation. European governments will be more likely to change their policies, to become more pragmatic and less confrontational toward Russia. Or European governments will be voted out of power and do the same thing. Other states could join Hungary in saying that Europe should never impose a full natural gas embargo on Russia. Russia would be able to salvage some of its energy trade with Europe over the long run, despite the war in Ukraine and the inevitable European energy diversification. In recent months we highlighted Italy as the weakest link in the European chain and the country most likely to see such a shift in policy occur. Italy’s national unity coalition had lost its reason for being, while the combination of rising bond yields and natural gas prices weighed on the economy. The Italian bond spread over German bunds has long served as our indicator of European political stress – and it is spiking now, forcing the European Central Bank to rush to plan an anti-fragmentation strategy that would theoretically enable it to tighten monetary policy while preventing an Italian debt crisis (Chart 6). The European Union remains unlikely to break up – Russian aggression was always one of our chief arguments for why the EU would stick together. But Italy will undergo a recession and an election (due by June 2023 but that could easily happen this fall), likely producing a new government that is more pragmatic with regard to Russia so as to reduce the energy strain. Chart 6Italy's Crisis Points To EU Divisions On Russia
Italy's Crisis Points To EU Divisions On Russia
Italy's Crisis Points To EU Divisions On Russia
Italy’s political turmoil shows that European states are feeling the energy crisis and will begin to shift policies to reduce the burden on households. Households will lose their appetite for conflict with Russia on behalf of Ukrainians, especially if Russia begins offering a ceasefire after completing its conquest of the Donetsk area. If Russia expands its invasion, then Europe will expand sanctions and the risk of further strategic instability will go up. But most likely Russia will seek to quit while it is ahead and twist Europe’s arm into foisting a ceasefire onto Ukraine. Bottom Line: A change of government in Italy will increase the odds that the EU will engage in diplomacy with Russia in the coming year, if Russia offers, so as to reach a new understanding, restore natural gas flows, and salvage the economy. This would leave NATO enlargement unresolved but a shift in favor of a ceasefire in Ukraine in 2023 would be less negative for European assets and the euro. UK: Who Will Replace Boris Johnson? Last week UK Prime Minister Boris Johnson fell from power and now the Conservative Party is engaging in a leadership competition to replace him. We gave up on Johnson after he survived his no-confidence vote and yet it became clear that he could not recover in popular opinion. The inflation outburst destroyed his premiership and wiped away whatever support he had gained from executing Brexit. In fact it reinforced the faction that believed Brexit was the wrong decision. Going forward the UK will be consumed with domestic political turmoil as the cost of stagflation mounts, and geopolitical turmoil as Scotland attempts to hold a second independence referendum, possibly by October 2023. Global investors should focus primarily on Scotland’s attempt to secede, since the breakup of the United Kingdom would be a momentous historical event and a huge negative shock for pound sterling. While only 44.7% of Scots voted for independence in 2014, now they have witnessed Brexit, Covid-19, and stagflation, producing tailwinds for the Scots nationalist vote (Chart 7). Chart 7Forget Bojo's Exit, Watch Scotland
Questions From The Road
Questions From The Road
There are still major limitations on Scotland exiting, since its national capabilities are limited, it would need to join the European Union, and Spain and possibly others will threaten to veto its membership in the European Union for fear of feeding their own secessionist movements. But any new referendum – including one done without the approval of Westminster – should be taken very seriously by investors. Bottom Line: Johnson’s removal will only marginally improve the Tories’ ability to manage the rebellion brewing in the north. A snap election that brings the Labour Party back into power would have a greater chance of keeping Scotland in the union, although it is not clear that such a snap election will happen in time to affect any Scottish decision. The UK faces economic and political turmoil between now and any referendum and investors should steer clear of the pound. (Though we still favor GBP over eastern European currencies). Britain will remain aggressive toward Russia but its ability to affect the Russian dynamic will fall, leaving the US and EU to decide the fate of Russian relations. Japan: What Is The Significance Of Shinzo Abe’s Assassination? Former Japanese Prime Minister Shinzo Abe was assassinated by a lone fanatic with a handmade gun. The significance of the incident is that Abe will become a martyr for a certain vision of Japan – his vision of Japan, which is that Japan can become a “normal country” that moves beyond the shackles of the guilt of its imperial aggression in World War II. A normal country is one that is economically stable and militarily capable of defending itself – not a pacifist country mired in debt-deflation. Abe stood for domestic reflation and a proactive foreign policy, along with the normalization of the Japanese Self-Defense Forces (JSDF). True, economic policy can become less dovish if necessary to deal with inflation. Some changes at the Bank of Japan may usher in a less dovish shift in monetary policy in particular. But monetary policy cannot become outright hawkish like it was before Abe. And Abe’s fiscal policy was never as loose as it was made out to be, given that he executed several hikes to the consumption tax. Japan’s structural demographic decline and large debt burden will continue to weigh on economic activity whenever real rates and the yen rise. The government will be forced to reflate using monetary and fiscal policy whenever deflation threatens to return. Debt monetization will remain an option for future Japanese governments, even if it is restrained during times of high inflation. Chart 8Shinzo Abe's Legacy
Questions From The Road
Questions From The Road
This is not only because Japanese households will become depressed if deflation is left unchecked but also because economic growth must be maintained in order to sustain the nation’s new and growing national defense budgets. Japan’s growing need for self defense stems from China’s strategic rise, Russia’s aggression, and North Korea’s nuclearization, plus uncertainty about the future of American foreign policy. These trends will not change anytime soon. Indeed the Liberal Democratic Party’s popularity has increased under Abe’s successor, Prime Minister Fumio Kishida, who will largely sustain Abe’s vision. The Diet still has a supermajority in favor of constitutional revision so as to enshrine the self-defense forces (Chart 8). And the de facto policy of rearmament continues even without formal revision. Bottom Line: Any Japanese leader who attempts to promote a hawkish BoJ, and a dovish JSDF, will fail sooner rather than later. The revolving door of prime ministers will accelerate. As Japan’s longest-serving prime minister, Shinzo Abe opened up the reliable pathway, which is that of a dovish BoJ and a hawkish foreign policy. This is important for the world, as well as Japan, because a more hawkish Japan will increase China’s fears of strategic containment. The frozen conflicts in Asia will continue to thaw, perpetuating the secular rise in geopolitical risk. We remain long JPY-KRW, since the BoJ may adjust in the short term and Chinese stimulus is still compromised, but that trade is on downgrade watch. Investment Takeaways Russia’s energy cutoff is aimed at pushing Europe into recession so as to force policy changes or government changes in Europe that will improve Russia’s position at the negotiating table over Ukraine, NATO, and other strategic disputes. Hence Russia is unlikely to increase the natural gas flow until it believes it has achieved its strategic aims and multiple veto players in the EU will prevent the EU from ever implementing a full-blown natural gas embargo. Chinese stimulus cannot be fully effective until it relaxes Covid-19 restrictions, likely beginning in December or next year when Xi Jinping uses his renewed political capital to try to stabilize the economy. However, China’s government powers alone are insufficient to prevent the debt-deflationary tendency of the property bust. The Middle East faces rising geopolitical tensions that will take markets by surprise with additional energy supply constraints. The implication is continued oil volatility given that global growth is faltering. Once global demand stabilizes, the Middle East’s turmoil will add to existing oil supply constraints to create new price pressures. The odds are not very high of the Federal Reserve achieving a “soft landing” in the context of a global energy shock and a stagflationary Europe and China. Matt Gertken Chief Geopolitical Strategist mattg@bcaresearch.com Strategic Themes Open Tactical Positions (0-6 Months) Open Cyclical Recommendations (6-18 Months) Regional Geopolitical Risk Matrix "Batting Average": Geopolitical Strategy Trades () Section II: Special (EDIT this Header) Section III: Geopolitical Calendar
Italy entered a new round of political turmoil on Thursday after the populist Five Star Movement refused to support Prime Minister Draghi’s government on a parliamentary vote for a EUR 26 bn inflation-relief package. Although the aid package was eventually…