Europe
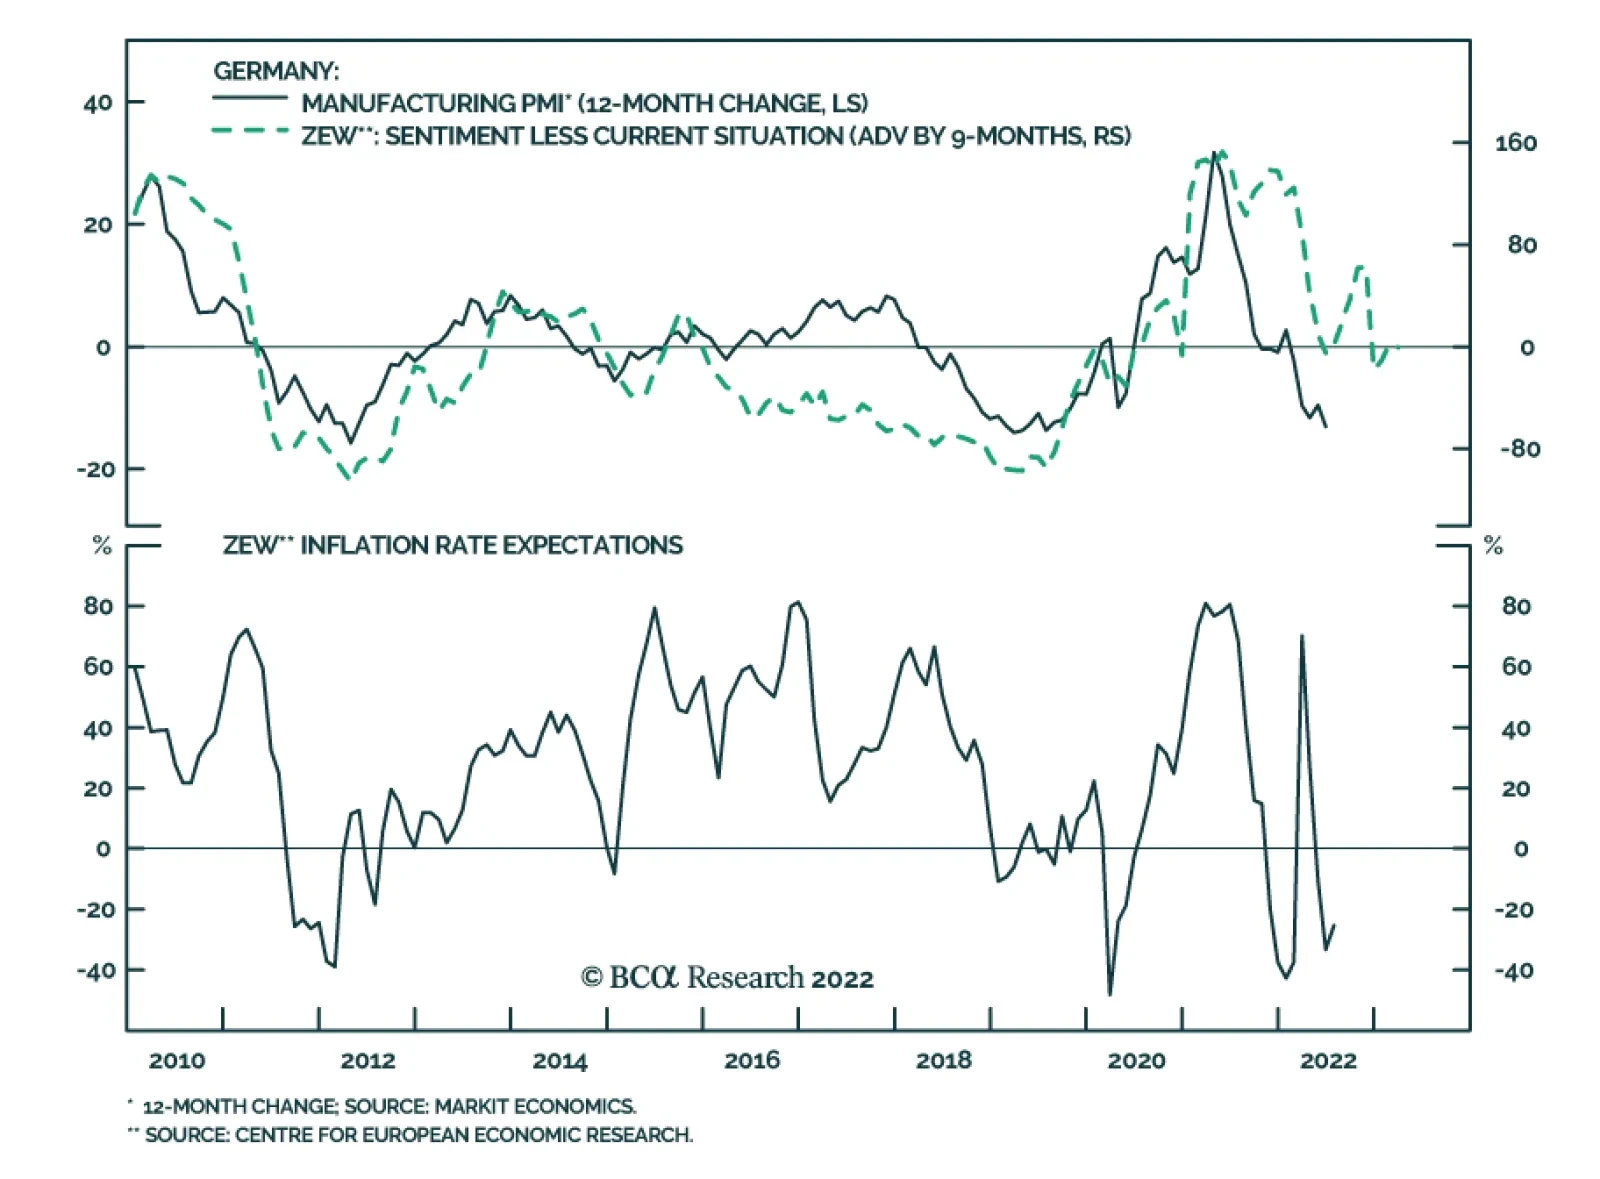
The ZEW survey of investor sentiment sent a cautionary signal on Tuesday. German sentiment slumped in July to the lowest level since 2011. The current situation and expectations indices dropped by 18.2 and 25.8 points, respectively – falling significantly…
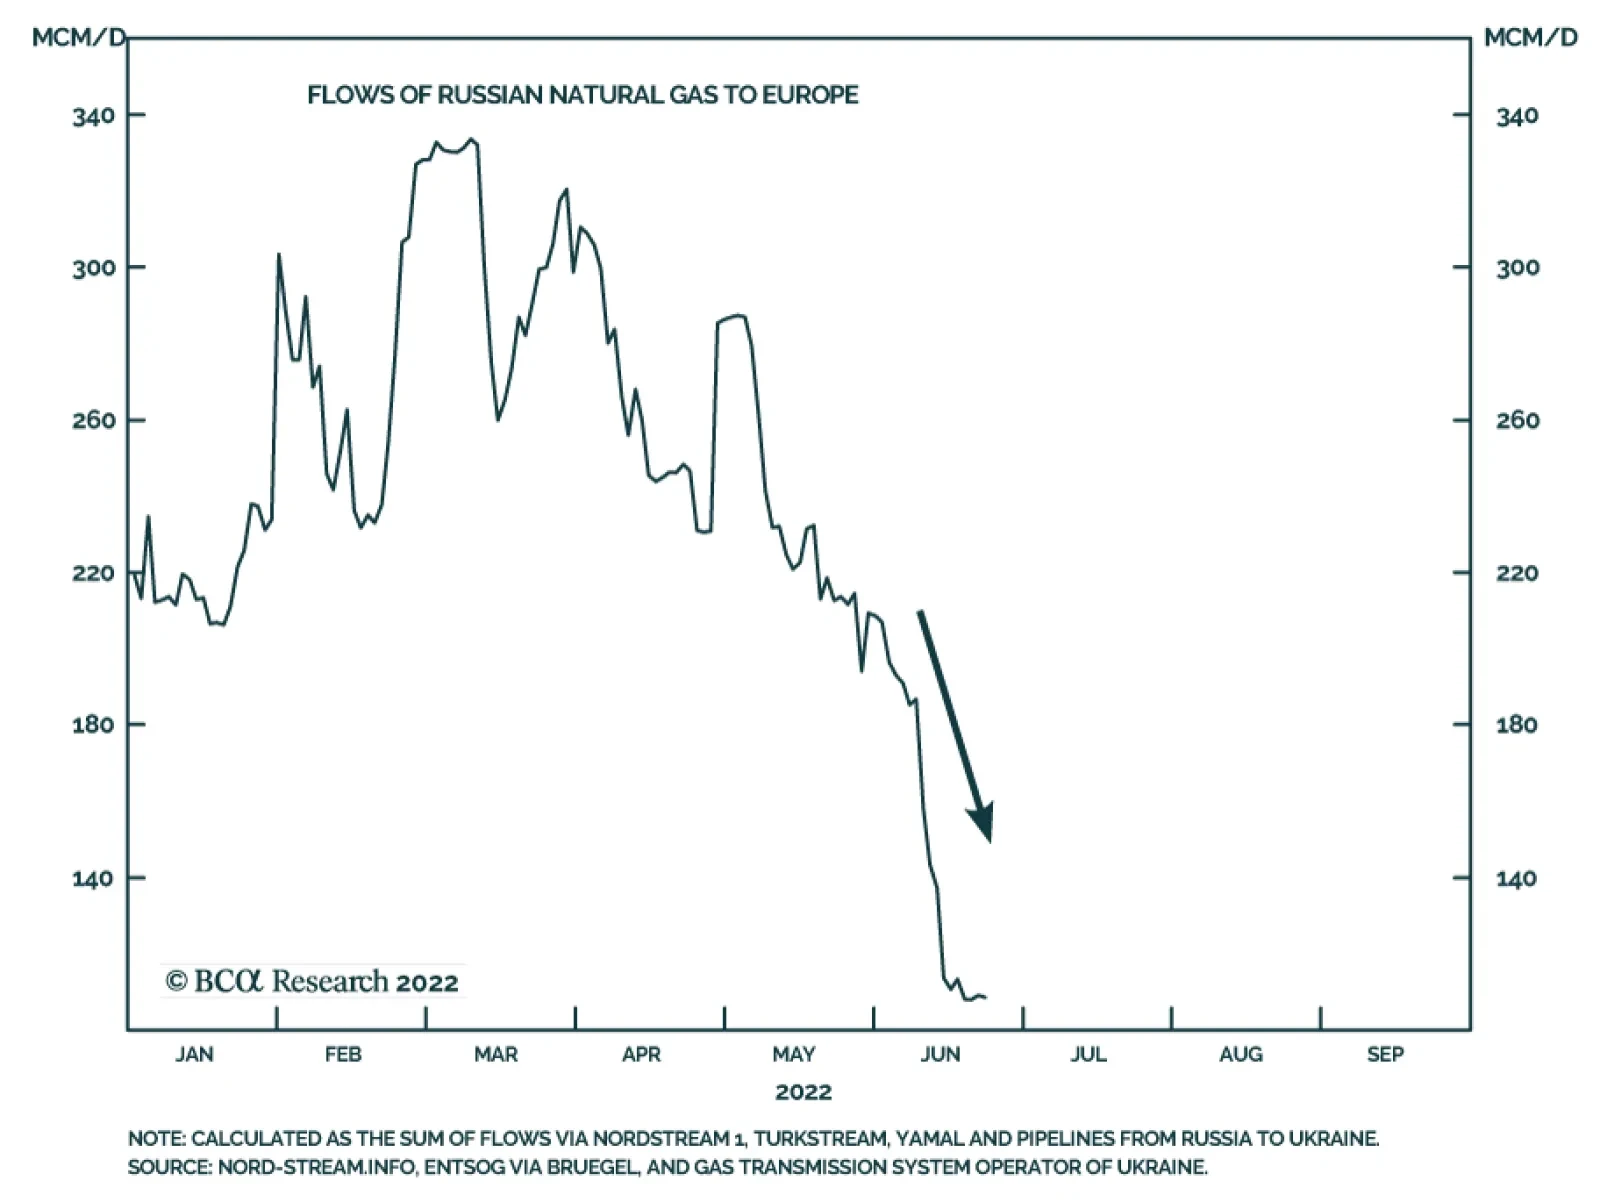
While recession fears have spread to industrial metals and oil markets, natural gas prices have been soaring. Dutch Title Transfer Facility (TTF) natural gas prices are up roughly 100% since June 1 and over 350% y/y. Supply-side disruptions continue to…
According to BCA Research’s European Investment Strategy service, while EUR/USD possesses ample upside over the coming 12 months, there is roughly a 1/3 chance that it will plunge to 0.9 by the winter. The euro benefits from important tailwinds that…

Executive Summary Don’t Try Catching Falling Euros
Don"t Try Catching Falling Euros
Don"t Try Catching Falling Euros
The euro is inexorably moving toward parity. However, many positives could still save EUR/USD, a cheap currency that will benefit if the fears of a global recession recede and if European inflation peaks by the fall. Nonetheless, many fundamental risks still weigh on the euro, including the dollar’s momentum and the continuing ructions in the European energy market. Moreover, technical vulnerabilities are likely to amplify the potential weakness in the euro. There is greater than a 30% chance that EUR/USD will fall to 0.9 or below. As a result, it is preferable to stay on the sidelines and opt for a neutral stance on the EUR/USD. Selling EUR/JPY offers a more attractive reward-to-risk ratio than EUR/USD. The GBP remains under threat. Bottom Line: Don’t be a hero. At this juncture, the EUR/USD outlook remains particularly uncertain. While EUR/USD possesses ample upside over the coming 12 months, there is roughly a 1/3 chance that it will plunge to 0.9 by the winter. Investors should sell EUR/JPY instead. The euro’s race toward parity continues. From May 12 to July 1, EUR/USD attempted to form a triple bottom at 1.0375 that could have marked the end of this year’s decline. Alas, the euro did not hold that floor and now traders are inexorably pushing the common currency lower. The outlook for the euro is complex. At current levels, it is inexpensive and discounts many negative developments affecting both the global and European economies. However, the EUR/USD’s weakness is also a story of dollar strength, and the deteriorating global economic momentum remains the Greenback’s best friend, to the euro’s detriment. For now, we stick to our mantra of the past few months: don’t be a hero. The euro may soon bottom, but enough risks lie ahead that a move below 0.9 against the dollar should not be discarded. The risk-reward from bottom fishing is therefore poor. Instead, investors should sell EUR/JPY, for which downside remains ample. What We Like About The Euro… Despite the pervasive negativity engulfing the euro, there are plenty of positives that will soon help EUR/USD form a bottom. First, the euro is cheap on most metrics. The Purchasing Power Parity (PPP) model developed by BCA’s Foreign Exchange Strategists adjust for the different consumption baskets in the Eurozone and the US. It currently shows that EUR/USD trades 25% below fair value, its deepest discount since 2001. This degree of undervaluation is associated with a high probability of strong long-term returns for the euro (Chart 1). Based on interest rate parity and risk aversion, the euro also trades well below its fair value. Steep discounts are often followed by an imminent rebound in the currency (Chart 2). However, the euro hit a similar discount in January, but failed to rally because of the problems in the energy markets prompted by Russia’s invasion of Ukraine. Chart 1Strong Long-Term Returns based on PPP
Strong Long-Term Returns based on PPP
Strong Long-Term Returns based on PPP
Chart 2Oversold on Many Metrics
Oversold on Many Metrics
Oversold on Many Metrics
Second, the euro is oversold. Both BCA’s Intermediate-Term Technical Indicator and the Citi FX Euro PAIN Index are very depressed, which indicates pervasive negative sentiment toward the euro (Chart 2, bottom two panels). This kind of extremes in momentum are often followed by a euro rally. Chart 3Global Recession Fears Hurt EUR/USD
Global Recession Fears Hurt EUR/USD
Global Recession Fears Hurt EUR/USD
Third, global economic pessimism is widespread. EUR/USD is a pro-cyclical pair, which mostly reflects the counter-cyclicality of the dollar and the great liquidity of the euro. It is therefore not surprising that spikes in global recession concerns are associated with a weakening EUR/USD (Chart 3). The recent wave of depreciation happened contemporaneously with a spike in Google searches for the word “recession.” If these fears, which reached extreme levels, subside further in the months ahead, the euro may benefit greatly. Fourth, pessimism toward China may ease, which would lift the euro in the process. Last week, it was announced that Beijing is considering allowing local governments to sell RMB1.5 trillion of special government bonds in the second half of the year to fund infrastructure spending. The news caused a rebound in the AUD, Brazilian assets, and copper. Europe too would benefit from greater activity in China. Chart 4Chinese Salvation?
Chinese Salvation?
Chinese Salvation?
Chinese monetary conditions are also easing, which historically supports industrial activity in Europe relative to the US (Chart 4, top panel). The change in approach in the implementation of the zero-COVID policy is helping Chinese PMIs rebound, which will eventually translate into higher European shipments to China. Moreover, the rate of change of the performance of real estate stocks relative to the broad market has turned the corner, which may facilitate a stabilization of Chinese real estate transactions (Chart 4, second panel). Ultimately, the expanding excess reserves in the Chinese banking system point toward a stabilization of the performance of EUR/USD later this year (Chart 4, bottom panel). Fifth, our expectation that European inflation will peak by the autumn will prove the greatest help to the euro. The EUR/USD’s weakness over the past twelve months has coincided with a surge in European inflation surprises (Chart 5, top panel). This relationship reflects the negative impact on European real rates of both stronger realized and expected inflation (Chart 5, second panel). Investors understand that Europe’s inflation crisis is driven by a relative price shock in the energy market that greatly hurts economic activity in the Eurozone. Hence, even if they expect the ECB to increase interest rates, they believe policy rates will lag inflation because of Europe’s poor growth outlook. This is particularly true when compared to the US Fed. As a result, European real rates continue to lag far behind US ones and the European yield curve is steeper than that of the US, because traders foresee easier policy on the Eastern shores of the Atlantic (Chart 5, panel three and four). Chart 5Inflation Hurts the Euro
Inflation Hurts the Euro
Inflation Hurts the Euro
Chart 6Declining Inflation Expectations? Declining Inflation Expectations?
Declining Inflation Expectations? Declining Inflation Expectations?
Declining Inflation Expectations? Declining Inflation Expectations?
This situation is fluid and inflation expectations have begun to decrease. The recent easing in energy prices has contributed to a decline in long-term inflation expectations (Chart 6). We argued last week that the energy inflation is arithmetically set to decrease over the coming twelve months, which suggests further downside in inflation expectations is likely. Moreover, four of the five largest weights in the Eurozone HICP are running hot, but all are linked to commodity inflation, which confirms our bias that European inflation will soon peak (Chart 7). A top in both headline and core inflation will drag short- and long-term inflation expectations lower, which will help European real rates (Chart 8). Meanwhile, lower imported energy inflation will limit the damage to European economic activity, allowing the ECB to increase rates anyway. Chart 7Key HICP Components
Key HICP Components
Key HICP Components
Chart 8A durable Decline In Expected Inflation Depends On Realized Inflation
A durable Decline In Expected Inflation Depends On Realized Inflation
A durable Decline In Expected Inflation Depends On Realized Inflation
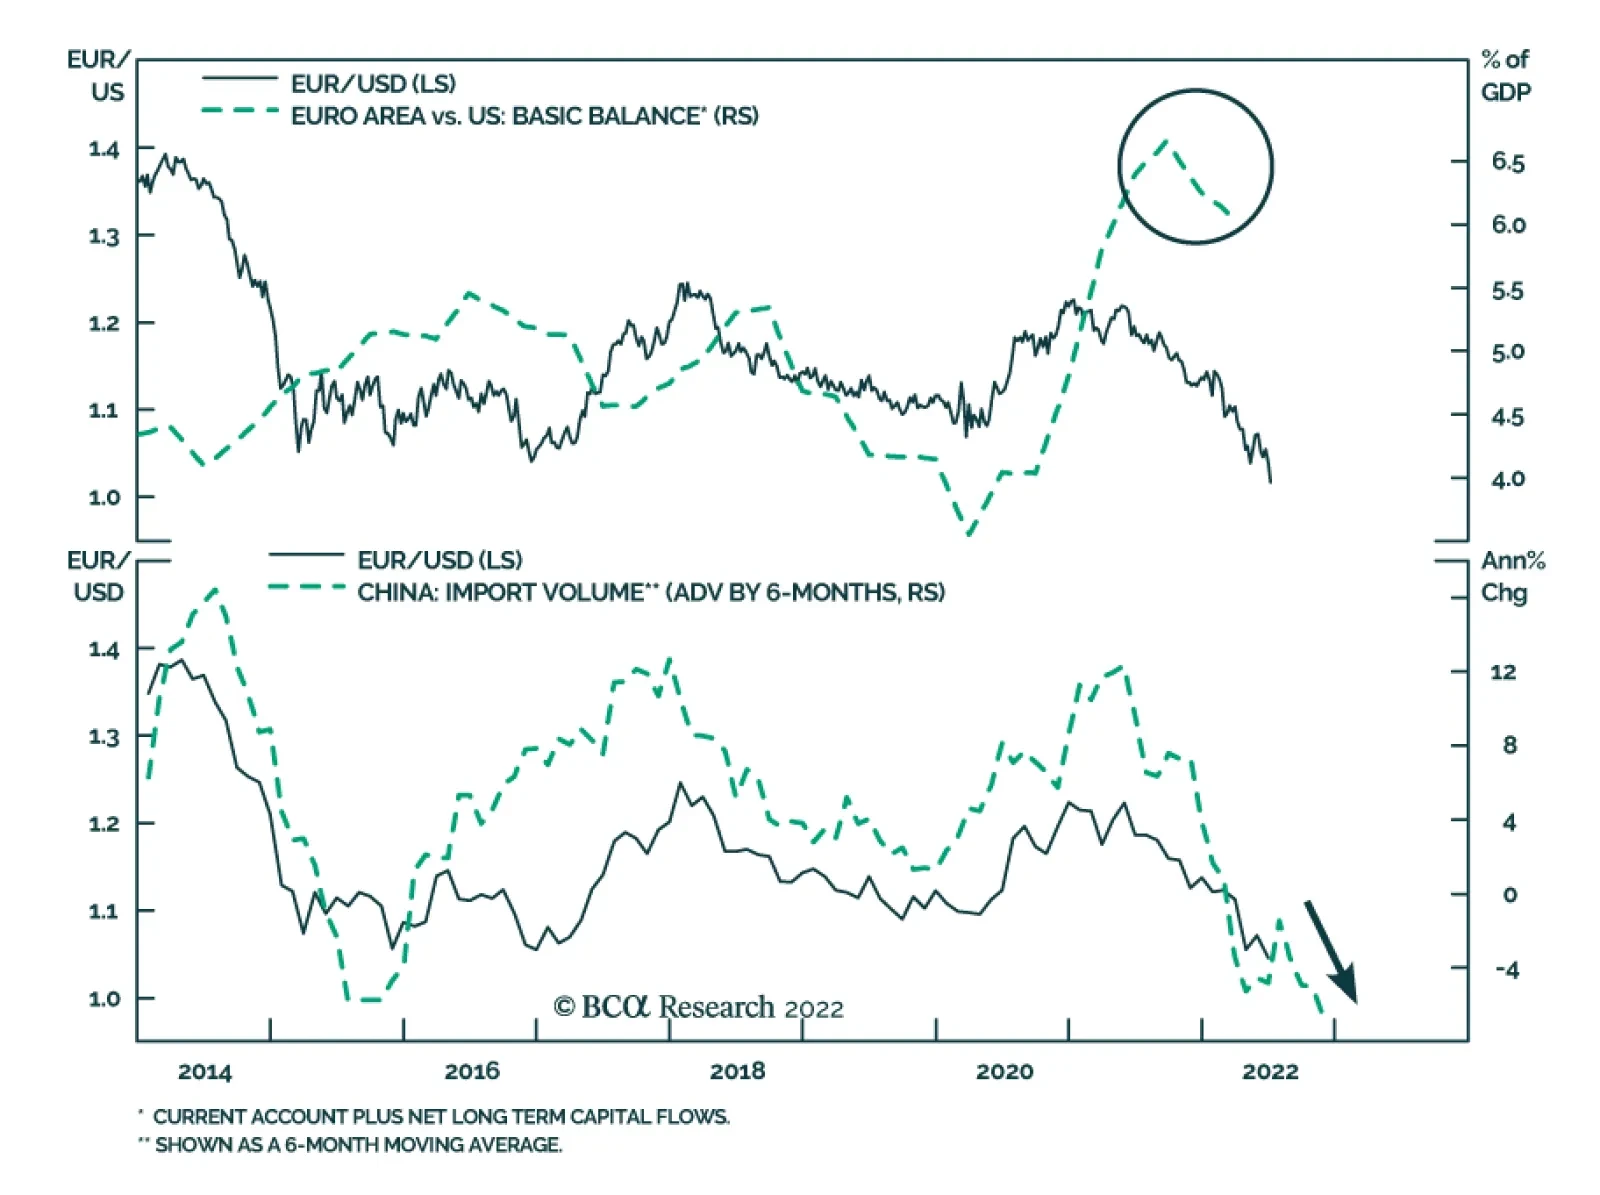
Chart 9Balance Of Payment Support
Balance Of Payment Support
Balance Of Payment Support
Bottom Line: The euro benefits from important tailwinds that suggest EUR/USD will be higher 12 to 18 months from now. It is cheap and oversold and the pervasive gloom among investors about the state of the global economy indicates that many negatives are already embedded in its pricing. Moreover, the Chinese economy could stabilize in the second half of 2022 and into 2023, which will hurt the dollar and boost the euro. Crucially, a peak in European inflation will allow European real rates to recover and curtail the handicap keeping EUR/USD under pressure, especially as the basic balance of payment remains in the euro’s favor (Chart 9). … And What We Don’t EUR/USD may benefit from some important tailwinds, but it is still burdened by massive handicaps. The first problem that will place downward pressure on the euro is that its weakness is not unique and that it reflects broad-based dollar strength (Chart 10). This is a problem for the euro because the dollar (and the yen) is the foremost momentum currency in the G10. Its strength begets further strength, and the momentum signal from moving average crossovers remains dollar-bullish. This headwind for the euro could even intensify in the coming months. JP Morgan EM FX Index is breaking down to new lows, which points to further tightening in EM financial conditions. Historically, tighter EM FCIs translate in both weaker Eurozone stock prices and a weaker EUR/USD, which reflects the closer link between the Euro Area and EM economies than between the US and EM (Chart 11). Chart 10The Dollar's Strength Is Broad-Based
The Dollar's Strength Is Broad-Based
The Dollar's Strength Is Broad-Based
Chart 11More Trouble In Store
More Trouble In Store
More Trouble In Store
This phenomenon is exacerbated by the underlying weakness in global economic activity. Arthur Budaghyan, BCA’s EM Chief Strategist, often reminds us that Asian exports remain soft. Additionally, the deterioration in US economic activity is likely to continue, as suggested by the weakness in the ISM new orders-to-inventories ratio and by the poor readings from the Regional Fed Surveys. Slowing US growth will generate a further decline in the business-sales-to-inventory ratio, which often coincides in a strong dollar and a weak euro. Chart 12Past Chinese Weaknesses Linger
Past Chinese Weaknesses Linger
Past Chinese Weaknesses Linger
The second problem for EUR/USD is that China’s economic outlook may be improving in the future, but, for now, the impact of the recent Chinese slowdown continues to hamper Europe. More specifically, the recent decline in Chinese import volumes is consistent with a euro-bearish backdrop for the remainder of this year (Chart 12, top panel). In fact, even if the CNY remains stable against the USD, this does not guarantee a positive outcome for the euro as the past weakness in Chinese import volumes is also consistent with a depreciating EUR/CNY (Chart 12, bottom panel) The third euro-negative force is the natural gas market. As we showed last week, Dutch natural gas prices must settle between EUR500-600/MWh this upcoming winter to have the same inflationary impact as they did over the past 18 months. This is unlikely to happen, even according to the direst forecasts of BCA’s Commodity and Energy strategists. However, there is a greater than 30% chance that Europe must ration electricity this winter, which would cause a violent output contraction. As a result, any fluctuation in natural gas flows in Europe will cause the market-based odds of a European recession to swing widely. Consequently, the negative correlation between EUR/USD and TTF prices observed over the past twelve months is likely to remain intact (Chart 13). Related Report European Investment StrategyQuestions From The Road The fourth issue hurting the euro is the US’s comparative isolation from the energy market’s travails. The US is a haven of relative economic stability today. Yes, its growth will slow further, but it is nonetheless set to outperform the Eurozone. The US is not under threat of rationing energy this winter. Moreover, the US terms of trades benefit from rising energy prices, unlike Europe (Chart 14). Furthermore, the US output gap is closing faster than that of in the Eurozone (Chart 14, bottom panel). As a result, the odds of dovish surprises by the ECB are much greater than those by the Fed. Chart 13Neutral Gas Is Still A Drag
Neutral Gas Is Still A Drag
Neutral Gas Is Still A Drag
Chart 14The US As A Haven Of Stability
The US As A Haven Of Stability
The US As A Haven Of Stability
The US’s relative resilience might also impact equity flows over the next few months in a euro-bearish fashion. US EPS have been stable relative to Euro Area ones, even in local currency terms. Interestingly, because relative EPS reflect broader economic forces, EUR/USD follows them (Chart 15). Thus, if the European economic outlook deteriorates further relative to that of the US, chances are high that Eurozone EPS estimates will be revised down relative to the US, which will coincide with a lower EUR/USD. In fact, the recent underperformance of Eurozone small-cap stocks (which are domestically focused) relative to European large-cap equities (which derive a greater proportion of their sales abroad) and US small-cap shares also confirms the worsening relative economic outlook between Europe and the US, and thus portend significant near-term risks to EUR/USD (Chart 16). Chart 15Follow Earnings Estimates
Follow Earnings Estimates
Follow Earnings Estimates
Chart 16Small Caps Indicate More EUR Selling
Small Caps Indicate More EUR Selling
Small Caps Indicate More EUR Selling
Chart 17An ECB Bungle Would Burden The Euro
An ECB Bungle Would Burden The Euro
An ECB Bungle Would Burden The Euro
The last major fundamental risk weighing on EUR/USD is the significant probability that the ECB will disappoint markets with respect to its anti-fragmentation tool to be announced in July. Investor expectations are lofty. However, internal divisions within the ECB Governing Council remain, and, most importantly, the ECB is hamstrung by previous ECJ and German Constitutional Court rulings on bond purchases. Thus, our base case remains that the development of an appropriate bond purchase program will be an iterative process resulting from a back-and-forth between market tensions and ECB responses. As a result, there are risks of further widening in Italian spreads as well as European corporate bond spreads. These developments would further hurt the euro (Chart 17). Chart 18Much Selling To Be Unleashed Sentiment Could Get More Negative
Much Selling To Be Unleashed Sentiment Could Get More Negative
Much Selling To Be Unleashed Sentiment Could Get More Negative
These fundamental problems with EUR/USD do not guarantee that the euro will punch below parity. After all, there are also plenty of positives with this currency. However, the risk of a violent selloff is elevated, at around 30%, because of underlying technical vulnerabilities. Global market liquidity has deteriorated in recent years, and this phenomenon is also impacting FX markets, resulting in sudden jumps being more frequent. Most crucially, the odds are high that automatic selling will be triggered if the euro tests parity, which would result in a cascading decline for a euro entering territory that has not been charted for the past 20 years. Specifically, speculators are marginally short the euro (Chart 18, top panel) and 1-month and 3-month risk reversals in the option markets are not yet at a capitulation point (Chart 18, bottom panel). Thus, if panic sets in, the euro could easily fall below 0.9, where the strongest supports lie. In essence, we worry that a sudden crash in the euro is becoming a growing threat. Bottom Line: The combination of the dollar’s momentum, the lagging impact of China’s economic woes, the risks to Europe’s energy supplies, the relative stability of the US economy, and the heightened chance that the ECB underdelivers with respect to its anti-fragmentation tool later next week all point to significant risks to the euro in the coming months. Moreover, the technical vulnerabilities present in the FX market suggest that, if further downside takes place, it will not only be large but also rapid. Investment Conclusions The dilemma between views and strategy is greatest with the euro today. There are many positives highlighted in this report that suggest that the euro has upside on a 12-month basis. However, the risks are abundant, and the potential downside in the coming six months not only carries a large probability, it is also likely to be pronounced if it takes place. As a result of this configuration, we fall back to the strategy we had adopted for European equities earlier this year: don’t be a hero. Even if the euro bottoms tomorrow, the risks are such that capital preservation remains paramount. Consequently, we recommend that investors stay on the sideline and maintain a neutral stance on EUR/USD. It is just as risky to try to bottom fish this pair as it is to chase it lower from current levels. Chart 19Sell EUR/JPY
Sell EUR/JPY
Sell EUR/JPY
Instead, we follow BCA’s Foreign Exchange Strategists recommendation to go short EUR/JPY as a bet with a lower risk-reward ratio. Global recession worries and weakening commodity inflation are likely to allow for greater downside in global yields, which often results in a lower EUR/JPY (Chart 19). Additionally, investors do not expect much out of the BoJ this year, but if recession risks intensify in Europe because of energy rationing this winter, there is room to curtail the interest rate pricing for the ECB embedded in the €STR curve. Furthermore, the JPY is the cheapest currency in the G10. Finally, investors wanting to build greater exposure to European currencies should do so via the Swiss franc. We argued three weeks ago that the CHF enjoys significant structural tailwinds because of the Swiss economy’s strong productivity. Additionally, the SNB is no longer intervening to limit the CHF upside, as demonstrated by the decline in its current deposits. Instead, a stronger Swiss franc is the most potent weapon in the SNB’s arsenal to combat inflation. Moreover, the CHF offers a hedge against both recession risks in the Eurozone and further widening in European spreads. Bottom Line: Don’t be a hero. EUR/USD’s outlook is uniquely uncertain now. While many factors point to positive returns on a 12-to-18 month basis, if the euro hits parity in response to the many clouds still hanging over Europe, technical factors could plunge this currency to EUR/USD 0.9 into a steep decline. Instead, the clearer call is to sell EUR/JPY. Investors who want to assume a European FX exposure today should do so through the Swiss franc, not the euro. A Few Words On The UK Last week, Prime Minister Boris Johnson resigned. The initial response of the pound was to rebound. This reaction should fade. BCA Geopolitical strategists argue that, even though the person sitting at 10 Downing Street is about to change, the fundamental problems with the UK remain the same. The Labour Party is ascending, but it will still have to deal with the Brexit aftermath, rising populism, and popular discontent across the country. The economy is still fragile and engulfed in an inflationary spiral. Meanwhile, the risks created by a looming Scottish independence referendum are much more significant than was the case in 2014. As a result, the pound is likely to remain under stress over the coming quarters. Mathieu Savary, Chief European Strategist Mathieu@bcaresearch.com Tactical Recommendations Cyclical Recommendations Structural Recommendations
Executive Summary Caught In Risk-Off Selling
Copper Testing Support
Copper Testing Support
Weak Chinese and European economies are suppressing copper demand and helping to temper prices in a market that remains fundamentally tight. Weaker US GDP growth could put the three largest economies in the world in or close to recession in 2H22/1H23, which would contribute to demand-side weakness in copper markets. The odds manufacturing and base-metals refining will be curtailed in Europe are rising. Although a strike in Norway has been averted by government intervention, maintenance on Russia’s Nord Stream 1 pipeline scheduled to begin next week likely will serve as a pretext for longer and deeper natgas supply cuts to the EU. Bottom Line: Despite fundamental tightness in global copper markets, prices are being restrained by fears weaker Chinese and European economic performance will lead to a global recession. Early reads of US GDP pointing to negative growth in 2Q22 stoke these fears. Heightened economic policy uncertainty globally exacerbates them. We remain fundamentally bullish copper and will re-establish our long SPDR S&P Metals & Mining ETF (XME) – down ~ 40% from its highs in April – at tonight’s close. In addition, we went long the XOP oil and gas ETF at Tuesday’s close, after prompt Brent breached the buy-trigger we set last week of $105/bbl during this week’s crude-oil sell-off. Feature Lower GDP growth expectations in China and the EU – along with a wobbly US economy being flagged by an Atlanta Fed GDPNow forecast pointing to negative growth in 2Q22 – are stoking fears of a global manufacturing and industrial recession. This prompted a rout in industrial commodities – base metals and oil – this week, which still has markets on edge. This slow-down in the world’s three largest economies – accounting for almost 50% of global GDP expressed in purchasing-power terms – is the only thing keeping the level of global copper demand close to supply at present (Chart 1).1 At least for the time being, this is keeping the threat of sharply higher copper prices, which would be more in line with the low levels of supplies and inventories globally, at bay (Chart 2). As of the week ended May 27th, global copper stocks stood at just above 562k tons, which is ~ 31% lower y/y. Chart 1World’s Biggest Economies Slowing
Copper Prices Decouple From Fundamentals
Copper Prices Decouple From Fundamentals
Chart 2Copper Prices Disconnect From Fundamentals
Copper Prices Disconnect From Fundamentals
Copper Prices Disconnect From Fundamentals
Uncertainty Weakens Copper Prices Energy and metals markets remain extremely tight on a fundamental supply-demand basis.2 The sharp sell-off this week in oil and metals prices is, in our view, evidence industrial-commodity prices have decoupled from fundamentals. This makes traders – hedgers and speculators – extremely risk-averse, which reduces liquidity and increases volatility. On the back of these concerns, markets exhibit the sort of volatility associated with economic collapse, despite still-strong underlying fundamentals. Chart 3Rising Global Policy Uncertainty
Copper Prices Decouple From Fundamentals
Copper Prices Decouple From Fundamentals
Volatility is on the rise due to increasing economic uncertainty in these markets. This makes it extremely difficult to assign probabilities to different price outcomes (i.e., true uncertainty). The BBD Global Economic Policy Uncertainty is approaching levels seen during the early pandemic (Chart 3). We put this rising uncertainty down to poor policy and communication from central banks and governments; a pig’s breakfast of energy policy globally that increasingly adds nothing but confusion to markets; and a muddled public-health policy in China, which produces random shut-downs in global supply chains as covid infections randomly crop up in important port cities. Lastly, the East and West are moving toward a new Cold War, which already is having profound effects on all markets, trade flows and capital availability in the short- and medium-term. This keeps markets on edge and forces them to parse every geopolitical development that hits the tape.3 Re-forging supply chains, re-building basic industrial infrastructure as the West moves away from outsourcing to China and other EM states will be costly and volatile, especially as embargoes and sanctions increase between these blocs. This political and economic evolution will require increased investment in base metals production and exploration, along with similar commitments to oil and gas. Low and volatile prices will not support this, as they disincentivize investment, and set markets up for continued shortage and scarcity going forward. In the metals markets, years of underinvestment by major mining companies will keep copper supplies and inventories tight going forward (Chart 4). This will hinder and delay the global renewable-energy transition, which cannot be realized without higher base-metals supplies. Chart 4Structural Underinvestment In Mining Fundamentally Bullish Copper
Copper Prices Decouple From Fundamentals
Copper Prices Decouple From Fundamentals
Recession Fears Haunt Metals Globally … The proximate causes of the persistent weakening of copper prices is the demand destruction arising from the lockdown in China, and an increasing concern over the economic prospects of the EU as it prepares for a possible shut-off of Russian natgas exports. Should Russian supplies be cut off, the EU will be pushed into recession as natural-gas rationing – and the attendant prioritization of human needs going into winter – will constrict economic activity, particularly in manufacturing. This leaves two of the three largest economies in the world either in recession or not growing at all. Added to this is the fear of a wobbly US economy, which has been slowed by higher energy prices and the Fed’s hawkish tightening of monetary policy. The Atlanta Fed’s GDPNow forecast for 2Q22 estimates a 2.1% contraction in US GDP. This would be the second consecutive quarter of negative growth and would meet a widely held rule-of-thumb indicator or recession.4 In our modelling, we estimate the income elasticity of copper demand in DM economies like the EU and US (1.39) and EM-ex-China (0.87) states is higher than that of China (0.37). This means that a 1% contraction in p.a. Chinese real GDP would translate to a 0.37% p.a. fall in copper demand, all else equal. A contraction of real incomes – i.e., real GDP – in the EU and EM-ex-China will cause a larger relative adjustment in copper demand than in China, even though the level of copper demand in China is far greater in absolute terms (Chart 5). A recession in the EU will reduce import demand for China’s manufactured output in these markets (Chart 6). As China’s trade volumes fall, Chinese manufacturing PMIs will contract. Similarly, exports to China from the EU will weaken as manufacturing weakens and real GDP moves lower. We believe this will put more pressure on the Chinese government to provide fiscal and monetary stimulus to counter such a downdraft. Chart 5Copper Demand Sensitive to Real GDP (Income)
Copper Demand Sensitive to Real GDP (Income)
Copper Demand Sensitive to Real GDP (Income)
Chart 6Trade Channel Effects Follow GDP Weakness
Trade Channel Effects Follow GDP Weakness
Trade Channel Effects Follow GDP Weakness
… But China Worries Dominate The Chinese economy is showing signs of further slowing.5 Weakness in credit levels, infrastructure investment, manufacturing, the property sector, and exports all indicate the covid-policy lockdowns, high commodity prices, and parsimonious credit and fiscal policies have produced a dramatic slowing in economic activity. In our modelling, we find evidence that each of these components exhibits a long-run inverse relationship with Chinese copper inventories, which in turn exhibits a long-run inverse relationship with COMEX copper prices. Roughly 10 days after the initial Shanghai lockdown, copper prices went into contango (Chart 7). This occurred despite continuous declines in Chinese copper inventories during the lockdown months (Chart 8). Such anomalous behavior – i.e., as inventories fall markets become more backwardated – makes it difficult to connect prices and supply-demand-inventory fundamentals. Chart 7Copper In Contango For Most Of China’s Lockdown
Copper In Contango For Most Of Chinas Lockdown
Copper In Contango For Most Of Chinas Lockdown
Chart 8Chinese Copper Inventories Continue To Draw In Lockdown
Chinese Copper Inventories Continue To Draw In Lockdown
Chinese Copper Inventories Continue To Draw In Lockdown
BCA’s China Investment Strategy expects a muted 2H22 recovery for the Chinese economy. Rolling lockdowns due to China’s COVID policy will reduce the potency of fiscal and monetary stimulus. The stop-start nature of economic activity will stymie growth in disposable income and job creation, which in turn will translate to weaker aggregate demand. The knock-on effect of weaker business activity due to the lockdown earlier this year has been a higher propensity to save by households (Chart 9). Household surveys conducted by the PBoC show that, since 2017, household savings have been increasing, suggesting a precautionary sentiment (Chart 10). Chart 9Chinese Economic Slowdown Reduced Credit Demand
Chinese Economic Slowdown Reduced Credit Demand
Chinese Economic Slowdown Reduced Credit Demand
Chart 10Rising Precautionary Savings...
Rising Precautionary Savings...
Rising Precautionary Savings...
Chart 11...Will Impact Domestic Property Market
...Will Impact Domestic Property Market
...Will Impact Domestic Property Market
We do not expect the property market to recover in a manner similar to what occurred following China’s re-opening after the first wave of the COVID-19 pandemic. Depressed household purchasing power will keep housing demand subdued, while the “three red lines” policy, which limits the amount property developers can borrow, will keep supply low (Chart 11).6 Housing accounts for ~ 30% of copper consumption in China, which means weak property markets will remain a drag on copper demand. Investment Implications Continued weakness in China’s economy and a potentially deep recession in the EU will continue to restrain demand for copper globally. In addition, with the US economy looking wobbly, the third global pillar of economic strength also will be weakening going into 2H22. These fundamental demand-side effects will lower pressure on tight copper inventories and keep prices subdued, in our view. This does not, however, signal an all-clear for copper supply or inventory tightness. Weaker demand is the only thing keeping prices from rising sharply, given the tight supply and inventory position of global copper markets. On the supply side, governance issues in copper-rich Latin American states, which are in the process of revising their social contracts with copper producers and consumers, will increase mining costs for companies, disincentivizing long-term and large-scale investments in new mines.7 These costs ultimately will be borne by consumers as supply shortages mount and the need to increase capex grows. Ultimately, this will feed into longer-term inflation and inflation expectations. Chart 12Caught In Risk-Off Selling
Copper Testing Support
Copper Testing Support
We remain long-term bullish copper, as fundamentals remain tight and will get tighter. That said, over the short term, aggregate-demand weakness in the three major economic pillars in the world makes us leery of getting long copper futures, particularly as prompt COMEX prices test support (Chart 12). Persistently weak copper prices will disincentivize the needed investment in new supply the world will need to effect a transition to renewable energy in coming decades. For this reason, we are comfortable re-establishing our long XME metals and mining ETF at tonight’s close, as copper prices are down 40% from their April highs. Robert P. Ryan Chief Commodity & Energy Strategist rryan@bcaresearch.com Ashwin Shyam Research Analyst Commodity & Energy Strategy ashwin.shyam@bcaresearch.com Paula Struk Research Associate Commodity & Energy Strategy paula.struk@bcaresearch.com Commodity Round-Up Energy: Bullish. A strike by Norwegian energy-sector workers that would have hit the natural gas market in Europe particularly hard was averted earlier this week.8 This still leaves the EU and UK (Europe) at risk of additional losses of Russian natgas exports beginning next week when Nord Stream 1 (NS1) maintenance is due to start. These threats have pushed Dutch Title Transfer Facility (TTF) natural gas prices up close to 93% since 1 June, and close to 400% y/y as of Tuesday. For the first five months of this year, Europe’s been importing just under 15 Bcf/d of LNG, with ~ 8.5 Bcf/d of those volumes coming from the US, based on EIA data. The EIA expects US LNG exports to average ~ 11.9 Bcf/d this year and 12 Bcf/d in 2023. Europe accounted for just under 75% of US exports in January – April of this year, and we expect that to continue going forward. The IEA expects Russia to supply 25% of EU demand this year, the lowest in 20 years. Last year, Russian imports covered ~ 40% (~ 7 TCF) of EU demand. Base Metals: Zinc stocks are depleted but prices are dropping on recession fears (Chart 13). Smelting operations were hit last year following the power-supply crunches in China and Europe. While China has recovered its energy security, Europe, which accounts for ~15% of global refined zinc supply, has not. Reduced natgas supply from Russia will make the smelting shortage in Europe even more acute, especially if power and fuel rationing occur. In April, China was a net exporter of zinc for the first time since 2014, as low demand in the state and low European zinc supply incentivized Chinese smelters to ship metal to the West despite high outbound tariffs. Precious Metals: Markets switched from inflation to growth fears, as central banks, notably the Fed began hiking interest rates aggressively to curb inflation. Investors have been flocking to the USD, which hit a 20-year high on recession fears this week (Chart 14). This has happened at the expense of the yellow metal, which, since breaking through the USD 1800/oz mark last week, has continued to drop, hitting an 8-month low as of yesterday's close. Chart 13Global Copper Inventories Remain Tight
Global Copper Inventories Remain Tight
Global Copper Inventories Remain Tight
Chart 14
Copper Prices Decouple From Fundamentals
Copper Prices Decouple From Fundamentals
Footnotes 1 Please see China, US and EU are the largest economies in the world, which was published by Eurostat 19 May 2020. 2 For additional discussion of oil-market fundamentals, please see Recession Unlikely To Batter Oil Prices, which covers our expectation for global oil balances and prices. It was published 16 June 2022. 3 Please see Hypo-Globalization (A GeoRisk Update) published by BCA Research’s Geopolitical Strategy 30 July 2021. See also Commodities' Watershed Moment, which we published 22 March 2022. 4 Please see GDPNow, published by the Federal Reserve Bank of Atlanta 1 July 2022. 5 Please see Third Quarter Geopolitical Outlook: Thunder And Lightning, published by BCA’s Geopolitical Strategy 24 June 2022. This report notes, “China’s political crackdown, struggle with Covid-19, waning exports, and deflating property market have led to an abrupt slowdown this year. The government is responding by easing monetary, fiscal, and regulatory policy, though so far with limited effect … . Economic policy will not be decisive in the third quarter unless a crash forces the administration to stimulate aggressively.” 6 In August 2020, the Ministry of Housing and Urban-Rural Development and the People’s Bank of China proposed to implement a policy which kept a ceiling on companies’ asset to liability ratio at 70%, net debt to equity ratio at 100%, and cash to short-term borrowings ratio at 1. Developers whose liabilities are within these requirements may increase their liabilities by less than 15%. These were known as the “three red lines.” Per that policy, if one or more of these ceilings are surpassed, maximum liabilities growth is capped at a lower percentage. 7 Please see Add Local Politics To Copper Supply Risks, which we published 25 November 2021. It is available at ces.bcaresearch.com. See also Chile sticks to plan for new mining profit tax up to 32% linked to copper price, published by reuters.com via mining.com 1 July 2022. 8 Please see Norway’s government halts oil and gas strike published by ft.com 5 July 2022. Investment Views and Themes Strategic Recommendations Tactical Trades Trades Closed In 2022
Executive Summary Our recommended model bond portfolio outperformed its custom benchmark index by +24bps in Q2/2022, improving the year-to-date outperformance to a solid +72bps. The Q2 outperformance came entirely from the credit side of the portfolio (+35bps), led by underweights to US investment grade corporates (+28bps) and EM hard currency debt (+24bps). The rates side of the portfolio was down slightly (-11bps), with gains from underweights in US and UK inflation-linked bonds (a combined +24bps) helping offset the hit from overweights to German and French government bonds (a combined -30bps). Looking ahead, we continue to see more defensive positioning in growth-sensitive credit sectors like US investment grade corporate bonds and EM hard currency debt, rather than duration management, as providing the better opportunity to generate alpha in bond portfolios over the latter half of 2022. GFIS Model Bond Portfolio Recommended Positioning For The Next Six Months
GFIS Model Bond Portfolio Q2/2022 Review & Outlook: Winning By Playing Defense
GFIS Model Bond Portfolio Q2/2022 Review & Outlook: Winning By Playing Defense
Bottom Line: In our model bond portfolio, we are maintaining an overall neutral duration stance and a moderate underweight of spread product versus developed market sovereign bonds. We are, however, reducing the recommended tilts in inflation-linked bonds by upgrading US TIPS to neutral and downgrading Canadian linkers to neutral. Feature Dear Client, We are about to take a mid-summer publishing break, as this humble bond strategist moves his family into a new home in a new city. Next week, you will be receiving a report written by BCA Research’s Chief US Bond Strategist, Ryan Swift. The following week, there will be no Global Fixed Income Strategy report published. Our next report will be published on July 26, 2022. Regards, Rob Robis Bond investors are running out of places to hide to avoid losses in 2022. The total return on the Bloomberg Global Aggregate index (hedged into USD) in the second quarter of this year was -4%, nearly matching the -6% loss seen in Q1. No sector, from government bonds to corporate debt to emerging market credit, could avoid the damage caused by hawkish central bankers belated responding to the worst bout of global inflation since the 1970s. Related Report Global Fixed Income StrategyGFIS Model Bond Portfolio Q1/2022 Review & Outlook: Trading The Consolidation Phase Global inflation rates will soon peak, led by slowing growth of goods prices and commodity prices. However, inflation will remain well above central bank targets across the bulk of the developed world, supported by more domestic sources like services prices, housing costs and wages. This will limit the ability for important central banks like the Fed and ECB to quickly pivot in a more dovish direction to support weakening growth – and bail out foundering bond markets. With that backdrop in mind, we present our quarterly review of the BCA Research Global Fixed Income Strategy (GFIS) model bond portfolio for the second quarter of 2022. We also present our recommended positioning for the portfolio for the next six months, as well as portfolio return expectations for our base case and alternative investment scenarios. As a reminder to existing readers (and to new clients), the model portfolio is a part of our service that complements the usual macro analysis of global fixed income markets. The portfolio is how we communicate our opinion on the relative attractiveness between government bond and spread product sectors. We do this by applying actual percentage weightings to each of our recommendations within a fully invested hypothetical bond portfolio. Q2/2022 Model Bond Portfolio Performance: All About Credit Chart 1Q2/2022 Performance: Gains From Defensive Credit Positioning
Q2/2022 Performance: Gains From Defensive Credit Positioning
Q2/2022 Performance: Gains From Defensive Credit Positioning
The total return for the GFIS model portfolio (hedged into US dollars) in the second quarter was -4.3%, outperforming the custom benchmark index by +24bps (Chart 1).1 In terms of the specific breakdown between the government bond and spread product allocations in our model portfolio, the former generated -11bps of underperformance versus our custom benchmark index while the latter outperformed by +35bps. In our previous quarterly portfolio performance review in April, we noted that the greater opportunities to generate outperformance for fixed income investors would come from more defensive allocations to spread product, rather than big directional moves in government bond yields. That forecast largely panned out, as global credit markets moved to price in the growing risk of a deep economic downturn. Declining nominal government bond yields provided some modest relief at the end of June, with markets modestly pricing out some of the rate hikes discounted over the next year amid deepening global recession fears. While we maintained a neutral stance on overall portfolio duration during the quarter, we did benefit from the fact that the decline in global bond yields in late June was concentrated more in lower inflation expectations than falling real yields. Thus, our underweight positioning in inflation-linked bonds, focused on the US and UK, helped add a combined +25bps of outperformance versus the benchmark (Table 1). Table 1GFIS Model Bond Portfolio Q2/2022 Overall Return Attribution
GFIS Model Bond Portfolio Q2/2022 Review & Outlook: Winning By Playing Defense
GFIS Model Bond Portfolio Q2/2022 Review & Outlook: Winning By Playing Defense
The bar charts showing the total and relative returns for each individual government bond market and spread product sector in our model portfolio are presented in Charts 2 & 3. Chart 2GFIS Model Bond Portfolio Q2/2022 Government Bond Performance Attribution
GFIS Model Bond Portfolio Q2/2022 Review & Outlook: Winning By Playing Defense
GFIS Model Bond Portfolio Q2/2022 Review & Outlook: Winning By Playing Defense
Chart 3GFIS Model Bond Portfolio Q2/2022 Spread Product Performance Attribution By Sector
GFIS Model Bond Portfolio Q2/2022 Review & Outlook: Winning By Playing Defense
GFIS Model Bond Portfolio Q2/2022 Review & Outlook: Winning By Playing Defense
Biggest Outperformers: Underweight US investment grade Industrials (+19bps) Underweight UK index-linked Gilts (+15bps) Underweight US TIPS (+9bps) Underweight US investment grade Financials (+7bps) Underweight US MBS (+6bps) Underweight US Treasuries with maturities beyond ten years (+6bps) Biggest Underperformers: Overweight euro area investment grade corporates (-19bps) Overweight German government bonds with maturities beyond ten years (-14bps) Overweight French government bonds with maturities beyond ten years (-8bps) Overweight UK Gilts with maturities beyond ten years (-6bps) Overweight US CMBS (-4bps) Chart 4 presents the ranked benchmark index returns of the individual countries and spread product sectors in the GFIS model bond portfolio for Q2/2022. Returns are hedged into US dollars (we do not take active currency risk in this portfolio) and adjusted to reflect duration differences between each country/sector and the overall custom benchmark index for the model portfolio. We have also color coded the bars in each chart to reflect our recommended investment stance for each market during Q2 (red for underweight, dark green for overweight, gray for neutral). Chart 4Ranking The Winners & Losers From The GFIS Model Bond Portfolio Universe In Q2/2022
GFIS Model Bond Portfolio Q2/2022 Review & Outlook: Winning By Playing Defense
GFIS Model Bond Portfolio Q2/2022 Review & Outlook: Winning By Playing Defense
Ideally, we would look to see more green bars on the left side of the chart where market returns are highest, and more red bars on the right side of the chart were returns are lowest. That pattern largely held true in Q2/2022, especially at the tail ends of the chart. During a quarter where all the major asset classes in our portfolio lost money on a hedged and duration-matched basis, we outperformed by selectively underweighting the worst performers within the credit side of the benchmark portfolio universe. Notably, we were underweight EM USD-denominated Sovereigns (-1099bps), EM USD-denominated corporates (-816bps) and US investment grade corporates (-686bps) on the extreme right side of the chart. Some of our key overweight positions did relatively well, led by overweights in US CMBS (-148bps), Australian government bonds (-288bps) and euro area investment grade corporates (-378bps), all of which were on the left side of Chart 4. One of our key recommendations throughout the first half of 2022 - overweighting German government bonds (-517bps) and French government bonds (-657bps) versus underweighting US Treasuries (-283bps) - performed poorly in Q2. This was due to investors rapidly pricing in a far more aggressive series of ECB rate hikes than we expected, resulting in some convergence of US-European bond yield differentials. Importantly, core European bond yields have pulled back substantially over the last month, and by much more than US yields have declined. Most notably, the 2-year German yield, which began Q2 at minus-7bps and hit a peak of 1.2% on June 14, has now fallen all the way back to 0.4% as this report went to press. The 2-year US-Germany yield differential has already widened by 35bps in the first week of July, suggesting that our overweight core Europe/underweight US allocation is already contributing positively to the model bond portfolio returns for Q3. Bottom Line: Our model bond portfolio outperformed its benchmark index in the second quarter of the year by +24bps – a positive result coming largely from underweight positions in US corporate bonds, EM spread product and inflation-linked bonds in the US and UK. Future Drivers Of Model Bond Portfolio Returns Just as in Q2/2022, the performance of the model bond portfolio in Q3/2022 will be driven more by relative allocations between countries and spread product sectors, rather than big directional moves in bond yields or credit spreads. Overall Duration Exposure Chart 5A More Stable Backdrop For Global Bond Yields
A More Stable Backdrop For Global Bond Yields
A More Stable Backdrop For Global Bond Yields
In terms of portfolio duration, we still see a stronger case for global bond yields to be more rangebound than trending, especially in the US. There has already been a major downward adjustment to global bond yields via lower inflation expectations and reduced rate hike expectations. A GDP-weighted average of major developed market 10-year inflation breakevens has already fallen from an April 2022 peak of 281bps to 216bps (Chart 5). That aggregate breakeven is now back to the levels that began 2022, before the Russian invasion of Ukraine that triggered a surge in global energy prices. We anticipate that additional declines in global inflation expectations – and the associated reductions in central bank rate hike expectations – will be harder to achieve over the latter half of 2022. “Stickier” inflation from services, housing costs and wages will remain strong enough to keep overall inflation rates above central bank targets, even as decelerating goods and commodity price inflation act to slow headline inflation rates. Our Global Duration Indicator, which is comprised of growth indicators like the ZEW expectations index for the US and Europe as well as our own global leading economic indicator, has fallen substantially and is signaling a decline in global bond yield momentum once realized inflation rates peak (Chart 6). Chart 6Our Duration Indicator Calling For Slowing Global Yield Momentum
Our Duration Indicator Calling For Slowing Global Yield Momentum
Our Duration Indicator Calling For Slowing Global Yield Momentum
Chart 7Overall Portfolio Duration: Stay Neutral
Overall Portfolio Duration: Stay Neutral
Overall Portfolio Duration: Stay Neutral
We see that as signaling more of a sideways action in bond yields over the next six months, rather than a big downward move, especially in the US. Thus, we are keeping the duration of the model bond portfolio close to that of the benchmark index (Chart 7). Government Bond Country Allocation We are sticking with our view that, for countries with active central banks (i.e. everyone but Japan), favoring markets where interest rate expectations are above plausible estimates of neutral policy rates should lead to outperformance from country allocation. In Chart 8, we show 10-year bond yields and 2-years-forward 1-month Overnight Index Swap (OIS) rates for the US, euro area, UK, Canada and Australia. The shaded regions in the chart represent estimates of the range of neutral policy rates. In the case of the US, rate expectations and Treasury yields are now below the upper level of the range of neutral fed funds rates estimates, between 2-3%, taken from the latest set of FOMC economic projections. Hence, we are sticking with an underweight stance on US Treasuries with yields offering less protection against the Fed following through on its current guidance and lifting the funds rate into restrictive territory above 3%. In the other countries, rate expectations are above the range of neutral rate estimates, which suggests that bond yields have a bit more protection against hawkish central bank actions. That leads us to stay overweight core Europe, the UK and Australia in the government bond portion of the model bond portfolio. We are only keeping Canada at neutral, however, as we suspect that the Bank of Canada is more willing than other central banks to follow the Fed’s lead on taking rates to a restrictive level to help bring down elevated Canadian inflation. For other countries, we are staying neutral on Italian government bond exposure, for now, and underweight Japan (Chart 9). Chart 8Favor Countries Where Markets Expect Above-Neutral Rates
Favor Countries Where Markets Expect Above-Neutral Rates
Favor Countries Where Markets Expect Above-Neutral Rates
Chart 9Underweight JGBs, Stay Neutral Italy (For Now)
Underweight JGBs, Stay Neutral Italy (For Now)
Underweight JGBs, Stay Neutral Italy (For Now)
For Italy, we await news from the July 21 ECB meeting on the details of a proposal to help support Italian bond markets in the event of additional yield increases or spread widening versus Germany. It is clear from the history of the past decade that Italian bond returns suffer when the ECB is either hiking rates or slowing the growth of its balance sheet (top panel). In other words, it is difficult to recommend overweighting Italian bonds without the support of easy ECB monetary policy. Chart 10Our Inflation-Linked Bond Country Allocations
Our Inflation-Linked Bond Country Allocations
Our Inflation-Linked Bond Country Allocations
For Japan, our recommendation is strictly related to our view on the move in overall global bond yields. The Bank of Japan is bucking the worldwide trend to tighten monetary policy because core Japanese inflation remains weak. This makes Japanese government bonds (JGBs) a good place for bond investors to “hide out” in when global bond yields are rising. Given our view that global bond yield momentum will slow – in line with the signal from our Global Duration Indicator – we do not see a strong cyclical case for overweighting low-yielding JGBs. On inflation-linked bonds, we are maintaining a cautious overall stance, with commodity prices decelerating, realized inflation momentum set to soon peak and central banks signaling more tightening ahead (Chart 10). This week, we are closing out our lone overweight recommendation on inflation-linked bonds in Canada, where we downgrading to neutral (3 out of 5, see the model bond portfolio table on page 24).2 At the same time, we are neutralizing our underweight stance on US TIPS, moving the allocation to neutral. We still see shorter-term TIPS breakevens as having downside from here, but longer-maturity breakevens have already made enough of a downward adjustment, in our view. Global Spread Product Turning to credit markets, we are maintaining our moderately cautious view on the overall allocation to credit versus government bonds. Slowing global growth momentum and tightening global monetary policy is not an environment where credit spreads can narrow, especially for growth-sensitive credit like corporate bonds and high-yield (Chart 11). Having said that – the spread widening seen in US and European corporate bond markets has introduced a better valuation cushion into spreads. Our preferred measure of spread product valuation – the historical percentile ranking of the 12-month breakeven spread – shows that investment grade spreads in the euro area are now in the top quartile (85%) of its history on a risk-adjusted basis (Chart 12). US investment grade spreads are now up into the second quartile (64%), which is a big improvement from the start of 2022 but not as much as seen in Europe. Chart 11Global Monetary Backdrop Turning More Negative For Credit
Global Monetary Backdrop Turning More Negative For Credit
Global Monetary Backdrop Turning More Negative For Credit
Chart 12Corporate Spread Valuations Have Improved In The US & Europe
Corporate Spread Valuations Have Improved In The US & Europe
Corporate Spread Valuations Have Improved In The US & Europe
European credit spreads likely need to be wide as a risk premium against the numerous risks the region is facing right now – slowing growth, an increasingly hawkish ECB, soaring energy prices and the lingering uncertainties stemming from the Ukraine war. However, a lot of bad news is now discounted in European spreads and, as a result, we are maintaining our overweight stance on European investment grade corporates, especially versus US investment grade where we remain underweight. High-yield spreads on both sides of the Atlantic look more attractive on a 12-month breakeven spread basis, but also on a default-adjusted spread basis (Chart 13). Assuming a moderate increase in the high-yield default rates in the US and Europe - consistent with a sharp slowing of economic growth but no deep recession - the current level of high-yield spreads net of expected default losses over the next year is above long-run averages. It is too soon to move to an overweight stance on high-yield, with the Fed and ECB set to tighten more amid ongoing growth uncertainty, but given the improved valuation cushion we see a neutral allocation to junk in both the US and Europe as appropriate in our model portfolio. Chart 13Junk Spreads Offer Value If Recession Can Be Avoided
Junk Spreads Offer Value If Recession Can Be Avoided
Junk Spreads Offer Value If Recession Can Be Avoided
Finally, we remain comfortably underweight emerging market USD-denominated sovereign and corporate debt. The backdrop is poor for emerging market bond returns, given slowing global growth, softening commodity prices, a tightening Fed and a strengthening US dollar (Chart 14). Chart 14Staying Cautious On EM Debt Exposure
Staying Cautious On EM Debt Exposure
Staying Cautious On EM Debt Exposure
Summing It All Up The full list of our recommended portfolio allocations can be seen in Table 2. The portfolio enters the second half of 2022 with the following high-level characteristics: Table 2GFIS Model Bond Portfolio Recommended Positioning For The Next Six Months
GFIS Model Bond Portfolio Q2/2022 Review & Outlook: Winning By Playing Defense
GFIS Model Bond Portfolio Q2/2022 Review & Outlook: Winning By Playing Defense
Chart 15Overall Portfolio Allocation: Underweight Spread Product Vs Governments
GFIS Model Bond Portfolio Q2/2022 Review & Outlook: Winning By Playing Defense
GFIS Model Bond Portfolio Q2/2022 Review & Outlook: Winning By Playing Defense
the overall duration exposure remains at-benchmark (i.e. neutral) the portfolio has an underweight allocation to overall spread products versus government bonds, equal to four percentage points of the portfolio (Chart 15) the tracking error of the portfolio, or its expected volatility in excess of that of the benchmark, is 77bps – below our self-imposed 100bps tracking error limit (Chart 16) the portfolio now has a yield below that of the custom benchmark index, equal to -31bps on a currency-unhedged basis but a more modest “carry gap” of -10bps on a USD-hedged basis given the gains from hedging into USD (Chart 17). Chart 16Overall Portfolio Risk: Moderate
Overall Portfolio Risk: Moderate
Overall Portfolio Risk: Moderate
Chart 17Overall Portfolio Yield: Below-Benchmark
Overall Portfolio Yield: Below-Benchmark
Overall Portfolio Yield: Below-Benchmark
Bottom Line: Looking ahead, our model bond portfolio performance will continue to be driven by the same factors in Q3/2022 as in the previous quarter: the relative performance of US bonds versus European equivalents for both government debt and corporate bonds, and the path for emerging market credit spreads. Portfolio Scenario Analysis For The Next Six Months After making the modest changes to our inflation-linked bond allocations in the US and Canada, which can be seen in the tables on pages 23-24, we now turn to our regularly quarterly scenario analysis to determine the return expectations for the portfolio for the next six months. On the credit side of the portfolio, we use risk-factor-based regression models to forecast future yield changes for global spread product sectors as a function of four major factors - the VIX, oil prices, the US dollar and the fed funds rate (Table 3A). For the government bond side of the portfolio, we avoid using regression models and instead use a yield-beta driven framework, taking forecasts for changes in US Treasury yields and translating those in changes in non-US bond yields by applying a historical yield beta (Table 3B). Table 3AFactor Regressions Used To Estimate Spread Product Yield Changes
GFIS Model Bond Portfolio Q2/2022 Review & Outlook: Winning By Playing Defense
GFIS Model Bond Portfolio Q2/2022 Review & Outlook: Winning By Playing Defense
Table 3BEstimated Government Bond Yield Betas To US Treasuries
GFIS Model Bond Portfolio Q2/2022 Review & Outlook: Winning By Playing Defense
GFIS Model Bond Portfolio Q2/2022 Review & Outlook: Winning By Playing Defense
For our scenario analysis over the next six months, we use a base case scenario plus two alternate “tail risk” scenarios. In the current environment, our scenarios center around the pace of global growth. Base Case (Slow Global Growth) Global growth momentum slows substantially, with firms cutting back on hiring and investing activity due to slowing corporate profit growth. An outright recession is avoided because softening energy prices help ease the drag on real spending power for consumers. China introduces more monetary and fiscal stimulus measures to boost growth. Global inflation peaks and eases on the back of slowing growth of goods prices and commodity prices, but the floor on inflation in the US and other developed markets is higher than central bank inflation targets due to sticky domestic price pressures. The Fed continues to hike at every policy meeting in H2/2022. There is a very mild bear flattening of the US Treasury curve, but with longer-term yields remain broadly unchanged over the full six month scenario period with the Fed not hiking by more than currently discounted. The Brent oil price retreats by -10%, the US dollar modestly appreciates by 2%, the VIX stays close to current levels at 28 and the fed funds rate reaches 3.25% by year-end. Resilient Growth Scenario Consumer spending surprises to the upside in the US and even Europe, as softer momentum of energy prices eases the relentless downward pressure on real incomes. Labor demand remains sold across the developed world, particularly with firms reluctant to do mass layoffs because of a perceived scarcity of quality labor. China enacts more policy stimulus with growth likely to fall below 2022 government targets. The Fed is forced to be more aggressive on rate hikes, given resilient US growth and inflation staying well above the Fed’s 2% target. The US Treasury curve bear-flattens into outright inversion, but with Treasury yields rising across the curve. The Brent oil price rises +20%, the VIX index climbs to 30, the US dollar appreciates by +3% thanks to a more aggressive Fed that lifts the funds rate to 3.75% by year-end. Recession Scenario A toxic combination of contracting corporate profits and negative real income growth drags the major developed economies into outright recession. Global inflation rates slow rapidly from current elevated levels, fueled by a rapid decline in commodity prices, but remain above central bank targets making it hard for the Fed and other major central banks to pivot dovishly to support growth. Chinese policymakers belatedly act to ease monetary and fiscal policy, but not by enough to offset the slow response from developed market policymakers. The Treasury curve moderately bull-steepens, although the absolute decline in nominal Treasury yields is relatively modest as the Fed will not pivot quickly to signaling policy easing with inflation still likely to remain above 2%. The Brent oil price falls -20%, the VIX index soars to 35, the US dollar depreciates by -3% (as lower US rates win out over slowing global growth) and the Fed pushes the funds rate to 2.75% before pausing after September. The excess return scenarios for the model bond portfolio, using the above inputs in our simple quantitative return forecast framework, are shown in Table 4A. The US Treasury yield assumptions are shown in Table 4B. For the more visually inclined, we present charts showing the model inputs and Treasury yield projections in Chart 18 and Chart 19, respectively. Table 4AGFIS Model Bond Portfolio Scenario Analysis For The Next Six Months
GFIS Model Bond Portfolio Q2/2022 Review & Outlook: Winning By Playing Defense
GFIS Model Bond Portfolio Q2/2022 Review & Outlook: Winning By Playing Defense
Table 4BUS Treasury Yield Assumptions For The 6-Month Forward Scenario Analysis
GFIS Model Bond Portfolio Q2/2022 Review & Outlook: Winning By Playing Defense
GFIS Model Bond Portfolio Q2/2022 Review & Outlook: Winning By Playing Defense
Chart 18Risk Factor Assumptions For The Scenario Analysis
Risk Factor Assumptions For The Scenario Analysis
Risk Factor Assumptions For The Scenario Analysis
Chart 19US Treasury Yield Assumptions For The Scenario Analysis
US Treasury Yield Assumptions For The Scenario Analysis
US Treasury Yield Assumptions For The Scenario Analysis
Given our neutral overall duration stance, the return scenarios will be driven by mostly by the credit side of the portfolio. In the recession scenario where Treasury yields decline, there is a modest projected outperformance from the rates side of the portfolio coming through the underweight to low-beta JGBs. In all scenarios, financial market volatility is expected to stay at, or above, current levels as central banks will be unable to ease policy, even in the event of an actual recession, because of lingering high inflation. Thus, the return on the credit side of the model portfolio will be the main driver of performance, delivering a range of excess return outcomes between +47bps and +60bps. Bottom Line: The model bond portfolio should benefit in H2/2022 from the ongoing cautious stance on global spread product, focused on underweights to US investment grade corporates and EM hard currency debt. Robert Robis, CFA Chief Fixed Income Strategist rrobis@bcaresearch.com Footnotes 1 The GFIS model bond portfolio custom benchmark index is the Bloomberg Barclays Global Aggregate Index, but with allocations to global high-yield corporate debt replacing very high-quality spread product (i.e. AA-rated). We believe this to be more indicative of the typical internal benchmark used by global multi-sector fixed income managers. 2 We are also closing out our Canadian breakeven widening trade in our Tactical Overlay portfolio. GFIS Model Bond Portfolio Recommended Positioning Active Duration Contribution: GFIS Recommended Portfolio Vs. Custom Performance Benchmark
GFIS Model Bond Portfolio Q2/2022 Review & Outlook: Winning By Playing Defense
GFIS Model Bond Portfolio Q2/2022 Review & Outlook: Winning By Playing Defense
The GFIS Recommended Portfolio Vs. The Custom Benchmark Index Global Fixed Income - Strategic Recommendations*
GFIS Model Bond Portfolio Q2/2022 Review & Outlook: Winning By Playing Defense
GFIS Model Bond Portfolio Q2/2022 Review & Outlook: Winning By Playing Defense
Executive Summary Buying a home is now more expensive than renting in many parts of the world. In the US and UK, disappearing homebuyers combined with a flood of home-sellers will weigh on home prices over the next 6-12 months. Falling employment and falling house prices risk becoming a self-reinforcing negative feedback loop that turns a mild recession into a severe recession. To stop such a vicious cycle running out of control, policymakers will eventually bring down mortgage rates. For this reason, on a time horizon of 6-12 months, overweight bonds. A collapse in Chinese property development and construction activity will have negative long-term implications for commodities, emerging Asia, and developing countries that produce raw materials. Structurally underweight. On the other hand, stay structurally overweight the China 30-year government bond. Fractal trading watchlist: US Biotech versus Utilities. Buying A Home Is Now More Expensive Than Renting!
Buying A Home Is Now More Expensive Than Renting!
Buying A Home Is Now More Expensive Than Renting!
Bottom Line: The decade-long global housing boom is over. Feature For the first time since 2018, the number of Brits wanting to buy a home is less than the number of Brits wanting to sell their home. The balance of homebuyers versus homes for sale is the main driver of any housing market. When multiple homebuyers are competing for a home for sale, the subsequent bidding war puts upward pressure on house prices. But when, multiple homes for sale are competing for a homebuyer, the subsequent discounting war puts downward pressure on house prices. The balance of homebuyers versus homes for sale is the main driver of any housing market. This makes the number of homebuyers versus homes for sale the best leading indicator of house prices. The recent collapse of this leading indicator in the UK warns that UK house prices are likely to soften through the remainder of 2022 and into 2023 (Chart I-1). Chart I-1With Fewer UK Homebuyers Than UK Home-Sellers, UK House Prices Are Set To Drop
With Fewer UK Homebuyers Than UK Home-Sellers, UK House Prices Are Set To Drop
With Fewer UK Homebuyers Than UK Home-Sellers, UK House Prices Are Set To Drop
Homebuyers Are Disappearing While Home-Sellers Are Flooding The Market Disappearing homebuyers combined with a flood of home-sellers is also evident in the US. According to Realtor.com: “Weary US homebuyers face not only sky-high home prices but also rising mortgage rates, and that financial double whammy is hitting homebuyers hard: Compared with just a year ago, the cost of financing 80 percent of a typical home rose 57.6 percent, amounting to an extra $745 per month.” Compared with just a year ago, the cost of financing 80 percent of a typical US home rose 57.6 percent, amounting to an extra $745 per month. Unsurprisingly, US mortgage applications for home purchase have recently plunged by a third (Chart I-2) and homebuyer demand has declined by 16 percent since last June.1 Meanwhile, the inventory of homes actively for sale on a typical day in June has increased by 19 percent, the largest increase in the data history. Chart I-2With The Cost Of Financing A US Home Purchase Surging, Mortgage Applications Have Collapsed
With The Cost Of Financing A US Home Purchase Surging, Mortgage Applications Have Collapsed
With The Cost Of Financing A US Home Purchase Surging, Mortgage Applications Have Collapsed
The flood of new homes on the market means that the dwindling pool of homebuyers will have more negotiating leverage on the asking price (Chart I-3 and Chart I-4). This will balance the highly lopsided negotiating dynamics in the raging seller’s market of the past two years. The shape of things to come can be seen in Austin, Texas, which was one of the hottest markets during the early pandemic real estate frenzy. Chart I-3US Homebuyers Are Disappearing...
US Homebuyers Are Disappearing...
US Homebuyers Are Disappearing...
Chart I-4...While US Home-Sellers Are Flooding The Market
...While US Home-Sellers Are Flooding The Market
...While US Home-Sellers Are Flooding The Market
“Prices are definitely starting to go down again… last Friday, an Austin home was listed at $825,000. The next day, at the open house, no one came. A few months ago, there would have been 20 or more buyers showing up. The sellers didn’t want to test the market, so on Sunday, they dropped it to $790,000. It sold for $760,000.” Buying A Home Is Now More Expensive Than Renting The nub of the problem for homebuyers is that the mortgage rate is higher than the rental yield. In simple terms, buying a home is now more expensive than renting (Chart I-5). The housing bulls counter that the high mortgage rate will force rental yields to adjust upwards by rents going up, but this argument is flawed. Chart I-5Buying A Home Is Now More Expensive Than Renting!
Buying A Home Is Now More Expensive Than Renting!
Buying A Home Is Now More Expensive Than Renting!
The most important driver of rent inflation is the unemployment rate (inversely). Because, to put it bluntly, you need a steady job to pay the rent! Today, the Federal Reserve’s inflation problem, in a nutshell, is that rent inflation is too high even versus the tight jobs market (Chart I-6). Chart I-6The Fed Needs To Push Up Unemployment To Pull Down Rent Inflation
The Fed Needs To Push Up Unemployment To Pull Down Rent Inflation
The Fed Needs To Push Up Unemployment To Pull Down Rent Inflation
Although the Fed cannot say this explicitly, its mechanism to bring down inflation is to push up unemployment, and thereby to pull down rent inflation, which constitutes almost half of the core inflation basket. In this case, the rental yield (rent divided by house price) would adjust upwards by the denominator – house prices – going down. The most important driver of rent inflation is the unemployment rate (inversely). Yet the housing bulls also argue that the housing boom is the result of a structural undersupply of homes. They claim that as this structural undersupply persists, it will underpin house prices. But this ‘housing shortage’ narrative is another myth, which we can debunk with two simple observations. Through the past decade, home prices have risen simultaneously and exponentially everywhere in the world. Now ask yourself, is it plausible that there could be a structural undersupply of homes everywhere in the world at the precisely the same time? If this doesn’t debunk the housing shortage narrative, then try this second observation. Through the past decade, gross rents have tracked nominal GDP. Theory says that gross rents should track nominal GDP, because the quality of the housing stock improves broadly in line with GDP, and therefore so too should rents. If there really was a structural undersupply of housing, then gross rents would be structurally outperforming nominal GDP. But that hasn’t happened in any major economy (Chart I-7). Chart I-7Rents Have Tracked GDP, So There Is No 'Structural Undersupply' Of Homes
Rents Have Tracked GDP, So There Is No 'Structural Undersupply' Of Homes
Rents Have Tracked GDP, So There Is No 'Structural Undersupply' Of Homes
As an aside, if rents track GDP, then why do they constitute almost half of the core inflation basket? The answer is that the rents included in inflation are ‘hedonically adjusted’, meaning that are supposedly deflated for quality improvements – though there is always a niggling doubt whether the statisticians do this adjustment correctly! Pulling all of this together, the synchronized global housing boom of the past decade was not the result of a structural undersupply. Instead, it was the result of a valuation boom – meaning, plummeting rental yields, which in turn were the result of plummeting mortgage rates, which in turn were the result of plummeting bond yields. But now that mortgage rates are much higher than rental yields, this ‘virtuous’ cycle risks turning vicious. Falling employment and falling house prices risk becoming a self-reinforcing negative feedback loop that turns a mild recession into a severe recession. To stop such a vicious cycle running out of control, policymakers will eventually have no other choice than to bring down mortgage rates. For this reason, on a time horizon of 6-12 months, overweight bonds. But The Prize For The Biggest Housing Boom Goes To… China The housing booms in the UK, US and other Western economies, extreme as they are, are small fry compared to the housing boom in China. Chinese real estate, now worth $100 trillion, is by far the largest asset-class in the world. And Chinese rental yields, at around 1 percent, are well below the yield on cash. Begging the question, how can Chinese real estate valuations be in such stratospheric territory, with a yield even less than that on ‘risk-free’ cash? The simple answer is that investors have been led to believe that Chinese real estate is a risk-free investment! Without a social safety net and with limited places to park their money, Chinese savers have for years been encouraged to buy homes, in the widespread belief that property is the safest investment, whose price is only supposed to go up (Chart I-8). Chart I-8Chinese Real Estate Is Perceived To Be A 'Risk Free' Investment
Chinese Real Estate Is Perceived To Be A 'Risk Free' Investment
Chinese Real Estate Is Perceived To Be A 'Risk Free' Investment
With the bulk of Chinese households’ wealth in property acting as a perceived economic safety net, even a 10 percent decline in house prices would constitute a major shock to the household sector’s hopes and expectations of what property is. In turn, the ensuing ‘negative wealth effect’ would be catastrophic for household spending in the world’s second largest economy. Therefore, in contrast to the US housing debacle in 2008, the Chinese government will ensure that its property market adjustment does not come from a collapse in home prices. Rather, it will come from a collapse in property development and construction activity, combined with keeping interest rates structurally low. This will have negative long-term implications for commodities, emerging Asia, and developing countries that produce raw materials. Structurally underweight. On the other hand, Chinese bonds are an excellent investment for those investors who can accept the capital control risks. Stay structurally overweight the China 30-year government bond. Fractal Trading Watchlist Biotech and Utilities are both defensive sectors, based on the insensitivity of theirs profits to economic fluctuations. But whereas Biotech is ‘long duration’, Utilities is ‘shorter duration’. Over the coming months, as the economy falters and bond yields back down, long duration defensives, such as Biotech, are likely to be the winners. This is supported by the recent underperformance reaching the point of fractal fragility that has indicated previous major turning points (Chart I-9). The recommended trade is long US Biotech versus Utilities, setting a profit target and symmetrical stop-loss at 20 percent. This replaces our long US Biotech versus Tech position, which achieved its 17.5 percent profit target, and is now closed. Chart I-9Biotech Is Set To Be A Big Winner
Biotech Is Set To Be A Big Winner
Biotech Is Set To Be A Big Winner
Chart 1CNY/USD Has Reversed
CNY/USD Has Reversed
CNY/USD Has Reversed
Chart 2US REITS Are Oversold Versus Utilities
US REITS Are Oversold Versus Utilities
US REITS Are Oversold Versus Utilities
Chart 3CAD/SEK Reversal Has Started
CAD/SEK Reversal Has Started
CAD/SEK Reversal Has Started
Chart 4Financials Versus Industrials To Reverse
Financials Versus Industrials To Reverse
Financials Versus Industrials To Reverse
Chart 5The Outperformance Of Resources Versus Biotech Has Started To Reverse
The Outperformance Of Resources Versus Biotech Has Started To Reverse
The Outperformance Of Resources Versus Biotech Has Started To Reverse
Chart 6The Outperformance Of Resources Versus Healthcare Is Vulnerable To Reversal
The Outperformance Of Resources Versus Healthcare Is Vulnerable To Reversal
The Outperformance Of Resources Versus Healthcare Is Vulnerable To Reversal
Chart 7FTSE100 Outperformance Vs. Euro Stoxx 50 Is Reversing
FTSE100 Outperformance Vs. Euro Stoxx 50 Is Reversing
FTSE100 Outperformance Vs. Euro Stoxx 50 Is Reversing
Chart 8Netherlands Underperformance Vs. Switzerland Has Been Exhausted
Netherlands Underperformance Vs. Switzerland Has Been Exhausted
Netherlands Underperformance Vs. Switzerland Has Been Exhausted
Chart 9The Sell-Off In The 30-Year T-Bond Is Approaching Fractal Fragility
The Sell-Off In The 30-Year T-Bond Is Approaching Fractal Fragility
The Sell-Off In The 30-Year T-Bond Is Approaching Fractal Fragility
Chart 10The Sell-Off In The NASDAQ Is Approaching Fractal Fragility
The Sell-Off In The NASDAQ Is Approaching Fractal Fragility
The Sell-Off In The NASDAQ Is Approaching Fractal Fragility
Chart 11Food And Beverage Outperformance Has Been Exhausted
Food And Beverage Outperformance Has Been Exhausted
Food And Beverage Outperformance Has Been Exhausted
Chart 12AT REVERSAL
AT REVERSAL
AT REVERSAL
Chart 13AT REVERSAL
AT REVERSAL
AT REVERSAL
Chart 14The Strong Trend In The 18-Month-Out US Interest Rate Future Is Fragile
The Strong Trend In The 18-Month-Out US Interest Rate Future Is Fragile
The Strong Trend In The 18-Month-Out US Interest Rate Future Is Fragile
Chart 15The Strong Trend In The 3 Year T-Bond Is Fragile
The Strong Trend In The 3 Year T-Bond Is Fragile
The Strong Trend In The 3 Year T-Bond Is Fragile
Chart 16A Potential Switching Point From Tobacco Into Cannabis
A Potential Switching Point From Tobacco Into Cannabis
A Potential Switching Point From Tobacco Into Cannabis
Chart 17Biotech Is A Major Buy
Biotech Is A Major Buy
Biotech Is A Major Buy
Chart 18Norway's Outperformance Could End
Norway's Outperformance Could End
Norway's Outperformance Could End
Chart 19Cotton's Outperformance Is Vulnerable To Reversal
Cotton's Outperformance Is Vulnerable To Reversal
Cotton's Outperformance Is Vulnerable To Reversal
Chart 20Fractal Trading Watch List
Fractal Trading Watch List
Fractal Trading Watch List
Chart 21The Rally In USD/EUR Could End
The Rally In USD/EUR Could End
The Rally In USD/EUR Could End
Chart 22The Outperformance Of MSCI Hong Kong Versus China Is Vulnerable To Reversal
The Outperformance Of MSCI Hong Kong Versus China Is Vulnerable To Reversal
The Outperformance Of MSCI Hong Kong Versus China Is Vulnerable To Reversal
Chart 23A Potential New Entry Point Into Petcare
A Potential New Entry Point Into Petcare
A Potential New Entry Point Into Petcare
Chart 24GBP/USD At A Turning Point
GBP/USD At A Turning Point
GBP/USD At A Turning Point
Chart 25Fractal Trading Watch List
Fractal Trading Watch List
Fractal Trading Watch List
Chart 26Fractal Trading Watch List
Fractal Trading Watch List
Fractal Trading Watch List
Dhaval Joshi Chief Strategist dhaval@bcaresearch.com Footnotes 1 Realtor.com gauge homebuyer demand by so-called ‘pending listings’, the number of listings that are at various stages of the selling process that are not yet sold. Fractal Trading System Fractal Trades
The Global Housing Boom Is Over, As Buying Becomes More Expensive Than Renting
The Global Housing Boom Is Over, As Buying Becomes More Expensive Than Renting
The Global Housing Boom Is Over, As Buying Becomes More Expensive Than Renting
The Global Housing Boom Is Over, As Buying Becomes More Expensive Than Renting
6-12 Month Recommendations Structural Recommendations Closed Fractal Trades Indicators To Watch - Bond Yields Chart II-1Indicators To Watch - Bond Yields - Euro Area
Indicators To Watch - Bond Yields - Euro Area
Indicators To Watch - Bond Yields - Euro Area
Chart II-2Indicators To Watch - Bond Yields - Europe Ex Euro Area
Indicators To Watch - Bond Yields - Europe Ex Euro Area
Indicators To Watch - Bond Yields - Europe Ex Euro Area
Chart II-3Indicators To Watch - Bond Yields - Asia
Indicators To Watch - Bond Yields - Asia
Indicators To Watch - Bond Yields - Asia
Chart II-4Indicators To Watch - Bond Yields - Other Developed
Indicators To Watch - Bond Yields - Other Developed
Indicators To Watch - Bond Yields - Other Developed
Indicators To Watch - Interest Rate Expectations Chart II-5Indicators To Watch - Interest Rate Expectations
Indicators To Watch - Interest Rate Expectations
Indicators To Watch - Interest Rate Expectations
Chart II-6Indicators To Watch - Interest Rate Expectations
Indicators To Watch - Interest Rate Expectations
Indicators To Watch - Interest Rate Expectations
Chart II-7Indicators To Watch - Interest Rate Expectations
Indicators To Watch - Interest Rate Expectations
Indicators To Watch - Interest Rate Expectations
Chart II-8Indicators To Watch - Interest Rate Expectations
Indicators To Watch - Interest Rate Expectations
Indicators To Watch - Interest Rate Expectations
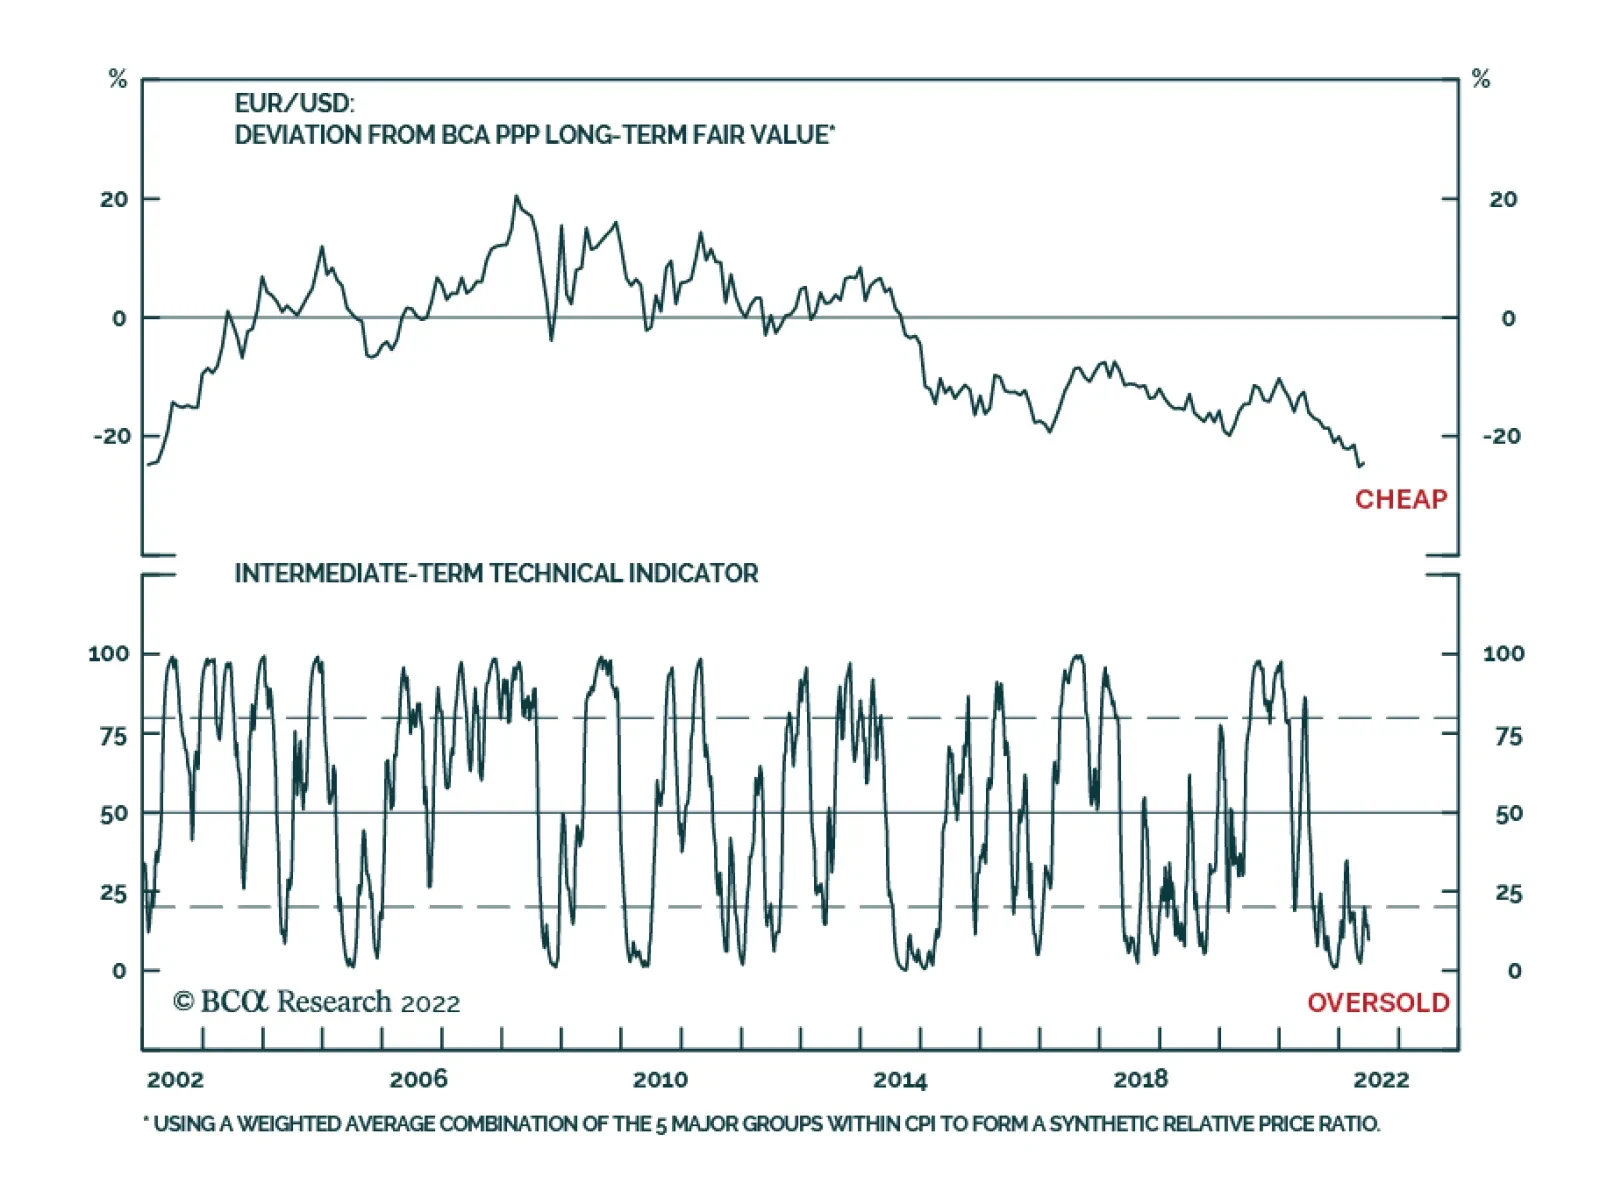
EUR/USD continues to sink lower and is on the cusp of parity. To a great extent, this weakness reflects broad-based dollar-strength. As we recently highlighted, the ADXY – a trade-weighted index of emerging Asia’s most actively traded currencies vis-à-vis the…
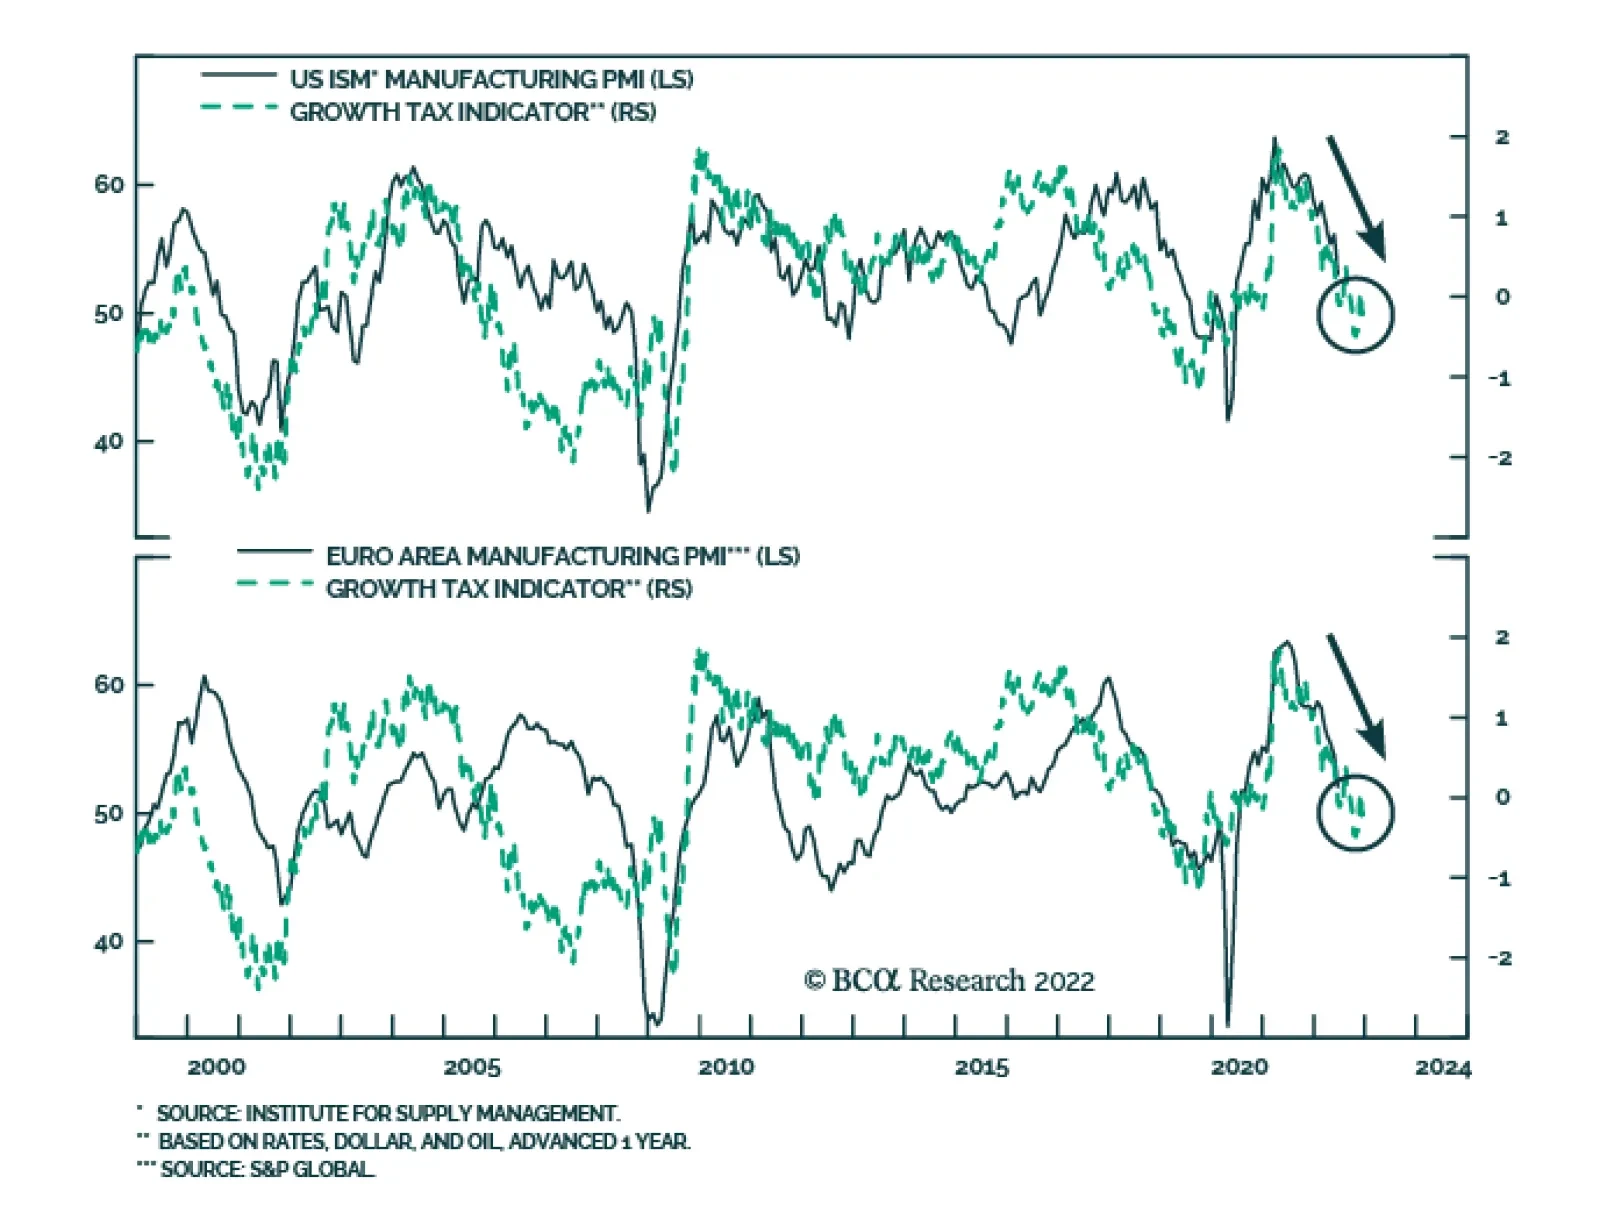
According to BCA Research’s European Investment Strategy service, the risk-reward ratio over the coming twelve months leans increasingly in favor of European risk assets. The EURO STOXX 50 has plunged 22% from its January 5th high, the euro is down to 1.04…
Executive Summary China: GeoRisk Indicator
China: GeoRisk Indicator
China: GeoRisk Indicator
A new equilibrium between NATO, which now includes Sweden and Finland, and Russia needs to be reestablished before geopolitical risks in Europe subside. Russia aims to inflict a recession on the EU which will revive dormant geopolitical risks embedded in each country. Investors should ignore the apparent drop in China’s geopolitical risk as it could rise further until Xi Jinping consolidates power at the Party Congress this fall. Stay on the sideline on Brazilian, South African, Australian, and Canadian equities despite the commodity bull market, at least until China’s growth stabilizes. Korean risk will rise, albeit by less than Taiwanese risk. The US political cycle ensures that Biden may take further actions against adversaries in Europe, Middle East, and East Asia, putting a floor under global geopolitical risk. Tactical Recommendation Inception Date Return LONG GLOBAL AEROSPACE & DEFENSE / BROAD MARKET EQUITIES 2020-11-27 9.3% Bottom Line: Geopolitical risk will rise in the near term. Stay long gold and global defensive stocks. Feature This month we update our GeoRisk Indicators and make observations about the status of political risk for each territory, and where risks are underrated or overrated by global financial markets. Russia GeoRisk Indicator Our “Original” quantitative measure of Russian political risk – the Russian “geopolitical risk premium” shown in the dotted red line below – has fallen to new lows (Chart 1). One must keep in mind that this geopolitical premium is operating under the assumption of a “free market” but the Russian market in the past few months had been anything but free. The Russian government and central bank had been manipulating the ruble and preventing capital outflows. Hence, Russian assets and any indicator derived from it does not reflect its true risk premium, merely the resolve of its government in the geopolitical struggle. Chart 1Russia: GeoRisk Indicator
Russia: GeoRisk Indicator
Russia: GeoRisk Indicator
While the Russia Risk Premium accurately detected the build-up in tensions before the invasion of Ukraine this year, today it gives the misleading impression that Russian geopolitical risk is low. In reality the risk level remains high due to the lack of strategic stability between Russia and the West, particularly the United States, and particularly over the question of NATO enlargement. Our “Old” Russia GeoRisk Indicator remains elevated but has slightly fallen back. This measure failed to detect the rise in risk ahead of this year’s invasion of Ukraine. We predicted the war based on non-market variables, including qualitative analysis. As a result of the failure of our indicator, we devised a “New” Russia GeoRisk Indicator after this year’s invasion, shown as the green line below. This measure provides the most accurate reading. It is pushing the upper limits, which we truncated at 4, as it did during the invasion of Georgia in 2008 and initial invasion of Ukraine in 2014. Related Report Geopolitical StrategyThird Quarter Geopolitical Outlook: Thunder And Lightning Has Russian geopolitical risk peaked for Europe and the rest of the world? Not until a new strategic equilibrium is established between the US and Russia. That will require a ceasefire in Ukraine and a US-Russia understanding about the role of Finland and Sweden within NATO. However, Hungary is signaling that the EU should impose no further sanctions on Russia. Russia’s cutoff of natural gas exports to Europe will create economic hardship that will start driving change in European governments or policies. A full ban on Russian natural gas may not be implemented in the coming years due to lack of EU unanimity. Still, the EU cannot lift sanctions on Russia because that would enable economic recovery and hence military rehabilitation, which could enable new aggression. Also, Russia will not relinquish the territories it has taken from Ukraine even if President Putin exits the scene. No Russian leader will have the political capital to do that given the sacrifices that Russia has made. Bottom Line: Russia’s management of the ruble is distorting some of our risk indicators. Russia remains un-investable for western investors. Substantial sanction relief will not come until late in the decade, if at all. UK GeoRisk Indicator British political risk is rising, and it may surpass the peaks of the Brexit referendum period in 2016 now that Scotland is pursuing another independence referendum (Chart 2). Chart 2United Kingdom: GeoRisk Indicator
United Kingdom: GeoRisk Indicator
United Kingdom: GeoRisk Indicator
New elections are not due until January 25, 2025 and the ruling Conservative Party has every reason to avoid an election over the whole period so that inflation can come down and the economy can recover. But an early election is possible between now and 2025. Prime Minister Boris Johnson has become a liability to his party but he is still a more compelling leader than the alternatives. If Johnson is replaced, then the change of leadership will only temporarily boost the Tories’ public approval. It will ultimately compound the party’s difficulties by dividing the party without resolving the Scottish question. Regardless, the Tories face stiff headwinds in the coming referendum debate and election, having been in power since 2010 and having suffered a series of major shocks (Brexit, the pandemic, inflation). Bottom Line: The US dollar is not yet peaking against pound sterling, As from a global geopolitical perspective it can go further. Investors should stay cautious about the pound in the short term. But they should prefer the pound to eastern European currencies exposed to Russian instability. Germany GeoRisk Indicator German political risk spiked around the time of the 2021 election and has since subsided, including over the course of the Ukraine war (Chart 3). However, risk will rise again now that Germany has declared that it is under “economic attack” from Russia, which is cutting natural gas in retaliation to Germany’s oil embargo. Chart 3Germany: GeoRisk Indicator
Germany: GeoRisk Indicator
Germany: GeoRisk Indicator
This spike in strategic tensions should not be underrated. Germany is entering a new paradigm in which Russian aggression has caused a break with the past policy of Ostpolitik, or economic engagement. Germany will have to devote huge new resources to energy security and national defense and will have to guard against Russia for the foreseeable future. Domestic political risk will also rise as the economy weakens and industrial activity is rationed. Germany does not face a general election until October 26, 2025. Early elections are rare but cannot be ruled out over the next few years. The ruling coalition does not have a solid foundation. It only has a 57% majority in the Bundestag and consists of an ideological mix of parties (a “traffic light” coalition of Social Democrats, Greens, and Free Democrats). Still, Germany’s confrontation with Russia will keep the coalition in power for now. Bottom Line: From a geopolitical point of view, there is not yet a basis for the dollar to peak and roll over against the euro. That is not likely until there is a ceasefire in Ukraine and/or a new NATO-Russia understanding. France GeoRisk Indicator French political risks are lingering at fairly high levels in the wake of the general election and will only partially normalize given the likelihood of European recession and continued tensions around Russia (Chart 4). Chart 4France: GeoRisk Indicator
France: GeoRisk Indicator
France: GeoRisk Indicator
President Emmanuel Macron was re-elected, as expected, but his Renaissance party (previously En Marche) lost its majority and Macron will struggle to win over 39 deputies to gain a majority of 289 seats in the Assembly. He will, however, be able to draw from an overall right-wing ideological majority – especially the Republicans – when it comes to legislative compromises. The election produced some surprises. The right-wing, anti-establishment National Rally of Marine Le Pen, which usually performs poorly in legislative elections, won 89 seats. The left-wing alliance (NUPES) underperformed opinion polls and has not formed a unified bloc within the Assembly. Still, the left will be a powerful force as it will command 151 seats (the sum of the left-wing anti-establishment leader Jean-Luc Mélenchon’s La France Insoumise party and the Communists, Socialists, and Greens). Macron’s key reform – raising the average retirement age from 62 to 65 – will require an ad hoc majority in the Assembly. The Republicans, with 74 seats, can provide the necessary votes. But some members have already refused to side with Macron on this issue. Macron will most likely get support from the populist National Rally on immigration, including measures to make it harder to be naturalized or obtain long-term residence permits, and measures making it easier to expel migrants whose asylum applications have been refused. France will remain hawkish on immigration, but Macron will be able to rein in the populists. On energy and the environment, Macron may be able to cooperate with the Left on climate measures, but ultimately any cooperation will be constrained by the fact that Mélenchon opposes nuclear power. The Republicans and the National Rally will support Macron’s bid to shore up France’s nuclear energy sector. Popular opinion will hold up for France’s energy security in the face of Russian weaponization of natural gas. Macron and Mélenchon will clash on domestic security. Police violence has emerged as a major source of controversy since the Yellow Vest protests. Macron and the Right will protect the police establishment while the Left will favor reforms, notably the concept of “proximity police,” which would entail police officers patrolling in a small area to create stronger, more personal links between the police and the population; officers being under the control of the mayor and prefect; and ultimately most officers not carrying lethal weapons, and the ban of physically dangerous arrest techniques. Grievances over the police as well as racial inequality will likely erupt into significant social unrest in the coming years. As a second-term president without a single-party majority, Macron will increasingly focus on foreign policy. He will aim to become the premier European leader on the world stage. He will seek to revive France’s historic role as a leading diplomatic power and arbiter of Europe. He will strengthen France’s position in the EU and NATO, keep selling arms to the Middle East, and maintain a French military presence in the Sahel. Macron will favor Ukraine’s membership in the EU but also a ceasefire with Russia. He will face a difficult decision on whether to join Israeli and American military action against Iran should the latter reach nuclear breakout capacity and pursue weaponization. Bottom Line: The outperformance of French equities is stretched relative to EMU counterparts. But France will not underperform until the EU’s natural gas crisis begins to subside and a new equilibrium is established with Russia. Italy GeoRisk Indicator Italy is perhaps the weakest link in Europe both economically and strategically (Chart 5). Elections are due by June 2023 but could come earlier as the ruling coalition is showing strains. A change of government would likely compromise the EU’s attempt to maintain a unified front against Russia over the war in Ukraine. Chart 5Italy: GeoRisk Indicator
Italy: GeoRisk Indicator
Italy: GeoRisk Indicator
Before the war Italy received 40% of its natural gas from Russia and maintained pragmatic relations with the Putin administration. Now Russia is reducing flows to Italy by 50%, forcing the country into an energy crisis at a time when expected GDP growth had already been downgraded to 2.3% this year and 1.7% in 2023. Meanwhile Italian sovereign bond spreads over German bunds have risen by 64 basis points YTD as a result of the global inflation. The national unity coalition under Prime Minister Mario Draghi came together for two purposes. First, to distribute the EU’s pandemic recovery funds across the country, which amounted to 191.5 billion euros in grants and cheap loans for Italy, 27% of the EU’s total recovery fund and 12% of Italy’s GDP. Second, to elect an establishment politician in the Italian presidency to constrain future populist governments (i.e. re-electing President Sergio Mattarella). Now about 13% of the recovery funds have been distributed in 2021, the economy is slowing, Russia is cutting off energy, and elections are looming. The coalition is no longer stable. Coalition members will jockey for better positioning and pursue their separate interests. The anti-establishment Five Star Movement has already split, with leader Luigi di Maio walking out. Five Star’s popular support has fallen to 12%. The most popular party in the country is now the right-wing, anti-establishment Brothers of Italy, who receive 23% support in polling. Matteo Salvini, leader of the League, another right-wing populist party, has seen its public support fall to 15% and will be looking for opportunities. On the whole, far-right parties command 38% of popular voting intentions, while far-left parties command 17% and centrist parties command 39%. Italy’s elections will favor anti-incumbent parties, especially if the country falls into recession. These parties will be more pragmatic toward Russia and less inclined to expand the EU’s stringent sanctions regime. Implementing a ban on Russian natural gas by 2027 will become more difficult if Italy switches. Italy will be more inclined to push for a ceasefire. A substantial move toward ceasefire will improve investor sentiment, although, again, a durable new strategic equilibrium cannot be established until the US and Russia come to an understanding regarding Finland, Sweden, and NATO enlargement. Bottom Line: Investors should steer clear of Italian government debt and equities until after the next election. Spain GeoRisk Indicator Infighting and power struggles within the People’s Party (PP) have provided temporary relief for the ruling Socialist Worker’s Party (PSOE) and Spanish Prime Minister Pedro Sanchez. However, with Alberto Nunez Feijoo elected as the new leader of PP on April 2, the People’s Party quickly recovered from its setback. It not only retook the first place in the general election polling, but also scored a landslide victory in the Andalusia regional election. Andalusia is the most populous autonomous community in Spain, contributing 17% of the seats in the lower house. The Andalusian regional election was a test run for the parties before next year’s general election. Historically, Andalusia was PSOE’s biggest stronghold, but it was ousted by the center-right People’s Party-Citizens coalition in 2018. Since then, the People’s party has consolidated their presence and popularity in Andalusia. The snap election in June, weeks after Feijoo was elected as the new national party leader, expanded PP’s seats in the regional parliament. It now has an absolute majority in the regional parliament while the Socialists suffered its worst defeat. With the sweeping victory in Andalusia, the People’s Party is well positioned for next year’s general election. In addition, the ruling Socialist Worker’s Party continues to suffer from the stagflationary economic condition. In May, Spain recorded the second highest inflation figure in more than 30 years, slightly below its March number. Furthermore, the recent deadly Melilla incident which resulted in dozens of migrants’ death, also caused some minor setbacks within Sanchez’s ruling coalition. His far-left coalition partner joined the opposition parties in condemning Sanchez for being complacent toward the Moroccan police. The pressure is on the Socialists now, and political risk will rise in the coming months, till after the election (Chart 6). Chart 6Spain: GeoRisk Indicator
Spain: GeoRisk Indicator
Spain: GeoRisk Indicator
Bottom Line: Domestic political risk will remain elevated in this polarized country, as elections are due by December 2023 and could come sooner. Populism may return if Europe suffers a recession. Russia aims to inflict a recession on the EU which is negative for cyclical markets like Spain, but Spain benefits from Europe’s turn to liquefied natural gas and has little to fear from Russia. Investors should favor Spanish stocks relative to Italian stocks. Turkey GeoRisk Indicator Turkey faces extreme political and economic instability between now and the general election due by June 2023 (Chart 7). Chart 7Turkey: GeoRisk Indicator
Turkey: GeoRisk Indicator
Turkey: GeoRisk Indicator
Almost any country would see the incumbent ruling party thrown from power under Turkey’s conditions. The ruling Justice and Development Party has been in charge since 2002, the country’s economy has suffered over that period, and today inflation is running at 73% while unemployment stands at 11%. However, President Recep Tayyip Erdoğan is doing everything he can with his recently expanded presidential powers to stay in office. He is making amends with the Gulf Arab states and seeking their economic support. He is also warming relations with Israel, as Turkey seeks to diversify away from Russian gas and Israel/Egypt are potential suppliers. He is doubling down on military distractions across the Middle East and North Africa. And he waged a high-stakes negotiation with the West over Finnish and Swedish accession to NATO. Russian aggression poses a threat to Turkish national interests. Turkey ultimately agreed to Finnish and Swedish membership after a show of Erdoğan strong hands in negotiating with the West over their membership, to show his domestic audience that he is one of the big boys ahead of the election. A risk to this view is that Erdoğan stages military operations against Greek-controlled Cyprus. This would initiate a crisis within NATO and put Finnish and Swedish accession on hold for a longer period. Bottom Line: Investors should not attempt to bottom-feed Turkish lira or stocks and should sell any rallies ahead of the election. A decisive election that removes Erdoğan from power is the best case for Turkish assets, while a decisive Erdoğan victory is second best. Worse scenarios include indecisive outcomes, a contested or stolen election, a constitutional breakdown, or a military coup. China GeoRisk Indicator China’s geopolitical risk is falling and relative equity performance is picking up now that the government has begun easing monetary, fiscal, and regulatory policy to try to secure the economic recovery (Chart 8). Chart 8China: GeoRisk Indicator
China: GeoRisk Indicator
China: GeoRisk Indicator
Easing regulation on Big Tech has spurred a rebound in heavily sold Chinese tech shares, while the Politburo will likely signal a pro-growth turn in policy at its July economic meeting. The worst news of the country’s draconian “Covid Zero” policy is largely priced, while positive news regarding domestic vaccines, vaccine imports, or anti-viral drugs could surprise the market. However, none of these policy signals are reliable until Xi Jinping consolidates power at the twentieth national party congress sometime between September and November (likely October). Chinese stimulus could fail to pick up as much as the market hopes and policy signals could reverse or could continue to contradict themselves. After the party congress, we expect the Xi administration to intensify its efforts to stabilize the economy. The economic work conference in December will release a pro-growth communique. The March legislative session will provide more government support for the economy if needed. However, short-term measures to stabilize growth should not be mistaken for a major reacceleration, as China will continue to struggle with debt-deflation as households and corporations deleverage and the economic model transitions to a post-manufacturing model. Bottom Line: A Santa Claus rally in the fourth quarter, and/or a 2023 rally, is likely, both for offshore and onshore equities. But long-term investors, especially westerners, should steer clear of Chinese assets. China’s reversion to autocracy and confrontation with the United States will ultimately result in tariffs and sanctions and geopolitical crises and will keep risk premiums high. Taiwan GeoRisk Indicator Taiwan’s geopolitical risk has spiked as expected due to confrontation with China. Tensions will remain high through the Taiwanese midterm election on November 26, the Chinese party congress, and the US midterm (Chart 9). But China is not ready to stage a full-scale military conflict over Taiwan yet – that risk will grow over in the later 2020s and 2030s, depending on whether the US and China provide each other with adequate security assurances. Chart 9Taiwan: GeoRisk Indicator
Taiwan: GeoRisk Indicator
Taiwan: GeoRisk Indicator
Still, Taiwan is the epicenter of global geopolitical risk. China insists that it will be unified with the mainland eventually, by force if not persuasion. China’s potential growth is weakening so it is losing the ability to absorb Taiwan through economic attraction over time. Meanwhile the Taiwanese people do not want to be absorbed – they have developed their own identity and prefer the status quo (or independence) over unification. Taiwan does not have a mutual defense treaty with the United States and yet the US and Taiwan are trying to strengthen their economic and military bonds. This situation is both threatening to China and yet not threatening enough to force China to forswear the military option. At some point China could believe it must assert control over Taiwan before the US increases its military commitment. Meanwhile China, the US, Japan, South Korea, and Europe are all adopting policies to promote semiconductor manufacturing at home, and/or outside Taiwan, so that their industries are not over-reliant on Taiwan. That means Taiwan will lose its comparative advantage over time. Bottom Line: Structurally remain underweight Taiwanese equities. Korea GeoRisk Indicator The newly elected President Yoon reaffirmed the strong military tie between Korea and the US, when he hosted President Biden in Seoul in May. Both Presidents expressed interests in expanding cooperation into new areas like semiconductors, economic security, and stability in the Indo-Pacific region. The new administration is also finding ways to improve relations with Japan, which soured in the past few years over the issue of forced labor during the Japanese occupation of Korea. A way forward is yet to be found, but a new public-private council will be launched on July 4 to seek potential solutions before the supreme court ruling in August which could further damage bilateral ties. President Yoon’s various statements throughout the NATO summit in Madrid on wanting a better relationship with Japan and to resolve historical issues showed this administration’s willingness towards a warming of the relations between the two countries, a departure from the previous administration. On the sideline of the NATO summit, Yoon also engaged with European leaders, dealing Korean defense products, semiconductors, and nuclear technologies, with a receptive European audience eager to bolster their defense, secure supply chain, and diversify energy source. North Korea ramped up its missile tests this year as it tends to do during periods of political transitions in South Korea. It is also rumored to be preparing for another nuclear test. Provocations will continue as the North is responding to the hawkish orientation of the Yoon administration. Investors should expect a rise in geopolitical risk in the peninsular, but on a relative basis, due to its strong alliance network, Korean risk will be lower compared to Taiwan (Chart 10). Korea will benefit from a rebound in China in the near term, but in the long-term, it is a secure source of semiconductors and high-tech exports, as Greater China will be mired in long-term geopolitical instability. Chart 10Korea: GeoRisk Indicator
Korea: GeoRisk Indicator
Korea: GeoRisk Indicator
Bottom Line: Overweight South Korean equities relative to emerging markets as a play on Chinese stimulus. Overweight Korea versus Taiwan. Australia GeoRisk Indicator Australia’s Labor Party ultimately obtained a one-seat majority in the House of Representatives following the general election in May (77 seats where 76 are needed). It does not have a majority in the Senate, where it falls 13 seats short of the 39 it needs. It will rely on the Green Party (12 seats) and a few stragglers to piece together ad hoc coalitions to pass legislation. Hence Prime Minister Anthony Albanese’s domestic agenda will be heavily constrained. Pragmatic policies to boost the economy are likely but major tax hikes and energy sector overhauls are unlikely (Chart 11). Chart 11Australia: GeoRisk Indicator
Australia: GeoRisk Indicator
Australia: GeoRisk Indicator
Fortunately for Albanese, his government is taking power in the wake of the pandemic, inflation, and Chinese slowdown, so that there is a prospect for the macroeconomic context to improve over his term in office. This could give him a tailwind. But for now he is limited. Like President Biden in the US, Albanese can attempt to reduce tensions with China after Xi Jinping consolidates power. But also like Biden, he will not have a basis for broad and durable re-engagement, since China’s regional ambitions threaten Australian national security over the long run. Global commodity supply constraints give Australia leverage over China. Bottom Line: Stay neutral on Australian currency and equities until global and Chinese growth stabilize. Brazil GeoRisk Indicator It would take a bolt of lightning to prevent former President Lula da Silva from winning re-election in Brazil’s October 2 first round election. Lula is more in line with the median voter than sitting President Jair Bolsonaro. Bolsonaro’s term has been marred with external shocks, following on a decade of recession and malaise. Polls may tighten ahead of the election but Lula is heavily favored. While ideologically to the left, Lula is a known quantity to global investors (Chart 12). However, Bolsonaro may attempt to cling to power, straining the constitutional system and various institutions. A military coup is unlikely but incidents of insubordination cannot be ruled out. Once Lula is inaugurated, a market riot may be necessary to discipline his new administration and ensure that his policies do not stray too far into left-wing populism. Chart 12Brazil: GeoRisk Indicator
Brazil: GeoRisk Indicator
Brazil: GeoRisk Indicator
Brazil’s macroeconomic context is less favorable than it was when Lula first ruled. During the 2000s he rode the wave of Chinese industrialization and a global commodity boom. Today China is slipping into a balance sheet recession and the next wave of industrialization has not yet taken off. Brazil’s public debt dynamics discourage a structural overweight on Brazil within emerging markets. At least Brazil is geopolitically secure – far separated from the conflicts marring Russia, East Europe, China, and East Asia. It also has a decade of bad news behind it that is already priced. Bottom Line: Stay neutral Brazilian assets until global and Chinese growth stabilize and the crisis-prone election season is over. South Africa GeoRisk Indicator South Africa’s economy continues to face major headwinds amid persistent structural issues that have yet to be adequately addressed and resolved by policy makers. The latest bout of severe energy supply cuts by the state-run energy producer, Eskom, serve as a reminder to investors that South Africa’s economy is still dealing with a major issue of generating an uninterrupted supply of electricity. Each day that electricity supply is cut to businesses and households, the local economy stalls. Among other macroeconomic issues such as high unemployment and rising inflation, low-income households which are too the median voter, are facing increasing hardships. The political backdrop is geared toward further increases in political risk going forward (Chart 13). Chart 13South Africa: GeoRisk Indicator
South Africa: GeoRisk Indicator
South Africa: GeoRisk Indicator
Fiscal reform and austerity are underway but won’t last long enough to make a material difference in government finances. The 2024 election is not that far out and the ruling political party, the ANC, will look to quell growing economic pressures to shore up voter support and reinforce its voter base. Fiscal austerity will unwind. Meanwhile, the bull market in global metal prices stands to moderate on weakening global growth, which reduces a tailwind for the rand, South African equities relative to other emerging markets, and government coffers, reducing our reasons for slight optimism on South Africa until global growth stabilizes. Bottom Line: Shift to a neutral stance on South Africa until global and Chinese growth stabilize. Canada GeoRisk Indicator Canadian political risk has spiked since the pandemic (Chart 14). Populist politics can grow over time in Canada, especially if the property sector goes bust. However, the country is geopolitically secure and benefits from proximity to the US economy. Chart 14Canada: GeoRisk Indicator
Canada: GeoRisk Indicator
Canada: GeoRisk Indicator
Global commodity supply constraints create opportunities for Canada as governments around the world pursue fiscal programs directed at energy security, national defense, and supply chain resilience. Bottom Line: Stay neutral Canadian currency and equities. While Canada benefits from the high oil price and robust US economy, rising interest rates pose a threat to its high-debt model, while US growth faces disappointments due to Europe’s and China’s troubles. Matt Gertken Chief Geopolitical Strategist mattg@bcaresearch.com Yushu Ma Research Analyst yushu.ma@bcaresearch.com Jesse Anak Kuri Associate Editor jesse.kuri@bcaresearch.com Guy Russell Senior Analyst GuyR@bcaresearch.com Alice Brocheux Research Associate alice.brocheux@bcaresearch.com Strategic Themes Open Tactical Positions (0-6 Months) Open Cyclical Recommendations (6-18 Months) Regional Geopolitical Risk Matrix Section III: Geopolitical Calendar