Europe

In this <i>Strategy Outlook</i>, we present the major investment themes and views we see playing out for the rest of the year and beyond.
Executive Summary Long-Term Contracts Needed To Increase LNG Supply
EU Will Reverse Course On Fossil Fuels
EU Will Reverse Course On Fossil Fuels
The EU will have to reverse course and execute long-term contracts with natural gas producers, LNG shippers and pipeline operators to incentivize production of supplies needed to contain energy prices. Long-term contracting will offer the EU an opportunity to address political and economic fragmentation risks via joint taxation policies. This would transform state-level risks via-a-vis energy and military security into joint-and-several obligations. The G7’s plan to cap Russian oil prices will be DOA. The most oil import-dependent EM economies – China and India – will find deeply discounted crude irresistible. Hydrocarbon producers and refiners will increase investments in carbon-capture and storage technology, to maintain their new-found advantage as secure energy sources. Additional subsidies and funding for this technology will be forthcoming. Bottom Line: The hard realities of military conflict and a lack of investment in production and refining will force governments to incentivize substantial investments in hydrocarbons – particularly natural gas and LNG infrastructure – to address global energy scarcity during a time of war. We remain long oil and gas exposures via the COMT ETF, and long equity refining and services exposures via the CRAK and IEZ ETFs. We will re-establish our producer-oriented XOP ETF position if prompt Brent futures trade down to $105/bbl in the front month. We also remain tactically long Brent and eurozone natgas futures and options. Feature The G7 last opined on liquified natural gas (LNG) supply in May, and as was the case this week, it left even casual observers uncertain as to what it is seeking to achieve: It advocated for a halt to further investments in fossil-fuel projects and, at the same time, called for higher LNG supplies to be provided for the EU states.1 The EU faces daunting energy security and supply constraints.2 A deepening energy scarcity will, we expect, push the EU into recession later this year, as natural-gas rationing is invoked to ensure there are sufficient supplies to meet human needs this winter. Natgas scarcity will force the EU to reverse course on its renewable-energy transition in the medium term and prioritize fossil-fuel investments, in our view. Long-term contracting with LNG suppliers will be required to incentivize needed investment in production and transportation to replace Russian gas imports. Such contracting is a necessity for hydrocarbon producers, given governments’ continued calls for no additional fossil-fuel investment. Quicksilver shifts in policy are a continuing source of uncertainty for investors and energy-supply firms. Over time, the EU will have to replace close to 7 Tcf/yr of Russian gas imports (Chart 1, middle panel). This will propel the EU into the ranks of the world’s largest LNG importers (Chart 2). Chart 1EU Needs To Replace ~ 7 Tcf/yr Of LNG
EU Will Reverse Course On Fossil Fuels
EU Will Reverse Course On Fossil Fuels
Chart 2EU Will Become A World-Class LNG Importer
EU Will Become A World-Class LNG Importer
EU Will Become A World-Class LNG Importer
Chart 3Long-Term Contracts Needed To Increase LNG Supply
EU Will Reverse Course On Fossil Fuels
EU Will Reverse Course On Fossil Fuels
Given the length of contracts typically executed with LNG exporters – in excess of 20-plus years – EU governments will be compelled to allow firms and member states to sign long-term contracts for these supplies. EU governments also will be required to begin planning for and developing LNG importing infrastructure, as these supplies become available over the next 3-5 years. In the meantime, LNG prices will remain under pressure as competition heats up globally ahead of the coming winter (Chart 3). G7 Price-Cap Scheme Will Be DOA The G7’s scheme to impose a price cap on Russian oil exports will be DOA as soon as details are presented. This is because the world’s largest oil import-dependent economies – China and India – not only have long trading histories with Russia, but they also operate their own oil-transport fleets that can circumvent insurance-related obstacles imposed by the US and the UK. China and India already find discounted Russian oil irresistible, and are unlikely to acquiesce to US demands for a price cap. China imports 75% of its 15.5mm b/d of oil consumption, while India imports ~ 85% of the 5mm b/d of oil it consumes. Even if oil importers taking Russia's exports going to the EU were to sign on to a price-cap scheme, Russia could always unilaterally cut its oil and condensate production by 20-30% and force Brent prices sharply higher for remaining contract holders. This would almost surely lead to higher prices – above $140/bbl, based on our earlier estimates – and raise Russia’s net export proceeds in the process, since the G7 does not want all of Russia's oil taken off the market.3 Government Interventions Exacerbate Scarcity Governments of states with contestable elections increasingly are intervening – or attempting to do so – in global energy markets and imposing often-contradictory policies that nominally favor consumers at the expense of energy producers. This almost always is counter-productive: Price caps intended to soften the blow of higher-cost electricity and hydrocarbons discourages the necessary conservation of scarce resources. So-called windfall profits taxes discourage the investment required to address supply scarcity. Higher demand and lower supply does not lead to lower prices. Even grander schemes – e.g., the monopsony cartels floated by G7 member states like the US and EU, along with China – almost surely would reduce the profitability of developing and marketing new energy supplies, which also would exacerbate scarcity of supply by discouraging investment. These quick ad hoc fixes work at cross purposes in solving the problem of global energy scarcity. While they are in keeping with a penchant of governments to demonstrate they are addressing voters’ concerns, such policies mistake a quick response for long-term solutions. Investment Implications The EU will, in our opinion, be forced to reverse course and sign long-term LNG supply contracts to replace Russian natural gas imports. This will not derail its renewable-energy transition strategy, but it will significantly delay it. We remain long oil and gas exposures via the S&P GSCI and COMT ETF, and long equity refining and services exposures via the CRAK and IEZ ETFs. We will re-establish our producer-focused XOP ETF position if Brent trades down to $105/bbl in the front month. We also remain tactically long Brent and eurozone natgas futures and options (see p. 7 below). Housekeeping Notes We were stopped out of our long S&P GSCI position with a gain of 64%. We are getting long again at the close. We also were stopped out of our long 4Q22 $120/bbl Brent calls with a 16% return. Separately, there will be no Commodity Round-Up in this week’s publication. We are broadcasting our Commodity Round-Up today at 9 a.m. EDT. Robert P. Ryan Chief Commodity & Energy Strategist rryan@bcaresearch.com Footnotes 1 Please see The G7 wants to dump natural gas … but not yet published by politico.com 27 May 2022. The report notes, “The G7 called for an end to international investments in fossil fuels by the end of this year and slammed private finance for continuing to back dirty energy — but left a big out for EU countries desperate to replace Russian gas. ‘We acknowledge that investment in [the liquefied natural gas] sector is necessary in response to the current crisis, in a manner consistent with our climate objectives and without creating lock-in effects,’ the ministers said.” 2 Please see One Hot Mess: EU Energy Policy, published 26 May 2022. This report delves into the EU’s post-Cold War foreign policy. For three decades, EU foreign policy largely was set by Germany, the organization's most powerful economy. Successive generations of German politicians championed the idea that the West could bring the former Soviet Union – and later Russia – into the modern world of global trade through Ostpolitik, which had, at its core, a belief in the power of trade to effect political and economic change. This policy is kaput. 3 Please see Higher Gasoline, Diesel Prices Ahead, which we published 2 June 2022. It is available at ces.bcaresearch.com. Investment Views and Themes Strategic Recommendations Tactical Trades Trades Closed in 2022
Dear Client, This month’s Special Report has been written by Martin Barnes, BCA’s former Chief Economist. Martin, who retired from BCA Research last year after a long and illustrious career, discusses the long-run outlook for inflation. The views expressed in this report are his, and may not be consistent with those of the Bank Credit Analyst or other BCA Research services. But Martin’s warning of future stagflation is sobering, and I trust you will find his report both interesting and insightful. Jonathan LaBerge, CFA The Bank Credit Analyst Highlights Overly stimulative policies meant that inflation was set to rise even before the disruptions caused by the pandemic and Ukraine conflict. Inflation should decline sharply over the coming year in response to weaker economic growth and an easing in supply problems. But it will be a temporary respite. Central banks will not have the stomach to keep policy tight enough for long enough to squeeze inflation out of the system. Price pressures will return as economies bottom and the environment will become one of stagflation. Financial assets will rally strongly when inflation fears subside but subsequent stagflation will not be bullish for markets. Feature Former Federal Reserve Chairman Alan Greenspan once defined price stability as existing when “households and businesses need not factor expectations of changes in the average level of prices into their decisions”. Until recently, that state of affairs was the case for much of the past 30 years and for many, inflation was quiescent during their entire working lives. But inflation is now back as a huge issue and there is massive debate and uncertainty about whether it will be a temporary or lasting problem. I lean toward the latter view. Major changes in the economic and/or financial environment more often are identified in hindsight than in real time. It is easier to attribute large trend deviations to temporary factors than to make bold predictions about structural shifts. Obviously, the pandemic and conflict in Ukraine have had a significant impact on the near-term inflation picture via massive supply-side disruptions and represent temporary events. Thus, inflation will retreat from current elevated levels as those disruptions diminish. But the conditions for higher inflation were already in place before those two unfortunate events occurred. Specifically, central banks have been erring on the side of stimulus for several years and they will find it extremely difficult, if not impossible, to put the inflation genie back into the bottle. Inflation has moved from a non-issue to the most important factor driving markets. Over the next year, the next big surprise might be how fast inflation retreats and investors and policymakers will then breathe a big sigh of relief. However, this will prove to be a temporary respite because it will not take long for inflation to move back up and remain stubbornly above central bank targets. In other words, a whipsaw is in prospect over the next few years as inflation goes from up, to down, and to up again. The Current Inflation Problem The biggest increases in consumer prices have occurred in areas most affected by supply problems, with energy attracting the most attention. Nevertheless, in most countries, inflation has risen across the majority of goods and services. The core inflation rate (i.e. consumer prices excluding food and energy) in the G7 economies climbed from 2% to 4.8% between April 2021 and April 2022 (Chart II-1). Meanwhile, the Cleveland Fed’s trimmed mean measure of US consumer price inflation has spiked dramatically higher, consistent with a broad-based acceleration in inflation.1 The rise in underlying inflation is a bigger problem in the US, UK and Canada than in Japan or the Euro Area. Chart II-2 shows current core inflation rates relative to the target rate of 2% pursued by most central banks. That geographical divergence will be touched on later and in the meantime, the focus will be on the US situation. Chart II-1A Broad-Based Pickup In Inflation
A Broad-Based Pickup in Inflation
A Broad-Based Pickup in Inflation
Chart II-2The US, UK And Canada Have A Bigger Inflation Problem
July 2022
July 2022
The latest US inflation data for a range of goods and services is shown in Table II-1. The table shows the three- and six-month annualized changes in prices because 12-month rates can be affected by a base effect given the impact of pandemic-related shutdowns and disruptions a year ago. Also, a comparison of the three- and six-month rates shows if momentum is building or fading. The trends are not encouraging in that momentum has accelerated, not diminished in many key areas. Table II-1Selected Inflation Rates In The US CPI
July 2022
July 2022
Even if the data show a moderation in core inflation in the months ahead, it is important to note that rent inflation – the CPI component with the biggest weight – is seriously underestimated. This is one of the few items where prices are collected with a lag and real estate industry reports highlight that rent inflation is running at double-digit rates in the major cities. According to one report, average rents nationally increased by more than 25% in the year to May.2 The CPI data will eventually catch up with reality, providing at least a partial offset to any inflation improvements in other areas. Another problem for inflation is the acceleration in wage growth against the backdrop of an unusually tight labor market. Currently, the number of unfilled vacancies is almost twice the number of unemployed and it is thus no surprise that wage growth has picked up sharply (Chart II-3). The Atlanta Fed’s measure of annual wage inflation has risen above 6%, its highest reading since the data began in 1997. Wage growth is unlikely to suddenly decline absent a marked rise in the unemployment rate. There is much debate about whether the US economy is on the verge of recession, but let’s not get bogged down in semantics. Regardless of whether the technical definition of recession is met (at least two consecutive quarters of negative GDP growth), the pace of activity is set to slow sharply. Plunging consumer and business confidence, contracting real incomes and a peaking in housing activity all point to a significant weakening in growth, even if the labor market stays healthy (Chart II-4). Chart II-3A Very Tight US Labor Market
A Very Tight US Labor Market
A Very Tight US Labor Market
Chart II-4The US Economy Is In Trouble
The US Economy is in Trouble
The US Economy is in Trouble
Softer economic growth eventually will take the edge off inflationary pressures in many goods and services. Combined with an easing in supply-side disruptions, the inflation rate is certain to decline in the coming year, even if oil prices move higher in the short run. Currently, the Fed is talking tough about dealing with inflation and there is little doubt that further rate hikes are on the way. However, policymakers will have little stomach for inflicting enough economic pain to completely squeeze inflation out of the system. Once there are clear signs of a significant economic slowdown, the Fed will back off quickly. What Causes Inflation Anyway? Economics 101 teaches that prices are determined by the interaction of supply and demand. If the demand for a good or service exceeds supply, then prices will rise to bring things back into balance. Seems simple enough but, unfortunately, this leaves many unanswered questions. How much must prices rise and for how long in order to restore balance? What if there are structural impediments to supply? What if there are monopolies in key commodities or services? What if policy interferes with the operation of market-clearing solutions? And, finally, what measure of inflation should we be looking at? Chart II-5Inflation Is A 'Modern' Issue
Inflation is a 'Modern' Issue
Inflation is a 'Modern' Issue
For much of economic history, deflation was just as prevalent as inflation, with the latter only being a problem during periods of war (Chart II-5). As the pre-WWII world pre-dated fiat money, automatic stabilizers (e.g. the welfare state), and counter-cyclical fiscal policy, economies were prone to regular depressions that served to wash out financial and economic excesses and any inflationary pressures. But those days are long gone and free market forces should not be expected to keep inflation under wraps. I rather like the simple explanation of inflation’s roots as being “too much money chasing too few goods”. In that sense, the control of inflation lies firmly at the door of central banks. In the “old days” (i.e. before the 1990s), it was possible to use the growth in the money supply to gauge the stance of policy because there was a fairly stable and predictable relationship between monetary and economic trends. That all ended when financial deregulation and the explosion in non-bank financial activities meant that monetary trends ceased to be a reliable indicator of economic growth and inflation. As a result, the Fed stopped setting monetary growth targets more than 20 years ago and since then, money supply data has rarely been mentioned in FOMC discussions. Chart II-6A Simple Measure Of The Monetary Stance
A Simple Measure of the Monetary Stance
A Simple Measure of the Monetary Stance
Fortunately, all is not lost. The gap between the federal funds rate and nominal GDP growth is a reasonably good proxy for the stance of monetary policy. Conditions are easy when rates are persistently below GDP growth and vice versa when they are above. As can be seen in Chart II-6, rates were below GDP growth during most of the 1960s and 1970s, a period when inflation rose sharply. And inflation fell steadily in the 1980s into the first half of the 1990s when the Fed kept interest rates above GDP growth. And look at what has happened in the past decade: rates have been significantly below GDP growth, suggesting an aggressively easy monetary stance. It was only a matter of time before inflation picked up, even without the recent supply-side disruptions. The FOMC’s latest projections show long-run growth of 3.8% in nominal GDP while the fed funds rate is expected to average only 2.5%. That implies a continued accommodative stance, yet inflation is forecast to be in line with the 2% target. That all seems very unlikely. Fed policymakers spend a lot of time trying to figure out the level of the equilibrium real interest rate – the level consistent with steady non-inflationary economic growth. It would be very helpful to have this number but coming up with an accurate measure is a largely futile exercise. It cannot be measured empirically and its estimation requires a lot of assumptions, explaining why there is no broad agreement on what the right number is. I think there is a case for the simpler approach of using the nominal growth in GDP as a proxy for where rates should be in normal circumstances. As noted above, that suggests monetary policy was excessively accommodative for an extended period. If US Policy Was Too Easy, Why Was Inflation Low For So Long? The Fed’s preferred measure of underlying inflation is the change in the personal consumption deflator, excluding food and energy. In the 25 years to 2019, inflation by this measure averaged only 1.7%, compared to the Fed’s desired level of 2%. Thus, even though the level of interest rates implied very accommodative policy over that period, inflation remained tame. This leads to an important caveat. The stance of monetary policy plays the key role in driving inflation, but it is not everything. Offsetting forces on inflation (in both directions) can mute or even swamp the impact of policy. There were several disinflationary forces in operation during the past 25 years. Specifically: In the second half of the 1990s, the explosive growth of the internet and accompanying boom in technology spending led to a marked pickup in productivity growth. The entry of China into the World Trade Organization at the end of 2001 unleashed a wave of offshoring and downward pressure on traded goods prices. A series of deflationary shocks hit the US and global economy including the 1998 financial crisis in South-East Asia and Russia, the bursting of the tech bubble after 2000, and of course the global financial meltdown in 2007-09. Unstable economic conditions undermined labor’s bargaining power, keeping a tight lid on wage growth. This was highlighted by the dramatic decline in labor’s share of income after 2000. Importantly, the above forces are no longer in place and in some cases are reversing. The key technological advances of the past decade have not been particularly good for productivity. Indeed, one could argue that the activities of most so-called FANG stocks – especially those involved in social media - have had a negative impact on productivity. Time spent on FaceBook, Twitter and Netflix do not have obvious benefits for increased economic efficiency. Chart II-7Globalization In Retreat
Globalization in Retreat
Globalization in Retreat
Even before the pandemic’s impact on supply chains, there were signs that globalization had peaked (Chart II-7). Indeed, BCA first suggested in 2014 that globalization was running out of steam. More recently, the interruption to supply chains has highlighted the downside of relying excessively on overseas production for key goods such as semi-conductors and pharmaceuticals. Onshoring rather than offshoring will become more common with higher prices being the cost for greater control over supply. Globalization is not dead, but, at the margin, it no longer is a powerful source of disinflation. US import prices from China are back to their highest level in a decade after falling steadily during the eight years to 2020. The inflationary impact of the pandemic and the war in Ukraine via supply-side disruptions are more than offsetting any disinflationary effects of softer economic growth. In other words, they have represented stagflationary rather than deflationary shocks. Finally, with regard to income shares, the pendulum has swung more in favor of labor. Demographic trends (e.g. slow growth in the working-age population) suggest that the labor market will remain relatively tight in the years ahead, notwithstanding short-term weakness as the economy slows. Profit margins are likely to weaken and labor’s share of income will rise. The bottom line is that easy money policies will no longer be offset by a number of powerful external forces that served to keep consumer price inflation under wraps in the pre-pandemic period. And this raises another important point. If monetary policy is too easy, then it will show up somewhere, even if consumer price inflation is under control. There Is More Than One Kind Of Inflation Inflation most commonly refers to the change in the prices of consumer goods and services. That is understandable because consumer spending accounts for more than half of GDP in the major developed economies (and almost 70% in the US). And because consumers are the ones who vote, it is the inflation rate that politicians care most about. However, there are other kinds of inflation. If there are structural impediments to increased consumer prices, then excessively easy monetary policy most likely will show up in higher asset prices. This is a very different kind of inflation because it is welcomed by the owners of assets and by politicians. Nobody is happy to face higher prices for the goods and services they buy, but asset owners love the wealth-boosting effect of higher prices for homes and shares. Consumer inflation may have been subdued in the pre-pandemic decade, but the same is not true for asset prices. During the period that the Fed ran accommodative policies, there were several periods of rampant asset inflation such as the tech stock bubble of the late 1990s, the housing bubble of the 2000s, and the bond bubble of 2016-2020. And both equity and home prices surged in response to monetary stimulus triggered by the pandemic. Central banks may fret about the potential financial stability implications of surging asset prices, but in practice they do not act to curb them. Policymakers argue that it is hard to determine when an asset bubble exists and even when one is obvious, monetary policy is a crude tool to deal with it. If rising asset prices occur alongside an economy that is characterized by stable growth and moderate inflation, then acting to burst a bubble could inflict unnecessary economic damage. That is an understandable position, but it means ignoring the longer-term problems that occur when bubbles inevitably burst. This was highlighted by the economic and financial chaos after the US housing bubble burst in 2007. The reality is that central banks have been forced to rely more heavily on asset inflation as a source of monetary stimulus. An easing in monetary policy affects economic conditions in three primary ways: boosting credit demand and supply, raising asset prices, and lowering the exchange rate.3 Historically, the credit channel was by far the most important. BCA has written extensively about the Debt Supercycle and the role of monetary policy in fueling ever-rising levels of private sector indebtedness (see the Appendix for a brief description of the Debt Supercycle). Chart II-8No Releveraging Cycle In Household Debt
No Releveraging Cycle in Household Debt
No Releveraging Cycle in Household Debt
The environment changed dramatically after the 2007-09 financial meltdown. The collapse of the credit-fueled housing bubble drove a stake through the heart of the household sector’s love affair with debt. The ratio of household debt to income peaked in early 2009 and ten years later it was back to the levels of 2001 (Chart II-8). Even an extended period of record low interest rates has failed to trigger a new leveraging cycle. If the Fed can’t persuade consumers and businesses to fall back in love with debt, then it must rely on the other two transmission channels for monetary policy – asset prices and the exchange rate. And the Fed really has limited control over the latter channel given that it also depends on the actions of other central banks. The deleveraging of the household sector in the post-2009 period could have been very bearish for the economy, but the Fed’s easy money policies underpinned the stock market, allowing household net worth to revive. There was an explosive rise in household net worth in 2020-21 as surging house prices added to stock market gains. Between end-2019 and end-2021, the household sector’s direct holdings of equities plus owner’s equity in real estate increased in value by around $20 trillion, equal to more than one year’s personal disposable income. The recent decline in equity prices has reversed some of the gains, but net worth remains elevated by historical standards. The bottom line is that it was wrong to suggest that the Fed’s accommodative stance did not create inflation. Consumer price inflation was tame in the pre-pandemic period, but there was lots of asset inflation and that gathered pace in 2020 and 2021. There was always going to be some leakage of this into more generalized inflation but this was accelerated by the double whammy of the supply disruptions caused by the pandemic and the Ukraine war. The Strange Case Of Japan If higher inflation in the US has seemed inevitable, how can one explain the situation in Japan? In contrast to other developed countries, Japan’s annual core inflation rate was only 0.2% in May. While this was an increase from the average -1.3% rate in the prior six months, it is impressive given the country’s continued highly stimulative monetary policy and the same exposure to supply disruptions as elsewhere. Most importantly, Japan has suffered structural deflation for so long that inflation expectations are totally dormant for both consumers and businesses. In other words, raising prices is seen as a desperate measure and something to be avoided. Japan’s poor demographics may also have played a role. A sharply declining labor force and rapidly aging population are disinflationary rather than inflationary influences and help reinforce the corporate sector’s reluctance to raise prices. While Japan seems an outlier, it is worth noting that core inflation also has remained relatively subdued in many European countries. For the overall Euro area, the latest core inflation rate is 3.8%, well below that of the US and UK. Two common features of the higher inflation countries are that they tended to have more aggressively-easy fiscal policies in recent years and greater asset inflation – especially in real estate. Unfortunately, inflation expectations and business pricing behavior in the US and other Anglo-Saxon economies have not followed Japan’s example. Employees have become more aggressive in demanding higher wages, and most companies have no problem in passing on higher costs to their customers. The UK is facing a wave of public sector strikes over pay the likes of which have not been seen for decades. The Outlook Chart II-9A Peaking In Supply Problems?
A Peaking in Supply Problems?
A Peaking in Supply Problems?
Inflation may prove sticky over the next few months, but as noted earlier, it should move significantly lower over the coming year. Crude oil prices have risen by around 75% in the past year and that pace of rise cannot be sustained. Meanwhile, while shipping rates remain historically high, they are down sharply from earlier peaks (Chart II-9). Together with a revival in Chinese exports, this suggests some easing in supply chain problems. And as mentioned above, the pace of economic activity is set to slow sharply. But a return to pre-pandemic inflation levels is not in the cards. The Fed currently is talking tough and further rate hikes are on the way. But the tightening will end as soon as it becomes clear that the economy is heading south. A deep recession is not likely because there are not the worrying imbalances such as excessive consumer debt or inventories that typically precede serious downturns. However, policymakers will not take any risks and policy will return quickly to an accommodative stance, even though inflation is unlikely to return to the desired 2% level. On a positive note, inflation may be the highest in 40 years in many countries, but we are not facing a return to the destructive high-inflation environment of the 1970s. Inflation back then was institutionalized and a self-feeding cycle of higher wages and rising prices was deeply embedded. I was working as an economist for BP in London in the 1970s and remember receiving large quarterly pay rises just to compensate for inflation. In the absence of inflation-accounting practices, companies seriously underestimated the destruction that inflation was creating to balance sheets and profitability, making them complacent about the problem. Moreover, there were not the same global competitive pressures that exist today. Inflation in the US likely will form a new base of 3% to 4% over the medium term, with occasional fluctuations to 5% or above. An environment of stagflation is in prospect: growth will not be weak enough to suppress inflation and not strong enough to allow the Fed to maintain a restrictive stance. This puts the Fed in a difficult spot as it will be reluctant to admit defeat by raising the inflation target from its current 2%, even though that level will be out of reach in practical terms. A counter view is that I am too pessimistic by underestimating the disinflationary effects of technological advances. A sustained improvement in productivity would certainly help lower inflation but how likely is this? Technological advances are occurring all the time, but in recent years they largely have been incremental in nature and it is hard to think of any new breakthrough productivity-enhancing technologies. There is a difference between new technologies that simply represent better ways to do existing tasks (3D printing would fall into that category) and general purpose technologies that completely change the way economies operate (e.g. electricity and the internet). While businesses are still exploiting the benefits of the digital world, we await innovations that will trigger a new sustained upsurge in productivity. A game changer would be the development of unlimited cheap energy (cold fusion?) but that does not seem likely any time soon. Nevertheless, I will keep an open mind about the potential for productivity to surprise on the upside, despite my current skepticism. Chart II-10Inflation Expectations Spike Higher
Inflation Expectations Spike Higher
Inflation Expectations Spike Higher
What does all this mean for the markets? Not surprisingly, shifts in market expectations for future inflation are highly correlated with the current rate and have thus spiked higher in recent months, hurting both bonds and stocks (Chart II-10). Obvious inflation hedges would be inflation-protected bonds and resources, but neither group currently is attractively priced. The good news is that the current panic about inflation is setting the scene for a buying opportunity in both stocks and bonds. The exact timing is tricky to predict but both stocks and bonds will rally strongly later this year when inflation expectations retreat as it becomes clear that the economy is weakening and the Fed softens its hawkish tones. The bad news is that this bullish phase will not last much more than a year because a re-emergence of inflationary pressures will bring things back to earth. The long-run outlook is one of stagflation and that will be a tough environment for financial assets. Martin H. Barnes Former Chief Economist, BCA Research mhbarnes15@gmail.com Appendix: A Primer On The Debt Supercycle The Debt Supercycle is a description of the long-term decline in U.S. balance-sheet liquidity and rise in indebtedness during the post-WWII period. Economic expansions have always been associated with a buildup of leverage. However, prior to the introduction of automatic stabilizers such as the welfare state and deposit insurance, balance-sheet excesses tended to be fully unwound during economic downturns, albeit at the cost of severe declines in activity. The pain of the Great Depression led governments to intervene to smooth out the business cycle, and their actions were given legitimacy by the economic theories of John Maynard Keynes. Fiscal and monetary reflation, together with the introduction of automatic stabilizers such as unemployment insurance, were successful in preventing the frequent depressions that plagued the pre-WWII economy, but the downside was that balance-sheet imbalances and financial excesses built up during each expansion phase were never fully unwound. Periodic "cyclical" corrections to the buildup of debt and illiquidity occurred during recessions, but these were never enough to reverse the long-run trend. Although liquidity was rebuilt during a recession, it did not return to its previous cyclical high. Meanwhile, the liquidity rundown during the next expansion phase established new lows. These trends led to growing illiquidity, and vulnerability in the financial markets. The greater the degree of illiquidity in the economy, the greater is the threat of deflation. Thus, the bigger that balance-sheet excesses become, the more painful the corrective process would be. So, the stakes became higher in each cycle, putting ever-increasing pressure on the authorities to reflate demand, by whatever means were available. The Supercycle process was driven over time by the building tension between rising underlying deflationary risks in the economy, and the ability of policymakers to create inflation. The Supercycle reached an important inflection point in the recent economic and financial meltdown, with the authorities reaching the limit of their ability to get consumers to take on more leverage. This forced the government to leverage itself up instead, representing the Debt Supercycle's final inning. Footnotes 1This trimmed mean measure excludes the top 8% of CPI components with the largest monthly price gains and the bottom 8% with the smallest monthly gains. 2 Rent.com, https://www.rent.com/research/average-rent-price-report/, June 2022. 3 A fourth channel can be via a psychological boost to business and consumer confidence, but this can cut both ways if an easing in policy is interpreted as a sign of worsening economic conditions rather than as a reason for optimism.
Highlights We now recommend that investors maintain a neutral stance towards stocks versus bonds in a global multi-asset portfolio. We also recommend that investors increase their allocation to government bonds within a global fixed income portfolio (to overweight), at the expense of corporate bonds. We still believe that the US will likely avoid a recession over the coming year, but we are less convinced that this is true than we were a few months ago. The fact that mortgage rates have risen to neutral territory means it is possible that the usual ingredients for a recession – tight monetary policy plus a shock to aggregate demand in the form of a sharp decline in real wages – are currently present or soon will be. In addition, the Fed is now very concerned that long-term household inflation expectations may become unanchored to the upside. Headline inflation has seemingly been a more impactful driver of long-term inflation expectations than core measures, implying that the Fed may have to crowd out demand for goods and services that are comparatively less affected by supply-side constraints in order to contain rising inflation expectations. That would be clearly negative for economic growth and is potentially recessionary in nature. We see no compelling signs of an acceleration in European or Chinese growth that could act as a ballast to support the global economy. The European energy situation is worsening, China’s post-lockdown rebound has so far been tepid, and market-based indicators of Chinese economic growth are deteriorating. The US equity market is not priced for a typical “income-statement” recession induced by monetary policy. We expect the S&P 500 to fall to 3100 in a recession scenario, driven mostly by declining earnings. In a recession scenario, we do not expect long-maturity government bond yields to fall enough to offset a likely increase in the equity risk premium. Financial markets rarely trend sideways over 6-to-12 month periods. We regard a neutral global asset allocation stance as a temporary stepping stone to either a further downgrade of risky assets to underweight, or an increase in risky asset exposure back to a high-conviction overweight. The latter is still possible, especially if we soon see a substantial slowdown in the US headline inflation rate. Thus, additional changes to our recommended cyclical allocation may occur over the coming few months, in response to the incoming data and our assessment of the likely implications for monetary policy. Downgrading Risky Assets To Neutral Every month, BCA strategists hold a house view meeting to discuss the most important issues driving the macroeconomy and financial markets. As highlighted in a recent Special Alert from our Global Investment Strategy service,1 BCA strategists voted at our June meeting to change our House View to a neutral asset allocation stance towards equities, with a slight plurality favoring an outright underweight. Table I-1We Now Recommend More Conservative Positioning Than We Did In May
July 2022
July 2022
The view of the Bank Credit Analyst service is in line with the consensus of BCA strategists on this issue, and we consequently recommend a neutral stance towards stocks versus bonds in a global multi-asset portfolio. We also recommend that investors increase their allocation to government bonds within a global fixed income portfolio (to overweight), at the expense of corporate bonds (Table I-1). We noted in our April report2 – when the S&P 500 index stood at 4530 – that the outlook for equities had deteriorated meaningfully since the beginning of the year and that investors should maintain at most a very modest overweight toward equities in a global multi-asset portfolio. A formal downgrade to neutral is thus not a large change in our recommended positioning, but it reflects what we view as a legitimate increase in the odds of a US recession over the coming year. It is not yet our view that a US recession is a probable outcome, but it is important to distinguish between one’s forecast of the economic outlook and the appropriate investment strategy. The unique inflationary pressure created by the COVID-19 pandemic has created a large confidence interval around our forecast, underscoring that an aggressive stance towards risky assets is not warranted. Financial markets rarely trend sideways over 6-to-12 month periods. We regard a neutral stance as a temporary stepping stone to either a further downgrade of risky assets to underweight or an increase in risky asset exposure back to a high-conviction overweight. The latter is still possible, especially if we see a substantial slowdown in the US headline inflation rate. But as we will discuss below, that slowdown will have to materialize soon in order for us to recommend an overweight risky asset stance. Reviewing Our Previously Constructive View On US Economic Growth Chart I-1Recessionary Concerns Have Escalated Significantly Since The 2-10 Yield Curve Inverted
Recessionary Concerns Have Escalated Significantly Since The 2-10 Yield Curve Inverted
Recessionary Concerns Have Escalated Significantly Since The 2-10 Yield Curve Inverted
Concerns about a potential US recession have been growing since the Fed’s hawkish pivot in November, especially following Russia’s invasion of Ukraine. Previously, these concerns centered around two core issues: the aggressive pace at which the Fed communicated it would raise the policy rate, and the fact that the 2-10 yield curve flattened sharply in the first quarter and finally inverted (based on closing prices) on April 1st (Chart I-1). We had pushed back against those concerns, for several reasons. Our deeply-held view is that recessions typically occur when a significant shock to aggregate demand emerges against the backdrop of tight monetary policy. Sometimes the debt-service and credit demand impact of high interest rates itself is the shock. In other cases, recessions have been triggered in an environment of restrictive monetary policy by a sudden change in key input costs (such as oil prices), the bursting of a financial asset bubble, or a major shift in fiscal spending (typically following a period of war). But the core point is that recessions rarely occur when monetary policy is easy, even when shocks to aggregate demand occur. We abstract here from special cases such as the recession that occurred during the early phase of the COVID-19 pandemic. That event saw the introduction of government policies that purposely arrested economic activity, which in our view would have caused a recession under any conceivable fiscal and/or monetary policy alignment. As a business cycle indicator, the yield curve is significant for investors because it essentially represents the bond market’s assessment of the monetary policy stance. The 2-10 yield curve inversion in early April occurred, in part, because of the speed at which the Fed signaled it would raise interest rates, but also because the 10-year Treasury yield stood just under 2.4% at the point of inversion. This level of long-maturity bond yields reflected the view of both the Fed and most investors that the neutral rate of interest permanently fell following the 2008/2009 global financial crisis (GFC), a view that we have argued against in several previous reports.3 As such, the first reason we pushed back against earlier recessionary concerns is that we believe that the natural/neutral rate of interest is higher than the Fed and investors believe (even though we warned that a recessionary scare was quite likely). Chart I-2A Large Portion Of Currently Elevated Inflation Is Due To Supply-Side And Pandemic-Related Factors
July 2022
July 2022
The second reason that we had pushed back against recessionary concerns was our view that a meaningful portion of currently elevated US inflation is a function of supply-side and pandemic-related factors that will eventually abate. Chart I-2 highlights credible estimates showing that roughly half of the year-over-year change in the headline PCE deflator is the result of supply-side factors, versus 40-50% for core inflation. It has been and remains our view that a substantial portion of these supply-side and pandemic-related factors will dissipate as the pandemic continues to recede in importance, with several price categories likely to deflate outright. Chart I-3Excess Savings Should Still Support Higher Services Spending
Excess Savings Should Still Support Higher Services Spending
Excess Savings Should Still Support Higher Services Spending
Finally, we have argued in several reports that US goods spending has been well above-trend and is likely to slow, but also that services spending is far too low and is likely to rise. Chart I-3 highlights that close to $3 trillion in excess savings have accrued during the pandemic, which formed because of a combination of rising disposable income and falling services spending. We noted that the continued transition of the US and global economies towards a post-pandemic state would boost services spending, providing (an admittedly atypical) source of support for overall aggregate demand. Why The Odds Of A US Recession Have Increased We still believe that the US will more likely than not avoid a recession over the coming year, but it is true that the strength of all three of the arguments presented above has weakened. Regarding the stance of monetary policy, Charts I-4 and I-5 highlight that it is still true that the Fed funds rate and 5-year/5-year forward Treasury yields remain below our estimate of the neutral rate (nominal potential GDP growth). However, Chart I-6 highlights that the sharp rise in consumer price inflation has caused a substantial reduction in real wage growth, which certainly constitutes a non-monetary aggregate demand shock. Chart I-4The Policy Rate Is Not Yet At Neutral, But Mortgage Rates Are
The Policy Rate Is Not Yet At Neutral, But Mortgage Rates Are
The Policy Rate Is Not Yet At Neutral, But Mortgage Rates Are
Chart I-5Long-Maturity Government Bond Yields Would Have Room To Move A Lot Higher Absent Any Shocks To Demand...
Long-Maturity Government Bond Yields Would Have Room To Move A Lot Higher Absent Any Shocks To Demand...
Long-Maturity Government Bond Yields Would Have Room To Move A Lot Higher Absent Any Shocks To Demand...
Chart I-6...Unfortunately, US Consumers Are Clearly Experiencing A Shock In The Form Of Sharply Lower Real Wages
...Unfortunately, US Consumers Are Clearly Experiencing A Shock In The Form Of Sharply Lower Real Wages
...Unfortunately, US Consumers Are Clearly Experiencing A Shock In The Form Of Sharply Lower Real Wages
Panel 2 of Chart I-4 also shows that the 30-year mortgage rate in the US is now at neutral levels, in contrast to government bond yields and the US policy rate. Chart I-7 highlights that our models for US home sales and starts, featured in last month’s report,4 are still not pointing to a severe slowdown in the housing market. However, the fact that mortgage rates have risen to neutral territory means that it is possible that the usual ingredients for a recession – tight monetary policy plus a shock to aggregate demand – are currently present or soon will be. On the question of services spending acting as a support for US economic growth as goods spending slows, we continue to believe that services spending will recover back towards its pre-pandemic trend – funded by excess savings that accrued during the pandemic. However, Chart I-8, presented by my colleague Arthur Budaghyan in a recent Emerging Markets Strategy report,5 underscores the extent of the wealth destruction that has occurred because of the joint effect of falling stock and bond prices. At least some of the services-boosting effect of excess savings will likely be blunted by a negative wealth effect stemming from these financial market losses, especially since the remaining excess savings in the US are likely held by middle-to-upper income households – who are the disproportionate holders of publicly-traded financial assets. Chart I-7No Sign Yet Of A Sharp Slowdown In The Housing Market, But The Ingredients Of A Typical Recession May Be Present
No Sign Yet Of A Sharp Slowdown In The Housing Market, But The Ingredients Of A Typical Recession May Be Present
No Sign Yet Of A Sharp Slowdown In The Housing Market, But The Ingredients Of A Typical Recession May Be Present
Chart I-8A Significant Wealth Shock May Blunt The Deployment Of The Excess Savings Accrued During The Pandemic
A Significant Wealth Shock May Blunt The Deployment Of The Excess Savings Accrued During The Pandemic
A Significant Wealth Shock May Blunt The Deployment Of The Excess Savings Accrued During The Pandemic
On the inflation front, the May CPI release – and the Fed’s reaction to it – underscores that the US economy is at risk of a recession unless supply-side inflation dissipates quickly. Chart I-9 highlights that the May CPI release directly contradicted the view that the monthly rate of change in inflation has peaked. In addition, Chart I-10 presents a breakdown of the percent change in May’s headline consumer price index, with each bar in the chart representing the contribution of that category to headline CPI rising faster than 4% (annualized). The note next to each bar highlights our view of the main driver of that price category, and the color of the bars denotes how probable it is that we will soon see a significant easing in price pressure. Chart I-9The May CPI Report Was Clearly Inconsistent With A Peak Inflation Narrative
The May CPI Report Was Clearly Inconsistent With A Peak Inflation Narrative
The May CPI Report Was Clearly Inconsistent With A Peak Inflation Narrative
Chart I-10Some Elements Of Outsized CPI Will Dissipate Soon. Others May Not.
July 2022
July 2022
The chart makes it clear that certain price categories that have been strongly contributing to outsized headline inflation are likely to peak or even turn deflationary over the next few months. Gasoline and fuel oil inflation is clearly being driven by the trend in crude oil prices, which in our view will likely be flat for the rest of the year. In addition, motor vehicles and parts inflation continues to be driven by the impact of supply-chain shortages on vehicle production. Over the past year, the volume of industrial production of motor vehicle assemblies has averaged just 83% of its pre-pandemic level, which we noted in last month’s report now finally seems to be normalizing (Chart I-11). And while airlines have experienced legitimate cost increases due to rising fuel prices and COVID-related labor shortages, panel 2 of Chart I-11 highlights that real airfares have risen well above their pre-pandemic level. This underscores that a moderation in airfares is quite likely over the coming several months. However, Chart I-10 also highlights that there are several price categories that are less likely to ease quickly. Outsized food and energy services inflation has recently been tied to natural gas prices, given that natural gas is used to generate electricity and is a key element used in the production of fertilizer. Chart I-12 highlights that food inflation has been strongly correlated with the producer price index for pesticide, fertilizer, and other agricultural chemicals, and that there is no sign yet of the latter abating. Despite the fact that global wheat prices have recently been falling, the recent increase in European natural gas prices is likely to exacerbate US food inflation, as fertilizer is used to produce all major planted crops. In addition, European energy insecurity has created an even stronger link between the US and European natural gas markets than what prevailed prior to the Ukrainian war, because of what is likely to be permanently higher LNG demand from Europe. Chart I-11Vehicle And Airfare Inflation Is Likely To Ease Soon
Vehicle And Airfare Inflation Is Likely To Ease Soon
Vehicle And Airfare Inflation Is Likely To Ease Soon
Chart I-12Food Inflation May Remain Elevated For Some Time
Food Inflation May Remain Elevated For Some Time
Food Inflation May Remain Elevated For Some Time
On top of what is likely to be persistent food and energy services inflation, shelter inflation is likely to stay elevated for some time – a point highlighted by my esteemed former colleague, Martin Barnes, in Section 2 of this month’s report. The unemployment rate and house prices are the two main drivers of shelter inflation, and the effect of the latter clearly lags because owner’s equivalent rent is a surveyed measure. The fact that mortgage rates have risen so significantly points to a meaningful slowdown in house price appreciation and possibly even mild deflation, so shelter inflation will eventually slow. The Federal Reserve has made it clear, however, that they are now focused on quickly bringing down consumer prices, even at the cost of a recession. The justification for the Fed’s impatience comes straight from the Modern-Day Phillips Curve, which we discussed in great detail in our January 2021 Special Report.6 Economic theory dictates that inflation should be “normal” when the economy is in equilibrium – defined as economic growth in line with potential growth, no economic/labor market slack, and no supply-side shocks affecting prices. In the minds of many investors, “normal” inflation means the central bank’s target for inflation, but that is not necessarily the case. The experience of the 1970s highlighted that “normal” inflation is the rate that is expected by households and firms, and that the Fed will only succeed at achieving target inflation under normal economic conditions if inflation expectations are consistent with its target. The Fed’s failure to prevent inflation expectations from shifting higher on a structural basis led to two debilitating recessions in the early 1980s, and a prolonged period over which the Fed had to maintain comparatively tight monetary policy. This is a mistake that the Fed does not want to make again. Chart I-13Headline Inflation, Not Core, Is Driving Long-Term Inflation Expectations
Headline Inflation, Not Core, Is Driving Long-Term Inflation Expectations
Headline Inflation, Not Core, Is Driving Long-Term Inflation Expectations
Consistent with that view, Jerome Powell made it clear during the June FOMC meeting press conference that the Fed is now very concerned that long-term household inflation expectations may become unanchored to the upside. Powell implicitly referenced the University of Michigan’s 5-10 year median household inflation expectations survey during the press conference, which we have described in several previous reports as one of the most important macro data series for investors to monitor. The final reading for June came in materially lower than what was suggested by the preliminary report, but they were already at risk of a breakout even before the June release. In addition, Chart I-13 highlights that it is headline inflation (not core) that appears to be the main driver of rising long-term household inflation expectations, which raises a troubling point. If the Fed decides that inflation expectations need to be quickly reined in even at the cost of a higher unemployment rate, that decision implies that it is headline inflation that needs to return rapidly towards the Fed’s target, not just core. Given that some price categories shown in Chart I-10 are likely to be sticky for some time, and that the chart accounted for deviations in headline inflation from 4% (which itself is above the Fed’s target), the implication is that the Fed may have to crowd out demand for goods and services that are comparatively less affected by supply-side constraints. That would be clearly negative for economic growth, and is potentially recessionary in nature. As a final point, it is not just the potential for future economic weakness that concerns us. The US economy was already slowing prior to the Fed’s hawkish pivot and Russia’s invasion of Ukraine, and important indicators for economic activity continue to deteriorate. Chart I-14 highlights that the S&P Global US manufacturing and services PMIs fell meaningfully in June, and Chart I-15 highlights that the Conference Board’s US leading economic indicator continues to deteriorate. In fact, the Conference Board’s LEI has now decreased for three consecutive months, and the bottom panel of Chart I-15 highlights that four consecutive month-over-month declines have all essentially been associated with a recession. 2006 seemingly stands out as an exception to this rule, but given the fact that the housing market downturn began two years before the recession officially started, we simply regard this as an early recessionary signal rather than a false one. Chart I-14The US Is Losing Economic Momentum
The US Is Losing Economic Momentum
The US Is Losing Economic Momentum
Chart I-15The Conference Board's LEI May Soon Send A Recessionary Signal
The Conference Board's LEI May Soon Send A Recessionary Signal
The Conference Board's LEI May Soon Send A Recessionary Signal
No Help From Europe Or China An overweight stance towards global equities might still be warranted in the face of a significant slowdown in US economic activity if economic growth in Europe or China were accelerating. However, the European outlook has been strongly tied to natural gas flows from Russia since the invasion of Ukraine, which tightened meaningfully in June in response to Europe’s oil ban, the looming expansion of NATO, and Europe’s success at replenishing its amount of natural gas in storage. Russia has not fully weaponized its natural gas exports and its actions so far have fallen well short of a complete cutoff, but prices have risen close to 70% over the past month, forcing Germany to trigger the alert level of its emergency gas plan. Aside from the negative impact that higher natural gas prices will have on headline inflation globally, this is obviously incrementally negative for European economic activity. Chart I-16 highlights that the German IFO business climate indexes have led the S&P Global Germany PMI lower over the past few months, and that they imply further manufacturing weakness. And while the services climate index for Germany ticked higher, it remains meaningfully below the levels that prevailed last summer and implies a deterioration in German services activity over the coming few months. In China, we see no compelling signs of a sustainable pickup in economic activity that will provide a ballast to slowing growth in the DM world. We have seen a bounce back in some activity indicators following the significant easing of restrictions in Shanghai and Beijing (Chart I-17). These indicators, however, are still quite weak, and it is likely that China will experience significant further COVID outbreaks over the coming 6-12 months. Chart I-16Europe's Economy Is Likely To Slow Further
Europe's Economy Is Likely To Slow Further
Europe's Economy Is Likely To Slow Further
Chart I-17China's Post-Lockdown 'Recovery' Remains Tepid
China's Post-Lockdown 'Recovery' Remains Tepid
China's Post-Lockdown 'Recovery' Remains Tepid
While Chinese stocks have been rallying in absolute terms over the past few weeks, Chart I-18 highlights that this is essentially the only positive market-based signal about the pace of economic activity in China. The chart highlights that our market-based China Growth Indicator has experienced a renewed down leg, and that the diffusion index never rose above the boom/bust line earlier this year. The recent decline in industrial metals prices is also not a positive market-based signal for Chinese economic activity (Chart 19). Some investors have argued that weak metals prices reflect growth concerns outside of China, but even if that is the case, it implies that China’s reopening will not be forceful enough to offset slowing global ex-China growth. Chart I-18Market-Based Signals Are Not Pointing To An Improvement In Chinese Economic Activity
Market-Based Signals Are Not Pointing To An Improvement In Chinese Economic Activity
Market-Based Signals Are Not Pointing To An Improvement In Chinese Economic Activity
Chart I-19Metals Prices Are Now Falling, Highlighting Mounting Global Growth Fears
Metals Prices Are Now Falling, Highlighting Mounting Global Growth Fears
Metals Prices Are Now Falling, Highlighting Mounting Global Growth Fears
Has The US Equity Market Already Priced In A Recession? One very important question for investors to answer is how much further downside is likely to occur for US equities in the event of a US recession. At its worst point in mid-June, the S&P 500 fell close to 24% from its early January high, and many investors have since questioned whether the US equity market is already priced for a potential contraction in output. Chart I-20The S&P 500 Is Not Currently Priced For A US Recession
July 2022
July 2022
We disagree with this perspective, and believe that the S&P 500 would fall close to 3100 in a typical recession scenario. Chart I-20 presents a range of estimates for the S&P 500 based on a Monte Carlo approach, using what we believe are feasible ranges for the US equity risk premium, real 10-year government bond yields, and the extent of the decline in 12-month forward earnings per share. The chart shows that the equity market only has a positive return at the 5th percentile, which can be interpreted as just a 5% chance that the US equity market has already priced in the impact of a recession. Charts I-21 and I-22 highlight the range of possible outcomes that we used when modeling the likely decline in stock prices in a recession scenario. We assume that the equity risk premium, defined here as the difference between the S&P 500 12-month forward earnings yield and 10-year TIPS yields, rises on average to its early-March level in the wake of Russia’s invasion of Ukraine. We assume that both 10-year nominal Treasury yields and 10-year breakeven inflation rates fall to 2%, reflecting an expectation that 10-year TIPS yields will not return to negative territory in a recessionary scenario. Finally, we expect that S&P 500 forward EPS will decline by 15% from current levels, which is in line with the historical average decline in 12-month trailing operating EPS during recessions. Chart I-21We Do Not Expect Real Bond Yields To Fall Back Into Negative Territory In A Typical Recession Scenario
We Do Not Expect Real Bond Yields To Fall Back Into Negative Territory In A Typical Recession Scenario
We Do Not Expect Real Bond Yields To Fall Back Into Negative Territory In A Typical Recession Scenario
Chart I-22We Expect Earnings To Decline Between 10-20% In A Recession
We Expect Earnings To Decline Between 10-20% In A Recession
We Expect Earnings To Decline Between 10-20% In A Recession
One key takeaway from our analysis is that the likely recessionary equity market decline projected by our approach is fairly close to our estimate of the likely decline in earnings. One potential pushback against our view that earnings will fall in line with what usually occurs during recessions is the fact that nominal revenue growth may only mildly contract or may not contract at all in a recession that is occurring due to high rates of inflation (and thus higher prices charged by firms). Chart I-23 highlights that 12-month trailing S&P 500 sales per share growth never turned negative in the 1970s, even following the 1970 and 1974 recessions. Chart I-23Revenue Growth Did Not Contract In The 1970s, And May Not Contract Significantly If A Recession Occurs Today...
Revenue Growth Did Not Contract In The 1970s, And May Not Contract Significantly If A Recession Occurs Today...
Revenue Growth Did Not Contract In The 1970s, And May Not Contract Significantly If A Recession Occurs Today...
There are two counterpoints to this argument. First, the current risk of a recession mostly stems from the Fed’s determination not to repeat the mistakes that it made during the 1970s, meaning that inflation expectations are unlikely to rise to the level that they did during that period in advance of a recession. That implies that actual inflation, and thus corporate pricing power, will come down significantly during a recession. Second, even in a scenario in which a recession occurs and S&P 500 revenue growth contracts less aggressively than it has during previous recessions, Chart I-24 highlights that the mean-reversion risks to earnings from falling profit margins are quite high. The chart shows that even if profit margins were merely to return to their pre-pandemic levels during a recession (which would actually be a comparatively mild decline given the historical behavior of margins during recessions), it would imply close to a 20% contraction in earnings if sales per share growth were flat. Given this, we feel that our assumption of a 10-20% decline in earnings per share in a recessionary scenario is reasonable. Chart I-24But Profit Margins Are At Great Risk Of A Significant Decline If The Economy Contracts
But Profit Margins Are At Great Risk Of A Significant Decline If The Economy Contracts
But Profit Margins Are At Great Risk Of A Significant Decline If The Economy Contracts
There is another important takeaway from our analysis, which is that the decline in bond yields that will occur in a recessionary scenario will likely be more than offset by a rise in the equity risk premium. Another potential pushback against our view that the US equity market has already priced in a recession is focused on our assumption that the 10-year US Treasury yield will only fall back to 2%, and that real 10-year yields will not return to negative territory. For some investors, this assumption seems far too high, given the structural decline in long-maturity bond yields over the past decade and the fact that the 10-year yield stood below 2% at the beginning of the year when the odds of a recession were lower than they are today. In response to this, we offer three points for structurally-bullish bond investors to consider. The first is that the decline in the nominal 10-year US Treasury yield to 0.5% in 2020 was extremely irregular and it occurred because of the extent of the essentially unprecedented economic weakness wrought by the pandemic. This is absolutely the wrong yield benchmark to use in a typical recession scenario, because the Fed’s response to the recession will be much less aggressive. The second point is related to the first, in that negative real 10-year government bond yields have been heavily driven by the secular stagnation narrative and the general view that the natural/neutral rate of interest has permanently fallen. We agree that the neutral rate of interest fell for a time following the global financial crisis, but we believe strongly that it rose in the latter half of the last economic expansion as US households aggressively deleveraged their balance sheets. Academic estimates of R-star, such as that derived from the previously popular (but now discontinued) Laubach-Williams model, continued to point to a low neutral rate from 2015-2019 because of the deflationary impact of an energy-driven decline in long-term inflation expectations on actual inflation, a factor that is clearly no longer present. Chart I-25We Doubt That The Fed Will Resort To QE When The Next Recession Occurs
We Doubt That The Fed Will Resort To QE When The Next Recession Occurs
We Doubt That The Fed Will Resort To QE When The Next Recession Occurs
Finally, we agree that the existence of the Fed’s asset purchase program has likely had some impact on the 10-year term premium over the past decade. We doubt that the Fed would resort to QE as a monetary policy tool in response to a conventional recession, implying that the term premium will not fall as low as it has over the past decade when growth slowed or contracted. Chart I-25 highlights one important reason for this. Since 2008, the Fed’s use of asset purchases has been part of a strategy to ease monetary policy further when the policy rate had already fallen to zero, to meet its dual mandate of maximum employment and price stability. The chart highlights that even just prior to the pandemic, a persistent gap existed between the headline and core PCE deflator and the level that would have prevailed if both deflators had grown at a 2% annual rate since the onset of the 2008 recession. The chart makes it clear that this gap will completely disappear within the next 12 months for both the headline and core deflator, if the recent pace of change in prices is sustained. In effect, Chart I-25 highlights that the entire post-GFC missed inflation-target era is almost over, which severely undercuts the idea that the Fed will resort to QE as a monetary policy tool in a recession scenario unless the contraction is very severe as it was in 2008 and 2020. We doubt that this will be the case if a recession does occur, implying that both a deeply negative term premium and a significant decline in the 5-year/5-year forward bond yield in a typical recession scenario is unlikely. Investment Conclusions Wayne Gretsky’s famous quotation, that he “skate[s] to where the puck is going, not where it has been” is often invoked by BCA strategists. Successful active investing requires anticipation rather than reaction, and it is legitimate for investors to ask whether downgrading risky assets at the current juncture represents the latter rather than the former. We are cognizant of that risk, but we are also mindful of the importance of capital preservation. When we wrote our annual outlook last year, we believed fairly confidently that inflation would peak and specifically that supply-side inflation would wane. We still believe that pandemic-related effects on consumer prices will eventually dissipate, and it is still possible that inflation is in the process of peaking. Recent evidence, however, about the pace of price advances, the clear impact that high inflation is having on real wage growth, and the Fed’s desire to see consumer prices fall quickly back toward its target, means that the cyclical economic outlook is now highly dependent on the speed at which prices normalize – not just whether it will occur. To us, that implies that investors need to have a high-conviction view that supply-side inflation will normalize soon in order to stay overweight risky assets, and that the Fed will look through elevated housing-related inflation that is likely to persist for several months. At least in the case of supply-side inflation, we think normalization is probable but we no longer have high conviction about the speed of adjustment. As such, we recommend that investors maintain no more than a neutral stance towards stocks versus bonds in a global multi-asset portfolio. We also recommend that investors increase their allocation to government bonds within a global fixed income portfolio (to overweight), at the expense of corporate bonds, as part of an overall shift towards more defensive positions. In terms of other important asset class allocations, we recommend the following: Within a global equity portfolio, maintain a neutral regional allocation, a neutral stance toward cyclicals versus defensives, and a neutral stance towards small-cap stocks versus their large-cap peers. Modestly favor value stocks over growth stocks, as most of the outsized outperformance of growth stocks during the pandemic has already reversed. Within a fixed-income portfolio, a modestly short stance is warranted over the coming 6- to 12-months. Extremely stretched technical and valuation conditions point to a bearish view towards the US dollar over the coming 6- to 12-months, but USD will likely remain well-bid over the nearer-term. We are only likely to upgrade our cyclical USD call in a scenario in which we recommend underweighting global equities within a multi-asset portfolio. As noted above, financial markets rarely trend sideways over 6-to-12 month periods. We regard a neutral global asset allocation stance as a temporary stepping stone to either a further downgrade of risky assets to underweight or an increase in risky asset exposure back to a high-conviction overweight. Thus, additional changes to our recommended cyclical allocation may occur over the coming few months, in response to the incoming data and our assessment of the likely implications for monetary policy. Stay tuned! Jonathan LaBerge, CFA Vice President The Bank Credit Analyst June 30, 2022 Next Report: July 28, 2022 II. Inflation Whipsaw Ahead Dear Client, This month’s Special Report has been written by Martin Barnes, BCA’s former Chief Economist. Martin, who retired from BCA Research last year after a long and illustrious career, discusses the long-run outlook for inflation. The views expressed in this report are his, and may not be consistent with those of the Bank Credit Analyst or other BCA Research services. But Martin’s warning of future stagflation is sobering, and I trust you will find his report both interesting and insightful. Jonathan LaBerge, CFA The Bank Credit Analyst Overly stimulative policies meant that inflation was set to rise even before the disruptions caused by the pandemic and Ukraine conflict. Inflation should decline sharply over the coming year in response to weaker economic growth and an easing in supply problems. But it will be a temporary respite. Central banks will not have the stomach to keep policy tight enough for long enough to squeeze inflation out of the system. Price pressures will return as economies bottom and the environment will become one of stagflation. Financial assets will rally strongly when inflation fears subside but subsequent stagflation will not be bullish for markets. Former Federal Reserve Chairman Alan Greenspan once defined price stability as existing when “households and businesses need not factor expectations of changes in the average level of prices into their decisions”. Until recently, that state of affairs was the case for much of the past 30 years and for many, inflation was quiescent during their entire working lives. But inflation is now back as a huge issue and there is massive debate and uncertainty about whether it will be a temporary or lasting problem. I lean toward the latter view. Major changes in the economic and/or financial environment more often are identified in hindsight than in real time. It is easier to attribute large trend deviations to temporary factors than to make bold predictions about structural shifts. Obviously, the pandemic and conflict in Ukraine have had a significant impact on the near-term inflation picture via massive supply-side disruptions and represent temporary events. Thus, inflation will retreat from current elevated levels as those disruptions diminish. But the conditions for higher inflation were already in place before those two unfortunate events occurred. Specifically, central banks have been erring on the side of stimulus for several years and they will find it extremely difficult, if not impossible, to put the inflation genie back into the bottle. Inflation has moved from a non-issue to the most important factor driving markets. Over the next year, the next big surprise might be how fast inflation retreats and investors and policymakers will then breathe a big sigh of relief. However, this will prove to be a temporary respite because it will not take long for inflation to move back up and remain stubbornly above central bank targets. In other words, a whipsaw is in prospect over the next few years as inflation goes from up, to down, and to up again. The Current Inflation Problem The biggest increases in consumer prices have occurred in areas most affected by supply problems, with energy attracting the most attention. Nevertheless, in most countries, inflation has risen across the majority of goods and services. The core inflation rate (i.e. consumer prices excluding food and energy) in the G7 economies climbed from 2% to 4.8% between April 2021 and April 2022 (Chart II-1). Meanwhile, the Cleveland Fed’s trimmed mean measure of US consumer price inflation has spiked dramatically higher, consistent with a broad-based acceleration in inflation.7 The rise in underlying inflation is a bigger problem in the US, UK and Canada than in Japan or the Euro Area. Chart II-2 shows current core inflation rates relative to the target rate of 2% pursued by most central banks. That geographical divergence will be touched on later and in the meantime, the focus will be on the US situation. Chart II-1A Broad-Based Pickup In Inflation
A Broad-Based Pickup in Inflation
A Broad-Based Pickup in Inflation
Chart II-2The US, UK And Canada Have A Bigger Inflation Problem
July 2022
July 2022
The latest US inflation data for a range of goods and services is shown in Table II-1. The table shows the three- and six-month annualized changes in prices because 12-month rates can be affected by a base effect given the impact of pandemic-related shutdowns and disruptions a year ago. Also, a comparison of the three- and six-month rates shows if momentum is building or fading. The trends are not encouraging in that momentum has accelerated, not diminished in many key areas. Table II-1Selected Inflation Rates In The US CPI
July 2022
July 2022
Even if the data show a moderation in core inflation in the months ahead, it is important to note that rent inflation – the CPI component with the biggest weight – is seriously underestimated. This is one of the few items where prices are collected with a lag and real estate industry reports highlight that rent inflation is running at double-digit rates in the major cities. According to one report, average rents nationally increased by more than 25% in the year to May.8 The CPI data will eventually catch up with reality, providing at least a partial offset to any inflation improvements in other areas. Another problem for inflation is the acceleration in wage growth against the backdrop of an unusually tight labor market. Currently, the number of unfilled vacancies is almost twice the number of unemployed and it is thus no surprise that wage growth has picked up sharply (Chart II-3). The Atlanta Fed’s measure of annual wage inflation has risen above 6%, its highest reading since the data began in 1997. Wage growth is unlikely to suddenly decline absent a marked rise in the unemployment rate. There is much debate about whether the US economy is on the verge of recession, but let’s not get bogged down in semantics. Regardless of whether the technical definition of recession is met (at least two consecutive quarters of negative GDP growth), the pace of activity is set to slow sharply. Plunging consumer and business confidence, contracting real incomes and a peaking in housing activity all point to a significant weakening in growth, even if the labor market stays healthy (Chart II-4). Chart II-3A Very Tight US Labor Market
A Very Tight US Labor Market
A Very Tight US Labor Market
Chart II-4The US Economy Is In Trouble
The US Economy is in Trouble
The US Economy is in Trouble
Softer economic growth eventually will take the edge off inflationary pressures in many goods and services. Combined with an easing in supply-side disruptions, the inflation rate is certain to decline in the coming year, even if oil prices move higher in the short run. Currently, the Fed is talking tough about dealing with inflation and there is little doubt that further rate hikes are on the way. However, policymakers will have little stomach for inflicting enough economic pain to completely squeeze inflation out of the system. Once there are clear signs of a significant economic slowdown, the Fed will back off quickly. What Causes Inflation Anyway? Economics 101 teaches that prices are determined by the interaction of supply and demand. If the demand for a good or service exceeds supply, then prices will rise to bring things back into balance. Seems simple enough but, unfortunately, this leaves many unanswered questions. How much must prices rise and for how long in order to restore balance? What if there are structural impediments to supply? What if there are monopolies in key commodities or services? What if policy interferes with the operation of market-clearing solutions? And, finally, what measure of inflation should we be looking at? Chart II-5Inflation Is A 'Modern' Issue
Inflation is a 'Modern' Issue
Inflation is a 'Modern' Issue
For much of economic history, deflation was just as prevalent as inflation, with the latter only being a problem during periods of war (Chart II-5). As the pre-WWII world pre-dated fiat money, automatic stabilizers (e.g. the welfare state), and counter-cyclical fiscal policy, economies were prone to regular depressions that served to wash out financial and economic excesses and any inflationary pressures. But those days are long gone and free market forces should not be expected to keep inflation under wraps. I rather like the simple explanation of inflation’s roots as being “too much money chasing too few goods”. In that sense, the control of inflation lies firmly at the door of central banks. In the “old days” (i.e. before the 1990s), it was possible to use the growth in the money supply to gauge the stance of policy because there was a fairly stable and predictable relationship between monetary and economic trends. That all ended when financial deregulation and the explosion in non-bank financial activities meant that monetary trends ceased to be a reliable indicator of economic growth and inflation. As a result, the Fed stopped setting monetary growth targets more than 20 years ago and since then, money supply data has rarely been mentioned in FOMC discussions. Chart II-6A Simple Measure Of The Monetary Stance
A Simple Measure of the Monetary Stance
A Simple Measure of the Monetary Stance
Fortunately, all is not lost. The gap between the federal funds rate and nominal GDP growth is a reasonably good proxy for the stance of monetary policy. Conditions are easy when rates are persistently below GDP growth and vice versa when they are above. As can be seen in Chart II-6, rates were below GDP growth during most of the 1960s and 1970s, a period when inflation rose sharply. And inflation fell steadily in the 1980s into the first half of the 1990s when the Fed kept interest rates above GDP growth. And look at what has happened in the past decade: rates have been significantly below GDP growth, suggesting an aggressively easy monetary stance. It was only a matter of time before inflation picked up, even without the recent supply-side disruptions. The FOMC’s latest projections show long-run growth of 3.8% in nominal GDP while the fed funds rate is expected to average only 2.5%. That implies a continued accommodative stance, yet inflation is forecast to be in line with the 2% target. That all seems very unlikely. Fed policymakers spend a lot of time trying to figure out the level of the equilibrium real interest rate – the level consistent with steady non-inflationary economic growth. It would be very helpful to have this number but coming up with an accurate measure is a largely futile exercise. It cannot be measured empirically and its estimation requires a lot of assumptions, explaining why there is no broad agreement on what the right number is. I think there is a case for the simpler approach of using the nominal growth in GDP as a proxy for where rates should be in normal circumstances. As noted above, that suggests monetary policy was excessively accommodative for an extended period. If US Policy Was Too Easy, Why Was Inflation Low For So Long? The Fed’s preferred measure of underlying inflation is the change in the personal consumption deflator, excluding food and energy. In the 25 years to 2019, inflation by this measure averaged only 1.7%, compared to the Fed’s desired level of 2%. Thus, even though the level of interest rates implied very accommodative policy over that period, inflation remained tame. This leads to an important caveat. The stance of monetary policy plays the key role in driving inflation, but it is not everything. Offsetting forces on inflation (in both directions) can mute or even swamp the impact of policy. There were several disinflationary forces in operation during the past 25 years. Specifically: In the second half of the 1990s, the explosive growth of the internet and accompanying boom in technology spending led to a marked pickup in productivity growth. The entry of China into the World Trade Organization at the end of 2001 unleashed a wave of offshoring and downward pressure on traded goods prices. A series of deflationary shocks hit the US and global economy including the 1998 financial crisis in South-East Asia and Russia, the bursting of the tech bubble after 2000, and of course the global financial meltdown in 2007-09. Unstable economic conditions undermined labor’s bargaining power, keeping a tight lid on wage growth. This was highlighted by the dramatic decline in labor’s share of income after 2000. Importantly, the above forces are no longer in place and in some cases are reversing. The key technological advances of the past decade have not been particularly good for productivity. Indeed, one could argue that the activities of most so-called FANG stocks – especially those involved in social media - have had a negative impact on productivity. Time spent on FaceBook, Twitter and Netflix do not have obvious benefits for increased economic efficiency. Chart II-7Globalization In Retreat
Globalization in Retreat
Globalization in Retreat
Even before the pandemic’s impact on supply chains, there were signs that globalization had peaked (Chart II-7). Indeed, BCA first suggested in 2014 that globalization was running out of steam. More recently, the interruption to supply chains has highlighted the downside of relying excessively on overseas production for key goods such as semi-conductors and pharmaceuticals. Onshoring rather than offshoring will become more common with higher prices being the cost for greater control over supply. Globalization is not dead, but, at the margin, it no longer is a powerful source of disinflation. US import prices from China are back to their highest level in a decade after falling steadily during the eight years to 2020. The inflationary impact of the pandemic and the war in Ukraine via supply-side disruptions are more than offsetting any disinflationary effects of softer economic growth. In other words, they have represented stagflationary rather than deflationary shocks. Finally, with regard to income shares, the pendulum has swung more in favor of labor. Demographic trends (e.g. slow growth in the working-age population) suggest that the labor market will remain relatively tight in the years ahead, notwithstanding short-term weakness as the economy slows. Profit margins are likely to weaken and labor’s share of income will rise. The bottom line is that easy money policies will no longer be offset by a number of powerful external forces that served to keep consumer price inflation under wraps in the pre-pandemic period. And this raises another important point. If monetary policy is too easy, then it will show up somewhere, even if consumer price inflation is under control. There Is More Than One Kind Of Inflation Inflation most commonly refers to the change in the prices of consumer goods and services. That is understandable because consumer spending accounts for more than half of GDP in the major developed economies (and almost 70% in the US). And because consumers are the ones who vote, it is the inflation rate that politicians care most about. However, there are other kinds of inflation. If there are structural impediments to increased consumer prices, then excessively easy monetary policy most likely will show up in higher asset prices. This is a very different kind of inflation because it is welcomed by the owners of assets and by politicians. Nobody is happy to face higher prices for the goods and services they buy, but asset owners love the wealth-boosting effect of higher prices for homes and shares. Consumer inflation may have been subdued in the pre-pandemic decade, but the same is not true for asset prices. During the period that the Fed ran accommodative policies, there were several periods of rampant asset inflation such as the tech stock bubble of the late 1990s, the housing bubble of the 2000s, and the bond bubble of 2016-2020. And both equity and home prices surged in response to monetary stimulus triggered by the pandemic. Central banks may fret about the potential financial stability implications of surging asset prices, but in practice they do not act to curb them. Policymakers argue that it is hard to determine when an asset bubble exists and even when one is obvious, monetary policy is a crude tool to deal with it. If rising asset prices occur alongside an economy that is characterized by stable growth and moderate inflation, then acting to burst a bubble could inflict unnecessary economic damage. That is an understandable position, but it means ignoring the longer-term problems that occur when bubbles inevitably burst. This was highlighted by the economic and financial chaos after the US housing bubble burst in 2007. The reality is that central banks have been forced to rely more heavily on asset inflation as a source of monetary stimulus. An easing in monetary policy affects economic conditions in three primary ways: boosting credit demand and supply, raising asset prices, and lowering the exchange rate.9 Historically, the credit channel was by far the most important. BCA has written extensively about the Debt Supercycle and the role of monetary policy in fueling ever-rising levels of private sector indebtedness (see the Appendix for a brief description of the Debt Supercycle). Chart II-8No Releveraging Cycle In Household Debt
No Releveraging Cycle in Household Debt
No Releveraging Cycle in Household Debt
The environment changed dramatically after the 2007-09 financial meltdown. The collapse of the credit-fueled housing bubble drove a stake through the heart of the household sector’s love affair with debt. The ratio of household debt to income peaked in early 2009 and ten years later it was back to the levels of 2001 (Chart II-8). Even an extended period of record low interest rates has failed to trigger a new leveraging cycle. If the Fed can’t persuade consumers and businesses to fall back in love with debt, then it must rely on the other two transmission channels for monetary policy – asset prices and the exchange rate. And the Fed really has limited control over the latter channel given that it also depends on the actions of other central banks. The deleveraging of the household sector in the post-2009 period could have been very bearish for the economy, but the Fed’s easy money policies underpinned the stock market, allowing household net worth to revive. There was an explosive rise in household net worth in 2020-21 as surging house prices added to stock market gains. Between end-2019 and end-2021, the household sector’s direct holdings of equities plus owner’s equity in real estate increased in value by around $20 trillion, equal to more than one year’s personal disposable income. The recent decline in equity prices has reversed some of the gains, but net worth remains elevated by historical standards. The bottom line is that it was wrong to suggest that the Fed’s accommodative stance did not create inflation. Consumer price inflation was tame in the pre-pandemic period, but there was lots of asset inflation and that gathered pace in 2020 and 2021. There was always going to be some leakage of this into more generalized inflation but this was accelerated by the double whammy of the supply disruptions caused by the pandemic and the Ukraine war. The Strange Case Of Japan If higher inflation in the US has seemed inevitable, how can one explain the situation in Japan? In contrast to other developed countries, Japan’s annual core inflation rate was only 0.2% in May. While this was an increase from the average -1.3% rate in the prior six months, it is impressive given the country’s continued highly stimulative monetary policy and the same exposure to supply disruptions as elsewhere. Most importantly, Japan has suffered structural deflation for so long that inflation expectations are totally dormant for both consumers and businesses. In other words, raising prices is seen as a desperate measure and something to be avoided. Japan’s poor demographics may also have played a role. A sharply declining labor force and rapidly aging population are disinflationary rather than inflationary influences and help reinforce the corporate sector’s reluctance to raise prices. While Japan seems an outlier, it is worth noting that core inflation also has remained relatively subdued in many European countries. For the overall Euro area, the latest core inflation rate is 3.8%, well below that of the US and UK. Two common features of the higher inflation countries are that they tended to have more aggressively-easy fiscal policies in recent years and greater asset inflation – especially in real estate. Unfortunately, inflation expectations and business pricing behavior in the US and other Anglo-Saxon economies have not followed Japan’s example. Employees have become more aggressive in demanding higher wages, and most companies have no problem in passing on higher costs to their customers. The UK is facing a wave of public sector strikes over pay the likes of which have not been seen for decades. The Outlook Chart II-9A Peaking In Supply Problems?
A Peaking in Supply Problems?
A Peaking in Supply Problems?
Inflation may prove sticky over the next few months, but as noted earlier, it should move significantly lower over the coming year. Crude oil prices have risen by around 75% in the past year and that pace of rise cannot be sustained. Meanwhile, while shipping rates remain historically high, they are down sharply from earlier peaks (Chart II-9). Together with a revival in Chinese exports, this suggests some easing in supply chain problems. And as mentioned above, the pace of economic activity is set to slow sharply. But a return to pre-pandemic inflation levels is not in the cards. The Fed currently is talking tough and further rate hikes are on the way. But the tightening will end as soon as it becomes clear that the economy is heading south. A deep recession is not likely because there are not the worrying imbalances such as excessive consumer debt or inventories that typically precede serious downturns. However, policymakers will not take any risks and policy will return quickly to an accommodative stance, even though inflation is unlikely to return to the desired 2% level. On a positive note, inflation may be the highest in 40 years in many countries, but we are not facing a return to the destructive high-inflation environment of the 1970s. Inflation back then was institutionalized and a self-feeding cycle of higher wages and rising prices was deeply embedded. I was working as an economist for BP in London in the 1970s and remember receiving large quarterly pay rises just to compensate for inflation. In the absence of inflation-accounting practices, companies seriously underestimated the destruction that inflation was creating to balance sheets and profitability, making them complacent about the problem. Moreover, there were not the same global competitive pressures that exist today. Inflation in the US likely will form a new base of 3% to 4% over the medium term, with occasional fluctuations to 5% or above. An environment of stagflation is in prospect: growth will not be weak enough to suppress inflation and not strong enough to allow the Fed to maintain a restrictive stance. This puts the Fed in a difficult spot as it will be reluctant to admit defeat by raising the inflation target from its current 2%, even though that level will be out of reach in practical terms. A counter view is that I am too pessimistic by underestimating the disinflationary effects of technological advances. A sustained improvement in productivity would certainly help lower inflation but how likely is this? Technological advances are occurring all the time, but in recent years they largely have been incremental in nature and it is hard to think of any new breakthrough productivity-enhancing technologies. There is a difference between new technologies that simply represent better ways to do existing tasks (3D printing would fall into that category) and general purpose technologies that completely change the way economies operate (e.g. electricity and the internet). While businesses are still exploiting the benefits of the digital world, we await innovations that will trigger a new sustained upsurge in productivity. A game changer would be the development of unlimited cheap energy (cold fusion?) but that does not seem likely any time soon. Nevertheless, I will keep an open mind about the potential for productivity to surprise on the upside, despite my current skepticism. Chart II-10Inflation Expectations Spike Higher
Inflation Expectations Spike Higher
Inflation Expectations Spike Higher
What does all this mean for the markets? Not surprisingly, shifts in market expectations for future inflation are highly correlated with the current rate and have thus spiked higher in recent months, hurting both bonds and stocks (Chart II-10). Obvious inflation hedges would be inflation-protected bonds and resources, but neither group currently is attractively priced. The good news is that the current panic about inflation is setting the scene for a buying opportunity in both stocks and bonds. The exact timing is tricky to predict but both stocks and bonds will rally strongly later this year when inflation expectations retreat as it becomes clear that the economy is weakening and the Fed softens its hawkish tones. The bad news is that this bullish phase will not last much more than a year because a re-emergence of inflationary pressures will bring things back to earth. The long-run outlook is one of stagflation and that will be a tough environment for financial assets. Martin H. Barnes Former Chief Economist, BCA Research mhbarnes15@gmail.com Appendix: A Primer On The Debt Supercycle The Debt Supercycle is a description of the long-term decline in U.S. balance-sheet liquidity and rise in indebtedness during the post-WWII period. Economic expansions have always been associated with a buildup of leverage. However, prior to the introduction of automatic stabilizers such as the welfare state and deposit insurance, balance-sheet excesses tended to be fully unwound during economic downturns, albeit at the cost of severe declines in activity. The pain of the Great Depression led governments to intervene to smooth out the business cycle, and their actions were given legitimacy by the economic theories of John Maynard Keynes. Fiscal and monetary reflation, together with the introduction of automatic stabilizers such as unemployment insurance, were successful in preventing the frequent depressions that plagued the pre-WWII economy, but the downside was that balance-sheet imbalances and financial excesses built up during each expansion phase were never fully unwound. Periodic "cyclical" corrections to the buildup of debt and illiquidity occurred during recessions, but these were never enough to reverse the long-run trend. Although liquidity was rebuilt during a recession, it did not return to its previous cyclical high. Meanwhile, the liquidity rundown during the next expansion phase established new lows. These trends led to growing illiquidity, and vulnerability in the financial markets. The greater the degree of illiquidity in the economy, the greater is the threat of deflation. Thus, the bigger that balance-sheet excesses become, the more painful the corrective process would be. So, the stakes became higher in each cycle, putting ever-increasing pressure on the authorities to reflate demand, by whatever means were available. The Supercycle process was driven over time by the building tension between rising underlying deflationary risks in the economy, and the ability of policymakers to create inflation. The Supercycle reached an important inflection point in the recent economic and financial meltdown, with the authorities reaching the limit of their ability to get consumers to take on more leverage. This forced the government to leverage itself up instead, representing the Debt Supercycle's final inning. III. Indicators And Reference Charts BCA’s equity indicators paint a bearish picture for stock prices. Our monetary indicator is now at its weakest in almost three decades and our valuation indicator highlights that stocks are still overvalued, albeit less so than they were last year. Meanwhile, both our sentiment and technical indicators have now broken down very significantly, and are not yet providing a contrarian buy signal. The odds of a US recession over the next 12 months have recently risen, and we now recommend a neutral stance for stocks versus bonds over the coming year. Forward earnings are no longer being significantly revised up, but bottom-up analysts’ expectations for earnings are still too rosy. Although earnings growth is still likely to be positive over the coming year if a US recession is avoided, it will be in the mid-to-low single-digits. Within a global equity portfolio, we recommend a neutral stance on cyclicals versus defensives, small caps versus large, and a neutral stance on regional equity allocation. Within a fixed-income portfolio, investors should stay modestly short duration. The increase in commodity prices that followed Russia’s invasion of Ukraine has cooled, and prices are now rolling over significantly on the back of global growth concerns. Our composite technical indicator has dropped meaningfully, indicating that commodities are now no longer overbought. Our base-case view is that oil prices have peaked, but there some risk to that view given the current geopolitical situation. In addition, the recent rise in European natural gas prices suggests that global food inflation could remain elevated, given that natural gas is used in the production of fertilizer. We remain structurally bullish on industrial metals, but metals prices are likely to decline further until recessionary concerns abate. US and global LEIs have rolled over significantly and are now edging towards negative territory. The Conference Board’s LEI has now decreased for three consecutive months, and four consecutive month-over-month declines have historically been associated with a recession. Our global LEI diffusion index has bottomed, but we are not convinced that this heralds a major upturn in the LEI itself. EQUITIES: Chart III-1US Equity Indicators
US Equity Indicators
US Equity Indicators
Chart III-2Willingness To Pay For Risk
Willingness To Pay For Risk
Willingness To Pay For Risk
Chart III-3US Equity Sentiment Indicators
US Equity Sentiment Indicators
US Equity Sentiment Indicators
Chart III-4US Stock Market Breadth
US Stock Market Breadth
US Stock Market Breadth
Chart III-5US Stock Market Valuation
US Stock Market Valuation
US Stock Market Valuation
Chart III-6US Earnings
US Earnings
US Earnings
Chart III-7Global Stock Market And Earnings: Relative Performance
Global Stock Market And Earnings: Relative Performance
Global Stock Market And Earnings: Relative Performance
Chart III-8Global Stock Market And Earnings: Relative Performance
Global Stock Market And Earnings: Relative Performance
Global Stock Market And Earnings: Relative Performance
FIXED INCOME: Chart III-9US Treasurys And Valuations
US Treasurys And Valuations
US Treasurys And Valuations
Chart III-10Yield Curve Slopes
Yield Curve Slopes
Yield Curve Slopes
Chart III-11Selected US Bond Yields
Selected US Bond Yields
Selected US Bond Yields
Chart III-1210-Year Treasury Yield Components
10-Year Treasury Yield Components
10-Year Treasury Yield Components
Chart III-13US Corporate Bonds And Health Monitor
US Corporate Bonds And Health Monitor
US Corporate Bonds And Health Monitor
Chart III-14Global Bonds: Developed Markets
Global Bonds: Developed Markets
Global Bonds: Developed Markets
Content Chart III-15Global Bonds: Emerging Markets
Global Bonds: Emerging Markets
Global Bonds: Emerging Markets
CURRENCIES: Chart III-16US Dollar And PPP
US Dollar And PPP
US Dollar And PPP
Chart III-17US Dollar And Indicator
US Dollar And Indicator
US Dollar And Indicator
Chart III-18US Dollar Fundamentals
US Dollar Fundamentals
US Dollar Fundamentals
Chart III-19Japanese Yen Technicals
Japanese Yen Technicals
Japanese Yen Technicals
Chart III-20Euro Technicals
Euro Technicals
Euro Technicals
Chart III-21Euro/Yen Technicals
Euro/Yen Technicals
Euro/Yen Technicals
Chart III-22Euro/Pound Technicals
Euro/Pound Technicals
Euro/Pound Technicals
COMMODITIES: Chart III-23Broad Commodity Indicators
Broad Commodity Indicators
Broad Commodity Indicators
Chart III-24Commodity Prices
Commodity Prices
Commodity Prices
Chart III-25Commodity Prices
Commodity Prices
Commodity Prices
Chart III-26Commodity Sentiment
Commodity Sentiment
Commodity Sentiment
Chart III-27Speculative Positioning
Speculative Positioning
Speculative Positioning
Chart III-28US And Global Macro Backdrop
US And Global Macro Backdrop
US And Global Macro Backdrop
ECONOMY: Chart III-29US Macro Snapshot
US Macro Snapshot
US Macro Snapshot
Chart III-30US Growth Outlook
US Growth Outlook
US Growth Outlook
Chart III-31US Cyclical Spending
US Cyclical Spending
US Cyclical Spending
Chart III-32US Labor Market
US Labor Market
US Labor Market
Chart III-33US Consumption
US Consumption
US Consumption
Chart III-34US Housing
US Housing
US Housing
Chart III-35US Debt And Deleveraging
US Debt And Deleveraging
US Debt And Deleveraging
Chart III-36US Financial Conditions
US Financial Conditions
US Financial Conditions
Chart III-37Global Economic Snapshot: Europe
Global Economic Snapshot: Europe
Global Economic Snapshot: Europe
Chart III-38Global Economic Snapshot: China
Global Economic Snapshot: China
Global Economic Snapshot: China
Jonathan LaBerge, CFA Vice President The Bank Credit Analyst Gabriel Di Lullo Research Associate Footnotes 1 Please see Global Investment Strategy Special Alert "Hard Or Soft Landing? BCA Strategists Debate The Question," dated June 21, 2022, available at gis.bcaresearch.com 2 Please see The Bank Credit Analyst "April 2022," dated March 31, 2022, available at bca.bcaresearch.com 3 Please see Global Investment Strategy "Revisiting The Neutral Rate Of Interest: A Contrarian View In A Time Of Crisis," dated March 20, 2020, available at gis.bcaresearch.com; The Bank Credit Analyst "R-star, And The Structural Risk To Stocks," dated March 31, 2021, available at bca.bcaresearch.com; The Bank Credit Analyst "Do Excess Savings Explain Low US Interest Rates?" dated March 31, 2022, available at bca.bcaresearch.com 4 Please see The Bank Credit Analyst "Is The US Housing Market Signaling An Imminent Recession?" dated May 26, 2022, available at bca.bcaresearch.com 5 Please see Emerging Markets Strategy "A Conversation With Ms. Mea: Navigating An Inflation Storm," dated June 16, 2022, available at ems.bcaresearch.com 6 Please see The Bank Credit Analyst "The Modern-Day Phillips Curve, Future Inflation, And What To Do About It," dated December 18, 2020, available at bca.bcaresearch.com 7 This trimmed mean measure excludes the top 8% of CPI components with the largest monthly price gains and the bottom 8% with the smallest monthly gains. 8 Rent.com, https://www.rent.com/research/average-rent-price-report/, June 2022. 9 A fourth channel can be via a psychological boost to business and consumer confidence, but this can cut both ways if an easing in policy is interpreted as a sign of worsening economic conditions rather than as a reason for optimism.
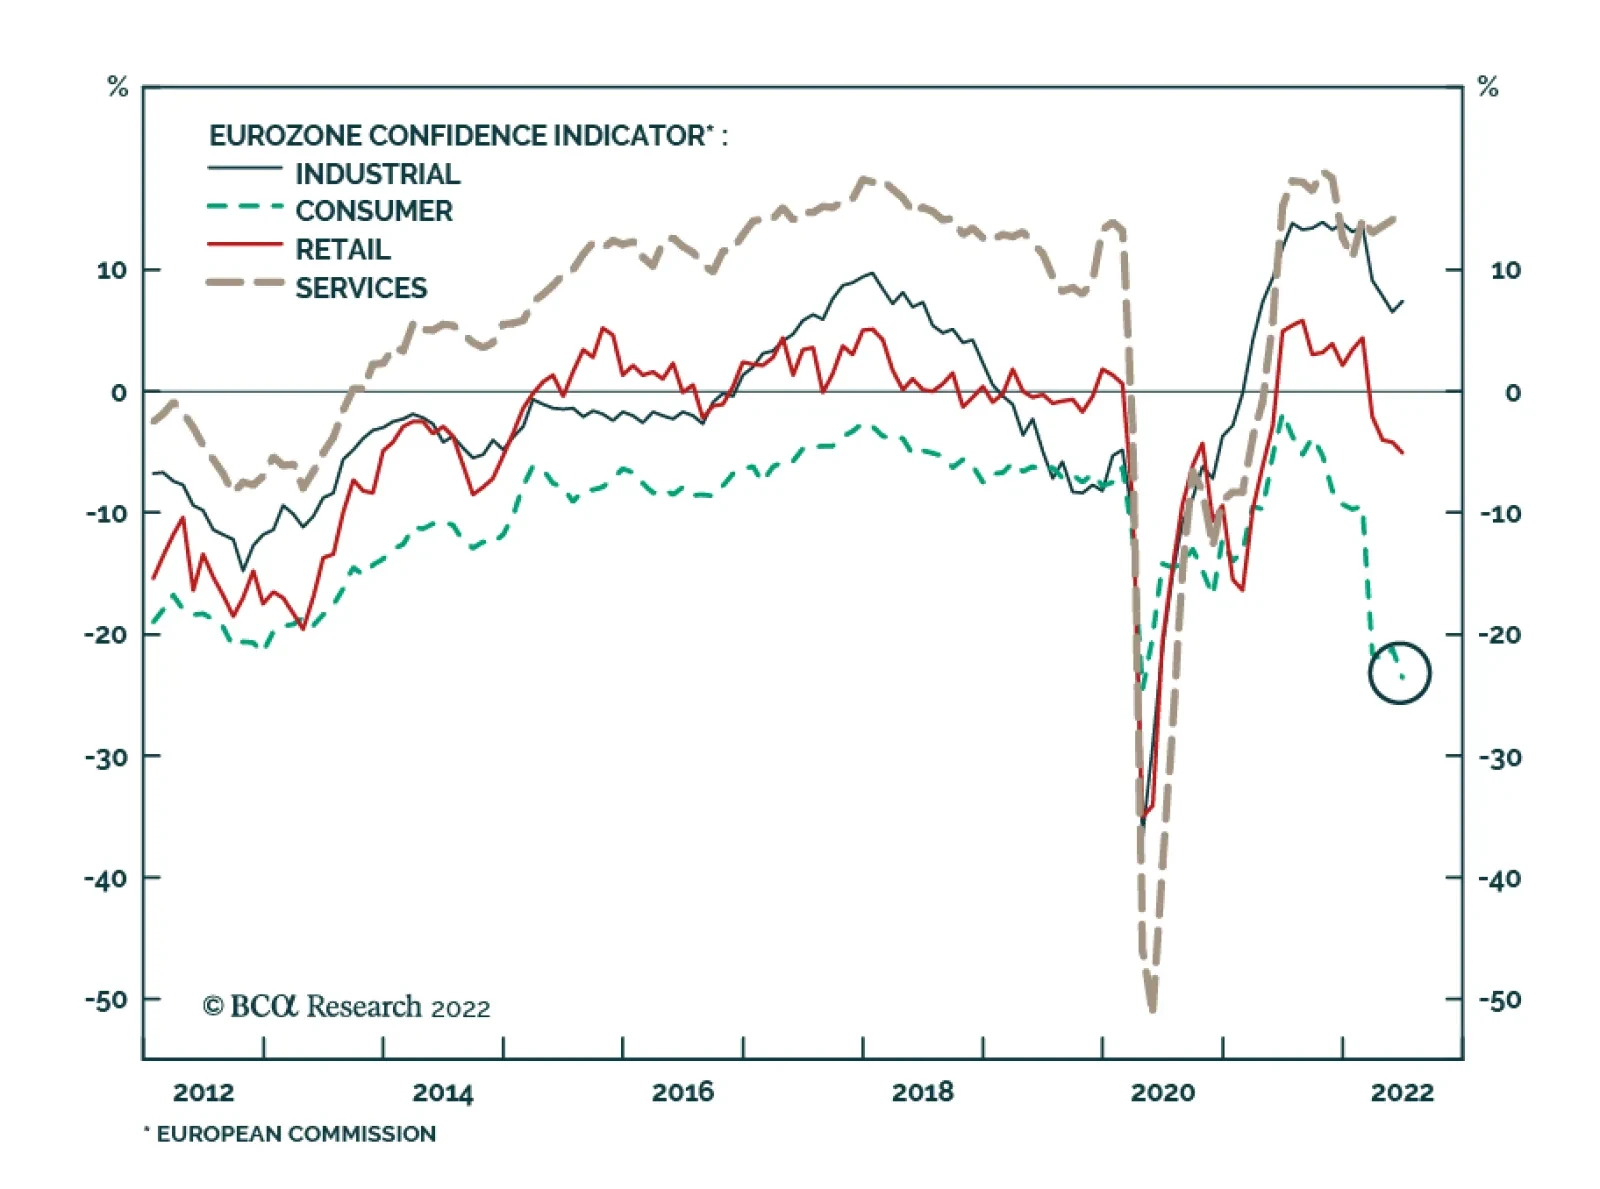
Eurozone economic confidence fell 1 point to 104.0 in June, slightly above expectations of 103.0. Deteriorating consumer morale (which fell from -21.1 to -23.6) offset improvements in industrial (from 6.5 to 7.5) and services sector confidence (from 14.1 to…
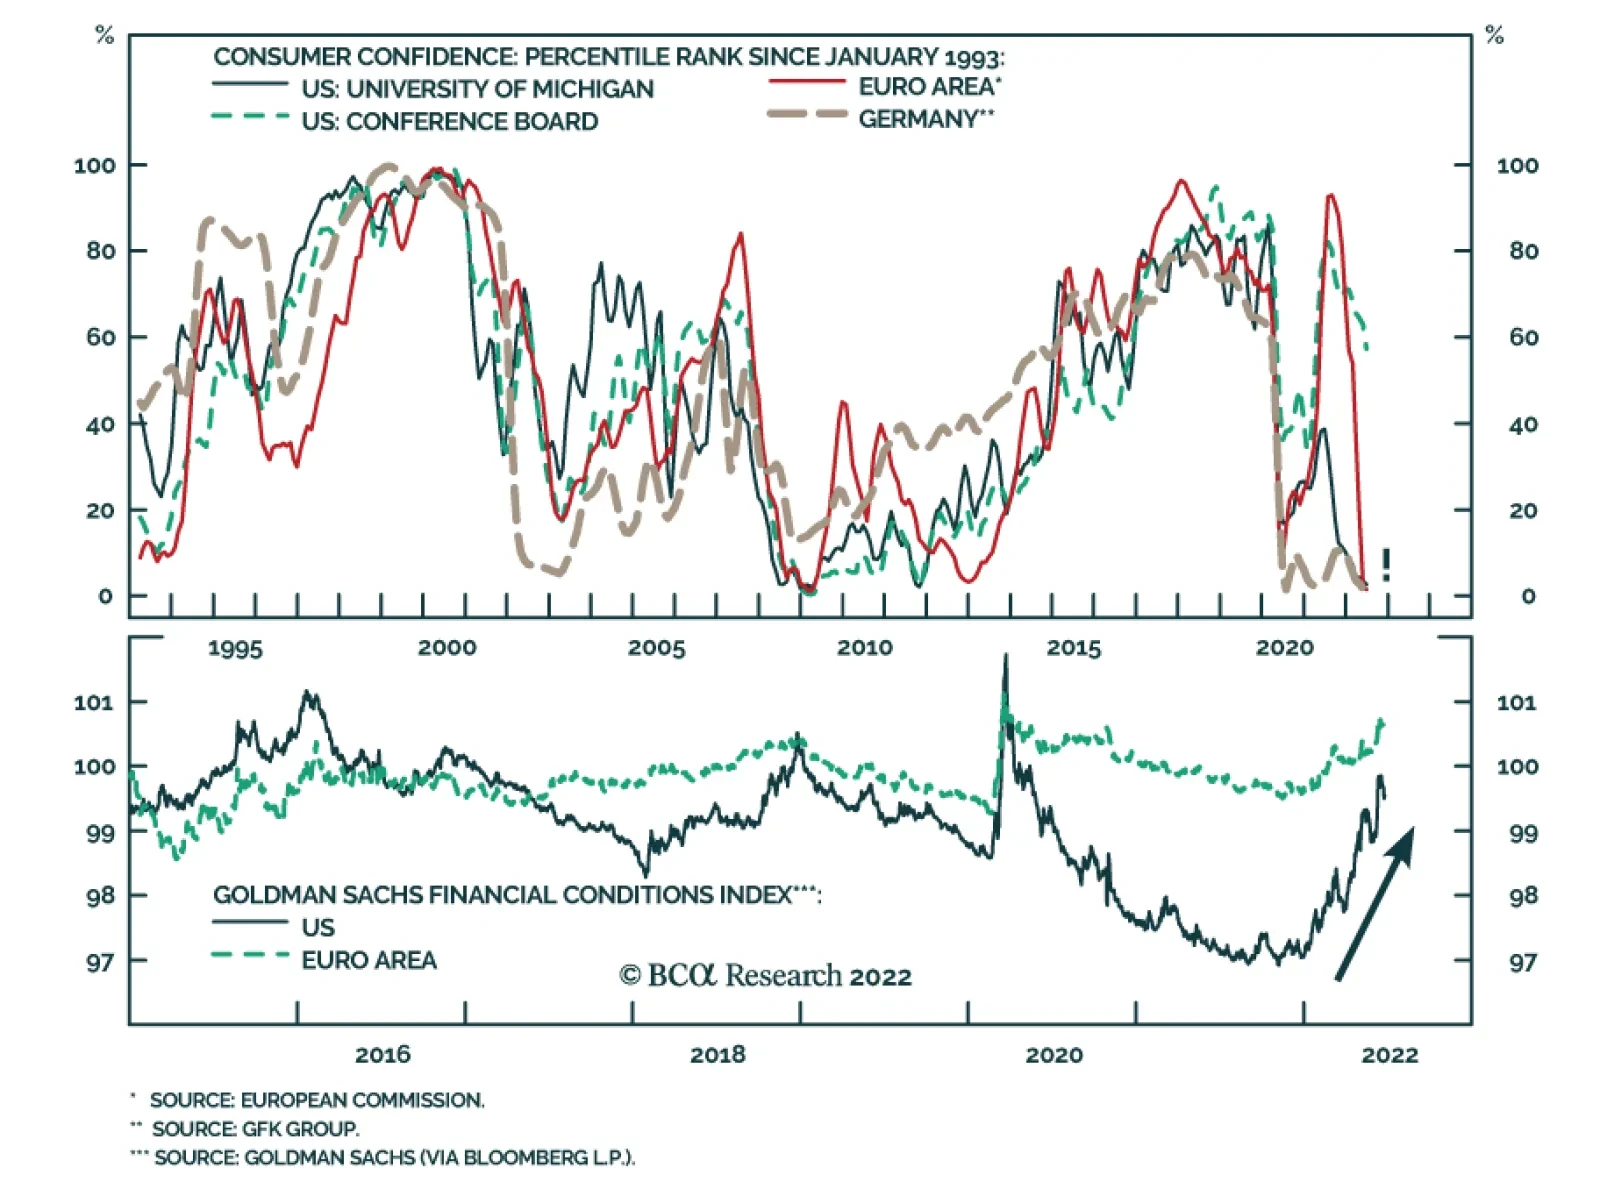
The European energy crisis remains a dark cloud over the Eurozone economy. Indeed, our European Investment strategists have shown that since Q2 2021, the performance of Euro Area financial assets relative to their US counterparts has been inversely correlated…
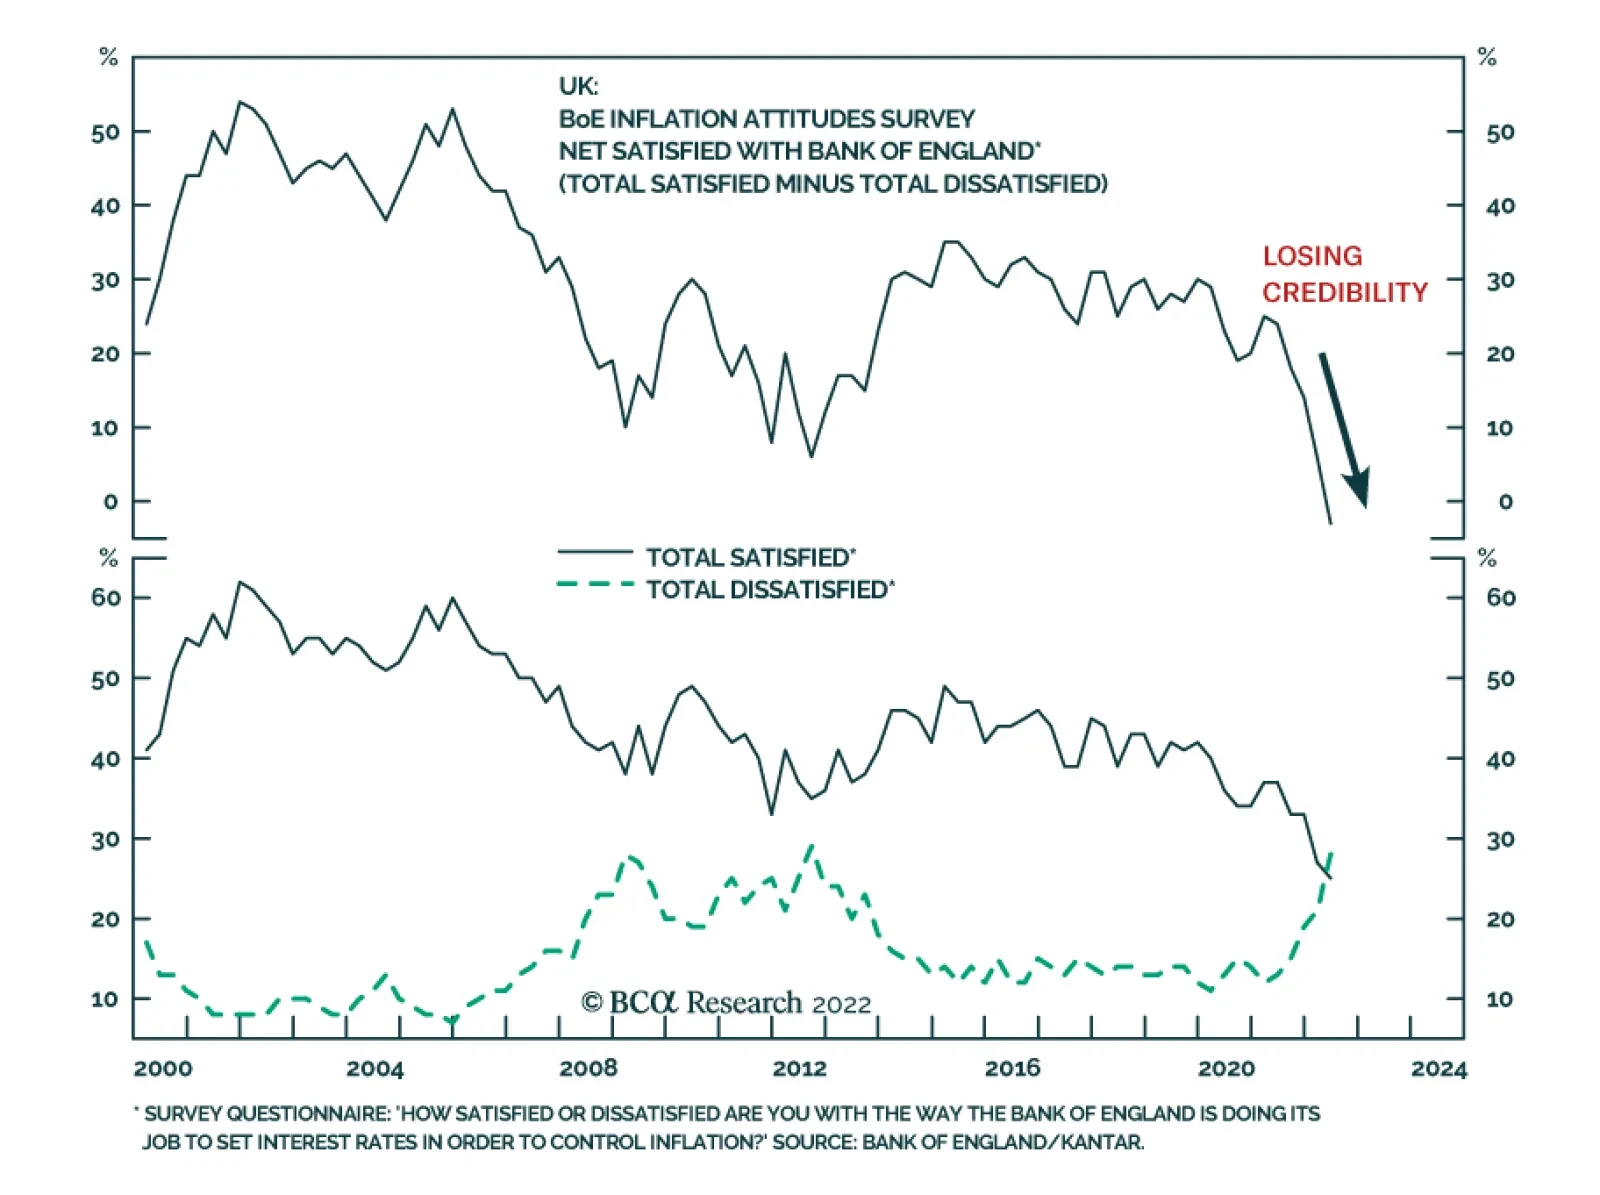
The “cost of living crisis” is weighing down on UK consumers. The volume of total retail sales fell by 0.5% m/m in May, and the measure that excludes auto fuel declined by a greater magnitude of 0.7% m/m. Consumer confidence fell to a new record low in June…
Executive Summary Russia Squeezes EU Natural Gas
Russia Squeezes EU Natural Gas
Russia Squeezes EU Natural Gas
Major geopolitical shocks tend to coincide with bear markets, so the market is getting closer to pricing this year’s bad news. But investors are not out of the woods yet. Russia is cutting off Europe’s natural gas supply ahead of this winter in retaliation to Europe’s oil embargo. Europe is sliding toward recession. China is reverting to autocratic rule and suffering a cyclical and structural downshift in growth rates. Only after Xi Jinping consolidates power will the ruling party focus exclusively on economic stabilization. The US can afford to take risks with Russia, opening up the possibility of a direct confrontation between the two giants before the US midterm election. A new strategic equilibrium is not yet at hand. Tactical Recommendation Inception Date Return LONG GLOBAL DEFENSIVES / CYCLICALS EQUITIES 2022-01-20 18.3% Bottom Line: Maintain a defensive posture in the third quarter but look for opportunities to buy oversold assets with long-term macro and policy tailwinds. Feature 2022 is a year of geopolitics and supply shocks. Global investors should remain defensive at least until the Chinese national party congress and US midterm election have passed. More fundamentally, an equilibrium must be established between Russia and NATO and between the US and Iran. Until then supply shocks will destroy demand. Checking Up On Our Three Key Views For 2022 Our three key views for the year are broadly on track: 1. China’s Reversion To Autocracy: For ten years now, the fall in Chinese potential economic growth has coincided with a rise in neo-Maoist autocracy and foreign policy assertiveness, leading to capital flight, international tensions, and depressed animal spirits (Chart 1). Related Report Geopolitical StrategyWill China Let 100 Flowers Bloom? Only Briefly. Rising incomes provided legitimacy for the Communist Party over the past four decades. Less rapidly rising incomes – and extreme disparities in standards of living – undermine the party and force it to find other sources of public support. Fighting pollution and expanding the social safety net are positives for political stability and potentially for economic productivity. But converting the political system from single-party rule to single-person rule is negative for productivity. Mercantilist trade policy and nationalist security policy are also negative. China’s political crackdown, struggle with Covid-19, waning exports, and deflating property market have led to an abrupt slowdown this year. The government is responding by easing monetary, fiscal, and regulatory policy, though so far with limited effect (Chart 2). Economic policy will not be decisive in the third quarter unless a crash forces the administration to stimulate aggressively. Chart 1China's Slowdown Leads To Maoism, Nationalism
China's Slowdown Leads To Maoism, Nationalism
China's Slowdown Leads To Maoism, Nationalism
Chart 2Chinese Policy Easing: Limited Effect So Far
Chinese Policy Easing: Limited Effect So Far
Chinese Policy Easing: Limited Effect So Far
Chart 3Nascent Rally In Chinese Shares Will Be Dashed
Nascent Rally In Chinese Shares Will Be Dashed
Nascent Rally In Chinese Shares Will Be Dashed
Once General Secretary Xi Jinping secures another five-to-ten years in power at the twentieth national party congress this fall, he will be able to “let 100 flowers bloom,” i.e. ease policy further and focus exclusively on securing the economic recovery in 2023. But policy uncertainty will remain high until then. The party may have to crack down anew to ensure Xi’s power consolidation goes according to plan. China is highly vulnerable to social unrest for both structural and cyclical reasons. The US would jump to slap sanctions on China for human rights abuses. Hence the nascent recovery in Chinese domestic and offshore equities can easily be interrupted until the political reshuffle is over (Chart 3). If China’s economy stabilizes and a recession is avoided, investors will pile into the rally, but over the long run they will still be vulnerable to stranded capital due to Chinese autocracy and US-China cold war. If the Politburo and Politburo Standing Committee are stacked with members of Xi’s faction, as one should expect, then the reduction in policy uncertainty will only be temporary. Autocracy will lead to unpredictable and draconian policy measures – and it cannot solve the problem of a shrinking and overly indebted population. If the Communist Party changes course and stacks the Politburo with Xi’s factional rivals, to prevent China from going down the Maoist, Stalinist, and Putinist route, then global financial markets will cheer. But that outcome is unlikely. Hawkish foreign policy means that China will continue to increase its military threats against Taiwan, while not yet invading outright. Beijing has tightened its grip over Tibet, Xinjiang, and Hong Kong since 2008; Taiwan and the South China Sea are the only critical buffer areas that remain to be subjugated. Taiwan’s midterm elections, US midterms, and China’s party congress will keep uncertainty elevated. Taiwan has underperformed global and emerging market equities as the semiconductor boom and shortage has declined (Chart 4). Hong Kong is vulnerable to another outbreak of social unrest and government repression. Quality of life has deteriorated for the native population. Democracy activists are disaffected and prone to radicalization. Singapore will continue to benefit at Hong Kong’s expense (Chart 5). Chart 4Taiwan Equity Relative Performance Peaked
Taiwan Equity Relative Performance Peaked
Taiwan Equity Relative Performance Peaked
Chart 5Hong Kong Faces More Troubles
Hong Kong Faces More Troubles
Hong Kong Faces More Troubles
Chart 6Japan Undercuts China
Japan Undercuts China
Japan Undercuts China
China and Japan are likely to engage in clashes in the East China Sea. Beijing’s military modernization, nuclear weapons expansion, and technological development pose a threat to Japanese security. The gradual encirclement of Taiwan jeopardizes Japan’s vital sea lines of communication. Prime Minister Fumio Kishida is well positioned to lead the Liberal Democratic Party into the upper house election on July 10 – he does not need to trigger a diplomatic showdown but he would not suffer from it. Meanwhile China is hungry for foreign distractions and unhappy that Japan is reviving its military and depreciating its currency (Chart 6). A Sino-Japanese crisis cannot be ruled out, especially if the Biden administration looks as if it will lose its nerve in containing China. Financial markets would react negatively, depending on the magnitude of the crisis. North Korea is going back to testing ballistic missiles and likely nuclear weapons. It is expanding its doctrine for the use of such weapons. It could take advantage of China’s and America’s domestic politics to stage aggressive provocations. South Korea, which has a hawkish new president who lacks parliamentary support, is strengthening its deterrence with the United States. These efforts could provoke a negative response from the North. Financial markets will only temporarily react to North Korean provocations unless they are serious enough to elicit military threats from Japan or the United States. China would be happy to offer negotiations to distract the Biden administration from Xi’s power grab. South Korean equities will benefit on a relative basis as China adds more stimulus. 2. America’s Policy Insularity: President Biden’s net approval rating, at -15%, is now worse than President Trump’s in 2018, when the Republicans suffered a beating in midterm elections (Chart 7). Biden is now fighting inflation to try to salvage the elections for his party. That means US foreign policy will be domestically focused and erratic in the third quarter. Aside from “letting” the Federal Reserve hike rates, Biden’s executive options are limited. Pausing the federal gasoline tax requires congressional approval, and yet if he unilaterally orders tax collectors to stand down, the result will be a $10 billion tax cut – a drop in the bucket. Biden is considering waiving some of former President Trump’s tariffs on China, which he can do on his own. But doing so will hurt his standing in Rust Belt swing states without reducing inflation enough to get a payoff at the voting booth – after all, import prices are growing slower from China than elsewhere (Chart 8). He would also give Xi Jinping a last-minute victory over America that would silence Xi’s critics and cement his dictatorship at the critical hour. Chart 7Democrats Face Shellacking In Midterm Elections
Third Quarter Geopolitical Outlook: Thunder And Lightning
Third Quarter Geopolitical Outlook: Thunder And Lightning
Chart 8Paring Trump Tariffs Won't Reduce Inflation Much
Paring Trump Tariffs Won't Reduce Inflation Much
Paring Trump Tariffs Won't Reduce Inflation Much
Chart 9Only OPEC Can Help Biden - And Help May Come Late
Only OPEC Can Help Biden - And Help May Come Late
Only OPEC Can Help Biden - And Help May Come Late
Biden is offering to lift sanctions on Iran, which would free up 1.3 million barrels of oil per day. But Iran is not being forced to freeze its nuclear program by weak oil prices or Russian and Chinese pressure – quite the opposite. If Biden eases sanctions anyway, prices at the pump may not fall enough to win votes. Hence Biden is traveling to Saudi Arabia to make amends with Crown Prince Mohammed bin Salman. OPEC’s interest lies in producing enough oil to prevent a global recession, not in flooding the market on Biden’s whims to rescue the Democratic Party. Saudi and Emirati production may come but it may not come early in the third quarter. Lifting sanctions on Venezuela is a joke and Libya recently collapsed again (Chart 9). Even in dealing with Russia the Biden administration will exhibit an insular perspective. The US is not immediately threatened, like Europe, so it can afford to take risks, such as selling Ukraine advanced and long-range weapons and providing intelligence used to sink Russian ships. If Russia reacts negatively, a direct US-Russia confrontation will generate a rally around the flag that would help the Democrats, as it did under President John F. Kennedy in 1962 – one of the rare years in which the ruling party minimized its midterm election losses (Chart 10). The Cuban Missile Crisis counted more with voters than the earlier stock market slide. 3. Petro-States’ Geopolitical Leverage: Oil-producing states have immense geopolitical leverage this year thanks to the commodity cycle. Russia will not be forced to conclude its assault on Ukraine until global energy prices collapse, as occurred in 2014. In fact Russia’s leverage over Europe will be greatly reduced in the coming years since Europe is diversifying away from Russian energy exports. Hence Moscow is cutting natural gas flows to Europe today while it still can (Chart 11). Chart 10Biden Can Afford To Take Risks With Russia
Third Quarter Geopolitical Outlook: Thunder And Lightning
Third Quarter Geopolitical Outlook: Thunder And Lightning
Chart 11Russia Squeezes EU's Natural Gas
Russia Squeezes EU's Natural Gas
Russia Squeezes EU's Natural Gas
Chart 12EU/China Slowdown Will Weigh On World
Third Quarter Geopolitical Outlook: Thunder And Lightning
Third Quarter Geopolitical Outlook: Thunder And Lightning
Russia’s objective is to inflict a recession and cause changes in either policy or government in Europe. This will make it easier to conclude a favorable ceasefire in Ukraine. More importantly it will increase the odds that the EU’s 27 members, having suffered the cost of their coal and oil embargo, will fail to agree to a natural gas embargo by 2027 as they intend. Italy, for example, faces an election by June 2023, which could come earlier. The national unity coalition was formed to distribute the EU’s pandemic recovery funds. Now those funds are drying up, the economy is sliding toward recession, and the coalition is cracking. The most popular party is an anti-establishment right-wing party, the Brothers of Italy, which is waiting in the wings and can ally with the populist League, which has some sympathies with Russia. A recession could very easily produce a change in government and a more pragmatic approach to Moscow. The Italian economy is getting squeezed by energy prices and rising interest rates at the same time and cannot withstand the combination very long. A European recession or near-recession will cause further downgrades to global growth, especially when considering the knock-on effects in China, where the slowdown is more pronounced than is likely reported. The US economy is more robust but it will have to be very robust indeed to withstand a recession in Europe and growth recession in China (Chart 12). Russia does not have to retaliate against Finland and Sweden joining NATO until Turkey clears the path for them to join, which may not be until just before the Turkish general election due in June 2023. But imposing a recession on Europe is already retaliation – maybe a government change will produce a new veto against NATO enlargement. Russian retaliation against Lithuania for blocking 50% of its shipments to the Kaliningrad exclave is also forthcoming – unless Lithuania effectively stops enforcing the EU’s sanctions on Russian resources. Russia cannot wage a full-scale attack on the Baltic states without triggering direct hostilities with NATO since they are members of NATO. But it can retaliate in other ways. In a negative scenario Moscow could stage a small “accidental” attack against Lithuania to test NATO. But that would force Biden to uphold his pledge to defend “every inch” of NATO territory. Biden would probably do so by staging a proportionate military response or coordinating with an ally to do it. The target would be the Russian origin of attack or comparable assets in the Baltic Sea, the Black Sea, Ukraine, Belarus, or elsewhere. The result would be a dangerous escalation. Russia could also opt for cyber-attacks or economic warfare – such as squeezing Europe’s natural gas supply further. Ultimately Russia can afford to take greater risks than the US over Kaliningrad, other territories, and its periphery more broadly. That is the difference between Kennedy and Biden – the confrontation is not over Cuba. Russia is also likely to take a page out of Josef Stalin’s playbook and open a new front – not so much in Nicaragua as in the Middle East and North Africa. The US betrayal of the 2015 nuclear deal with Iran opens the opportunity for Russia to strengthen cooperation with Iran, stir up the Iranians’ courage, sell them weapons, and generate a security crisis in the Middle East. The US military would be distracted keeping peace in the Persian Gulf while the Europeans would lose their long-term energy alternative to Russia – and energy prices would rise. The Iranians – who also have leverage during a time of high oil prices – are not inclined to freeze their nuclear program. That would be to trade their long-term regime survival for economic benefits that the next American president can revoke unilaterally. Bottom Line: Xi Jinping is converting China back into an autocracy, the Biden administration lacks options and is willing to have a showdown with Russia, and the Putin administration is trying to inflict a European recession and political upheaval. Stay defensive. Checking Up On Our Strategic Themes For The 2020s As for our long-term themes, the following points are relevant after what we have learned in the second quarter: 1. Great Power Rivalry: The war in Ukraine has reminded investors of the primacy of national security. In an anarchic international system, if a single great nation pursues power to the neglect of its neighbors’ interests, then its neighbors need to pursue power to defend themselves. Before long every nation is out for itself. At least until a new equilibrium is established. For example, Russia’s decision to neutralize Ukraine by force is driving Germany to abandon its formerly liberal policy of energy cooperation in order to reduce Russia’s energy revenues and avoid feeding its military ambitions. Russia in turn is reducing natural gas exports to weaken Europe’s economy this winter. Germany will re-arm, Finland and Sweden will eventually join NATO, and Russia will underscore its red line against NATO bases or forces in Finland and Sweden. If this red line is violated then a larger war could ensue. Chart 13China Will Shift To Russian Energy
China Will Shift To Russian Energy
China Will Shift To Russian Energy
Until Russia and NATO come to a new understanding, neither Europe nor Russia can be secure. Meanwhile China cannot reject Russia’s turn to the east. China believes it may need to use force to prevent Taiwan independence at some point, so it must prepare for the US and its allies to treat it the same way that they have treated Russia. It must secure energy supply from Russia, Central Asia, and the Middle East via land routes that the US navy cannot blockade (Chart 13). Beijing must also diversify away from the US dollar, lest the Treasury Department freeze its foreign exchange reserves like it did Russia’s. Global investors will see diversification as a sign of China’s exit from the international order and preparation for conflict, which is negative for its economic future. However, the Russo-Chinese alliance presents a historic threat to the US’s security, coming close to the geopolitical nightmare of a unified Eurasia. The US is bound to oppose this development, whether coherently or not, and whether alone or in concert with its allies. After all, the US cannot offer credible security guarantees to negotiate a détente with China or Iran because its domestic divisions are so extreme that its foreign policy can change overnight. Other powers cannot be sure that the US will not suffer a radical domestic policy change or revolution that leads to belligerent foreign policy. Insecurity will drive the US and China apart rather than bringing them together. For example, Russia’s difficulties in Ukraine will encourage Chinese strategists to go back to the drawing board to adjust their plans for military contingencies in Taiwan. But the American lesson from Ukraine is to increase deterrence in Taiwan. That will provoke China and encourage the belief that China cannot wait forever to resolve the Taiwan problem. Until there is a strategic understanding between Russia and NATO, and the US and China, the world will remain in a painful and dangerous transitional phase – a multipolar disequilibrium. Chart 14Hypo-Globalization: Globalizing Less Than Potential
Third Quarter Geopolitical Outlook: Thunder And Lightning
Third Quarter Geopolitical Outlook: Thunder And Lightning
2. Hypo-Globalization: If national security rises to the fore, then economics becomes a tool of state power. Mercantilism becomes the basis of globalization rather than free market liberalism. Hypo-globalization is the result. The term is fitting because the trade intensity of global growth is not yet in a total free fall (i.e. de-globalization) but merely dropping off from its peaks during the phase of “hyper-globalization” in the 1990s and early 2000s (Chart 14). Hypo-globalization is probably a structural rather than cyclical phenomenon. The EU cannot re-engage with Russia and ease sanctions without rehabilitating Russia’s economy and hence its military capacity – which could enable Russia to attack Europe again. The US and China can try to re-engage but they will fail. Russo-Chinese alliance ensures that the US would be enriching not one but both of its greatest strategic rivals if it reopened its doors to Chinese technology acquisition and intellectual property theft. Iran will see its security in alliance with Russia and China. China has an incentive to develop Iran’s economy so as not to depend solely on Russia and Central Asia. Russia has an incentive to develop Iran’s military capacity so as to deprive Europe of an energy alternative. Both Russia and China wish to deprive the US of strategic hegemony in the Middle East. By contrast the US and EU cannot offer ironclad security guarantees to Iran because of its nuclear ambitions and America’s occasional belligerence. Thus the world can see expanding Russian and Chinese economic integration with Eurasia, and expanding American and European integration with various regions, but it cannot see further European integration with Russia or American integration with China. And ultimately Europe and China will be forced to sever links (Chart 15). Globalization will not cease – it is a multi-millennial trend – but it will slow down. It will be subordinated to national security and mercantilist economic theory. 3. Populism/Nationalism: In theory, domestic instability can cause introversion or extroversion. But in practice we are seeing extroversion, which is dangerous for global stability (Chart 16). Chart 15Global Economic Disintegration
Global Economic Disintegration
Global Economic Disintegration
Chart 16Internal Sources Of Nationalism
Internal Sources Of Nationalism
Internal Sources Of Nationalism
Russia’s invasion of Ukraine derived from domestic Russian instability – and instability across the former Soviet space, including Belarus, which the Kremlin feared could suffer a color revolution after the rigged election and mass protests of 2020-21. The reason the northern European countries are rapidly revising their national defense and foreign policies to counter Russia is because they perceive that the threat to their security is driven by factors within the former Soviet sphere that they cannot easily remove. These factors will get worse as a result of the Ukraine war. Russian aggression still poses the risk of spilling out of Ukraine’s borders. China’s Maoist nostalgia and return to autocratic government is also about nationalism. The end of the rapid growth phase of industrialization is giving way to the Asian scourge: debt-deflation. The Communist Party is trying to orchestrate a great leap forward into the next phase of development. But in case that leap fails like the last one, Beijing is promoting “the great rejuvenation of the Chinese nation” and blaming the rest of the world for excluding and containing China. Taiwan, unfortunately, is the last relic of China’s past humiliation at the hands of western imperialists. China will also seek to control the strategic approach to Taiwan, i.e. the South China Sea. China’s claim that the Taiwan Strait is sovereign sea, not international waters, will force the American navy to assert freedom of passage. American efforts to upgrade Taiwan relations and increase deterrence will be perceived as neo-imperialism. The United States, for its part, could also see nationalism convert into international aggression. The US is veering on the brink of a miniature civil war as nationalist forces in the interior of the country struggle with the political establishment in the coastal states. Polarization has abated since 2020, as stagflation has discredited the Democrats. But it is now likely to rebound, making congressional gridlock all but inevitable. A Republican-controlled House will find a reason to impeach President Biden in 2023-24, in hopes of undermining his party and reclaiming the presidency. Another hotly contested election is possible, or worse, a full-blown constitutional crisis. American institutions proved impervious to the attempt of former President Trump and his followers to disrupt the certification of the Electoral College vote. However, security forces will be much more aggressive against rebellions of whatever stripe in future, which could lead to episodes in which social unrest is aggravated by police repression. If the GOP retakes the White House – especially if it is a second-term Trump presidency with a vendetta against political enemies and nothing to lose – then the US will return to aggressive foreign policy, whether directed at China or Iran or both. In short, polarization has contaminated foreign policy such that the most powerful country in the world cannot lead with a steady hand. Over the long run polarization will decline in the face of common foreign enemies but for now the trend vitiates global stability. Chart 17Germany And Japan Rearming
Third Quarter Geopolitical Outlook: Thunder And Lightning
Third Quarter Geopolitical Outlook: Thunder And Lightning
It goes without saying that nationalism is also an active force in Iran, where 83-year-old Supreme Leader Ayatollah Khamenei is attempting to ensure the survival of his regime in the face of youthful social unrest and an unclear succession process. If Khamenei takes advantage of the commodity cycle, and American and Israeli disarray, he can make a mad dash for the bomb and try to achieve regime security. But if he does so then nationalism will betray him, since Israel and/or the US are willing to conduct air strikes to uphold the red line against nuclear weaponization. If any more proof of global nationalism is needed, look no further than Germany and Japan, the principal aggressors of World War II. Their pacifist foreign policies have served as the linchpins of the post-war international order. Now they are both pursuing rearmament and a more proactive foreign policy (Chart 17). Nationalism may be very nascent in Germany but it has clearly made a comeback in Japan, which exacerbates China’s fears of containment. The rise of nationalism in India is widely known and reinforces the trend. Bottom Line: Great power rivalry is intensifying because of Russia’s conflict with the West and China’s inability to reject Russia. Hypo-globalization is the result since EU-Russia and US-China economic integration cannot easily be mended in the context of great power struggle. Domestic instability in Russia, China, and the US is leading to nationalism and aggressive foreign policy, as leaders find themselves unwilling or unable to stabilize domestic politics through productive economic pursuits. Investment Takeaways BCA has shifted its House View to a neutral asset allocation stance on equities relative to bonds (Chart 18). Chart 18BCA House View: Neutral Stocks Versus Bonds
BCA House View: Neutral Stocks Versus Bonds
BCA House View: Neutral Stocks Versus Bonds
Geopolitical Strategy remains defensively positioned, favoring defensive markets and sectors, albeit with some exceptions that reflect our long-term views. Tactically stay long US 10-year Treasuries, large caps versus small caps, and defensives versus cyclicals. Stay long Mexico and short the UAE (Chart 19). Strategically stay long gold, US equities relative to global, and aerospace/defense sectors (Chart 20). Among currencies favor the USD, EUR, JPY, and GBP. Chart 19Stay Defensive In Q3 2022
Stay Defensive In Q3 2022
Stay Defensive In Q3 2022
Chart 20Stick To Long-Term Geopolitical Trades
Stick To Long-Term Geopolitical Trades
Stick To Long-Term Geopolitical Trades
Chart 21Favor Semiconductors But Not Taiwan
Favor Semiconductors But Not Taiwan
Favor Semiconductors But Not Taiwan
Chart 22Indian Tech Will Rebound Amid China's Geopolitical Risks
Indian Tech Will Rebound Amid China's Geopolitical Risks
Indian Tech Will Rebound Amid China's Geopolitical Risks
Chart 23Overweight ASEAN
Overweight ASEAN
Overweight ASEAN
Go long US semiconductors and semi equipment versus Taiwan broad market (Chart 21). While we correctly called the peak in Taiwanese stocks relative to global and EM equities, our long Korea / short Taiwan trade was the wrong way to articulate this view and remains deeply in the red. Similarly our attempt to double down on Indian tech versus Chinese tech was ill-timed. China eased tech regulations sooner than we expected. However, the long-term profile of the trade is still attractive and Chinese tech will still suffer from excessive government and foreign interference (Chart 22). Go long Singapore over Hong Kong, as Asian financial leadership continues to rotate (see Chart 5 above). Stay long ASEAN among emerging markets. We will also put Malaysia on upgrade watch, given recent Malaysian equity outperformance on the back of Chinese stimulus and growing western interest in alternatives to China (Chart 23). Matt Gertken Chief Geopolitical Strategist mattg@bcaresearch.com Strategic Themes Open Tactical Positions (0-6 Months) Open Cyclical Recommendations (6-18 Months) Regional Geopolitical Risk Matrix
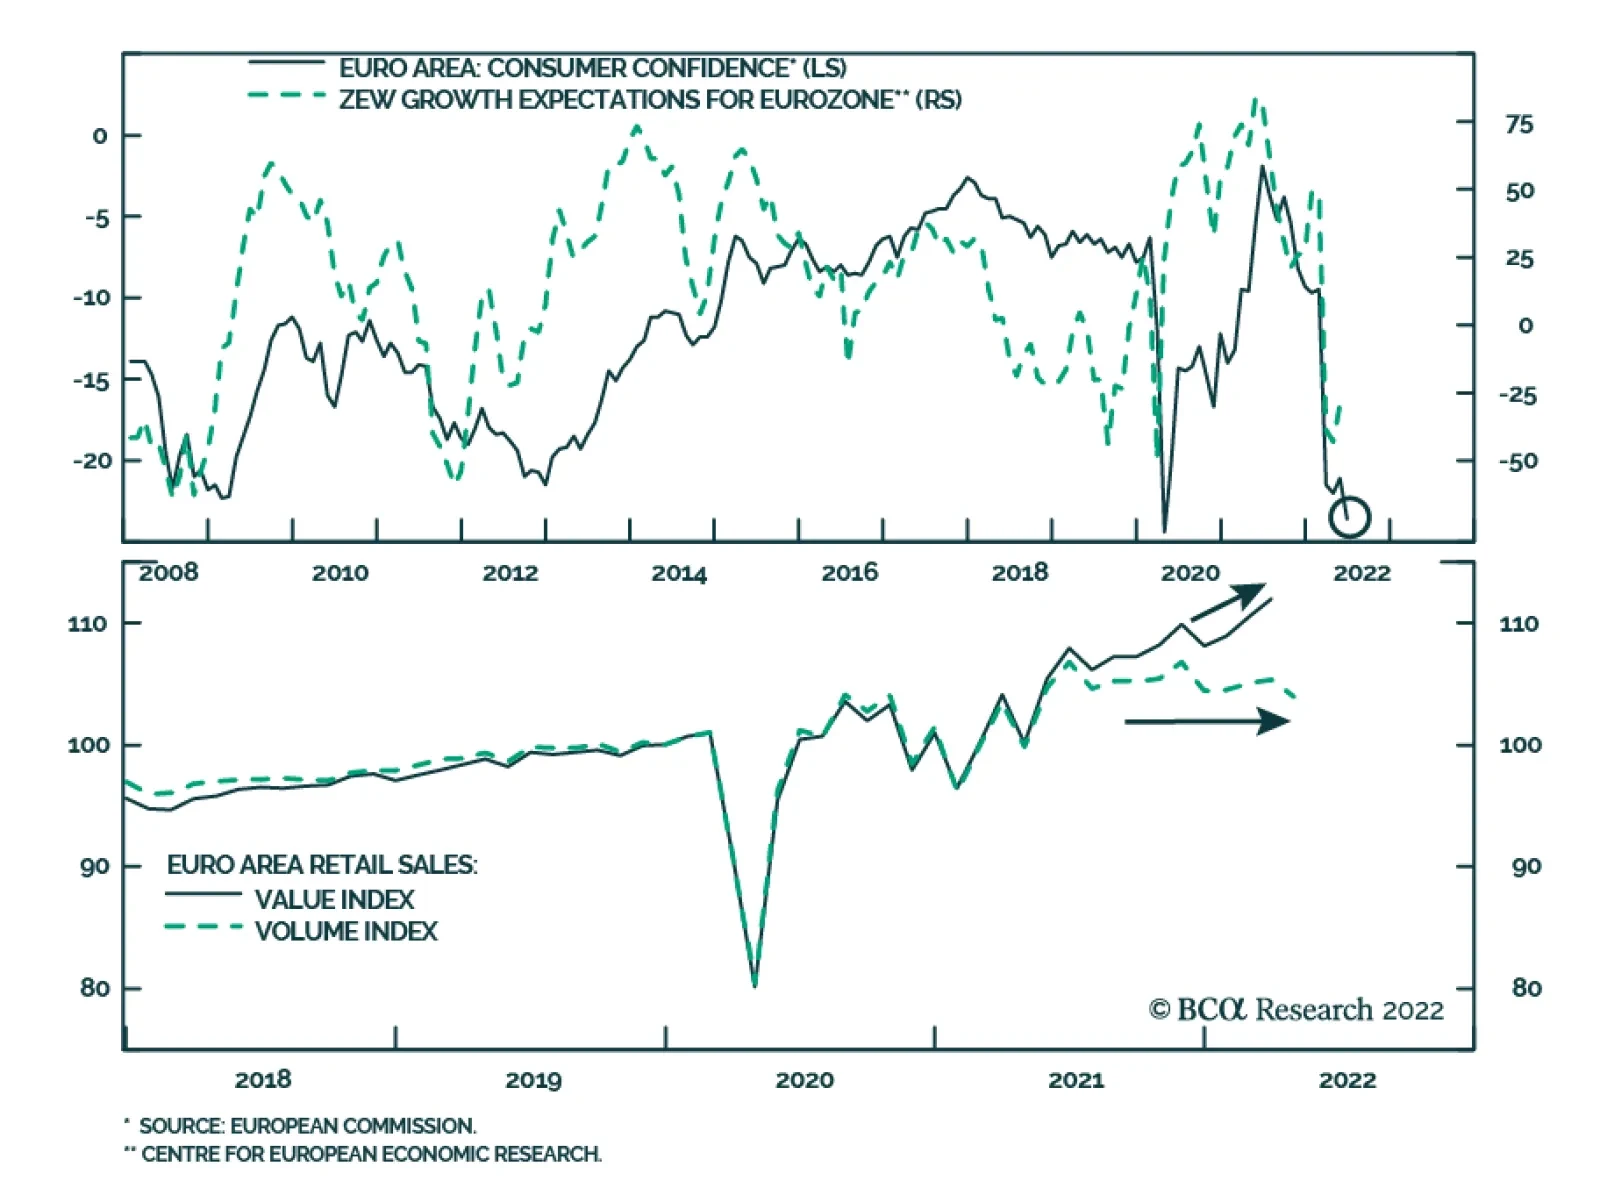
Economic data in the Eurozone continues to soften. Preliminary estimates indicated that the EC Consumer Confidence deteriorated further in June, despite expectations it would improve. Sentiment among Euro Area consumers declined to -23.6 from -21.1 in May, a…

The primary macroeconomic problem the world currently faces is containing rising inflation, especially the kind that is supply-side driven. This problem has become particularly acute in recent months since both equity and bond prices have been selling off on…