Europe

Executive Summary At our monthly view meeting on Monday, BCA strategists voted to change the House View to a neutral asset allocation stance on equities, with a slight plurality favoring an outright underweight. The view of the Global Investment Strategy service is somewhat more constructive, as I think it is still more likely than not that the US will avoid a recession; and that if a recession does occur, it will be a fairly mild one. Nevertheless, the risks to my view have increased. I now estimate 40% odds of a recession during the next 12 months, up from 20% a month ago. In The Past, When Unemployment Has Started Rising In The US, It Has Kept On Rising
In The Past, When Unemployment Has Started Rising In The US, It Has Kept On Rising
In The Past, When Unemployment Has Started Rising In The US, It Has Kept On Rising
Bottom Line: With the S&P 500 down 27% in real terms from its highs at the time of the meeting, the view of the Global Investment Strategy service is that a modest overweight is appropriate. However, investors should refrain from adding to equity positions until more clarity emerges about the path for inflation and growth. Heading For Recession? Every month, BCA strategists hold a view meeting to discuss the most important issues driving the macroeconomy and financial markets. This month’s meeting, which was held yesterday, was especially pertinent as it comes on the heels of a substantial decline in global equities. The key issue that we grappled with was whether the Fed could achieve a proverbial soft landing or whether the US and the rest of the global economy were spiraling towards recession (if it wasn’t already there). I began the meeting by showing one of my favorite charts, a deceptively simple chart of the US unemployment rate (Chart 1). The chart makes three things clear: 1) The US unemployment rate is rarely stable; It is almost always either rising or falling; 2) Once it starts rising, it keeps rising. In fact, the US has never averted a recession when the 3-month average of the unemployment rate has risen by more than a third of a percentage point; and 3) As a mean-reverting series, the unemployment rate is most likely to start rising when it is very low. Chart 1In The Past, When Unemployment Has Started Rising In The US, It Has Kept On Rising
In The Past, When Unemployment Has Started Rising In The US, It Has Kept On Rising
In The Past, When Unemployment Has Started Rising In The US, It Has Kept On Rising
Taken at face value, the chart paints a damning picture about the economic outlook. The US unemployment rate is near a record low, which means that it has nowhere to go but up. And once the unemployment rate starts going up, history suggests that a recession is inevitable. Five Caveats Despite this ominous implication, I did highlight five caveats. First, the observation that even a modest increase in the unemployment rate invariably heralds a recession is based on a limited sample of business cycles from the US. Across the G10, soft landings have occurred, Canada being one example (Chart 2). Second, unlike the unemployment rate, the employment-to-population ratio is still 1.1 percentage points below its pre-pandemic level, and 4.6 percentage points below where it was in April 2000. A similar, though less pronounced, pattern holds if one focuses only on the 25-to-54 age cohort (Chart 3). Chart 2G10 Economies Sometimes Manage To Avoid A Recession Amid Rising Unemployment
G10 Economies Sometimes Manage To Avoid A Recession Amid Rising Unemployment
G10 Economies Sometimes Manage To Avoid A Recession Amid Rising Unemployment
Chart 3The Employment-To-Population Ratio Remains Below Pre-Pandemic Levels
The Employment-To-Population Ratio Remains Below Pre-Pandemic Levels
The Employment-To-Population Ratio Remains Below Pre-Pandemic Levels
While the number of people not working either because they are worried about the pandemic, or because they are still burning through their stimulus checks, has been trending lower, it is still fairly high in absolute terms (Chart 4). As my colleague Doug Peta discussed in his latest report, one can envision a scenario where job growth remains positive, but the unemployment rate nonetheless edges higher as more workers rejoin the labor force. Chart 4ALabor Supply Should Increase As Covid Fears Continue To Abate And More Workers Burn Through Their Stimulus Savings (I)
Labor Supply Should Increase As Covid Fears Continue To Abate And More Workers Burn Through Their Stimulus Savings (I)
Labor Supply Should Increase As Covid Fears Continue To Abate And More Workers Burn Through Their Stimulus Savings (I)
Chart 4BLabor Supply Should Increase As Covid Fears Continue To Abate And More Workers Burn Through Their Stimulus Savings (II)
Labor Supply Should Increase As Covid Fears Continue To Abate And More Workers Burn Through Their Stimulus Savings (II)
Labor Supply Should Increase As Covid Fears Continue To Abate And More Workers Burn Through Their Stimulus Savings (II)
Third, the job vacancy rate is extremely high today – much higher than a pre-pandemic “Beveridge Curve” would have predicted (Chart 5). This provides the labor market with a wide moat against an increase in firings. As Fed governor Christopher Waller has emphasized, the main effect of the Federal Reserve’s efforts to cool labor demand could be to push down vacancies rather than to push up unemployment. Fourth, as we have highlighted in past research, the Phillips curve is kinked at very low levels of unemployment (Chart 6). This means that a decline in unemployment from high to moderate levels may do little to spur inflation, but once the unemployment rate falls below its full employment level, then watch out! Chart 5The Fed Hopes That Its Tightening Policy Will Bring Down Job Openings More Than It Pushes Up The Unemployment Rate
The Fed Hopes That Its Tightening Policy Will Bring Down Job Openings More Than It Pushes Up The Unemployment Rate
The Fed Hopes That Its Tightening Policy Will Bring Down Job Openings More Than It Pushes Up The Unemployment Rate
Chart 6The Phillips Curve Is Kinked At Very Low Levels Of Unemployment
Hard Or Soft Landing? BCA Strategists Debate The Question
Hard Or Soft Landing? BCA Strategists Debate The Question
The converse is also true, however. If a small decrease in unemployment can trigger a large increase in inflation, then a small increase in unemployment can trigger a large decrease in inflation, provided that long-term inflation expectations remain reasonably well anchored in the meantime. In other words, it is possible that the so-called “sacrifice ratio” — the amount of output that has to be sacrificed to reduce inflation — may be quite low. Fifth, and perhaps most importantly, there is a lot of variation from one recession to the next in how much unemployment rises. In general, the greater the financial and economic imbalances going into a recession, the deeper it tends to be. US household balance sheets are in reasonably good shape these days. Households are sitting on $2.2 trillion in excess savings (Chart 7). Yes, most of those savings belong to relatively well-off households. But as Chart 8 illustrates, even rich people spend well over half of their income. Chart 7Households Have Only Just Begun To Draw Down Their Accumulated Savings
Households Have Only Just Begun To Draw Down Their Accumulated Savings
Households Have Only Just Begun To Draw Down Their Accumulated Savings
Chart 8Even The Rich Spend The Majority Of Their Income
Hard Or Soft Landing? BCA Strategists Debate The Question
Hard Or Soft Landing? BCA Strategists Debate The Question
The ratio of household debt-to-disposable income in the US is down by a third since its peak in 2008. Despite falling equity prices, the ratio of household net worth-to-disposable income is still up nearly 50 percentage points since the end of 2019, mainly because home prices have risen (Chart 9). As is likely to be the case in many other countries, home prices in the US will level off and quite possibly decline over the next few years. In and of itself, that may not be such a bad outcome for equity markets since lower real estate prices will cool aggregate demand, thus lowering inflation without the need for much higher interest rates. The danger, of course, is that we could see a replay of the GFC. This risk cannot be ignored but is probably quite small. The quality of mortgage lending has been very strong over the past 15 years. Moreover, unlike in 2007, when there was a large glut of homes, the homeowner vacancy rate today is at a record low. Tepid homebuilding has pushed the average age of the US residential capital stock to 31 years, the highest since 1948 (Chart 10). Chart 9The US Household Debt Burden Has Come Down Significantly Since 2008, While Net Worth Is Still Higher Than Before The Pandemic
The US Household Debt Burden Has Come Down Significantly Since 2008, While Net Worth Is Still Higher Than Before The Pandemic
The US Household Debt Burden Has Come Down Significantly Since 2008, While Net Worth Is Still Higher Than Before The Pandemic
Chart 10Tight Supply Conditions In The Housing Market Argue Against A Repeat Of The GFC
Tight Supply Conditions In The Housing Market Argue Against A Repeat Of The GFC
Tight Supply Conditions In The Housing Market Argue Against A Repeat Of The GFC
A Bleaker Picture Outside The US The situation is admittedly dicier outside the US. Putin’s despotic regime continues to wage war on Ukraine. While European natural gas prices are still well below their March peak, they have recently surged as Russia has begun to throttle natural gas exports (Chart 11). The euro area manufacturing PMI clocked in a respectable 54.6 in May but is likely to drop over the coming months as higher energy prices restrain production. The only saving grace is that fiscal policy in Europe has turned more expansionary. The IMF’s April projection foresaw the structural primary budget balance easing from a surplus of 1.2% of GDP between 2014 and 2019 to a deficit of 1.2% of GDP between 2022 and 2027, the biggest swing among the major economies (Chart 12). Even the IMF’s numbers probably underestimate the fiscal easing that will transpire considering the need for Europe to invest more in energy independence and defense. Chart 11The European Economy Is Threatened By Rising Gas Prices
The European Economy Is Threatened By Rising Gas Prices
The European Economy Is Threatened By Rising Gas Prices
Chart 12Euro Area Fiscal Policy Is Expected To Be More Expansionary In The Years To Come Than Before The Pandemic
Hard Or Soft Landing? BCA Strategists Debate The Question
Hard Or Soft Landing? BCA Strategists Debate The Question
The Chinese economy continues to suffer from the “triple threat” of renewed Covid lockdowns, a shift of global demand away from manufactured goods towards services, and a floundering property market. We expect the Chinese property market to ultimately succumb to the same fate that befell Japan 30 years ago. Chart 13Chinese Stocks Are Cheap
Chinese Stocks Are Cheap
Chinese Stocks Are Cheap
Unlike Japanese stocks in the early 1990s, however, Chinese stocks are trading at fairly beaten down valuations – 10.9-times earnings and 1.4-times book for the investable index (Chart 13). With the Twentieth Party Congress slated for later this year and the population jaded by lockdowns, the political incentive to shower the economy with cash and loosen the reins on regulation will intensify. A Scenario Analysis For The S&P 500 Corralling all these moving parts is no easy matter. We would put the odds of a US recession over the next 12 months at 40%. This is double what we would have said a month ago when we tactically upgraded stocks after the S&P 500 fell below the 4,000 mark. The May CPI report was clearly a shocker, both to the Fed and the markets. The median dot in the June Summary of Economic Projections sees the Fed funds rate rising to 3.8% next year, smack dab in the middle of our once highly out-of-consensus estimate of 3.5%-to-4% for the neutral rate of interest. With interest rates potentially moving into restrictive territory next year, equity investors are right to be concerned. Yet, as noted above, if a recession does occur, it is likely to be a fairly mild one. At the time of the BCA monthly view meeting, the S&P 500 was already down 23% in nominal terms and 27% in real terms from its peak in early January. We assume that the S&P 500 will fall a further 10% in real terms over the next 12 months in a “mild recession” scenario (30% odds) and by 25% in a “deep recession” scenario (10% odds). Conversely, we assume that the S&P 500 will be 20% higher in 12 months’ time in a “no recession” scenario (60% odds). Note that even in a “no recession” scenario, the real value of the S&P 500 would still be down 12% in June 2023 from its all-time high. On a probability-weighted basis, the expected 12-month real return across all three scenarios works out to 6.5%, or 8% with dividends (Table 1). That is enough to justify a modest overweight in my view – but given the risks, just barely. Investors focused on capital preservation should consider a more conservative stance. Table 1S&P 500 Drawdowns Depending On Whether The US Will Enter A Recession And How Severe It Will Be
Hard Or Soft Landing? BCA Strategists Debate The Question
Hard Or Soft Landing? BCA Strategists Debate The Question
Most of my colleagues were more cautious than me, as they generally thought that the odds of a recession were greater than 50%. They voted to shift the BCA house view to a neutral asset allocation stance on equities, with a slight plurality favoring an outright underweight (10 for underweight; 9 for neutral; and 6 for overweight). Peter Berezin Chief Global Strategist peterb@bcaresearch.com Global Investment Strategy View Matrix
Hard Or Soft Landing? BCA Strategists Debate The Question
Hard Or Soft Landing? BCA Strategists Debate The Question
Special Trade Recommendations Current MacroQuant Model Scores
Hard Or Soft Landing? BCA Strategists Debate The Question
Hard Or Soft Landing? BCA Strategists Debate The Question
Executive Summary Structural Tailwinds For The Franc
Structural Tailwinds For The Franc
Structural Tailwinds For The Franc
Volatility in FX markets is likely to remain elevated, as witnessed by the reaction of a full circle of central bank meetings this week.Policy convergence remains a good bet for interest rate curves and currency pairs. The SNB surprised markets by raising interest rates by 50 bps, to -0.25%, the first hike since 2007.Higher volatility will continue to buoy the Swiss franc in the short run.Structural appreciation in the franc is also likely over the coming decades (Feature Chart). Swiss stocks often perform well during economic downturns, but they are not particularly cheap, and are vulnerable to higher interest rates. Investors should only overweight Swiss stocks if they expect more significant downside to global stocks.Valuation favors the franc versus the dollar. However, EUR/CHF and GBP/CHF are closer to fair value. CHF/JPY is expensive; hence, the yen is a better hedge for downside economic surprises. Go short CHF/JPY as a trade.BCA’s Foreign Exchange Strategy was short CHF/SEK at 10.2 with stop loss at 10.5. That stop was hit overnight, triggering a loss of -3.3%. Stand aside for now.Bottom Line: Favor the franc over the short term against other pro-cyclical currencies, with a view to downgrade CHF when it becomes evident that economic growth is bottoming. Any further bout of Swiss equity outperformance, prompted by global risk aversion, offers an attractive selling opportunity versus Eurozone stocks.Feature Chart 1The SNB Has Capitulated To Rising Inflation
The SNB Has Capitulated To Rising Inflation
The SNB Has Capitulated To Rising Inflation
Volatility in FX markets is likely to remain elevated. This week, the Fed delivered its first 75 bps interest rate hike since 1994. It also increased its expected year-end level for the Fed Funds rate to 3.4% from 1.9%, and to 3.8% from 3.4% at the end of 2023. The FX market had been warming up to a hawkish surprise, but the dollar surged on the news, hitting a fresh two-decade high of 105.5, before later reversing gains.Meanwhile, the European Central Bank (ECB) held an emergency meeting on Wednesday, to try to mitigate the rise in Italian yields, which hit as high as 4.2% on Tuesday, or 243 bps over German 10-year yields. The subsequent statement released by the Governing Council offered no concrete details. Yes, the reinvestments of the proceeds from maturing debt in the Pandemic Emergency Purchase Program (PEPP) will flow mostly to peripheral markets, but investors want clarity on the nature of the long-awaited policy plan to tackle fragmentation risk in the Euro Area. As a result, peripheral bond markets will remain fragile until a bold program comes to fruition.To cement currency volatility this week, SNB Governor Thomas Jordan surprised markets by raising interest rates by 50 bps in Switzerland, to -0.25%, the first hike since the Global Financial Crisis (Chart 1). The negative interest rate threshold for sight deposits was also lowered, a move encouraging banks to pack reserves at the SNB. The Bank of England also raised interest rates in line with market expectations. The move initially disappointed GBP bulls, but sterling is holding above our 1.20 floor.An environment of monetary policy uncertainty, rising recession risks in response to high inflation, and the potential for central bank policy mistakes bodes well for safe-haven assets. In Europe, the market with the strongest defensive profile is Switzerland. In this report, we address whether investors should bet on continued appreciation of the franc and an outperformance of Swiss stocks, especially now that the SNB has turned hawkish.Switzerland Versus The WorldGlobal economic growth is slowing and a small/open economy like Switzerland’s has not been spared. The KOF economic barometer, a key leading indicator for Swiss GDP growth, has collapsed over the past twelve months from 144 to 97 as global industrial activity decelerated (Chart 2). Despite softening growth, global inflation refuses to decline, forcing central banks worldwide to lean into the slowdown. This threatens to cut the post-pandemic business cycle expansion short. Chart 2The SNB Is Tightening Into A Slowing Economy
The SNB Is Tightening Into A Slowing Economy
The SNB Is Tightening Into A Slowing Economy
Surprisingly, the Swiss economy is generally performing better than the rest of Europe. Historically, Swiss economic performance is procyclical due to the large share of exports within its GDP. Hence, a slowdown in global manufacturing often creates a large threat to Swiss growth. Going forward, can the Swiss economy diverge from that of the rest of the world (Chart 3)? Such a divergence is not probable, but a few factors will protect the Swiss economy:Switzerland still has one of the lowest policy rates in the G10, even after today’s 50bps interest rate increase. This has tremendously helped ease monetary conditions. Our monetary gauge is at its most accommodative level in over two decades (Chart 4). Chart 3The Swiss Economy Is Procyclical
The Swiss Economy Is Procyclical
The Swiss Economy Is Procyclical
Chart 4Swiss Monetary Conditions Are Still Accommodative
Swiss Monetary Conditions Are Still Accommodative
Swiss Monetary Conditions Are Still Accommodative
Swiss inflation remains the lowest in the G10 outside Japan. In Switzerland, the main driver of price increases has been goods, while services inflation remains subdued. Consequently, the SNB has been tolerating an appreciating franc to temper imported inflation (Chart 5), while keeping domestic borrowing costs at very accommodative levels. In its updated forecasts, the SNB now expects a -0.25% interest rate to allow Swiss inflation to moderate to 1.9% in 2023 and 1.6% in 2024. Chart 5Swiss Inflation Is Surprising To The Upside
Swiss Inflation Is Surprising To The Upside
Swiss Inflation Is Surprising To The Upside
Part of the reason Switzerland has low inflation has been the tremendous productivity gains, especially relative to its trading partners (Chart 6). Swiss income-per-capita is elevated, but wage growth has lagged output gains, which limits the risk of a wage-inflation spiral. It is notable that part-time employment continues to dominate job gains, implying that the need for precautionary savings will remain high in Switzerland. Chart 6A Productivity Profile For Switzerland
A Productivity Profile For Switzerland
A Productivity Profile For Switzerland
Higher productivity growth and the elevated national savings leave their footprint on the trade data. The Swiss trade balance is hitting fresh highs, unlike Europe or Japan (Chart 7). This could potentially create a problem for the Swiss economy as it puts upward pressure on the CHF at a time when global manufacturing output is slowing. However, Switzerland specializes in high value-added exports with an elevated degree of complexity, that stand early in global supply chains. These type of goods are likely to remain in high demand in a global environment marked by supply-chain bottlenecks and high-capacity utilization. Chart 7Structural Tailwinds For The Franc
Structural Tailwinds For The Franc
Structural Tailwinds For The Franc
Finally, Switzerland does not import energy to fulfill its electricity production. Hydropower accounts for roughly 61.4% of electricity generation, followed by nuclear power at 28.5%. This has partially insulated Switzerland from the energy shock hurting economic activity and trade balances in the EU. For example, German electricity generation is 28.8% coal and 14.7% natural gas.Bottom Line: The Swiss economy is reopening and is relatively insulated from the Russia-Ukraine conflict. This limits to some degree how closely Switzerland will track the global and European economic slowdown. It creates a departure from the traditional pro-cyclicality of the Swiss economy.The SNB, The SARON Curve, And The Swiss FrancIf the Swiss economy surprises to the upside, the case for the SNB to tolerate a rising franc becomes even stronger. The pace of foreign exchange reserve accumulation is already decelerating (Chart 8). Governor Thomas Jordan has been very clear: as global prices rise, the fair value of the franc is also rising, which implies a willingness to tolerate currency strength. In a purchasing power parity framework, higher external inflation makes Swiss goods relatively cheaper. This allows foreigners to bid up the currency.Even with today’s updated pricing, the SNB is still expected to remain among the most dovish central banks in the G10 (Chart 9). If inflationary pressures prove sticky, the SNB will step up its hawkish rhetoric. If inflationary fears subside, then global rates will fall as well, which has usually been a boon for the franc. More specifically, this would be negative for the EUR/CHF cross (Chart 10). Chart 8Less Intervention By The SNB
Less Intervention By The SNB
Less Intervention By The SNB
Chart 9The SARON Curve Has Adjusted Higher
The SARON Curve Has Adjusted Higher
The SARON Curve Has Adjusted Higher
Chart 10EUR/CHF And Bund Yields Can Continue To Diverge
EUR/CHF And Bund Yields Can Continue To Diverge
EUR/CHF And Bund Yields Can Continue To Diverge
The Swiss economy can tolerate an appreciating CHF, but can it withstand higher interest rates? We believe so. Switzerland is a net creditor nation, but its domestic non-financial debt is also extremely elevated. Thus, the Swiss economy is vulnerable to higher rates, especially the housing market (Chart 11). Nonetheless, internal adjustments will soften the blow and increase affordability. Of note, property speculation in Switzerland has decreased in response to macroprudential measures. Growth in rental housing prices, which usually constitute the bulk of investment homes, has collapsed, but the price of owner-occupied homes has proven more robust (Chart 12). A cap on the percentage of secondary homes in any Canton as well as tighter lending standards have also helped. In a renewed update to its Financial Stability Report, Fritz Zurbrügg, Vice Chairman of the Governing Board, suggests that Swiss banks are well capitalized, especially given the recent reactivation of the countercyclical capital buffer. Chart 11Higher Rates Are A Risk For Swiss Real Estate
Higher Rates Are A Risk For Swiss Real Estate
Higher Rates Are A Risk For Swiss Real Estate
Chart 12Some Adjustment Already In Investment Home Prices
Some Adjustment Already In Investment Home Prices
Some Adjustment Already In Investment Home Prices
In the very near term, demographics might also be a tailwind. The pandemic limited immigration to Switzerland, but the working-age population is rebounding anew (Chart 13), which will create a cushion under housing and support domestic demand. Chart 13A Small Demographic Tailwind For Home Prices
A Small Demographic Tailwind For Home Prices
A Small Demographic Tailwind For Home Prices
Stronger aggregate demand in an inflationary world will justify the need for less monetary accommodation. In a nutshell, the SNB is likely to continue walking the path of “least regrets” like most central banks, by tightening monetary policy to meet its 2% inflation mandate, but pausing if economic conditions warrant.The currency has historically been used as a key tool for calibrating financial conditions. From a fundamental perspective, our PPP models suggest the franc is quite cheap versus the dollar but at fair value versus the euro and sterling. This is echoed by Governor Jordan, who no longer views the franc as expensive. Our models adjusts the consumption basket in Switzerland for an apples-to-apples comparison across both the UK and the eurozone (Chart 14). Chart 14AA CHF Is At Fair Value Versus The EUR And GBP
A CHF Is At Fair Value Versus The EUR And GBP
A CHF Is At Fair Value Versus The EUR And GBP
Chart 14BA CHF Is At Fair Value Versus The EUR And GBP
A CHF Is At Fair Value Versus The EUR And GBP
A CHF Is At Fair Value Versus The EUR And GBP
Finally, hedging costs for shorting the franc against the dollar have risen substantially (Chart 15). As such, any short bets on the franc are likely being placed naked. If the Fed ends up tempering its pace of rate hikes next year in response to weaker US activity, short-covering activity is likely to accentuate any pre-existing strength in the CHF. Chart 15Hedging Costs For USD/CHF Carry Trades Have Risen Hedging Costs Are Prohibitive
Hedging Costs For USD/CHF Carry Trades Have Risen Hedging Costs Are Prohibitive
Hedging Costs For USD/CHF Carry Trades Have Risen Hedging Costs Are Prohibitive
Bottom Line: The franc is undervalued against the dollar, and a good hedge against a rise in volatility versus other procyclical currencies. This places the franc in a good “heads I win, tails I don’t loose too much” bet. Swiss interest rates are also likely to climb higher. However, because the franc will do the bulk of the monetary tightening, the SNB is likely to lag the expectations now embedded in the SARON curve.What About Swiss Equities?Despite the cyclical nature of the Swiss economy, Swiss equities are extremely defensive. Swiss stocks have little to do with the domestic economy and are mostly a collection of large multinationals, dominated by the healthcare and consumer staples sectors, which together account for roughly 60% of the Swiss MSCI benchmark.This defensive attribute has created its own problem for Swiss equities. Relative to the Eurozone, the Swiss market has moved massively ahead of profitability, and it is now more expensive than at the apex of the European debt crisis in 2012 (Chart 16). Moreover, the jump in German yields is becoming increasingly problematic for Swiss stocks that historically perform poorly when global interest rates are rising (Chart 17). Chart 16Swiss Stocks Are Expensive
Swiss Stocks Are Expensive
Swiss Stocks Are Expensive
Chart 17A Lost Tailwind
A Lost Tailwind
A Lost Tailwind
In the near term, Swiss equities will only be able to defy the gravitational pull created by demanding valuations and higher yields if global risk aversion remains elevated. However, once global stocks find a floor and Italian spreads begin to narrow, Swiss stocks are likely to underperform massively (Chart 18). It could take a few more weeks before the BTP/Bund spreads narrow as the recent ECB announcement was rather tepid. However, the ECB holding an emergency meeting and issuing a formal statement addressing the problem facing peripheral bond markets suggests that a formal program designed to manage fragmentation risk will emerge before the end of the summer.Beyond their defensive attributes, Swiss stocks also correlate to the Quality Factor. The robust performance of this factor since the turn of the millennium, in Europe and globally, has allowed the Swiss market to greatly outperform Eurozone equities (Chart 19). However, the Quality Factor has begun to underperform, which indicates that the Swiss market is losing another of its underpinnings. Chart 18Near-term, Follow Risk Aversion
Near-term, Follow Risk Aversion
Near-term, Follow Risk Aversion
Chart 19Swiss Stocks Are About Quality
Swiss Stocks Are About Quality
Swiss Stocks Are About Quality
These observations imply that over the next 12 to 18 months, Swiss equities will underperform their Euro Area counterparts. Materials and consumer staples stand out as the two sectors with the most extended valuations relative to their Euro Area competitors, especially since their relative performances have become dissociated from relative profits (Chart 20). They should carry maximum underweights relative to their European counterparts. The healthcare sector is Switzerland’s largest market weight. It is not as expensive relative to the Eurozone as the materials and consumer staples sectors, but it carries enough of a premium that investors should still underweight this sector relative to its eurozone competitor (Chart 21). Chart 20Dangerous Setup For Swiss Materials and Staples
Dangerous Setup For Swiss Materials and Staples
Dangerous Setup For Swiss Materials and Staples
Chart 21The Swiss Heavyweight Is Becoming Pricey
The Swiss Heavyweight Is Becoming Pricey
The Swiss Heavyweight Is Becoming Pricey
Bottom Line: The defensive nature of the Swiss market has allowed for a large outperformance over European equities. However, the Swiss market is now very expensive on a relative basis, and it is vulnerable to higher interest rates. While global risk aversion can still buoy the Swiss market in the near term, conditions are falling into place for Swiss stocks to underperform their Eurozone counterpart over a 12-to-18 month window. Materials and consumer staples are the sectors mostly likely to experience a large underperformance relative to their Euro Area competitors, followed by the healthcare sector. Investment ConclusionsVolatility in FX markets is likely to remain elevated, as witnessed by the reaction of a full circle of central bank meetings this week.Policy convergence remains a good bet for interest rate curves and currency pairs. The SNB surprised markets by raising interest rates by 50 bps, to -0.25%, the first hike since 2007 (Chart 1).Higher volatility will continue to buoy the Swiss franc in the short run.Structural appreciation in the franc is also likely over the coming decades.Swiss stocks often perform well during economic downturns, but they are not particularly cheap, and vulnerable to higher interest rates. Investors should only overweight Swiss stocks if they expect more significant downside to global stocks.Valuation favors the franc versus the dollar. However, EUR/CHF and GBP/CHF are closer to fair value. CHF/JPY is expensive; hence the yen is a better hedge for downside economic surprises. Go short CHF/JPY as a trade.BCA’s Foreign Exchange Strategy was short CHF/SEK at 10.2 with stop loss at 10.5. That stop was hit overnight, triggering a loss of -3.3%. Stand aside for now. Chester NtoniforForeign Exchange Strategistchestern@bcaresearch.comMathieu Savary Chief European StrategistMathieu@bcaresearch.com
Listen to a short summary of this report. Executive Summary Higher Real Yields Have Weighed On Equity Valuations
Higher Real Yields Have Weighed On Equity Valuations
Higher Real Yields Have Weighed On Equity Valuations
I had the pleasure of visiting clients in Saudi Arabia, Bahrain, and Abu Dhabi last week. In contrast to the rest of the world, the mood in the Middle East was very positive. While high oil prices are helping, there is also a lot of optimism about ongoing structural reforms. Petrodollar flows are increasingly being steered towards private and public equities. EM assets stand to benefit the most. Producers in the region are trying to offset lost Russian output, but realistically, they will not be able to completely fill the gap in the near term. Today’s high energy prices have largely baked in this reality, as reflected in strongly backwardated futures curves. There was no consensus about how high oil prices would need to rise to trigger a global recession, although the number $150 per barrel got bandied about a lot. Given that most Middle Eastern currencies are pegged to the dollar, there was a heavy focus on Fed policy. Market estimates of the neutral rate in the US have increased rapidly towards our highly out-of-consensus view. Nevertheless, we continue to see modest upside for bond yields over a multi-year horizon. Over a shorter-term 6-to-12-month horizon, the direction of bond yields will be guided by the evolution of inflation. While US CPI inflation rose much more than expected in May, the details of the report were somewhat less worrying, as they continue to show significant supply-side distortions. Bottom Line: Inflation should come down during the remainder of the year, allowing the Fed to breathe a sigh of relief and stocks to recover some of their losses. A further spike in oil prices is a major risk to this view. Dear Client, Instead of our regular report next week, we will be sending you a Special Report written by Chester Ntonifor, BCA Research’s Chief Foreign Exchange Strategist, discussing the outlook for gold. We will be back the following week with the GIS Quarterly Strategy Outlook, where we will explore the major trends that are set to drive financial markets in the rest of 2022 and beyond. As always, I will hold a webcast discussing the outlook the following week, on Thursday, July 7th. Best regards, Peter Berezin Chief Global Strategist Peter in Arabia I had the pleasure of visiting clients in Saudi Arabia, Bahrain, and Abu Dhabi last week. This note summarizes my impressions and provides some commentary about recent market turmoil. The Mood in the Region is Very Positive In contrast to the rest of the world, the mood in the Middle East was upbeat. Obviously, high oil prices are a major contributor (Chart 1). Across the region, stock markets are still up for the year (Chart 2). Chart 1Oil Prices Have Shot Up
Oil Prices Have Shot Up
Oil Prices Have Shot Up
Chart 2Middle Eastern Stock Markets Are Doing Relatively Well This Year
Middle Eastern Stock Markets Are Doing Relatively Well This Year
Middle Eastern Stock Markets Are Doing Relatively Well This Year
That said, I also felt that investors were encouraged by ongoing structural reforms, especially in Saudi Arabia where the Vision 2030 program is being rolled out. The program seeks to diversify the Saudi economy away from its historic reliance on petroleum exports. A number of people I spoke with cited the Saudi sovereign wealth fund’s acquisition of a majority stake in Lucid, a California-based EV startup, as the sort of bold move that would have been unthinkable a few years ago. I first visited Riyadh in May 2011 where I controversially delivered a speech entitled “The Coming Commodity Bust” (oil was $120/bbl then and copper prices were near an all-time high). The city has changed immensely since then. The number of restaurants and entertainment venues has increased exponentially. The ban on women drivers was lifted only four years ago. In that short time, it has become a common-day occurrence. Capital Flows Into and Out of the Region are Reflecting a New Geopolitical Reality In addition to high oil prices and structural reforms, geopolitical considerations are propelling significant capital inflows into the region. The freezing of Russia’s foreign exchange reserves sent a shockwave across much of the world, with a number of other EM countries wondering if “they are next.” Ironically, the Middle East has emerged as a neutral player of sorts in this multipolar world, and hence a safer destination for capital flows. On the flipside, the region’s oil exporters appear to be acting more strategically in how they allocate their petrodollar earnings. Rather than simply parking the proceeds of oil sales in overseas US dollar bank accounts, they are investing them in ways that further their economic and political goals. One clear trend is that equity allocations to both overseas public and private markets are rising. Other emerging markets stand to benefit the most from this development, especially EMs who have assets that Middle Eastern countries deem important – assets tied to food security being a prime example. Assuming that the current level of oil prices is maintained, we estimate that non-US oil exports will rise to $2.5 trillion in 2022, up from $1.5 trillion in 2021 (Chart 3). About 40% of this windfall will flow to the Middle East. That is a big slug of cash, enough to influence the direction of equity markets. Chart 3Oil Exporters Reaping The Benefits Of High Oil Prices
An Oasis Of Optimism: Notes From The Middle East
An Oasis Of Optimism: Notes From The Middle East
Middle Eastern Energy Producers Will Boost Output, But Don’t Expect Any Miracles in the Short Term Russian oil production will likely fall by about 2 million bpd relative to pre-war levels over the next 12 months. To help offset the impact, OPEC has already raised production by 200,000 barrels and will almost certainly bump it up again following President Biden’s visit to the region in July (Chart 4). The decision to raise production to stave off a super spike in oil prices is not entirely altruistic. The region’s oil exporters know that excessively high oil prices could tip the global economy into recession, an outcome that would surely lead to much lower oil prices down the road. There was not much clarity on what that tipping point is, but the number $150 per barrel got bandied around a lot. Politics is also a factor. A further rise in oil prices could compel the US to make a deal with Iran, something the Saudis do not want to see happen. Still, there is a practical limit to how much more oil the Saudis and other Middle Eastern producers can bring to market in the near term. Today’s high energy prices have largely baked in this reality, as reflected in strongly backwardated futures curves (Chart 5). Chart 4Output Trends In The Major Oil Producers
Output Trends In The Major Oil Producers
Output Trends In The Major Oil Producers
Chart 5Energy Prices On Both Sides Of The Atlantic
An Oasis Of Optimism: Notes From The Middle East
An Oasis Of Optimism: Notes From The Middle East
Data on Saudi’s excess capacity is notoriously opaque, but I got the feeling that an extra 1-to-1.5 million bpd was the most that the Kingdom could deliver. The same constraints apply to natural gas. Qatar is investing nearly $30 billion to expand its giant North Field, which should allow gas production to rise by as much as 60%. However, it will take four years to complete the project. The share of Qatari liquefied natural gas (LNG) going to Europe has actually declined this year. About 80% of Qatar’s LNG is sold to Asian buyers under long-term contracts that cannot be easily adjusted. And even if those contracts could be rewritten, this would only bring limited benefits to Europe. For example, Germany has no terminals to accept LNG imports, although it is planning to build two. While there was plenty of sympathy to Europe’s plight in the region, there was also a sense that European governments had been cruising for a bruising by doubling down on strident anti-fossil fuel rhetoric over the past decade without doing much to end their dependence on Russian oil and gas. In that context, few in the region seemed willing to bend over backwards to help Europe. In the meantime, the US remains Europe’s best hope. US LNG shipments to Europe have tripled since last year. The US is now sending nearly three quarters of its liquefied gas to Europe. This has pushed up US natural gas prices, although they still remain a fraction of what they are in Europe. Huge Focus on the Fed Chart 6Most Of The Increase In Bond Yields Has Been In The Real Component
Most Of The Increase In Bond Yields Has Been In The Real Component
Most Of The Increase In Bond Yields Has Been In The Real Component
Most Middle Eastern currencies are pegged to the dollar, and hence the region effectively imports its monetary policy from the US. Not surprisingly, clients were very focused on the Federal Reserve. Many expressed concern about the abrupt pace of rate hikes. One of our high-conviction views is that the neutral rate of interest in the US has risen as the household deleveraging cycle has ended, fiscal policy has become structurally looser, and a growing number of baby boomers have transitioned from working (and saving) to retirement (and dissaving). The markets have rapidly priced in this view over the course of 2022. The 5-year/5-year forward Treasury yield – a proxy for the neutral rate – has increased from 1.90% at the start of the year to 3.21% at present. Most of this increase in the market’s estimate of the neutral rate has occurred in the real component. The 5-year/5-year forward TIPS yield has climbed from -0.49% to 0.84%; in contrast, the implied TIPS breakeven inflation rate has risen from only 2.24% to 2.37% (Chart 6). Implications of Higher Bond Yields on Equity Prices and the Economy Chart 7Higher Real Yields Have Weighed On Equity Valuations
Higher Real Yields Have Weighed On Equity Valuations
Higher Real Yields Have Weighed On Equity Valuations
As both theory and practice suggest, there is a strong negative correlation between real bond yields and equity valuations. Chart 7 shows that the S&P 500 forward P/E ratio has been moving broadly in line with the 5-year/5-year forward TIPS yield. The bad news is that there is still scope for bond yields to rise over the long haul. Our fair value estimate of 3.5%-to-4% for the neutral rate is about 25-to-75 basis points above current pricing. The good news is that a high neutral rate helps insulate the economy from a near-term recession. Recessions typically occur only when monetary policy turns restrictive. A few clients cited the negative Q1 GDP reading and the near-zero Q2 growth estimate in the Atlanta Fed GDPNow model as evidence that a US recession is either close at hand or has already begun (Chart 8). Chart 8Underlying US Growth Is Expected To Be Solid In Q2
An Oasis Of Optimism: Notes From The Middle East
An Oasis Of Optimism: Notes From The Middle East
We would push back against such an interpretation. In contrast to the -1.5% real GDP print, real Gross Domestic Income (GDI) rose by 2.1% in Q1. Conceptually, GDP and GDI should be equal, but since the two numbers are compiled in different ways, there can often be major statistical discrepancies. A simple average of the two suggests the US economy still grew in the first quarter. More importantly, real final sales to private domestic purchasers rose by 3.9% in Q1. This measure of economic activity – which strips out the often-noisy contributions from inventories, government expenditures, and net exports – is the best predictor of future GDP growth of any item in the national accounts (Table 1). Table 1A Good Sign: Real Final Sales To Private Domestic Purchasers Rose By 3.9% In Q1
An Oasis Of Optimism: Notes From The Middle East
An Oasis Of Optimism: Notes From The Middle East
As far as Q2 is concerned, real final sales to private domestic purchasers are tracking at 2.0% according to the Atlanta Fed model – a clear deceleration from earlier this year, but still consistent with a generally healthy economy. Growth will probably slow in the third quarter, reflecting the impact of higher gasoline prices, rising interest rates, and lower asset prices. Nevertheless, the fundamental underpinnings for the economy – low household debt, $2.2 trillion in excess savings, a dire need to boost corporate capex and homebuilding, and a strong labor market – remain in place. The odds of a recession in the next 12 months are quite low. Gauging Near-Term Inflation Dynamics A higher-than-expected neutral rate of interest implies that bond yields will probably rise from current levels over the long run. Over a shorter-term 6-to-12-month horizon, however, the direction of yields will be guided by the evolution of inflation. While the core CPI surprised on the upside in May, the details of the report were somewhat less worrying, as they continue to show significant supply-side distortions. Excluding vehicles, core goods prices rose 0.3% in May, down from a Q1 average of 0.7% (Chart 9). Recent commentary from companies such as Target suggest that goods inflation will ease further. Chart 9Goods Inflation Is Moderating, While Service Price Growth Is Elevated
An Oasis Of Optimism: Notes From The Middle East
An Oasis Of Optimism: Notes From The Middle East
Stripping out energy-related services, services inflation slowed slightly to 0.6% in May from 0.7% in April. A deceleration in wage growth should help keep a lid on services inflation over the coming months (Chart 10). Chart 10A Deceleration In Wage Growth Should Help Keep Services Inflation Contained
An Oasis Of Optimism: Notes From The Middle East
An Oasis Of Optimism: Notes From The Middle East
During his press conference, Fed Chair Powell described the rise in inflation expectations in the University of Michigan survey as “quite eye-catching.” Although long-term inflation expectations remain a fraction of what they were in the early 1980s, they did rise to the highest level in 14 years in June (Chart 11). Powell also noted that the Fed’s Index of Common Inflation Expectations has been edging higher. The Fed’s focus on ensuring that inflation expectations remain well anchored is understandable. That said, there is a strong correlation between the level of gasoline prices and inflation expectations (Chart 12). If gasoline prices come down from record high levels over the coming months, inflation expectations should drop. Chart 11Consumer Long-Term Inflation Expectations Keep Rising, But Are Still Not At Historically High Levels
Consumer Long-Term Inflation Expectations Keep Rising, But Are Still Not At Historically High Levels
Consumer Long-Term Inflation Expectations Keep Rising, But Are Still Not At Historically High Levels
Chart 12Lower Gasoline Prices Would Help Soothe Consumer Fears Over Inflation
Lower Gasoline Prices Would Help Soothe Consumer Fears Over Inflation
Lower Gasoline Prices Would Help Soothe Consumer Fears Over Inflation
The Fed expects core PCE inflation to fall to 4.3% on a year-over-year basis by the end of 2022. This would require month-over-month readings of about 0.35 percentage points, which is slightly above the average of the past three months (Chart 13). Our guess is that the Fed may be highballing its near-term inflation projections in order to give itself room to “underpromise and overdeliver” on the inflation front. If so, we could see inflation estimates trimmed later this year, which would provide a more soothing backdrop for risk assets. Chart 13AUS Inflation Will Fall By More Than The Fed Expects If The Monthly Change In Core PCE Is Less Than 0.35% (I)
US Inflation Will Fall By More Than The Fed Expects If The Monthly Change In Core PCE Is Less Than 0.35% (I)
US Inflation Will Fall By More Than The Fed Expects If The Monthly Change In Core PCE Is Less Than 0.35% (I)
Chart 13BUS Inflation Will Fall By More Than The Fed Expects If The Monthly Change In Core PCE Is Less Than 0.35% (II)
US Inflation Will Fall By More Than The Fed Expects If The Monthly Change In Core PCE Is Less Than 0.35% (II)
US Inflation Will Fall By More Than The Fed Expects If The Monthly Change In Core PCE Is Less Than 0.35% (II)
Concluding Thoughts on Investment Strategy According to Bank of America, fund managers cut their equity exposure to the lowest since May 2020. Optimism on global growth fell to a record low. Meanwhile, bears outnumbered bulls by 39 percentage points in this week’s AAII poll (Chart 14). If the stock market is about to crash, it will be the most anticipated crash in history. In my experience, markets rarely do what most people expect them to do. Chart 14Sentiment Towards Equities Is Pessimistic
Sentiment Towards Equities Is Pessimistic
Sentiment Towards Equities Is Pessimistic
Chart 15Global Equities Are More Attractively Valued After The Recent Sell-Off
Global Equities Are More Attractively Valued After The Recent Sell-Off
Global Equities Are More Attractively Valued After The Recent Sell-Off
Chart 16US And European EPS Estimates Have Been Trending Higher This Year
US And European EPS Estimates Have Been Trending Higher This Year
US And European EPS Estimates Have Been Trending Higher This Year
US equities are trading at 16.3-times forward earnings, with non-US stocks sporting a forward P/E ratio of 12.1 (Chart 15). Despite the decline in share prices, earnings estimates in both the US and Europe have increased since the start of the year (Chart 16). The consensus is that those estimates will fall. However, if our expectation that a recession will be averted over the next 12 months pans out, that may not happen. A sensible strategy right now is to maintain a modest overweight to stocks while being prepared to significantly raise equity exposure once clear evidence emerges that inflation has peaked. Peter Berezin Chief Global Strategist peterb@bcaresearch.com Follow me on LinkedIn Twitter View Matrix
An Oasis Of Optimism: Notes From The Middle East
An Oasis Of Optimism: Notes From The Middle East
Special Trade Recommendations Current MacroQuant Model Scores
An Oasis Of Optimism: Notes From The Middle East
An Oasis Of Optimism: Notes From The Middle East
Executive Summary Structural Tailwinds For The Franc
Structural Tailwinds For The Franc
Structural Tailwinds For The Franc
Volatility in FX markets is likely to remain elevated, as witnessed by the reaction of a full circle of central bank meetings this week. Policy convergence remains a good bet for interest rate curves and currency pairs. The SNB surprised markets by raising interest rates by 50 bps, to -0.25%, the first hike since 2007. Higher volatility will continue to buoy the Swiss franc in the short run. Structural appreciation in the franc is also likely over the coming decades (Feature Chart). Swiss stocks often perform well during economic downturns, but they are not particularly cheap, and are vulnerable to higher interest rates. Investors should only overweight Swiss stocks if they expect more significant downside to global stocks. Valuation favors the franc versus the dollar. However, EUR/CHF and GBP/CHF are closer to fair value. CHF/JPY is expensive; hence, the yen is a better hedge for downside economic surprises. Go short CHF/JPY as a trade. BCA’s Foreign Exchange Strategy was short CHF/SEK at 10.2 with stop loss at 10.5. That stop was hit overnight, triggering a loss of -3.3%. Stand aside for now. Bottom Line: Favor the franc over the short term against other pro-cyclical currencies, with a view to downgrade CHF when it becomes evident that economic growth is bottoming. Any further bout of Swiss equity outperformance, prompted by global risk aversion, offers an attractive selling opportunity versus Eurozone stocks. Feature Chart 1The SNB Has Capitulated To Rising Inflation
The SNB Has Capitulated To Rising Inflation
The SNB Has Capitulated To Rising Inflation
Volatility in FX markets is likely to remain elevated. This week, the Fed delivered its first 75 bps interest rate hike since 1994. It also increased its expected year-end level for the Fed Funds rate to 3.4% from 1.9%, and to 3.8% from 3.4% at the end of 2023. The FX market had been warming up to a hawkish surprise, but the dollar surged on the news, hitting a fresh two-decade high of 105.5, before later reversing gains. Meanwhile, the European Central Bank (ECB) held an emergency meeting on Wednesday, to try to mitigate the rise in Italian yields, which hit as high as 4.2% on Tuesday, or 243 bps over German 10-year yields. The subsequent statement released by the Governing Council offered no concrete details. Yes, the reinvestments of the proceeds from maturing debt in the Pandemic Emergency Purchase Program (PEPP) will flow mostly to peripheral markets, but investors want clarity on the nature of the long-awaited policy plan to tackle fragmentation risk in the Euro Area. As a result, peripheral bond markets will remain fragile until a bold program comes to fruition. To cement currency volatility this week, SNB Governor Thomas Jordan surprised markets by raising interest rates by 50 bps in Switzerland, to -0.25%, the first hike since the Global Financial Crisis (Chart 1). The negative interest rate threshold for sight deposits was also lowered, a move encouraging banks to pack reserves at the SNB. The Bank of England also raised interest rates in line with market expectations. The move initially disappointed GBP bulls, but sterling is holding above our 1.20 floor. An environment of monetary policy uncertainty, rising recession risks in response to high inflation, and the potential for central bank policy mistakes bodes well for safe-haven assets. In Europe, the market with the strongest defensive profile is Switzerland. In this report, we address whether investors should bet on continued appreciation of the franc and an outperformance of Swiss stocks, especially now that the SNB has turned hawkish. Switzerland Versus The World Global economic growth is slowing and a small/open economy like Switzerland’s has not been spared. The KOF economic barometer, a key leading indicator for Swiss GDP growth, has collapsed over the past twelve months from 144 to 97 as global industrial activity decelerated (Chart 2). Despite softening growth, global inflation refuses to decline, forcing central banks worldwide to lean into the slowdown. This threatens to cut the post-pandemic business cycle expansion short. Chart 2The SNB Is Tightening Into A Slowing Economy
The SNB Is Tightening Into A Slowing Economy
The SNB Is Tightening Into A Slowing Economy
Surprisingly, the Swiss economy is generally performing better than the rest of Europe. Historically, Swiss economic performance is procyclical due to the large share of exports within its GDP. Hence, a slowdown in global manufacturing often creates a large threat to Swiss growth. Going forward, can the Swiss economy diverge from that of the rest of the world (Chart 3)? Such a divergence is not probable, but a few factors will protect the Swiss economy: Switzerland still has one of the lowest policy rates in the G10, even after today’s 50bps interest rate increase. This has tremendously helped ease monetary conditions. Our monetary gauge is at its most accommodative level in over two decades (Chart 4). Chart 3The Swiss Economy Is Procyclical
The Swiss Economy Is Procyclical
The Swiss Economy Is Procyclical
Chart 4Swiss Monetary Conditions Are Still Accommodative
Swiss Monetary Conditions Are Still Accommodative
Swiss Monetary Conditions Are Still Accommodative
Swiss inflation remains the lowest in the G10 outside Japan. In Switzerland, the main driver of price increases has been goods, while services inflation remains subdued. Consequently, the SNB has been tolerating an appreciating franc to temper imported inflation (Chart 5), while keeping domestic borrowing costs at very accommodative levels. In its updated forecasts, the SNB now expects a -0.25% interest rate to allow Swiss inflation to moderate to 1.9% in 2023 and 1.6% in 2024. Chart 5Swiss Inflation Is Surprising To The Upside
Swiss Inflation Is Surprising To The Upside
Swiss Inflation Is Surprising To The Upside
Part of the reason Switzerland has low inflation has been the tremendous productivity gains, especially relative to its trading partners (Chart 6). Swiss income-per-capita is elevated, but wage growth has lagged output gains, which limits the risk of a wage-inflation spiral. It is notable that part-time employment continues to dominate job gains, implying that the need for precautionary savings will remain high in Switzerland. Chart 6A Productivity Profile For Switzerland
A Productivity Profile For Switzerland
A Productivity Profile For Switzerland
Higher productivity growth and the elevated national savings leave their footprint on the trade data. The Swiss trade balance is hitting fresh highs, unlike Europe or Japan (Chart 7). This could potentially create a problem for the Swiss economy as it puts upward pressure on the CHF at a time when global manufacturing output is slowing. However, Switzerland specializes in high value-added exports with an elevated degree of complexity, that stand early in global supply chains. These type of goods are likely to remain in high demand in a global environment marked by supply-chain bottlenecks and high-capacity utilization. Chart 7Structural Tailwinds For The Franc
Structural Tailwinds For The Franc
Structural Tailwinds For The Franc
Finally, Switzerland does not import energy to fulfill its electricity production. Hydropower accounts for roughly 61.4% of electricity generation, followed by nuclear power at 28.5%. This has partially insulated Switzerland from the energy shock hurting economic activity and trade balances in the EU. For example, German electricity generation is 28.8% coal and 14.7% natural gas. Bottom Line: The Swiss economy is reopening and is relatively insulated from the Russia-Ukraine conflict. This limits to some degree how closely Switzerland will track the global and European economic slowdown. It creates a departure from the traditional pro-cyclicality of the Swiss economy. The SNB, The SARON Curve, And The Swiss Franc If the Swiss economy surprises to the upside, the case for the SNB to tolerate a rising franc becomes even stronger. The pace of foreign exchange reserve accumulation is already decelerating (Chart 8). Governor Thomas Jordan has been very clear: as global prices rise, the fair value of the franc is also rising, which implies a willingness to tolerate currency strength. In a purchasing power parity framework, higher external inflation makes Swiss goods relatively cheaper. This allows foreigners to bid up the currency. Even with today’s updated pricing, the SNB is still expected to remain among the most dovish central banks in the G10 (Chart 9). If inflationary pressures prove sticky, the SNB will step up its hawkish rhetoric. If inflationary fears subside, then global rates will fall as well, which has usually been a boon for the franc. More specifically, this would be negative for the EUR/CHF cross (Chart 10). Chart 8Less Intervention By The SNB
Less Intervention By The SNB
Less Intervention By The SNB
Chart 9The SARON Curve Has Adjusted Higher
The SARON Curve Has Adjusted Higher
The SARON Curve Has Adjusted Higher
Chart 10EUR/CHF And Bund Yields Can Continue To Diverge
EUR/CHF And Bund Yields Can Continue To Diverge
EUR/CHF And Bund Yields Can Continue To Diverge
The Swiss economy can tolerate an appreciating CHF, but can it withstand higher interest rates? We believe so. Switzerland is a net creditor nation, but its domestic non-financial debt is also extremely elevated. Thus, the Swiss economy is vulnerable to higher rates, especially the housing market (Chart 11). Nonetheless, internal adjustments will soften the blow and increase affordability. Of note, property speculation in Switzerland has decreased in response to macroprudential measures. Growth in rental housing prices, which usually constitute the bulk of investment homes, has collapsed, but the price of owner-occupied homes has proven more robust (Chart 12). A cap on the percentage of secondary homes in any Canton as well as tighter lending standards have also helped. In a renewed update to its Financial Stability Report, Fritz Zurbrügg, Vice Chairman of the Governing Board, suggests that Swiss banks are well capitalized, especially given the recent reactivation of the countercyclical capital buffer. Chart 11Higher Rates Are A Risk For Swiss Real Estate
Higher Rates Are A Risk For Swiss Real Estate
Higher Rates Are A Risk For Swiss Real Estate
Chart 12Some Adjustment Already In Investment Home Prices
Some Adjustment Already In Investment Home Prices
Some Adjustment Already In Investment Home Prices
In the very near term, demographics might also be a tailwind. The pandemic limited immigration to Switzerland, but the working-age population is rebounding anew (Chart 13), which will create a cushion under housing and support domestic demand. Chart 13A Small Demographic Tailwind For Home Prices
A Small Demographic Tailwind For Home Prices
A Small Demographic Tailwind For Home Prices
Stronger aggregate demand in an inflationary world will justify the need for less monetary accommodation. In a nutshell, the SNB is likely to continue walking the path of “least regrets” like most central banks, by tightening monetary policy to meet its 2% inflation mandate, but pausing if economic conditions warrant. The currency has historically been used as a key tool for calibrating financial conditions. From a fundamental perspective, our PPP models suggest the franc is quite cheap versus the dollar but at fair value versus the euro and sterling. This is echoed by Governor Jordan, who no longer views the franc as expensive. Our models adjusts the consumption basket in Switzerland for an apples-to-apples comparison across both the UK and the eurozone (Chart 14). Chart 14AA CHF Is At Fair Value Versus The EUR And GBP
A CHF Is At Fair Value Versus The EUR And GBP
A CHF Is At Fair Value Versus The EUR And GBP
Chart 14BA CHF Is At Fair Value Versus The EUR And GBP
A CHF Is At Fair Value Versus The EUR And GBP
A CHF Is At Fair Value Versus The EUR And GBP
Finally, hedging costs for shorting the franc against the dollar have risen substantially (Chart 15). As such, any short bets on the franc are likely being placed naked. If the Fed ends up tempering its pace of rate hikes next year in response to weaker US activity, short-covering activity is likely to accentuate any pre-existing strength in the CHF. Chart 15Hedging Costs For USD/CHF Carry Trades Have Risen Hedging Costs Are Prohibitive
Hedging Costs For USD/CHF Carry Trades Have Risen Hedging Costs Are Prohibitive
Hedging Costs For USD/CHF Carry Trades Have Risen Hedging Costs Are Prohibitive
Bottom Line: The franc is undervalued against the dollar, and a good hedge against a rise in volatility versus other procyclical currencies. This places the franc in a good “heads I win, tails I don’t loose too much” bet. Swiss interest rates are also likely to climb higher. However, because the franc will do the bulk of the monetary tightening, the SNB is likely to lag the expectations now embedded in the SARON curve. What About Swiss Equities? Despite the cyclical nature of the Swiss economy, Swiss equities are extremely defensive. Swiss stocks have little to do with the domestic economy and are mostly a collection of large multinationals, dominated by the healthcare and consumer staples sectors, which together account for roughly 60% of the Swiss MSCI benchmark. This defensive attribute has created its own problem for Swiss equities. Relative to the Eurozone, the Swiss market has moved massively ahead of profitability, and it is now more expensive than at the apex of the European debt crisis in 2012 (Chart 16). Moreover, the jump in German yields is becoming increasingly problematic for Swiss stocks that historically perform poorly when global interest rates are rising (Chart 17). Chart 16Swiss Stocks Are Expensive
Swiss Stocks Are Expensive
Swiss Stocks Are Expensive
Chart 17A Lost Tailwind
A Lost Tailwind
A Lost Tailwind
In the near term, Swiss equities will only be able to defy the gravitational pull created by demanding valuations and higher yields if global risk aversion remains elevated. However, once global stocks find a floor and Italian spreads begin to narrow, Swiss stocks are likely to underperform massively (Chart 18). It could take a few more weeks before the BTP/Bund spreads narrow as the recent ECB announcement was rather tepid. However, the ECB holding an emergency meeting and issuing a formal statement addressing the problem facing peripheral bond markets suggests that a formal program designed to manage fragmentation risk will emerge before the end of the summer. Beyond their defensive attributes, Swiss stocks also correlate to the Quality Factor. The robust performance of this factor since the turn of the millennium, in Europe and globally, has allowed the Swiss market to greatly outperform Eurozone equities (Chart 19). However, the Quality Factor has begun to underperform, which indicates that the Swiss market is losing another of its underpinnings. Chart 18Near-term, Follow Risk Aversion
Near-term, Follow Risk Aversion
Near-term, Follow Risk Aversion
Chart 19Swiss Stocks Are About Quality
Swiss Stocks Are About Quality
Swiss Stocks Are About Quality
These observations imply that over the next 12 to 18 months, Swiss equities will underperform their Euro Area counterparts. Materials and consumer staples stand out as the two sectors with the most extended valuations relative to their Euro Area competitors, especially since their relative performances have become dissociated from relative profits (Chart 20). They should carry maximum underweights relative to their European counterparts. The healthcare sector is Switzerland’s largest market weight. It is not as expensive relative to the Eurozone as the materials and consumer staples sectors, but it carries enough of a premium that investors should still underweight this sector relative to its eurozone competitor (Chart 21). Chart 20Dangerous Setup For Swiss Materials and Staples
Dangerous Setup For Swiss Materials and Staples
Dangerous Setup For Swiss Materials and Staples
Chart 21The Swiss Heavyweight Is Becoming Pricey
The Swiss Heavyweight Is Becoming Pricey
The Swiss Heavyweight Is Becoming Pricey
Bottom Line: The defensive nature of the Swiss market has allowed for a large outperformance over European equities. However, the Swiss market is now very expensive on a relative basis, and it is vulnerable to higher interest rates. While global risk aversion can still buoy the Swiss market in the near term, conditions are falling into place for Swiss stocks to underperform their Eurozone counterpart over a 12-to-18 month window. Materials and consumer staples are the sectors mostly likely to experience a large underperformance relative to their Euro Area competitors, followed by the healthcare sector. Investment Conclusions Volatility in FX markets is likely to remain elevated, as witnessed by the reaction of a full circle of central bank meetings this week. Policy convergence remains a good bet for interest rate curves and currency pairs. The SNB surprised markets by raising interest rates by 50 bps, to -0.25%, the first hike since 2007 (Chart 1). Higher volatility will continue to buoy the Swiss franc in the short run. Structural appreciation in the franc is also likely over the coming decades. Swiss stocks often perform well during economic downturns, but they are not particularly cheap, and vulnerable to higher interest rates. Investors should only overweight Swiss stocks if they expect more significant downside to global stocks. Valuation favors the franc versus the dollar. However, EUR/CHF and GBP/CHF are closer to fair value. CHF/JPY is expensive; hence the yen is a better hedge for downside economic surprises. Go short CHF/JPY as a trade. BCA’s Foreign Exchange Strategy was short CHF/SEK at 10.2 with stop loss at 10.5. That stop was hit overnight, triggering a loss of -3.3%. Stand aside for now. Chester Ntonifor Foreign Exchange Strategist chestern@bcaresearch.com Mathieu Savary Chief European Strategist Mathieu@bcaresearch.com Trades & Forecasts Strategic View Cyclical Holdings (6-18 months) Tactical Holdings (0-6 months) Forecast Summary

The Swiss National Bank lifted its policy rate by 50bps to -0.25% on Thursday, surprising expectations that it would stand pat and marking its first rate hike in 15 years. In addition, the post-meeting statement noted that “it cannot be ruled out that further…
Executive Summary
Does Powell Need To Channel His Inner Volcker?
Does Powell Need To Channel His Inner Volcker?
Economic growth is now a casualty, and not a driver, of monetary policy choices. Inflation is dictating where central banks are taking interest rates. Our baseline view remains that core US inflation will cool by enough on its own without the need for the Fed to deliver a policy-induced recession. However, the odds of the latter have increased after the upside surprise in the May US CPI report. The ECB has been dragged into the same morass as other major central banks – tightening policy because of soaring inflation, despite broad-based signs of sluggish economic growth. We still see the pricing of cumulative rate hikes in the euro area as being too aggressive, even after last week’s clear announcement from the ECB that a string of future rate hikes was coming. With the ECB also announcing an end to its QE program, but offering no details on a replacement, markets have been given the green light to push Italian yields/spreads higher (and the euro lower) until there is an ECB response to market fragmentation in European sovereign debt. Bottom Line: The Fed is still more likely than the ECB to follow through on rate hikes discounted in US and European interest rate curves - position for renewed widening of the Treasury-Bund spread. Italian bond yields will remain under upward pressure until the contours of an ECB plan to stabilize Peripheral Spreads alongside rate hikes are revealed – tactically position for a wider BTP-Bund spread. Central Bankers Cannot Worry About Growth … Or Your Investment Portfolio The US consumer price index (CPI) report for May was yet another bond-bearish shock in a year full of them. With US headline US inflation hitting an 41-year high of 8.6%, the Treasury market adjusted bond yields upward to reflect both higher inflation expectations and even more aggressive Fed tightening. Coming only a day after the June European Central Bank (ECB) meeting that provided guidance that a series of rate hikes would begin in July, that could include a 50bp hike at the September meeting, financial markets worldwide moved to price in the risk that policy-induced recessions were the only way to bring down soaring global inflation. The result: global bond yields soared to new highs for the year, while risk assets of all shapes and sizes were hammered. We have our doubts that today’s class of policymakers – especially the Fed - has the stomach to repeat the actions of former Fed Chair Paul Volcker, who famously pushed US interest rates above the double-digit inflation rates of the late 1970s to engineer a deep recession to crush inflation. The starting point of the current tightening cycle is even further behind the curve than during the Volcker era, in terms of “realized” real interest rates, with the 10-year US Treasury yield now over five percentage points below headline US CPI inflation (Chart 1). Related Report Global Fixed Income StrategyAssessing The Risks To Our Main Views Central bankers are now faced with the no-win scenario of pushing nominal policy rates higher to chase soaring inflation in a bid to maintain inflation fighting credibility, regardless of the spillover effects on financial market stability or economic growth expectations. More worryingly, the rate hikes needed to establish that credibility are not only becoming more frequent but larger. 50bps has become the “standard” size for developed market rate hikes. The Fed may have upped the ante with the 75bp hike at yesterday's FOMC meeting. Such is the reality of a funds rate still only at 1.75% but with US inflation pushing toward 9%. The timing of the latest hawkish shifts from the Fed, ECB and others is surprising, looking purely from a growth perspective. The OECD leading economic indicators for the US, euro area and China are slowing, alongside depressed consumer confidence and deteriorating business sentiment (Chart 2). Similar readings are evident in comparable measures in other major economies, both in developed and emerging economies. This would normally be the type of backdrop that would entice central banks to consider easing monetary policy - IF inflation was subdued, which is clearly not the case today. Chart 1Does Powell Need To Channel His Inner Volcker?
Does Powell Need To Channel His Inner Volcker?
Does Powell Need To Channel His Inner Volcker?
In fact, high inflation is the reason why economic sentiment has worsened. Chart 2Worrying Signs For Global Growth
Worrying Signs For Global Growth
Worrying Signs For Global Growth
Consumers see income growth that is lagging inflation, especially for everyday items like gasoline and food. Businesses are seeing input costs rising, especially for labor in an environment of tight job markets. Inflation has become broad-based, across goods, services and wages. This is true for countries that are more advanced in their monetary tightening cycles - the US, Canada and the UK - where inflation rates are remarkably similar (Chart 3). But it is also now true in countries with lower (but still accelerating) inflation rates and where central banks have been slower to tighten monetary conditions, like the euro area and Australia (Chart 4). Chart 3Inflation Turning More 'Domestic' (Services / Wages) Here
Inflation Turning More 'Domestic' (Services / Wages) Here
Inflation Turning More 'Domestic' (Services / Wages) Here
Chart 4Still No Major Services/Wage Inflation Overshoots Here
Still No Major Services/Wage Inflation Overshoots Here
Still No Major Services/Wage Inflation Overshoots Here
For the Fed, assessing the underlying momentum of US inflation, and setting monetary policy accordingly, has become a bit trickier. While headline inflation continues to accelerate in response to rising energy and food prices, core inflation ticked lower in both April and May and now sits at 6.1%, down from 6.5% in March. Longer-term survey-based measures of inflation expectations have been moving steadily higher, with the University of Michigan 5-10 year consumer inflation expectations survey now up to a 14-year high of 3.3% (Chart 5). Yet longer-term market-based inflation expectations have been more stable, with the 10-year TIPS breakeven now at 2.66%, down from the late April peak of 3.02%. There are also some mixed signals visible within the US inflation data. Core goods CPI inflation clocked in at 8.5% in May, down from the recent peak of 12.4% in February 2022, while core services CPI inflation accelerated to a 14-year high of 5.2% in May (Chart 6). A similar divergence can be seen when looking at the Atlanta Fed’s measures of “sticky” and “flexible” price inflation. Core flexible CPI inflation – measuring prices that adjust more rapidly – has fallen from a peak of 19% to 12.3% in May. At the same time, core sticky CPI inflation for prices that are slower to adjust sped up to an 31-year high of 5% in May. Chart 5Some Mixed Inflation Messages For The Fed
Some Mixed Inflation Messages For The Fed
Some Mixed Inflation Messages For The Fed
Chart 6US Inflation Will Eventually Be Lower, But 'Stickier'
US Inflation Will Eventually Be Lower, But 'Stickier'
US Inflation Will Eventually Be Lower, But 'Stickier'
Chart 7Stick With UST-Bund Spread Widening Trades
Stick With UST-Bund Spread Widening Trades
Stick With UST-Bund Spread Widening Trades
In terms of the Fed’s next policy moves, the acceleration of core services (and sticky) inflation means underlying inflation momentum remains strong enough to make it difficult for the Fed to tighten by less than markets are discounting over the next year. Yet the deceleration of core goods (and flexible) inflation, if it continues, can lead to an eventual peak in overall US inflation. This would ease pressure on the Fed to tighten policy more aggressively than markets are expecting to slam the brakes on US economic growth. For nervous markets worried about Fed-induced recession risks, the clear peak in US inflation that we had been expecting has likely been pushed out further into the latter half of 2022. Thus, a significant fall in US Treasury yields that would provide relief to stressed risk assets is unlikely in the near term. Our preferred way to play that upward pressure on US Treasury yields is through an underweight stance on US Treasuries in global bond portfolios, rather than a below-benchmark duration stance. That is particularly true versus German Bunds - the 10-year UST-Bund yield spread is now well below the fair value level from our fundamental valuation model (Chart 7). Bottom Line: It is not clear that the Fed needs to “pull a Volcker” and generate a policy-induced recession to cool off US inflation. However, the Fed is far more likely to hike rates in line with market expectations than the ECB over the next 6-12 months. Stay underweight US Treasuries versus core Europe in global bond portfolios. The ECB Takes The Patient Off Life Support The ECB is finally coming to grips with surging European inflation. At last week’s policy meeting, the ECB Governing Council voted to end new bond buying via the Asset Purchase Program, while also signaling that a 25bp rate hike was on the way in July, with more hikes to follow – perhaps as much as 50bps in September if inflation remains elevated. Chart 8Markets Pricing In A Highly Aggressive ECB
Markets Pricing In A Highly Aggressive ECB
Markets Pricing In A Highly Aggressive ECB
The central bank provided a new set of quarterly economic projections that, unsurprisingly, included significant upward revisions to the inflation forecasts. The 2022 headline HICP inflation forecast was bumped from 5.1% to 6.8%, the 2023 forecast from 2.1% to 3.5% and the 2024 forecast was nudged higher from 1.9% to 2.1%. The projections for core HICP inflation were also increased to 3.3% for 2022, 2.8% for 2023 and 2.3% for 2024. The central bank now expects euro area inflation to stay above its 2% inflation target throughout its forecast period – even with a 20% decline in oil prices, and 36% fall in natural gas prices, built into the projection between 2022 and 2024. A move towards tighter monetary policy has been heralded by our ECB Monitor, which remains elevated largely due to its inflation component (Chart 8). By contrast, the growth component of the Monitor has rolled over and is now at levels consistent with unchanged monetary policy. Yet in the current environment of very elevated inflation, concerns about the economy are taking a back seat to maintaining the ECB’s inflation-fighting credibility. In the relatively young history of the ECB, dating back to the inception of the euro in 1998, there have only been three true hiking cycles that involved multiple interest rate increases: 2000, 2006-08 and 2011. In each case, both growth and inflation were accelerating in a broad-based way across the majority of euro area countries. Today, inflation is surging, with the headline HICP inflation rate hitting 8.1% in May, while core inflation (ex energy and food) is a more subdued but still high 4.4%. Economic growth is decelerating, however, with leading economic indicators now slowing in a majority of euro area countries (Chart 9). Chart 9Coming Up: An Unusual ECB Tightening Cycle That Ignores Growth
Coming Up: An Unusual ECB Tightening Cycle That Ignores Growth
Coming Up: An Unusual ECB Tightening Cycle That Ignores Growth
The ECB’s updated economic growth forecasts were downgraded for this year and next, with real GDP growth now expected to reach 2.8% in 2022 and 2.1% in both 2023 and 2024. Cutting growth forecasts for the current year was inevitable given the uncertainties stemming from the Ukraine war and soaring European energy prices. However, the projected growth rates do seem optimistic in the face of deeply depressed readings on economic sentiment from reliable measures like the ZEW index or the European Commission consumer confidence index, both of which have fallen sharply to levels last seen during the 2020 pandemic shock (Chart 10). Demand for European exports is also sluggish, particularly exports to China which are now flat in year-over-year terms. A similar pattern can be seen in the ECB’s inflation forecasts, which seem too optimistic in projecting lower wage growth and core inflation through 2024, even with the euro area unemployment rate forecasted to stay below 7% - under the OECD’s full employment estimate of 7.7% over the same period (Chart 11). Chart 10Overly Optimistic ECB Growth Forecasts
Overly Optimistic ECB Growth Forecasts
Overly Optimistic ECB Growth Forecasts
Chart 11Overly Optimistic ECB Inflation Forecasts?
Overly Optimistic ECB Inflation Forecasts?
Overly Optimistic ECB Inflation Forecasts?
The ECB is facing the same communications problem as other central banks at the moment. There is a fear of forecasting a major growth slowdown that would scare financial markets, even though that is a necessary condition to help bring down elevated inflation. At the same time, projections of a big decline in inflation that would limit the need for economy-crushing monetary tightening are not credible in the current environment of historically elevated headline inflation with very low unemployment rates. Interest rate markets understand the bind that the ECB finds itself in, and have moved to price in a very rapid jump in policy rates over the next 1-2 years. The 1-month OIS rate, 2-years forward is now at 2.5%, a high level compared to estimates of the neutral ECB policy rate, which lies between 1-1.5%. Core European bond yields have moved up alongside those rising rate expectations, with the 10-year German bund yield now at 1.64%, a far cry from the -0.18% yield at the start of 2022. Additional German yield increases will prove to be more difficult in the months ahead. There has already been a major upward adjustment in the inflation expectations component of yields, with the 10-year euro CPI swap rate now up to 2.6% compared to 2% at the start of this year (Chart 12). Importantly, those inflation expectations have stabilized of late, even in the face of high oil prices. Meanwhile, real bond yields, while still negative, have also moved up substantially and are now back to levels that prevailed before the ECB introduced negative policy rates in 2014 (bottom panel). With so much bond-bearish news now priced into core European bond yields, additional yield increases from here would require a more fundamental driver – an upward repricing of terminal interest rate expectations. On that note, the German yield curve is signaling that the terminal rate in the euro area is not much above 1.75%, as that is where bond yield forwards have converged to for both long and short maturity bonds (Chart 13). Chart 12How Much Higher Can Bund Yields Realistically Go?
How Much Higher Can Bund Yields Realistically Go?
How Much Higher Can Bund Yields Realistically Go?
Chart 13Markets Signaling A 1.75% Terminal Rate
Markets Signaling A 1.75% Terminal Rate
Markets Signaling A 1.75% Terminal Rate
Given our view that the neutral rate in Europe is, at best, no more than 1.5%, ECB rate hikes much beyond that level would likely invert a Bund curve that is priced for only a 1.75% terminal rate. An inverted Bund curve would also raise the odds that Europe enters a policy-induced recession – turning a bond bearish outcome into a bond bullish one. Even with the relatively aggressive policy expectations priced into European bond yields, it is still too soon to raise European duration exposure with inflation still accelerating. We prefer maintaining a neutral duration stance until there is a clear peak in realized European inflation – an outcome that would also favor a shift into Bund curve steepeners as the markets price out rate hikes and, potentially, begin to discount future rate cuts. Does The ECB Even Have A Plan For Italian Debt? The ECB seems to have a clear near-term plan on the timing, and even the potential size, of rate hikes. There is far less clarity on how it will deal with stabilizing sovereign bond yields post-APP in the countries that benefitted from ECB asset purchases, most notably Italy. By offering no details on a replacement to APP buying of riskier European debt at last week’s policy meeting, markets were given the green light to test the ECB’s resolve by pushing Italian bond yields higher (and the euro lower). Volatility in both markets will continue until there is a credible ECB response to so-called “market fragmentation” in European sovereign debt (i.e. higher yields and wider spreads versus Bunds in the Periphery). With the benchmark 10-year Italian BTP yield pushing above 4%, the ECB tried to calm markets yesterday by announcing an emergency meeting of the Governing Council to discuss “anti-fragmentation” policy options. The announcement triggered a relief rally in BTP prices, likely fueled by short covering. But the ECB statement was again light on concrete details, only noting that: a) reinvestments from maturing bonds from the now-completed Pandemic Emergency Purchase Program (PEPP) could be used “flexibly” to support stressed parts of the European bond market b) the timeline for ECB researchers to prepare proposals for a “new anti-fragmentation instrument” would be accelerated. We expect the ECB to eventually produce a credible bond buying plan to support Peripheral European bond markets – but only after an “iterative” trial-and-error process where trial balloon proposals are floated and skeptical financial markets respond. Chart 14Stay Cautious On Italian Government Bonds
Stay Cautious On Italian Government Bonds
Stay Cautious On Italian Government Bonds
There is almost certainly some serious horse trading going on within the ECB Governing Council, with inflation hawks demanding more rate hikes in exchange for their support of new plans to deal with market fragmentation. Details such as the size of any new program, the conditions under which it would be activated, and country purchase limits (if any) will need to be ironed out. Internal ECB debates will prolong that trial-and-error process with financial markets, keeping yield/spread/FX volatility elevated in the short-term. On a strategic (6-18 month) time horizon, we see a neutral allocation to Italy in global bond portfolios as appropriate, given the tradeoff between increasingly attractive yields and the uncertain timing of effective ECB market stabilization proposals. On a more tactical horizon (0-6 months), we expect Italian yields and spreads versus Germany to remain under upward pressure until a viable anti-fragmentation program is announced (Chart 14). To play for that move, we are introducing a new position in our Tactical Overlay Trade portfolio, selling 10-year Italy futures and buying 10-year German Bund futures. The details of the new trade, including the specific futures contracts and weightings for the two legs of the trade to make it duration-neutral, can be found in the Tactical Trade table on page 18. As we monitor and discuss this trade in future reports, we will refer to the well-followed 10-year Italy-Germany spread (currently 225bps) to determine targets and stop levels of this bond futures spread trade. We are setting a stop-out on this trade if the 10-year Italy-Germany spread has a one-day close below 200bps, while targeting a potential widening to 275-300bps (the 2018 peak in that spread). Bottom Line: The ECB’s lack of conviction on designing a plan to support Peripheral bond markets during the upcoming period of interest rate hikes will keep upward pressure on Peripheral yields/spreads over the next few months. Robert Robis, CFA Chief Fixed Income Strategist rrobis@bcaresearch.com GFIS Model Bond Portfolio Recommended Positioning Active Duration Contribution: GFIS Recommended Portfolio Vs. Custom Performance Benchmark
Volcker's Ghost
Volcker's Ghost
The GFIS Recommended Portfolio Vs. The Custom Benchmark Index Global Fixed Income - Strategic Recommendations*
Volcker's Ghost
Volcker's Ghost
Tactical Overlay Trades
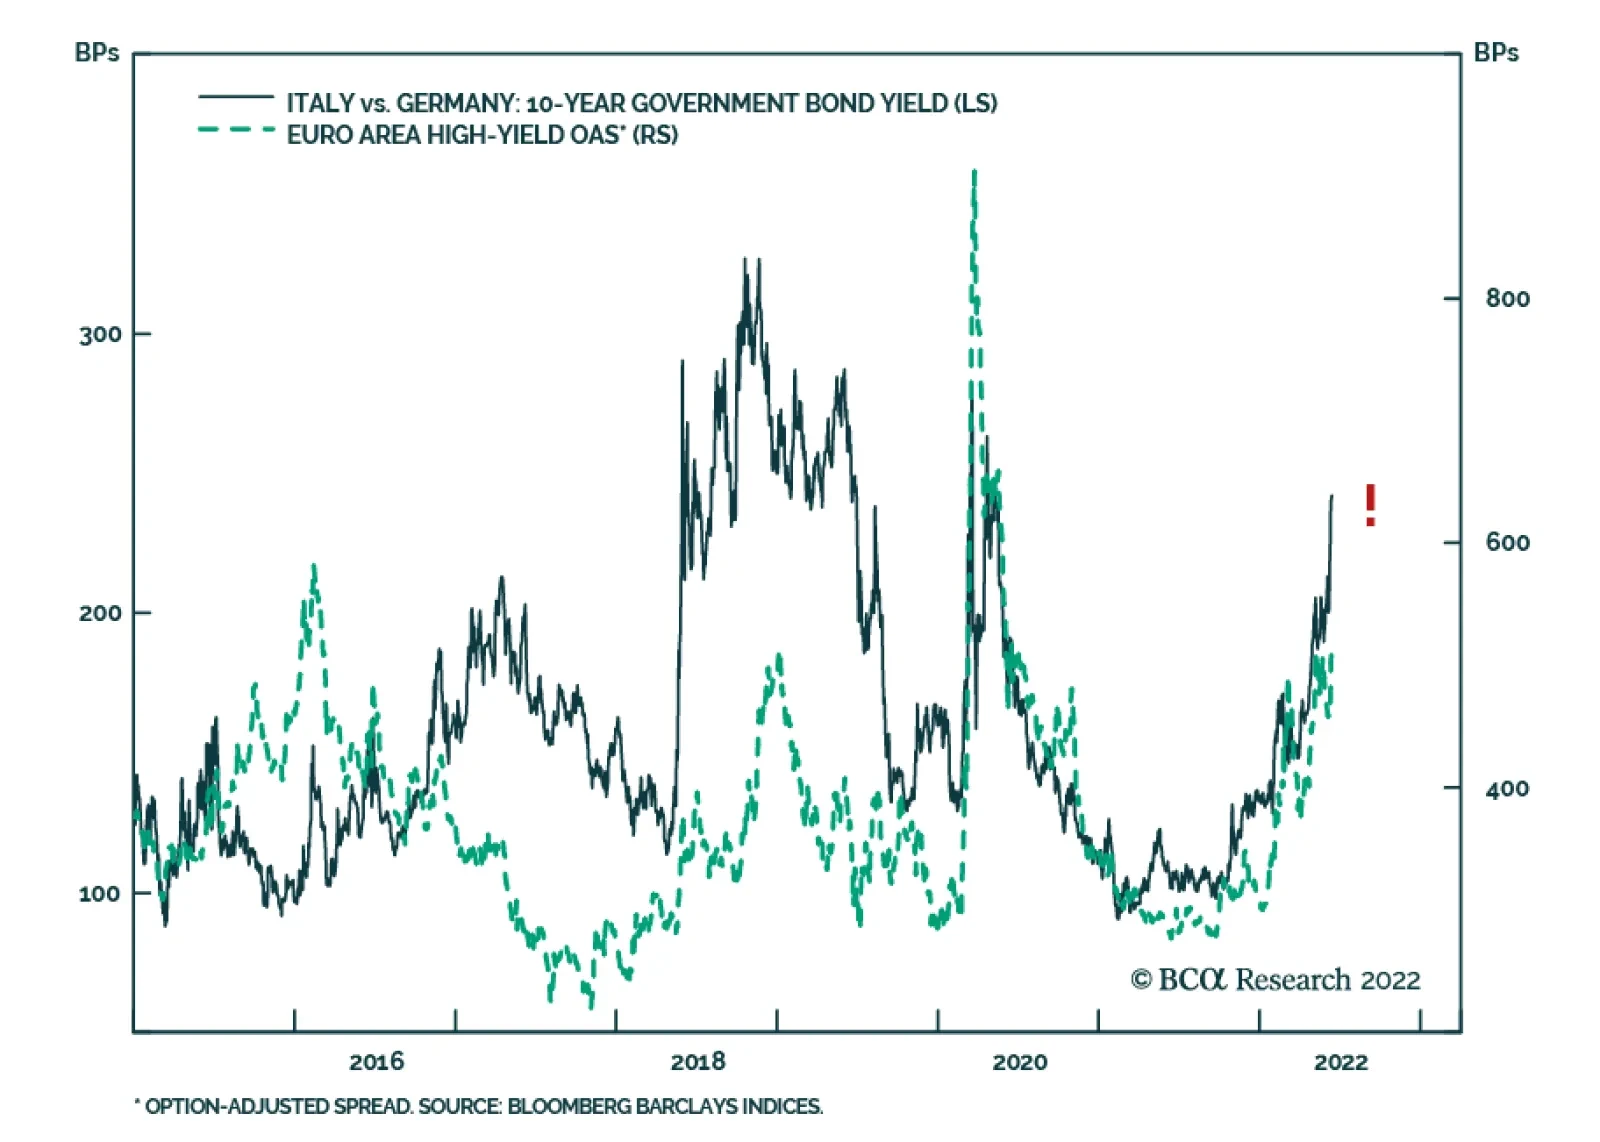
Following an emergency meeting on Wednesday, the ECB pledged to “apply flexibility in reinvesting redemptions coming due in the PEPP portfolio” and “accelerate the completion of the design of a new anti-fragmentation instrument” in order to address the…
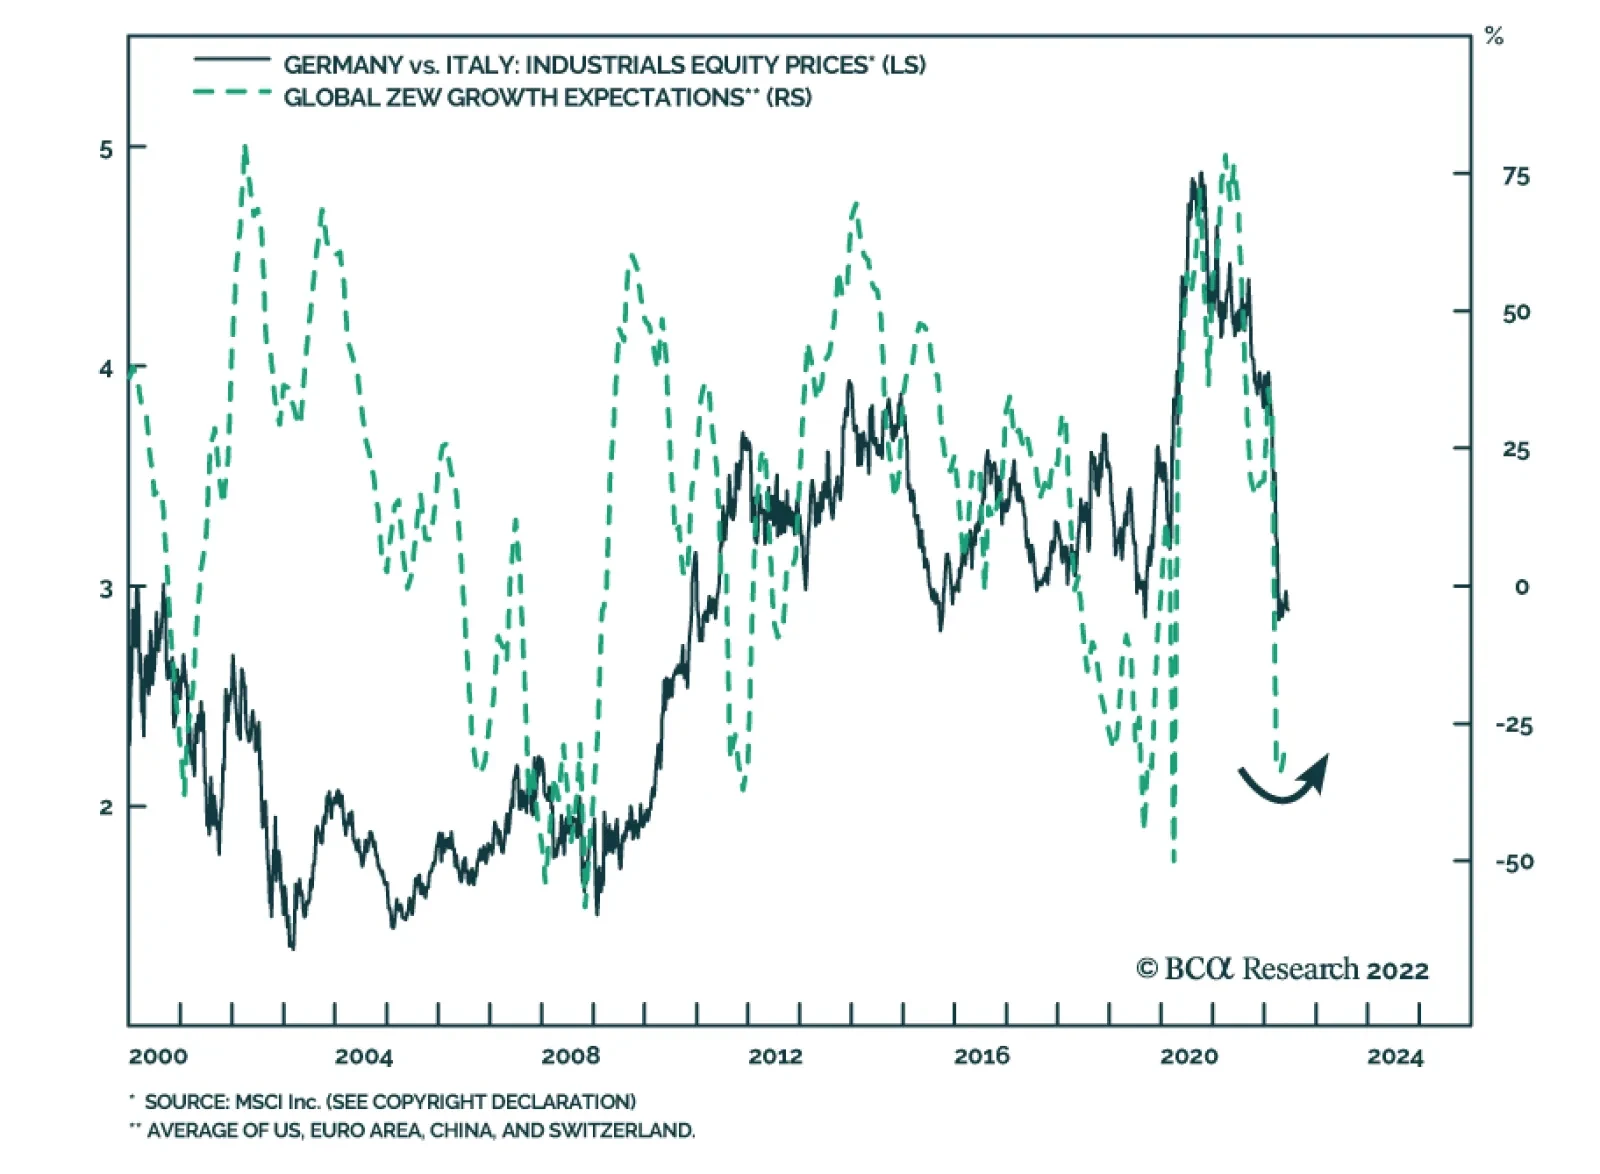
European peripheral bond spreads have continued to widen since the conclusion of last week’s ECB meeting. The Governing Council’s focus on taming inflationary pressures raises risks to the Eurozone economic growth outlook. Moreover, the central bank has not…
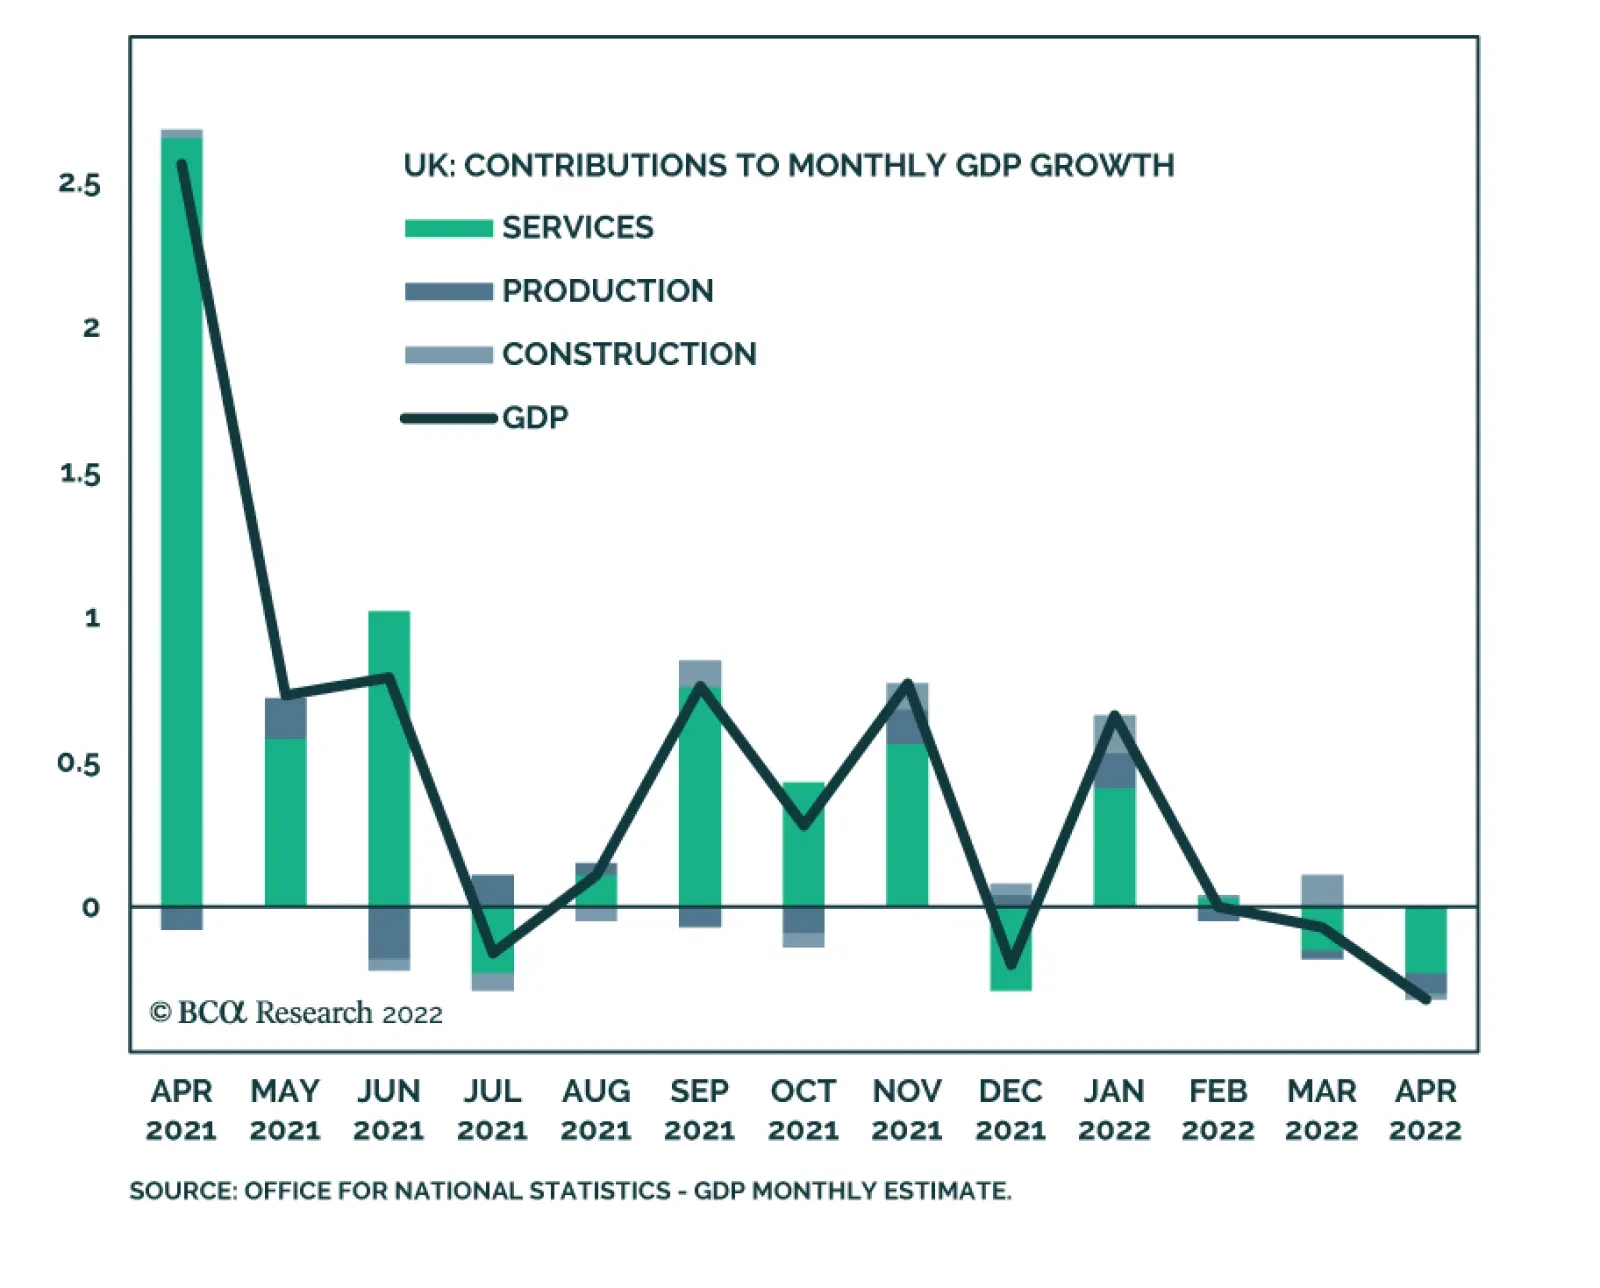
The UK economy unexpectedly contracted in April for the second consecutive month. GDP fell 0.3% m/m following a 1% m/m decline in March, disappointing expectations of a 0.1% m/m increase. Service sector activity was the largest detractor from overall GDP,…
Executive Summary ECB & Inflation: Whatever It Takes?
Pricey Industrials
Pricey Industrials
Inflation is the European Central Bank’s single focus. This single-mindedness heightens the risks to Euro Area growth, especially because wider peripheral spreads do not seem to worry the ECB yet. Italian spreads will widen further, which will contribute to weaker financials, especially in the periphery. The money market curve already prices in the path of the ECB; the upside in Bund yields is therefore capped. Cyclical assets, including stocks, are vulnerable to the confluence of weaker growth and tighter monetary policy. Industrials are fragile. Downgrade to neutral for now. German industrials will outperform Italian industrials. Bottom Line: The ECB will do whatever it takes to slow inflation, which will further hurt an already brittle European economy. This backdrop threatens European stocks and peripheral bonds. Downgrade industrials to neutral and go long German / short Italian industrials. Feature Last week, the European Central Bank’s Governing Council sided with the hawks. The doves have capitulated. This development creates mounting risks this summer for European assets, especially when global growth is slowing. Worryingly, the ECB has given speculators the green light to widen peripheral and credit spreads in the near term. Cyclical assets remain at risk. We are downgrading industrials and financials. Hawkish Chart 1Higher Inflation Forecast = Hawkish ECB
Don’t Fight The ECB
Don’t Fight The ECB
The ECB’s forward guidance proved more hawkish than anticipated by the market, as highlighted by the 16bps increase in the implied rate of the December 22 Euribor contract following the press conference. The ECB also refused to sooth investors’ nerves regarding fragmentation risk in the periphery. A large part of the ECB move was already anticipated. The ECB will lift its three interest rate benchmarks by 25bps at its July meeting. It also increased its headline inflation forecasts to 6.8% from 5.1% in 2022, to 3.5% from 2.1% in 2023, and most importantly, it raised its long-term HICP forecast to 2.1% from 1.9% (Chart 1). The ECB now expects medium-term inflation to be above its 2% target. The true hawkish shock came in response to the higher-than-target medium-term inflation forecast. By September, if the 2024 inflation forecast does not fall back below 2%, then a 50bps hike that month will be inevitable. The whole interest rate curve moved up in response to that guidance. The most concerning part of the statement was the lack of clarity about the fragmentation fighting tool. The ECB specified that it will re-invest the principal of its holdings under the APP and PEPP until 2024, at least. However, the program to prevent stress in peripheral bond markets was not revealed and was presented as an eventuality to be deployed only if market conditions deteriorate further. Investors may therefore assume that the ECB is still comfortable with Italian bond yields above 3.5% and high-yield spreads of 464bps (Chart 2). Ultimately, the ECB’s single-minded focus is inflation, even though it is mostly an imported shock. The ECB cares little for the effect of its actions on growth. It will therefore remain very hawkish until it sees enough evidence that the medium-term inflation outlook will fall back below 2%. Before the ECB can tabulate a decline in the inflation outlook, the following developments must take place: The economy must slow in order to extinguish domestic inflationary pressures. The labor market, to which President Christine Lagarde referred often in the press conference, must cool. Specifically, the very elevated number of vacancies must decline relative to the low number of unemployed persons (Chart 3). A weaker economy will cause this shift. Energy inflation must recede to choke secondary effects on prices. Chart 2Tight But Not Tight Enough For The Hawks
Tight But Not Tight Enough For The Hawks
Tight But Not Tight Enough For The Hawks
Chart 3The Labor Market Must Cool
The Labor Market Must Cool
The Labor Market Must Cool
The good news is that the decline in commodity inflation is already underway. Last week, we argued that if energy prices remain at their current levels, (or if Brent experiences the additional upside anticipated by BCA’s Commodity and Energy strategists), then energy inflation will decelerate significantly. Already, the inflationary impact of commodities is dissipating (Chart 4). European growth has not slowed enough to hurt the labor market, but it will decline further. Real disposable income is falling, and the manufacturing sector is decelerating globally. Moreover, European terms of trade are tumbling, which hurts the Euro Area’s growth outlook, especially compared to the US where the terms of trade are improving (Chart 5). Chart 4Dwindling Commodity Impulse
Dwindling Commodity Impulse
Dwindling Commodity Impulse
Chart 5Europe's Terms-of-Trade Problem
Europe's Terms-of-Trade Problem
Europe's Terms-of-Trade Problem
The European periphery, especially Italy, faces particularly acute problems. We argued two months ago that Italian yields of 4.5% would not cause a sovereign debt crisis if economic activity were strong. As we go to press, Italian yields stand at 3.7%, or higher than those in Canada and Australia. Yet, Italy suffers from poor demographic and productivity trends; its neutral rate of interest is lower than that of both Canada and Australia. Moreover, Canada and Australia today enjoy robust terms-of-trades. Meanwhile, Italy is among the European economies most hurt by surging energy prices. Consequently, a vicious circle of higher yields and lower growth is likely to develop. Chart 6The BTP-EUR/USD Valse
The BTP-EUR/USD Valse
The BTP-EUR/USD Valse
Italy’s economic problems imply that investors will continue to push Italian spreads higher until the ECB provides a clear signal of support for BTPs, which could happen after spreads reach 300bps over German 10-year yields. Italy’s weakness is a major handicap for the monetary union as well. The higher Italian spreads widen, the weaker the euro will be (Chart 6). However, a depreciating euro is inflationary, which invites higher rates for the Euro Area and tighter financial conditions. The great paradox is that, if the ECB were more pro-active about the fragmentation risk, it could fight inflation with less danger to the economy and thus, the Eurozone could achieve higher rates down the road. Weaknesses in global and European growth, risks of higher Italian and peripheral spreads, and an ECB solely focused on inflation will harm European risk assets further. Specifically, credit spreads will widen more and cyclical stocks will remain vulnerable. Within cyclical stocks, Italian and Spanish financials are the most exposed to the fragmentation threat in Euro Area bond markets. We have held an overweight recommendation on industrial equities. We maintain a positive long-term bias toward this sector, but a neutral stance is warranted in the near term. Finally, Bund yields have limited upside from here. The curve already anticipates 146bps of tightening by the end of this year and 241bps by June 2023. The ECB is unlikely to increase rates more than is anticipated, which caps German yields. Instead, the ECB is likely to undershoot the €STR curve pricing if it increases interest rates once a quarter after the September 50bps hike. Bottom Line: Don’t fight the ECB. The Governing Council is single-mindedly focused on fighting inflation. Growth must slow significantly to cool the labor market and allow the ECB to cut back its medium-term inflation forecast to 2%. Therefore, European assets will remain under stress in the coming months as global growth deteriorates. Italian and peripheral spreads are particularly vulnerable, which will also weigh on financials because of Spanish and Italian banks. Chart 7Pricey Industrials
Pricey Industrials
Pricey Industrials
Neutral On Industrials Industrials stocks have outperformed other cyclicals and have moved in line with the Euro Area broad market. However, relative forward EPS have not tracked prices; industrials are now expensive and vulnerable to shocks (Chart 7). The increase in the relative valuations of industrials reflects their robust pricing power. Normally, the economic weakness pinpointed by the Global Growth Expectations component from the ZEW Survey results in falling valuations for industrials, since it is a growth-sensitive sector (Chart 8). However, this year, the earnings multiples of industrials relative to the broad market have followed inflation higher (Chart 8, bottom panel). This paradox reflects the strong pricing power of the industrial sector, which allows these firms to pass on a greater share of their increasing input-costs and protect their profits (Chart 9). Chart 8Ignore Growth, Loving Inflation
Ignore Growth, Loving Inflation
Ignore Growth, Loving Inflation
Chart 9Pricing Power Is The Savior
Pricing Power Is The Savior
Pricing Power Is The Savior
The ability of industrials to weather a growth slowdown is diminishing: European inflation will peak in response to the decline in commodity inflation (see Chart 4, on page 4). Already, the waning inflation of metal prices is consistent with lower relative multiples for industrials (Chart 10) Last week, we argued that global PMIs have greater downside because of the tightening in global financial conditions. Weaker global manufacturing activity hurts the relative performance of industrials. Capex in advanced economies is likely to drop in the coming quarters. US capex intentions are rapidly slowing, which has hurt European industrials. European capex intentions have so far withstood this headwind; however, the outlook is worsening. European final domestic demand is weakening, and European inventories are growing rapidly (Chart 11). Capex is a form of derived demand; the challenges to European growth translate into downside for investment. Chart 10The Commodity Paradox
The Commodity Paradox
The Commodity Paradox
Chart 11The Inventory Buildup Threat
The Inventory Buildup Threat
The Inventory Buildup Threat
The Euro Area Composite Leading Economic Indicator is already contracting and will fall further. The ECB’s focus on inflation and its neglect of financial conditions will drag the LEI lower. Moreover, central banks across the world are also tightening policy, which will filter through to weaken global and Europe LEIs. A declining LEI hurts industrials (Chart 12). The relative performance of European industrials is positively correlated to that of US industrials (Chart 13). BCA’s Global Asset Allocation has recently downgraded industrials to neutral from overweight. Chart 12Weaker LEIs Spell Trouble
Weaker LEIs Spell Trouble
Weaker LEIs Spell Trouble
Chart 13Where the US Goes, So Does Europe
Where the US Goes, So Does Europe
Where the US Goes, So Does Europe
Despite these risks, we are reluctant to go underweight industrials because financials are more exposed to the ECB’s neglect of financial conditions. Moreover, the headwinds against the industrial complex are temporary, especially when it comes to China. Chinese authorities have greatly stimulated their economy, and Beijing is softening its stance on the tech sector. A loosening of the regulatory crackdown would revive animal spirits and credit demand. Moreover, the aerospace and defense industry, which is a large component of the industrial sector, still offers attractive prospects. Instead, we express our concerns for industrials via the following pair trade: Long German industrials / short Italian Industrials. This is a relative value trade. German industrials have underperformed their relative earnings, while Italian ones have moved significantly ahead of their earning power. Thus, German industrials are very cheap and oversold relative to their southern neighbors (Chart 14). Interestingly, this derating took place despite the widening in Italian government bond spreads, which normally explains this price ratio well (Chart 15). This disconnect presents a trading opportunity. Chart 14A Relative Value Trade
A Relative Value Trade
A Relative Value Trade
Chart 15An Unusual Disconnect
An Unusual Disconnect
An Unusual Disconnect
Chart 16German Industrials And Growth Expectations
German Industrials And Growth Expectations
German Industrials And Growth Expectations
While global growth has yet to bottom, the performance of German relative to Italian industrials fluctuates along growth expectations (Chart 16). Germany seats earlier in the global supply chain than Italy. The Global Growth Expectations component from the ZEW Survey is extremely depressed and approaching levels where a rebound would be imminent. German industrials suffer more from the energy crunch than Italian ones. They will therefore benefit more from the decline in energy inflation. Historically, German industrials outperform Italian ones when commodity prices rise, but this relationship normally reflects the strong global demand that often lifts natural resource prices (Chart 17). Today, commodities are skyrocketing because of supply constraints, not strong demand. Therefore, they are hurting rather than mimicking growth. This inversion in the relationship between the performance of German compared to Italian industrials and natural resources prices is particularly evident when looking at European energy prices (Chart 18). Consequently, once the constraint from commodities and global supply chains ebb, German industrials will outshine their Italian counterparts. Chart 17Commodities: From Friends To Foes
Commodities: From Friends To Foes
Commodities: From Friends To Foes
Chart 18Energy: From Friend To Foe
Energy: From Friend To Foe
Energy: From Friend To Foe
German industrials suffer when stagflation fears expand (Chart 19). The ECB’s focus on inflation will assuage the apprehension of entrenched inflation in Europe. The recent improvement in our European Stagflation Sentiment Proxy will continue to the advantage of German industrials. Additionally, a firm ECB stance will push European inflation expectations lower, which will help German industrials compared to their Italian competitors (Chart 20). Chart 19Stagflation Hurts Germany More
Stagflation Hurts Germany More
Stagflation Hurts Germany More
Chart 20The ECB"s Inflation Focus Helps German Industrials
The ECB"s Inflation Focus Helps German Industrials
The ECB"s Inflation Focus Helps German Industrials
German PMIs are improving relative to Italian ones. The trend in Germany’s industrial activity compared to that of Italy dictates the evolution of industrials relative performance between the two countries (Chart 21). The tightening in financial conditions in Italy due to both wider BTP spreads and their negative impact on the Italian banking sector will accentuate the outperformance of Germany’s manufacturing sector. German industrials are more sensitive than Italian ones to the gyrations of the Chinese economy. BCA’s Geopolitical Strategy service anticipates an improvement in China’s economy for the next 18 months or so in response to previous stimuli and the easing regulatory burden. The close link between the performance of German industrials relative to Italian ones and the yuan’s exchange rate indicates that a stabilizing Chinese economy will undo most of the valuation premium of Italian industrials (Chart 22). An improvement in China’s economy will also lift its marginal propensity to consume (which the spread between the growth rate of M1 and M2 approximates). A rebound in Chinese marginal propensity to consume will boost comparative rates of returns in favor of Germany (Chart 22, bottom panel). Chart 21Relative Growth Matters
Relative Growth Matters
Relative Growth Matters
Chart 22The China Factor
The China Factor
The China Factor
Bottom Line: Industrials have become expensive relative to the rest of the market, but they are still too exposed to the global economy’s downside risk. This tug-of-war warrants a downgrade to neutral for now. Going long German industrials / short Italian industrials is an attractive pair trade within the sector. German industrials are cheap and they will benefit from both the ECB’s policy tightening and the upcoming decline in European inflation. Mathieu Savary, Chief European Strategist Mathieu@bcaresearch.com Tactical Recommendations Cyclical Recommendations Structural Recommendations Closed Trades