Financial Markets

Executive Summary Surge In Yields Tanked Equities
Surge In Yields Tanked Equities
Surge In Yields Tanked Equities
In this week’s report, we conduct a post-mortem analysis of the past week’s market panic and probe the effect of the new developments on US equities. Inflation is embedded. US equities won’t find a bottom until inflation turns decisively. The Fed will continue to tighten monetary policy, and rates will rise until inflation rolls over. The Fed “put” is also no longer at play as the Fed has signaled that it cares far more about combating inflation than about the performance of the stock market. Economic growth is decelerating and is already surprising on the downside. Watch rates. With rates stable, the S&P 500 performance will be a function of earnings growth. With rates rising, the multiple will contract and will exacerbate the damage done by the earnings recession. Bottom Line: The S&P 500 is unlikely to find a bottom until inflation turns and monetary conditions stabilize. In addition, economic growth is slowing and an earnings recession is likely. We believe US equities will follow a “fat and down” trajectory in light of the recent developments. We recommend that investors “not be heroes” and keep sector allocation close to the benchmark. Overweight defensives vs. cyclicals. Feature The May CPI reading showed that despite the Fed’s “heroic actions,” inflation has not yet peaked—a data point that has shocked both the market and Fed officials. In an unprecedented move, the Fed, which prides itself on its transparent communication style and its ability to move the market by guiding its expectations, leaked its intention to raise rates by 75 bps to the WSJ despite the communications blackout period. Since last Friday, equity markets around the globe have been in turmoil, with the S&P 500 falling 8%. The NASDAQ is down 7%. Is this just a leg down of the “Fat and Flat” market we have called for with a rebound waiting in the wings, or is there a structural change in the inflationary backdrop and a relentless bear market set to continue? To answer these questions, we will revisit our macroeconomic calls to better understand what expectations need to be adapted to the new reality and what we should expect for US equities over the next three to six months. Sneak Preview: US equities are likely to fall further as monetary conditions continue to tighten and earnings growth is set to contract. We believe that equities will trade in a wide “channel” with multiple rallies and pullbacks, but the general direction is down until inflation turns decisively, and fears of recession dissipate. Why Did Equities Tank? The last few days in the markets were simply brutal. What were investors (and the Fed) panicking about? Here is our hunch: Inflation is not abating, while growth is slowing. Are we in the early innings of stagflation? We believe that stagflation is certainly a high risk. The Fed’s aggressive tightening of monetary conditions is bound to further slow economic growth and taper demand. However, the Fed has no means of controlling the supply side of the equation such as prices of food or energy, which surge because of constrained supply. Will monetary tightening be even more aggressive than expected? Will 75-bps rate rises become the Fed’s new normal? During the press conference, Chairman Powell reassured the market that a 75-bps rate hike is an extraordinary measure. However, both 50-bps and 75-bps rate hikes will be on the table in July. Are the markets on the cusp of a new monetary regime, and is the easy money of the past 12 years a thing of the past? The Fed’s balance sheet has increased from $2 trillion in 2009 to an unprecedented $9 trillion in 2022. This ultra-easy monetary policy has lifted asset values both in private and public markets. The new monetary regime of liquidity being drained from the financial markets to combat inflation is bound to be a major headwind for most asset classes. We believe that it will take a while to bring inflation back to the 2% target, and easy money in the near future is no longer in the cards. It is also unlikely that such a major Fed balance sheet expansion will ever be repeated. The Fed’s tightening via both rising rates and QT will result in a dearth of liquidity in the fixed income space— a credit/counterparty “black swan” may materialize, with MBS most exposed to this risk yet again. Withdrawal of liquidity is a hit to many asset classes, from private markets to unprofitable small-cap growth companies to fixed income markets. This is a serious concern that should be monitored. Incorporating New Data Into Macro And Market Calls We have been writing about these calls for a few months—let’s revisit them here to consider what may have changed recently. Peak Inflation Is Elusive We have never quite bought the argument of transitory inflation. To us, inflation is a product of excessive demand fueled by ultra-easy fiscal and monetary policy and supply chains hobbled by the pandemic. Recently, the situation has been exacerbated by shortages of food and energy. Inflation has spread from pandemic-related goods to “stickier” service items and is broad-based (Chart 1). The wage/price spiral is relentless (Chart 2), as consumer inflation expectations are on the rise, and the job market is on fire. Chart 1Inflation Is Entrenched And Broad-based
Inflation Is Entrenched And Broad-based
Inflation Is Entrenched And Broad-based
While we always believed that it would take inflation a long time to reach the coveted 2% level, we assumed that peak inflation was behind us. Our view that inflation was going to roll over was more down to a base effect rather than the Fed’s actions. In addition, we observed that demand for goods pulled forward by the pandemic had started fading, suppressed by rising prices and negative real wage growth. The Citigroup Inflation Surprise Index had also turned (Chart 3). Chart 2Wage-Price Spiral Is Relentless
Wage-Price Spiral Is Relentless
Wage-Price Spiral Is Relentless
Chart 3Inflation Was Surprising On The Downside
Inflation Was Surprising On The Downside
Inflation Was Surprising On The Downside
It is little consolation that we were in good company when rattled by the May headline inflation reading, which came in at 8.5% year on year, and 1% higher than in April. Headline inflation was certainly affected by the price of food and energy, while core inflation was down to a higher price of shelter and goods (Chart 4). While energy is excluded from core inflation, it permeates all aspects of the economy, increasing costs of raw materials, manufacturing, and transportation, which eventually get passed through to the prices of goods and services. The same is the case with the rising wage bill. Chart 4Inflation Picked Up Because Of Prices Of Shelter And Core Goods
Adaptive Expectations: Revisiting Our Views
Adaptive Expectations: Revisiting Our Views
Importantly, what is next? It would help if US shale producers ramped up production, and the Saudis opened their oil spigots, bringing the price of energy down. Short of that, the price of oil should become a function of a slowing economy and fading demand for goods as interest rates rise (Chart 5). While the Fed has little control over food and energy prices, wage-price dynamics fall squarely in its court. The key channel through which the Fed controls inflation is by cooling the economy and reducing the demand for labor. Rising unemployment is the only way to extinguish inflation in a decisive way. Chart 5Rates Surged
Rates Surged
Rates Surged
Eventually, inflation will turn but it may be in fits and starts, and each data point will have a heavy effect on the pace of monetary tightening and the direction of equity markets, with lower inflation readings igniting rallies and higher readings triggering sell-offs. Inflation is embedded. Of course, sooner or later, it will abate but until then we expect a much more aggressive monetary policy. Monetary Conditions Have Tightened Dramatically As we summarized in our “Market Capitulation Scorecard,” one of the key conditions of an equity market bottom, and potentially, even a sustainable rebound, is stabilization in monetary conditions. We hypothesized that this could happen as the Fed tightens monetary conditions and growth slows and inflation turns, pulling down long rates. We also believed that the market focus is going to start shifting away from concerns about inflation to concerns about economic growth. Friday’s inflation reading has changed that – now investors worry about inflation and growth. Rates have initially skyrocketed, with the 10-year Treasury yield moving by 30bps points over the course of three days from 3.18 to 3.48. Real rates increased from 0.38% to 0.63%. US financial conditions have tightened sharply (Chart 6), moving to the neutral level. What’s next is the most difficult question of this report. It is likely this fast and furious move in rates has accomplished in five days what usually takes weeks. Tighter monetary policy, as it stands now, until more data comes in, is priced in. These moves capture changes in dot-plot expectations revised by the Fed, with the peak rate moving from around 3% to 4%. And, of course, that move got priced into the equity space with the S&P 500 pulling back sharply (Chart 7). Chart 6Financial Conditions Are Moving Into Restrictive Territory
Financial Conditions Are Moving Into Restrictive Territory
Financial Conditions Are Moving Into Restrictive Territory
Chart 7Surge In Yields Tanked Equities
Surge In Yields Tanked Equities
Surge In Yields Tanked Equities
The Fed will continue to tighten monetary policy and rates will rise until inflation rolls over. However, once inflation abates, long rates are likely to stabilize, signaling slower growth ahead. The Fed Won’t Come To The Rescue The Fed “put” is no longer at play as the Fed has signaled that it cares far more about combating inflation than the performance of the stock market. In fact, falling equities will play into Powell’s hand as a negative wealth effect is likely to put a lid on inflationary pressures, with wealthier Americans paying the toll. Kansas City Fed President Esther George, the only member of the FOMC that voted against a 75bps rate hike in the June meeting (she was in favor of 50 bps) said in May: “The Federal Reserve is not targeting equity markets in its battle against inflation, but that is "one of the avenues" where the impact of tighter monetary policy will be felt".1 Further, the Fed is very concerned about a recent pick-up in the long-term consumer inflation expectations (Chart 8) and will likely err on the side of caution to manage these expectations and avoid a self-fulfilling prophecy. Chart 8The Fed Is Worried About Inflation Expectations
The Fed Is Worried About Inflation Expectations
The Fed Is Worried About Inflation Expectations
Economic Growth Is Slowing Fast, Both At Home And Abroad A tighter monetary policy is designed to slow economic growth. The World Bank has downgraded global GDP growth expectations from 4.1% to 2.9%, and import volumes are declining. The Atlanta GDPNow forecast is hovering around zero (Chart 9). The Philly Fed survey has just crossed into negative territory (Chart 10). Retail sales are contracting both in nominal and real terms. According to the Citi Economic Surprise Index, economic growth is surprising on the downside (Chart 11). While the probability of a recession has picked up over the past few weeks, it is earnings growth disappointment that will have an adverse effect on equities in the near term. Chart 9Consensus Expectation Are Still Too High
Consensus Expectation Are Still Too High
Consensus Expectation Are Still Too High
Chart 10Many Signs That Economy Is Slowing Sharply
Many Signs That Economy Is Slowing Sharply
Many Signs That Economy Is Slowing Sharply
Chart 11Economic Growth Disappoints
Economic Growth Disappoints
Economic Growth Disappoints
We maintain our view that economic growth is decelerating and is already surprising on the downside. Earnings Growth Will Contract And Take The Market With It We stated in last week’s “Is An Earnings Recession In The Cards?” report that this year’s sell-off has been triggered by fears of an aggressive Fed, tighter monetary policy, and rising rates. However, the decom- position of the total return demonstrates that the pullback was all about multiple contraction, while strong earnings growth helped absorb the blow. We hypothesized that the multiple contraction phase is complete and that the next leg of the bear market will be all about growth, and earnings growth in particular (Chart 12). Hence if rates stabilize, then multiples will stay at the current level, and returns will be a function of earnings growth. However, the 10-year Treasury rate increasing from 3.18 has resulted in the S&P 500 multiple contracting from 16.7 to 15.6 over the course of just three days, while earnings growth expectations have remained mostly intact. Currently, according to our very simple model (Chart 13), a 3.5% 10-year Treasury yield corresponds to the S&P 500 forward multiple of 16.8x, which is close to where the S&P 500 stands today. If rates rise further, the forward multiple will fall. Chart 12Multiple Contraction Will Be Followed By Earnings Growth Deceleration
Multiple Contraction Will Be Followed By Earnings Growth Deceleration
Multiple Contraction Will Be Followed By Earnings Growth Deceleration
Chart 13Higher Rates Translate Into Lower Equity Multiples
Adaptive Expectations: Revisiting Our Views
Adaptive Expectations: Revisiting Our Views
Our earnings growth model predicts that earnings growth will trend towards zero over the next three months (Chart 14). Chart 14Earnings Growth Will Trend To Zero And Then Contract
Adaptive Expectations: Revisiting Our Views
Adaptive Expectations: Revisiting Our Views
Our scenario analysis matrix shows that if multiples stay stable around 17x forward earnings, while earnings contract by zero to five percent next quarter, the index will be flat to slightly down (Table 1). Broadly speaking, with a stable multiple, the market will move in line with earnings growth. If rates continue to rise and the multiple falls to 16x, going another 11% down is likely. Table 1The S&P 500 Target Scenario Analysis
Adaptive Expectations: Revisiting Our Views
Adaptive Expectations: Revisiting Our Views
Watch rates. With rates stable, the S&P 500 performance will be a function of earnings growth, and the market is likely to be range-bound. With rates rising, a multiple will contract further, and equities will fall. Investment Implications: “Fat And Down” The SPX has discounted plenty of negative news now that it is officially in bear market territory. However, we believe that the S&P 500 is not yet close to the bottom. The market is again pricing in tighter monetary policy and rising rates, which is accompanied by multiple contraction. It is hard to see equities bottoming without inflation peaking. In addition, we are predicting that the next leg of the bear market will be driven by earnings growth, which is likely to contract due to an economic slowdown both at home and abroad. As such, “fat and down” may be a more likely outcome than just “fat and flat.” Bottom Line Equities will move in a wide range over the next three to six months. However, if rates are to rise further and earnings growth is to contract, they may be trading in a downward sloping “channel,” or “fat and down.” We recommend that investors “not be heroes” and keep sector allocation close to the benchmark. Overweight defensives vs. cyclicals. Irene Tunkel Chief Strategist, US Equity Strategy irene.tunkel@bcaresearch.com Footnotes 1 https://www.reuters.com/business/feds-george-policy-not-aimed-equity-markets-though-it-will-be-felt-there-cnbc-2022-05-19/#:~:text=WASHINGTON%2C%20May%2019%20(Reuters),Esther%20George%20said%20on%20Thursday. Recommended Allocation Recommended Allocation: Addendum
Is Earnings Recession In The Cards?
Is Earnings Recession In The Cards?
Executive Summary The Fed has sought to convince one and all of its commitment to overcome high inflation and asset markets have taken heed, tightening financial conditions at a breakneck pace. As we write, the S&P 500 is down 23% year to date, the Bloomberg Barclays Treasury index is down 10%, its sister Corporate and High Yield indexes are down 15% and 12%, respectively, and the dollar had risen by 10% at its peak last week. According to Goldman Sachs’ Financial Conditions Index, the combination has amounted to a 3-percentage-point drag on GDP. Financial markets’ reaction function vis-a-vis monetary policy actions in this tightening cycle has been markedly different than in the previous three tightening cycles. Where tighter financial conditions had previously followed tighter monetary policy with a lengthy lag, they moved ahead of the Fed this time. If the recession is further away than moves in the bond, equity and foreign exchange markets imply, or if inflation eases across the rest of the year in line with our expectations, risk assets are poised to rebound. All Together Now
All Together Now
All Together Now
Bottom Line: The FOMC appears to be on course to induce a recession in its quest to bring inflation to heel. The outlook for financial markets depends on when the recession arrives and how bad it will be, however, and we see scope for positive surprises on both counts. Feature 2022 has not been a good year for financial markets and the action over the last week and a half has made it decidedly worse. In six sessions through Thursday, the S&P 500 nosedived 11%, swooning into bear market territory and unwinding nineteen months of advances. The benchmark 10-year Treasury note’s yield needed just three sessions to back up 45 basis points, from 3.05% to 3.5%. The upheaval has not been unique to the US – inflation and decelerating growth are global phenomena and central banks around the world are scrambling to tighten monetary conditions to rein in rising consumer prices while markets agonize about the effect on growth – but the Fed has been at the center of the storm and last week’s FOMC meeting inspired more swings. This week’s report highlights the most important takeaways from the latest FOMC meeting and how financial markets and Fed policy may interact going forward. There are several factors that are at least slightly different this time. Those differences may keep volatility elevated but they do not condemn stocks and bonds to continued declines. Financial markets have made huge pre-emptive moves that may be subject to reversals as inflation data improve and/or growth holds up better than expected. Prioritizing Price Stability Times have changed. Until inflation began to stir last year, the Fed had been able to prioritize the full employment element of its dual mandate for the entire post-crisis period. Chair Powell made it abundantly clear that price stability is the FOMC’s top priority now, opening his post-meeting remarks with the “overarching message” that it has the means and the will to bring inflation back down to its target level. Living up to this commitment will not be as much fun as trying to prod the economy back to full employment, and it looks as if it will ultimately result in a recession. Following 150 basis points (bps) of hikes so far this year, the target range for the fed funds rate now stands at 1.5-1.75%, and the revised Summary of Economic Projections (SEP) indicated that the median FOMC participant expects another 175 bps of hikes across the year’s remaining four meetings, bringing the funds rate to 3.25-3.5% by year end, at the low end of the money markets’ expectations range (Chart 1). Chart 1Markets And The Fed Are On The Same Page
Markets And The Fed Are On The Same Page
Markets And The Fed Are On The Same Page
During the press conference, Powell repeatedly cited the committee’s concern over rising inflation expectations, calling out the increase in 5-year inflation expectations in the University of Michigan’s preliminary June survey as “quite eye-catching.” The series rose from 30 basis points, to 3.3%, after spending the last four months at 3% and the previous ten in a tight 2.9-3.1% range. The reading was the highest since 2008, when the average national gasoline price first rose above $4 per gallon (Chart 2). Chart 2An "Eye-Catching" Move ...
An "Eye-Catching" Move ...
An "Eye-Catching" Move ...
Threading The Needle FOMC participants’ median projections for real growth, unemployment and inflation at the end of 2022, 2023 and 2024 were benign to pollyannaish, signaling their confidence that the committee will be able to thread the needle, wrestling inflation back to target while maintaining trend growth and capping the unemployment rate at 4.1%. That would meet anyone’s definition of a soft landing, but soft landings have been notoriously elusive. It is fiendishly difficult to fine-tune a complex multi-faceted economy with central bankers’ blunt tools. Empirically, every unemployment rate increase of at least one-third of a percentage point has led to a recession (Chart 3), so even the modest one-half point rise envisioned in the SEP could bring some challenges. A closer examination of past unemployment rate increases suggests a potential way around the dour history, but it depends on reversing the decline in labor force participation that is not yet fully understood. The labor force participation rate – the share of the 16-and-over population that is either working or actively looking for a job – remains more than a percentage point below its pre-pandemic level (Chart 4). If it recovered its early 2020 share, the labor force would expand by 2.8 million people. Chart 3... That Could Put Upward Pressure On The Unemployment Rate
... That Could Put Upward Pressure On The Unemployment Rate
... That Could Put Upward Pressure On The Unemployment Rate
Chart 4The Mystery Of The Missing Workers
The Mystery Of The Missing Workers
The Mystery Of The Missing Workers
If the participation rate were restored to its pre-pandemic level, the fortified labor force would allow for payroll expansion despite the unemployment rate increases envisioned in the latest SEP, as per the population growth and household-to-establishment-survey conversion rate estimates embedded in Table 1. It is reasonable to think that the expansion could continue, or the ensuing recession would be mild, despite a rising unemployment rate if payrolls manage to keep growing. An increasing unemployment rate/increasing payrolls scenario is plausible, but we cannot deem it probable when we do not know what has impeded the participation rate’s recovery. The committee is unlikely to be of one mind on the participation rate question, but it may hold the key to reconciling the sunny projections with the observed difficulty of achieving a soft landing. Table 1A Path To A Soft Landing
One Overarching Message, Multiple Potential Outcomes
One Overarching Message, Multiple Potential Outcomes
We’ll Take The Over We agree with Chair Powell and the FOMC’s assessment that solid consumer balance sheets and robust job gains have the economy on a sound footing, despite slowing growth. We do not see familiar underlying vulnerabilities that herald a reversal like an overreliance on debt, broad supply overhangs or an investment boom that has gone on too long. Inflation is the signal problem in the US and the rest of the world, and we continue to expect that it will recede in the second half as supply constraints in pandemic-squeezed segments ease and the pre-emptive backup in yields holds back some marginal demand for big-ticket items that require financing. No one knows the equilibrium fed funds rate in real time, but Powell indicated the committee thinks it’s around 3.5%, placing the year end 2022 median funds rate dot just shy of equilibrium and the median 2023 dot in modestly restrictive territory. A recession is the likely outcome of the rate hike campaign, but if the target rate doesn’t exceed the equilibrium rate until early next year, it may not begin until the middle of 2023 or early in 2024. Given that the consensus view now appears to be that a recession will begin this year if it hasn’t done so already, and financial markets have gone a long way toward pricing in its effects, we don’t see much upside to joining the bearish chorus now. We’ll take the over on the recession-by-year-end proposition. The Big Difference This Time When asked how high the funds rate has to go to arrest inflation, Powell offered the following description of how rate hikes work. “I … look at it this way: We move the policy rate that affects financial conditions, and that affects the economy. We have [more] rigorous ways to think about it, but ultimately it comes down to, ‘do we think financial conditions are in a place where they’re having the desired effect on the economy?’ And that desired effect is we’d like to see demand moderating.” Related Report US Investment StrategyInflation And Investing Two questions later, he approvingly noted how much bang the committee had already gotten for its buck to this point in the tightening campaign. “[T]his year has been a demonstration of how well [guidance] can work. With us having … done very little in the way of raising interest rates, financial conditions have tightened quite significantly through the expectations channel, as we’ve made clear what our plans are. I think that’s been … very healthy[.]” We stay away from making value judgments about policy, though we can see that a central banker would be in favor of anything that shortens the lag between policy actions and their economic effect. It is immediately obvious, however, that the current rate hike campaign’s real-time impact on financial conditions contrasts sharply with the last three decades’ campaigns (Chart 5). Every one-point change in the Goldman Sachs Financial Conditions Index (FCI) is calibrated to correspond to a one-percentage-point change in real GDP. The FOMC hiked by 175 bps ahead of the 2001 recession and the FCI eventually rose four points, peaking in October 2002, 29 months after the FOMC pushed fed funds to its terminal rate and 21 after it began cutting rates. After the 2004-6 “conundrum” campaign, when financial conditions eased despite 17 consecutive quarter-point rate hikes, the FCI tightened by five points, reaching its peak almost three years after the last hike and 18 months after the first cut. Chart 5Seize The Day
Seize The Day
Seize The Day
Chart 6Decoupling
Decoupling
Decoupling
Some of the response is a simple reflection of the about-face in the inflation backdrop. As our Chief Emerging Markets Strategist Arthur Budaghyan predicted in February 2021, Treasury yields and stock prices have flipped from several decades of positive correlation (rising stock prices offset falling bond valuations and vice versa) in a disinflationary environment to negative correlation in an inflationary environment. Now that Treasury bond, corporate bond and stock prices have been falling together, and the safe-haven dollar has risen amidst the general flight from risk, all of the FCI’s subcomponents have been reinforcing one another, making the index jumpier. More volatile financial conditions raise the probability of overshoots. To wit, has the FCI moved too far, too soon? The volcanic upward move in the 10-year Treasury yield has severed its reliable empirical link with the gold-to-commodity ratio (Chart 6, top panel) and the relative performance of cyclical and defensive equity sectors (Chart 6, bottom panel). They suggest a retracement could be in store. Projected policy rate differentials between the Fed and other currency majors’ central banks are narrowing as monetary policy makers rush to combat inflation. Gloom about growth is widespread. Any positive global growth surprise, from China regarding COVID or stimulus, from the Ukrainian theater, or from supply chain relief, could reel in the extended dollar. Investors should not lose sight of the potential that the coming recession could be mild. A 25% selloff in the S&P 500 may be nearly enough to address that outcome. As of Thursday’s close, the index’s forward four-quarter multiple was down to 15.5 from just under 22 at the start of the year – stocks were expensive, but the nearly 30% de-rating haircut has been severe. The 15.5 multiple assumes the next four quarters’ earnings grow almost 10% year-over-year, which looks ambitious. 5% growth would yield a 16.2 multiple, while no growth would price stocks at 17 times. Those multiples are not cheap, but a lot of froth has come out of the equity market. Against the gloom that has taken over financial markets, we think the next twelve months can be rewarding for investors in risk assets. We are alert to the principal ways our constructive view could be proven wrong and will change our view if it is invalidated by the evidence, but we remain overweight equities in a multi-asset portfolio over the cyclical three-to-twelve-month timeframe. Doug Peta, CFA Chief US Investment Strategist dougp@bcaresearch.com
Executive Summary Structural Tailwinds For The Franc
Structural Tailwinds For The Franc
Structural Tailwinds For The Franc
Volatility in FX markets is likely to remain elevated, as witnessed by the reaction of a full circle of central bank meetings this week.Policy convergence remains a good bet for interest rate curves and currency pairs. The SNB surprised markets by raising interest rates by 50 bps, to -0.25%, the first hike since 2007.Higher volatility will continue to buoy the Swiss franc in the short run.Structural appreciation in the franc is also likely over the coming decades (Feature Chart). Swiss stocks often perform well during economic downturns, but they are not particularly cheap, and are vulnerable to higher interest rates. Investors should only overweight Swiss stocks if they expect more significant downside to global stocks.Valuation favors the franc versus the dollar. However, EUR/CHF and GBP/CHF are closer to fair value. CHF/JPY is expensive; hence, the yen is a better hedge for downside economic surprises. Go short CHF/JPY as a trade.BCA’s Foreign Exchange Strategy was short CHF/SEK at 10.2 with stop loss at 10.5. That stop was hit overnight, triggering a loss of -3.3%. Stand aside for now.Bottom Line: Favor the franc over the short term against other pro-cyclical currencies, with a view to downgrade CHF when it becomes evident that economic growth is bottoming. Any further bout of Swiss equity outperformance, prompted by global risk aversion, offers an attractive selling opportunity versus Eurozone stocks.Feature Chart 1The SNB Has Capitulated To Rising Inflation
The SNB Has Capitulated To Rising Inflation
The SNB Has Capitulated To Rising Inflation
Volatility in FX markets is likely to remain elevated. This week, the Fed delivered its first 75 bps interest rate hike since 1994. It also increased its expected year-end level for the Fed Funds rate to 3.4% from 1.9%, and to 3.8% from 3.4% at the end of 2023. The FX market had been warming up to a hawkish surprise, but the dollar surged on the news, hitting a fresh two-decade high of 105.5, before later reversing gains.Meanwhile, the European Central Bank (ECB) held an emergency meeting on Wednesday, to try to mitigate the rise in Italian yields, which hit as high as 4.2% on Tuesday, or 243 bps over German 10-year yields. The subsequent statement released by the Governing Council offered no concrete details. Yes, the reinvestments of the proceeds from maturing debt in the Pandemic Emergency Purchase Program (PEPP) will flow mostly to peripheral markets, but investors want clarity on the nature of the long-awaited policy plan to tackle fragmentation risk in the Euro Area. As a result, peripheral bond markets will remain fragile until a bold program comes to fruition.To cement currency volatility this week, SNB Governor Thomas Jordan surprised markets by raising interest rates by 50 bps in Switzerland, to -0.25%, the first hike since the Global Financial Crisis (Chart 1). The negative interest rate threshold for sight deposits was also lowered, a move encouraging banks to pack reserves at the SNB. The Bank of England also raised interest rates in line with market expectations. The move initially disappointed GBP bulls, but sterling is holding above our 1.20 floor.An environment of monetary policy uncertainty, rising recession risks in response to high inflation, and the potential for central bank policy mistakes bodes well for safe-haven assets. In Europe, the market with the strongest defensive profile is Switzerland. In this report, we address whether investors should bet on continued appreciation of the franc and an outperformance of Swiss stocks, especially now that the SNB has turned hawkish.Switzerland Versus The WorldGlobal economic growth is slowing and a small/open economy like Switzerland’s has not been spared. The KOF economic barometer, a key leading indicator for Swiss GDP growth, has collapsed over the past twelve months from 144 to 97 as global industrial activity decelerated (Chart 2). Despite softening growth, global inflation refuses to decline, forcing central banks worldwide to lean into the slowdown. This threatens to cut the post-pandemic business cycle expansion short. Chart 2The SNB Is Tightening Into A Slowing Economy
The SNB Is Tightening Into A Slowing Economy
The SNB Is Tightening Into A Slowing Economy
Surprisingly, the Swiss economy is generally performing better than the rest of Europe. Historically, Swiss economic performance is procyclical due to the large share of exports within its GDP. Hence, a slowdown in global manufacturing often creates a large threat to Swiss growth. Going forward, can the Swiss economy diverge from that of the rest of the world (Chart 3)? Such a divergence is not probable, but a few factors will protect the Swiss economy:Switzerland still has one of the lowest policy rates in the G10, even after today’s 50bps interest rate increase. This has tremendously helped ease monetary conditions. Our monetary gauge is at its most accommodative level in over two decades (Chart 4). Chart 3The Swiss Economy Is Procyclical
The Swiss Economy Is Procyclical
The Swiss Economy Is Procyclical
Chart 4Swiss Monetary Conditions Are Still Accommodative
Swiss Monetary Conditions Are Still Accommodative
Swiss Monetary Conditions Are Still Accommodative
Swiss inflation remains the lowest in the G10 outside Japan. In Switzerland, the main driver of price increases has been goods, while services inflation remains subdued. Consequently, the SNB has been tolerating an appreciating franc to temper imported inflation (Chart 5), while keeping domestic borrowing costs at very accommodative levels. In its updated forecasts, the SNB now expects a -0.25% interest rate to allow Swiss inflation to moderate to 1.9% in 2023 and 1.6% in 2024. Chart 5Swiss Inflation Is Surprising To The Upside
Swiss Inflation Is Surprising To The Upside
Swiss Inflation Is Surprising To The Upside
Part of the reason Switzerland has low inflation has been the tremendous productivity gains, especially relative to its trading partners (Chart 6). Swiss income-per-capita is elevated, but wage growth has lagged output gains, which limits the risk of a wage-inflation spiral. It is notable that part-time employment continues to dominate job gains, implying that the need for precautionary savings will remain high in Switzerland. Chart 6A Productivity Profile For Switzerland
A Productivity Profile For Switzerland
A Productivity Profile For Switzerland
Higher productivity growth and the elevated national savings leave their footprint on the trade data. The Swiss trade balance is hitting fresh highs, unlike Europe or Japan (Chart 7). This could potentially create a problem for the Swiss economy as it puts upward pressure on the CHF at a time when global manufacturing output is slowing. However, Switzerland specializes in high value-added exports with an elevated degree of complexity, that stand early in global supply chains. These type of goods are likely to remain in high demand in a global environment marked by supply-chain bottlenecks and high-capacity utilization. Chart 7Structural Tailwinds For The Franc
Structural Tailwinds For The Franc
Structural Tailwinds For The Franc
Finally, Switzerland does not import energy to fulfill its electricity production. Hydropower accounts for roughly 61.4% of electricity generation, followed by nuclear power at 28.5%. This has partially insulated Switzerland from the energy shock hurting economic activity and trade balances in the EU. For example, German electricity generation is 28.8% coal and 14.7% natural gas.Bottom Line: The Swiss economy is reopening and is relatively insulated from the Russia-Ukraine conflict. This limits to some degree how closely Switzerland will track the global and European economic slowdown. It creates a departure from the traditional pro-cyclicality of the Swiss economy.The SNB, The SARON Curve, And The Swiss FrancIf the Swiss economy surprises to the upside, the case for the SNB to tolerate a rising franc becomes even stronger. The pace of foreign exchange reserve accumulation is already decelerating (Chart 8). Governor Thomas Jordan has been very clear: as global prices rise, the fair value of the franc is also rising, which implies a willingness to tolerate currency strength. In a purchasing power parity framework, higher external inflation makes Swiss goods relatively cheaper. This allows foreigners to bid up the currency.Even with today’s updated pricing, the SNB is still expected to remain among the most dovish central banks in the G10 (Chart 9). If inflationary pressures prove sticky, the SNB will step up its hawkish rhetoric. If inflationary fears subside, then global rates will fall as well, which has usually been a boon for the franc. More specifically, this would be negative for the EUR/CHF cross (Chart 10). Chart 8Less Intervention By The SNB
Less Intervention By The SNB
Less Intervention By The SNB
Chart 9The SARON Curve Has Adjusted Higher
The SARON Curve Has Adjusted Higher
The SARON Curve Has Adjusted Higher
Chart 10EUR/CHF And Bund Yields Can Continue To Diverge
EUR/CHF And Bund Yields Can Continue To Diverge
EUR/CHF And Bund Yields Can Continue To Diverge
The Swiss economy can tolerate an appreciating CHF, but can it withstand higher interest rates? We believe so. Switzerland is a net creditor nation, but its domestic non-financial debt is also extremely elevated. Thus, the Swiss economy is vulnerable to higher rates, especially the housing market (Chart 11). Nonetheless, internal adjustments will soften the blow and increase affordability. Of note, property speculation in Switzerland has decreased in response to macroprudential measures. Growth in rental housing prices, which usually constitute the bulk of investment homes, has collapsed, but the price of owner-occupied homes has proven more robust (Chart 12). A cap on the percentage of secondary homes in any Canton as well as tighter lending standards have also helped. In a renewed update to its Financial Stability Report, Fritz Zurbrügg, Vice Chairman of the Governing Board, suggests that Swiss banks are well capitalized, especially given the recent reactivation of the countercyclical capital buffer. Chart 11Higher Rates Are A Risk For Swiss Real Estate
Higher Rates Are A Risk For Swiss Real Estate
Higher Rates Are A Risk For Swiss Real Estate
Chart 12Some Adjustment Already In Investment Home Prices
Some Adjustment Already In Investment Home Prices
Some Adjustment Already In Investment Home Prices
In the very near term, demographics might also be a tailwind. The pandemic limited immigration to Switzerland, but the working-age population is rebounding anew (Chart 13), which will create a cushion under housing and support domestic demand. Chart 13A Small Demographic Tailwind For Home Prices
A Small Demographic Tailwind For Home Prices
A Small Demographic Tailwind For Home Prices
Stronger aggregate demand in an inflationary world will justify the need for less monetary accommodation. In a nutshell, the SNB is likely to continue walking the path of “least regrets” like most central banks, by tightening monetary policy to meet its 2% inflation mandate, but pausing if economic conditions warrant.The currency has historically been used as a key tool for calibrating financial conditions. From a fundamental perspective, our PPP models suggest the franc is quite cheap versus the dollar but at fair value versus the euro and sterling. This is echoed by Governor Jordan, who no longer views the franc as expensive. Our models adjusts the consumption basket in Switzerland for an apples-to-apples comparison across both the UK and the eurozone (Chart 14). Chart 14AA CHF Is At Fair Value Versus The EUR And GBP
A CHF Is At Fair Value Versus The EUR And GBP
A CHF Is At Fair Value Versus The EUR And GBP
Chart 14BA CHF Is At Fair Value Versus The EUR And GBP
A CHF Is At Fair Value Versus The EUR And GBP
A CHF Is At Fair Value Versus The EUR And GBP
Finally, hedging costs for shorting the franc against the dollar have risen substantially (Chart 15). As such, any short bets on the franc are likely being placed naked. If the Fed ends up tempering its pace of rate hikes next year in response to weaker US activity, short-covering activity is likely to accentuate any pre-existing strength in the CHF. Chart 15Hedging Costs For USD/CHF Carry Trades Have Risen Hedging Costs Are Prohibitive
Hedging Costs For USD/CHF Carry Trades Have Risen Hedging Costs Are Prohibitive
Hedging Costs For USD/CHF Carry Trades Have Risen Hedging Costs Are Prohibitive
Bottom Line: The franc is undervalued against the dollar, and a good hedge against a rise in volatility versus other procyclical currencies. This places the franc in a good “heads I win, tails I don’t loose too much” bet. Swiss interest rates are also likely to climb higher. However, because the franc will do the bulk of the monetary tightening, the SNB is likely to lag the expectations now embedded in the SARON curve.What About Swiss Equities?Despite the cyclical nature of the Swiss economy, Swiss equities are extremely defensive. Swiss stocks have little to do with the domestic economy and are mostly a collection of large multinationals, dominated by the healthcare and consumer staples sectors, which together account for roughly 60% of the Swiss MSCI benchmark.This defensive attribute has created its own problem for Swiss equities. Relative to the Eurozone, the Swiss market has moved massively ahead of profitability, and it is now more expensive than at the apex of the European debt crisis in 2012 (Chart 16). Moreover, the jump in German yields is becoming increasingly problematic for Swiss stocks that historically perform poorly when global interest rates are rising (Chart 17). Chart 16Swiss Stocks Are Expensive
Swiss Stocks Are Expensive
Swiss Stocks Are Expensive
Chart 17A Lost Tailwind
A Lost Tailwind
A Lost Tailwind
In the near term, Swiss equities will only be able to defy the gravitational pull created by demanding valuations and higher yields if global risk aversion remains elevated. However, once global stocks find a floor and Italian spreads begin to narrow, Swiss stocks are likely to underperform massively (Chart 18). It could take a few more weeks before the BTP/Bund spreads narrow as the recent ECB announcement was rather tepid. However, the ECB holding an emergency meeting and issuing a formal statement addressing the problem facing peripheral bond markets suggests that a formal program designed to manage fragmentation risk will emerge before the end of the summer.Beyond their defensive attributes, Swiss stocks also correlate to the Quality Factor. The robust performance of this factor since the turn of the millennium, in Europe and globally, has allowed the Swiss market to greatly outperform Eurozone equities (Chart 19). However, the Quality Factor has begun to underperform, which indicates that the Swiss market is losing another of its underpinnings. Chart 18Near-term, Follow Risk Aversion
Near-term, Follow Risk Aversion
Near-term, Follow Risk Aversion
Chart 19Swiss Stocks Are About Quality
Swiss Stocks Are About Quality
Swiss Stocks Are About Quality
These observations imply that over the next 12 to 18 months, Swiss equities will underperform their Euro Area counterparts. Materials and consumer staples stand out as the two sectors with the most extended valuations relative to their Euro Area competitors, especially since their relative performances have become dissociated from relative profits (Chart 20). They should carry maximum underweights relative to their European counterparts. The healthcare sector is Switzerland’s largest market weight. It is not as expensive relative to the Eurozone as the materials and consumer staples sectors, but it carries enough of a premium that investors should still underweight this sector relative to its eurozone competitor (Chart 21). Chart 20Dangerous Setup For Swiss Materials and Staples
Dangerous Setup For Swiss Materials and Staples
Dangerous Setup For Swiss Materials and Staples
Chart 21The Swiss Heavyweight Is Becoming Pricey
The Swiss Heavyweight Is Becoming Pricey
The Swiss Heavyweight Is Becoming Pricey
Bottom Line: The defensive nature of the Swiss market has allowed for a large outperformance over European equities. However, the Swiss market is now very expensive on a relative basis, and it is vulnerable to higher interest rates. While global risk aversion can still buoy the Swiss market in the near term, conditions are falling into place for Swiss stocks to underperform their Eurozone counterpart over a 12-to-18 month window. Materials and consumer staples are the sectors mostly likely to experience a large underperformance relative to their Euro Area competitors, followed by the healthcare sector. Investment ConclusionsVolatility in FX markets is likely to remain elevated, as witnessed by the reaction of a full circle of central bank meetings this week.Policy convergence remains a good bet for interest rate curves and currency pairs. The SNB surprised markets by raising interest rates by 50 bps, to -0.25%, the first hike since 2007 (Chart 1).Higher volatility will continue to buoy the Swiss franc in the short run.Structural appreciation in the franc is also likely over the coming decades.Swiss stocks often perform well during economic downturns, but they are not particularly cheap, and vulnerable to higher interest rates. Investors should only overweight Swiss stocks if they expect more significant downside to global stocks.Valuation favors the franc versus the dollar. However, EUR/CHF and GBP/CHF are closer to fair value. CHF/JPY is expensive; hence the yen is a better hedge for downside economic surprises. Go short CHF/JPY as a trade.BCA’s Foreign Exchange Strategy was short CHF/SEK at 10.2 with stop loss at 10.5. That stop was hit overnight, triggering a loss of -3.3%. Stand aside for now. Chester NtoniforForeign Exchange Strategistchestern@bcaresearch.comMathieu Savary Chief European StrategistMathieu@bcaresearch.com
Listen to a short summary of this report. Executive Summary Higher Real Yields Have Weighed On Equity Valuations
Higher Real Yields Have Weighed On Equity Valuations
Higher Real Yields Have Weighed On Equity Valuations
I had the pleasure of visiting clients in Saudi Arabia, Bahrain, and Abu Dhabi last week. In contrast to the rest of the world, the mood in the Middle East was very positive. While high oil prices are helping, there is also a lot of optimism about ongoing structural reforms. Petrodollar flows are increasingly being steered towards private and public equities. EM assets stand to benefit the most. Producers in the region are trying to offset lost Russian output, but realistically, they will not be able to completely fill the gap in the near term. Today’s high energy prices have largely baked in this reality, as reflected in strongly backwardated futures curves. There was no consensus about how high oil prices would need to rise to trigger a global recession, although the number $150 per barrel got bandied about a lot. Given that most Middle Eastern currencies are pegged to the dollar, there was a heavy focus on Fed policy. Market estimates of the neutral rate in the US have increased rapidly towards our highly out-of-consensus view. Nevertheless, we continue to see modest upside for bond yields over a multi-year horizon. Over a shorter-term 6-to-12-month horizon, the direction of bond yields will be guided by the evolution of inflation. While US CPI inflation rose much more than expected in May, the details of the report were somewhat less worrying, as they continue to show significant supply-side distortions. Bottom Line: Inflation should come down during the remainder of the year, allowing the Fed to breathe a sigh of relief and stocks to recover some of their losses. A further spike in oil prices is a major risk to this view. Dear Client, Instead of our regular report next week, we will be sending you a Special Report written by Chester Ntonifor, BCA Research’s Chief Foreign Exchange Strategist, discussing the outlook for gold. We will be back the following week with the GIS Quarterly Strategy Outlook, where we will explore the major trends that are set to drive financial markets in the rest of 2022 and beyond. As always, I will hold a webcast discussing the outlook the following week, on Thursday, July 7th. Best regards, Peter Berezin Chief Global Strategist Peter in Arabia I had the pleasure of visiting clients in Saudi Arabia, Bahrain, and Abu Dhabi last week. This note summarizes my impressions and provides some commentary about recent market turmoil. The Mood in the Region is Very Positive In contrast to the rest of the world, the mood in the Middle East was upbeat. Obviously, high oil prices are a major contributor (Chart 1). Across the region, stock markets are still up for the year (Chart 2). Chart 1Oil Prices Have Shot Up
Oil Prices Have Shot Up
Oil Prices Have Shot Up
Chart 2Middle Eastern Stock Markets Are Doing Relatively Well This Year
Middle Eastern Stock Markets Are Doing Relatively Well This Year
Middle Eastern Stock Markets Are Doing Relatively Well This Year
That said, I also felt that investors were encouraged by ongoing structural reforms, especially in Saudi Arabia where the Vision 2030 program is being rolled out. The program seeks to diversify the Saudi economy away from its historic reliance on petroleum exports. A number of people I spoke with cited the Saudi sovereign wealth fund’s acquisition of a majority stake in Lucid, a California-based EV startup, as the sort of bold move that would have been unthinkable a few years ago. I first visited Riyadh in May 2011 where I controversially delivered a speech entitled “The Coming Commodity Bust” (oil was $120/bbl then and copper prices were near an all-time high). The city has changed immensely since then. The number of restaurants and entertainment venues has increased exponentially. The ban on women drivers was lifted only four years ago. In that short time, it has become a common-day occurrence. Capital Flows Into and Out of the Region are Reflecting a New Geopolitical Reality In addition to high oil prices and structural reforms, geopolitical considerations are propelling significant capital inflows into the region. The freezing of Russia’s foreign exchange reserves sent a shockwave across much of the world, with a number of other EM countries wondering if “they are next.” Ironically, the Middle East has emerged as a neutral player of sorts in this multipolar world, and hence a safer destination for capital flows. On the flipside, the region’s oil exporters appear to be acting more strategically in how they allocate their petrodollar earnings. Rather than simply parking the proceeds of oil sales in overseas US dollar bank accounts, they are investing them in ways that further their economic and political goals. One clear trend is that equity allocations to both overseas public and private markets are rising. Other emerging markets stand to benefit the most from this development, especially EMs who have assets that Middle Eastern countries deem important – assets tied to food security being a prime example. Assuming that the current level of oil prices is maintained, we estimate that non-US oil exports will rise to $2.5 trillion in 2022, up from $1.5 trillion in 2021 (Chart 3). About 40% of this windfall will flow to the Middle East. That is a big slug of cash, enough to influence the direction of equity markets. Chart 3Oil Exporters Reaping The Benefits Of High Oil Prices
An Oasis Of Optimism: Notes From The Middle East
An Oasis Of Optimism: Notes From The Middle East
Middle Eastern Energy Producers Will Boost Output, But Don’t Expect Any Miracles in the Short Term Russian oil production will likely fall by about 2 million bpd relative to pre-war levels over the next 12 months. To help offset the impact, OPEC has already raised production by 200,000 barrels and will almost certainly bump it up again following President Biden’s visit to the region in July (Chart 4). The decision to raise production to stave off a super spike in oil prices is not entirely altruistic. The region’s oil exporters know that excessively high oil prices could tip the global economy into recession, an outcome that would surely lead to much lower oil prices down the road. There was not much clarity on what that tipping point is, but the number $150 per barrel got bandied around a lot. Politics is also a factor. A further rise in oil prices could compel the US to make a deal with Iran, something the Saudis do not want to see happen. Still, there is a practical limit to how much more oil the Saudis and other Middle Eastern producers can bring to market in the near term. Today’s high energy prices have largely baked in this reality, as reflected in strongly backwardated futures curves (Chart 5). Chart 4Output Trends In The Major Oil Producers
Output Trends In The Major Oil Producers
Output Trends In The Major Oil Producers
Chart 5Energy Prices On Both Sides Of The Atlantic
An Oasis Of Optimism: Notes From The Middle East
An Oasis Of Optimism: Notes From The Middle East
Data on Saudi’s excess capacity is notoriously opaque, but I got the feeling that an extra 1-to-1.5 million bpd was the most that the Kingdom could deliver. The same constraints apply to natural gas. Qatar is investing nearly $30 billion to expand its giant North Field, which should allow gas production to rise by as much as 60%. However, it will take four years to complete the project. The share of Qatari liquefied natural gas (LNG) going to Europe has actually declined this year. About 80% of Qatar’s LNG is sold to Asian buyers under long-term contracts that cannot be easily adjusted. And even if those contracts could be rewritten, this would only bring limited benefits to Europe. For example, Germany has no terminals to accept LNG imports, although it is planning to build two. While there was plenty of sympathy to Europe’s plight in the region, there was also a sense that European governments had been cruising for a bruising by doubling down on strident anti-fossil fuel rhetoric over the past decade without doing much to end their dependence on Russian oil and gas. In that context, few in the region seemed willing to bend over backwards to help Europe. In the meantime, the US remains Europe’s best hope. US LNG shipments to Europe have tripled since last year. The US is now sending nearly three quarters of its liquefied gas to Europe. This has pushed up US natural gas prices, although they still remain a fraction of what they are in Europe. Huge Focus on the Fed Chart 6Most Of The Increase In Bond Yields Has Been In The Real Component
Most Of The Increase In Bond Yields Has Been In The Real Component
Most Of The Increase In Bond Yields Has Been In The Real Component
Most Middle Eastern currencies are pegged to the dollar, and hence the region effectively imports its monetary policy from the US. Not surprisingly, clients were very focused on the Federal Reserve. Many expressed concern about the abrupt pace of rate hikes. One of our high-conviction views is that the neutral rate of interest in the US has risen as the household deleveraging cycle has ended, fiscal policy has become structurally looser, and a growing number of baby boomers have transitioned from working (and saving) to retirement (and dissaving). The markets have rapidly priced in this view over the course of 2022. The 5-year/5-year forward Treasury yield – a proxy for the neutral rate – has increased from 1.90% at the start of the year to 3.21% at present. Most of this increase in the market’s estimate of the neutral rate has occurred in the real component. The 5-year/5-year forward TIPS yield has climbed from -0.49% to 0.84%; in contrast, the implied TIPS breakeven inflation rate has risen from only 2.24% to 2.37% (Chart 6). Implications of Higher Bond Yields on Equity Prices and the Economy Chart 7Higher Real Yields Have Weighed On Equity Valuations
Higher Real Yields Have Weighed On Equity Valuations
Higher Real Yields Have Weighed On Equity Valuations
As both theory and practice suggest, there is a strong negative correlation between real bond yields and equity valuations. Chart 7 shows that the S&P 500 forward P/E ratio has been moving broadly in line with the 5-year/5-year forward TIPS yield. The bad news is that there is still scope for bond yields to rise over the long haul. Our fair value estimate of 3.5%-to-4% for the neutral rate is about 25-to-75 basis points above current pricing. The good news is that a high neutral rate helps insulate the economy from a near-term recession. Recessions typically occur only when monetary policy turns restrictive. A few clients cited the negative Q1 GDP reading and the near-zero Q2 growth estimate in the Atlanta Fed GDPNow model as evidence that a US recession is either close at hand or has already begun (Chart 8). Chart 8Underlying US Growth Is Expected To Be Solid In Q2
An Oasis Of Optimism: Notes From The Middle East
An Oasis Of Optimism: Notes From The Middle East
We would push back against such an interpretation. In contrast to the -1.5% real GDP print, real Gross Domestic Income (GDI) rose by 2.1% in Q1. Conceptually, GDP and GDI should be equal, but since the two numbers are compiled in different ways, there can often be major statistical discrepancies. A simple average of the two suggests the US economy still grew in the first quarter. More importantly, real final sales to private domestic purchasers rose by 3.9% in Q1. This measure of economic activity – which strips out the often-noisy contributions from inventories, government expenditures, and net exports – is the best predictor of future GDP growth of any item in the national accounts (Table 1). Table 1A Good Sign: Real Final Sales To Private Domestic Purchasers Rose By 3.9% In Q1
An Oasis Of Optimism: Notes From The Middle East
An Oasis Of Optimism: Notes From The Middle East
As far as Q2 is concerned, real final sales to private domestic purchasers are tracking at 2.0% according to the Atlanta Fed model – a clear deceleration from earlier this year, but still consistent with a generally healthy economy. Growth will probably slow in the third quarter, reflecting the impact of higher gasoline prices, rising interest rates, and lower asset prices. Nevertheless, the fundamental underpinnings for the economy – low household debt, $2.2 trillion in excess savings, a dire need to boost corporate capex and homebuilding, and a strong labor market – remain in place. The odds of a recession in the next 12 months are quite low. Gauging Near-Term Inflation Dynamics A higher-than-expected neutral rate of interest implies that bond yields will probably rise from current levels over the long run. Over a shorter-term 6-to-12-month horizon, however, the direction of yields will be guided by the evolution of inflation. While the core CPI surprised on the upside in May, the details of the report were somewhat less worrying, as they continue to show significant supply-side distortions. Excluding vehicles, core goods prices rose 0.3% in May, down from a Q1 average of 0.7% (Chart 9). Recent commentary from companies such as Target suggest that goods inflation will ease further. Chart 9Goods Inflation Is Moderating, While Service Price Growth Is Elevated
An Oasis Of Optimism: Notes From The Middle East
An Oasis Of Optimism: Notes From The Middle East
Stripping out energy-related services, services inflation slowed slightly to 0.6% in May from 0.7% in April. A deceleration in wage growth should help keep a lid on services inflation over the coming months (Chart 10). Chart 10A Deceleration In Wage Growth Should Help Keep Services Inflation Contained
An Oasis Of Optimism: Notes From The Middle East
An Oasis Of Optimism: Notes From The Middle East
During his press conference, Fed Chair Powell described the rise in inflation expectations in the University of Michigan survey as “quite eye-catching.” Although long-term inflation expectations remain a fraction of what they were in the early 1980s, they did rise to the highest level in 14 years in June (Chart 11). Powell also noted that the Fed’s Index of Common Inflation Expectations has been edging higher. The Fed’s focus on ensuring that inflation expectations remain well anchored is understandable. That said, there is a strong correlation between the level of gasoline prices and inflation expectations (Chart 12). If gasoline prices come down from record high levels over the coming months, inflation expectations should drop. Chart 11Consumer Long-Term Inflation Expectations Keep Rising, But Are Still Not At Historically High Levels
Consumer Long-Term Inflation Expectations Keep Rising, But Are Still Not At Historically High Levels
Consumer Long-Term Inflation Expectations Keep Rising, But Are Still Not At Historically High Levels
Chart 12Lower Gasoline Prices Would Help Soothe Consumer Fears Over Inflation
Lower Gasoline Prices Would Help Soothe Consumer Fears Over Inflation
Lower Gasoline Prices Would Help Soothe Consumer Fears Over Inflation
The Fed expects core PCE inflation to fall to 4.3% on a year-over-year basis by the end of 2022. This would require month-over-month readings of about 0.35 percentage points, which is slightly above the average of the past three months (Chart 13). Our guess is that the Fed may be highballing its near-term inflation projections in order to give itself room to “underpromise and overdeliver” on the inflation front. If so, we could see inflation estimates trimmed later this year, which would provide a more soothing backdrop for risk assets. Chart 13AUS Inflation Will Fall By More Than The Fed Expects If The Monthly Change In Core PCE Is Less Than 0.35% (I)
US Inflation Will Fall By More Than The Fed Expects If The Monthly Change In Core PCE Is Less Than 0.35% (I)
US Inflation Will Fall By More Than The Fed Expects If The Monthly Change In Core PCE Is Less Than 0.35% (I)
Chart 13BUS Inflation Will Fall By More Than The Fed Expects If The Monthly Change In Core PCE Is Less Than 0.35% (II)
US Inflation Will Fall By More Than The Fed Expects If The Monthly Change In Core PCE Is Less Than 0.35% (II)
US Inflation Will Fall By More Than The Fed Expects If The Monthly Change In Core PCE Is Less Than 0.35% (II)
Concluding Thoughts on Investment Strategy According to Bank of America, fund managers cut their equity exposure to the lowest since May 2020. Optimism on global growth fell to a record low. Meanwhile, bears outnumbered bulls by 39 percentage points in this week’s AAII poll (Chart 14). If the stock market is about to crash, it will be the most anticipated crash in history. In my experience, markets rarely do what most people expect them to do. Chart 14Sentiment Towards Equities Is Pessimistic
Sentiment Towards Equities Is Pessimistic
Sentiment Towards Equities Is Pessimistic
Chart 15Global Equities Are More Attractively Valued After The Recent Sell-Off
Global Equities Are More Attractively Valued After The Recent Sell-Off
Global Equities Are More Attractively Valued After The Recent Sell-Off
Chart 16US And European EPS Estimates Have Been Trending Higher This Year
US And European EPS Estimates Have Been Trending Higher This Year
US And European EPS Estimates Have Been Trending Higher This Year
US equities are trading at 16.3-times forward earnings, with non-US stocks sporting a forward P/E ratio of 12.1 (Chart 15). Despite the decline in share prices, earnings estimates in both the US and Europe have increased since the start of the year (Chart 16). The consensus is that those estimates will fall. However, if our expectation that a recession will be averted over the next 12 months pans out, that may not happen. A sensible strategy right now is to maintain a modest overweight to stocks while being prepared to significantly raise equity exposure once clear evidence emerges that inflation has peaked. Peter Berezin Chief Global Strategist peterb@bcaresearch.com Follow me on LinkedIn Twitter View Matrix
An Oasis Of Optimism: Notes From The Middle East
An Oasis Of Optimism: Notes From The Middle East
Special Trade Recommendations Current MacroQuant Model Scores
An Oasis Of Optimism: Notes From The Middle East
An Oasis Of Optimism: Notes From The Middle East
Executive Summary Structural Tailwinds For The Franc
Structural Tailwinds For The Franc
Structural Tailwinds For The Franc
Volatility in FX markets is likely to remain elevated, as witnessed by the reaction of a full circle of central bank meetings this week. Policy convergence remains a good bet for interest rate curves and currency pairs. The SNB surprised markets by raising interest rates by 50 bps, to -0.25%, the first hike since 2007. Higher volatility will continue to buoy the Swiss franc in the short run. Structural appreciation in the franc is also likely over the coming decades (Feature Chart). Swiss stocks often perform well during economic downturns, but they are not particularly cheap, and are vulnerable to higher interest rates. Investors should only overweight Swiss stocks if they expect more significant downside to global stocks. Valuation favors the franc versus the dollar. However, EUR/CHF and GBP/CHF are closer to fair value. CHF/JPY is expensive; hence, the yen is a better hedge for downside economic surprises. Go short CHF/JPY as a trade. BCA’s Foreign Exchange Strategy was short CHF/SEK at 10.2 with stop loss at 10.5. That stop was hit overnight, triggering a loss of -3.3%. Stand aside for now. Bottom Line: Favor the franc over the short term against other pro-cyclical currencies, with a view to downgrade CHF when it becomes evident that economic growth is bottoming. Any further bout of Swiss equity outperformance, prompted by global risk aversion, offers an attractive selling opportunity versus Eurozone stocks. Feature Chart 1The SNB Has Capitulated To Rising Inflation
The SNB Has Capitulated To Rising Inflation
The SNB Has Capitulated To Rising Inflation
Volatility in FX markets is likely to remain elevated. This week, the Fed delivered its first 75 bps interest rate hike since 1994. It also increased its expected year-end level for the Fed Funds rate to 3.4% from 1.9%, and to 3.8% from 3.4% at the end of 2023. The FX market had been warming up to a hawkish surprise, but the dollar surged on the news, hitting a fresh two-decade high of 105.5, before later reversing gains. Meanwhile, the European Central Bank (ECB) held an emergency meeting on Wednesday, to try to mitigate the rise in Italian yields, which hit as high as 4.2% on Tuesday, or 243 bps over German 10-year yields. The subsequent statement released by the Governing Council offered no concrete details. Yes, the reinvestments of the proceeds from maturing debt in the Pandemic Emergency Purchase Program (PEPP) will flow mostly to peripheral markets, but investors want clarity on the nature of the long-awaited policy plan to tackle fragmentation risk in the Euro Area. As a result, peripheral bond markets will remain fragile until a bold program comes to fruition. To cement currency volatility this week, SNB Governor Thomas Jordan surprised markets by raising interest rates by 50 bps in Switzerland, to -0.25%, the first hike since the Global Financial Crisis (Chart 1). The negative interest rate threshold for sight deposits was also lowered, a move encouraging banks to pack reserves at the SNB. The Bank of England also raised interest rates in line with market expectations. The move initially disappointed GBP bulls, but sterling is holding above our 1.20 floor. An environment of monetary policy uncertainty, rising recession risks in response to high inflation, and the potential for central bank policy mistakes bodes well for safe-haven assets. In Europe, the market with the strongest defensive profile is Switzerland. In this report, we address whether investors should bet on continued appreciation of the franc and an outperformance of Swiss stocks, especially now that the SNB has turned hawkish. Switzerland Versus The World Global economic growth is slowing and a small/open economy like Switzerland’s has not been spared. The KOF economic barometer, a key leading indicator for Swiss GDP growth, has collapsed over the past twelve months from 144 to 97 as global industrial activity decelerated (Chart 2). Despite softening growth, global inflation refuses to decline, forcing central banks worldwide to lean into the slowdown. This threatens to cut the post-pandemic business cycle expansion short. Chart 2The SNB Is Tightening Into A Slowing Economy
The SNB Is Tightening Into A Slowing Economy
The SNB Is Tightening Into A Slowing Economy
Surprisingly, the Swiss economy is generally performing better than the rest of Europe. Historically, Swiss economic performance is procyclical due to the large share of exports within its GDP. Hence, a slowdown in global manufacturing often creates a large threat to Swiss growth. Going forward, can the Swiss economy diverge from that of the rest of the world (Chart 3)? Such a divergence is not probable, but a few factors will protect the Swiss economy: Switzerland still has one of the lowest policy rates in the G10, even after today’s 50bps interest rate increase. This has tremendously helped ease monetary conditions. Our monetary gauge is at its most accommodative level in over two decades (Chart 4). Chart 3The Swiss Economy Is Procyclical
The Swiss Economy Is Procyclical
The Swiss Economy Is Procyclical
Chart 4Swiss Monetary Conditions Are Still Accommodative
Swiss Monetary Conditions Are Still Accommodative
Swiss Monetary Conditions Are Still Accommodative
Swiss inflation remains the lowest in the G10 outside Japan. In Switzerland, the main driver of price increases has been goods, while services inflation remains subdued. Consequently, the SNB has been tolerating an appreciating franc to temper imported inflation (Chart 5), while keeping domestic borrowing costs at very accommodative levels. In its updated forecasts, the SNB now expects a -0.25% interest rate to allow Swiss inflation to moderate to 1.9% in 2023 and 1.6% in 2024. Chart 5Swiss Inflation Is Surprising To The Upside
Swiss Inflation Is Surprising To The Upside
Swiss Inflation Is Surprising To The Upside
Part of the reason Switzerland has low inflation has been the tremendous productivity gains, especially relative to its trading partners (Chart 6). Swiss income-per-capita is elevated, but wage growth has lagged output gains, which limits the risk of a wage-inflation spiral. It is notable that part-time employment continues to dominate job gains, implying that the need for precautionary savings will remain high in Switzerland. Chart 6A Productivity Profile For Switzerland
A Productivity Profile For Switzerland
A Productivity Profile For Switzerland
Higher productivity growth and the elevated national savings leave their footprint on the trade data. The Swiss trade balance is hitting fresh highs, unlike Europe or Japan (Chart 7). This could potentially create a problem for the Swiss economy as it puts upward pressure on the CHF at a time when global manufacturing output is slowing. However, Switzerland specializes in high value-added exports with an elevated degree of complexity, that stand early in global supply chains. These type of goods are likely to remain in high demand in a global environment marked by supply-chain bottlenecks and high-capacity utilization. Chart 7Structural Tailwinds For The Franc
Structural Tailwinds For The Franc
Structural Tailwinds For The Franc
Finally, Switzerland does not import energy to fulfill its electricity production. Hydropower accounts for roughly 61.4% of electricity generation, followed by nuclear power at 28.5%. This has partially insulated Switzerland from the energy shock hurting economic activity and trade balances in the EU. For example, German electricity generation is 28.8% coal and 14.7% natural gas. Bottom Line: The Swiss economy is reopening and is relatively insulated from the Russia-Ukraine conflict. This limits to some degree how closely Switzerland will track the global and European economic slowdown. It creates a departure from the traditional pro-cyclicality of the Swiss economy. The SNB, The SARON Curve, And The Swiss Franc If the Swiss economy surprises to the upside, the case for the SNB to tolerate a rising franc becomes even stronger. The pace of foreign exchange reserve accumulation is already decelerating (Chart 8). Governor Thomas Jordan has been very clear: as global prices rise, the fair value of the franc is also rising, which implies a willingness to tolerate currency strength. In a purchasing power parity framework, higher external inflation makes Swiss goods relatively cheaper. This allows foreigners to bid up the currency. Even with today’s updated pricing, the SNB is still expected to remain among the most dovish central banks in the G10 (Chart 9). If inflationary pressures prove sticky, the SNB will step up its hawkish rhetoric. If inflationary fears subside, then global rates will fall as well, which has usually been a boon for the franc. More specifically, this would be negative for the EUR/CHF cross (Chart 10). Chart 8Less Intervention By The SNB
Less Intervention By The SNB
Less Intervention By The SNB
Chart 9The SARON Curve Has Adjusted Higher
The SARON Curve Has Adjusted Higher
The SARON Curve Has Adjusted Higher
Chart 10EUR/CHF And Bund Yields Can Continue To Diverge
EUR/CHF And Bund Yields Can Continue To Diverge
EUR/CHF And Bund Yields Can Continue To Diverge
The Swiss economy can tolerate an appreciating CHF, but can it withstand higher interest rates? We believe so. Switzerland is a net creditor nation, but its domestic non-financial debt is also extremely elevated. Thus, the Swiss economy is vulnerable to higher rates, especially the housing market (Chart 11). Nonetheless, internal adjustments will soften the blow and increase affordability. Of note, property speculation in Switzerland has decreased in response to macroprudential measures. Growth in rental housing prices, which usually constitute the bulk of investment homes, has collapsed, but the price of owner-occupied homes has proven more robust (Chart 12). A cap on the percentage of secondary homes in any Canton as well as tighter lending standards have also helped. In a renewed update to its Financial Stability Report, Fritz Zurbrügg, Vice Chairman of the Governing Board, suggests that Swiss banks are well capitalized, especially given the recent reactivation of the countercyclical capital buffer. Chart 11Higher Rates Are A Risk For Swiss Real Estate
Higher Rates Are A Risk For Swiss Real Estate
Higher Rates Are A Risk For Swiss Real Estate
Chart 12Some Adjustment Already In Investment Home Prices
Some Adjustment Already In Investment Home Prices
Some Adjustment Already In Investment Home Prices
In the very near term, demographics might also be a tailwind. The pandemic limited immigration to Switzerland, but the working-age population is rebounding anew (Chart 13), which will create a cushion under housing and support domestic demand. Chart 13A Small Demographic Tailwind For Home Prices
A Small Demographic Tailwind For Home Prices
A Small Demographic Tailwind For Home Prices
Stronger aggregate demand in an inflationary world will justify the need for less monetary accommodation. In a nutshell, the SNB is likely to continue walking the path of “least regrets” like most central banks, by tightening monetary policy to meet its 2% inflation mandate, but pausing if economic conditions warrant. The currency has historically been used as a key tool for calibrating financial conditions. From a fundamental perspective, our PPP models suggest the franc is quite cheap versus the dollar but at fair value versus the euro and sterling. This is echoed by Governor Jordan, who no longer views the franc as expensive. Our models adjusts the consumption basket in Switzerland for an apples-to-apples comparison across both the UK and the eurozone (Chart 14). Chart 14AA CHF Is At Fair Value Versus The EUR And GBP
A CHF Is At Fair Value Versus The EUR And GBP
A CHF Is At Fair Value Versus The EUR And GBP
Chart 14BA CHF Is At Fair Value Versus The EUR And GBP
A CHF Is At Fair Value Versus The EUR And GBP
A CHF Is At Fair Value Versus The EUR And GBP
Finally, hedging costs for shorting the franc against the dollar have risen substantially (Chart 15). As such, any short bets on the franc are likely being placed naked. If the Fed ends up tempering its pace of rate hikes next year in response to weaker US activity, short-covering activity is likely to accentuate any pre-existing strength in the CHF. Chart 15Hedging Costs For USD/CHF Carry Trades Have Risen Hedging Costs Are Prohibitive
Hedging Costs For USD/CHF Carry Trades Have Risen Hedging Costs Are Prohibitive
Hedging Costs For USD/CHF Carry Trades Have Risen Hedging Costs Are Prohibitive
Bottom Line: The franc is undervalued against the dollar, and a good hedge against a rise in volatility versus other procyclical currencies. This places the franc in a good “heads I win, tails I don’t loose too much” bet. Swiss interest rates are also likely to climb higher. However, because the franc will do the bulk of the monetary tightening, the SNB is likely to lag the expectations now embedded in the SARON curve. What About Swiss Equities? Despite the cyclical nature of the Swiss economy, Swiss equities are extremely defensive. Swiss stocks have little to do with the domestic economy and are mostly a collection of large multinationals, dominated by the healthcare and consumer staples sectors, which together account for roughly 60% of the Swiss MSCI benchmark. This defensive attribute has created its own problem for Swiss equities. Relative to the Eurozone, the Swiss market has moved massively ahead of profitability, and it is now more expensive than at the apex of the European debt crisis in 2012 (Chart 16). Moreover, the jump in German yields is becoming increasingly problematic for Swiss stocks that historically perform poorly when global interest rates are rising (Chart 17). Chart 16Swiss Stocks Are Expensive
Swiss Stocks Are Expensive
Swiss Stocks Are Expensive
Chart 17A Lost Tailwind
A Lost Tailwind
A Lost Tailwind
In the near term, Swiss equities will only be able to defy the gravitational pull created by demanding valuations and higher yields if global risk aversion remains elevated. However, once global stocks find a floor and Italian spreads begin to narrow, Swiss stocks are likely to underperform massively (Chart 18). It could take a few more weeks before the BTP/Bund spreads narrow as the recent ECB announcement was rather tepid. However, the ECB holding an emergency meeting and issuing a formal statement addressing the problem facing peripheral bond markets suggests that a formal program designed to manage fragmentation risk will emerge before the end of the summer. Beyond their defensive attributes, Swiss stocks also correlate to the Quality Factor. The robust performance of this factor since the turn of the millennium, in Europe and globally, has allowed the Swiss market to greatly outperform Eurozone equities (Chart 19). However, the Quality Factor has begun to underperform, which indicates that the Swiss market is losing another of its underpinnings. Chart 18Near-term, Follow Risk Aversion
Near-term, Follow Risk Aversion
Near-term, Follow Risk Aversion
Chart 19Swiss Stocks Are About Quality
Swiss Stocks Are About Quality
Swiss Stocks Are About Quality
These observations imply that over the next 12 to 18 months, Swiss equities will underperform their Euro Area counterparts. Materials and consumer staples stand out as the two sectors with the most extended valuations relative to their Euro Area competitors, especially since their relative performances have become dissociated from relative profits (Chart 20). They should carry maximum underweights relative to their European counterparts. The healthcare sector is Switzerland’s largest market weight. It is not as expensive relative to the Eurozone as the materials and consumer staples sectors, but it carries enough of a premium that investors should still underweight this sector relative to its eurozone competitor (Chart 21). Chart 20Dangerous Setup For Swiss Materials and Staples
Dangerous Setup For Swiss Materials and Staples
Dangerous Setup For Swiss Materials and Staples
Chart 21The Swiss Heavyweight Is Becoming Pricey
The Swiss Heavyweight Is Becoming Pricey
The Swiss Heavyweight Is Becoming Pricey
Bottom Line: The defensive nature of the Swiss market has allowed for a large outperformance over European equities. However, the Swiss market is now very expensive on a relative basis, and it is vulnerable to higher interest rates. While global risk aversion can still buoy the Swiss market in the near term, conditions are falling into place for Swiss stocks to underperform their Eurozone counterpart over a 12-to-18 month window. Materials and consumer staples are the sectors mostly likely to experience a large underperformance relative to their Euro Area competitors, followed by the healthcare sector. Investment Conclusions Volatility in FX markets is likely to remain elevated, as witnessed by the reaction of a full circle of central bank meetings this week. Policy convergence remains a good bet for interest rate curves and currency pairs. The SNB surprised markets by raising interest rates by 50 bps, to -0.25%, the first hike since 2007 (Chart 1). Higher volatility will continue to buoy the Swiss franc in the short run. Structural appreciation in the franc is also likely over the coming decades. Swiss stocks often perform well during economic downturns, but they are not particularly cheap, and vulnerable to higher interest rates. Investors should only overweight Swiss stocks if they expect more significant downside to global stocks. Valuation favors the franc versus the dollar. However, EUR/CHF and GBP/CHF are closer to fair value. CHF/JPY is expensive; hence the yen is a better hedge for downside economic surprises. Go short CHF/JPY as a trade. BCA’s Foreign Exchange Strategy was short CHF/SEK at 10.2 with stop loss at 10.5. That stop was hit overnight, triggering a loss of -3.3%. Stand aside for now. Chester Ntonifor Foreign Exchange Strategist chestern@bcaresearch.com Mathieu Savary Chief European Strategist Mathieu@bcaresearch.com Trades & Forecasts Strategic View Cyclical Holdings (6-18 months) Tactical Holdings (0-6 months) Forecast Summary
Executive Summary Was FAANGM A Bubble?
Was FAANGM A Bubble?
Was FAANGM A Bubble?
US inflation has become broad-based, and the labor market is very tight. Wages are a lagging variable, and they will be rising rapidly in the coming months, even as the economy slows. Although US growth will be slowing and global trade will be contracting, the Fed will remain hawkish over the coming months. This is an unprecedented environment and is negative for global and EM risk assets. The US trade-weighted dollar will continue to appreciate as long as the Fed sounds and acts in a hawkish manner and global trade contracts. Consistent with a US dollar overshoot, EM financial markets will undershoot. Even though EM equity and local bond valuations have become attractive, their fundamentals are still negative. A buying opportunity in EM will occur when the Fed makes a dovish pivot and China stimulates more aggressively. We reckon that these conditions will fall into place sometime in H2 this year. Bottom Line: For now, we recommend that investors stay defensive in absolute terms and underweight EM within global equity and credit portfolios. The dollar has more upside in the near term but a major buying opportunity in EM local currency bonds is approaching. Feature Last week, after a two and a half year hiatus, I travelled to Europe to visit clients. I also took the opportunity catch up with Ms. Mea, a global portfolio manager and a long-standing client. Prior to the pandemic, we met regularly to discuss global macro and financial markets. She was happy to resume our in-person meetings, and we met in Amsterdam over dinner last Friday. This report provides the key points of our conversation for the benefit of all clients. Ms. Mea: I am very happy that we are again able to meet in person. Video meetings are good, but in-person meetings are better. One’s body language often gives away their level of confidence regarding investment recommendations. Answer: Agreed. My meetings with clients this week have reminded me of the value of in-person meetings. Chart 1Our Calls On Various EM Asset Classes
Our Calls On Various EM Asset Classes
Our Calls On Various EM Asset Classes
Ms. Mea: Before our meeting I reviewed the evolution of your investment views since the pandemic erupted. Let me try to summarize them, and correct me if I miss something. Even though you upgraded your medium-term view on Chinese growth in May 2020 due to the stimulus, you remained skeptical of the rally in global risk assets. In Q2 2020, you upgraded your stance on EM bonds and in July 2020 you lifted the recommended allocation to EM equities and currencies from underweight to neutral (Chart 1). In the summer and fall of 2020, you were still wary of a deflationary relapse in developed economies. However, since January 2021, your outlook for the US shifted drastically to overheating and inflation. Since then, you have been very vocal about inflation risks in the US. At the same time, you have been warning about a major slowdown in Chinese growth. Regarding financial markets, in March 2021, you downgraded EM stocks and bonds to underweight and recommended shorting select EM currencies versus the US dollar (Chart 1). I should say that your call on US inflation and China’s slowdown have played out very well over the past 18 months. Let’s zero in on US inflation. It was just last year that many investors and analysts claimed that inflation is good for stocks because it helps their top line growth. Why then have global markets panicked? Chart 2Record Wealth Destruction In US Stocks And Bonds
Record Wealth Destruction In US Stocks And Bonds
Record Wealth Destruction In US Stocks And Bonds
Answer: Not many people have a deep understanding of inflation and its impact on financial markets because most investors lack experience in navigating financial markets during an inflation era. In fact, the US equity and bond market selloffs of the past 12 months have wiped out about $12 trillion and $3.5 trillion off their respective market value. This adds up to a combined $15.5 trillion or about 60% of US GDP and already exceeds the wipeouts during the March 2020 crash and all other bear markets (Chart 2). The way we think about macro and markets must change in an inflation regime. In our seminal February 25, 2021 Special Report titled A Paradigm Shift In The Stock-Bond Relationship, we made the case that the US economy and its financial markets were about to enter a new paradigm of higher inflation. We argued that US core CPI would spike well above 2% and US share prices and US government bond yields would become negatively correlated. A similar paradigm shift occurred in 1966 (Chart 3). In short, we argued that the era of low US inflation was over, and as a result, equities and bonds would selloff simultaneously. This will remain the roadmap for investors as long as core inflation is high. Chart 3A Paradigm Shift: US Stock Prices And Bond Yields Correlation Over Decades
A Paradigm Shift: US Stock Prices And Bond Yields Correlation Over Decades
A Paradigm Shift: US Stock Prices And Bond Yields Correlation Over Decades
Ms. Mea: Do you think the Fed is behind the curve? Answer: Yes, the Fed has fallen behind the curve, and, as we have repeatedly argued over the past 12 months, the US inflation genie is out of the bottle. There is a lot of confusion in the global investment community about how we should think about inflation, and about how and when the various measures of inflation matter. As consumers, we care about headline inflation because it affects our purchasing power. So, changes in all goods and service prices, including energy and food, matter to consumers. However, this does not mean that central banks should target and set policy based on headline inflation. Rather, central banks should target genuine broad-based inflation in the economy before it becomes entrenched. Ms. Mea: Can you explain why in certain cases a surge in energy, food and other prices leads to entrenched inflation but in other cases it does not? Answer: Let me give you an example. When consumers experience rapidly rising food and energy prices, they will likely demand faster wage growth from their employers. If businesses are enjoying strong demand for their goods/services and facing a tight labor market, they might have little choice but to agree to pay raises to sustain their business. Companies will then attempt to protect their profit margins by hiking their selling prices. Households may accept higher prices given their incomes are rising. This dynamic could cause inflation to become broad-based and entrenched. In this case, central banks should lift rates to slow the economy materially and cool off the labor market to end the wage-price spiral. If employees fail to negotiate hefty pay raises, odds are that inflation will not become broad-based. The more households spend on energy and food, the less income they will have to spend on other items, causing their discretionary spending to contract. In this case, there is no rush for central banks to tighten policy. If monetary authorities tighten materially, the economy will experience a full-fledged recession. In short, wage dynamics will determine whether inflation becomes broad-based. Labor market conditions will ultimately dictate this outcome. Ms. Mea: But why are wages more important than the price of fuel or food in determining whether inflation becomes broad-based? Answer: To be technically correct, unit labor costs, not wages, are key to inflation dynamics. Unit labor cost = (wage per hour) / (productivity). Productivity is output per hour. Given that labor is the largest cost component of US businesses, unit labor costs will swell and profit margins will shrink when salaries rise faster than productivity. CEOs and business owners always do their best to protect the their profit margins. Thus, accelerating unit labor costs will lead them to raise their selling prices. In the wake of wage gains, consumers might accept higher goods and service prices. If they do and go on to demand even higher wages, the economy will enter a wage-price spiral. This is why wage costs, more specifically unit labor costs, are the most important variable to monitor. If high energy and food prices lead employees to demand faster wage growth from their employers, and if they are granted wage increases above and beyond their productivity advances, inflation will become more broad-based and genuine. If consumers push back against higher prices, i.e., reduce their spending, corporate profits will plunge, and companies will freeze investment and lay off employees. Wages will slow and inflation will wane. Ms. Mea: Are all economies currently experiencing a wage-price spiral? Answer: The US and some other countries have been experiencing a wage-price spiral over the past 12 months. In other countries, including many developing economies, a wage-price spiral is currently absent. In the US, labor demand exceeds supply by the widest margin since 1950 (Chart 4). The upshot is that wages will continue to rise in response to persistently high inflation (Chart 5). Chart 4US Labor Demand Is Exceeding Labor Supply By The Widest Margin Since 1950
US Labor Demand Is Exceeding Labor Supply By The Widest Margin Since 1950
US Labor Demand Is Exceeding Labor Supply By The Widest Margin Since 1950
Chart 5US Wage Growth Is Already Very High
US Wage Growth Is Already Very High
US Wage Growth Is Already Very High
Wages in the US are currently rising at a rate of 6-6.5% or so. US productivity growth is around 1.5%. As a result, unit labor costs are rising at a 4.5-5% annual rate, the fastest rate for corporate America in the past 40 years (Chart 6). As Chart 6 demonstrates, unit labor costs have been instrumental in defining core CPI fluctuations over the past 70 years in the US. Chart 6US Unit Labor Costs Are Rising At The Fastest Rate Since 1982
US Unit Labor Costs Are Rising At The Fastest Rate Since 1982
US Unit Labor Costs Are Rising At The Fastest Rate Since 1982
Chart 7US Core Of Core Inflation Is High And Not Falling
US Core Of Core Inflation Is High And Not Falling
US Core Of Core Inflation Is High And Not Falling
In short, both surging unit labor costs and the acceleration of super core CPI measures like trimmed-mean CPI and median CPI suggest that US inflation has become broad-based and a wage-inflation spiral has taken hold in the US (Chart 7). Critically, wages are a lagging variable and are not reset all at once for all employees. American employees will continue to demand substantial wage hikes both to offset the last 12 months of lost purchasing power and to protect their purchasing power for the next 12 months. Hence, we will be witnessing faster wage growth in the coming months even as the economy slows. For many continental European economies and for several EM economies, wage growth is still weak. Chart 8 illustrates that nominal wage growth in India, Indonesia, China and Mexico are very subdued. Sluggish wage gains in emerging economies are consistent with the profile of their domestic demand. Domestic demand in these large developing economies remains extremely weak. In many cases, the level of domestic demand in real terms is still below its pre-pandemic level (Chart 9). Chart 8EM Wages Are Very Tame
EM Wages Are Very Tame
EM Wages Are Very Tame
Chart 9EM Domestic Demand Is Depressed
EM Domestic Demand Is Depressed
EM Domestic Demand Is Depressed
In China, deflation, rather than inflation, is the main economic threat. Headline and core inflation are within a 1-2% range (Chart 10), domestic demand is very weak, and the unemployment rate has risen in the past 12 months. Chart 10China's Inflation Is Subdued
China's Inflation Is Subdued
China's Inflation Is Subdued
Ms. Mea: Do you expect the US economy to contract? Answer: US growth will decelerate substantially, and certain segments of the economy could shrink for a couple of quarters. My expectation is that US corporate profits will contract materially. Slowing top line growth, narrowing profit margins, shrinking global trade and a strong dollar are all major headwinds for the S&P 500 EPS. EM EPS are also heading towards a major contraction. This is why I view EM fundamentals as negative even though EM valuations have become attractive. Ms. Mea: You have recently written that global trade volumes are about to contract. What is your rationale and is there any evidence that this is already happening? Answer: US and EU demand for consumer goods ex-autos has been booming over the past two years. Households have overspent on goods ex-autos (Chart 11). Given that their disposable income is contracting in real terms and a preference to spend on services, households will markedly curtail their purchases of consumer goods in the coming months. This will hurt global manufacturing in general, and emerging Asia in particular. Some forward-looking indicators are already signaling a contraction in global trade: US retail inventories (in real terms) have swelled (Chart 12, top panel). US retailers will dramatically reduce their orders. Chart 11Global Trade Volumes Will Shrink In H2 2022
Global Trade Volumes Will Shrink In H2 2022
Global Trade Volumes Will Shrink In H2 2022
Chart 12US Import Volumes Are Set To Contract
US Import Volumes Are Set To Contract
US Import Volumes Are Set To Contract
Besides, US railroad carload is already shrinking, signaling reduced goods shipments (Chart 12, bottom panel). Taiwanese shipments to China lead global trade and they point to an impending slump (Chart 13, top panel). Also, the Taiwanese manufacturing shipments-to-inventory ratio has dropped below 1 (Chart 13, bottom panel). Finally, industrial metal prices are breaking down despite easing lockdowns in China and continued sanctions on Russia (Chart 14). This is a sign of downshifting global manufacturing. Chart 13A Red Flag For Global Trade
A Red Flag For Global Trade
A Red Flag For Global Trade
Chart 14Industrial Metal Prices Are Breaking Down
Industrial Metal Prices Are Breaking Down
Industrial Metal Prices Are Breaking Down
Ms. Mea: Won’t a global trade contraction push down goods prices and help US inflation? Answer: Correct, it will bring down US goods inflation but not services inflation. Importantly, as we discussed above, US inflation has already spilled into wages and has become broad-based. Plus, it is hovering well above the Fed’s target. Hence, the Fed cannot dial down its hawkishness now, even if goods price inflation drops significantly. In brief, even though US growth will be slowing and global trade will be contracting over the coming months, the Fed is likely to remain hawkish. This is an unprecedented environment and is negative for global and EM risk assets. Ms. Mea: What are the financial market implications of entrenched inflation in the US and the lack of genuine inflationary pressures in many emerging economies? Answer: As long as the Fed sounds and acts in a hawkish manner and/or global trade contracts, the US trade-weighted dollar will continue to appreciate. The greenback is a countercyclical currency and rallies when global trade slumps. On the whole, the USD will likely overshoot in the near run. Consistent with a US dollar overshoot, EM financial markets will undershoot. Even though investor sentiment on EM equities and USD bonds is very low (Chart 15), a final capitulation selloff is still likely. In short, EM valuation and positioning are positive for future potential returns yet their fundamentals (business cycle, profits, return on capital, etc.) are still negative. A buying opportunity in EM will emerge when the Fed makes a dovish pivot, China stimulates more aggressively, and EM equity and bond valuations improve further. We reckon that these conditions will fall into place sometime in H2 this year. If the Fed turns dovish early without taming US inflation, it will fall behind the inflation curve and the US dollar will begin its bear market. Investors will respond by embracing EM financial assets. EM local currency bonds in particular offer value (Chart 16). Prudent macro policies and the lack of wage pressures entail a good medium-to-long term opportunity in EM local currency bonds. Chart 15Investor Sentiment On EM Stocks And USD Bonds Is Low
Investor Sentiment On EM Stocks And USD Bonds Is Low
Investor Sentiment On EM Stocks And USD Bonds Is Low
Chart 16US TIPS Yields Should Roll Over For EM Local Bond Yields To Decline
US TIPS Yields Should Roll Over For EM Local Bond Yields To Decline
US TIPS Yields Should Roll Over For EM Local Bond Yields To Decline
As EM currencies put in a bottom, local yields will come down. This will help their equity markets. Ms. Mea: Speaking of a capitulation selloff, how far can it go? Both for EM stocks as well as the S&P 500? Chart 17S&P500: Where Is Technical Support Line?
S&P500: Where Is Technical Support Line?
S&P500: Where Is Technical Support Line?
Answer: As long as US bond yields and oil prices do not start falling on a consistent basis, the S&P 500 will remain under selling pressure. Technicals can help us gauge the likely magnitude of the move. The S&P 500 has dropped to a major technical support, but it will likely be broken. The next support is around 3100-3200 (Chart 17). The EM equity index is sitting on a technical support now (Chart 18). The next support level is 15-17% below the current one. Chart 18EM Stocks in USD Terms Could Drop Another 15%
EM Stocks in USD Terms Could Drop Another 15%
EM Stocks in USD Terms Could Drop Another 15%
Critically, US equity investors should also consider whether the US equity bull market that has been in place since 2009 is over. If it is, then the S&P 500 bear market could last long, and prices could drop significantly. Chart 19Was FAANGM A Bubble?
Was FAANGM A Bubble?
Was FAANGM A Bubble?
A few observations that investors should keep in mind: First, over the past 12 years, FAANGM stocks have followed the profile of the Nasdaq 100 (Chart 19). In short, FAANGM stocks have risen as much as the Nasdaq 100 index did in the 1990s. Second, when retail investors rush into an asset class, it often signals the final phase of the bull market. Once the bull market ends, the ensuing bear market is vicious. The behavior of tech/internet stocks and the broader S&P 500 fits this profile extremely well. For several years after the Lehman crash, individual investors were hesitant to buy US stocks. However, the resilience of US equities led to a buy the dip mentality in 2019-20. Retail investors joined the equity party en masse in early 2020. The post retail frenzy hangover is usually very painful and prolonged. Based on this roadmap, it seems that the 2020-21 retail-driven rally was the final upleg in the S&P 500 bull market. By extension, we have entered a bear market that could be vicious and extended. All the excesses of the 10-year FAANGM and S&P500 bull markets will need to be worked out before a new bull market emerges. Finally, a high inflation regime raises the bar for the Fed to rescue the stock market. This also entails lower equity multiples than we have in the S&P500 now. Ms. Mea: What do you make of EM’s recent outperformance versus DM stocks? When will you upgrade EM versus DM? Answer: Indeed, EM stocks have recently outperformed DM stocks. We might be witnessing a major transition in global equity market leadership. We have held for some time that an equity leadership change from the US to the rest of the world and from TMT stocks to other segments of the global equity market would likely take place during or following a major market selloff. The ongoing equity bear market seems to be exactly that catalyst. Chart 20For EM Equities To Outperform, USD Needs To Weaken
For EM Equities To Outperform, USD Needs To Weaken
For EM Equities To Outperform, USD Needs To Weaken
If the S&P 500 bull market is over, the global equity leadership will also change away from US and TMT stocks to other stock markets and sectors. That said, to upgrade EM stocks, we need to change our view on the USD because EM relative equity performance versus DM closely tracks the inverted trade-weighted US dollar (Chart 20). In the near term, we believe the greenback has more upside potential. In particular, Asian currencies and equity markets cannot outperform when the Fed is hawkish and global trade is contracting. Latin American currencies have benefited since early this year from the spike in commodity prices. However, worries about a US recession, a strong dollar and a lack of strong recovery in the Chinese economy will push industrial metal prices lower. As shown in Chart 14 above, industrial metal prices are breaking down. This is a bad omen for Latin American markets. On the whole, we will likely be upgrading EM versus DM later this year. For now, we recommend that investors stay defensive and underweight EM within global equity and credit portfolios. We also continue to short the following currencies versus the USD: ZAR, COP, PEN, PLN, PHP and IDR; as well as HUF vs. CZK, and KRW vs. JPY. A major buying opportunity in local currency bonds is approaching. Arthur Budaghyan Chief Emerging Markets Strategist arthurb@bcaresearch.com
In lieu of next week’s report, I will host a Webcast on Monday, June 27 to explain the recent market turmoil and how to navigate it through the second half of 2022. Please mark the date, and I do hope you can join. Executive Summary The recent sharp underperformance of the HR and employment services sector presages an imminent rise in the US unemployment rate. Central banks have decided that a recession is a price worth paying to slay inflation. In this sense, the current setup rhymes with 1981-82, when the Paul Volcker Fed made the same decision. The correct investment strategy for stocks, bonds, sectors and FX is to follow the template of 1981-82. In a nutshell, an imminent recession will require a defensive strategy for most of 2022, before a strong recovery in markets unfolds in 2023. Go long the December 2023 Eurodollar (or SOFR) futures contract. While interest rates are likely to overshoot in the near term, the pain that they will unleash will require a commensurate undershoot in 2023-24. Cryptocurrencies will rally strongly once the Nasdaq reaches a near-term bottom, which in turn will depend on a peak in long bond yields. Fractal trading watchlist: Czechia versus Poland, German telecoms, Japanese telecoms, and US utilities. The Underperformance Of Human Resources Warns That The US Jobs Market Is Rolling Over
The Underperformance Of Human Resources Warns That The US Jobs Market Is Rolling Over
The Underperformance Of Human Resources Warns That The US Jobs Market Is Rolling Over
Bottom Line: An imminent recession will require a defensive strategy for most of 2022, before a strong recovery in markets unfolds in 2023. Feature Financial markets have collapsed in 2022, but jobs markets have held firm, at least so far. For example, the US economy has added an average of 500 thousand jobs per month1, and the unemployment rate, at 3.6 percent, remains close to a historic low. But now, an excellent real-time indicator warns that cracks are appearing in the US jobs market. The excellent real-time indicator of the jobs market is the performance of the human resources (HR) and employment services sector. After all, with its role to place and support workers in their jobs, what better pulse for the jobs market could there be than HR? What better pulse for the jobs market could there be than the human resources sector? Worryingly, the recent sharp underperformance of the HR and employment services sector warns that the pulse of the jobs market is weakening, and that consumers will soon be reporting that jobs are becoming less ‘plentiful’ (Chart I-1). In turn, consumers reporting that jobs are becoming less plentiful presages an imminent rise in the unemployment rate (Chart I-2). Chart I-1The Underperformance Of Human Resources Warns That The US Jobs Market Is Rolling Over
The Underperformance Of Human Resources Warns That The US Jobs Market Is Rolling Over
The Underperformance Of Human Resources Warns That The US Jobs Market Is Rolling Over
Chart I-2Jobs Becoming Less 'Plentiful' Presages Higher Unemployment
Jobs Becoming Less 'Plentiful' Presages Higher Unemployment
Jobs Becoming Less 'Plentiful' Presages Higher Unemployment
2 Percent Inflation Will Require A Sharp Rise In Unemployment The health of the jobs market has a huge bearing on the big issue du jour – inflation. Specifically, in the US, the unemployment rate (inversely) drives the inflation of rent and owners’ equivalent rent (OER) because, to put it simply, you need a steady job to pay the rent. Furthermore, with rent and OER comprising almost half of the core CPI basket, the ‘rent of shelter’ component is by far the most important long-term driver of core inflation.2 Shelter inflation at 3.5 percent equates to core inflation at 2 percent. For the past couple of decades, full employment has been consistent with rent of shelter inflation running at 3.5 percent, which itself has been consistent with core inflation running at 2 percent (Chart I-3). Hence, the Fed could achieve the Holy Grail of full employment combined with inflation running close to 2 percent. Chart I-3Core Inflation At 2 Percent = Shelter Inflation At 3.5 Percent...
Core Inflation At 2 Percent = Shelter Inflation At 3.5 Percent...
Core Inflation At 2 Percent = Shelter Inflation At 3.5 Percent...
But here’s the Fed’s problem. In recent months, there has been a major disconnect between the jobs market and rent of shelter inflation. The current state of full employment equates to rent of shelter inflation running not at 3.5 percent, but at 5.5 percent (Chart I-4). Chart I-4...But Full Employment Now = Shelter Inflation At 5.5 Percent
...But Full Employment Now = Shelter Inflation At 5.5 Percent
...But Full Employment Now = Shelter Inflation At 5.5 Percent
This means that to bring rent of shelter and core inflation back to 3.5 percent and 2 percent respectively, the unemployment rate will have to rise by 2 percent. In other words, to achieve its inflation goal, the Fed will have to sacrifice its full employment goal. Put more bluntly, if the Fed wants to reach 2 percent inflation quickly, it will have to take the economy into recession. The cracks appearing in the HR and employment services sector suggest this process is already underway. There Are Two ‘Neutral Rates Of Interest’. Which One Will Central Banks Choose? The ‘neutral rate of interest rate’, also known as the long-run equilibrium interest rate, the natural rate and, to insiders, r-star or r*, is the short-term interest rate that is consistent with the economy at full employment and stable inflation: the rate at which monetary policy is neither contractionary nor expansionary. But here’s the subtle point that many people miss. The neutral rate is defined in terms of stable inflation without stating what that stable rate of inflation is. Therein lies the Fed’s problem. The near-term neutral rate that is consistent with inflation at 2 percent is much higher than the near-term neutral rate that is consistent with full employment. The near-term neutral rate that is consistent with inflation at 2 percent is much higher than the near-term neutral rate that is consistent with full employment. Now let’s add a third goal of ‘financial stability’, and the message from the ongoing crash in stock, bond, and credit markets is crystal clear. The near-term neutral rate that is consistent with inflation at 2 percent is also much higher than the near-term neutral rate that is consistent with financial stability (Chart I-5 and Chart I-6). Chart I-5Markets Have Crashed Because Valuations Have Crashed. Profits Have Held Up… So Far
5. Markets Have Crashed Because Valuations Have Crashed. Profits Have Held Up... So Far
5. Markets Have Crashed Because Valuations Have Crashed. Profits Have Held Up... So Far
Chart I-6When The Mortgage Rate Exceeds The Rental Yield, It Spells Trouble For House Prices
When The Mortgage Rate Exceeds The Rental Yield, It Spells Trouble For House Prices
When The Mortgage Rate Exceeds The Rental Yield, It Spells Trouble For House Prices
This leaves the Fed, and other central banks, with a major dilemma. Which neutral rate goal to pursue – full employment and financial stability, or inflation at 2 percent? In the near term, the answer seems to be inflation at 2 percent. This is because the lifeblood of central banks is their credibility. With their credibility as inflation fighters in tatters, this may be the last chance to repair it before it is shredded forever. Taking this long-term existential view, central banks have decided that a recession is a price worth paying to slay inflation and repair their credibility. In this important sense, the current setup rhymes with 1981-82 when the Paul Volcker Fed made the same decision. Therefore, the correct investment strategy for stocks, bonds, sectors and FX is to follow the template of 1981-82, which we detailed in More On 2022-2023 = 1981-82, And The Danger Ahead. In a nutshell, an imminent recession will require a defensive strategy for most of 2022, before a strong recovery in markets unfolds in 2023. Eventually, the central banks’ major dilemma between inflation and growth will resolve itself. The triple whammy of a recession in asset prices, profits, and jobs will unleash a strong disinflationary – or even outright deflationary – impulse, causing inflation to collapse to well below 2 percent in 2023-24. And suddenly, there will be no conflict between the neutral rate that is consistent with full employment and financial stability, and that which is consistent with inflation at 2 percent. Both neutral rates will be ultra-low. Hence, while interest rates are likely to overshoot in the near term, the pain that they will cause will require a commensurate undershoot in 2023-24. On this basis, go long the December 2023 Eurodollar (or SOFR) futures contract (Chart I-7). Chart I-7Go Long The Dec 2023 Eurodollar (Or SOFR) Future
Go Long The Dec 2023 Eurodollar (Or SOFR) Future
Go Long The Dec 2023 Eurodollar (Or SOFR) Future
Cryptos Will Bottom When The Nasdaq Bottoms The turmoil across financial markets has naturally engulfed cryptocurrencies, and this has generated the usual Schadenfreude among the crypto-doubters. But in the short-term, cryptocurrencies just behave like leveraged tech stocks, meaning that as the Nasdaq has fallen sharply, cryptos have fallen even more sharply (Chart I-8). Chart I-8In the Short Term, Cryptos = A Leveraged Nasdaq
In the Short Term, Cryptos = A Leveraged Nasdaq
In the Short Term, Cryptos = A Leveraged Nasdaq
Most cryptocurrencies are just the tokens that secure their underlying blockchains, so their long-term value hinges on whether their underlying blockchain technologies will succeed in displacing the current ‘trusted third party’ model of intermediation. In this sense, blockchain tokens are the ultimate long-duration growth stocks, whose present values are highly sensitive to the performance of the blockchain technology sector, which in turn is highly sensitive to the long-duration bond yield. Hence, while the bear markets in bonds, Nasdaq, and cryptos appear to be separate stories, they are just one massive correlated trade! Given that nothing fundamental has changed in the outlook for blockchains, long-term investors should treat this crypto crash, just like all the previous crypto crashes, as a buying opportunity. Cryptos will rally strongly once the Nasdaq reaches a near-term bottom, which in turn will depend on a peak in long bond yields. Fractal Trading Watchlist Amazingly, while most markets have crashed, the financial-heavy Czech stock market is up by 20 percent this year, in sharp contrast to its neighbouring Polish stock market which is down by 25 percent. In fact, over the last year, Czechia has outperformed Poland by 100 percent. From both a fundamental and technical perspective, this outperformance is now vulnerable to reversal (Chart I-9). Accordingly, a recommended trade is to underweight Czechia versus Poland, setting the profit target and stop-loss at 15 percent. Elsewhere, the outperformances of German telecoms, Japanese telecoms, and US utilities are all at, or close, to points of fractal fragilities which make them vulnerable to reversals. As such, these have entered out watchlist. The full watchlist of 27 investments that are at, or approaching turning points, is available on our website: cpt.bcaresearch.com Chart I-9Czechia's Spectacular Outperformance Is Vulnerable To Reversal
Czechia's Spectacular Outperformance Is Vulnerable To Reversal
Czechia's Spectacular Outperformance Is Vulnerable To Reversal
Fractal Trading Watchlist: New Additions German Telecom Outperformance Vulnerable To Reversal
German Telecom Outperformance Vulnerable To Reversal
German Telecom Outperformance Vulnerable To Reversal
Japanese Telecom Outperformance Vulnerable To Reversal
Japanese Telecom Outperformance Vulnerable To Reversal
Japanese Telecom Outperformance Vulnerable To Reversal
US Utilities Outperformance Vulnerable To Reversal
US Utilities Outperformance Vulnerable To Reversal
US Utilities Outperformance Vulnerable To Reversal
Chart 1BRL/NZD At A Resistance Point
Higher Unemployment Is Coming, Says This Indicator
Higher Unemployment Is Coming, Says This Indicator
Chart 2Homebuilders Versus Healthcare Services Has Turned
Higher Unemployment Is Coming, Says This Indicator
Higher Unemployment Is Coming, Says This Indicator
Chart 3CNY/USD At A Potential Turning Point
Higher Unemployment Is Coming, Says This Indicator
Higher Unemployment Is Coming, Says This Indicator
Chart 4US REITS Are Oversold Versus Utilities
Higher Unemployment Is Coming, Says This Indicator
Higher Unemployment Is Coming, Says This Indicator
Chart 5CAD/SEK Is Vulnerable To Reversal
Higher Unemployment Is Coming, Says This Indicator
Higher Unemployment Is Coming, Says This Indicator
Chart 6Financials Versus Industrials Has Reversed
Higher Unemployment Is Coming, Says This Indicator
Higher Unemployment Is Coming, Says This Indicator
Chart 7The Outperformance Of Resources Versus Biotech Has Ended
Higher Unemployment Is Coming, Says This Indicator
Higher Unemployment Is Coming, Says This Indicator
Chart 8The Outperformance Of Resources Versus Healthcare Has Ended
Higher Unemployment Is Coming, Says This Indicator
Higher Unemployment Is Coming, Says This Indicator
Chart 9FTSE100 Outperformance Vs. Euro Stoxx 50 Is Vulnerable To Reversal
Higher Unemployment Is Coming, Says This Indicator
Higher Unemployment Is Coming, Says This Indicator
Chart 10Netherlands' Underperformance Vs. Switzerland Is Ending
Higher Unemployment Is Coming, Says This Indicator
Higher Unemployment Is Coming, Says This Indicator
Chart 11The Sell-Off In The 30-Year T-Bond At Fractal Fragility
Higher Unemployment Is Coming, Says This Indicator
Higher Unemployment Is Coming, Says This Indicator
Chart 12The Sell-Off In The NASDAQ Is Approaching Fractal Fragility
Higher Unemployment Is Coming, Says This Indicator
Higher Unemployment Is Coming, Says This Indicator
Chart 13Food And Beverage Outperformance Is Exhausted
Higher Unemployment Is Coming, Says This Indicator
Higher Unemployment Is Coming, Says This Indicator
Chart 14German Telecom Outperformance Vulnerable To Reversal
Higher Unemployment Is Coming, Says This Indicator
Higher Unemployment Is Coming, Says This Indicator
Chart 15Japanese Telecom Outperformance Vulnerable To Reversal
Higher Unemployment Is Coming, Says This Indicator
Higher Unemployment Is Coming, Says This Indicator
Chart 16The Strong Downtrend In The 18-Month-Out US Interest Rate Future Is Fragile
Higher Unemployment Is Coming, Says This Indicator
Higher Unemployment Is Coming, Says This Indicator
Chart 17The Strong Downtrend In The 3 Year T-Bond Is Fragile
Higher Unemployment Is Coming, Says This Indicator
Higher Unemployment Is Coming, Says This Indicator
Chart 18A Potential Switching Point From Tobacco Into Cannabis
Higher Unemployment Is Coming, Says This Indicator
Higher Unemployment Is Coming, Says This Indicator
Chart 19Biotech Is A Major Buy
Higher Unemployment Is Coming, Says This Indicator
Higher Unemployment Is Coming, Says This Indicator
Chart 20Norway's Outperformance Has Ended
Higher Unemployment Is Coming, Says This Indicator
Higher Unemployment Is Coming, Says This Indicator
Chart 21Cotton Versus Platinum Is At Risk Of Reversal
Higher Unemployment Is Coming, Says This Indicator
Higher Unemployment Is Coming, Says This Indicator
Chart 22Switzerland's Outperformance Vs. Germany Has Ended
Higher Unemployment Is Coming, Says This Indicator
Higher Unemployment Is Coming, Says This Indicator
Chart 23USD/EUR Is Vulnerable To Reversal
Higher Unemployment Is Coming, Says This Indicator
Higher Unemployment Is Coming, Says This Indicator
Chart 24The Outperformance Of MSCI Hong Kong Versus China Has Ended
Higher Unemployment Is Coming, Says This Indicator
Higher Unemployment Is Coming, Says This Indicator
Chart 25A Potential New Entry Point Into Petcare
Higher Unemployment Is Coming, Says This Indicator
Higher Unemployment Is Coming, Says This Indicator
Chart 26GBP/USD At A Potential Turning Point
Higher Unemployment Is Coming, Says This Indicator
Higher Unemployment Is Coming, Says This Indicator
Chart 27US Utilities Outperformance Vulnerable To Reversal
Higher Unemployment Is Coming, Says This Indicator
Higher Unemployment Is Coming, Says This Indicator
Dhaval Joshi Chief Strategist dhaval@bcaresearch.com Footnotes 1 Based on the nonfarm payrolls. 2 Rent of shelter also includes lodging away from home, but the two dominant components are rent of primary residence and owners’ equivalent rent of residences. Fractal Trading System Fractal Trades
Higher Unemployment Is Coming, Says This Indicator
Higher Unemployment Is Coming, Says This Indicator
Higher Unemployment Is Coming, Says This Indicator
Higher Unemployment Is Coming, Says This Indicator
6-Month Recommendations Structural Recommendations Closed Fractal Trades Indicators To Watch - Bond Yields Chart II-1Indicators To Watch - Bond Yields - Euro Area
Indicators To Watch - Bond Yields - Euro Area
Indicators To Watch - Bond Yields - Euro Area
Chart II-2Indicators To Watch - Bond Yields - Europe Ex Euro Area
Indicators To Watch - Bond Yields - Europe Ex Euro Area
Indicators To Watch - Bond Yields - Europe Ex Euro Area
Chart II-3Indicators To Watch - Bond Yields - Asia
Indicators To Watch - Bond Yields - Asia
Indicators To Watch - Bond Yields - Asia
Chart II-4Indicators To Watch - Bond Yields - Other Developed
Indicators To Watch - Bond Yields - Other Developed
Indicators To Watch - Bond Yields - Other Developed
Indicators To Watch - Interest Rate Expectations Chart II-5Indicators To Watch - Interest Rate Expectations
Indicators To Watch - Interest Rate Expectations
Indicators To Watch - Interest Rate Expectations
Chart II-6Indicators To Watch - Interest Rate Expectations
Indicators To Watch - Interest Rate Expectations
Indicators To Watch - Interest Rate Expectations
Chart II-7Indicators To Watch - Interest Rate Expectations
Indicators To Watch - Interest Rate Expectations
Indicators To Watch - Interest Rate Expectations
Chart II-8Indicators To Watch - Interest Rate Expectations
Indicators To Watch - Interest Rate Expectations
Indicators To Watch - Interest Rate Expectations
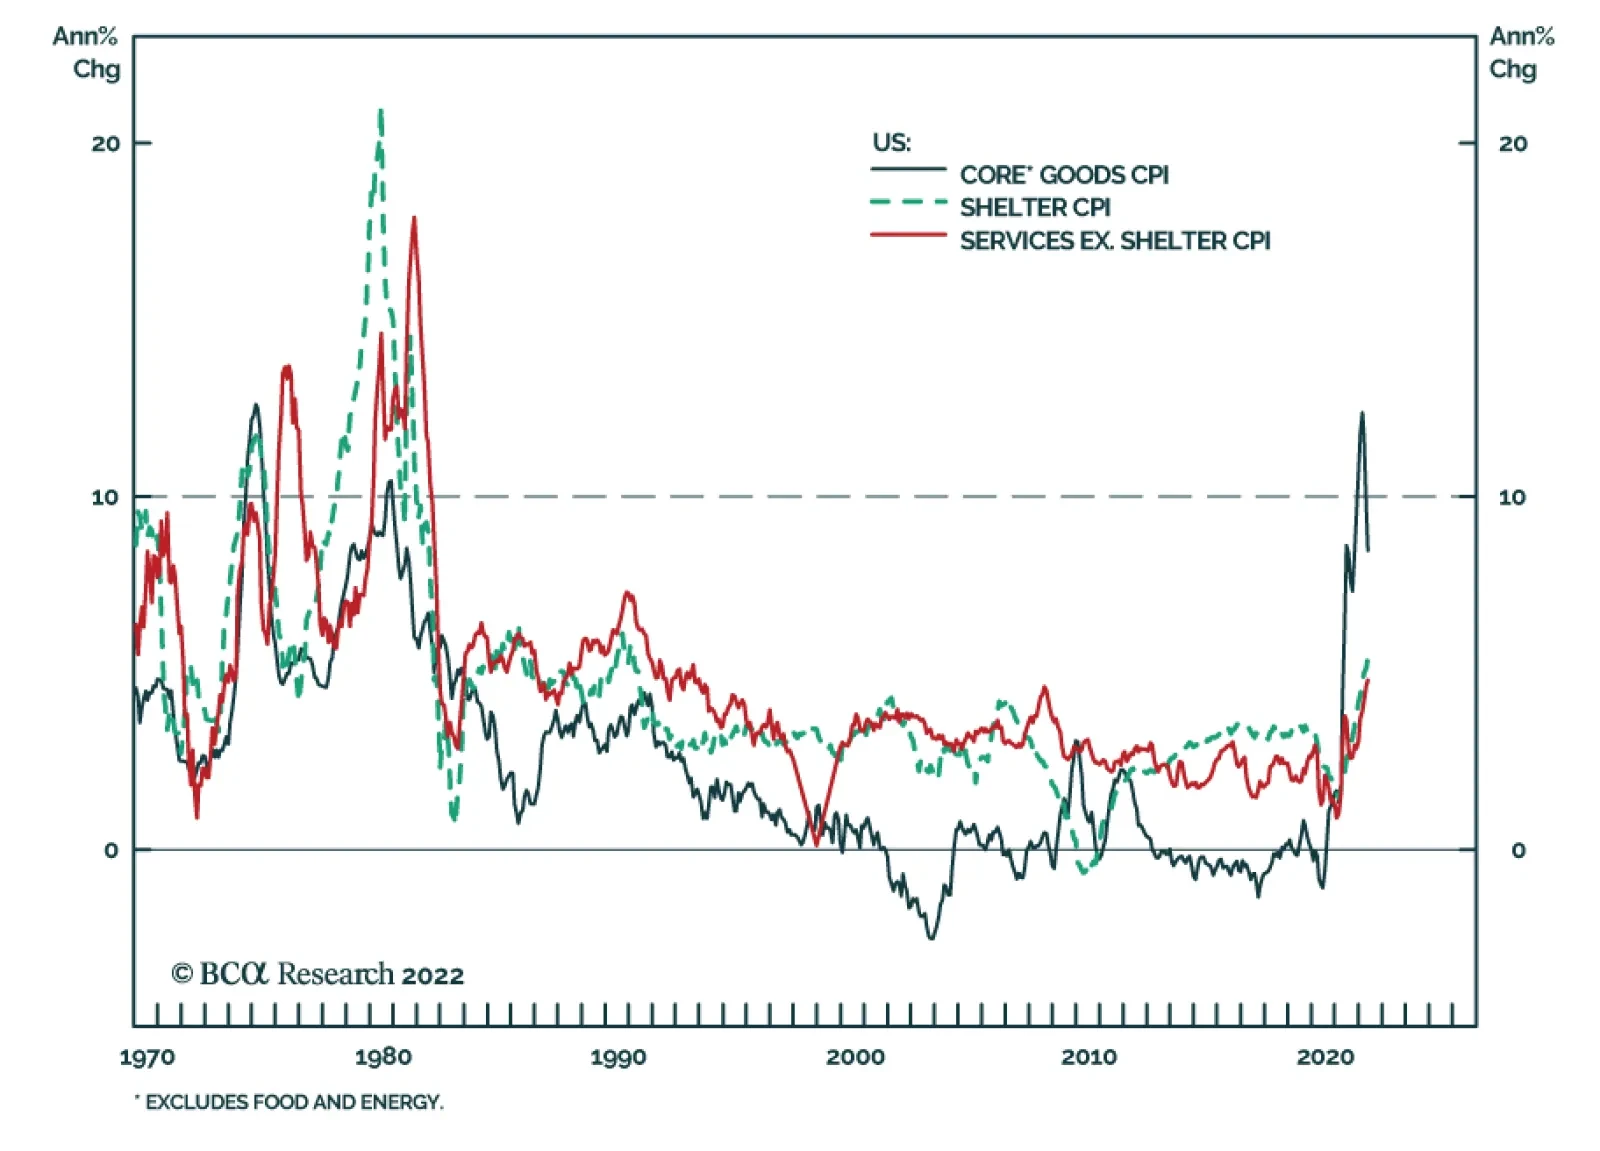
According to BCA Research’s US Bond Strategy service, inflation is still more likely to fall than rise during the next 6-12 months, and this will prevent the Fed from tightening more quickly than what is already priced in the yield curve. The big question…
Executive Summary Autocracy Hurts Productivity
Autocracy Hurts Productivity
Autocracy Hurts Productivity
Over the next six-to-18 months, the Xi Jinping administration will “let 100 flowers bloom” – i.e., relax a range of government policies to secure China’s economic recovery from the pandemic. The first signs of this policy are already apparent via monetary and fiscal easing and looser regulation of Big Tech. However, investors should treat any risk-on rally in Chinese stocks with skepticism over the long run. Political risk and policy uncertainty will remain high until after Xi consolidates power this fall. Xi is highly likely to remain in office but uncertainty over other personnel – and future national policy – will be substantial. Next year China’s policy trajectory will become clearer. But global investors should avoid mistaking temporary improvements for a change of Xi’s strategy or China’s grand strategy. Beijing is driven by instability and insecurity to challenge the US-led world order. The result will be continued economic divorce and potentially military conflicts in the coming decade. Russia’s reversion to autocracy led to falling productivity and poor equity returns. China is also reverting to autocratic government as a solution to its domestic challenges. Western investors should limit long-term exposure to China and prefer markets that benefit from China’s recovery, such as in Southeast Asia and Latin America.
Image
Bottom Line: The geopolitical risk premium in Chinese equities will stay high in 2022, fall in 2023, but then rise again as global investors learn that China in the Xi Jinping era is fundamentally unstable and insecure. Feature Chart 1Market Cheers China's Hints At Policy Easing
Market Cheers China's Hints At Policy Easing
Market Cheers China's Hints At Policy Easing
In 1957, after nearly a decade at the helm of the People’s Republic of China, Chairman Mao Zedong initiated the “Hundred Flowers Campaign.” The campaign allowed a degree of political freedom to try to encourage new ideas and debate among China’s intellectuals. The country’s innovative forces had suffered from decades of foreign invasion, civil war, and repression. Within three years, Mao reversed course, reimposed ideological discipline, and punished those who had criticized the party. It turned out that the new communist regime could not maintain political control while allowing liberalization in the social and economic spheres.1 This episode is useful to bear in mind in 2022 as General Secretary Xi Jinping restores autocratic government in China. In the coming year, Xi will ease a range of policies to promote economic growth and innovation. Already his administration is relaxing some regulatory pressure on Big Tech. Global financial markets are cheering this apparent policy improvement (Chart 1). In effect, Xi is preparing to let 100 flowers bloom. However, China’s economic trajectory remains gloomy over the long run – not least because the US and China lack a strategic basis for re-engagement. Chinese Leaders Fear Foreign Encroachments Mao’s predicament was not only one of ideology and historical circumstance. It was also one of China’s geopolitics. Chinese governments have always struggled to establish domestic control, extend that control over far-flung buffer territories, and impose limits on foreign encroachments. Mao reversed his brief attempt at liberalization because he could not feel secure in his person or his regime. In 1959, the Chinese economy remained backward. The state faced challenges in administration and in buffer spaces like Tibet and Taiwan. The American military loomed large, despite the stalemate and ceasefire on the Korean peninsula in 1952. Russia was turning against Stalinism, while Hungary was revolting against the Soviet Union. Mao feared that the free exchange of ideas would do more to undermine national unity than it would to promote industrialization and technological progress. The 100 flowers that bloomed – intellectuals criticizing government policy – revealed themselves to be insufficiently loyal. They could be culled, strengthening the regime. However, what followed was a failed economic program and nationwide famine. Fast forward to today, when circumstances have changed but the Chinese state faces the same geopolitical insecurities. Xi Jinping, like all Chinese rulers, is struggling to maintain domestic stability and territorial integrity while regulating foreign influence. Although the People’s Republic is not as vulnerable as it was in Mao’s time, it is increasingly vulnerable – namely, to a historic downshift in potential economic growth and a rise in international tensions (Chart 2). The Xi administration has repeatedly shown that it views the US alliance system, US-led global monetary and financial system, and western liberal ideology as threats that need to be counteracted. Chart 2China: Less Stable, Less Secure
China: Less Stable, Less Secure
China: Less Stable, Less Secure
In addition, Russia’s difficulties invading Ukraine suggest that China faces an enormous challenge in attempting to carve out its own sphere of influence without shattering its economic stability. Hence Beijing needs to slow the pace of confrontation with the West while pursuing the same strategic aims. Xi Stays, But Policy Uncertainty Still High In 2022 2022 is a critical political juncture for China. Xi was supposed to step down and hand the baton to a successor chosen by his predecessor Hu Jintao. Instead he has spent the past decade arranging to remain in power until at least 2032. He took a big stride toward this goal at the nineteenth national party congress in 2017, when he assumed the title of “core leader” of the Communist Party and removed term limits from its constitution. This year’s Omicron outbreak and abrupt economic slowdown have raised speculation about whether Xi’s position is secure. Some of this speculation is wild – but China is far less stable than it appears. Structurally, inequality is high, social mobility is low, and growth is slowing, forcing the new middle class to compromise its aspirations. Cyclically, unemployment is rising and the Misery Index is higher than it appears if one focuses on youth employment and fuel inflation (Chart 3). The risk of sociopolitical upheaval is underrated among global investors. Chart 3AStructurally China Is Vulnerable To Social Unrest
Will China Let 100 Flowers Bloom? Only Briefly.
Will China Let 100 Flowers Bloom? Only Briefly.
Chart 3BCyclically China Is Vulnerable To Social Unrest
Cyclically China Is Vulnerable To Social Unrest
Cyclically China Is Vulnerable To Social Unrest
Yet even assuming that social unrest and political dissent flare up, Xi is highly likely to clinch another five-to-ten years in power. Consider the following points: The top leaders control personnel decisions. The national party congress is often called an “election,” but that is a misnomer. The Communist Party’s top posts will be ratified, not elected. The Politburo and Politburo Standing Committee select the members of the Central Committee; the national party congress convenes to ratify these new members. The Central Committee then ratifies the line-up of the new Politburo and Politburo Standing Committee, which is orchestrated by Xi along with the existing Politburo Standing Committee (Diagram 1). Xi is the most important figure in deciding the new leadership. Diagram 1Mechanics Of The Chinese Communist Party’s National Congress
Will China Let 100 Flowers Bloom? Only Briefly.
Will China Let 100 Flowers Bloom? Only Briefly.
There is no history of surprise votes. The party congress ratifies approximately 90% of the candidates put forward. Outcomes closely conform to predictions of external analysts, meaning that the leadership selection is not a spontaneous, grassroots process but rather a mechanical, elite-driven process with minimal influence from low-level party members, not to mention the population at large.2 The party and state control the levers of power: The Communist Party has control over the military, state bureaucracy, and “commanding heights” of the economy. This includes domestic security forces, energy, communications, transportation, and the financial system. Whoever controls the Communist Party and central government exerts heavy influence over provincial governments and non-government institutions. The state bureaucracy is not in a position to oppose the party leadership. Xi has conducted a decade-long political purge (“anti-corruption campaign”). Upon coming to power in 2012, Xi initiated a neo-Maoist campaign to re-centralize power in his own person, in the Communist Party, and in the central government. He has purged foreign influence along with rivals in the party, state, military, business, civil society, and Big Tech. He personally controls the military, the police, the paramilitary forces, the intelligence and security agencies, and the top Communist Party organs. There may be opposition but it is not organized or capable. Chart 4China: Big Tech Gets Relief ... For Now
China: Big Tech Gets Relief ... For Now
China: Big Tech Gets Relief ... For Now
There are no serious alternatives to Xi’s leadership. Xi is widely recognized within China as the “core” of the fifth generation of Chinese leaders. The other leaders and their factions have been repressed. Xi imprisoned his top rivals, Bo Xilai and Zhou Yongkang, a decade ago. He has since neutralized their followers and the factions of previous leaders Hu Jintao and Jiang Zemin. Premier Li Keqiang has never exercised any influence and will retire at the end of this year. None of the ousted figures have reemerged to challenge Xi, but potential rivals have been imprisoned or disciplined, as have prominent figures that pose no direct political threat, such as tech entrepreneur Jack Ma (Chart 4). Additional high-level sackings are likely before the party congress. China’s reversion to autocracy grew from Communist Party elites, not Xi alone. China’s slowing potential GDP growth and changing economic model raise an existential threat to the Communist Party over the long run. The party recognized its potential loss of legitimacy back in 2012, the year Xi was slated to take the helm. The solution was to concentrate power in the center, promoting Maoist nostalgia and strongman rule. In essence, the party needed a new Mao; Xi was all too willing to play the part. Hence Xi’s current position does not rest on his personal maneuvers alone. The party has invested heavily in Xi and will continue to do so. Characteristics of the political elite underpin the autocratic shift. Statistics on the evolving character traits of Politburo members show the trend toward leaders that are more rural, more bureaucratic, and more ideologically orthodox, i.e. more nationalist and communist (Chart 5). This trend underpins the party’s behavior and Xi’s personal rule. Chart 5China: From Technocracy To Autocracy
Will China Let 100 Flowers Bloom? Only Briefly.
Will China Let 100 Flowers Bloom? Only Briefly.
Chart 6China: De-Industrialization Undermines Stability
China: De-Industrialization Undermines Stability
China: De-Industrialization Undermines Stability
Xi has guarded his left flank. By cornering the hard left of the political spectrum Xi has positioned himself as the champion of poor people, workers, farmers, soldiers, and common folk. This is the political base of the Communist Party, as opposed to the rich coastal elites and westernizing capitalists, who stand to suffer from Xi’s policies. Ultimately de-industrialization – e.g. the sharp decline in manufacturing and construction sectors (Chart 6) – poses a major challenge to this narrative. But social unrest will be repressed and will not overturn Xi or the regime anytime soon. Xi still retains political capital. After centuries of instability, Chinese households are averse to upheaval, civil war, and chaos. They support the current regime because it has stabilized China and made it prosperous. Of course, relative to the Hu Jintao era, Xi’s policies have produced slower growth and productivity and a tarnished international image (Chart 7). But they have not yet led to massive instability that would alienate the people in general. If Chinese citizens look abroad, they see that Xi has already outlasted US Presidents Obama and Trump, is likely to outlast Biden, and that US politics are in turmoil. The same goes for Europe, Japan, and Russia – Xi’s leadership does not suffer by comparison. Chart 7China’s Declining International Image
Will China Let 100 Flowers Bloom? Only Briefly.
Will China Let 100 Flowers Bloom? Only Briefly.
External actors are neither willing nor able to topple Xi. Any outside attempt to interfere with China’s leadership or political system would be unwarranted and would provoke an aggressive response. The US is internally divided and has not developed a consistent China policy. This year the Biden administration has its hands full with midterm elections, Russia, and Iran, where it must also accept the current leadership as a fact of life. It has no ability to prevent Xi’s power consolidation, though it will impose punitive economic measures. Japan and other US allies have an interest in undermining Xi’s administration, but they follow the US’s lead in foreign policy. They also lack influence over the political rotation within the Communist Party. The Europeans will keep their distance but will not try to antagonize China given their more pressing conflict with Russia. Russia needs China more than ever and will lend material support in the form of cheaper and more secure natural resources. North Korean and Iranian nuclear provocations will help Xi stay under the radar. There is no reason to expect a new leader to take over in China. The Xi administration’s strategy, revealed over the past ten years, will remain intact for another five-to-ten years at least. The real question at the party congress is whether Xi will be forced to name a successor or compromise with the opposing faction on the personnel of the Politburo and Politburo Standing Committee. But even that remains to be seen – and either way he will remain the paramount leader. Bottom Line: Xi Jinping has the political capability to cement another five-to-ten years in power. Opposing factions have been weakened over the past decade by Xi’s domestic political purge and clash with the United States. China is ripe for social unrest and political dissent but these will be repressed as China goes further down the path of autocracy. Foreign powers have little influence over the process. Policy Uncertainty Falls In 2023 … Only To Rise Again What will Xi Jinping do once he consolidates power? Xi’s administration has weighed heavily on China’s economy, foreign relations, and financial markets. The situation has worsened dramatically this year as the economy struggles with “A Trifecta Of Economic Woes” – namely a rampant pandemic, waning demand for exports, and a faltering housing market (Chart 8). In response the administration is now easing a range of policies to stabilize expectations and try to meet the 5.5% annual growth target. The money impulse, and potentially the credit impulse, is turning less negative, heralding an eventual upturn in industrial activity and import volumes in 2023. These measures will give a boost to Chinese and global growth, although stimulus measures are losing effectiveness over time (Chart 9). Chart 8China's Trifecta Of Economic Woes
China's Trifecta Of Economic Woes
China's Trifecta Of Economic Woes
Chart 9More Stimulus, But Less Effectiveness
More Stimulus, But Less Effectiveness
More Stimulus, But Less Effectiveness
This pro-growth policy pivot will continue through the year and into next year. After all, if Xi is going to stay in power, he does not want to bequeath himself a financial crisis or recession at the start of his third term. Still, investors should treat any rally in Chinese equity markets with skepticism. First, political risk and uncertainty will remain elevated until Xi completes his power grab, as China is highly susceptible to surprises and negative political incidents this year (Chart 10). For example, if social unrest emerges and is repressed, then the West will impose sanctions. If China increases its support of Russia, Iran, or North Korea, then the US will impose sanctions. Chart 10China: Policy Uncertainty And Geopolitical Risk To Stay High In 2022, Might Improve In 2023
China: Policy Uncertainty And Geopolitical Risk To Stay High In 2022, Might Improve In 2023
China: Policy Uncertainty And Geopolitical Risk To Stay High In 2022, Might Improve In 2023
Chart 11China Needs To Court Europe
China Needs To Court Europe
China Needs To Court Europe
The regime will be extremely vigilant and overreact to any threats this year, real or perceived. Political objectives will remain paramount, above the economy and financial markets, and that means new economic policy initiatives will not be reliable. Investors cannot be confident about the country’s policy direction until the leadership rotation is complete and new policy guidance is revealed, particularly in December 2022 and March 2023. Second, after consolidating power, investors should interpret Xi’s policy shift as “letting 100 flowers bloom,” i.e., a temporary relaxation that aims to reboot the economy but does not change the country’s long-term policy trajectory. Economic reopening is inevitable after the pandemic response is downgraded – which is a political determination. Xi will also be forced to reduce foreign tensions for the sake of the economy, particularly by courting Europe, which is three times larger than Russia as a market (Chart 11). However, China’s declining labor force and high debt levels prevent its periodic credit stimulus from generating as much economic output as in the past. And the administration will not ultimately pursue liberal structural reforms and a more open economy. That is the path toward foreign encroachment – and regime insecurity. The US’s sanctions on Russia have shown the consequences of deep dependency on the West. China will continue diversifying away from the US. And, as we will see, the US cannot provide credible promises that it will reduce tensions. US-China: Re-Engagement Will Fail The Biden administration is focused on fighting inflation ahead of the midterm elections. But its confrontation with Russia – and likely failure to freeze Iran’s nuclear program – increases rather than decreases oil supply constraints. Hence some administration officials and outside observers argue that the administration should pursue a strategic re-engagement with China.3 Theoretically a US-China détente would buy both countries time to deal with their domestic politics by providing some international stability. Improved US-China relations could also isolate Russia and hasten a resolution to the war in Ukraine, potentially reducing commodity price pressures. In essence, a US-China détente would reprise President Richard Nixon’s outreach to China in 1972, benefiting both countries at the expense of Russia.4 This kind of Kissinger 2.0 maneuver could happen but there are good reasons to think it will not, or if it does that it will fall apart in one or two years. In 1972, China had nowhere near the capacity to deny the US access to the Asia Pacific region, expel US influence from neighboring countries, reconquer Taiwan, or project power elsewhere. Today, China is increasingly gaining these abilities. In fact it is the only power in the world capable of rivaling the US in both economic and military terms over the long run (Chart 12). Secretary of State Antony Blinken recently outlined the Biden administration’s China policy and declared that China poses “the most serious long-term challenge” to the US despite Russian aggression.5 Chart 12US-China Competition Sows Distrust, Drives Economic Divorce
Will China Let 100 Flowers Bloom? Only Briefly.
Will China Let 100 Flowers Bloom? Only Briefly.
While another decade of US engagement with China would benefit the US economy, it would be far more beneficial to China. Crucially, it would be beneficial in a strategic sense, not just an economic one. It could provide just the room for maneuver that China needs – at this critical juncture in its development – to achieve technological and productivity breakthroughs and escape the middle-income trap. Another ten-year reprieve from direct American competition would set China up to challenge the US on the global stage. That would be far too high of a strategic price for America to pay for a ceasefire in Ukraine. Ukraine has limited strategic value for the US and it does not steer US grand strategy, which aims to prevent regional empires from taking shape. In fact Washington is deliberately escalating and prolonging the war in Ukraine to drain Russia’s resources. Ending the war would do Russia a strategic favor, while re-engaging with China would do China a strategic favor. So why would the defense and intelligence community advise the Biden administration to pursue Kissinger 2.0? Chart 13US Unlikely To Revoke Trump Tariffs
US Unlikely To Revoke Trump Tariffs
US Unlikely To Revoke Trump Tariffs
Biden could still pursue some degree of détente with China, namely by repealing President Trump’s trade tariffs, in order to relieve price pressures ahead of the midterm election. Yet even here the case is deeply flawed. Trump’s tariffs on China did not trigger the current inflationary bout. That was the combined Trump-Biden fiscal stimulus and Covid-era supply constraints. US import prices are rising faster from the rest of the world than they are from China (Chart 13). Tariff relief would not change China’s Zero Covid policy, which is the current driver of price spikes from China. And while lifting tariffs on China would not reduce inflation enough to attract voters, it would cost Biden some political credit among voters in swing states like Pennsylvania, and across the US, where China’s image has plummeted in the wake of Covid-19 (Chart 14). Chart 14US Political Consensus Remains Hawkish On China
Will China Let 100 Flowers Bloom? Only Briefly.
Will China Let 100 Flowers Bloom? Only Briefly.
If Biden did pursue détente, would China be able to reciprocate and offer trade concessions? Xi has the authority to do so but he is unlikely to make major trade concessions prior to the party congress. Economic self-sufficiency and resistance to American pressure have become pillars of his support. Promises will not ease inflation for US voters in November and Xi has no incentive to make binding concessions because the next US administration could intensify the trade war regardless. Bottom Line: The US has no long-term interest, and a limited short-term interest, in easing pressure on China’s economy. Continued US pressure, combined with China’s internal difficulties, will reinforce Xi Jinping’s shift toward nationalism and hawkish foreign policy. Hence there is little basis for a substantial US-China re-engagement that improves the global macroeconomic environment over the coming years. Investment Takeaways Chart 15Autocracy Hurts Productivity
Autocracy Hurts Productivity
Autocracy Hurts Productivity
Xi Jinping will clinch another five-to-ten years in power this fall. To stabilize the economy, he will “let 100 flowers bloom” and ease monetary, fiscal, regulatory, and social policy at home. He will also court the West, especially Europe, for the sake of economic growth. However, he will not go so far as to compromise his ultimate aims: self-sufficiency at home and a sphere of influence abroad. The result will be a relapse into conflict with the West within a year or two. Ultimately a closed Chinese economy in conflict with the West will result in lower productivity, a weaker currency, a high geopolitical risk premium, and low equity returns – just as it did for Russia (Chart 15). Any short-term improvement in China’s low equity multiples will ultimately be capped. Over the long run, western investors should hedge against Chinese geopolitical risk by preferring markets that benefit from China’s periodic stimulus yet do not suffer from the break-up of the US-China and EU-Russia economic relationships, such as key markets in Latin America and Southeast Asia (Charts 16 & 17). Chart 16China Stimulus Creates Opportunity For … Latin America
China Stimulus Creates Opportunity For ... Latin America
China Stimulus Creates Opportunity For ... Latin America
Chart 17China Stimulus Creates Opportunity For … Southeast Asia
China Stimulus Creates Opportunity For ... Southeast Asia
China Stimulus Creates Opportunity For ... Southeast Asia
Matt Gertken Chief Geopolitical Strategist mattg@bcaresearch.com Footnotes 1 Modern scholarship has shown that Mao intended to entrap the opposition through the 100 Flowers Campaign. For a harrowing account of this episode, see Jung Chang and Jon Halliday, Mao: The Unknown Story (New York: Anchor Books, 2006), pp. 409-17. 2 “At least 8% of CPC Central Committee nominees voted off,” Xinhua, October 24, 2017, english.www.gov.cn. 3 Christopher Condon, “Yellen Says Biden Team Is Looking To ‘Reconfigure’ China Tariffs,” June 8, 2022, www.bloomberg.com. 4 Niall Ferguson, “Dust Off That Dirty Word Détente And Engage With China,” Bloomberg, June 5, 2022, www.bloomberg.com. 5 See Antony J Blinken, Secretary of State, “The Administration’s Approach to the People’s Republic of China,” George Washington University, Washington D.C., May 26, 2022, state.gov. Additionally, see President Joe Biden’s third assertion of US willingness to defend Taiwan against China, in a joint press conference with Japan’s Prime Minister Kishida Fumio, “Remarks by President Biden and Prime Minister Kishida Fumio of Japan in Joint Press Conference,” Akasaka Palace, Tokyo, Japan, May 23, 2022, whitehouse.gov.
Executive Summary Singapore stocks are at risk as an impending contraction in global trade will hurt this very open economy and its markets. The country’s foreign reserves are already shrinking as the balance of payments has slid into deficit. The Monetary Authority of Singapore’s (MAS) attempts to rein in inflation by pushing up the currency is also causing foreign reserves to contract, and local money supply to decelerate sharply. Inflationary pressures in Singapore are not entrenched and will soon subside. Wage growth is under control, and unit labor cost increases are subdued. Singapore’s export competitiveness remains robust; yet that does not preclude it from a period of shrinking exports over the next 6-12 months. Falling exports, shrinking foreign reserves, decelerating money supply and peaking inflation will dissuade MAS from pushing up the Singapore dollar much higher from current levels. Manufacturing Cycles Dictate The Performance Of Singapore Stocks
Manufacturing Cycles Dictate The Performance Of Singapore Stocks
Manufacturing Cycles Dictate The Performance Of Singapore Stocks
Recommendation Inception Date RETURN Downgrade Singapore stocks from overweight to neutral May 10, 2021 2.3% Bottom Line: Equity investors should reduce their exposure to Singapore stocks in EM and Asian portfolios by downgrading their allocation from overweight to neutral. Absolute return investors should wait for a better entry point. Feature Chart 1Singapore Stocks' Outperformance Is Set To Take A Breather
Singapore Stocks' Outperformance Is Set To Take A Breather
Singapore Stocks' Outperformance Is Set To Take A Breather
Like most global markets, Singapore stocks have sold off materially since early this year. Relative to EM and Asian counterparts, however, they have fared well – in line with our call back in May 2021 when we upgraded this bourse to overweight (Chart 1). The question is, given the changing macro backdrop − where a whiff of stagflation has permeated global investment landscapes – what should investors now do about this market? We believe that higher inflation in Singapore is a temporary phenomenon and will subside sooner rather than later. Contracting global trade, on the other hand, is a much more vital risk for this very open economy and its equity markets; and is a reason to downgrade this bourse. Indeed, Singapore stocks in absolute US dollar terms face more downside over the next several months. Relative to its EM and Asian counterparts also, this bourse’s outperformance is likely to take a breather. Asian and EM equity portfolios would therefore do well to downgrade this market by a notch from overweight to neutral in EM and Asian equity baskets. Absolute return investors should stay on the sidelines for now. Unfavorable Settings Contracting global trade and tightening liquidity will weigh on Singapore stocks in the months ahead. Global trade volumes will fall as developed countries’ demand for goods (ex-auto) shrinks following the pandemic-era binge. Chinese growth will also likely be struggling to recover. What this means is that both global manufacturing and exports are heading towards a contraction. As a very open economy where goods exports make up 115% of GDP (and services exports another 55%), manufacturing and exports of goods drive income for the entire Singaporean economy and influence its stock market cycles. Chart 2 shows how ebbs and flows in manufacturing new orders dictate Singapore’s equity market performances. Chart 2Manufacturing Cycles Dictate The Performance Of Singapore Stocks
Manufacturing Cycles Dictate The Performance Of Singapore Stocks
Manufacturing Cycles Dictate The Performance Of Singapore Stocks
The performances of financial and real estate stocks, which make up two-thirds of the MSCI Singapore index, are also highly dependent on business cycles − which in turn, are driven by swings in manufacturing and exports (Chart 3). One reason for that is, at 23% of GDP, manufacturing is the single largest sector in the economy. By comparison, finance and insurance make up 14% of the nation’s output, and real estate 3%. Any acceleration or deceleration in manufacturing activity therefore has a strong impact on the performance of tertiary sectors, including those of banking and real estate. In addition, MAS’ tightening is causing local money supply to decelerate (discussed in more detail later). Slower money growth is never bullish for stock prices (Chart 4). Chart 3Banks And Real Estate Stocks Also Move With Manufacturing And Exports
Banks And Real Estate Stocks Also Move With Manufacturing And Exports
Banks And Real Estate Stocks Also Move With Manufacturing And Exports
Chart 4Decelerating Money Supply Is A Bad Omen For Share Prices
Decelerating Money Supply Is A Bad Omen For Share Prices
Decelerating Money Supply Is A Bad Omen For Share Prices
In sum, given the changing global macro backdrop of slowing manufacturing and trade, and elevated US inflation, Singapore stocks have not yet found a sustainable bottom in absolute terms. Relative to their EM counterparts, Singapore’s outperformance could also take a breather. During periods of weakening global trade and manufacturing, Singapore stocks usually do poorly relative to their EM peers. The top panel of Chart 5 shows US manufacturing PMI new orders as decelerating rapidly. Periods of falling and/or sub-50 PMI prints usually herald Singapore stocks’ underperformance relative to EM, with a few months lag. Singapore’s own new export orders are also about to slip into contraction territory. If history is any guide, this too entails a period of underperformance of this bourse versus EM going forward (Chart 5, bottom panel). Is Inflation Genuine In Singapore? The short answer is no; there is little genuine inflation in Singapore. The country is not witnessing any wage-price spiral either, unlike in the US. What we see there instead is just a one-off surge in inflation. Average monthly wages in Singapore have accelerated in the past year but are not out of line when compared to the past 20 years (Chart 6, top panel). Chart 5Weakening Manufacturing Orders Foreshadow Singapore Equities' Underperformance
Weakening Manufacturing Orders Foreshadow Singapore Equities' Underperformance
Weakening Manufacturing Orders Foreshadow Singapore Equities' Underperformance
Chart 6Limited Wage Growth And Subdued Unit Labor Costs Will Rein In Inflationary Pressures
Limited Wage Growth And Subdued Unit Labor Costs Will Rein In Inflationary Pressures
Limited Wage Growth And Subdued Unit Labor Costs Will Rein In Inflationary Pressures
A controlled rise in wages has helped keep Singaporean firms’ unit labor costs (ULCs) in check. The middle panel of Chart 6 shows ULCs for the overall economy vis-à-vis the consumer price index. ULCs are much below pre-pandemic levels. This happens to be the case even in the service sector of the economy where productivity gains are much harder to achieve. In the goods producing sector, where productivity gains are relatively easier to achieve, ULCs have remained particularly low (Chart 6, bottom two panels). What this means is that firms are facing little wage-related cost pressures. They are, therefore, less likely to pass it on to customers via higher selling prices. That, in turn, will help cap inflationary pressures in the economy. Chart 7Sharply Slowing Money Growth Points To Peaking Inflation
Sharply Slowing Money Growth Points To Peaking Inflation
Sharply Slowing Money Growth Points To Peaking Inflation
In fact, much of the recent rise in headline and core consumer inflation in Singapore has had to do with the explosive money growth seen during the pandemic. Both narrow (M1) and broad money (M3) growth rates in Singapore accelerated in 2020 to levels not seen since the Global Financial Crisis of 2008-09. Inflation usually follows money growth with several months lag, and this time was no different. That said, both measures of money have since decelerated markedly this year. This will rein in inflationary pressures going forward (Chart 7). Looking forward, money supply itself will likely decelerate further in the months ahead. A critical reason for that is the manner in which the central bank (MAS) uses the currency to achieve its monetary policy objectives (i.e., to maintain price stability). When inflation rises, MAS typically guides the trade-weighted Singapore dollar to appreciate, in an attempt to rein in inflation. In so doing, MAS buys local currency and sells foreign currency. This reduces local liquidity and money supply. Chart 8 shows that MAS is indeed guiding the Singapore dollar up: the trade weighted currency has risen by over 3% in the past six months tracking inflation. Not surprisingly, money growth in Singapore has decelerated meaningfully. In time, that will help pull inflation lower. There was an external factor too. In the past couple of years, the country had witnessed a massive improvement in its balance of payments (BoP). It skyrocketed from a minus 3% of GDP in 2019 to a plus 27% in 2021. To prevent the currency from surging, the central bank had resorted to a rapid accumulation of foreign reserves. As MAS pumped local currency into the system while purchasing foreign currencies, local money supply boomed (Chart 9). Chart 8In Order To Check Inflation, The MAS Has Pushed The Singapore Dollar Up...
In Order To Check Inflation, The MAS Has Pushed The Singapore Dollar Up...
In Order To Check Inflation, The MAS Has Pushed The Singapore Dollar Up...
Chart 9...Causing Foreign Reserves To Drop, And Money Supply To Decelerate Materially
...Causing Foreign Reserves To Drop, And Money Supply To Decelerate Materially
...Causing Foreign Reserves To Drop, And Money Supply To Decelerate Materially
Chart 10The Trade Surplus Will Narrow, Putting More Pressure On The Balance Of Payments
The Trade Surplus Will Narrow, Putting More Pressure On The Balance Of Payments
The Trade Surplus Will Narrow, Putting More Pressure On The Balance Of Payments
But the tide has turned this year. The trade surplus has rolled over and will continue to shrink as global trade is set to weaken further this year as explained above. As such, Singapore’s current account surplus will also likely roll over. The capital account has already slipped back into massive deficits; so has the BoP (Chart 10). The upshot is that foreign reserves have begun to contract. This means MAS is now selling foreign reserves to buy back local currency. This is causing a deceleration in local money supply (Chart 9, above). In sum, the absence of meaningful wage pressures, a decelerating money supply, and a strengthening currency will help Singapore see its inflation ease sooner than in the US. Can Singapore Withstand A Stronger Currency? As discussed above, Singapore’s monetary policy entails tackling higher inflation by letting the Singapore dollar appreciate in nominal terms. But given the high inflation prints, an appreciating currency would mean that it gets even stronger in real terms (i.e., in inflation-adjusted terms). An expensive currency in real terms could erode competitiveness. So, the question is, can the Singapore economy withstand a stronger currency? The short answer is yes. Chart 11 shows that while the Singapore dollar has appreciated to new highs in nominal trade weighted terms, in real terms (ULC-based) it remains at around 15-year lows. As such, currency competitiveness should not be an issue anytime soon. Notably, real exchange rates calculated using ULCs are more representative of currency competitiveness than the use of consumer prices allows. The reason is that employee compensation is a major component of any company’s overall cost structure; and therefore, ULCs matter for a company much more directly than do consumer prices. The very low levels of the ULC-based real exchange rate indicates that the Singapore dollar is still very competitive. Indeed, Singapore’s export volumes have been on an upward trend relative to global exports (Chart 12). Chart 11The Singapore Dollar Remains A Highly Competitive Currency
The Singapore Dollar Remains A Highly Competitive Currency
The Singapore Dollar Remains A Highly Competitive Currency
Chart 12Singapore Is Grabbing Export Market Share From The Rest Of The World
Singapore Is Grabbing Export Market Share From The Rest Of The World
Singapore Is Grabbing Export Market Share From The Rest Of The World
Notably, Singapore continues to attract a very high amount of FDI. This will help raise productivity going forward, thereby keeping ULCs in check down the line. All that said, strong competitiveness (i.e., the ability to maintain global market share) does not preclude Singapore from experiencing a drop in its export revenues over the next 6-to-12 months. The reason is faltering goods demand in the US and Europe after a pandemic-era overconsumption. Falling exports, in turn, will lead to shrinking foreign reserves, decelerating money supply, and finally slowing growth and inflation. This will discourage MAS from pushing the Singapore dollar much higher from current levels. As Chart 11 showed, the Singaporean currency is already at an all-time high in trade-weighted terms. The rally in the trade-weighted Singapore dollar is therefore in late stages. Investment Recommendations Chart 13The Singapore Dollar's Outperformance Vesus Other Asian Currencies Is Late
The Singapore Dollar's Outperformance Vesus Other Asian Currencies Is Late
The Singapore Dollar's Outperformance Vesus Other Asian Currencies Is Late
Singapore stocks, with a P/E ratio of 21.5, have become relatively expensive vis-à-vis their EM (13.1) and Asian (14.1) counterparts. In terms of the price-to-book value ratio however, they are not expensive. Considering all, we recommend that investors reduce their exposure to Singapore stocks in EM and Asian equity portfolios by downgrading their allocation from overweight to neutral. Our overweight stance since May 10, 2021, has yielded a gain of 2.3% so far. Absolute return investors should wait for a better entry point. The depreciation of the Singapore dollar vis-à-vis the US dollar likely has some more room given the impending deterioration in global trade. But the latter will also soon check the appreciation of the Singapore dollar versus other Asian currencies − as MAS will be dissuaded from guiding the currency up in view of peaking domestic inflation and shrinking trade (Chart 13). Rajeeb Pramanik Senior EM Strategist rajeeb.pramanik@bcaresearch.com