Financial Markets

BCA Research is proud to announce a new feature to help clients get the most out of our research: an Executive Summary cover page on each of the BCA Research Reports. We created these summaries to help you quickly capture the main points of each report through an at-a-glance read of key insights, chart of the day, investment recommendations and a bottom line. For a deeper analysis, you may refer to the full BCA Research Report. Executive Summary The Software and Services Industry is undergoing a fundamental transformation in its business model catalyzed by a momentous migration of software applications to the cloud and broad-based digitization of the economy. This shift is accompanied by displacement of the traditional on-prem license and support model with a more lucrative cloud-based subscription model. While on-prem software sales are contracting, cloud revenue is growing in double digits. As a result, the industry enjoys spectacular margins and earnings growth. Its earnings have also proven to be resilient across the business cycle because software and IT services increase companies’ productivity in good times and bad. Rising rates are a headwind, but a temporary one. Margins Will Continue To Expand
Margins Are To Continue Expanding
Margins Are To Continue Expanding
Bottom Line: The Software and Services industry group is an all-weather industry with resilient earnings and strong growth throughout the business cycle. It is also in the epicenter of technological innovation: Migration to the cloud and digital transformation enhance the industry’s growth and profitability. We continue recommending both a tactical and a structural overweight. Feature Performance Technology stocks found themselves in the eye of this month’s market rout. After falling 19% from its peak, the NASDAQ is now firmly in correction territory. The Technology sector is down 11%, while the Software and Services industry group is down 10% (Chart 1). In the “Are We There Yet?” report published last week, we posited that it is not yet the right time to bottom fish: While the Technology sector appears oversold, macroeconomic headwinds from the imminent monetary tightening and a slowdown in demand for technology goods and services may prolong the pain. The interplay of valuations and fundamentals for the sector is not yet favorable. While we are underweight the Technology sector, thanks to our underweight positions in Semiconductors and Hardware and Equipment, we remain overweight Software and Services (S&S). In this report, we will conduct a “deep dive” into S&S and reevaluate our positioning (Table 1). Although S&S is down more than 10% from the peak, it has outperformed the S&P 500 by 88% since 2011 (Chart 2). The million-dollar question we will try to answer is whether this outperformance continues over the tactical and structural time horizons. Chart 1Software And Services Outperformed Other Tech Industries
Software And Services: On The Seventh Cloud
Software And Services: On The Seventh Cloud
Chart 2S&S Outperformed The S&P 500 By 88% Over The Past 10 Years
S&S Outperformed The S&P 500 By 88% Over The Past 10 Years
S&S Outperformed The S&P 500 By 88% Over The Past 10 Years
Table 1Performance
Software And Services: On The Seventh Cloud
Software And Services: On The Seventh Cloud
Sneak Preview: We maintain our overweight of the Software and Services sector thanks to positive market trends, the all-weather nature of the industry, and resilient earnings. Industry Group Composition The Software And Services Industry Group Is Top Heavy The S&P 500 Software and Services industry group is the largest in the Technology sector and is 48% of the sector market cap. The industry group is split between Software, which is about two-thirds of its market cap, and IT Services, which is one-third (Chart 3). Just like other technology industries, it is dominated by one of the FAANGs+M, Microsoft in this case, which makes up 42% of the industry group index weight. The top 10 constituents out of 36 comprise 80% of the industry’s weight (Table 2). During the current pullback, the S&S industry group has fallen by more than 10%, cushioned by the performance of its larger players. But this masks the pain of the smaller and less profitable constituents, which have fallen by more than 30% (Chart 4). Chart 3Software Dwarfs IT Services
Software And Services: On The Seventh Cloud
Software And Services: On The Seventh Cloud
Chart 4Some Smaller Constituents Have Fallen More Than 15% YTD
Software And Services: On The Seventh Cloud
Software And Services: On The Seventh Cloud
Table 2S&S Industry Is Dominated By A Handful Of Successful Companies
Software And Services: On The Seventh Cloud
Software And Services: On The Seventh Cloud
However, market dominance runs much deeper than just market capitalization: Microsoft, Adobe, Salesforce, and Oracle account for 87% of the Software Industry revenue, while Visa, Mastercard, Accenture, and PayPal generate 42% of the IT Services industry revenue. Larger industry players are also more profitable thanks to the high operating leverage the industry enjoys. Clearly, just a few companies drive sales and earnings growth, valuations, and performance. On the bright side, these are some of the most successful US technology companies, and their size is their competitive moat. We believe that the industry group is in “good hands.” Key Trends Cloud Migration Following the success of offshoring the US manufacturing base to China that allowed corporations to reduce labor costs, companies are now experimenting with outsourcing other key infrastructure elements. This time, however, the migration is happening to digital cloud platforms. Instead of investing in pricey servers and other hardware assets, corporations have the choice of going with Software-as-a-Service (SaaS), Platform-as-a-Service (PaaS), or Infrastructure-as-a-Service (IaaS) solutions offered by the tech titans. Not only are cloud solutions more cost-effective, but they also offer the convenience and flexibility to scale corporate hardware infrastructure by simply purchasing more or less computational power. COVID-19 lockdowns and the migration of the white-collar workforce towards remote work have motivated companies to transition their technology and operations to the cloud, and have acted as a catalyst for “digital offshoring.” Digital Transformation Digital transformation is in many ways similar to cloud migration. Essentially, it represents broader software penetration into the US economy. Whether it is a manufacturing production or customer relationship management process, wider adoption of software allows for a more efficient business solution via automation and process optimization. Airbnb and Uber are the poster children of digital transformation. While some industries have already undergone digital transformation, there are notable areas which lag behind. For instance, banks’ failure to modernize their digital infrastructure to speed up transactions and to increase overall user convenience has arguably led to the development of the crypto space as an alternative to the slow-evolving traditional financial institutions. The broader implication is that there are still major sectors in the economy that are yet to ramp up automation and increase efficiencies via digital transformation, meaning that there is a healthy demand pipeline for the tech companies. Types Of Software And Services Companies Software: Migration To The Cloud Is A Key Driver Of Growth In the past, classifying software companies was a relatively straightforward exercise: They were divided into system software vs. application software. System software included such categories as operating systems for PCs, and other hardware and database software. Application software covered Enterprise Resource Planning (ERP), Customer Relationship Management (CRM), Communications and Collaborations, etc. However, over time, the industry landscape has changed, first by the mergers that blurred the distinction across these lines, and lately, thanks to ubiquitous migration to the cloud model and digitization of the economy. Therefore, it is most practical to classify software companies by their type of business model, i.e., legacy license and support model, or cloud-based, or hybrid. Pure cloud-first: These companies derive 100% of their sales from the cloud model – Salesforce.com (CRM), ServiceNow (Now), and Twilio (TWLO) are among the biggest winners. Cloud/license hybrid: These are companies that derive 50%+ of their sales from the cloud, such as Microsoft (MSFT), Atlassian (TEAM), Autodesk (ADSK), and Adobe (ADBE). Legacy license and support model (aka On-Premises): Constellation Software (CSU), Citrix Systems (CTSX) – these companies are likely to struggle to grow organically. Types Of Cloud Application Services The cloud-based business model in turn can be classified under three different types of service: Software-as-a-Service (SaaS), Infrastructure-as-a-Service (IaaS), or Platform-as-a-Service (PaaS). Software-as-a-Service: Customers configure and access a web-based application operated by a SaaS provider over the internet. Salesforce.com, Workday (DAY), ServiceNow, and Oracle are some of the most established players. Infrastructure-as-a-Service: This service gives customers access to virtual storage and servers over the internet, enabling them to develop and run any application just as if it were running in their own data center. Amazon’s AWS, Microsoft’s Azure, and IBM are the key competitors in this space. Platform-as-a-Service: This service occupies a middle ground between SaaS and IaaS, i.e. between a full-fledged app that can be used “out-of-the-box” and a “raw server and storage” instance, making the customer responsible for installing and configuring its own “full stack.” PaaS offerings tend to be less standardized. Salesforce.com, Microsoft, and Oracle are the leaders. IDC projects the continued strength of this segment and expects it to grow at an annualized rate of 29.7% over the next five years. The following table from Microsoft presents a perfect explanation of the different software service models (Table 3). Table 3Differences In Cloud Computing Service Models
Software And Services: On The Seventh Cloud
Software And Services: On The Seventh Cloud
License And Support Vs. Cloud Subscription Model Growth Rates Broad-based migration to the cloud is shifting the industry’s revenue composition, with accelerating bifurcation between cloud and on-prem models: Cloud subscription revenue is replacing the traditional license and support model. As a result, legacy on-prem revenue has recently been contracting, and once the last of the legacy enterprise applications are retired, it will be fully replaced by cloud revenue. According to estimates by CFRA,1 the software industry grew by 4% in 2021, with a 22% year-on-year increase in cloud subscription revenue, which now constitutes 37% of total industry revenue, and a 3% decline in traditional software revenue. The surge in cloud growth is likely to continue, thanks to the accelerating pace of digital transformation. This trend is also promulgated by some of the largest players, such as Microsoft, whose cloud subscription revenue now constitutes more than half of the overall revenue and is an engine of growth in the software space. Strong cloud revenue growth is not just a function of recruiting new users but is also supported by the proliferation of new cloud apps and upgrades to the existing ones. Importantly, the cloud subscription model is also more profitable than the license model, whose EBITDA margins rarely exceed 40%. Cloud-based services take longer to become profitable but have much higher operating leverage: Once profitable, cloud and hybrid companies often have operating margins around 50-60%. Software is one of the most resilient technology industries, performing equally well in a growing economy and during downturns: Subscription pricing is sticky, and switching costs are high. As a result, companies, which derive a large share of their revenue from the cloud, have stable and predictable sales. Once clients are onboarded, cloud providers may also be able to exercise their pricing power. IT Services IT services is a smaller segment of the Software and Services industry group and is a hodge-podge of different companies that provide a wide range of services from IT consulting to FinTech. The following is a brief description of the key categories: IT Consulting: The S&P 500 IT Consulting companies are Accenture, Gartner, and Cognizant. Companies offer Professional advice in IT, management, HR, logistics, and many others. Since the pandemic, these companies’ key focus is on assisting their clients with digital transformation and improving companies’ operations. This industry is one of the key beneficiaries of accelerated migration to the cloud and has enjoyed exponential growth over the past decade. Its revenue stream is highly resilient, as even during economic downturns, clients are seeking advice on the best ways to navigate an uncertain market environment. Outsourcing: Companies such as ADP and Paychex provide HR and business services solutions for mid-sized and small companies. Their services cover payroll, benefits, retirement, and insurance services. This industry has been growing its sales and profits at a healthy clip over the past few years. Now it is focused on modernizing itself by moving its own operations to the cloud and deploying Artificial Intelligence to improve operations. These companies are also undergoing digital transformation and are moving towards the SaaS model. Financial Transaction Services: This is a FinTech industry that includes card and payment processors, such as Visa, Mastercard, and PayPal, and each of these players operates their own proprietary payment networks. Digital payments and the wide acceptance of e-commerce drive this space. Lately, these companies have been at the forefront of the adoption of digital currencies as viable payment options. Payment companies are among the earliest adopters of the cloud, and their business model is best described as Transaction-processing-as-a-service. These are highly profitable companies that consistently generate an operating margin above 60%. Key Industry Drivers Software Enhances Productivity And Improves Profitability Broadly speaking, the Software and Services industry group is considered a defensive holding owing to the resiliency of its earnings (Chart 5). Software enhances productivity: During economic downturns, it helps reduce costs, and during expansions, it helps overcome capacity constraints and labor shortages. While pandemic labor shortages and lockdowns produced a spike in productivity, more recently it has been falling, which has warranted a year-over-year increase in software investment (Chart 6). Chart 5S&S Earnings Are Resilient Across The Business Cycle
S&S Earnings Are Resilient Across The Business Cycle
S&S Earnings Are Resilient Across The Business Cycle
Chart 6Investing In Software Improves Productivity
Investing In Software Improves Productivity
Investing In Software Improves Productivity
Further, both labor shortages and rising wages are prompting companies to redesign their operations to contain costs and preserve margins. To do so, many are accelerating investments in Capex and automation, much of which is achieved through investment in software and IT services, replacing both labor and capital. According to CFRA, “software is no longer used to manage a means of production, but rather IS means of production .” Software-related Capex is not only garnering a larger slice of tech spending budgets but also of the overall Capex pie (Chart 7). Chart 7Share Of Software In Overall Capex Has Been Rising Steadily
Share Of Software In Overall Capex Has Been Rising Steadily
Share Of Software In Overall Capex Has Been Rising Steadily
Macroeconomic Backdrop Imminent Rate Hikes Tighter monetary policy and runaway inflation are at the fore of investors’ minds and, arguably, a cause of the current market rout. Software stocks have outperformed the other long-duration technology stocks. To gauge the reaction of S&S to the upcoming rate hike, we have repeated an exercise we conducted for the Technology sector last week – historical performance of the industry six months before and after the first rate hike (Chart 8). Clearly, industry returns fall two to three months before the first rate hike, but eventually recover once a new monetary regime is priced in. The year-to-date correction of the software stocks is textbook behavior. Chart 8S&S Underperforms Before The First Rate Hike
Software And Services: On The Seventh Cloud
Software And Services: On The Seventh Cloud
Software And Services Is A Global Industry – Beware Of A Strong Dollar The Technology sector is one of the most global sectors in the S&P 500 and derives 40% of sales from abroad; similarly, Software and Services has a broad international footprint. As US rates trend higher, and the interest rate differential favors the US vs. other countries, the USD is likely to appreciate further. With a stronger dollar, products of US software firms are more expensive to foreigners, which may have a dampening effect on demand. The US firms’ profitability has also been hit by an unfavorable translation from foreign currency back to the USD. Historically, the path of the dollar and the returns of S&S were inversely correlated (Chart 9). Chart 9Historically, Stronger Dollar Has Been A Headwind For The Industry
Historically, Stronger Dollar Has Been A Headwind For The Industry
Historically, Stronger Dollar Has Been A Headwind For The Industry
The redeeming grace is that, as we mentioned before, software subscription revenue is sticky, and switching costs for customers are high. As such, we expect the adverse effect on demand to be minor. Fundamentals Sales Growth According to Grandview Research , the business software and services market is expected to grow at a compound annualized rate of 11.3% from 2021 to 2028. This strong growth is underpinned by the robust pace of enterprise application cloud migration and digital transformation, which see no end in sight. The street expects the Software and Services industry to grow on par with the Technology sector at just under 20% over the next 12 months, and growth is slowing off high levels. The pandemic has shifted forward some of the spending on software, as companies rushed to adjust to remote work. However, the industry continues to grow at a healthy clip (Chart 10). Chart 10Sales Growth Is Slowing
Sales Growth Is Slowing
Sales Growth Is Slowing
Labor Costs Are Contained For Now The S&S companies first and foremost rely on the talent and ingenuity of their workforce to deliver cutting-edge technological solutions. Wages are one of the largest expenses in the industry. Recent increases in salaries accompanied by labor shortages and “the great resignation” are bound to cut into the margins of these companies. So far, software and services companies have been able to counter the trend (Chart 11) by deploying creative solutions, offering their employees a wide range of perks, and throwing their net wide in search of talent by offering remote work. Chart 11Industry Labor Costs Have Been Contained
Industry Labor Costs Have Been Contained
Industry Labor Costs Have Been Contained
Resilient Earnings Growth For the reasons discussed above, S&S earnings growth is remarkably resilient and stable throughout the business cycle (Chart 12). Currently, earnings expectations of S&S over the next 12 months exceed growth expectations for both the Technology sector and the S&P 500. Over the next 12 months, S&S earnings are expected to grow at 14% compared to 8.6% for the S&P 500 (Table 4). Chart 12S&S EPS Growth Bests The Tech Sector And The S&P 500
S&S EPS Growth Bests The Tech Sector And The S&P 500
S&S EPS Growth Bests The Tech Sector And The S&P 500
Table 4Earnings Growth Vs. Valuations
Software And Services: On The Seventh Cloud
Software And Services: On The Seventh Cloud
Despite the slowdown in sales growth and the pick-up in labor costs, EBITDA margins have exceeded the previous peak, and are projected to trend higher towards 40% over the course of the year (Chart 13). Expecting a growth slowdown, analysts have been revising earnings expectations down for S&S companies, but by now the downgrading process has run its course, and the bar is set low (Chart 14). Chart 13Margins Will Continue To Expand
Margins Will Continue To Expand
Margins Will Continue To Expand
Chart 14Downgrades Are Bottoming
Downgrades Are Bottoming
Downgrades Are Bottoming
Valuations Since the S&S industry group’s earnings are expected to grow faster than the earnings of the Tech sector and the S&P 500, it is not surprising that it trades with a 44% premium to the S&P 500 on a forward earnings basis – a steep mark-up. The current correction has taken some froth off the industry’s valuations , with multiples contracting by 3.9 points. Even after the correction, the sector appears overvalued (Chart 15). Adjusting for expected 12-month EPS growth, S&S appears more attractively valued and trades with a discount both to tech and the broad market (Table 4). It is also important to note that the industry group is home to a plethora of quite a few smaller companies, which tend to be more expensive and more volatile: Chart 16 plots companies’ forward earnings multiples against their weight in the industry group. Chart 15Valuations Are Still Dear...
Valuations Are Still Dear...
Valuations Are Still Dear...
Chart 16Significant Valuation Dispersion Among The Constituents
Software And Services: On The Seventh Cloud
Software And Services: On The Seventh Cloud
Technicals Recently, the BCA Technical Indicator has moved into the oversold territory, indicating investor capitulation. This means that this bar is cleared, and from a technical standpoint alone, Software and Services is a buy (Chart 17). Chart 17... But Technicals Indicate That S&S Is Oversold
... But Technicals Indicate That S&S Is Oversold
... But Technicals Indicate That S&S Is Oversold
Investment Implications We are both tactically and structurally bullish on the Software and Services industry group. Tactically Bullish The Software and Services industry group is an all-weather industry with an unprecedented combination of both earnings resiliency and strong growth throughout the business cycle. It is also undergoing a fundamental transformation in its business model catalyzed by a ubiquitous shift in software applications to the cloud, accompanied by displacement of the traditional on-prem license and support model with a more lucrative subscription model. The industry is expected to grow earnings in double digits and expand margins, unhindered by rising labor costs. Rising rates are certainly a headwind, but hopefully a temporary one. Froth has come off valuations, and a new monetary regime is gradually getting priced in. According to the technical indicator, the sector is oversold. On balance, we have a positive outlook on the industry group (Table 5) and maintain our overweight position. Table 5Software And Services Scorecard
Software And Services: On The Seventh Cloud
Software And Services: On The Seventh Cloud
Structurally Bullish Our long-held belief is that the broader push to the cloud, augmented reality, AI, cybersecurity, and autonomous driving, which are all software dependent, are not fads but are here to stay. Software and Services are at the epicenter of technological innovation and are home to some of the best American companies. Irene Tunkel Chief Strategist, US Equity Strategy irene.tunkel@bcaresearch.com Footnotes 1 CFRA, Industry Surveys, Software, July 2021 Recommended Allocation
Highlights The selloff in equities since the start of the year marks a long overdue correction rather than the start of a bear market. Stocks often suffer a period of indigestion when bond yields rise suddenly, but usually bounce back as long as yields do not move into economically restrictive territory. BCA’s bond strategists expect the 10-year yield to rise to 2%-to-2.25% by the end of the year, which is well below the level that could trigger a recession. While valuations in the US remain stretched, they are much more favorable abroad. Investors should overweight non-US markets, value stocks, and small caps in 2022. Go long homebuilders versus the S&P 500. US homebuilders are trading at only 6.5-times forward earnings and will benefit from tight housing supply conditions and a moderation in input costs. FAQ On Recent Market Action The selloff in stocks since the start of the year has garnered a lot of attention. In this week’s report, we address some of the key questions clients are asking. Q: What do you see as the main reasons for the equity selloff? A: At the start of the year, the S&P 500 had gone 61 straight weeks without experiencing a 6% drawdown, the third longest stretch over the past two decades. Stocks were ripe for a pullback. The backup in bond yields provided a catalyst for the sellers to come out. Not surprisingly, growth stocks fell hardest, as they are most vulnerable to changes in the long-term discount rate. At last count, the S&P 500 Growth index was down 13.7% YTD, compared to 4.1% for the Value index. Our research has found that stocks often suffer a period of indigestion when bond yields rise suddenly, but usually bounce back as long as yields do not move into economically restrictive territory (Table 1). BCA’s bond strategists expect the 10-year yield to rise to 2%-to-2.25% by the end of the year, which is well below the level that could trigger a recession. Table 1As Long As Bond Yields Don’t Rise Into Restrictive Territory, Stocks Should Recover
A Correction Not A Bear Market
A Correction Not A Bear Market
Historically, equity bear markets have coincided with recessions (Chart 1). Corrections can occur outside of recessionary periods, but for stocks to go down and stay down, corporate earnings need to fall. That almost never happens unless there is a major economic downturn (Chart 2). In fact, the only time in the last 50 years the US stock market fell by more than 20% outside of a recessionary environment was in October 1987. Chart 1Recessions And Bear Markets Tend To Go Hand In Hand
Recessions And Bear Markets Tend To Go Hand In Hand
Recessions And Bear Markets Tend To Go Hand In Hand
Chart 2Business Cycles Drive Earnings
Business Cycles Drive Earnings
Business Cycles Drive Earnings
Chart 3The Bull-Bear Ratio Is Below Its Pandemic Lows
The Bull-Bear Ratio Is Below Its Pandemic Lows
The Bull-Bear Ratio Is Below Its Pandemic Lows
It is impossible to know when this correction will end. However, considering that the bull-bear spread in this week’s AAII survey fell below the trough reached both in March 2020 and December 2018, our guess is that it will be sooner rather than later (Chart 3). With global growth likely to remain solid, equity prices should rise. Q: What gives you confidence that growth will hold up? A: Households are sitting on a lot of excess savings – $2.3 trillion in the US and a similar amount abroad. That is a lot of dry powder. Banks are also actively looking to expand credit, as the recent easing in lending standards demonstrates (Chart 4). Leading indicators of capital spending are at buoyant levels (Chart 5). Chart 4US Banks Are Easing Lending Standards
US Banks Are Easing Lending Standards
US Banks Are Easing Lending Standards
Chart 5The Outlook For US Capex Is Bright
The Outlook For US Capex Is Bright
The Outlook For US Capex Is Bright
It is striking how well the global economy has handled the Omicron wave. While service PMIs have come down, manufacturing PMIs have remained firm. In fact, the euro area manufacturing PMI reached 59 in January versus expectations of 57.5. It was the strongest manufacturing print for the region since August. The manufacturing PMI also ticked up slightly in Japan. The China Caixin/Markit PMI and the official PMI published by the National Bureau of Statistics also ticked higher. After dipping below zero last August, the Citi global economic surprise index has swung back into positive territory (Chart 6). Chart 6The Omicron Wave Did Not Drag Down The Global Economy
The Omicron Wave Did Not Drag Down The Global Economy
The Omicron Wave Did Not Drag Down The Global Economy
Markets are also not pricing in much of a growth slowdown (Chart 7). Growth-sensitive industrial stocks have outperformed the overall index by 1.1% in the US so far this year. EM equities have outperformed the global benchmark by 5.9%. The Bloomberg Commodity Spot index has risen 7.2%. Credit spreads have barely increased. Chart 7Markets Are Not Discounting Much Of A Growth Slowdown
Markets Are Not Discounting Much Of A Growth Slowdown
Markets Are Not Discounting Much Of A Growth Slowdown
Q: What is your early read on the earnings season? A: Nothing spectacular, but certainly not bad enough to justify the steep drop in equity prices. According to Refinitiv, of the 145 S&P 500 companies that have reported Q4 earnings, 79% have beat analyst expectations while 19% reported earnings below expectations. Usually, 66% of companies report earnings above analyst estimates, while 20% miss expectations. In aggregate, the reported earnings are coming in 3.2% above estimates, slightly lower than the historic average of 4.1%. Guidance has been lackluster. However, outside of a few tech names like Netflix, earnings disappointments have generally been driven by higher-than-expected expenses, rather than weaker sales. Overall EPS estimates for 2022 have climbed 0.4% in the US and by 1.1% in foreign markets since the start of the year (Chart 8). Q: To the extent that the Fed is trying to engineer tighter financial conditions, doesn’t this imply that stocks must continue falling? A: That would be true if the Fed really did want to tighten financial conditions, either via lower stock prices, a stronger dollar, higher bond yields, or wider credit spreads. However, we do not think that this is what the Fed wants. Despite all the chatter about inflation, the 5-year/5-year forward TIPS breakeven inflation rate has fallen to 2.05%, which is 25 basis points below the bottom end of the Fed’s comfort zone (Chart 9).1 Chart 8Earnings Expectations Have Not Been Revised Lower
Earnings Expectations Have Not Been Revised Lower
Earnings Expectations Have Not Been Revised Lower
Chart 9Market-Based Long-Term Inflation Expectations Are Below The Fed's Comfort Zone
Market-Based Long-Term Inflation Expectations Are Below The Fed's Comfort Zone
Market-Based Long-Term Inflation Expectations Are Below The Fed's Comfort Zone
Chart 10The Terminal Fed Funds Rate Seen At 2%-2.5%
The Terminal Fed Funds Rate Seen At 2%-2.5%
The Terminal Fed Funds Rate Seen At 2%-2.5%
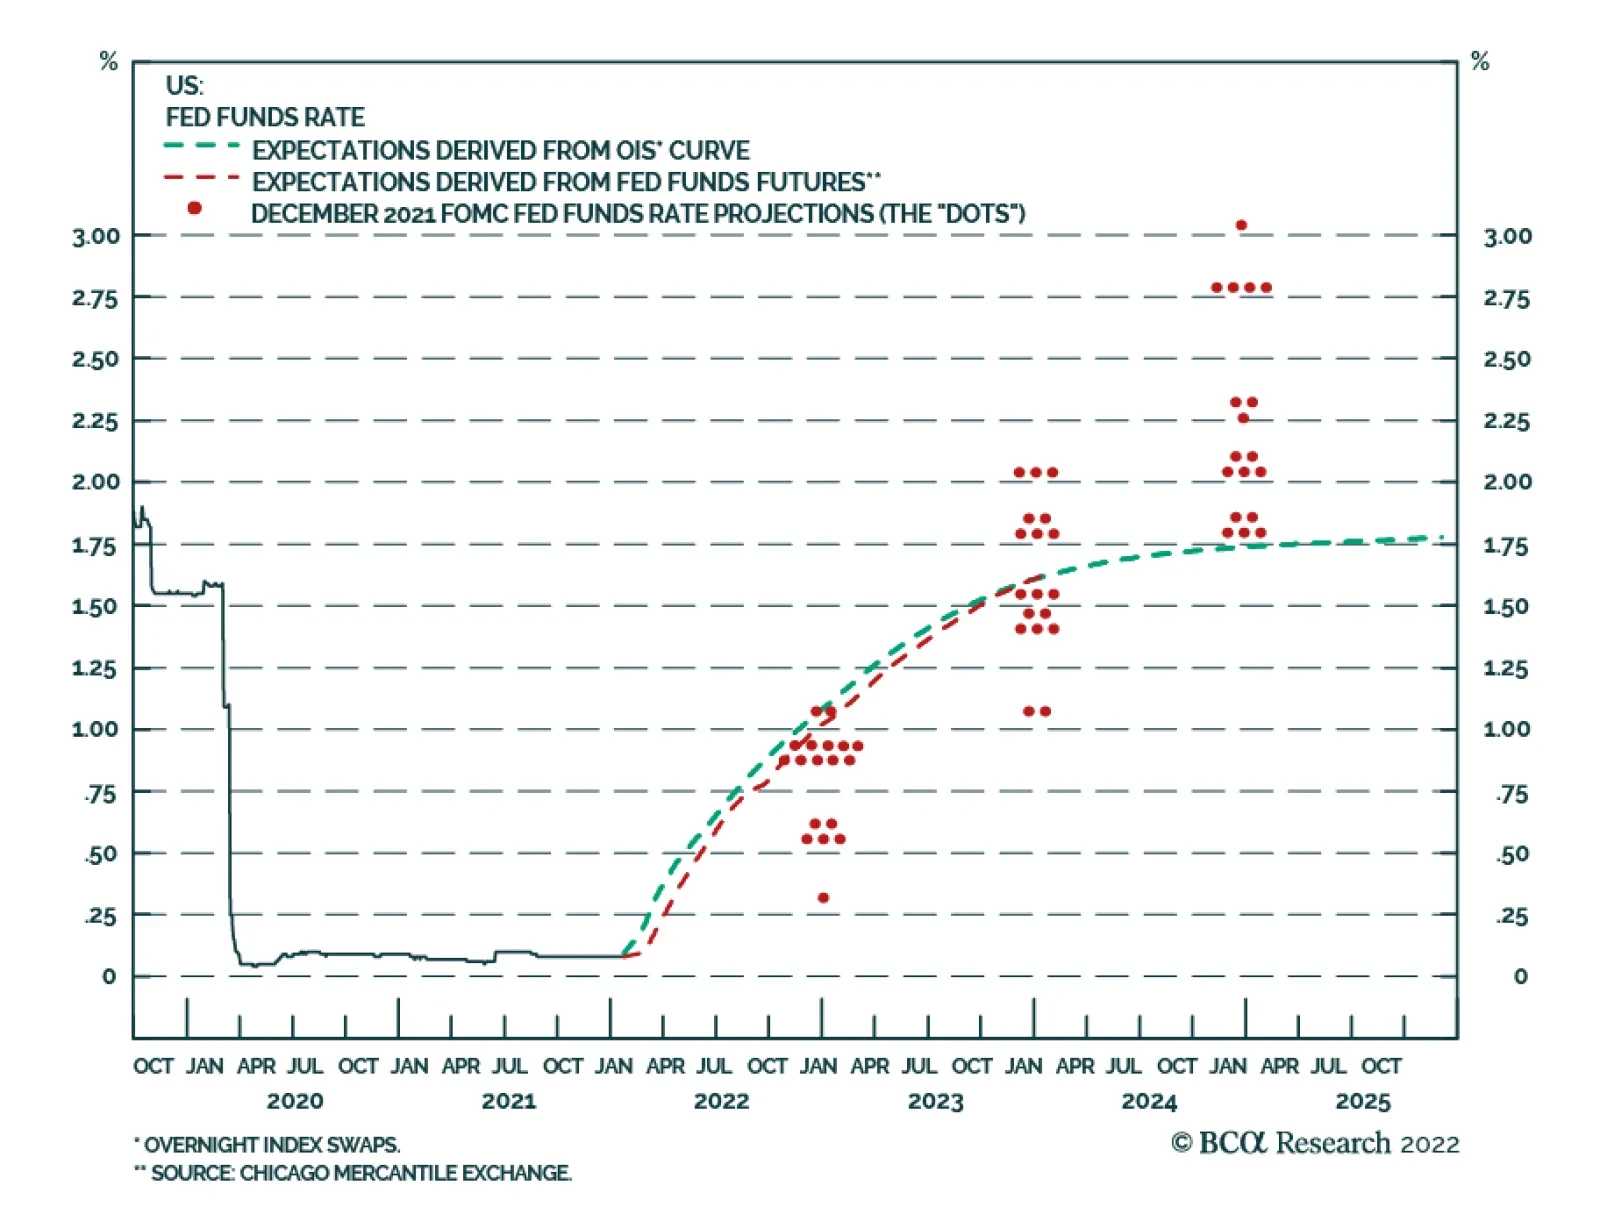
Chart 11The Market Thinks The Fed Will Not Be Able To Lift Rates Above 2%
The Market Thinks The Fed Will Not Be Able To Lift Rates Above 2%
The Market Thinks The Fed Will Not Be Able To Lift Rates Above 2%
Remember that the Fed’s estimate of the neutral rate, R*, is very low. The Fed thinks it will only be able to raise rates to 2.5% during this tightening cycle, which would barely bring real rates into positive territory (Chart 10). The market does not think the Fed will be able to raise rates to even 2% (Chart 11). The last thing the Fed wants to do is inadvertently invert the yield curve. In the past, an inverted yield curve has reliably predicted a recession (Chart 12). Chart 12A Yield Curve Inversion Usually Signals The End Of A Business Cycle (And Can Even Predict A Pandemic)
A Yield Curve Inversion Usually Signals The End Of A Business Cycle (And Can Even Predict A Pandemic)
A Yield Curve Inversion Usually Signals The End Of A Business Cycle (And Can Even Predict A Pandemic)
The Fed is about to start raising rates and shrinking its balance sheet not because it wants to slow growth, but because it wants to maintain its credibility. While the Fed will never admit it, it is very much attuned to the direction in which the political winds are blowing. The rise in inflation, and the Fed’s failure to predict it, has been embarrassing for the FOMC. Doing nothing is no longer an option. However, doing “something” does not necessarily imply having to raise rates more than the market is already discounting. Contrary to the consensus view that the Fed has turned hawkish, we think that the main takeaway from this week’s FOMC meeting is that Jay Powell, aka Nimble Jay, wants more flexibility in how the Fed conducts monetary policy. This makes perfect sense, as layer upon layer of forward guidance merely served to confuse market participants while unnecessarily tying the Fed’s hands. Q: How confident are you that inflation will fall without a meaningful tightening in financial conditions? A: If we are talking about a horizon of 2-to-3 years, not very confident. As we discussed two weeks ago in a report entitled The New Neutral, the interest rate consistent with stable inflation and full employment is substantially higher than either the Fed believes or the market is pricing in. This means that the Fed is likely to keep rates too low for too long. However, if we are talking about a 12-month horizon, there is a high probability that inflation will fall dramatically, even if monetary policy stays very accommodative. Today’s inflation is largely driven by rising durable goods prices. Durables are the one category of the CPI basket where prices usually fall over time, so this is not a sustainable source of inflation (Chart 13). As demand shifts back from goods to services and supply bottlenecks abate, durable goods inflation will wane. Chart 14 shows that the price indices for a number of prominent categories of goods – including new and used vehicles, furniture and furnishings, building supplies, and IT equipment – are well above their trendlines. Not only is inflation in these categories likely to fall, but it is apt to turn negative, as the absolute level of prices reverts back to trend. This will put significant downward pressure on inflation. Chart 13Durable Goods Prices Are The Main Driver Of Inflation
Durable Goods Prices Are The Main Driver Of Inflation
Durable Goods Prices Are The Main Driver Of Inflation
Chart 14Some Of These Prices Will Fall Outright
Some Of These Prices Will Fall Outright
Some Of These Prices Will Fall Outright
Chart 15Wage Growth Has Picked Up, Especially At The Bottom Of The Income Distribution
Wage Growth Has Picked Up, Especially At The Bottom Of The Income Distribution
Wage Growth Has Picked Up, Especially At The Bottom Of The Income Distribution
Granted, service inflation will accelerate this year as the labor market continues to tighten. However, rising service inflation is unlikely to offset falling goods inflation. While wage growth has accelerated, wage pressures have been concentrated at the bottom end of the wage distribution (Chart 15). According to the Census Household Pulse Survey, a record 8.75 million workers – many of them in relatively low-paid service jobs – were not working in the second week of January due to pandemic-related reasons (Chart 16). As the Omicron wave fades, most of these workers will re-enter the labor force. This should help boost labor participation among low-wage workers, which has recovered much less than for higher paid workers (Chart 17). Chart 16The Pandemic Is Still Affecting Labor Supply
The Pandemic Is Still Affecting Labor Supply
The Pandemic Is Still Affecting Labor Supply
Chart 17Employment In Low-Wage Industries Has Not Fully Recovered
Employment In Low-Wage Industries Has Not Fully Recovered
Employment In Low-Wage Industries Has Not Fully Recovered
Q: Tensions between Ukraine and Russia have risen to a fever pitch. Could this destabilize global markets? Chart 18Valuations Matter For Long-Term Returns
Valuations Matter For Long-Term Returns
Valuations Matter For Long-Term Returns
A: In a note published earlier today, Matt Gertken, BCA’s Chief Geopolitical Strategist, increased his odds that Russia will invade Ukraine from 50% to 75%. However, of that 75% war risk, he gives only 10% odds to Russia invading and conquering all of Ukraine. A much more likely scenario is one where Russia invades Donbas and perhaps a few other regions in Eastern or Southern Ukraine where there are large Russian-speaking populations and/or valuable coastal territory. While such a limited incursion would still invite sanctions from the West, Matt does not think that Russia will retaliate by cutting off oil and natural gas exports to Europe. Not only would such a retaliation deprive Russia of its main source of export earnings, but it could lead to a hostile response from countries such as Germany which so far have pushed for a more measured approach than the US has championed. Q: Valuations are still very stretched. Even if the conflict in Ukraine does not spiral out of control and the goldilocks macroeconomic scenario of above-trend global growth and falling inflation comes to pass, hasn’t much of the good news already been discounted? A: US stocks are quite pricey. Both the Shiller PE ratio and households’ allocations to equities point to near-zero total returns for stocks over a 10-year horizon (Chart 18). That said, valuations are not a useful timing tool. The business cycle, rather than valuations, tends to dictate the path of stocks over medium-term horizons of 6-to-12 months (Chart 19). Chart 19AThe Business Cycle Drives The Stock Market Over Medium-Term Horizons (I)
The Business Cycle Drives The Stock Market Over Medium-Term Horizons (I)
The Business Cycle Drives The Stock Market Over Medium-Term Horizons (I)
Chart 19BThe Business Cycle Drives The Stock Market Over Medium-Term Horizons (II)
The Business Cycle Drives The Stock Market Over Medium-Term Horizons (II)
The Business Cycle Drives The Stock Market Over Medium-Term Horizons (II)
Moreover, stocks are not expensive everywhere. While US equities trade at 20.8-times forward earnings, non-US stocks trade at a more respectable 14.1-times. The valuation gap is even more extreme based on other measures such as normalized earnings, price-to-book, and price-to-sales (Chart 20). Chart 20AUS Stocks Are Trading At A Significant Premium To Their Non-US Peers (I)
US Stocks Are Trading At A Significant Premium To Their Non-US Peers (I)
US Stocks Are Trading At A Significant Premium To Their Non-US Peers (I)
Chart 20BUS Stocks Are Trading At A Significant Premium To Their Non-US Peers (II)
US Stocks Are Trading At A Significant Premium To Their Non-US Peers (II)
US Stocks Are Trading At A Significant Premium To Their Non-US Peers (II)
In terms of equity styles, both small caps and value stocks trade at a substantial discount to large caps and growth stocks (Chart 21). We recommend that investors overweight these cheaper areas of the market in 2022. Trade Recommendation: Go Long US Homebuilders Versus The S&P 500 US homebuilder stocks have fallen by 19.4% since December 10th. Beyond the general market malaise, worries about rising mortgage rates and soaring input costs have weighed on the sector. Yet, current valuations more than adequately discount these risks. The sector trades at 6.5-times forward earnings, a steep discount to the S&P 500. Whereas demand for new homes is near record high levels according to the National Association of Home Builders (NAHB) survey, the homeowner vacancy rate is at a multi-decade low. The supply of recently completed new homes is half of what it was on the eve of the pandemic (Chart 22). With demand continuing to outstrip supply, home prices will maintain their upward trend. As building material prices stabilize and worries about an overly aggressive Fed recede, homebuilder stocks will rally. Chart 21Value Stocks And Small Caps Are Cheap
Value Stocks And Small Caps Are Cheap
Value Stocks And Small Caps Are Cheap
Chart 22US Homebuilders Looking Attractive
US Homebuilders Looking Attractive
US Homebuilders Looking Attractive
Peter Berezin Chief Global Strategist peterb@bcaresearch.com Footnotes 1 The Federal Reserve targets an average inflation rate of 2% for the personal consumption expenditures (PCE) index. The TIPS breakeven is based on the CPI index. Due to compositional differences between the two indices, CPI inflation has historically averaged 30-to-50 basis points higher than PCE inflation. This is why the Fed effectively targets a CPI inflation rate of about 2.3%-to-2.5%. Global Investment Strategy View Matrix
A Correction Not A Bear Market
A Correction Not A Bear Market
Special Trade Recommendations Current MacroQuant Model Scores
A Correction Not A Bear Market
A Correction Not A Bear Market
Feature Is the worst over for US and EM equities? Clearly, the risk-reward of stocks has somewhat improved, given they are no longer overbought and some bad news has already been priced in. However, conditions for a durable bottom and a sustainable and lasting rally do not yet exist. In the case of the S&P 500, our capitulation indicator has not yet reached the lows that marked the major bottoms of the past 12 years (Chart 1). Chart 1US Stocks Have Not Reached Their Selling Climax Yet
US Stocks Have Not Reached Their Selling Climax Yet
US Stocks Have Not Reached Their Selling Climax Yet
Chart 2Components Of US Equity Capitulation Indicator
Components Of US Equity Capitulation Indicator
Components Of US Equity Capitulation Indicator
None of its four components – the advance/decline line, momentum, breadth and investor sentiment – are back to their lows of 2010, 2011, 2015-16 and 2018 (Chart 2). In the past three cases, the S&P 500 corrected by 17-20%. A correction of this magnitude is our base case for the S&P 500 at the moment. The S&P drawdown has so far been half of this. US inflation and the Fed’s policy remain the key headwinds to US share prices. Core consumer price inflation is substantially above the Fed’s preferred range (2-2.25%) and wage growth is accelerating. As a result, the Fed will lose credibility if it does not sound ready to hike interest rates materially. The US equity market is vulnerable to such a not-dovish stance from the Fed because it is still very expensive. Inflation has also become a political problem. One reason Biden’s popularity has been sliding in the polls is the rapid pace of consumer price increases. Heading into the mid-term elections in the fall, the White House and the Democrats will not oppose the Fed raising interest rates to fight inflation. Overall, BCA’s Emerging Markets Strategy team believes markets/investors are underestimating inflation risks in the US. Core inflation will not drop below 3% unless the economy slows down and employment/wages slump. High and rising trimmed-mean and median CPI measures suggest inflation is broad-based. Normalization in supply-side factors will not be enough to lower core inflation below 3%. Importantly, the median and trimmed-mean core inflation measures strip out goods and services that post abnormal fluctuations. Their elevated readings corroborate that inflation is genuine and broad-based. Hence, pressure on the Fed to tighten will remain substantial. This is bad news for a still overvalued US stock market. Chart 3EM EPS Is Set To Dissapoint
EM EPS Is Set To Dissapoint
EM EPS Is Set To Dissapoint
Concerning EM equities and currencies, economic growth in EM will disappoint. Chart 3 suggests that EM corporate profits are set to deteriorate materially in the coming six months or so. Besides, investor sentiment on EM equities is not downbeat – it is neutral (Chart 28 below). From a contrarian perspective, there is not yet a case to buy EM stocks in absolute terms. China’s business cycle recovery is still several months away. In other EM countries, monetary policy has tightened substantially, real interest rates remain high, or the banking system is too unhealthy to support growth. Finally, fiscal policy will be slightly tight this year in the majority of EM. As domestic demand in China and in mainstream EMs disappoint and the Fed does not do a dovish pivot soon, EM currencies will resume their depreciation versus the US dollar. Chart 4 shows that China’s credit and fiscal impulse leads EM currency cycles and is presently pointing to more EM currency depreciation. Charts 32 and 33 (below) are pointing to further greenback strength. Finally, EM growth disappointments and a strong greenback will pressure EM fixed income markets. EM high-yield (HY) credit – both sovereign and corporate – has been selling off, but investment-grade (IG) credit has been holding up (Chart 5). This is a sign that investors have been reluctant to offload EM IG credit and points to lingering positive sentiment on EM and lack of capitulation. Sluggish EM growth and an appreciating US dollar are headwinds for EM credit markets. Chart 4EM Currencies Remain At Risk
EM Currencies Remain At Risk
EM Currencies Remain At Risk
Chart 5EM Credit Markets: The Selloff Will Broaden
EM Credit Markets: The Selloff Will Broaden
EM Credit Markets: The Selloff Will Broaden
Bottom Line: We continue to recommend a defensive strategy for absolute return investors. For global equity portfolios, we recommend underweighting EM and the US, and overweighting Europe and Japan. The path of least resistance for the US dollar is up for now. The charts on the following pages are the most important ones for investors today. Arthur Budaghyan Chief Emerging Markets Strategist arthurb@bcaresearch.com US Stocks Have Not Reached Their Selling Climax Yet Even though only 17% of the NASDAQ’s stocks are above their 200-day moving average, the same measure for the NYSE index is 38%, well above its previous lows. Besides, the NYSE’s advance/decline line has broken down, signifying a broadening equity rout. Finally, the US median stock has broken below its 200-day moving average after going sideways for 9-12 months. When such a profile occurs, the sell-off lasts more than a couple of weeks. Chart 6
US Stocks Have Not Reached Their Selling Climax Yet
US Stocks Have Not Reached Their Selling Climax Yet
Chart 7
US Stocks Have Not Reached Their Selling Climax Yet
US Stocks Have Not Reached Their Selling Climax Yet
Chart 8
US Stocks Have Not Reached Their Selling Climax Yet
US Stocks Have Not Reached Their Selling Climax Yet
Chart 9
US Stocks Have Not Reached Their Selling Climax Yet
US Stocks Have Not Reached Their Selling Climax Yet
Non-US Stocks Are Not Oversold Yet Neither global ex-US nor EM stocks are very oversold. Global ex-US and European share prices in SDR terms have been moving sideways for about 9-12 months prior to breaking down recently. Such a breakdown means a weakness in share prices that will likely last for a while. Chart 10
Non-US Stocks Are Not Oversold Yet
Non-US Stocks Are Not Oversold Yet
Chart 11
Non-US Stocks Are Not Oversold Yet
Non-US Stocks Are Not Oversold Yet
Chart 12
Non-US Stocks Are Not Oversold Yet
Non-US Stocks Are Not Oversold Yet
Chart 13
Non-US Stocks Are Not Oversold Yet
Non-US Stocks Are Not Oversold Yet
Growth Stocks Have Broken Down Various indexes of growth/TMT stocks have broken below their moving averages that have served as a support since spring 2020. This along with the fact that US interest rates will likely rise suggests that the bull market in growth stocks is either over or in for a prolonged hibernation. Chart 14
Growth Stocks Have Broken Down
Growth Stocks Have Broken Down
Chart 15
Growth Stocks Have Broken Down
Growth Stocks Have Broken Down
Chart 16
Growth Stocks Have Broken Down
Growth Stocks Have Broken Down
Chart 17
Growth Stocks Have Broken Down
Growth Stocks Have Broken Down
Is FAANGM A Bubble? In the past 12 years, US FAANGM stocks rose as much as the previous bubbles. When those bubbles peaked, their prices did not move sideways but rather collapsed. We do not assert that US FAANGM stocks will drop by more than 35% (we simply do not know). The point we would like to emphasize is that the bull market is over for now. At best, US growth stocks will likely be in a trading range in the coming 12-24 months. Chart 18
Is FAANGM A Bubble?
Is FAANGM A Bubble?
Chart 19
Is FAANGM A Bubble?
Is FAANGM A Bubble?
US Share Prices And Corporate Margins: Defying Gravity? From a very long-term perspective, the US equity market is rather overextended. Share prices in real terms are almost two standard deviations above their time trend. Similarly, corporate profits in real terms are also very elevated, not least in their reflection of record-high profit margins. The key questions for US equity investors are: (1) how persistent/sticky core inflation will be; and (2) how low corporate profit margins will drop. Wages are the key to both inflation and corporate margins. We believe wage growth will accelerate materially. That will be bad for the outlook of inflation and corporate profit margins, although it will be good news for corporate top lines. Chart 20
US Share Prices And Corporate Margins: Defying Gravity?
US Share Prices And Corporate Margins: Defying Gravity?
Chart 21
US Share Prices And Corporate Margins: Defying Gravity?
US Share Prices And Corporate Margins: Defying Gravity?
The Levels of EM Share Prices And Corporate Profits Have Been Flat For 12 years Contrary to the US, EM share prices are not overextended – they have been flat in absolute terms for the past 12 years. The reason for such dismal performance has been stagnant corporate profits. The latter have been flat-to-down in real terms for the past 12-14 years. A breakout in EM share prices in absolute terms will require their EPS entering a secular uptrend. While this is not impossible this decade, it is not imminent. Chart 22
The Levels Of EM Share Prices And Corporate Profits Have Been Flat For 12 Years
The Levels Of EM Share Prices And Corporate Profits Have Been Flat For 12 Years
Chart 23
The Levels Of EM Share Prices And Corporate Profits Have Been Flat For 12 Years
The Levels Of EM Share Prices And Corporate Profits Have Been Flat For 12 Years
Long-Term Equity Valuations (Cyclically-Adjusted P/E Ratio) Based on a cyclically-adjusted P/E (CAPE) ratio, EM stocks are close to their fair value. In contrast, based on the same measure, US equities are very overvalued. As a result, the relative CAPE ratio of EM versus the US is at a record low. Hence, on a multi-year horizon, odds are that EM share prices will outperform their US peers. In a nutshell, EM ex-China, Korea, Taiwan currencies are also close to their fair value. We will be looking to upgrade EM in the coming months. Chart 24
Long-Term Equity Valuations (Cyclically-Adjusted P/E Ratio)
Long-Term Equity Valuations (Cyclically-Adjusted P/E Ratio)
Chart 25
Long-Term Equity Valuations (Cyclically-Adjusted P/E Ratio)
Long-Term Equity Valuations (Cyclically-Adjusted P/E Ratio)
Chart 26
Long-Term Equity Valuations (Cyclically-Adjusted P/E Ratio)
Long-Term Equity Valuations (Cyclically-Adjusted P/E Ratio)
Chart 27
Long-Term Equity Valuations (Cyclically-Adjusted P/E Ratio)
Long-Term Equity Valuations (Cyclically-Adjusted P/E Ratio)
Investors Are Not Bearish On EM And Europe One missing factor to upgrade EM (non-US markets in general) is investor sentiment. Sentiment is neutral on EM stocks and is fairly upbeat on Europe. In brief, a capitulation has also not yet occurred in non-US markets. On the whole, the current EM sell-off will likely linger until sentiment becomes downbeat. Chart 28
Investors Are Not Bearish On EM And Europe
Investors Are Not Bearish On EM And Europe
Chart 29
Investors Are Not Bearish On EM And Europe
Investors Are Not Bearish On EM And Europe
Directional Indicators For EM Stocks Points To More Downside The cross rate between SEK (a pro-cyclical currency) and CHF (a defensive one) moves in tandem with EM share prices. The same holds for the NZD versus the USD. The rationale is as follows: all of these currencies correlate with the global business cycle and global risk-on/off trends. Presently, the SEK/CHF cross and the NZD point to lower EM share prices. Chart 30
Directional Indicators For EM Stocks Points To More Downside
Directional Indicators For EM Stocks Points To More Downside
Chart 31
Directional Indicators For EM Stocks Points To More Downside
Directional Indicators For EM Stocks Points To More Downside
The US Dollar Is To Rally Further The Fed’s willingness (for now) to hike rates is positive for the greenback. The trend in relative TIPS yields between the US and Germany heralds further USD strength against the euro. Also, the cross rate between SEK (a pro-cyclical currency) and CHF (a defensive one) entails more upside in the broad trade-weighted US dollar. Chart 32
The US Dollar Is To Rally Further
The US Dollar Is To Rally Further
Chart 33
The US Dollar Is To Rally Further
The US Dollar Is To Rally Further
Worrisome Market Profiles Several markets such as EM non-TMT share prices, Korean tech stocks, the Chinese onshore CSI300 stock index and silver prices have all failed to break above their 200-day moving averages and are now relapsing. Such a profile is often consistent with new cyclical lows in these markets. Chart 34
Worrisome Market Profiles
Worrisome Market Profiles
Chart 35
Worrisome Market Profiles
Worrisome Market Profiles
Chart 36
Worrisome Market Profiles
Worrisome Market Profiles
Chart 37
Worrisome Market Profiles
Worrisome Market Profiles
China’s Liquidity And Credit Cycles Even though China has heightened the pace of monetary easing, it will take several months before its credit impulse rebounds. On average, it takes about six months for reductions in the required reserve ratio (liquidity injections) to produce a meaningful recovery in the credit impulse. So far, the excess reserve ratio has stabilized but not improved. This means the credit impulse will continue stabilizing in the coming months, but a major rise is unlikely in the near term. In turn, the credit cycle leads share prices by several months. All in all, a risk window for China-related plays remains open in the coming months. Chart 38
China's Liquidity And Credit Cycles
China's Liquidity And Credit Cycles
Chart 39
China's Liquidity And Credit Cycles
China's Liquidity And Credit Cycles
Footnotes
As expected, the Fed maintained the target range for the fed funds rate unchanged at 0 to 0.25% following its meeting on Wednesday. However, the FOMC statement noted that “it will soon be appropriate to raise the target range for the federal funds rate.” At…
Highlights The Biden administration faces significant risks from outside the US economy – our third “key view” for 2022. The Ukraine conflict brings one external risk to the forefront. These external risks would exacerbate the global supply squeeze, potentially pushing up commodity prices until they start to kill demand. Investors should prepare for oil price overshoots. Exogenous risks – such as foreign policy crises – rarely help the president’s party in the midterm election. Any crisis that adds to short-term inflation will hurt the ruling party. Tactically we continue to prefer defensive equities. Close our tactical long industrials / short consumer discretionary trade for a gain of 11.6%. Close long energy stocks for a 15.6% gain and convert to long energy small caps versus large caps. Buy the dip in cyber security stocks. Feature Stock market volatility is back, thanks in no small part to external risks such as Europe’s energy shortage and Russia’s conflict with the West over Ukraine. In our forecast for 2022, we highlighted the Biden administration’s external risks as our third key view. The rapidly deteriorating geopolitical situation was one of several reasons behind this view and it has now clearly moved to the forefront. In this report we highlight the consequences for domestic-oriented US investors. Biden’s immediate external risks, if they materialize, will increase the likelihood that Democrats will lose control of Congress, causing US fiscal policy to freeze and driving policy uncertainty and the dollar upward. For detailed coverage of the Ukraine conflict and its global geopolitical, macro, and market implications please refer to our Geopolitical Strategy reports. Why Is Biden Vulnerable To External Risks The Biden administration and the Democratic Party face serious external risks in 2022. The Omicron variant and global supply constraints are a major factor. Also the US’s domestic political divisions invite challenges from abroad. President Biden is politically weak ahead of midterm elections on November 8. His net approval rating is under water at -10 percentage points. Republicans are now leading the generic congressional ballot with 45.5% support against Democrats’ 41.8%. On a deeper level, Democrats are beset by a socialist fringe on their left wing, making it difficult to pass legislation, and an enthusiastic nationalist opposition movement with a viable challenger for the presidency in 2024 (former President Trump). At best they will pass one more major bill this year before Congress gets gridlocked. Foreign rivals have an advantage in this context. America’s chief rivals face limited political constraints at home (no midterm elections) but they can make low-cost, high-impact threats against the Biden administration through their leverage over the global supply chain and hence voters’ pocketbooks. External Risks Are Inflationary (At Least At First) External risks begin with inflation. The US’s large imbalance of investment over savings is evident in a current account deficit of 3.3% and deteriorating terms of trade. American demand is exceedingly strong due to accumulated household savings, a new capex cycle, and lingering effects of monetary and fiscal stimulus. Yet global supply is impeded. Import prices are rising at a 5.7% rate, the fastest since the BLS started the series in 2010, while imports from China are rising at a 4.7% clip. China’s “zero Covid” policy implies that supply disruptions will keep up the inflationary pressure this year (Chart 1, first panel). The US is also importing inflation from rising commodity prices. West Texas Intermediate crude oil prices have risen to $83 per barrel and average gasoline prices stand at $3.3. With global supply-demand balances tight, WTI prices should average $77 per barrel this year and $78 next year, according to our Commodity & Energy Strategy. In this context, unplanned supply disruptions are likely and will put more pressure on the supply side. Any conflicts with oil producers such as Russia and Iran will backfire in the form of higher prices at the pump (Chart 1, second panel). Yet geopolitical competitors (Russia, Iran, China) have unfinished business with the US stemming from the Trump administration. It is also possible that Biden could negotiate diplomatic solutions, reducing the risk of an oil price spike, but that is not the current trajectory. Chart 1Biden's External Risks Are Inflationary For Now
Biden's External Risks Are Inflationary For Now
Biden's External Risks Are Inflationary For Now
Interest rate hikes from the Federal Reserve will not easily control inflation derived from external sources and supply constraints. They will take time to dampen domestic demand. Yet voters usually solidify their opinions by mid-summer. Inflation may not have come down much by that time. Biden and the Democratic Party are at the mercy of the global supply chain. In this context Russia deliberately forced its way to the top of the US and global agenda by demanding that the West renounce any attempt to threaten its national security via Ukraine or the former Soviet Union. Energy Shock From Russia? The Ukraine crisis threatens an increase in global energy prices. Russia provides 8% of Europe’s commodity imports, 18% of its energy imports, and 16% of its natural gas imports (Chart 2). Russia is already withholding energy supplies from Europe, helping push natural gas prices up by 122% since last August. If war ignites, Russia could reduce energy flows to Ukraine and hence to the rest of Europe. Europe would not be willing to impose as harsh of sanctions as the US because its energy supply depends on it. The US can increase exports to Europe but it cannot replace Russia without depriving its other allies and partners, including India, Japan, and South Korea (Chart 3). The squeeze will cause prices to rise at first but if it is not addressed by higher output from the US and OPEC 2.0, then demand will be destroyed. Note that in 1979, 2008, and 2014, Russian military invasions coincided with a peak in global oil prices. Chart 2Geopolitical Risks Cause Resource Squeeze
Biden’s External Risks
Biden’s External Risks
Chart 3Can US Replace Russia For Europe? Not Really.
Biden’s External Risks
Biden’s External Risks
If other supply problems emerged simultaneously, the slowdown could be especially disruptive. If US-Iran negotiations fail, then another energy supply risk will emerge immediately this spring. The implication is not only a rise in oil prices but also a resilient dollar, which is also the implication of the Fed’s looming rate hikes. Defensive plays would tend to beat cyclical plays, at least in the short run until the crisis abates. But it is important to look at previous examples of Russian aggression to test this hypothesis. US Market Response To Russian Belligerence When Russia invaded Georgia in August 2008, the attack had limited impact on global financial markets, which were focused on the subprime mortgage crisis unfolding on Wall Street. Naturally stocks underperformed bonds, cyclicals underperformed defensives, and value went sideways against growth. Small caps rallied at first versus large caps but then hit a turning point from outperformance to underperformance (Chart 4). Note that the invasion began while President Putin watched the summer Olympics live in Beijing. So one cannot rule out a limited military action against Ukraine in the near term just because Putin is also headed to Beijing for this winter’s Olympics. When Russia invaded Ukraine in February 2014, seizing the Crimean peninsula in the Black Sea, the attack had a greater impact on global financial markets than with Georgia, although Ukraine’s relevance to the global economy was (and is) still limited. Chart 4Market Reaction To Russia Invasion Of Georgia, 2008
Market Reaction To Russia Invasion Of Georgia, 2008
Market Reaction To Russia Invasion Of Georgia, 2008
Chart 5Market Reaction To Russia Invasion Of Ukraine, 2014
Market Reaction To Russia Invasion Of Ukraine, 2014
Market Reaction To Russia Invasion Of Ukraine, 2014
Bonds outperformed stocks, cyclicals were flat-to-up against defensives (energy clearly outperformed defensives), and small caps stumbled but then beat out large caps (Chart 5). Energy stocks theoretically stood to benefit but crashed later that year due to supply glut and China policy tightening. In 2022 the situation is different from these previous Russian invasions in that the world is already in the thrall of an energy supply squeeze brought on by various factors. China’s economy is growing slowly but authorities are easing policy. A comparison of the winter of 2021-22 with that of 2013-14, when Russia invaded Crimea, suggests that energy stocks have already far outpaced growth and defensives (Chart 6). Energy small caps, however, could rally substantially against large cap peers. Tactically US investors should maintain a risk-averse positioning until the Russians make a military decision and the West announces its retaliatory measures. This analysis suggests that cyclicals and small caps face volatility but can ultimately grind higher after the onset of any new war in Ukraine. The magnitude of the war will obviously matter, which is why we maintain a defensive tactical positioning. The next question centers on the medium-term policy impact of Biden’s external risks. Chart 6Market Context: 2022 Versus 2014
Market Context: 2022 Versus 2014
Market Context: 2022 Versus 2014
Implications For US Midterms And Policy It is possible that Biden’s external risks will play a role in the 2022 midterms. It depends on which risks materialize. Most likely a Russian re-invasion of Ukraine would have a negative effect on the Democrats, especially if it adds to voters’ inflation woes. Major foreign policy successes or failures have a substantial impact on a president’s re-election chances but midterms are less obvious. Midterms almost always go against the president’s party because the previous election’s losers turn out in droves while winners sit home in complacency or disillusionment. The midterm electorate tends to be older, whiter, and more educated than the presidential electorate. Chart 7 shows only midterm elections in which external risks – such as foreign policy – played a major role. In the House, the only time the president’s party gained seats was in 2002, though it only lost four seats in 1962. In the Senate, the president’s party gained seats in 1962, 2002, and 2018 and only lost 2 seats in 1954. From these points we can draw the following conclusions: Chart 7US Midterm Elections: Ruling Party Performance Amid Foreign Policy Crises
Biden’s External Risks
Biden’s External Risks
Foreign policy crises do not generally help the president’s party. While major crises like 9/11 helped the Republicans, and the 1962 Cuban Missile Crisis minimized Democrats’ losses, nevertheless the 1942 midterm occurred after Pearl Harbor and the Democrats lost seats. Minor crises like the 1958 “Lebanon Crisis” also do not help. Russia’s invasion of Ukraine in 2014 falls under this category and did not help President Obama’s Democrats. A major threat to the homeland can help the president’s party on the margin. This is the significance of 1962 and 2002. The ruling party either minimized losses or made absolute gains in the House, while gaining seats in the Senate. (The 2018 midterm is the other case in which the president’s party gained Senate seats, amid President Trump’s trade war with China, but Republicans suffered heavily in the House.) Wartime escalation and entanglement hurt the president’s party. President Johnson’s Democrats suffered deep losses in 1966, as did President George W. Bush’s Republicans in 2006. Obama’s troop surge in Afghanistan was not the main issue but did not help his party in 2010. Ceasefires and peace treaties do not help the president’s party, even when the end of the war is seen as a victory. World War I was drawing to a close in 1918 but Democrats suffered for having gotten the US involved. Democrats also lost in 1946, despite US triumph in WWII. The Korean war ended on a far more ambivalent note and Republicans suffered at the ballot box. Vietnam was drawing to an ignominious close in 1974, which also occurred in the aftermath of the Arab oil embargo, recession, and Watergate scandal, so no surprise Republicans lost seats. If there is a foreign policy crisis this year, the “best case” for Biden’s Democrats – in crass political terms – would be one that engenders a patriotic rally, like happened with the Cuban Missile Crisis or 9/11. If Democrats only lose four seats in 2022, like Kennedy in 1962, they will have a one-seat majority in the House. However, this best-case scenario is unlikely. As noted, 1962 and 2002 consisted of direct threats to the US homeland. All other crises either hurt or did not help the president’s party. In 2014, while voters had other things on their minds that year, Russia’s invasion of Crimea reinforced criticisms of Obama’s foreign policy already centered on Libya, Syria, and Iran. Obama responded with sanctions and aid to Ukraine, as Biden threatens to do today. Democrats lost 13 seats in the House and 9 seats in the Senate. A similar negative impact should be expected if Russia re-invades in 2022. Biden is already vulnerable: his approval rating collapsed after his messy withdrawal from Afghanistan (reinforcing the fourth bullet about ending wars above). A new foreign policy crisis could cement the narrative of foreign policy incompetence. It matters a great deal whether an exogenous crisis automatically hurts the voter’s pocketbook. If it does, then any initial rally around the flag will fade over time, leaving the negative material impact behind and angering voters. In 1974, President Ford’s approval rating shot up above 50% as he took over from Nixon, yet his party still suffered from the inflationary economic backdrop and dour foreign policy backdrop. In 1978, President Carter’s approval rating also recovered to nearly 50% in time for the vote but it was not enough to overcome inflationary malaise – and Iranian oil strikes began in September (Chart 8). If we subtract the Misery Index (unemployment plus inflation) from the president’s approval rating, we see that Kennedy had a 70% approval during the Cuban Missile Crisis, and Bush had a 62% approval in 2002. But Johnson and Carter were sinking toward 35% during their first midterms, which is where Biden stands today (Chart 9). Chart 8Different Reactions For Different Crises
Biden’s External Risks
Biden’s External Risks
Chart 9Best And Worst Case Scenarios Of Foreign Policy Crisis For Democrats
Biden’s External Risks
Biden’s External Risks
Thus Biden’s external risks, depending on which ones materialize, suggest that the Democratic Party will face another headwind in November. Democrats are very likely to lose the House and somewhat likely to lose the Senate. Gridlock is already setting in – as will be apparent with the potential government shutdown over the February 18 deadline to pass spending bills. But the midterm will formalize it. Policy uncertainty will continue to creep up and weigh on investor risk appetite this year. In other words, even if cyclicals rally through a Ukraine conflict, they may not outperform defensives later this year. Investment Takeaways Cyclically we are booking an 15.6% gain on our long energy trade and will convert it to a long US energy small caps relative to large caps trade. The external risks highlighted in this report would push up oil prices at least initially (Chart 10). However, volatility will pick up from here. OPEC 2.0 will want to keep Brent crude prices from settling above the $90 per barrel that starts to crimp demand, as our Commodity & Energy Strategy argues. Higher prices will also encourage new production, including from the US shale patch (Chart 11). Note that energy stocks, like other cyclicals, tend to underperform during midterm election years as policy uncertainty affects markets. Chart 10Book Gains On Tactical Long Energy Equities Trade
Book Gains On Tactical Long Energy Equities Trade
Book Gains On Tactical Long Energy Equities Trade
Chart 11US Oil Producers Will Step Up
US Oil Producers Will Step Up
US Oil Producers Will Step Up
Tactically we recommend closing our long industrials / short consumer discretionary for a gain of 11.6%. Normally, consumer discretionary stocks are the best performing sector during midterm election years while industrials are the worst. But because of China’s policy easing, we took a tactical bet that the opposite would occur at the start of the year. However, external risks should now cause this situation to reverse by pushing up the dollar, penalizing industrials, without hurting the American consumer too much (Chart 12). Industrial equities are pricing in strong capex intentions but geopolitical conflicts would weigh on those intentions, while new orders and core durable goods orders could suffer a bit (Chart 13). The midterms will come into focus later this year and weigh on industrials as well. Chart 12Close Long Industrials Trade For Now
Close Long Industrials Trade For Now
Close Long Industrials Trade For Now
Chart 13Industrials Still Attractive On Cyclical Basis
Industrials Still Attractive On Cyclical Basis
Industrials Still Attractive On Cyclical Basis
Cyclically stick with cyber security stocks. They have sold off along with the tech sector as interest rates rise. But long cyber security is a secular investment thesis based on digitization of the economy, rising cyber crime, and geopolitical risk. Tensions with Russia, proxied by the fall in the ruble and rise in aerospace/defense stocks, point to the fact that investors recognize international tensions will remain high (Chart 14). Cyber space will remain an area of conflict even if physical conflict does not materialize. Growth stocks should also revive later as midterm policy uncertainty picks up. Chart 14Cyber Security Is A Secular Trade ... Buy The Dip
Cyber Security Is A Secular Trade ... Buy The Dip
Cyber Security Is A Secular Trade ... Buy The Dip
Chart 15Overweight Health Care Amid Political Risk
Overweight Health Care Amid Political Risk
Overweight Health Care Amid Political Risk
Tactically stick with overweight health care on rising uncertainty and expectations that the dollar will pick up (Chart 15). Defensives, especially health, should also outperform as the year goes on and midterms approach. Pricing power is returning to the sector but the Biden administration only has a little legislative ammunition left and its regulatory focus lies elsewhere for now. Matt Gertken Vice President US Political Strategist mattg@bcaresearch.com Strategic View Open Tactical Positions (0-6 Months) Open Cyclical Recommendations (6-18 Months) Table A2Political Risk Matrix
Biden’s External Risks
Biden’s External Risks
Table A3US Political Capital Index
Biden’s External Risks
Biden’s External Risks
Image
Image
Table A4APolitical Capital: White House And Congress
Biden’s External Risks
Biden’s External Risks
Table A4BPolitical Capital: Household And Business Sentiment
Biden’s External Risks
Biden’s External Risks
Table A4CPolitical Capital: The Economy And Markets
Biden’s External Risks
Biden’s External Risks
Highlights Banks, households, and businesses are still swimming in cash: Asset purchases and zero rates are ending, but banks, households and businesses have more cash than they know what to do with. It will not be easy for the Fed to mop up enough accommodation to slow the economy in a material way this year. The flood of liquidity may be a headwind for interest rates in 2022, … : The biggest banks have positioned themselves to benefit from rising rates and may limit the backup in yields as they deploy their unused capital hoard into it. … and protect equities from suffering meaningful de-rating: All the money has to go somewhere, and equities may be the default winner if bonds and cash are poised to deliver negative real returns. The rosy near-term outlook implied by the biggest banks’ observations suggests that the bull market in risk assets isn’t over yet: Households have ramped up spending but have barely begun to tap into their excess savings and businesses are confident and well-heeled. Above-trend economic growth should bolster corporate earnings, credit performance and financial asset prices, keeping the bull market going through the end of the year. What The Banks See The SIFI banks (BAC, C, JPM and WFC) and USB kicked off fourth quarter earnings across three days bracketing the Martin Luther King long weekend. Their performance wasn’t bad – the SIFIs squarely beat analysts’ consensus estimates and USB came up about 3% short – but investors apparently wanted more from a group that had burst out of the gate to start 2022. Banks were market darlings in the year’s first nine sessions as investors sought out stocks that could outperform in a rising rate environment, and the SIFIs and USB beat the S&P 500 by 12 percentage points (Chart 1). Over the three sessions that they reported earnings, they gave back more than a third of their relative outperformance, though they still have a 7-point year-to-date advantage. Chart 1Rate Play
Rate Play
Rate Play
Our focus, however, is not on the banks themselves or their stocks’ relative performance. We’re after what the principal financial intermediaries are seeing from their privileged vantage point into activity across the economy. We examine the banks’ earnings releases and listen to their earnings calls for insight into the broad macro backdrop as revealed by borrower performance, lender willingness, the state of the financial system and the actions and intentions of households and businesses. Considering the banks’ calls from that perspective, several growth-friendly themes emerged. Households remain flush with cash, even at the lower end of the wealth distribution, heralding robust 2022 consumption. Deposits from households and businesses continue to pile up, supporting credit performance and likely pushing out the date when net charge-off rates will rise to more normalized levels. The deposit flows are increasing the banks’ capacity to lend, and they are champing at the bit to deploy their cash into new loans. Investment banking pipelines are full and rampant liquidity should see to it that new debt and equity offerings meet with a warm reception once they come to market, as long as the current bout of market turbulence doesn’t lead to a lasting rollback in animal spirits. All in all, the banks’ observations affirmed our constructive take on the economy through at least the end of the year. Households are already spending in a way that validates our time-release view of fiscal transfers and their incomes have apparently risen enough that they have not yet begun to deplete the savings they built up from Congress’ pandemic largess. Businesses remain flush and are looking to replenish depleted inventories to reduce their vulnerability to supply chain disruptions. M&A activity is still hot and underwriting calendars are full. Yields are poised to rise as the Fed dials down monetary accommodation, but it’s possible the banks’ eagerness to put their idle cash to work will help limit how high they can go. Households Have Been Spending (Chart 2), But They Still Have Loads Of Dry Powder (Chart 3) … [F]or the holiday period of November and December, [debit and credit] spending was up 26% over 2019. … And so far this year that strength continues. [S]pending of all types through January 17 … [was] up over 11% versus the start of ’21, which is well up over ’20 and ’19, and that bodes well for the rest of the year and quarter. (Moynihan, BAC CEO) Chart 2You Can't Keep An Avid Consumer Down
You Can't Keep An Avid Consumer Down
You Can't Keep An Avid Consumer Down
Chart 32 Trillion Of Excess Savings ...
2 Trillion Of Excess Savings ...
2 Trillion Of Excess Savings ...
[C]ombined credit and debit [card] spend was up 27% versus the fourth quarter of 2019, with each quarter in 2021 showing sequential growth compared to 2019. Within that, travel and entertainment spend was up 13% versus 4Q19, though we have seen some softening in recent weeks contemporaneously with the Omicron wave. (Barnum, JPM CFO) Consumer credit card spend also continued to be strong, up 28% from the fourth quarter of 2020 and up 27% from the fourth quarter of 2019. All spending categories were up in the fourth quarter compared to a year ago, with the largest increases in travel, fuel, entertainment and dining. (Scharf, WFC CEO) [W]hile there is some softening [from Omicron] in restaurant, travel and entertainment in recent weeks, overall spending remained strong in the first week of January with credit card up 26% and debit card up 29% versus the same week in 2020. (Scharf, WFC) [W]e are seeing increases in [card] spend volume … across the board, [with] branded card spend volumes up 24% and retail services spend volumes up 16%[.] People are using our cards, which is a good thing. (Mason, C CFO) [C]onsumer[s] [are] in really good shape, … spending … 25% more than they spent pre-COVID, 25% more. And that number drives all the order books for everybody else. (Dimon, JPM CEO) We believe there’s lots of potential spending capacity left as average deposit balances (Chart 4) continue to move up … despite … heavy spending[.] We had [only] one cohort of deposits that dipped [in any] month [in] the last part of the year: … customers who had balances of $2,000 or less pre-pandemic [saw their balances] dip by 1% [in November]. Other than that, every cohort from June [through] December [had their balances] grow every month. And what’s striking is that the balances for people who had less than $2,000 average balances before the pandemic [now have] five times [their pre-pandemic] balances. [C]ustomers who had $10,000 in their accounts before the pandemic are now sitting with two times [that] in their accounts. (Moynihan, BAC) Chart 4... Are Sitting In Checking Accounts, Waiting To Be Spent
... Are Sitting In Checking Accounts, Waiting To Be Spent
... Are Sitting In Checking Accounts, Waiting To Be Spent
Chart 5
… Helping Credit Performance (Chart 5) And Keeping A Lid On Card Balances (Chart 6) Chart 6Cash-Rich Consumers Don't Need To Carry Credit Card Balances
Cash-Rich Consumers Don't Need To Carry Credit Card Balances
Cash-Rich Consumers Don't Need To Carry Credit Card Balances
The asset quality of our customers remains very healthy and net charge-offs this quarter fell to a historical low of … 15 basis points of average loans. … Our credit card loss rate was 1.42%, … less than half of the pre-pandemic rate, [and] it improved in every quarter during the year. (Borthwick, BAC CFO) [O]ur 30, … 60 or 90 days past [due consumer loans] are staying at … low levels. … [C]ustomer [checking account] balances, elevated in some cases five times [above] … pre-pandemic levels … probably account for a lot of the consumer credit quality improvement. We’re anticipating at some point it will go back towards more normal historical levels. We just think it’s going to bump around here for a little while. (Borthwick, BAC) [W]e’re exiting the fourth quarter with a card net charge-off rate of … something like 1.2% -- -- Which you’ll never see again (Barnum and Dimon, JPM) [C]redit card [charge-offs] has been a number that we’ve never seen in our lives. Middle market has been lower than ever. … Mortgages have been lower than ever. They’re all low. Eventually, they’re going to normalize. (Dimon, JPM) In terms of [card] losses, … [we are seeing] very low loss levels. [W]hen I look at the delinquency trend, there’s really nothing to focus on there. [Delinquencies] remain quite low and we don’t see any signs or areas of concern. (Mason, C) Payment rates do remain stubbornly high, [negatively] impacting our loan growth … in [our] cards businesses. (Mason, C) Consumer credit performance remains strong with higher collateral values for homes and autos and consumer cash reserves remain[ing] above pre-pandemic levels. (Santomassimo, WFC CFO) Credit quality remains strong. Over the next few quarters, we expect the net charge-off ratio to remain lower than historical levels, but normalize over time as the effects of the pandemic continue to subside. (Dolan, USB CFO) Business Borrowing May Be Turning A Corner (Chart 7) Chart 7Are Middle-Market Corporate Borrowers Really Back?
Are Middle-Market Corporate Borrowers Really Back?
Are Middle-Market Corporate Borrowers Really Back?
[Sequential] growth was broad-based across all commercial lending segments. We saw improvement in new loans as well as improvement in utilization from existing clients. … In the all-important small business segment, lending activity is running consistently above pre-pandemic levels. (Moynihan, BAC) We are seeing an uptick in revolver utilization rates, … and it remains sort of skewed to the smaller clients. But we are starting to see an uptick … even in the bigger clients. … [O]ne driver of that is CEOs and management teams have been burned by low inventory levels as a result of the supply chain problems, wanting to run higher inventories and that is maybe driving higher utilization. … At the same time, we’re hearing quite a bit of confidence in the C suites, and all else equal that should be positive for C[ommercial]&I[ndustrial] loan growth. The levels there are modest still in a world where capital markets have been exceptionally receptive to … [bond] issuance … and so people [have been] well-funded [by the] capital markets. (Barnum, JPM) Commercial loan balances started to increase late in the third quarter and have now grown for four consecutive months with growth accelerating in December. … Increases in middle-market banking were driven by growth from our larger clients, a modest uptick in revolver utilization and strong seasonal borrowing. Growth in asset-based lending and leasing was driven by new client wins as well as increased levels from higher prices and some increase in inventory levels. (Santomassimo, WFC) We are encouraged by the loan growth momentum and we have a positive outlook for 2022, given improving client sentiment and business conditions, and continued strength in certain focused commercial portfolios, such as asset-backed securitization lending and supply chain financing. (Cecere, USB CEO) [W]e’re now starting to see a nice shift with respect to the commercial and the C&I portfolios. … At the end of the fourth quarter, we saw nice expansion of utilization rates, … like 60 basis points on average from the third quarter, but in December it was up almost 2.5%. … [P]eople are rebuilding their inventories on the commercial side. I think … they still have some [supply chain] concerns, so I think they’re being cautious about making sure they have inventory to be able to run their business. And I think they’re starting to make business investment ahead of the consumer spend and the economic growth they see in 2022. (Dolan, USB) [The] number one fourth-quarter trend that looks positive going into 2022 is the increase in utilization rates, which we haven’t seen for a number of quarters. (Cecere, USB) Banks Have Tons Of Dry Powder (Chart 8) And Want To Put It To Work (Chart 9) When The Time Is Right Chart 8Water, Water Everywhere And Not A Drop To Drink
Water, Water Everywhere And Not A Drop To Drink
Water, Water Everywhere And Not A Drop To Drink
Chart 9Banks Are Eager To Lend
Banks Are Eager To Lend
Banks Are Eager To Lend
Given continued deposit growth and low rates, our asset sensitivity to rising rates remains significant. (Borthwick, BAC) [W]e still have significant dry powder to put to work with either client demand [loans] or in an increasing rate environment [securities], which we expect. (Mason, C) [W]e have huge firepower to grow, to expand, to make loans, to extend duration. I’ve never seen a bank with [our level of] liquidity: $1.7 trillion in cash and marketable securities and $1 trillion in loans. There’s $500 or 600 billion of those cash and marketable securities that could be deployed in higher-yielding assets or loans when and if the time comes. (Dimon, JPM) [Our] expectation is that when long-term rates rise, which we’re starting to see now, we’re going to be able to take advantage of the rising rate environment. … We [deployed some cash into securities] in the fourth quarter but employed hedging strategies to keep the duration of those purchases relatively short … to maintain as much asset sensitivity going into 2022 as we possibly could. (Dolan, USB) [W]e want maximum flexibility as long-term rates start to rise. (Dolan, USB) Investment Implications Chart 10Comeback Or Head Fake?
Comeback Or Head Fake?
Comeback Or Head Fake?
The biggest banks told a consistent story about the US economy on their earnings calls. Activity is rising, as evidenced by avid consumption that gathered momentum across 2021, a pickup in business and consumer appetite for borrowing that quickened toward the end of the year (Chart 10), and expressions of confidence from businesses that are directing capital to replenishing inventories and buying equipment. Credit performance is tremendously strong with record-low net charge-off rates and low delinquency rates underpinned by bloated business and consumer deposit balances. Abundant cash reserves provide further fuel for consumption and should keep GDP growth well above its trend level. The growth and credit tailwinds suggest that a recession is not lurking around the corner and therefore offer a green light for investors to overweight equities within multi-asset portfolios. As detailed in the last two reports on rate hikes’ impact, we do not view the recent equity turbulence, triggered by a surge in Treasury yields, as the start of an inflection point for financial markets. We are inclined to see the decline as more of a buying opportunity than a herald of a new shift in the business cycle. The Fed has the means to slow the economy if it sets its mind to it but given the amount of cash that is overwhelming banks, businesses, households and investors, draining enough accommodation to do so by the end of 2022 is an awfully tall order. Doug Peta, CFA Chief US Investment Strategist dougp@bcaresearch.com
Dear Client, The subject of cryptocurrencies elicits more emotion that any topic I can think of. As is true for the broader investment community, there is no unanimity of opinion among BCA strategists on the matter. This week, our Global Asset Allocation team is publishing a report taking a favorable view on NFTs. My report is far less sanguine on NFTs and the broader crypto landscape. I hope you enjoy the spirited debate. Best regards, Peter Berezin, Chief Global Strategist Highlights The price of Bitcoin and other cryptocurrencies has become increasingly correlated with the direction of equities. Stocks should recover over the coming months as bond markets stabilize and corporate earnings continue to expand thanks to a resurgent global economy. This could give cryptos a temporary lift. The long-term outlook for cryptocurrencies remains daunting, however. In most cases, anything that cryptocurrencies can do, the existing financial system can do better. Many of the most hyped blockchain applications, from DeFi to NFTs, will turn out to be duds. Concerns that cryptocurrencies are harming the environment, contributing to crime, and enriching a small group of early investors at the expense of everyone else will lead to increased regulatory scrutiny. Our long-term target for Bitcoin is $5,000. Investors looking to hedge their risks should consider going long Cardano, Solana, and Polkadot (three up-and-coming “proof of stake” coins) versus Bitcoin, Litecoin, and Doge (three doomed “proof of work” coins). The Cost Of Crypto Who pays for cryptocurrencies? That may seem like a simple question with a simple answer: The people who buy them!
Chart 1
Yet, as economists have long known, purchases can produce externalities – costs or benefits that are borne by someone other than the person making the purchase. Some purchases can produce positive externalities, such as when you buy nice flowers to plant in front of your house. Other purchases produce negative externalities, such as when you buy a product that harms the environment. The negative externalities arising from Bitcoin mining are well known. A single Bitcoin transaction consumes 14 times as much energy as 100,000 Visa transactions (Chart 1). Bitcoin’s annual electricity consumption exceeds that of Pakistan and its 217 million inhabitants (Chart 2). The growth in crypto mining is one reason why electricity prices are so high in many countries.
Chart 2
Chart 3
Crime is another negative externality that cryptocurrencies facilitate. Bitcoin first entered the popular lexicon in 2013 when its price briefly eclipsed $1,000 due to rising demand for the currency as a medium of exchange on Silk Road and other parts of the so-called dark web. Fast forward to today and crime continues to be a major problem for the crypto industry. According to Chainalysis, illicit addresses received $14 billion in 2021, almost double 2020 levels (Chart 3). Scamming revenue grew 82% while cryptocurrency theft rose 516%. Don’t Feed The Whales There is another cost arising from cryptocurrencies that is rarely mentioned – a cost borne by people who have never bought cryptocurrencies and probably assume they are immune from the vagaries of crypto markets: The holders of regular fiat money. Early investors in today’s most popular cryptocurrencies are sitting on huge profits. A recent study found that 1% of Bitcoin holders control 27% of supply. Ownership is even more concentrated for most other cryptocurrencies (Chart 4).
Chart 4
If these whales were to sell their coins, they could purchase billions of dollars of goods and services. But since there is no indication yet that the proliferation of cryptocurrencies has expanded the aggregate supply of goods and services, their purchasing power must come at someone else’s expense.1 Still Waiting Cryptocurrency proponents would counter that blockchain technologies will usher in a golden age of innovation. Based on this perspective, Bitcoin is a lot like Amazon, a company that created immense wealth for Jeff Bezos and other early shareholders, but has reshaped the global economy in a way that arguably left most people, including those who never bought Amazon stock, better off. The problem with this argument is that Bitcoin is nothing like Amazon. Chainalysis estimates that online merchants processed less than $3 billion in cryptocurrency transactions in 2020, a number that has barely grown over time (Chart 5). While updated numbers for 2021 will be released in February, our analysis of data from Coinmap suggests that the number of merchants accepting cryptocurrency increased less last year than in either 2017 or 2018 (Chart 6). This is consistent with anecdotal evidence which suggests that the vast majority of cryptocurrency transactions continue to be motivated by investment flows rather than e-commerce.
Chart 5
Chart 6
A Feature Not A Bug “Just wait and see,” crypto evangelists say. “Sure, Bitcoin has been around since 2008, but new applications are just around the corner.” There are good reasons to be skeptical of such pronouncements. The Bitcoin network can barely process five transactions per second, compared to over 20,000 for the Visa network (Chart 7). The fee for a Bitcoin transaction can fluctuate significantly, and is typically much greater than for a debit card (Chart 8). Chart 7We Apologize For The Wait
We Apologize For The Wait
We Apologize For The Wait
Chart 8It Costs A Lot To Fill Up The Crypto Tank
It Costs A Lot To Fill Up The Crypto Tank
It Costs A Lot To Fill Up The Crypto Tank
Bitcoin’s sluggishness is inherent to how it was designed. Due to their decentralized nature, blockchains must rely on elaborate procedures to prevent bad actors from taking control. Bitcoin and other popular cryptocurrencies such as Doge use the so-called “proof of work” algorithm. To see how this algorithm works in simple terms, think of spam email. One way of eliminating spam is to require everyone to waste $10 in electricity to send a single email. That is effectively how Bitcoin functions. It is secure, but it is also very clunky. An alternative to “proof of work” is “proof of stake.” Smaller cryptocurrencies such as Cardano and Solana use this algorithm, and Ethereum is in the process of migrating to it. Continuing with the spam analogy, imagine requiring everyone to put $10 down before they send an email. If the email is opened, the $10 is returned. If the email is deleted, the $10 is forfeited. A Solution In Search Of A Problem Proof of stake systems are arguably superior to proof of work systems since the former do not require wasteful energy consumption. But are they superior to the current financial system? That is far from clear. Listening to crypto enthusiasts, one would think that everyone is still using paper money, or perhaps shells or cattle, to make transactions. In fact, the global financial system is already nearly 100% digital. Digital transfer systems such as Zelle in the US and Interac in Canada permit instantaneous transfers at very little cost. Granted, cross-border payments are far from seamless. However, this largely reflects anti-money laundering rules and other regulations that banks must follow rather than some inherent technological limitations with, say, the SWIFT system. The DeFi Delusion Decentralized Finance, or DeFi, has become a hot topic of late. Like most things involving cryptocurrencies, there is more hype than substance. The idea that there will ever be large-scale crypto-denominated lending is wishful thinking. To see why, put yourself in the position of someone contemplating lending 25 bitcoins to a borrower who is interested in buying a house for, say, $1,000,000. On the one hand, if the price of bitcoin drops, you will likely be repaid, but in depreciated coins. On the other hand, if the price of bitcoin rises, you might not be repaid at all since the value of the loan will exceed the value of the house. Any way you cut it, there is no incentive to make the loan. There are other potential DeFi applications, such as those involving smart contracts, that could potentially prove useful. The Ethereum blockchain, where many of these contracts reside, is secured by ether (ETH). The market cap of ETH is currently $370 billion. How much ether is held for investment purposes and how much is held by people looking to make transactions on the Ethereum blockchain? It is impossible to be sure, but it would not surprise us if investment demand accounts for well over 90% of ETH holdings. It would be as if the price of oil rose to $1,000 per barrel, with 90% of that value driven by investment demand. Most people would agree that this would not be a sustainable situation. NFTs: Why So Ugly? Chart 9NFTs Have Taken Off
NFTs Have Taken Off
NFTs Have Taken Off
The popularity of non-fungible tokens (NFTs) has soared over the past year. During the past four weeks, more than $250 million of NFTs were traded on average every day, up from almost nothing at the beginning of 2021 (Chart 9). NFTs allow artists to transform their work into verifiable assets that can be listed and sold on the blockchain. Or at least that is the claim. When they were first introduced, the expectation was that the most desirable NFTs would turn out to be unique and beautiful. Instead, as the CryptoPunks collection aptly demonstrates, many turned out to be repetitive and ugly. Why? One plausible answer is that many NFT buyers are not really looking to acquire digital art. Instead, they are looking to buy supercharged proxies for the cryptocurrency in which the NFT is denominated. As evidence, consider that 99% of the discussions in NFT forums are about how much money NFT buyers hope to make rather than about the “art” itself. Shadow Crypto Supply If this interpretation is correct, it undermines one of the main selling points of cryptocurrencies: That they are limited in supply. Just like banks can create money out of thin air whenever they make loans, the blockchain can spawn synthetic assets such as NFTs that increase the effective supply of the underlying cryptocurrency.2 And that is just for a single cryptocurrency. There is nothing that obliges someone to list a smart contract on the Ethereum blockchain as opposed to any other blockchain. Indeed, there is no limit to the number of blockchains, and by extension, the number of cryptocurrencies that can be created. Chart 10 shows that there are currently more than 9,000 cryptocurrencies in circulation, up from 1,000 in 2017 and less than 100 in 2013. At least with gold, they are not adding any new elements to the periodic table.
Chart 10
The Paradox Of Low Gas Fees Competition among blockchains will favor those that offer the lowest “gas fees,” that is, those that require only a small amount of cryptocurrency to update their ledgers. As users abandon blockchains with high gas fees, the prices of their cryptocurrencies will fall. The cryptocurrencies of the more efficient blockchains will benefit, but probably not as much as one might assume. Just as the demand for petrol would decline if automobiles became much more fuel efficient but miles driven did not rise much, falling gas fees could reduce demand for cryptocurrencies unless activity on their blockchains increased proportionately more than the decline in prices. Crypto prices may fall dramatically if governments offer blockchain networks as a public good. The rollout of Central Bank Digital Currencies (CBDCs) could pave the way for this development. Concluding Thoughts On The Current Market Environment And Long-Term Outlook For Cryptos The price of Bitcoin and other cryptocurrencies has become increasingly correlated with the direction of equities (Chart 11). As we noted in our first report of the new year, average returns for the S&P 500 in January have been negative since 2000. This year has been especially trying given the rapid ascent in bond yields. Our end-2022 target for the US 10-year Treasury yield is 2.25%. Hence, while we expect yields to rise over the remainder of the year, the process should be a lot more gradual than over the past few weeks. Equities often experience a period of indigestion when yields rise sharply. However, as we stressed last week, stocks typically rebound as long as yields do not end up rising to prohibitive levels. The bull-bear spread in this week’s AAII poll fell back to its pandemic lows, a positive contrarian indicator for stocks (Chart 12). With global growth still firmly above trend, corporate earnings should rise by enough to propel stocks into positive territory for the year. A rebound in stock prices, in turn, could give cryptocurrencies a temporary lift. Chart 11Cryptocurrency Prices Have Become Increasingly Correlated With Stocks
Cryptocurrency Prices Have Become Increasingly Correlated With Stocks
Cryptocurrency Prices Have Become Increasingly Correlated With Stocks
Chart 12The Bull-Bear Ratio Is Back To Its Pandemic Lows
The Bull-Bear Ratio Is Back To Its Pandemic Lows
The Bull-Bear Ratio Is Back To Its Pandemic Lows
Nevertheless, the long-term outlook for cryptocurrencies remains daunting. In most cases, anything that cryptocurrencies can do, the existing financial system can do better. Many of the most hyped blockchain applications, from DeFi to NFTs, will turn out to be duds. Meanwhile, concerns that cryptocurrencies are harming the environment, contributing to crime, and enriching a small group of early investors at the expense of everyone else will lead to increased regulatory scrutiny. Chart 13New Money Versus Old Money
New Money Versus Old Money
New Money Versus Old Money
The prices of the most popular cryptocurrencies do not reflect this eventuality. Even after falling 32% from its highs, the aggregate market capitalization of cryptocurrencies is still only slightly less than the value of the entire stock of US dollars in circulation (Chart 13). Our long-term target for Bitcoin is $5,000. Investors looking to hedge their risks should consider going long Cardano, Solana, and Polkadot (three up-and-coming “proof of stake” coins) versus Bitcoin, Litecoin, and Doge (three doomed “proof of work” coins). Peter Berezin Chief Global Strategist peterb@bcaresearch.com Footnotes 1 One way that holders of fiat money could suffer is if the presence of cryptocurrencies reduced the demand for dollars, euros, and other central bank issued currencies. If that were to happen, inflation would rise as people sought to dispose of unwanted fiat currency by buying goods and services. Alternatively, if central banks wanted to constrain inflation, they would have to shrink the money supply by selling income-generating assets. Either way, the public would be worse off. 2 For instance, consider Alice and Bob. Both wish to have a certain amount of exposure to ETH in their investment portfolios. Suppose Bob uses some of his ETH to buy an item from the “Dopey Duck” collection that Alice has just minted. If Bob regards his NFT as a substitute for the ETH he previously held, he will not want to buy more ETH to replace the ETH he lost. In contrast, Alice will end up with more ETH than she previously owned, and hence, will need to sell some of it. All things equal, this will lead to a lower price for ETH. Global Investment Strategy View Matrix
Image
Special Trade Recommendations Current MacroQuant Model Scores
Image
Dear client, In lieu of our weekly bulletin next week, I will be hosting a webcast on Friday, January 28 at 11:00 am EST, to discuss recent dollar trends. I hope you all tune in. Kind regards, Chester Ntonifor Highlights While not often discussed, it is well known that the dollar is expensive. It is true that valuations tend to matter less until they trigger a tipping point. Such inflections usually coincide with huge external imbalances, especially generated by an overvalued exchange rate. The US dollar could be stepping into such a paradigm - the DXY is 1.5 standard deviations above fair value, at the same time as the goods trade deficit is hitting record lows, and real interest rates are deeply negative. More importantly, there has been limited precedence to such a dollar configuration. Historically, it has required much higher real interest rates, or an improving balance of payments backdrop, to justify such lofty valuations. Our trading model shows that selling a currency when it is expensive and buying it when it is cheap generates excess returns over time. Within our valuation ranking, the cheapest currencies are JPY, SEK and NOK. On a terms-of-trade basis, the AUD stands out as a winner. Feature Chart 1High Dollar Valuation And Ultra-Low Real Rates Is Unprecedented
High Dollar Valuation And Ultra-Low Real Rates Is Unprecedented
High Dollar Valuation And Ultra-Low Real Rates Is Unprecedented
Valuations usually get little respect when it comes to medium-term currency movements. This has been especially the case over the last few years, where the macroeconomic environment has been by far the biggest driver of the US dollar. The bull market in the dollar from 2011 to 2020 coincided with higher real interest rates in the US, relative to the rest of the developed world. In fact, since 2008, no developed market central bank has been able to hike rates by more than 200bps, except for the US Federal Reserve. Our report last week focused on why aggressive interest rate increases by the Federal Reserve could be bullish for the US dollar in the short term, but eventually set the stage for depreciation. In this report, we argue that valuations will also become a more important factor for currency strategy over the next 1-2 years (Chart 1). The Dollar And The External Balance The framework to understand currencies and the external balance is straightforward - a rising trade deficit (imports > exports) requires a lower exchange rate to boost competitiveness in the manufacturing sector, or less spending to reduce the trade deficit. Reduced domestic spending is unlikely in most developed economies, given ample pent-up demand and loose fiscal policy. Therefore, the natural adjustment mechanism for countries running wide trade deficits will have to be the exchange rate. Within a broad spectrum of developed and emerging market currencies, the US dollar stands out as overvalued on a real effective exchange rate basis (Chart 2A and 2B). It is true that valuations tend to matter less until they trigger a tipping point. Such inflections usually occur with a shift in animal spirits, coinciding with huge external imbalances.
Chart 2
Chart 2
In the US, these imbalances are already starting to trigger a shift. The US trade deficit is deteriorating, with the goods deficit hitting a record low of -$98bn in November. Over the last few years, it has become increasingly difficult to fund this widening trade deficit via foreign purchases of US Treasuries (Chart 3). Meanwhile, as we highlighted last week, substantial equity inflows over the last few years have started to roll over. In a nutshell, the basic balance in the US (the sum of the current account and foreign direct investment) is deteriorating at an accelerated pace (Chart 4). The US current account deficit for Q3 came in at -$214.8 billion, the widest in over a decade. This has reversed a lot of the improvement in the basic balance since the Global Financial Crisis. The dollar tends to decline on a multi-year basis when the basic balance peaks and starts deteriorating. Chart 4Deteriorating Balance Of Payments Dynamics US Balance Of Payments
Deteriorating Balance Of Payments Dynamics US Balance Of Payments
Deteriorating Balance Of Payments Dynamics US Balance Of Payments
Chart 3It Is Becoming Increasingly Difficult To Fund The Widening Deficit
It Is Becoming Increasingly Difficult To Fund The Widening Deficit
It Is Becoming Increasingly Difficult To Fund The Widening Deficit
Fiscal policy is likely to become tighter in the next couple of years, easing the domestic spending constraint for the exchange rate. That said, fiscal policy will remain loose compared to pre-pandemic levels and relative to underlying employment conditions. This has historically led to a deterioration in the external balance and pulled the real effective exchange rate of the dollar down (Chart 5). Chart 5The Dollar And The Budget Deficit
The Dollar And The Budget Deficit
The Dollar And The Budget Deficit
Real Interest Rates And The Dollar It is remarkable that at a time when real rates are the most negative in the US, the dollar is as overvalued as it has been in decades on a simple PPP model. This is a perfect mirror image of the dollar configuration at the start of the bull market in 2010, where the dollar was cheap and real rates were more supportive (Chart 1). According to economic theory, a currency should adjust to equalize returns across countries. This is a no-arbitrage condition. In the early 80s, an overvalued dollar was supported by very positive real rates. The subsequent dollar declines thereafter also coincided with falling real interest rates. In fact, over the last decade, it has been an anomaly that the dollar is so strong despite relative real interest rates being so negative (Chart 6). Our view remains that the terminal interest rate for the US should be higher than what is currently discounted in the 10-year Treasury yield. According to the overnight index swap curve, the Fed will not hike interest rates past 1.75%. This is much lower than past cycles and will keep real interest rates low. This does not justify an expensive greenback. Our shorter-term interest rate model also shows the DXY as slightly expensive, even though short-term interest rates have moved in favor of the dollar over the past year (Chart 7). Chart 6The Level Of Relative Real Yields Also Matters
The Level Of Relative Real Yields Also Matters
The Level Of Relative Real Yields Also Matters
Chart 7Our Timing Model Suggests ##br##A Pullback
Our Timing Model Suggests A Pullback
Our Timing Model Suggests A Pullback
Other Considerations While real effective exchange rates and purchasing power parity models are among our favorite valuation gauges, they are not foolproof. Countries with structurally higher inflation (and so a higher real effective exchange rate), could also have higher productivity. According to the Balassa-Samuelson Hypothesis, competitiveness in the tradeable goods sector will boost wages across all sectors of the economy, leading to higher prices. This argument particularly resonates with proponents that suggest the US is a fast-growing economy, and so will tend to run a current account deficit, like Australia during the commodity boom of the early 2000s. Meanwhile, the US earns more on its overseas assets than it spends on its liabilities, suggesting that the funding gap will eventually close. Unfortunately, the overvaluation of the dollar has not been due to higher relative productivity in the US, especially when compared to other economies. Across a broad spectrum of developed and emerging market economies, the dollar is expensive according to our productivity models. The Chinese RMB (which is much overvalued on a PPP basis) is closer to fair value when productivity is taken into consideration (Chart 8).
Chart 8
Meanwhile, the sizeable US deficit is not completely offset by its positive investment balance (Chart 9). This is occurring at a time when many faster growing countries (such as China for example) are generating current account surpluses (Chart 10A and 10B). In a nutshell, whether one looks at relative price levels, relative productivity trends, or relative real returns on government assets, the dollar is expensive. Chart 9The Positive Income Balance Has Not Helped The Us Investment Position
The Positive Income Balance Has Not Helped The Us Investment Position
The Positive Income Balance Has Not Helped The Us Investment Position
Chart 10
Chart 10
Conclusion Last summer, we introduced a trading model for FX valuation enthusiasts. We used both our in-house purchasing power parity models (PPP) and our intermediate-term timing models as valuation tools. Since the 2000s, both valuation models have outperformed a buy-and-hold currency strategy with much lower volatility (Chart 11). Currency valuation tends to matter over the longer term, while the macro environment tends to dominate short-term currency trading. Given that the dollar has been overvalued for the last three to five years, the above analysis suggests we might be entering this “longer-term” tipping point where valuations will start to matter more going forward. Within our valuation ranking, the cheapest currencies are JPY, SEK and NOK. On a terms-of-trade and productivity basis, the AUD stands out as a winner. This is being reflected in a record-high basic balance surplus (Chart 12). In our trade tables, we went long AUD at 70 cents, and will upgrade this to a high conviction bet on signs that currency volatility is ebbing. Chart 11A Trading Rule Solely Based On Valuation
A Trading Rule Solely Based On Valuation
A Trading Rule Solely Based On Valuation
Chart 12AUD And Balance Of Payments
AUD And Balance Of Payments
AUD And Balance Of Payments
Chester Ntonifor Foreign Exchange Strategist chestern@bcaresearch.com Trades & Forecasts Strategic View Tactical Holdings (0-6 months) Forecast Summary
Highlights Duration: A look at past rate hike cycles shows that Treasury returns are generally low, though not always negative. For the current cycle, we continue to recommend a below-benchmark portfolio duration stance as we don’t think the full extent of Fed rate hikes is adequately priced in the yield curve. Interest Rate Policy: The Fed will deliver its first rate hike in March and will lift rates 2 or 3 more times this year. We see the fed funds rate moving above 2% this cycle, higher than what is currently priced in the market. Fed Balance Sheet: The Fed will start the passive runoff of its securities holdings in the first half of this year, after one or two rate hikes have been delivered. Balance sheet reduction will proceed more quickly than it did last cycle, but the Fed will refrain from outright sales. Feature Chart 1Market Expectations Are Too Low
Market Expectations Are Too Low
Market Expectations Are Too Low
Rate hikes are just around the corner. In fact, there is a growing consensus among FOMC participants that it will be appropriate to deliver the first rate hike in March, as soon as net asset purchases reach zero. Just last week, San Francisco Fed President Mary Daly called a March rate hike “quite reasonable” and Fed Vice-Chair Lael Brainard testified that the Fed will be “in a position” to lift rates as soon as purchases end. Brainard also mentioned that the Fed has discussed shrinking its balance sheet.1 We expect the Fed to follow through with a 25 basis point rate hike in March, and with 2 or 3 more hikes over the course of 2022. We also see the Fed shrinking its balance sheet this year, via the passive runoff of maturing securities. With all that in mind, this week’s report draws on the experience of past rate hike cycles to give us a sense of what Treasury returns to expect as the Fed lifts rates. We also discuss how the Fed’s balance sheet will evolve over the next few years. Treasury Returns During Rate Hike Cycles Table 1 provides a useful summary of Treasury returns during the prior four rate hike cycles. The table shows excess Treasury returns versus cash for the Bloomberg Barclays Treasury Index as well as its Intermediate Maturity and Long Maturity sub-indexes. Table 1Treasury Returns During Fed Rate Hike Cycles
Positioning For Rate Hikes In The Treasury Market
Positioning For Rate Hikes In The Treasury Market
The first conclusion we draw is that Treasury returns are generally poor during Fed tightening cycles. Intermediate maturity Treasuries underperformed cash in all four cycles. Long maturity Treasuries provided only modestly positive returns in two of the four cycles and deeply negative returns in one of them. One important caveat is that our analysis only considers cycles where the Fed lifted rates multiple times in a row. For example, we exclude the 1997-98 period when one rate hike in 1997 was quickly reversed in 1998. We also define the most recent tightening cycle as spanning from 2015 to 2018 even though the Fed kept the policy rate steady from December 2015 to December 2016. Obviously, if the Fed is forced to abandon its tightening cycle after one or two hikes, then Treasury returns will be much stronger than our historical analysis suggests. Next, let’s dig a bit deeper by looking at each rate hike cycle individually. The 2015-2018 Cycle Chart 22015-2018 Cycle
2015-2018 Cycle
2015-2018 Cycle
The most recent Fed tightening cycle started with a 25 basis point rate hike in December 2015. The Fed then went on hold for 12 months before delivering a string of 8 hikes between December 2016 and December 2018. All in all, the tightening cycle lasted 36 months and the Fed raised the target fed funds rate by 225 bps, from a range of 0% - 0.25% to a range of 2.25% - 2.5% (Chart 2). If we look at the 36-month discounter on the day before the first hike (Chart 2, panel 3), it shows that the market was priced for 159 bps of tightening over the next three years. The fact that the Fed delivered more tightening (225 bps) explains why excess Treasury returns were negative for short and intermediate maturities. The 5-year/5-year forward Treasury yield is another useful metric because it is a good approximation of the market’s expected terminal fed funds rate, i.e. the fed funds rate at the end of the tightening cycle. The 5-year/5-year forward Treasury yield stood at 2.92% in December 2015, slightly above where the fed funds rate peaked in 2018 (Chart 2, bottom panel). This explains why long-maturity excess Treasury returns were slightly positive during the cycle. The 2004-2006 Cycle Chart 32004-2006 Cycle
2004-2006 Cycle
2004-2006 Cycle
During this cycle, which spanned from June 2004 to June 2006, the Fed lifted rates by 400 bps (sixteen 25 basis point rate hikes). The fed funds rate rose from 1% to 5.25% during the two-year span (Chart 3). The 24-month fed funds discounter stood at 369 bps the day before the first hike (Chart 3, panel 3), indicating that the market discounted 31 bps less tightening than was ultimately delivered. Once again, this explains why excess Treasury returns were negative for short and intermediate maturities. The 5-year/5-year forward Treasury yield was 5.72% just prior to the first hike in June 2004 (Chart 3, bottom panel). But, as was the case in the 2015-2018 cycle, the fed funds rate never reached this level. It peaked at 5.25% in 2006 and long-maturity excess Treasury yields were somewhat positive as a result. The 1999-2000 Cycle Chart 41999-2000 Cycle
1999-2000 Cycle
1999-2000 Cycle
In this cycle, the Fed lifted rates by 175 bps between June 1999 and May 2000, driving the fed funds rate from 4.75% to 6.5% (Chart 4). The 12-month fed funds discounter stood at 108 bps on the day before the first hike (Chart 4, panel 3). Once again, this was slightly less than the 175 bps of tightening that transpired. Excess returns for short and intermediate maturity Treasuries were negative as a result. The 5-year/5-year forward Treasury yield was 5.99% on the day before the first hike (Chart 4, bottom panel). This time, the market’s assessment proved to be too low compared to the funds rate’s 6.5% peak. This divergence explains why long-maturity Treasury excess returns were worse during this period than they were in the 2015-18 and 2004-06 cycles. The 1994-1995 Cycle Chart 51994-1995 Cycle
1994-1995 Cycle
1994-1995 Cycle
The Fed surprised markets by lifting rates extremely quickly during this cycle. The Fed moved rates from 3% to 6% in the span of only 12 months between February 1994 and February 1995 (Chart 5). The 12-month discounter was only 130 bps at the beginning of the tightening cycle, well short of the 300 bps rate increase that was delivered (Chart 5, panel 3). This large divergence explains why excess Treasury returns were so poor during this period. Interestingly, the 5-year/5-year forward Treasury yield stood at 6.69% just prior to the first hike (Chart 5, bottom panel), not that far from the ultimate peak in the fed funds rate. In other words, while market expectations for the near-term path of interest rates were too low, expectations for the ultimate peak in interest rates were fairly accurate. However, terminal rate expectations became unmoored when the Fed started to tighten, and the 5-year/5-year forward Treasury yield rose all the way to 8.5%, far above the fed funds rate’s ultimate peak. This dramatic shift in terminal rate expectations explains the deeply negative long-maturity Treasury returns observed during the period. Of course, those losses were quickly reversed in H1 1995 once it became clear that the Fed would not lift rates further. The 5-year/5-year forward Treasury yield plummeted back to 6.5%. Investment Implications Let’s apply the above analysis to today’s situation. At present, the 12-month fed funds discounter stands at 93 bps. The 24-month discounter is 151 bps and the 36-month discounter is 159 bps (Chart 1). In other words, the market is discounting that the Fed will deliver between 3 and 4 rate hikes this year, but only 2 more in 2023 before the funds rate stabilizes at roughly 1.5%. Our expectation is that the fed funds rate will rise to at least 2% during the next three years, and we therefore continue to recommend running below-benchmark portfolio duration. For its part, the 5-year/5-year forward Treasury yield is currently 2.03%. This is at the low-end of survey estimates for the long-run neutral fed funds rate (Chart 1, bottom panel). We expect the 5-year/5-year forward Treasury yield to rise closer to the middle of the range of survey estimates (~2.25%) as it becomes clear that the fed funds rate will rise to at least 2%. It’s also possible that, like in the 1994-95 episode, terminal rate expectations will rise dramatically as the Fed lifts rates more quickly than anticipated. This, however, is not our base case outlook given that expectations for a low terminal fed funds rate are very well entrenched. Bottom Line: A look at past rate hike cycles shows that Treasury returns are generally low, though not always negative. For the current cycle, we continue to recommend a below-benchmark portfolio duration stance as we don’t think the full extent of Fed rate hikes is adequately priced in the yield curve. The Balance Sheet Outlook Chart 6Hike First, Then QT
Hike First, Then QT
Hike First, Then QT
We expect the Fed to start shrinking its securities holdings this year. The process will probably begin in the first half of the year after one or two rate hikes have been delivered. To arrive at this conclusion, we first look at how the Fed proceeded during the last tightening cycle. Back then, the Fed waited until the funds rate was around 1% before it started to shrink its balance sheet in September 2017 (Chart 6). Notably, the Fed didn’t immediately move toward the full passive runoff of its portfolio. Rather, it started slowly by permitting only $6 billion of Treasuries and $4 billion of MBS to mature in October 2017. These amounts were gradually increased in the subsequent months. The Fed will move more quickly toward balance sheet reduction this cycle and the pace of said reduction will be faster. Here are the relevant passages from the minutes of the December FOMC meeting: Almost all participants agreed that it would likely be appropriate to initiate balance sheet runoff at some point after the first increase in the target range for the federal funds rate. However, participants judged that the appropriate timing of balance sheet runoff would likely be closer to that of policy rate liftoff than in the Committee’s previous experience. […] Many participants judged that the appropriate pace of balance sheet runoff would likely be faster than it was during the previous normalization episode. Many participants also judged that monthly caps on the runoff of securities could help ensure that the pace of runoff would be measured and predictable…2 From these quotes, we surmise that balance sheet runoff will start earlier than last time – after one or two rate hikes instead of four. Also, while the runoff will proceed more quickly than last time, there is still support for maintaining monthly caps on the pace. The Fed will probably not move immediately to the complete passive runoff of its portfolio, and outright bond sales do not appear to be part of the discussion. One concern that investors might have about the Fed’s balance sheet runoff is the extra supply of Treasuries that will hit the market. As an upper-bound, if we assume complete passive runoff starting in April 2022, the Fed’s Treasury holdings will shrink from $5.7 trillion today to $3.5 trillion by the end of 2024, adding an average of $715 billion extra Treasury supply to the market each year (Chart 7). If we exclude T-bills and TIPS to focus only on coupon-paying nominal Treasury securities, then we calculate that Fed holdings will fall from $4.9 trillion to $3 trillion, adding an extra $639 billion of supply to the market on average for the next three years. However, it’s important to note that Fed policy alone doesn’t dictate the supply of Treasury securities. The Treasury department’s issuance plans also need to be considered. When the Fed allows a maturing bond to passively roll off its portfolio it doesn’t dump that bond directly into the market. Rather, the Treasury Department issues new debt to replace the maturing bond. The Treasury could decide, for example, to increase T-bill issuance instead of coupon issuance. In fact, this sort of decision becomes more likely if Treasury officials are concerned about dumping too much coupon supply on the market. Currently, the Treasury Department targets a range of 15% - 20% for the amount of outstanding T-bills as a proportion of the overall funding mix, a target that it is hitting (Chart 8). However, the minutes from the most recent Quarterly Refunding meeting stressed that the Treasury feels the need to maintain “flexibility” when it comes to this target range and noted that “there is likely more leeway at the top of the recommended range than at the bottom.”3 Chart 7The Pace Of ##br##Runoff
The Pace Of Runoff
The Pace Of Runoff
Chart 8T-bill Issuance Could Rise As The Fed's Portfolio Shrinks
T-bill Issuance Could Rise As The Fed's Portfolio Shrinks
T-bill Issuance Could Rise As The Fed's Portfolio Shrinks
Finally, it is important to consider the extent to which the Fed will be able to shrink its balance sheet. The Fed’s goal will be to achieve a reserve supply that allows it to maintain the funds rate within its target band without putting undue pressure on either its Overnight Reverse Repo Facility (ON RRP) or its new Standing Repo Facility (SRF). Chart 9The Fed's Balance Sheet Was Too Small In September 2019
The Fed's Balance Sheet Was Too Small In September 2019
The Fed's Balance Sheet Was Too Small In September 2019
The ON RRP acts as a floor on interest rates and its usage therefore increases when the Fed’s balance sheet is too large. The third panel of Chart 9 shows that this is currently the case. Conversely, the SRF acts as a ceiling on interest rates and its usage will ramp up if the Fed’s balance sheet becomes too small. This last occurred in September 2019 when the Fed briefly lost control of interest rates and was forced to increase repo holdings and reserve supply (Chart 9). Going forward, the Fed will continue to run down its balance sheet until ON RRP usage drops close to zero. However, it will want to stop reducing its holdings before SRF usage picks up. It is highly uncertain when this will occur, but we suspect that the Fed won’t be able to get the balance sheet back to September 2019 levels before seeing SRF usage increase. Bottom Line: The Fed will start the passive runoff of its securities holdings in the first half of this year, after one or two rate hikes have been delivered. Balance sheet reduction will proceed more quickly than it did last cycle, but the Fed will refrain from outright sales. While the size of the Fed’s balance sheet will shrink during the next few years, it will remain larger than it was in September 2019. Ryan Swift US Bond Strategist rswift@bcaresearch.com Footnotes 1 Please see https://www.reuters.com/business/exclusive-feds-daly-march-liftoff-is-quite-reasonable-2022-01-13/ and https://www.nbcnews.com/business/economy/interest-rate-hike-come-soon-march-feds-brainard-signals-rcna12112 2 https://www.federalreserve.gov/monetarypolicy/files/fomcminutes20211215.pdf 3 https://home.treasury.gov/news/press-releases/jy0464 Recommended Portfolio Specification Other Recommendations Treasury Index Returns Spread Product Returns
Highlights It’s true that rising rates often precipitate bear markets, but it takes a while, … : We subscribe to the view that expansions are more likely to be murdered by the Fed than die of old age. It’s hard to envision a plausible scenario in which the Fed could hike rates enough in 2022 to kill this one, though, and even the first half of 2023 would be a reach. … because the Fed only seeks to slow the economy when it’s firing on all cylinders: Earnings are typically growing at a rapid clip and risk aversion is a distant memory when the Fed begins the process of draining the punch bowl. The fed funds rate tipping point can only be definitively identified after the fact, but our estimate has an impressive track record: No one knows for sure where the line of demarcation between easy and tight monetary policy lies, but equities have shined when the fed funds rate is below our equilibrium estimate. We do not share the view that Tech stocks are especially vulnerable to higher interest rates: Although it lacks empirical support outside of a small subset of observations, the Tech vulnerability view has spread more widely than the Omicron variant. Feature Last week’s report discussing the equity impact of impending rate hikes elicited a lot of reaction. A discussion with one investor usually has relevance for other investors, so we are sharing a composite of the questions we received, along with our responses. It gives us the chance to elaborate on some points that we did not previously address in full, but our conclusion remains unchanged. History argues that equities have little to fear from an incremental rate hike campaign, and we expect that they will generate sizable positive excess returns above Treasuries and cash over the next twelve months. The Fed, With Rate Hikes, In The Board Room Why shouldn’t investors be concerned about rate hikes when you yourself have said that the Fed precipitates recessions? As the last expansion stretched on for a record length of time, we regularly repeated the line that expansions don’t die of old age, they die because the Fed murders them. It fits well with our tipping point view of rate hikes and we wholly subscribe to it. It is important to bear in mind, however, that the Fed’s tools act much more slowly than the lethal array of objects in the game of Clue. As we highlighted last week, monetary policy acts with long and variable lags and the Fed accordingly tightens it in increments allowing for real-time feedback that might help it tailor its actions to evolving economic conditions. Ex-the pandemic, tight monetary policy has been a necessary, albeit not sufficient, recession condition for the 60 years covered by our equilibrium fed funds rate estimate. Although not every instance when the fed funds rate exceeded its equilibrium level preceded a recession, no recession occurred when the funds rate was below equilibrium (Chart 1). Owing to monetary policy’s lagged effects, however, the recessions didn’t begin until well after the Fed began to tighten policy. On average, each recession arrived 26 months after Phase I kicked off and 12 months after the policy cycle entered Phase II (Table 1). Peak growth occurs in the early stages of rate hikes, while the Fed is merely easing up on the gas; deceleration only ensues in the latter stages, when the Fed pushes down on the brake pedal. Chart 1Rate Hikes Are A Necessary, But Not Sufficient, Recession Condition ...
Rate Hikes Are A Necessary, But Not Sufficient, Recession Condition ...
Rate Hikes Are A Necessary, But Not Sufficient, Recession Condition ...
Table 1... And It Takes A While For The Economy To Feel Their Full Effect
Q&A About Rate Hikes And Stocks
Q&A About Rate Hikes And Stocks
Index P/E Multiples Don’t Collapse Overnight It’s often said that the Fed hikes rates until something breaks. If equities are ultimately going to break in the process, why wouldn’t a prudent investor read the first rate hike, or even the run-up to it, as a sign to begin reducing exposure? We showed last week that signal measures of economic activity – hiring, lending, spending and GDP – grow well above their through-the-cycle pace while the Fed is tightening policy. Corporate earnings do, too, and S&P 500 earnings expectations have risen most rapidly when the Fed is hiking rates, with Phase I growth nearly doubling aggregate growth (Chart 2, middle panel). Earnings gains are vulnerable to dilution from multiple de-rating, but Phase I multiples have been roughly flat in the aggregate (Chart 2, bottom panel). Perhaps investors recognize that equities don’t break until well after the Fed starts hiking rates, or double-digit earnings growth makes them lose sight of the likelihood that they eventually will. Chart 2Our Definitions Of The Phases Must Be Close To The Mark
Our Definitions Of The Phases Must Be Close To The Mark
Our Definitions Of The Phases Must Be Close To The Mark
Based on the empirical record, investors judged by their relative performance should not reduce equity exposure until the rate hiking campaign is well advanced. Phase I has produced the best returns of any phase in the 42 years that earnings expectations have been compiled and missing out on them could be harmful to a professional investor’s career (Chart 2, top panel). Today’s Starting Point Is Unusually Demanding Have equities ever been this expensive at the start of a tightening cycle? History suggests that equities can rally in a “normal” Phase I even after some initial turbulence, but how much scope do they have to rise from current valuation levels? There is unfortunately scarcely any empirical data to address this question. The nine Phase I episodes account for just eight years of the 42-year earnings expectations era and several of them are very short (Table 2). The one instance when forward multiples were at or above today’s levels, from June through October of 1999, they were able to hold their ground, falling less than a half of a multiple point, or 1.5%. Earnings expectations grew by 6.3% over that period, allowing the S&P 500 to advance at the rate of about 1% per month, in line with its overall Phase I performance since 1979. Table 2Multiples Have Held Their Ground In Phase I
Q&A About Rate Hikes And Stocks
Q&A About Rate Hikes And Stocks
Empirically, however, robust growth in earnings expectations is the basis for overweighting stocks in Phase I, not multiple expansion. We do not expect re-rating as the Fed pushes the funds rate toward its equilibrium level, and we are alert to the certainty that stocks will de-rate sometime in the future if forward multiples are still subject to mean reversion. History shows it won’t necessarily happen in Phase I, though, and TINA may stave it off while there is a dearth of non-equity options offering positive prospective real returns. Disclaimer (BCA Is Human, Too) How can you be certain that your estimate of the equilibrium rate is accurate? We are not certain at all about the level of the equilibrium rate, and nothing we’ve ever written or said should be construed as implying that we are. As we’ve said many times before, the equilibrium rate is a concept. It cannot be directly observed and our attempts to estimate it are no more than our best effort to gain a sense of where the tipping point for financial markets and the economy might be. Our current 3.25% estimate likely sounds quite high, but we take the estimates at any given point in time with a grain of salt. We are not so full of ourselves that we believe we can pin down an amorphous concept to two decimal places in real time, and we have found that thinking of the point estimate as falling within a plausible range is the best way to proceed. Right now, the US Investment Strategy team views the equilibrium rate as somewhere around 2.5% or higher. That’s all the precision we need to assert with high conviction that monetary policy is accommodative and will remain so for all of 2022 and much, if not all, of 2023. For all the inherent uncertainty of attempts to quantify the equilibrium rate, however, the sharp disparity in equity performance across easy and tight monetary policy settings suggests that we’re on the right track. We’re further encouraged by the clear distinctions in earnings and multiples growth across phases (Figure 1), which suggest that monetary policy settings exert a persistent influence on fundamentals and investor appetites. Given that equities have flourished when policy is easy, overweighting stocks in multi-asset portfolios should contribute to outperformance over the next twelve months. Monetary policy settings are not the be-all and the end-all, but we have found that they offer a very useful default guide to asset allocation.
Chart
Fooled By Randomness? The results have been robust over a lengthy period, but how do you know they’re not random? Why does the relationship you’ve cited work? We are convinced that the observed strong-growth/tighter-policy, tepid-growth/easier-policy relationship has a durable structural foundation. The through line is the fact that monetary policy is a blunt instrument that works with indeterminate lags. Its limitations influence the way the Fed deploys it and impose a predictable pattern on its economic and market impacts. The Fed is not quite the meddler that its Libertarian-minded critics make it out to be, hovering over the economy in a continuous effort to fine-tune it. Instead, it acts on a limited basis to ensure that the harms embedded in cyclical extremes do not prevent the economy from reaching its long-run potential. It deploys accommodative measures during recessions to keep hysteresis from turning a cyclical soft patch into a structural albatross and restrictive measures during high-revving expansions to keep the inflation genie from getting out of the bottle. The Fed does not want to root out green shoots before they can take hold, so it does not begin Phase I, or assiduously pursue it, until it is certain that the economy can withstand higher rates, especially while (lagging) inflation readings are tame (Chart 3). It therefore launches tightening cycles with a predictable bias to err on the side of being too easy. Chart 3Inflation Is A Lagging Indicator, ...
Inflation Is A Lagging Indicator, ...
Inflation Is A Lagging Indicator, ...
That bias allows the economy to gather momentum in Phase I, in line with cyclical peaks in activity and earnings growth, and outsized equity and credit returns. Left unchecked, the momentum could produce higher inflation, and the Fed is typically compelled to dial up intervention to counter it. Wielding a blunt instrument that works with a lag, however, the Fed is at risk of going too far, and Phase II hikes often induce a recession. Investors sniff out the looming downturn and de-rate equities. By the time the Fed reverses field and initiates a new easing campaign (Phase III), earnings growth has stalled out and measured inflation is peaking (Table 3). Equities mark time and credit spreads widen until, with a slowdown plainly evident and measured inflation sliding, the Fed shifts to full-on accommodation (Phase IV). It maintains market-friendly settings until the economy begins to look too strong, upon which it intervenes to hold it back, kicking off a new policy cycle. Table 3... Managed With Policy That Works With A Lag
Q&A About Rate Hikes And Stocks
Q&A About Rate Hikes And Stocks
As we showed last week, the direct relationship between activity and rates is immediately apparent in the real economy. Robust activity translates to robust earnings growth, but it is possible that equity multiples will behave differently in the approaching fed funds rate cycle than they have in the past. Although we expect that TINA will protect equities from meaningful de-rating pressure this year, investors should not lose sight of the fact that the earnings estimate era began with the S&P 500’s forward P/E multiple at 7. That rock-bottom starting point paved the way for an annualized 2.6% valuation increase over the last 42 years, but it cannot continue indefinitely, if at all. We are confident that multiples will continue to fare better when the Fed is cutting rates than when it is hiking them, but the cutting tailwinds will likely weaken going forward, while the hiking headwinds will stiffen. Don’t Believe The Hype Tech stocks are especially vulnerable to higher interest rates and the fate of US indexes is intimately bound up with them. Aren’t you dismissing the threat from higher rates a little too easily? The Tech sector’s outsized presence in the S&P 500 has surely contributed to market anxieties over looming rate hikes. We are firmly of the view, however, that popular concerns over Tech stocks’ interest rate vulnerability are way overdone. The idea that their back-loaded earnings profile makes them acutely vulnerable to a higher discount rate in the manner of long duration bonds ignores the fact that their future cash flows are not fixed. Unlike bonds, their owners' claims on earnings ebb and flow as rates rise and fall in line with economic conditions. Chart 4Relative Tech Multiples Have Mostly Moved With Rates, Not Against Them
Relative Tech Multiples Have Mostly Moved With Rates, Not Against Them
Relative Tech Multiples Have Mostly Moved With Rates, Not Against Them
Chart 5
We recently devoted a Special Report to pushing back against the idea that Tech stocks are hostage to interest rates. In it, we argued that a stock’s price can be viewed as the product of its earnings per share and its P/E ratio. The biggest Tech companies’ earnings have a low interest rate sensitivity because they have little debt and do not sell big-ticket items that their customers have to finance, so the purported inverse relationship between Tech stocks’ relative performance and interest rates must be a function of relative P/E multiple changes. Relative Tech multiples and interest rates consistently moved together in the ten years through 2018, however, and were only sporadically negatively correlated over the last three years (Chart 4). Duration is essential for describing the sensitivity of risk-free bond returns to changes in interest rates, but it is an uncomfortable fit with equities. Treasuries exhibit a nearly perfect inverse correlation with changes in interest rates (Chart 5, top panel), but the cash flow uncertainty introduced by even the modest credit risk associated with investment grade corporate bonds reduces the correlation considerably (Chart 5, second panel). Interest rates’ impact on equities is even more attenuated. The S&P 500 is only weakly – and positively – correlated with rates (Chart 5, third panel), just like its Tech sector constituents (Chart 5, bottom panel). Doug Peta, CFA Chief US Investment Strategist dougp@bcaresearch.com