Financial Markets
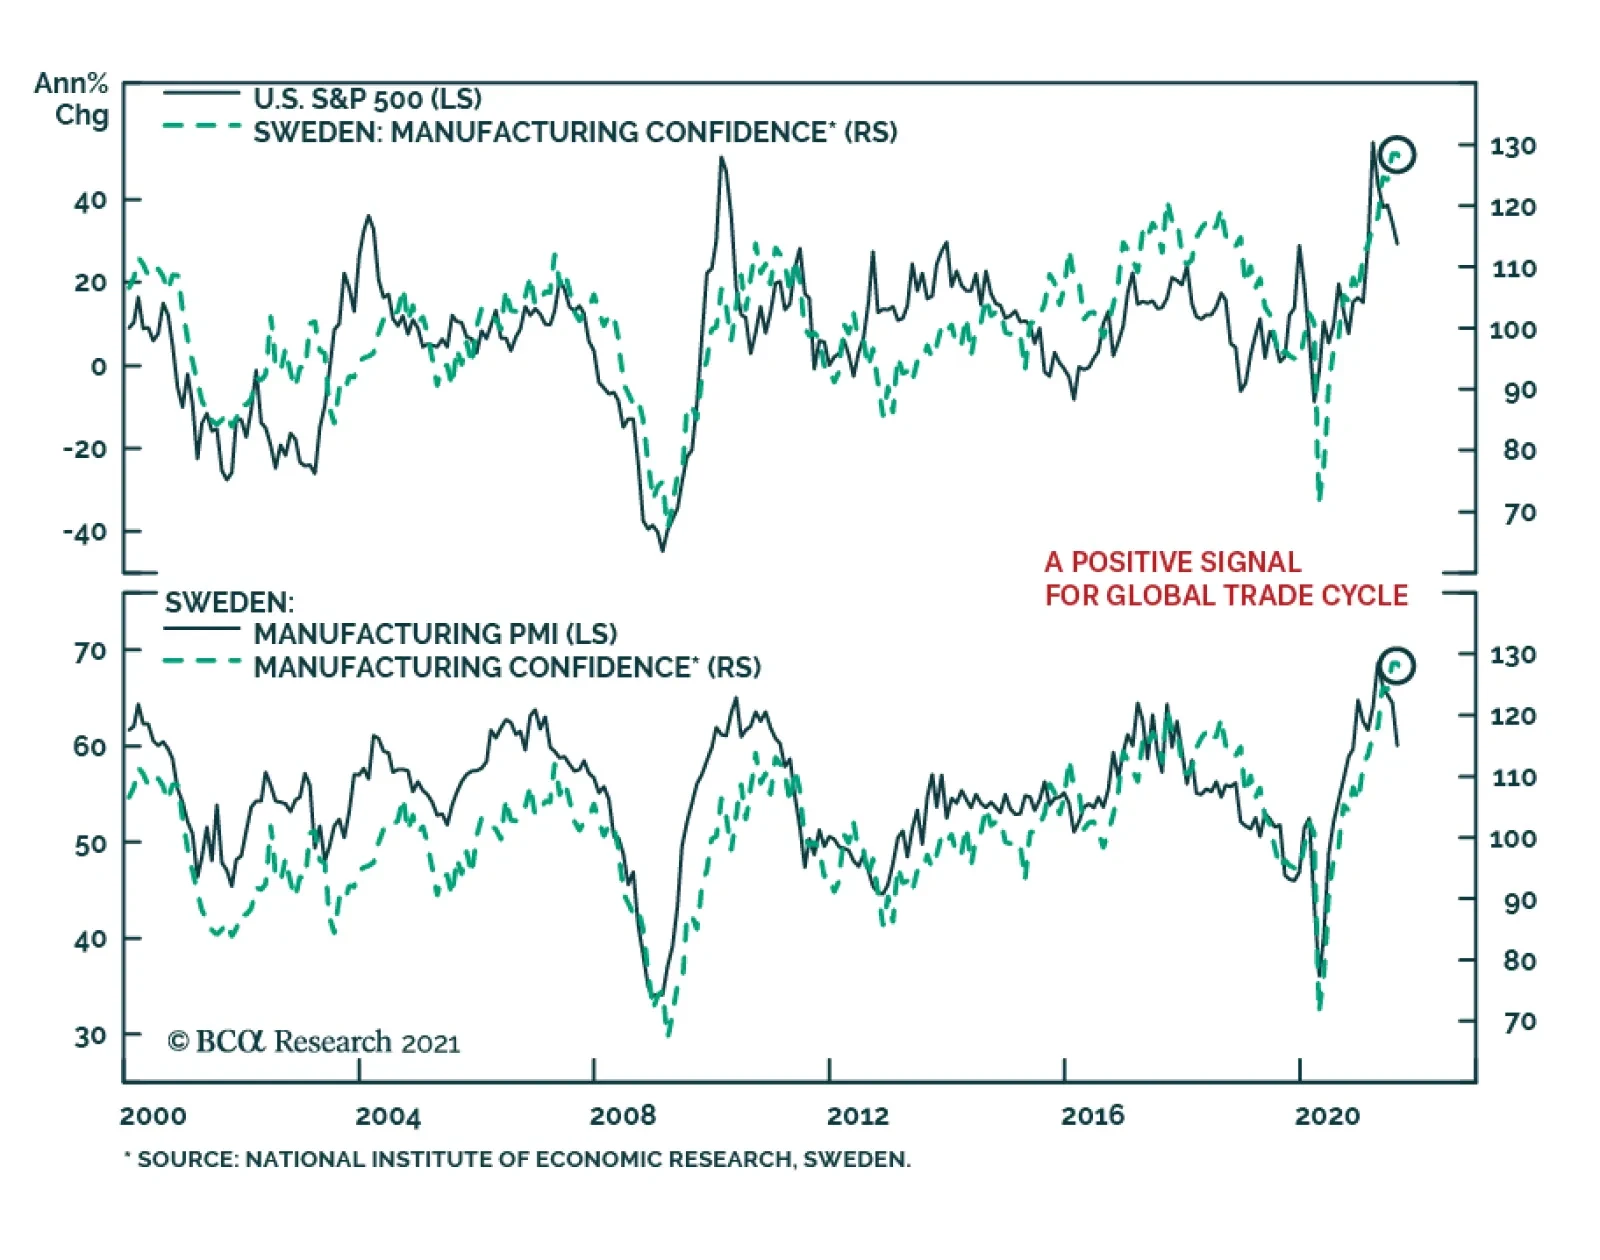
Results from Sweden’s September Economic Tendency survey were a minor disappointment. The headline indicator slipped 0.7 points to 119.9. The confidence indicators for both the manufacturing industry and consumer declined marginally. Despite the slight…
The decline in US government bond yields between April and August was largely put down to oversold conditions in the Treasury market and concerns amid signs that economic growth is moderating in the US. The stock market brushed off these…

Highlights Evergrande has not only crossed regulatory gridlines but also regulators’ bottom lines; the government will use the example of Evergrande to impose discipline on real estate developers. The policy response will likely prioritize domestic homebuyers and suppliers to minimize systemic risks and damage to the real economy. However, a bigger risk stems from the possibility that policymakers overestimate the resilience of the economy and ignore signs of a significant spillover to other segments in the economy. The existing policy restrictions on China’s housing sector will not be reversed; the sector is on a structural downshift and will face risks of further consolidation and profit growth compression. Feature China Evergrande Group continues to stir up the global markets. Last Thursday the company missed a deadline to pay USD $83.5m in bond interest. The firm has now entered a 30-day grace period; it will default if that deadline also passes without payment. Chart 1Roller-Coaster Ride Continues...
Roller-Coaster Ride Continues...
Roller-Coaster Ride Continues...
Evergrande has not remarked on the potential default nor have China’s authorities or state media offered any clues about a potential rescue package. Meanwhile, the PBoC injected large amounts of liquidity into the banking system of late, a clear sign of support for the markets. Evergrande share prices continued their roller-coaster ride (Chart 1). Evergrande’s tumult is indicative of an industry-wide problem. Real estate developers have expanded their businesses and profits through high-debt growth models. China’s policymakers have been trying to crack down on this business practice since 2017 and their clampdown has significantly intensified since August 2020. In this report, we follow up on last week’s Special Alert and share our thoughts on the potential market implications and policy response to the evolving Evergrande situation. The “Three Red Lines” Versus The “Bottom Lines” Evergrande has not only crossed the “three red lines” – three debt metrics China’s authorities laid out a year ago to reduce the housing sector’s leverage – but it has also crossed the bottom lines of policymakers. Therefore, we do not expect the government to lend a financial hand to bail out the corporation and its shareholders. Meanwhile, as discussed in our Special Alert, we expect that there will be some kind of a rescue plan to help onshore homebuyers and suppliers recover their losses. The authorities’ silence in the past three months as investors’ concerns about Evergrande’s debt situation escalated speaks volumes about plans for the overleveraged company. The Evergrande episode is not idiosyncratic; it represents an industry-wide problem linked to the sector’s high-debt growth model. However, Evergrande has become China’s and the world’s most indebted property developer; the “three red lines” policy last year has pushed the company into a severe liquidity crunch. Evergrande not only borrowed heavily to pursue an aggressive expansion strategy (“disorderly expansion of capitals”), but did so as President Xi Jinping famously remarked “houses are for living, not for speculation” in late 2016. Between 2016 and 2020, Evergrande’s total liabilities almost doubled and its stock prices jumped by 460%. Evergrande’s founder was ranked the richest man in China in 2017, building his company’s fortune on excessive leverage. The way that the company accumulated wealth conflicts with the government’s new mantra of building “common prosperity”, a policy shift to reduce income and wealth inequality. Furthermore, Evergrande paid its offshore investors in June this year while it continued to borrow from onshore banks and offload its onshore assets. This move did not bode well for China’s domestic stake- and shareholders, along with policymakers. Chart 2Housing Price Inflation Has Been Subdued Outside Of Top-Tier Cities
Housing Price Inflation Has Been Subdued Outside Of Top-Tier Cities
Housing Price Inflation Has Been Subdued Outside Of Top-Tier Cities
In contrast with policymakers’ silence about the future of Evergrande and its shareholders, the authorities have reportedly urged the company to finish and deliver its housing projects. Evergrande’s projects are mostly in tier-three cities where post-pandemic home price inflation has been subdued compared with top-tier cities (Chart 2). As such, policymakers will be less concerned about fueling home prices in these cities and more willing to work out a plan to finish and deliver those housing projects. Bottom Line: Beijing may rescue the stakeholders of Evergrande rather than its shareholders. Contagion Risks We discussed our baseline scenario for Evergrande’s bankruptcy and restructuring in last week’s Special Alert. Our message has been that the well-telegraphed Evergrande default might not create an imminent systemic crisis or crash in China’s financial markets. However, it will likely reinforce the credit tightening that has been underway in China over the past 12 months. This will delay and weaken the transmission of liquidity easing into the real economy. So far things are not bad enough for policymakers to reflate the economy in any meaningful way. Since the contagion risks from Evergrande’s debt crisis to China’s onshore financial markets seem to be contained, policy easing in the coming months will likely be gradual. Regulators have shown no sign of reversing the existing policy restrictions. Therefore, a bigger risk to China’s financial markets stems from the possibility that policymakers overestimate the resilience of the economy and ignore signs of a spillover to other segments in the economy. Real estate activity and investment in China are set to slow structurally (discussed in the section below). If policymakers allow a disruptive deceleration in the sector's growth while being reluctant to ramp up support in other industries, China’s economic growth could downshift much more than policymakers would like to see. A rapid deceleration in the real economic activity and jitters in the financial markets could reinforce each other and spiral out of control. The facts below explain why risks of an imminent systemic crisis in China’s and global financial markets are limited (Table 1): The exposure of China’s banks to real estate developers is small relative to the banks’ total lending. Although about 40% of total bank loans are property-related, only 6% are in loans to real estate developers. The majority of the 40% is in mortgage loans, construction loans and other loans collateralized by land and property. Evergrande’s outstanding bank debt accounts for less than 0.1% of China’s total onshore loan balances. The company owes about 1% of China’s existing trust loans and 0.04% of domestic bonds. The company has quality assets, as we discussed in last week’s report, that could cover most of its onshore outstanding debt. Widespread mortgage loan defaults are unlikely to happen, even if Evergrande does not strike a debt restructuring deal with the government. Strict housing and home-sale regulations cap the upside and limit the downside in home prices. Moreover, conservative loan-to-value ratio requirements have contributed to China’s low default rates on mortgage loans.1 Evergrande’s overseas liabilities are more significant, with its USD $20 billion bonds accounting for about 10% of China's corporate USD bonds issued by real estate developers. On the other hand, major US financial institutions have minimal direct exposure to China and Hong Kong SAR. Table 1Evergrande Debt, An Overview*
The Evergrande Saga Continues
The Evergrande Saga Continues
Despite limited systemic risks to the financial markets, a lack of government intervention could result in a disruptive bankruptcy of the company, risking substantial ripple effects on other parts of the economy. Evergrande’s accounts payable and bills amount to nearly RMB 700 billion, owed to companies in the upstream and downstream industry supply chains. In addition, Evergrande’s contract liabilities are as high as RMB 170 billion and are associated with the pre-sold but unfinished residential units in more than 200 cities. We think policymakers and Evergrande will ultimately agree on a debt restructuring plan. Evergrande could transfer some of its hard assets to state-owned banks or enterprises and the banks could either extend or restructure Evergrande’s existing loans to help finish and deliver the company’s housing projects. Regardless of how the debt is restructured, a government-led rescue will likely prioritize domestic homebuyers and suppliers. Evergrande shareholders and investors in offshore, USD-denominated corporate bonds will suffer large losses. Bottom Line: Our base case scenario is that the government will restructure Evergrande’s debt to prevent the company’s crisis from evolving into a systemic financial risk. Will Policymakers Reverse Restrictive Housing Policies? Even though China’s monetary and fiscal policies have eased at margin, policy restrictions on the property market remain in place. The bar for regulators to significantly ease or to reverse policy tightening in the real estate industry is much higher than in past cycles. Furthermore, the government’s efforts to contain the sector’s leverage and home price inflation are structural rather than cyclical. Our view is based on the following observations: Chart 3China's Housing Demand Is On A Structural Downshift
China's Housing Demand Is On A Structural Downshift
China's Housing Demand Is On A Structural Downshift
China’s housing demand is on a structural downshift due to China’s falling birthrate and working-age population. The decline in demand will likely accelerate in the next four to five years (Chart 3). Therefore, it is unreasonable to expect that the growth in real estate investment in the coming years will continue growing at the same rate as in the past cycles. The government is determined to improve housing affordability by capping home prices in the coming years while increasing lower-income household wage growth. Previous “big bang” stimulus and soaring home prices have widened rather than narrowed income and wealth inequality. Beijing’s current primary focus is “common prosperity,” which aims to reduce inequality. This overarching policy initiative will prevent policymakers from backtracking on reforms in the property sector. Things are not bad enough for a major shift in policy direction. Demand for housing is down, but from a very elevated level (Chart 4). The growth of home sales is now reverting to its pre-pandemic rate. In a previous report we pointed out that the current policy backdrop resembles that of 2H2018 and 2019, when the stimulus was very measured despite a slowing economy and an escalating trade war with the US. Demand for housing in the first eight months of this year is stronger than in 2018/19, thus policymakers may not feel pressure to loosen restrictions in the housing sector. Chart 4Post-Pandemic Housing Demand Stronger Than 2018/19
Post-Pandemic Housing Demand Stronger Than 2018/19
Post-Pandemic Housing Demand Stronger Than 2018/19
Chart 5Real Estate Investment Relatively Steady Despite Contracting Housing Starts
Real Estate Investment Relatively Steady Despite Contracting Housing Starts
Real Estate Investment Relatively Steady Despite Contracting Housing Starts
Growth in real estate investment has been steady despite contracting housing starts (Chart 5). The government’s deleveraging pressure on the sector since August last year has forced developers to hurry and finish their existing projects (Chart 5, bottom panel). This has helped to reduce developers’ project inventories and discourage them from hoarding land reserves, and the policy intention is unlikely to change (Chart 6). Additionally, the government has prioritized home price stability by capping prices and fine-tuning the supply of land (Chart 7). In other words, housing starts have become less market-driven and weaker readings may reflect regulators’ policy intentions to rein in land supplies.2 Local governments may increase the supply of land when real estate investment softens too fast, but home sales and project completions will have to decelerate more significantly. Chart 6Developers Have Been Rushing To Finish Existing Projects
Developers Have Been Rushing To Finish Existing Projects
Developers Have Been Rushing To Finish Existing Projects
Chart 7Government Prioritizes Home Price Stability By Capping Prices And Fine-Tuning Land Supply
Government Prioritizes Home Price Stability By Capping Prices And Fine-Tuning Land Supply
Government Prioritizes Home Price Stability By Capping Prices And Fine-Tuning Land Supply
Funding constraints will not be removed soon and restrictive policies apply to both developers and banks. Banks need to meet the “two red lines” while developers must bring their leverage ratios below the “three red lines” by end-2023. The “two red lines”, which the PBoC unveiled in January this year, set the upper limit on the portion of household mortgages and real estate loans in banks’ total lending. Despite aggressively scaling back lending to the housing sector, the lending ratio in many banks – including China’s six large banks and various medium-sized banks – still exceeded the upper limit. These banks will have to continue to reduce their property-related lending while the other banks will maintain a lower percentage of loans to the housing sector than in the past. Consequently, binding constraints on developers and banks will continue to weigh on the housing market in the coming years, suggesting that the property market downturn will last longer than in previous cycles. Chinese policymakers are unlikely to have much appetite for more robust construction activity in the current environment with supply-side constraints for both raw materials and energy. More than 10 provinces in China are currently under power rationing and have cut factory production amid electricity supply issues and a push to enforce environmental regulations. We expect supply shortages and production decreases to continue through the winter, limiting the upside potential of the country’s economic activity. Bottom Line: China’s reforms in the property sector are structural and the leadership is much less likely to use housing as counter-cyclical policy support to the economy than in previous cycles. Investment Implications China’s growth and its ever-important property market activity have slowed. Given the policymakers’ higher pain threshold for a slower economy and lower appetite for leverage, policy easing will likely be gradual and piecemeal in the near term. The current monetary, fiscal, and industry policy backdrops resemble China’s response in H2 2018 and early 2019. Chinese stock prices rose briefly in early 2019 on the expectation of a sizable stimulus, but the rally was short-lived (Chart 8). Furthermore, we do not rule out the possibility that policymakers will be overconfident in their capability to stabilize the economy as they balance structural reforms against growth volatility. They may choose to wait until there are signs of a significant spillover to other segments in the economy before backtracking the deleveraging campaign in the property sector and lending more support to the market/economy. In this scenario, the near-term response in the equity market will likely be very negative. China-related asset prices will not stabilize until policymakers decisively and significantly dial-up their reflationary response. Property sector stocks in China’s on- and offshore markets have been beaten down by policy tightening and lately the Evergrande saga (Chart 9). We maintain our view that these stocks have not reached their bottom. The property downturn in China is a structural change and authorities are unlikely to reverse current restrictions on the sector to support the economy. Chart 8Chinese Stock Price Rally In 2019 Was Short-Lived
Chinese Stock Price Rally In 2019 Was Short-Lived
Chinese Stock Price Rally In 2019 Was Short-Lived
Chart 9Chinese Real Estate Stocks Have Not Reached Their Bottom
Chinese Real Estate Stocks Have Not Reached Their Bottom
Chinese Real Estate Stocks Have Not Reached Their Bottom
The real estate sector’s contribution to China’s economic growth is expected to gradually decline in the medium to long term. The industry will be further reformed and consolidated, and more developers will be forced to abandon their high-leverage, high-growth business expansion model. The outlook for the real estate industry’s profit growth will become less certain. Investors will require higher risk premiums for real estate sector stocks, which means that these stocks’ valuations will be further compressed. Jing Sima China Strategist jings@bcaresearch.com Footnotes 1 Chinese homeowners’ down payment ratios on a first property is 30% and 50% on a second property. 2Land auctions were delayed in July and August due to overwhelming demand from developers in the first half of the year. Market/Sector Recommendations Cyclical Investment Stance
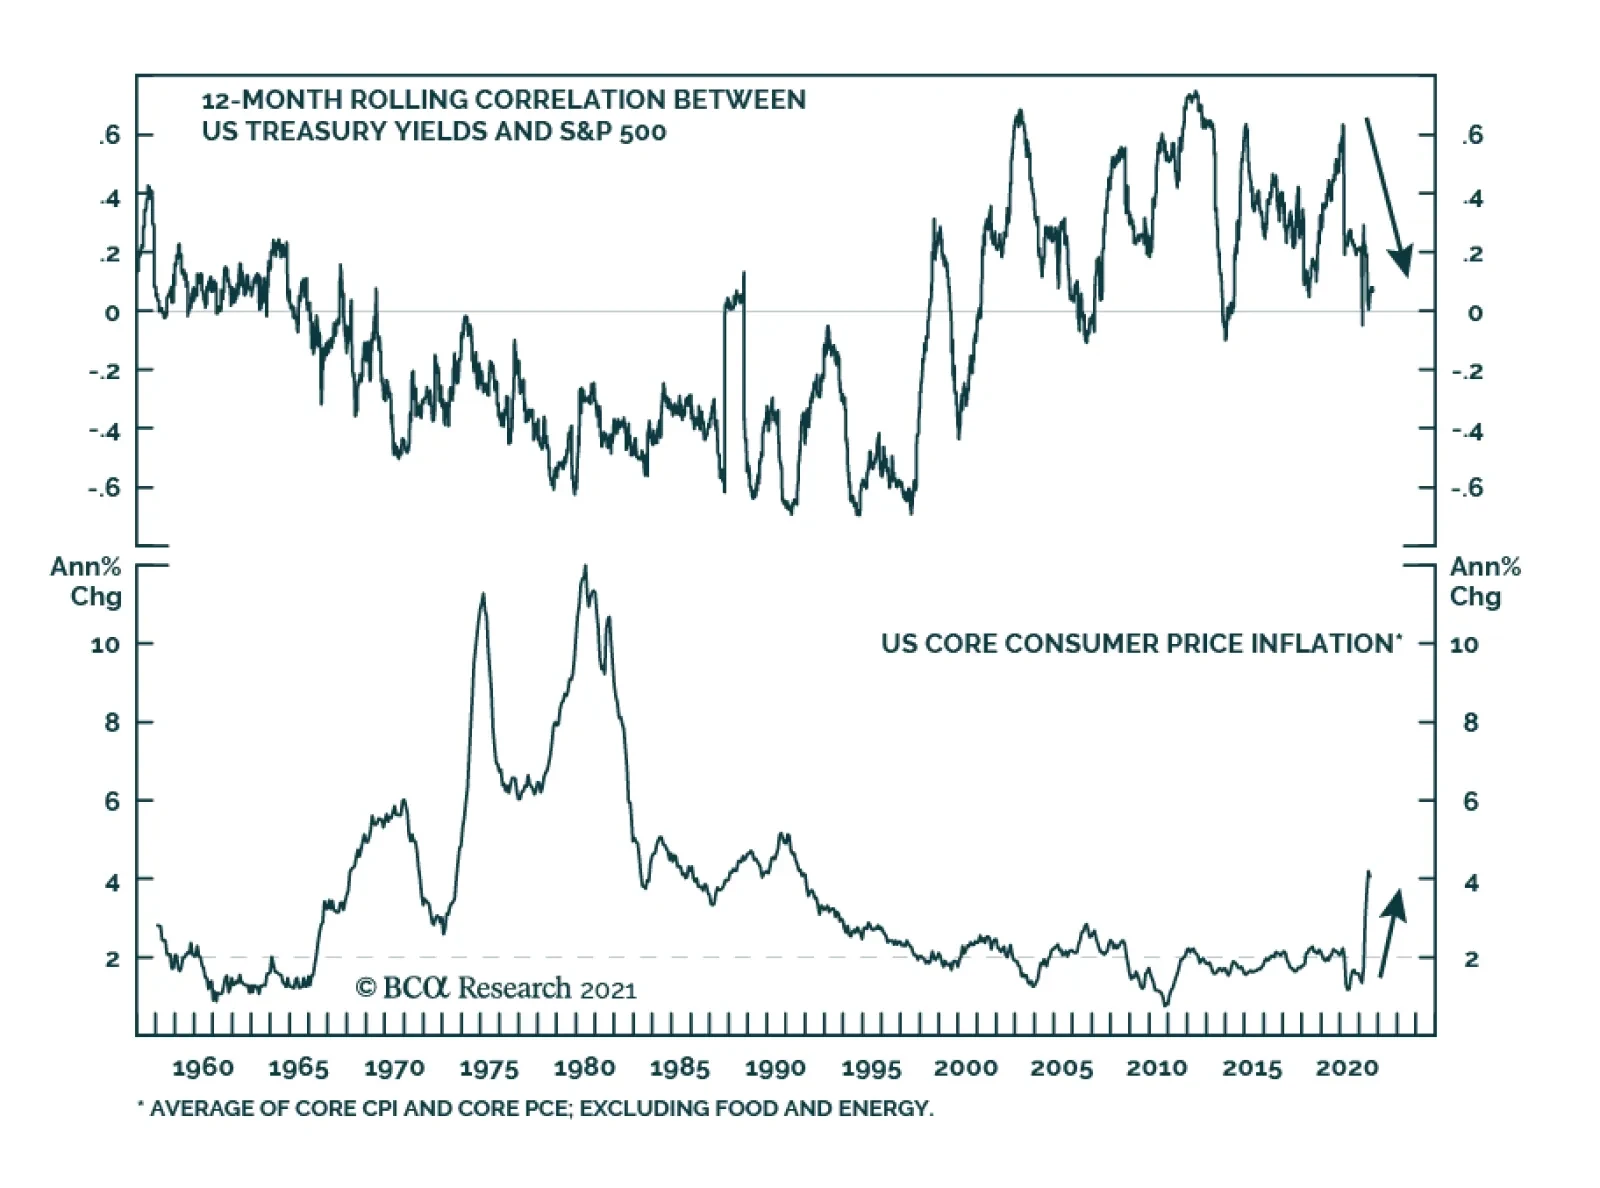
Market moves since the beginning of September have been characterized by a selloff in US Treasurys and a deterioration in US equity returns. The spectacular performance of US stocks thus far during the pandemic has stretched multiples to an extreme. These…
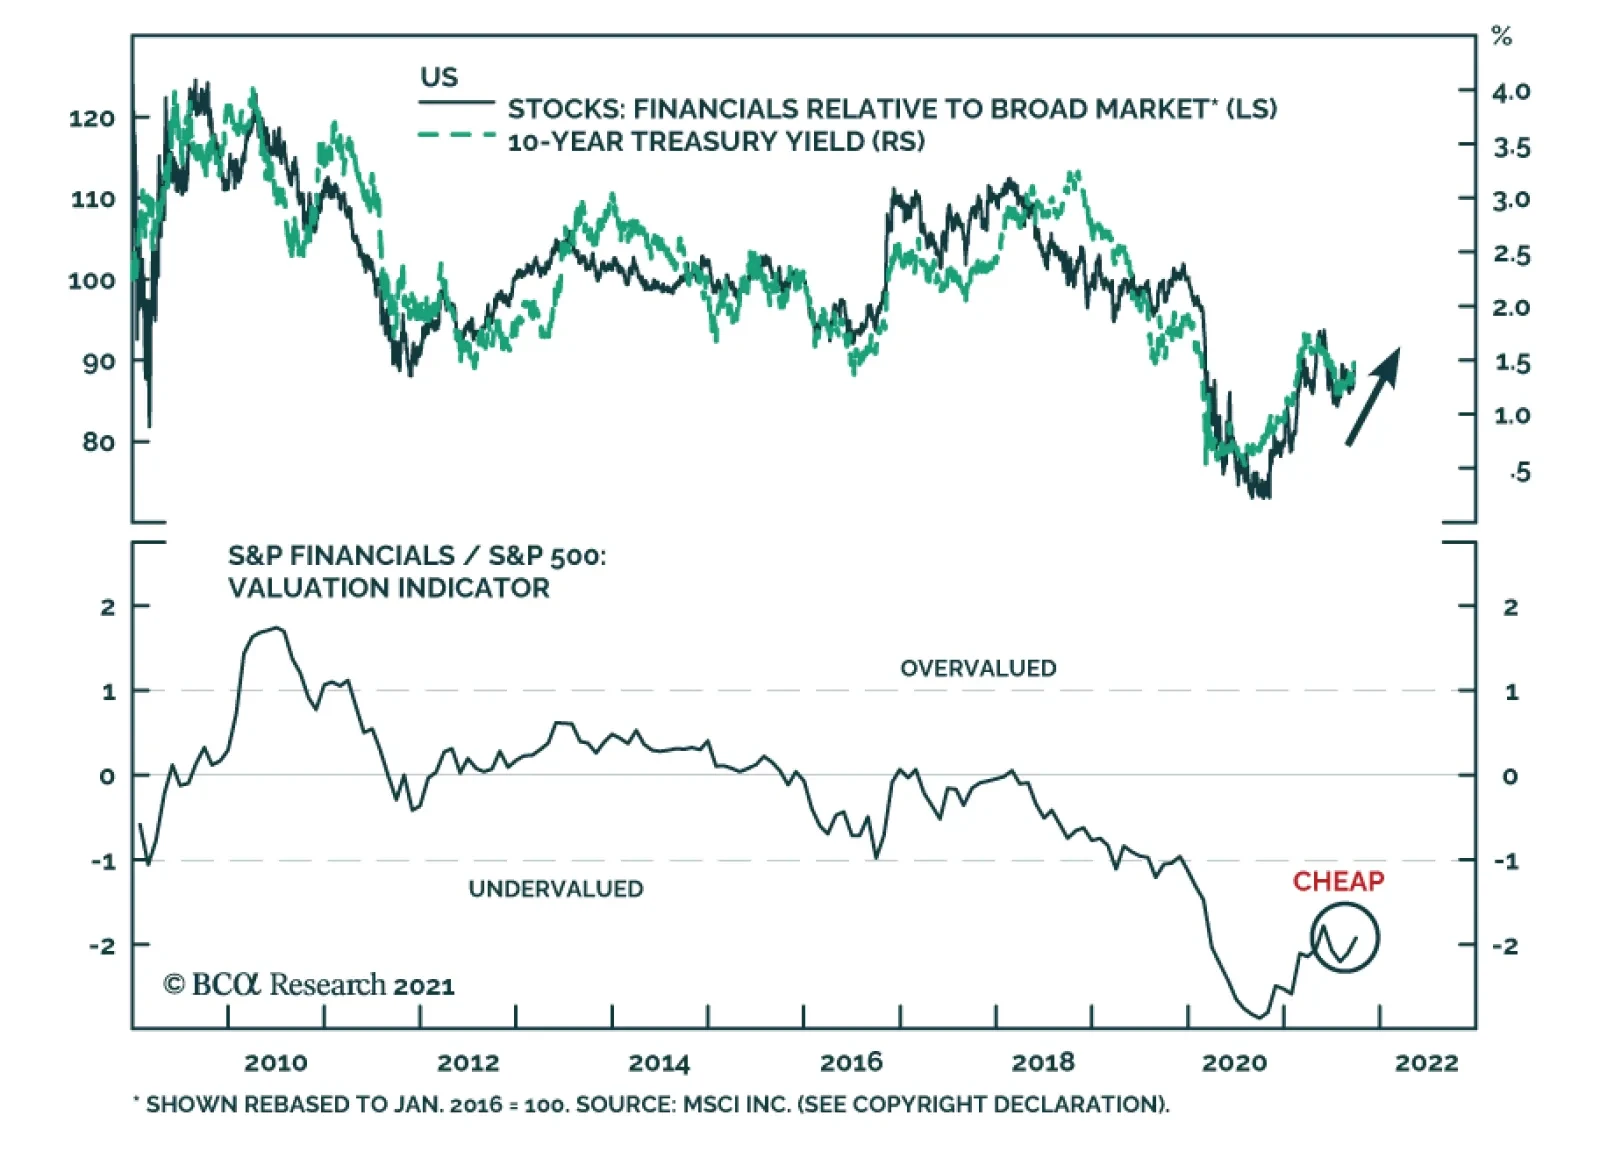
US Financials is among the best performing US equity sectors over the past three months. We expect these positive relative gains to continue. Financials will benefit from rising US bond yields over the coming year. Not only are higher interest rates…
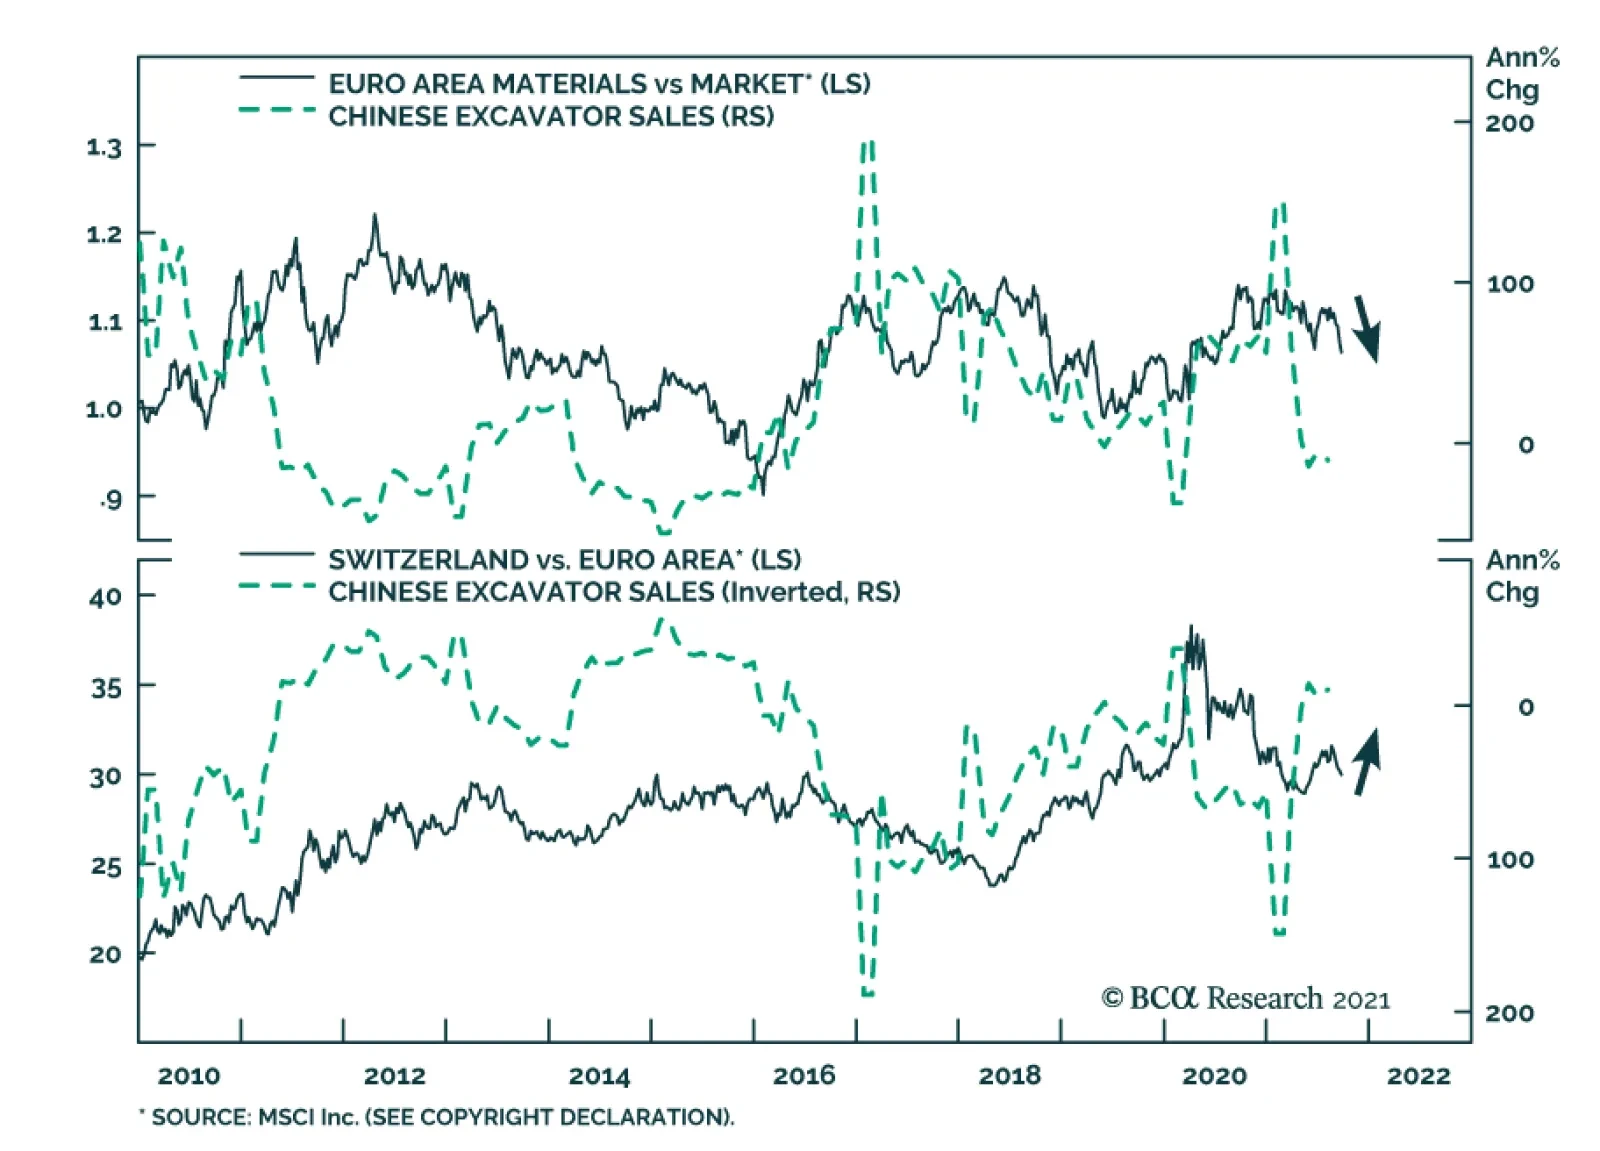
According to BCA Research’s European Investment Strategy service, the tactical environment is dangerous for European cyclicals in general, and materials in particular. The fallout from Evergrande’s problem will extend to the performance of European equity…
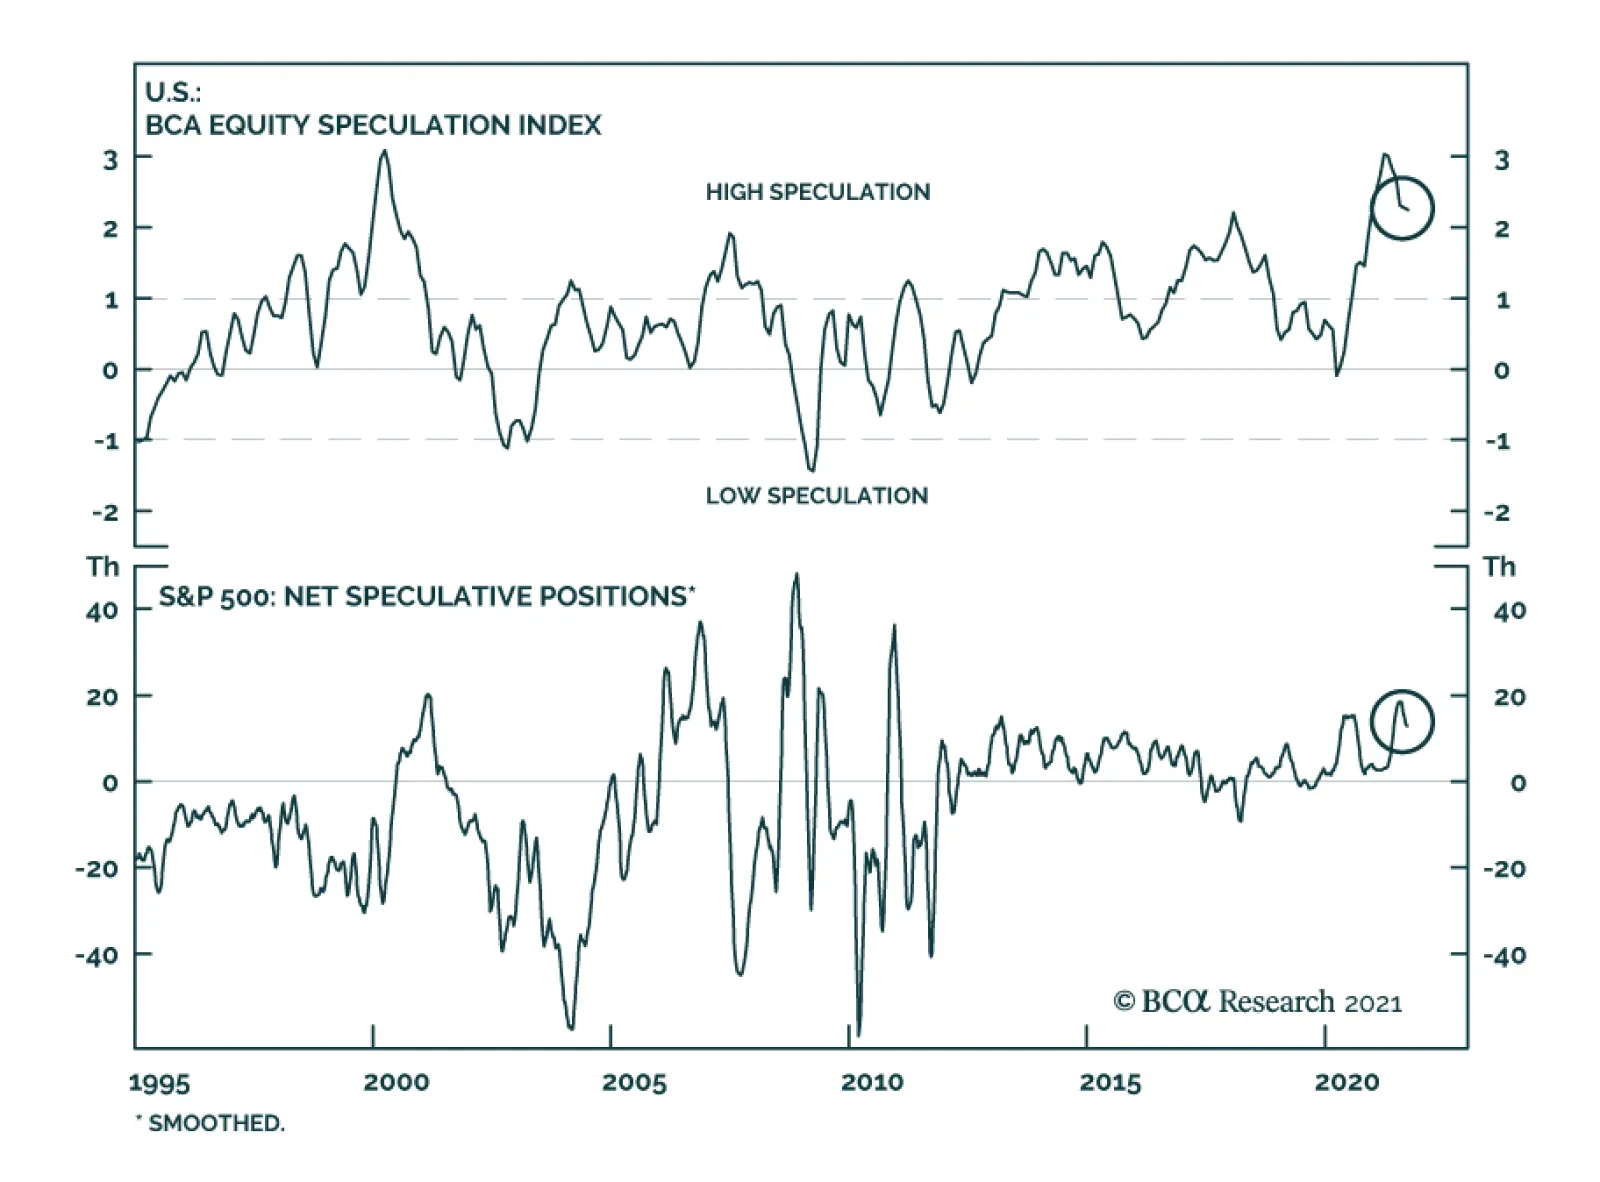
In an Insight last week, we highlighted that the American Association of Individual Investors’ latest survey reveals a collapse in sentiment. Bears now exceed bulls by a wide margin. However, this downbeat assessment is not consistent across all indicators…
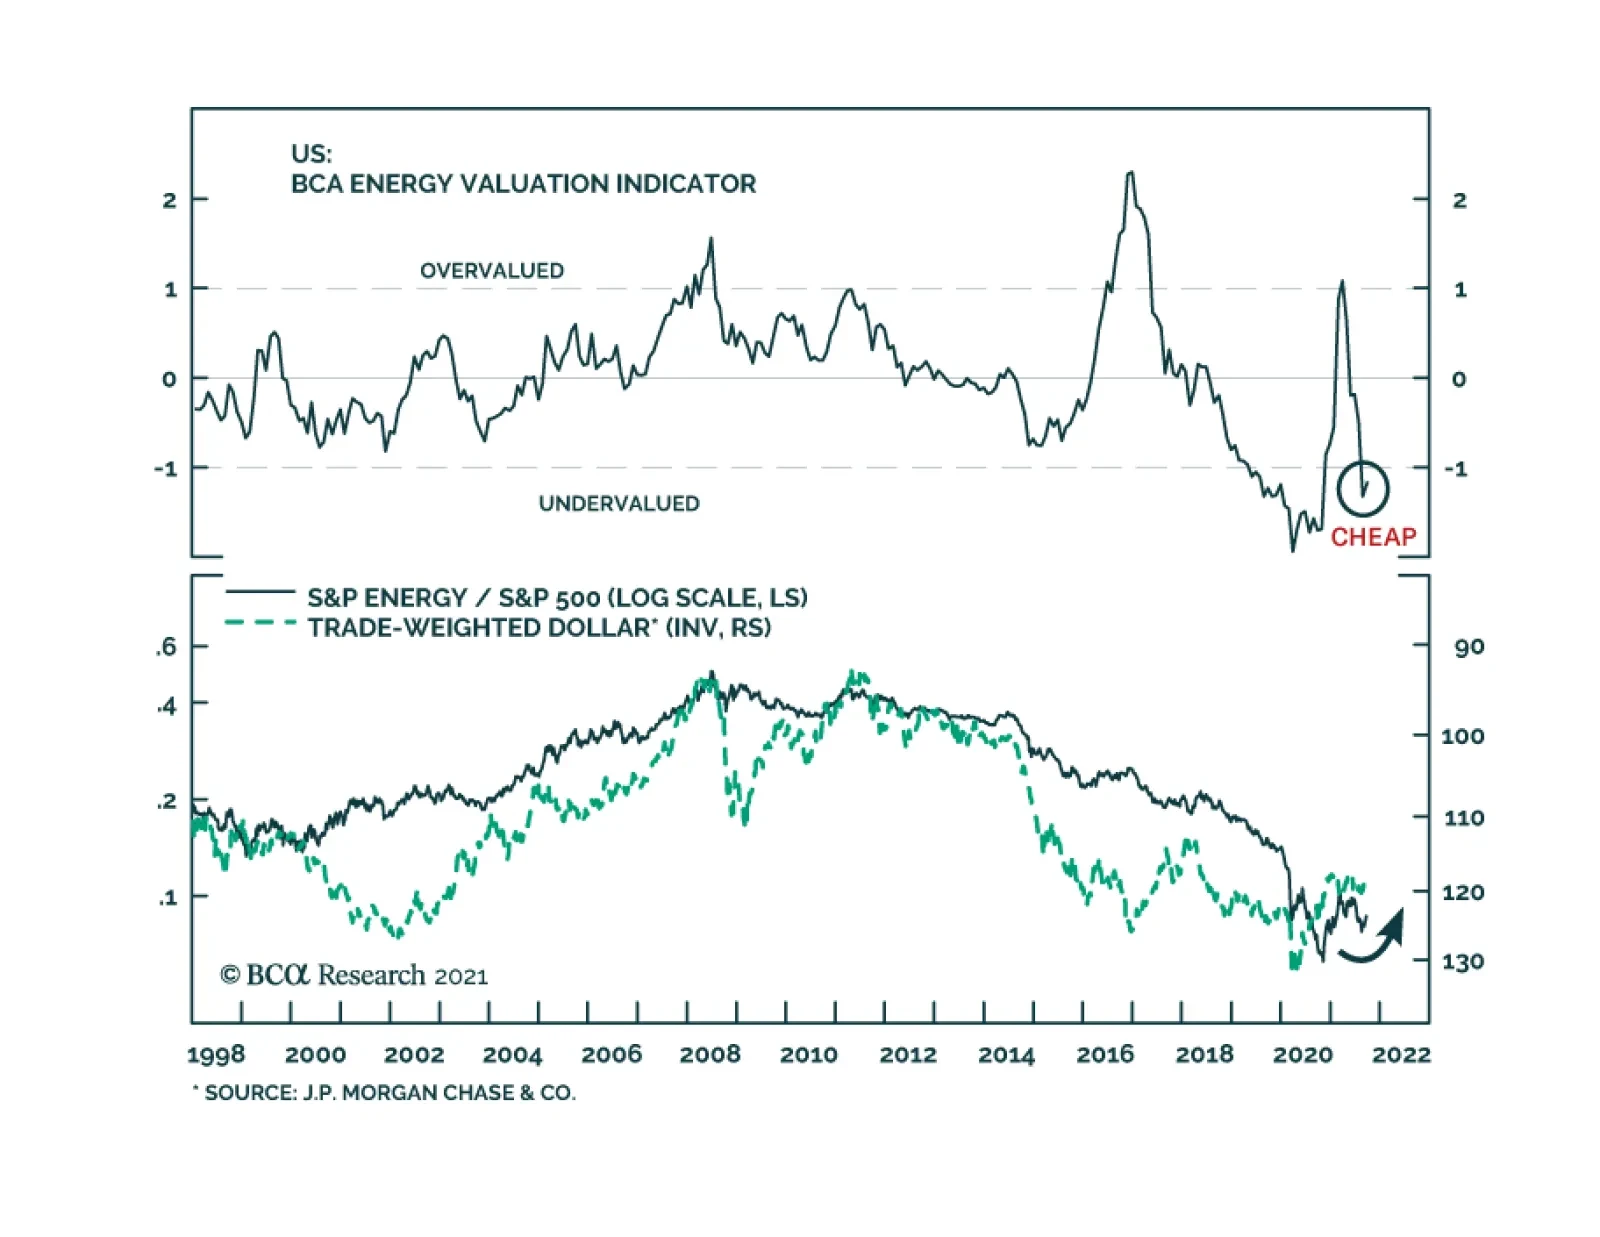
US energy stocks performed poorly earlier this year. They fell 14tween early March and late August. However, the tide seems to be turning in their favor. The energy sector is now leading the benchmark. It is up 12% since August 20 – a period of…
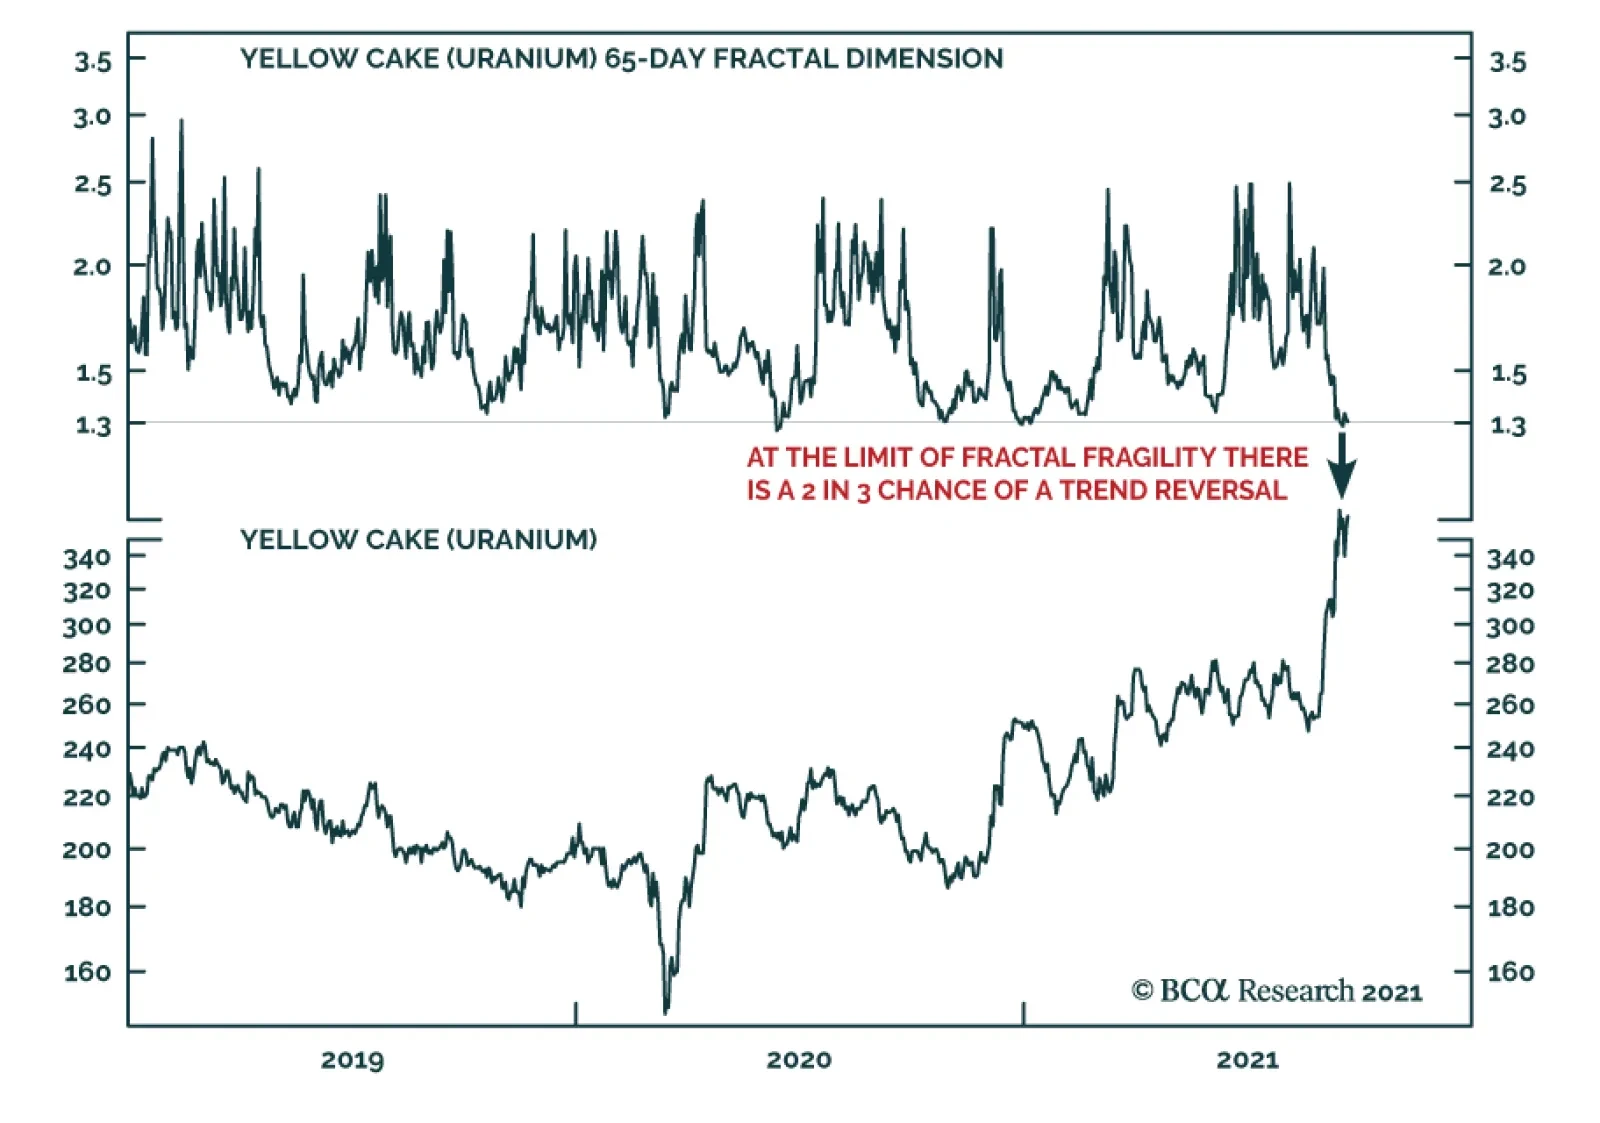
BCA Research’s Counterpoint service’s favored trade this week is to short the rally in uranium plays. The recent near-vertical ascent in uranium plays have left many investors scratching their heads and wondering: what’s going on? The answer, in large…
Highlights Asian and European natural gas prices will remain well bid as the Northern Hemisphere winter approaches. An upgraded probability of a second La Niña event this winter will keep gas buyers scouring markets for supplies (Chart of the Week). The IEA is pressing Russia to make more gas available to European consumers going into winter. While Russia is meeting contractual commitments, it is also trying to rebuild its inventories. Gas from the now-complete Nord Stream 2 pipeline might not flow at all this year. High natgas prices will incentivize electric generators to switch to coal and oil. This will push the level and costs of CO2 emissions permits higher, including coal and oil prices. Supply pressures in fossil-fuel energy markets are spilling into other commodity markets, raising the cost of producing and shipping commodities and manufactures. Consumers – i.e., voters – experiencing these effects might be disinclined to support and fund the energy transition to a low-carbon economy. We were stopped out of our long Henry Hub natural gas call spread in 1Q22 – long $5.00/MMBtu calls vs short $5.50/MMBtu calls in Jan-Feb-Mar 2022 – and our long PICK ETF positions with returns of 4.58% and -10.61%. We will be getting long these positions again at tonight's close. Feature European natural gas inventories remain below their five-year average, which, in the event of another colder-than-normal winter in the Northern Hemisphere, will leave these markets ill-equipped to handle a back-to-back season of high prices and limited supply (Chart 2).1 The probability of a second La Niña event this winter was increased to 70-80% by the US Climate Prediction Center earlier this week.2 This raises the odds of another colder-than-average winter. As a result, markets will remain focused on inventories and flowing natgas supplies from the US, in the form of Liquified Natural Gas (LNG) cargoes, and Russian pipeline shipments to Europe as winter approaches. Chart of the WeekSurging Natural Gas Prices Intensify Competition For Supplies
Natgas Markets Continue To Tighten
Natgas Markets Continue To Tighten
Chart 2Natgas Storage Remains Tight
Natgas Markets Continue To Tighten
Natgas Markets Continue To Tighten
US LNG supplies are being contested by Asian buyers, where gas storage facilities are sparse, and European buyers looking for gas to inject into storage as they prepare for winter. US LNG suppliers also are finding ready bids in Brazil, where droughts are reducing hydropower availability. In the first six months of this year, US natgas exports averaged 9.5 bcf/d, a y/y increase of more than 40%. Although Russia's Nord Stream 2 pipeline has been completed, it still must be certified to carry natgas into Germany. This process could take months to finish, unless there is an exemption granted by EU officials. Like the US and Europe, Russia is in the process of rebuilding its natgas inventories, following a colder-than-normal La Niña winter last year.3 Earlier this week, the IEA called on Russia to increase natgas exports to Europe as winter approaches. The risk remains no gas will flow through Nord Stream 2 this year.4 Expect Higher Coal, Oil Consumption As other sources of energy become constrained – particularly UK wind power in the North Sea, where supplies went from 25% of UK power in 2020 to 7% in 2021 – natgas and coal-fired generation have to make up for the shortfall.5 Electricity producers are turning more towards coal as they face rising natural gas prices.6 Increasing coal-fired electric generation produces more CO2 and raises the cost of emission permits, particularly in the EU's Emissions Trading System (ETS), which is the largest such market in the world (Chart 3). Prices of December 2021 ETS permits, which represent the cost of CO2 emissions in the EU, hit an all-time high of €62.75/MT earlier this month and were trading just above €60.00/MT as we went to press. Chart 3Higher CO2 Emissions Follow Lower Renewables Output
Higher CO2 Emissions Follow Lower Renewables Output
Higher CO2 Emissions Follow Lower Renewables Output
Going into winter, the likelihood of higher ETS permit prices increases if renewables output remains constrained and natgas inventories are pulled lower to meet space-heating needs in the EU. This will increase the price of power in the EU, where consumers are being particularly hard hit by higher prices (Chart 4). The European think tank Bruegel notes that even though natgas provides about 20% of Europe's electricity supply, it now is setting power prices on the margin.7 Chart 4EU Power Price Surge Is Inflationary
Natgas Markets Continue To Tighten
Natgas Markets Continue To Tighten
Elevated natgas prices are inflationary, according to Bruegel: "On an annual basis, a doubling of wholesale electricity prices from about €50/megawatt hour to €100/MWh would imply that EU consumers pay up to €150 billion (€50/MWh*3bn MWh) more for their electricity. … Drastic increases in energy spending will shrink the disposable income of the poorest households with their high propensity to consume." This is true in other regions and states, as well. Is the Natgas Price Surge Transitory? The odds of higher natgas and CO2 permit prices increase as the likelihood of a colder-than-normal winter increases. Even a normal winter likely would tax Europe's gas supplies, given the level of inventories, and the need for Russia to replenish its stocks. However, at present, even with the odds of a second La Niña event this winter increasing, this is a probable event, not a certainty. The global natgas market is evolving along lines similar to the crude oil market. Fungible cargoes can be traded and moved to the market with the highest netback realization, after accounting for transportation. High prices now will incentivize higher production and a stronger inventory-injection season next year. That said, prices could stay elevated relative to historical levels as this is occurring. Europe is embarked on a planned phase-out of coal- and nuclear-powered electricity generation over the next couple of years, which highlights the risks associated with the energy transition to a low-carbon future. China also is attempting to phase out coal-fired generation in favor of natgas turbines, and also is pursuing a buildout of renewables and nuclear power. Given the extreme weather dependence on prices for power generated from whatever source, renewables will remain risky bets for modern economies as primary energy sources in the early stages of the energy transition. When the loss of wind, for example, must be made up with natgas generation and that market is tight owing to its own fundamental supply-demand imbalance, volatile price excursions to high levels could be required to destroy enough demand to provide heat in a cold winter. This would reduce support for renewables if it became too-frequent an event. This past summer and coming winter illustrate the risk of too-rapid a phase out of fossil-fueled power generation and space-heating fuels (i.e., gas and coal). Frequent volatile energy-price excursions, which put firms and households at risk of price spikes over an extended period of time, are, for many households, material events. We have little doubt the commodity-market effects will be dealt with in the most efficient manner. As the old commodity-market saw goes, "High prices are the best cure for high prices, and vice versa." All the same, the political effects of another very cold winter and high energy prices are not solely the result of economic forces. Inflation concerns aside, consumers – i.e., voters – may be disinclined to support a renewable-energy buildout if the hits to their wallets and lifestyles become higher than they have been led to expect. Investment Implications The price spike in natgas is highly likely to be a transitory event. Another surge in natgas prices likely would be inflationary while supplies are rebuilding – so, transitory. Practically, this could stoke dissatisfaction among consumers, and add a political element to the transition to a low-carbon energy future. This would complicate capex decision-making for incumbent energy suppliers – i.e., the fossil-fuels industries – and for the metals suppliers, which will be relied upon to provide the literal building blocks for the renewables buildout. Robert P. Ryan Chief Commodity & Energy Strategist rryan@bcaresearch.com Ashwin Shyam Research Associate Commodity & Energy Strategy ashwin.shyam@bcaresearch.com Commodities Round-Up Energy: Bullish US crude oil inventories fell 3.5mm barrels in the week ended 17 September 2021, according to the US EIA. Product inventories built slightly, led by a 3.5mm-build in gasoline stocks, which was offset by a 2.6mm barrel draw in distillates (e.g., diesel fuel). Cumulative average daily crude oil production in the US was down 7% y/y, and stood at 10.9mm b/d. Cumulative average daily refined-product demand – what the EIA terms "Product Supplied" – was estimated at 19.92mm b/d, up almost 10% y/y. Brent prices recovered from an earlier sell-off this week and were supported by the latest inventory data (Chart 5). Base Metals: Bullish Iron ore prices have fallen -55.68% since hitting an all-time high of $230.58/MT in May 12, 2021 (Chart 6). This is due to sharply reduced steel output in China, as authorities push output lower to meet policy-mandated production goals and to conserve power. Even with the cuts in steel production, overall steel output in the first seven months of the year was up 8% on a y/y basis, or 48mm MT, according to S&P Global Platts. Supply constraints likely will be exacerbated as the upcoming Olympic Games hosted by China in early February approach. Authorities will want blue skies to showcase these events. Iron ore prices will remain closer to our earlier forecast of $90-$110/MT than not over this period.8 Precious Metals: Bullish The Federal Open Market Committee is set to publish the results of its meeting on Wednesday. In its last meeting in June, more hawkish than expected forecasts for interest rate hikes caused gold prices to drop and the yellow metal has been trading significantly lower since then. Our US Bond Strategy colleagues expect an announcement on asset purchase tapering in end-2021, and interest rate increases to begin by end-2022.9 Rate hikes are contingent on the Fed’s maximum employment criterion being reached, as expected and actual inflation are above the Fed criteria. Tapering asset purchases and increases in interest rates will be bearish for gold prices. Chart 5
BRENT PRICES BEING VOLATILE
BRENT PRICES BEING VOLATILE
Chart 6
BENCHMARK IRON ORE 62% FE, CFR CHINA (TSI)RECOVERING
BENCHMARK IRON ORE 62% FE, CFR CHINA (TSI)RECOVERING
Footnotes 1 Equinor, the Norwegian state-owned energy-supplier, estimates European natgas inventories will be 70-75% of their five-year average this winter. Please see IR Gas Market Update, September 16, 2021. 2 Please see "ENSO: Recent Evolution, Current Status and Predictions," published by the US Climate Prediction Center 20 September 2021. Earlier this month, the Center gave 70% odds to a second La Niña event in the Northern Hemisphere this winter. Please see our report from September 9, 2021 entitled NatGas: Winter Is Coming for additional background. 3 Please see IEA calls on Russia to send more gas to Europe before winter published by theguardian.com, and Big Bounce: Russian gas amid market tightness. Both were published on September 21, 2021. 4 Please see Nord Stream Two Construction Completed, but Gas Flows Unlikely in 2021 published 14 September 2021 by Jamestown.org. 5 Please see The U.K. went all in on wind power. Here’s what happens when it stops blowing, published by fortune.com on 16 September 2021. Argus Media this week reported wind-power output fell 56% y/y in September 2021 to just over 2.5 TWh. 6 Please see UK power firms stop taking new customers amid escalating crisis, published by Aljazeera; Please see UK fires up coal power plant as gas prices soar, published by BBC. 7 Please see Is Europe’s gas and electricity price surge a one-off?, published by Bruegel 13 September 2021. 8 Please see China's Recovery Paces Iron Ore, Steel, which we published on November 5, 2020. 9 Please see 2022 Will Be All About Inflation and Talking About Tapering, published on September 22, 2021 and on August 10, 2021 respectively. Investment Views and Themes Recommendations Strategic Recommendations Commodity Prices and Plays Reference Table Trades Closed in 2021 Summary of Closed Trades