Financial Markets
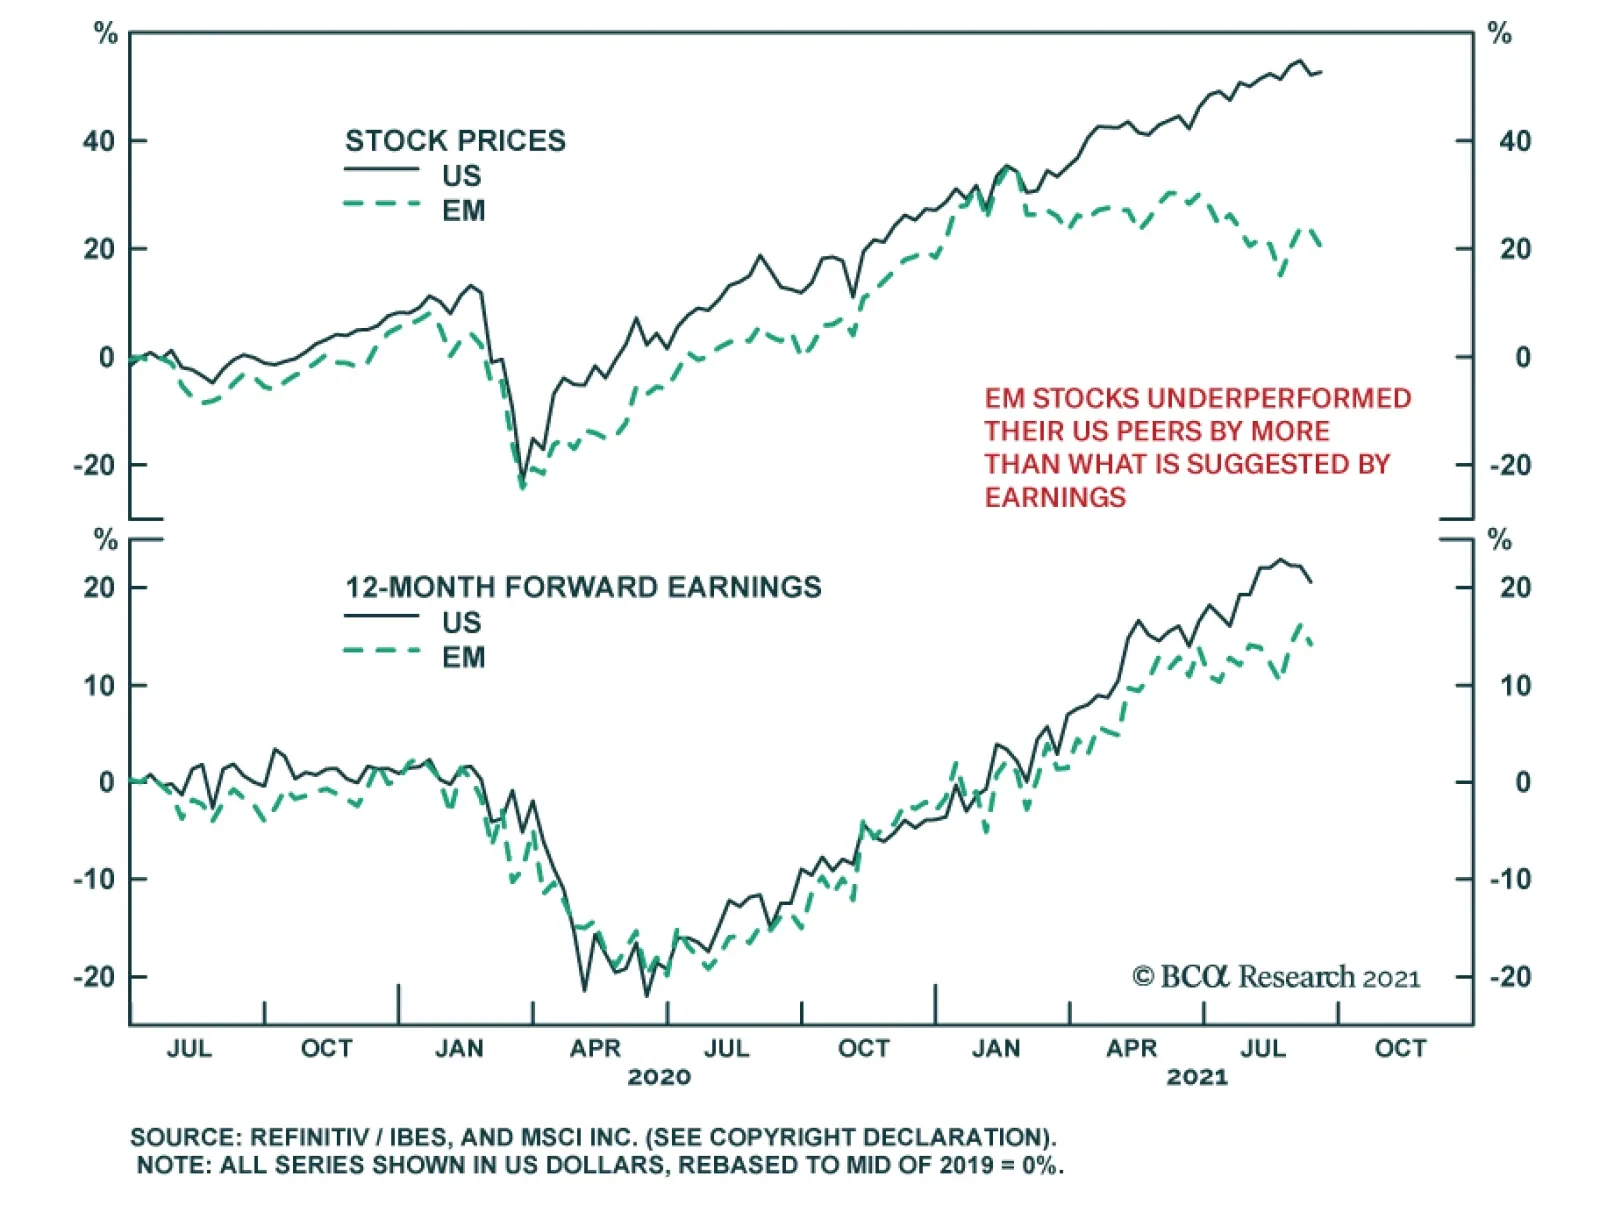
BCA Research’s Global Investment Strategy service upgraded its rating on EM equities and currencies to strong overweight After lagging the global indices, EM stocks are set to outperform during the remainder of this year and into 2022. Five factors will…
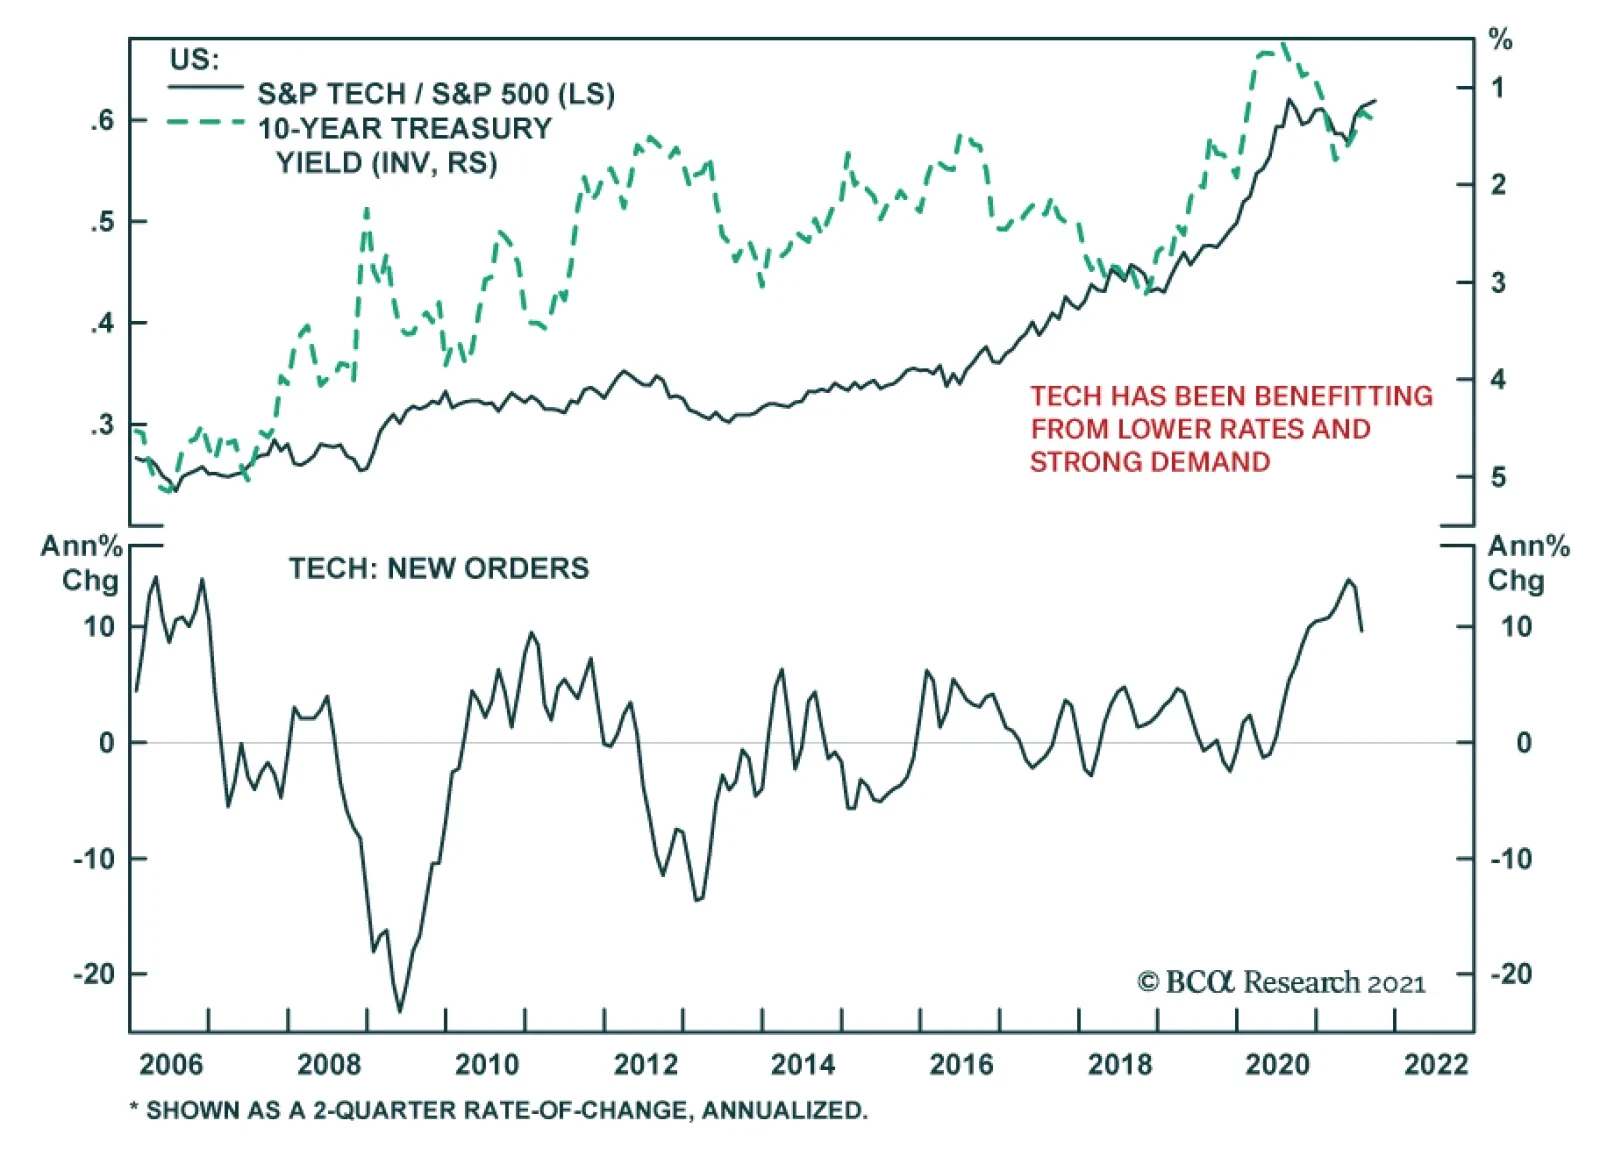
The rally in US Treasurys since March has been positive for tech stocks. The S&P 500 tech sector outperformed the benchmark by 6.58% since then. This strong performance has occurred despite elevated inflation prints and the Fed’s plan to begin normalizing…
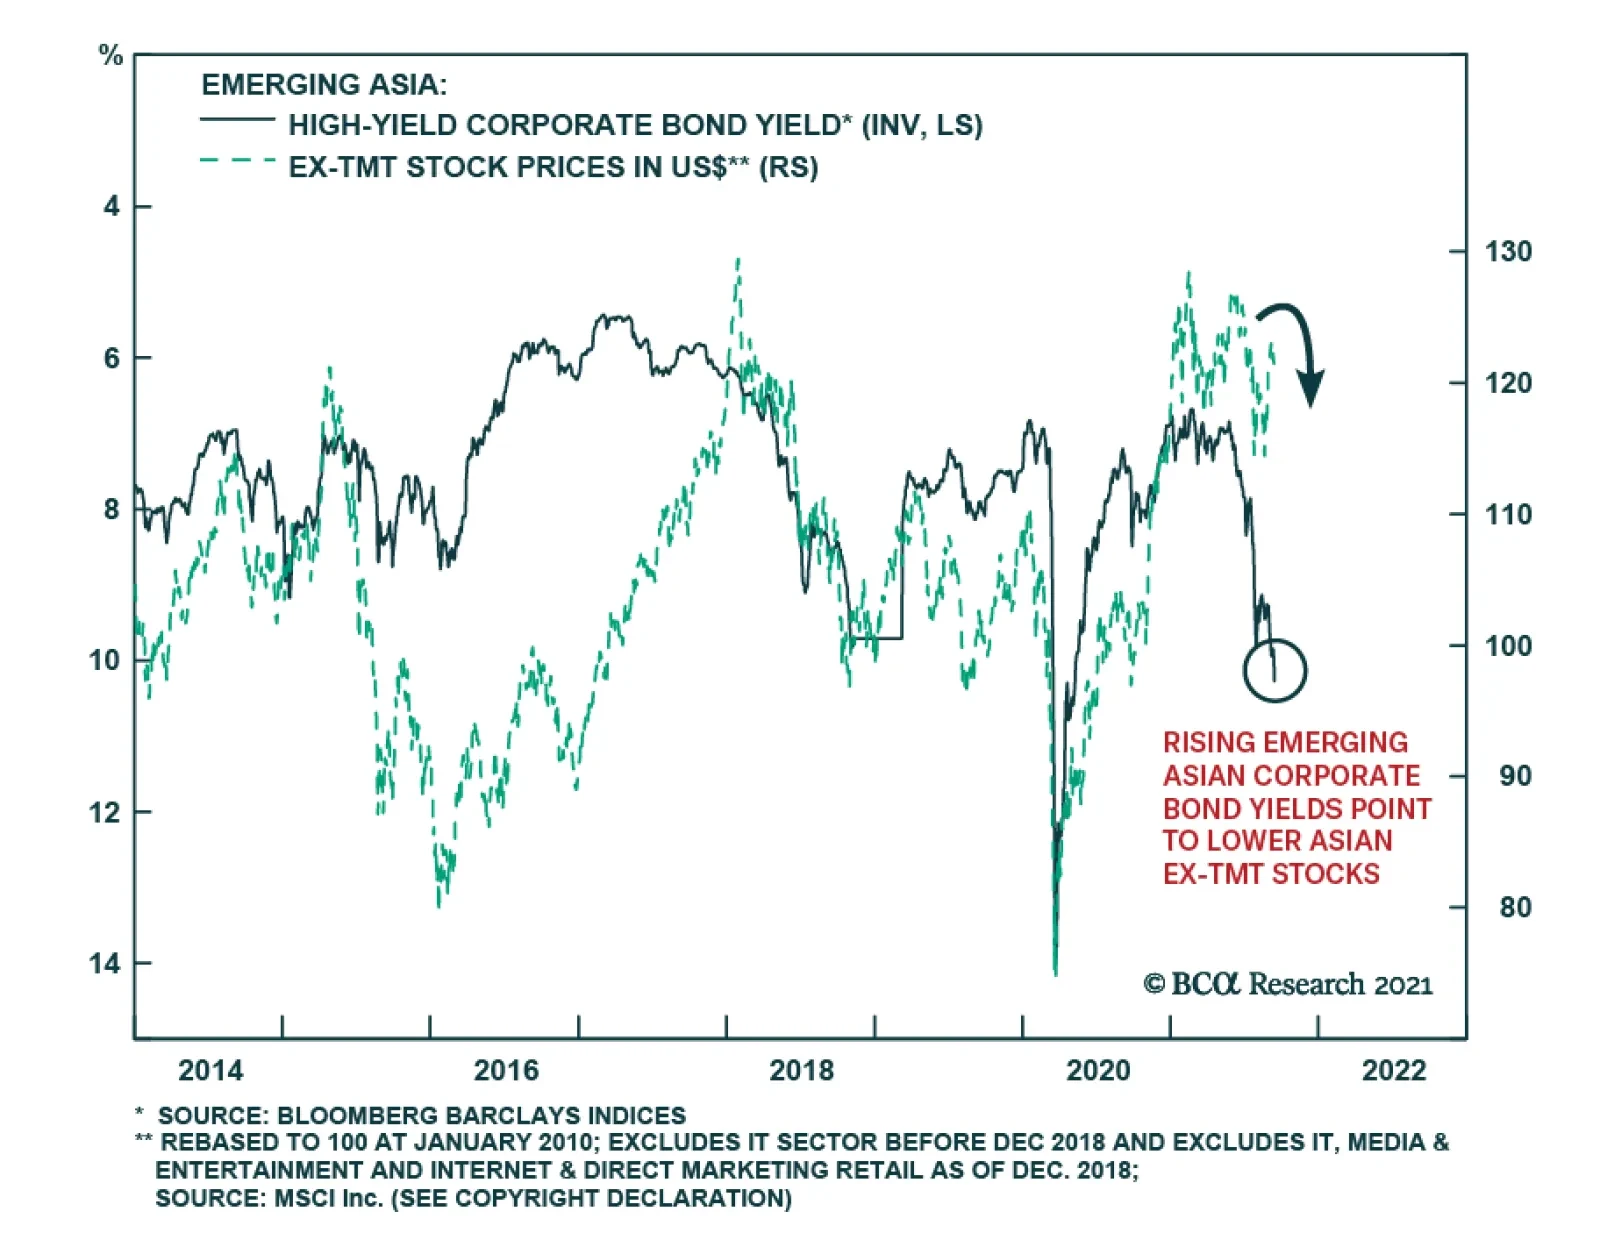
BCA Research's Emerging Markets Strategy service expects Evergrande’s partial default to reinforce credit tightening in China. Evergrande will likely default on some of its liabilities but there will be a bailout or roll-over of its other debt. This raises…
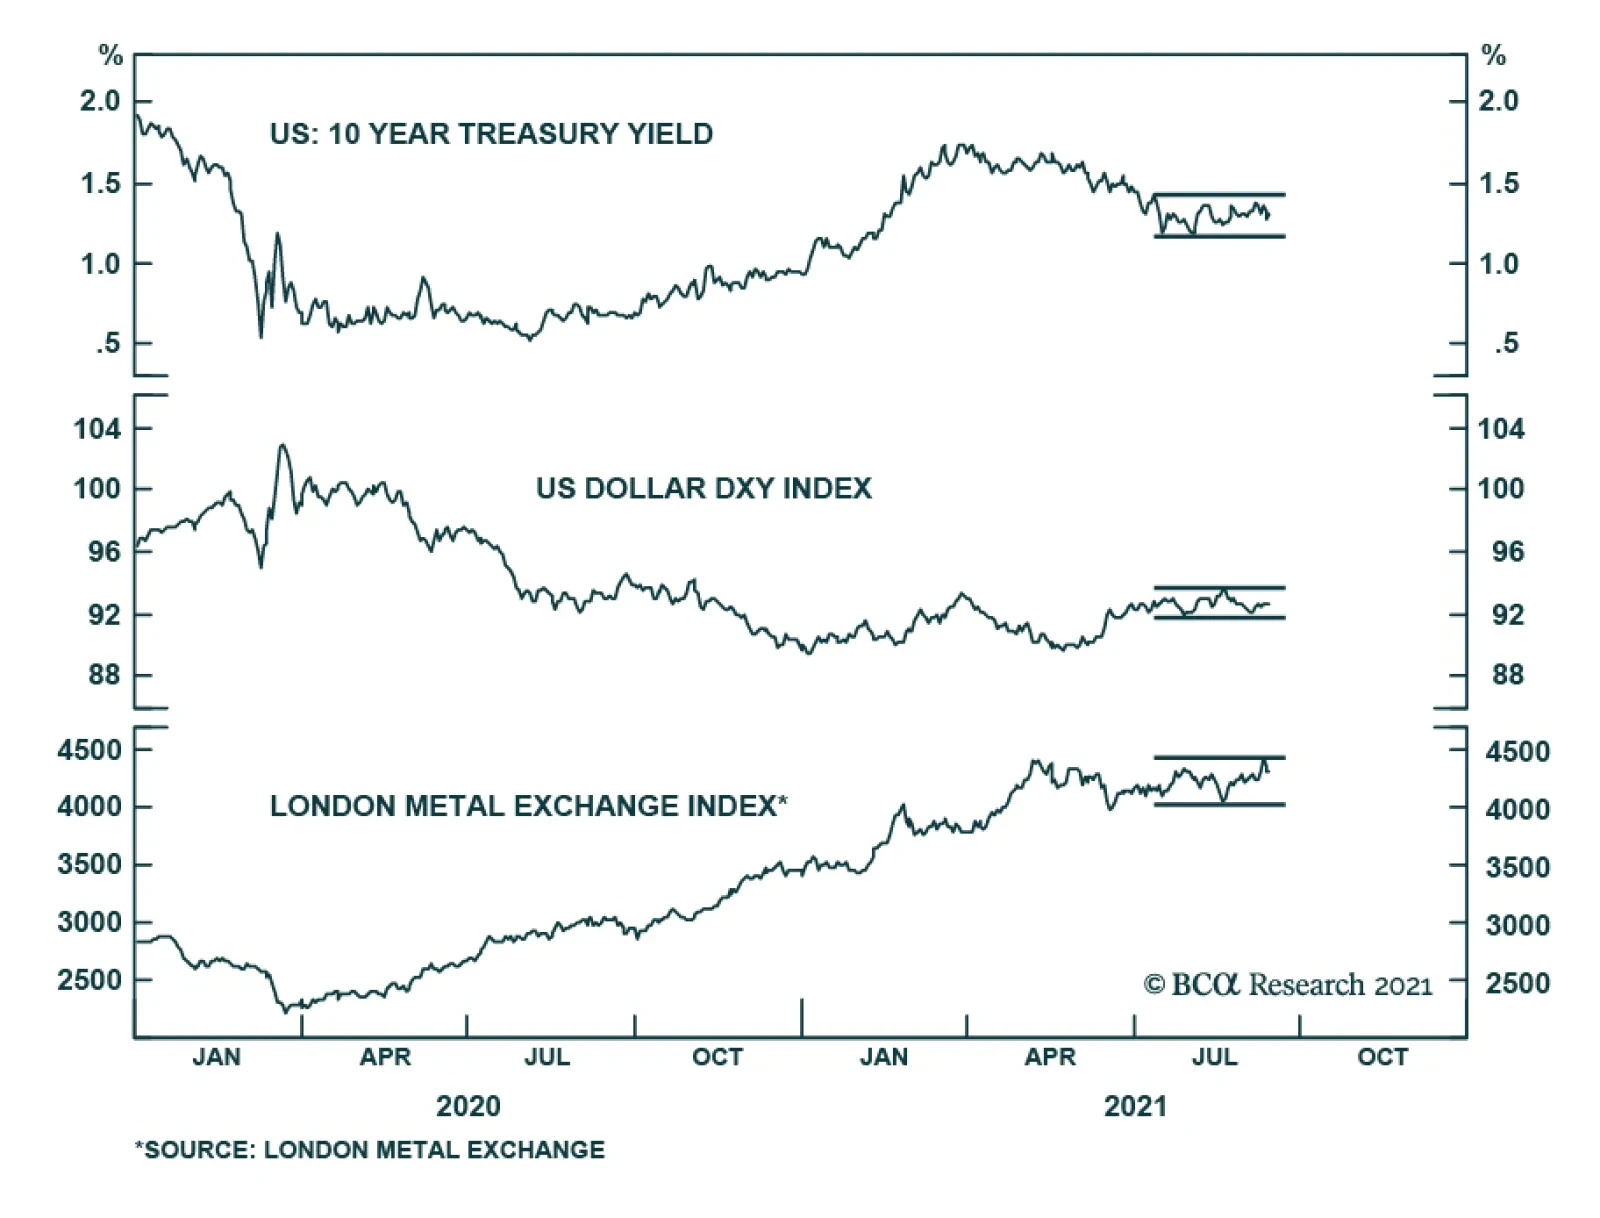
Several key financial assets are failing to send a strong signal and instead have been in a state of stasis. Abstracting from day-to-day moves, Treasury yields, the LMEX, and EUR/USD have not been on a clear trajectory since the beginning of July. Similarly,…

Highlights The odds of a stronger recovery in EM oil demand next year are rising, as vaccines using mRNA technology are manufactured locally and become widely available.1 This will reduce local lock-down risks in economies relying on less efficacious COVID-19 vaccines – or lacking them altogether – thereby increasing mobility, economic activity and oil demand. Our global crude oil balances estimates are little changed to the end of 2023, which leaves our price expectations mostly unchanged: 4Q21 Brent prices are expected to average $70.50/bbl, while 2022 and 2023 prices average $75 and $80/bbl, respectively (Chart of the Week). The balance of risks to the crude oil market remain to the upside in our estimation. In addition to a higher likelihood of better-than-expected EM demand growth, we expect OPEC 2.0 production discipline to hold, and for the price-taking cohort outside the coalition to continue prioritizing investors' interests. We remain long commodity index exposure – S&P GSCI and COMT – and, at tonight's close, will be getting long the DFA Dimensional Emerging Core Equity Market ETF (DFAE) on the back of increasing local mRNA vaccine production in EM economies. Feature As local production of COVID-19 vaccines employing mRNA technology spreads throughout EM economies, the odds of a stronger-than-expected recovery in oil demand next year will increase. The buildout of production and distribution facilities for this technology is progressing quickly in Asia – e.g., Chinese mRNA tech joint ventures are expected to be in production mode in 4Q21 – Latin America, Africa, and the Middle East.2 Accelerated availability of more efficacious vaccines globally will address the "fault lines" identified by the IMF in its July 2021 update. In that report, the Fund notes a major downside risk to its global GDP growth expectation of 6% this year remains slower-than-expected vaccine rollouts to emerging and developing economies.3 The other major risk identified by the Fund is too-rapid a winddown of policy support in DM economies, which would lead to tighter financial conditions globally. Our global demand expectation is driven by GDP estimates from the IMF and World Bank. The implication of that assumption is the powerful recovery in DM oil demand seen this year will slow while EM demand picks up next year (Chart 2). We proxy DM oil demand with OECD oil consumption and EM demand with non-OECD consumption. We continue to expect overall oil demand to recover by just over 5.0mm b/d this year and 4.4mm b/d next year (Table 1). Chart of the WeekOil Forecasts Hold Steady
Oil Forecasts Hold Steady
Oil Forecasts Hold Steady
Chart 2Higher EM Oil Demand Expected in 2022
Higher EM Oil Demand Expected in 2022
Higher EM Oil Demand Expected in 2022
Table 1BCA Global Oil Supply - Demand Balances (MMb/d, Base Case Balances) To Dec23
Upside Price Risk Rises For Crude
Upside Price Risk Rises For Crude
Global Oil Supply To Remain Steady Hurricane Ida will have removed ~ 30mm barrels of US offshore oil output by the time losses are fully tallied, based on IEA estimates. Even so, in line with the US EIA, we expect offshore US oil production will recover from the damage caused by the storm in 4Q21 and be back at ~ 1.7mm b/d on average over the quarter. This will allow oil prices to ease slightly from current elevated levels over the balance of the year. Inland, US shale-oil output remains on track to average ~ 9.06mm b/d this year, 9.55mmb/d in 2022 and 9.85mmb/d in 2023, in our modeling (Chart 3). We expect production in the Lower 48 states of the US to remain mostly steady going forward. Production from finishing drilled-but-uncompleted (DUCs) shale-oil wells is the lowest it's been since 2013. Output from these wells will remain relatively low for the rest of the year. This supply was developed during the COVID-19 pandemic, as it was cheaper to bring on than new drilling. For 2022 and 2023 overall, our model points to a slow build-up in US shale-oil output as drilling increases. Going into 2022, we expect continued production discipline from OPEC 2.0, and for the coalition to continue to manage output in line with actual demand it sees from its customers. The 400k b/d being returned monthly to the market over August 2021 to mid-2022 will accommodate demand increases. However, it will be monitored closely in the event demand fails to materialize, as has been OPEC 2.0's wont over the course of the pandemic. Chart 3US Shale-Oil Output Mostly Stable
US Shale-Oil Output Mostly Stable
US Shale-Oil Output Mostly Stable
Oil Markets To Remain Balanced We see markets remaining balanced to the end of 2023, with OPEC 2.0 maintaining its production-management strategy – keeping the level of supply just below the level of demand – and the price-taking cohort led by US shale-oil producers remaining focused on maintaining margins so as to provide competitive returns to investors. On the demand side, EM growth will pick up as DM growth slows. Given our fundamental view, global crude oil balances estimates are little changed to the end of 2023 (Chart 4). This allows inventories to continue to draw this year and next, then to slowly rebuild as production increases toward the end of 2023 (Chart 5). Falling inventories will keep the Brent forward curve backwardated – i.e., prompt-delivery oil will trade higher than deferred-delivery oil. Chart 4Markets Remain Balanced...
Markets Remain Balanced...
Markets Remain Balanced...
Chart 5...And Oil Inventory Continues To Draw
...And Oil Inventory Continues To Draw
...And Oil Inventory Continues To Draw
The backwardated forward curve means OPEC 2.0 producers will continue to realize higher delivered prices on their crude oil than the marginal shale-oil producer, which hedges its production 1-2 years forward to stabilize revenue. This is the primary benefit to the member states in the producer coalition: a backwardated curve pricing closer to marginal cost limits the amount of revenue available to shale-oil producers, and thus restrains output to that which is profitable at the margin. Investment Implications Our supply-demand outlook keeps our price expectations mostly unchanged from last month's forecast. We expect 4Q21 Brent prices to average $70.50/bbl, while 2022 and 2023 prices average $75 and $80/bbl, respectively, as can be seen in the Chart of the Week. WTI prices will continue to trade $2-$4/bbl below Brent over this interval. With fundamentals continuing to support a backwardated forward curve in Brent and WTI, we continue to favor long commodity-index exposure, which benefits from this structure.4 Therefore, we remain long the S&P GSCI and the COMT ETF, which is an optimized version of the GSCI that concentrates on positioning in backwardated futures contracts. The upside risk to oil prices resulting from increasing local production of mRNA vaccines in EM economies that had relied on less efficacious vaccines undoubtedly will increase mobility and raise oil demand, if, as appears likely, the impact of this localization is realized in the near term. This also could boost commodity demand generally, if it allows trade and GDP growth to accelerate in EM economies, which supports our long commodity-index view. The rollout of mRNA technology into EM economies also suggests EM GDP growth could increase at the margin with locally produced mRNA vaccines becoming more available. This would redound to the benefit of trade and economic activity generally.5 It also could help unsnarl the movement of goods globally. The wider implications of a successful expansion of locally produced mRNA vaccines leads us to recommend EM equity exposure on a tactical basis. At tonight's close, we will be getting long the DFA Dimensional Emerging Core Equity Market ETF (DFAE). As this is tactical, we will use a tight stop (10%) for this recommendation. Robert P. Ryan Chief Commodity & Energy Strategist rryan@bcaresearch.com Ashwin Shyam Research Associate Commodity & Energy Strategy ashwin.shyam@bcaresearch.com Commodities Round-Up Energy: Bullish Natural gas demand is surging globally. Record-breaking heat waves in the US are driving demand for gas-fired generation required to meet space-cooling demand. In addition, in the June-August period, the US saw record LNG exports. Europe and Asia are competing for the fuel as both prepare for winter. Brazil also has been a strong bid for LNG, as drought there has reduced hydropower supplies. In Europe, natural gas inventories were drawn hard this past winter as LNG supplies were bid away to Asia to meet space-heating demand. This is keeping Europe well bid now as winter approaches (Chart 6). The US Climate Prediction Center last week gave 70-80% odds of a second La Niña for the Northern Hemisphere winter. Should it materialize, it could again drive cold artic air into their markets, as it did last winter, and push natgas demand higher. Our recommendation to get long 1Q22 $5.00/MMBtu calls vs short 1Q22 $5.50/MMBtu calls last week was up 17% as of Tuesday's close. We remain long. Base Metals: Bullish The slide in iron ore prices from its ~ $230/MT peak earlier this year can be attributed to weak Chinese demand, and the possibility of its persistence through the winter and into next year (Chart 7). The world’s largest steel-producing nation is aiming to limit steel output to no higher than 2020 levels, in a bid to reduce industrial pollution. According to mining.com, provincial governments have directly asked local steel mills to curb output. Regulation in this sector in China will continue to reduce prices of iron ore, a key raw material in steel production. Precious Metals: Bullish The lower-than-expected reading on the US core CPI earlier this week weighed on the USD, and propelled gold prices above the $1,800/oz mark. While markets expected lower consumer prices for August to diminish the Fed’s resolve to taper asset purchases by year-end, we do not think the lower month-on-month CPI number will delay tapering. The timing of the Fed's initial rate hike – expected by markets to occur after the tapering of the central bank's asset-purchase program – will depend on the US labor force reaching "maximum employment." According to BCA Research's US Bond Strategy, this criterion will be met in late-2022 or early-2023. Low-interest rates, coupled with persistent inflation until then, will be bullish for gold prices. Chart 6
Upside Price Risk Rises For Crude
Upside Price Risk Rises For Crude
Chart 7
CHINA IMPORTED IRON ORE GOING DOWN
CHINA IMPORTED IRON ORE GOING DOWN
Footnotes 1 Please see Everest to bring Canadian biotech's potential Covid shots to China, other markets published on September 13, 2021 by indiatimes.com. 2 Examples of this include Brazil's Eurofarma to make Pfizer COVID-19 shots for Latin America, published by reuters.com; Biovac Institute to be first African company to produce mRNA vaccines, published be devex.com; and mRNA Vaccines Mark a New Era in Medicine, posted by supertrends.com. The latter report also discusses the application of mRNA technology to other diseases like malaria. 3 Please see Fault Lines Widen in the Global Recovery published 27 July 2021 by the Fund. 4 Backwardation is the source of roll yield for long-index exposure. This is due to the design of these index products, which buy forward then – in backwardated markets – roll out of futures contract as they approach physical delivery at a higher level and re-establish their exposure in a deferred contract. 5 The lower realized efficacy of Sinopharm and Sinovac COVID-19 vaccines and high reinfection rates in economies using these vaccines are one of the key risks to our overall bullish commodity view. Please see Assessing Risks To Our Commodity Views, which we published on July 8, 2021. It is available at ces.bcaresearch.com. Investment Views and Themes Recommendations Strategic Recommendations Tactical Trades Commodity Prices and Plays Reference Table Trades Closed in 2021 Summary of Closed Trades
Highlights Since June, 6 structured recommendations achieved their profit targets: short building and construction (XLB) versus healthcare (XLV); long USD/CAD; long USD/HUF; long Nike versus L’Oréal; short corn versus wheat; and short marine transport versus market. Additionally, short AMC Entertainment expired in profit, while short Australian versus Canadian 30-year bonds expired flat. Within the open trades, 3 are in profit. Against this, 2 structured recommendations hit their stop-losses: short Austria versus Chile; and short lead versus platinum. Additionally, short France versus Japan expired in loss. Within the open trades, 6 are in loss. This results in a ‘win ratio’ at a very pleasing 59 percent. Even more commendably, the 9 unstructured recommendations have all anticipated reversals or exhaustions – most notably for the ZAR, BRL, and stocks versus bonds. Feature Chart of the WeekFractal Fragility Correctly Signalled The Exhaustion Of Stocks Versus Bonds
Fractal Fragility Correctly Signalled The Exhaustion Of Stocks Versus Bonds
Fractal Fragility Correctly Signalled The Exhaustion Of Stocks Versus Bonds
A major advance in our understanding of financial markets is that the Efficient Market Hypothesis (EMH) is only partly true. The market is efficient only when a wide spectrum of investment horizons is setting the price, signified by the market having a rich fractal structure. The market is efficient only when a wide spectrum of investment horizons is setting the price, signified by the market having a rich fractal structure. The eponymous Fractal Market Hypothesis (FMH) teaches us that when the fractal structure becomes extremely fragile, the information and interpretation of longer-term investors is missing from the recent price setting. Meaning that the market has become inefficient. When the longer-term investors do re-enter the price setting process, the question is: will they endorse the most recent trend as a justification of a change in the fundamentals. In which case, the trend will continue. Or will they reject it as an unjustified deviation from a fundamental anchor. In which case, the trend will reverse. In most cases, it is the latter: a rejection and a reversal. As most investors are unaware of the FMH, it gives a competitive advantage to the few investors that use it to signal a potential countertrend reversal. On this basis, we have used it – and continue to use it – to identify countertrend investment opportunities with truly excellent results. Fractal Trade Update This a brief review and update of the 29 short-term trades that we have recommended since our last update on 3rd June 2021, including recommendations that were open on that date. The 29 recommendations have comprised 20 structured trades – which include profit-targets, symmetrical stop-losses, and expiry dates – plus a further 9 recommendations without structured exit points. In summary, 6 structured recommendations achieved their profit targets: short building and construction (XLB) versus healthcare (XLV); long USD/CAD; long USD/HUF; long Nike versus L’Oréal; short corn versus wheat; and short marine transport versus market. Additionally, short AMC Entertainment expired in profit, while short Australian versus Canadian 30-year bonds expired flat. Within the open trades, 3 are in profit. Against this, 2 structured recommendations hit their stop-losses: short Austria versus Chile; and short lead versus platinum. Additionally, short France versus Japan expired in loss. Within the open trades, 6 are in loss. This results in a ‘win ratio’ at a very pleasing 59 percent – counting a win as achieving the profit target, a loss as hitting the (symmetrical) stop-loss, and pro-rata for partial wins and losses. Even more commendably, the 9 unstructured recommendations have all anticipated reversals or exhaustions. The sections below review the structured and unstructured recommendations in chronological order. The 20 Structured Trades 1. 6th May: Short Building and Construction (PKB) vs. Healthcare (XLV) Achieved its profit target of 15 percent. 2. 6th May: Short MSCI France vs. Japan Expired after three months in partial loss but went on to become very profitable – implying that a longer holding period was required (Chart I-2). Chart I-2Short France Versus Japan Became Very Profitable
Short France Versus Japan Became Very Profitable
Short France Versus Japan Became Very Profitable
3. 13th May: Long USD/CAD Achieved its profit target of 3.7 percent and went on to reach a high-water mark of 5.7 percent. 4. 20th May: Long 10-year T-bond vs. TIPS Open, in profit, having reached a high-water mark of 2.7 percent (versus a 3.6 percent target). 5. 3rd June: Short MSCI Austria vs. Chile Hit its stop-loss of 7 percent, albeit after previously reaching a high-water mark of 5.3 percent – implying that the profit target needed to be tighter. 6. 10th June: Short AMC Entertainment Expired at a 4 percent profit, having reached a high-water mark of 65.3 percent (versus a 100 percent target) (Chart I-3). Chart I-3Fractal Analysis Works Very Well For Meme Stocks
Fractal Analysis Works Very Well For Meme Stocks
Fractal Analysis Works Very Well For Meme Stocks
7. 10th June: Long USD/HUF Achieved its 3 percent profit target, before continuing to a high-water mark of 7.6 percent (Chart I-4). Chart I-4HUF/USD Corrected By 7.6 Percent
HUF/USD Corrected By 7.6 Percent
HUF/USD Corrected By 7.6 Percent
8. 17th June: Long Nike vs. L’Oréal Achieved its 9 percent profit target, before continuing to a high-water mark of 31.3 percent (Chart I-5). Chart I-5L’Oréal Underperformed Nike By 31 Percent
L'Oreal Underperformed Nike By 31 Percent
L'Oreal Underperformed Nike By 31 Percent
9. 24th June: Short Corn vs. Wheat Achieved its 12 percent profit target, before continuing to a high-water mark of 38.7 percent (Chart I-6). Chart I-6Corn Underperformed Wheat By 39 Percent
Corn Underperformed Wheat By 39 Percent
Corn Underperformed Wheat By 39 Percent
10. 1st July: Short US REITs vs. Utilities Open, in profit, having reached a high-water mark of 3 percent (versus a 5 percent target). 11. 8th July: Short Marine Transport vs. Market Achieved its profit target of 16.5 percent. 12. 15th July: Short Lead vs. Platinum Hit its stop loss of 6.4 percent. 13. 15th July: Short Australia vs. Canada 30-year T-Bonds Expired flat. 14. 5th August: Short Tin vs. Platinum Open, in loss, albeit having reached a high-water mark of 9.3 percent (versus a 16.5 percent target). 15. 12th August: Long MSCI Hong Kong vs. MSCI World Open, in loss. 16. 12th August: Long New Zealand vs. Netherlands Open, in loss. 17. 19th August: Short India vs. China Open, in loss (Chart I-7). Chart I-7The Outperformance Of India Versus China Is Fractally Fragile
The Outperformance Of India Versus China Is Fractally Fragile
The Outperformance Of India Versus China Is Fractally Fragile
18. 26th August: Short Sugar vs. Soybeans Open, in loss. 19. 2nd September: Short Aluminum vs. Gold Open, in loss (Chart I-8). Chart I-8The Outperformance Of Base Metals Versus Precious Metals Is Fractally Fragile
The Outperformance Of Base Metals Versus Precious Metals Is Fractally Fragile
The Outperformance Of Base Metals Versus Precious Metals Is Fractally Fragile
20. 9th September: Short US Medical Equipment vs. Healthcare Services Open, in profit. The 9 Unstructured Trades 1. 10th June: Short ZAR/USD ZAR/USD subsequently corrected by 12 percent. 2. 24th June: Short Copper Copper’s rally subsequently exhausted. 3. 1st July: Short MSCI ACWI vs. 30-year T-bond The rally in stocks versus bonds has subsequently exhausted (Chart of the Week). 4. 8th July: Short BRL/COP BRL/COP subsequently corrected by 4 percent. 5. 8th July: Short Saudi Tadawul All-Share vs. FTSE Malaysia All Share KLCI The rally in Saudi Arabian equities versus Malaysian equities subsequently exhausted. 6. 12th August: Long NOK/GBP NOK/GBP has subsequently rallied by 3 percent. 7. 26th August: Short Hungary vs. EM Hungary’s outperformance is losing steam. 8. 26th August: Short USD/PLN USD/PLN subsequently corrected by 3 percent. 9. 2nd September: Short Trade Weighted US Dollar Index The dollar rally is meeting near-term resistance. Dhaval Joshi Chief Strategist dhaval@bcaresearch.com Mohamed El Shennawy Research Associate Fractal Trading System Fractal Trades 6-Month Recommendations Structural Recommendations Closed Fractal Trades Closed Trades Asset Performance Equity Market Performance Indicators To Watch - Bond Yields Chart II-1Indicators To Watch - Bond Yields ##br##- Euro Area
Indicators To Watch - Bond Yields - Euro Area
Indicators To Watch - Bond Yields - Euro Area
Chart II-2Indicators To Watch - Bond Yields ##br##- Europe Ex Euro Area
Indicators To Watch - Bond Yields - Europe Ex Euro Area
Indicators To Watch - Bond Yields - Europe Ex Euro Area
Chart II-3Indicators To Watch - Bond Yields ##br##- Asia
Indicators To Watch - Bond Yields - Asia
Indicators To Watch - Bond Yields - Asia
Chart II-4Indicators To Watch - Bond Yields ##br##- Other Developed
Indicators To Watch - Bond Yields - Other Developed
Indicators To Watch - Bond Yields - Other Developed
Indicators To Watch - Interest Rate Expectations Chart II-5Indicators To Watch - Interest Rate Expectations
Indicators To Watch - Interest Rate Expectations
Indicators To Watch - Interest Rate Expectations
Chart II-6Indicators To Watch - Interest Rate Expectations
Indicators To Watch - Interest Rate Expectations
Indicators To Watch - Interest Rate Expectations
Chart II-7Indicators To Watch - Interest Rate Expectations
Indicators To Watch - Interest Rate Expectations
Indicators To Watch - Interest Rate Expectations
Chart II-8Indicators To Watch - Interest Rate Expectations
Indicators To Watch - Interest Rate Expectations
Indicators To Watch - Interest Rate Expectations
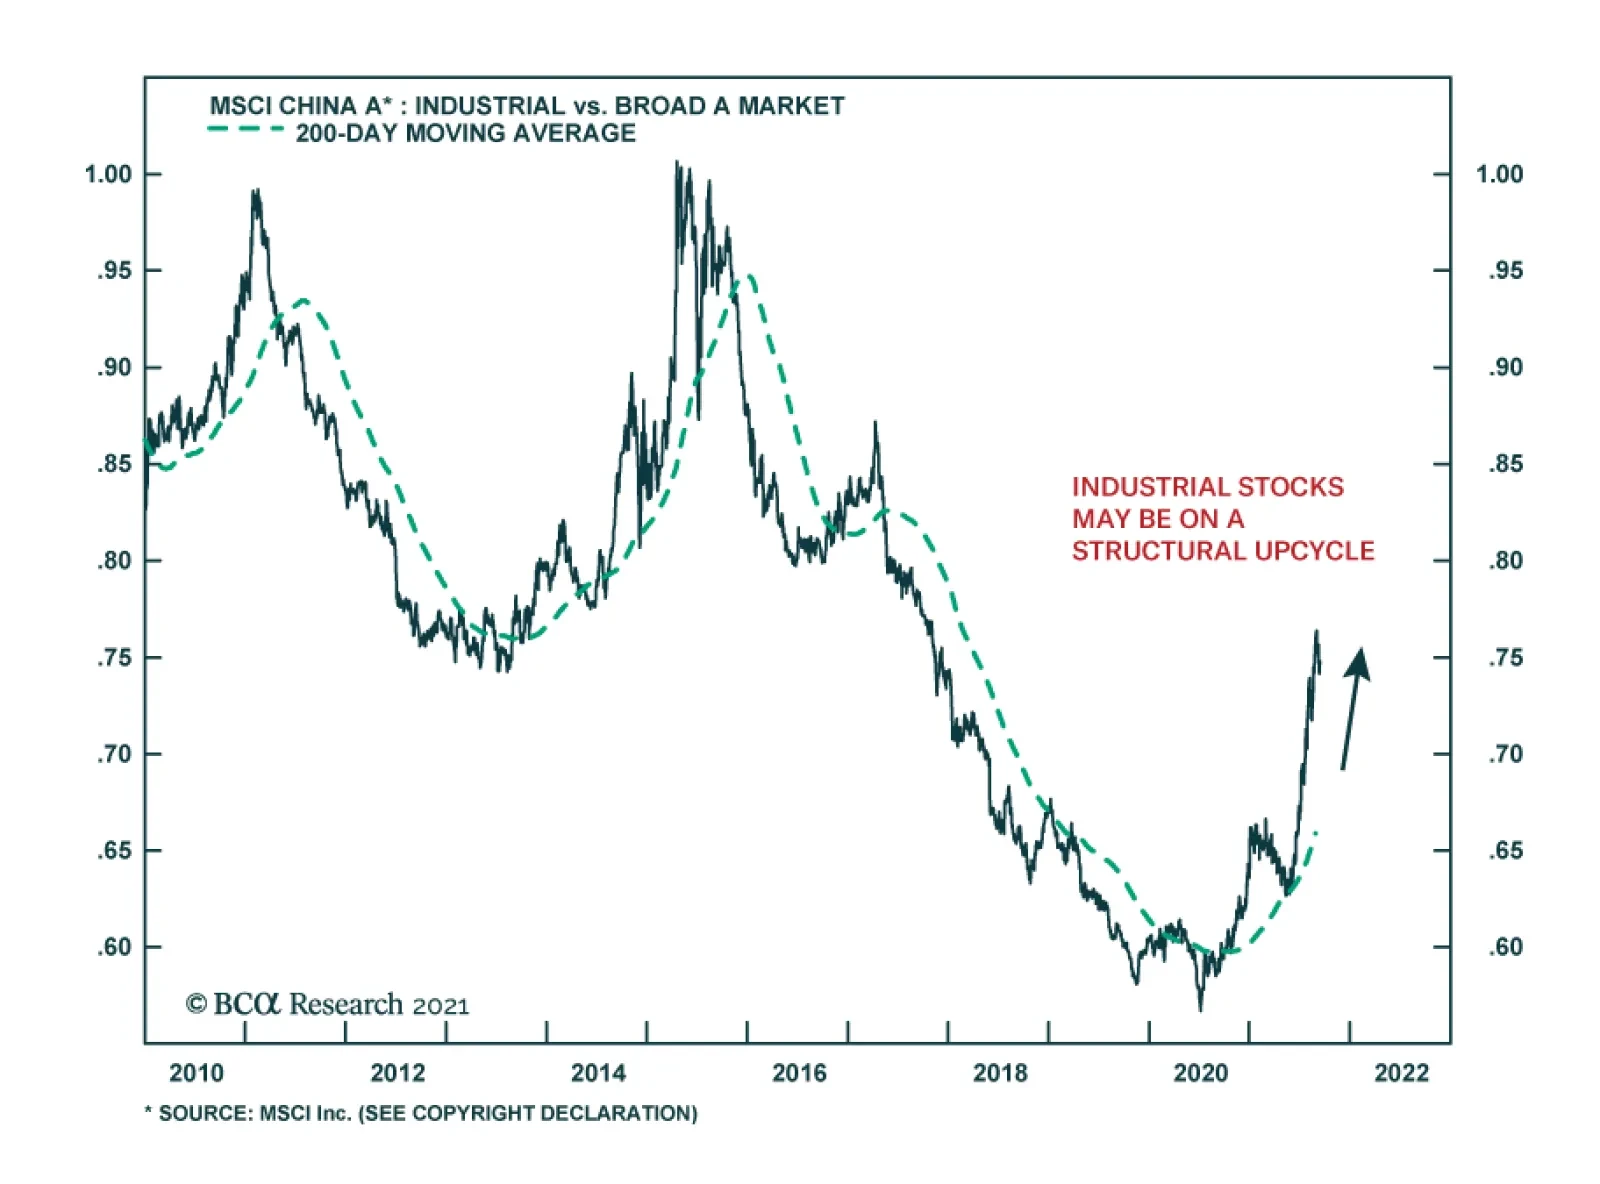
BCA Research's China Investment Strategy service recommends a new trade: long Chinese industrial stocks/short A-shares. Chinese onshore stocks in the infrastructure, materials, and industrial sectors recently advanced strongly in the expectation that…
Congress’ passage of the American Families Act is a keystone of the President Biden’s legislative agenda. However, to pay for the additional spending, Democrats will seek to levy more taxes on corporations and higher-income earners. The Biden Administration is aiming to raise the corporate tax rate from 21% to 28%, bringing it halfway back to the 35% level that prevailed prior to the Trump tax cuts. Joe Manchin, a key swing voter in the Senate, has indicated a preference for 25%. PredictIt, a popular betting site, assigns 31% odds to no tax hike. Among bettors forecasting higher tax rates, the median estimate is around 25% (Chart 1). BCA’s Geopolitical team thinks that corporate taxes will rise more than current market expectations suggest. Chart 1
Only Death And Taxes…
Only Death And Taxes…
Meanwhile, analyst estimates do not appear to reflect the prospect of higher taxes. However, even under President Biden’s baseline scenario of 28% tax rate, higher tax rates will cut earnings-per-share for S&P 500 companies by about 5% in 2022. Given that earnings are expected to rise by 9% next year, this would leave earnings growth in a positive territory, but just about (BCA Research - Five Risks We Are Monitoring). That’s concerning, given that earnings—particularly earnings estimates—have been driving the S&P 500 higher. The market, however, hasn’t even begun to consider the potential impact (Chart 2). Chart 2
CHART 2
CHART 2
Bottom Line: Corporate taxes are slated for a rise, yet the market has not yet priced this in. Even base case scenario tax hike to 28% is bound to reduce earnings growth by 5%, and have an adverse effect on the US equity market returns.
Highlights Stocks tend to perform worse when unemployment is low. Since 1950, the S&P 500 has risen at an annualized pace of 12% when the unemployment rate was above its historic average compared to 6% when the unemployment rate was below its average. Three reasons help explain this relationship: 1) The unemployment rate has historically been mean-reverting; 2) Low unemployment often leads to monetary tightening; and 3) Valuations are usually more stretched when unemployment is low. In the spring of 2020, stocks benefited from what turned out to be a very auspicious environment: A steady decline in the unemployment rate from very high levels, assisted by a massive dose of monetary and fiscal stimulus. Today, the situation is less clear-cut. The labor market has improved dramatically, while both monetary and fiscal policy are turning less accommodative. Nevertheless, the Fed is unlikely to hike rates for at least 12 months, and it will take much longer than that for monetary policy to turn restrictive. This suggests that we are still in the middle-to-late stages of a business cycle expansion that began following the Great Recession (and was only briefly interrupted by the pandemic). Historically, cyclical stocks have done well during this phase of the business cycle. To the extent that cyclicals are overrepresented in overseas indices, investors should favor non-US stock markets. Non-US stocks also trade at a substantial valuation discount to their US peers. A Surprising Relationship One of the best pieces of advice I received when I was starting my research career was to get to the punchline as soon as possible. As a strategist, you are not writing a detective novel where the answers are shrouded in mystery until the very end. You are providing conclusions to readers with supporting evidence. Chart 1Stocks Do Best When Unemployment Is High
Is Low Unemployment Good Or Bad For Stocks?
Is Low Unemployment Good Or Bad For Stocks?
With that in mind, let me answer the question posed in the title of this report: Is low unemployment good or bad for stocks? As Chart 1 shows, the answer is bad. The interesting issues are why it is bad and what this may mean for investors today. There are three key reasons why low unemployment has typically corresponded with paltry equity returns: The unemployment rate has historically been mean-reverting: Low unemployment is often followed by high unemployment. And, when the unemployment rate starts rising, it keeps rising. There has never been a case in the post-war era where the unemployment rate has risen by more than one-third of a percentage point without a recession occurring (Chart 2). Chart 2When Unemployment Starts Rising, It Usually Keeps Rising
When Unemployment Starts Rising, It Usually Keeps Rising
When Unemployment Starts Rising, It Usually Keeps Rising
Low unemployment often leads to monetary tightening: An economy can only grow at an above-trend pace if there is labor market slack. Once the slack runs out, growth is liable to weaken as supply-side constraints kick in. Worse yet, labor market overheating has historically prompted central banks to raise rates (Chart 3). Higher rates in the context of slowing growth is toxic for stocks. Valuations are usually more stretched when unemployment is low: During the post-war period, the S&P 500 has traded at an average Shiller P/E ratio of 22.5 when the unemployment rate was below its historic average compared to 16.3 when the unemployment rate was above its average. Implications For The Present Day Stocks fare best when unemployment is high but falling. In contrast, stocks fare the worst when unemployment is low and rising (Chart 4). My colleague Doug Peta, BCA’s Chief US Investment Strategist, reached a similar conclusion in his August report entitled Level Or Direction? Chart 3Low Unemployment Often Leads To Monetary Tightening
Low Unemployment Often Leads To Monetary Tightening
Low Unemployment Often Leads To Monetary Tightening
Chart 4Stocks Do Best When Unemployment Is Falling From High Levels
Is Low Unemployment Good Or Bad For Stocks?
Is Low Unemployment Good Or Bad For Stocks?
In the spring of 2020, stocks benefited from what turned out to be a very auspicious environment: A steady decline in the unemployment rate from very high levels, assisted by a massive dose of monetary and fiscal stimulus. Controversially at the time, this led us to argue that the pandemic could lead to much higher stock prices. Chart 5There Is Still Slack
There Is Still Slack
There Is Still Slack
Today, the situation is less clear-cut. On the one hand, the unemployment rate has fallen dramatically, while monetary and fiscal policy are turning less accommodative. This week, the ECB reduced the pace of net asset purchases under the PEPP. The Fed will start paring back asset purchases by the end of this year. Governments are also withdrawing fiscal policy support. In the US, emergency federal unemployment benefits expired, somewhat ironically, on Labor Day. On the other hand, the unemployment rate in most economies is still above pre-pandemic levels. In the US, the unemployment rate for prime-age workers is 1.7 percentage points higher than in February 2020, while the employment-to-population ratio is 2.4 points lower (Chart 5). The presence of labor market slack ensures that policy support will be withdrawn only gradually. Granted, core CPI inflation in the US is running above 4%. Standard Taylor Rule equations suggest that the Fed funds rate should be well above zero (Chart 6). That said, these equations use realized inflation, which may be misleading given that both market participants and Fed officials expect inflation to fall rapidly (Chart 7). Indeed, the widely followed 5-year/5-year forward TIPS breakeven rate is below the Fed’s comfort zone (Chart 8).1 With long-term inflation expectations still subdued, there is no urgency for the Fed to sound more hawkish. Chart 6What Rate Does The Taylor Rule Prescribe?
Is Low Unemployment Good Or Bad For Stocks?
Is Low Unemployment Good Or Bad For Stocks?
Chart 7Investors Expect Inflation To Fall Rapidly From Current Levels
Is Low Unemployment Good Or Bad For Stocks?
Is Low Unemployment Good Or Bad For Stocks?
Chart 8Long-Term Inflation Expectations Are Muted
Long-Term Inflation Expectations Are Muted
Long-Term Inflation Expectations Are Muted
Cyclical Stocks Usually Do Best In The Latter Innings Of The Business Cycle Expansion Monetary policy is unlikely to become restrictive in any major economy during the next 18 months, which should allow global growth to remain at an above-trend pace. Hence, it is too early to turn bearish on stocks. Nevertheless, given that the unemployment rate in most countries is closer to a trough than to a peak, it is reasonable to conclude that we are somewhere in the middle-to-late stages of a business cycle expansion that began following the Great Recession (and was only briefly interrupted by the pandemic). As Chart 9 shows, cyclical equity sectors, such as industrials, energy, and materials, typically do best in the latter innings of business cycle expansions. Such was the environment that prevailed in 2005-08, and such will be the environment that prevails over the coming quarters as the unemployment rate falls further, capital spending increases, and commodity prices rise further. Chart 9The Business Cycle And Equity Sectors
Is Low Unemployment Good Or Bad For Stocks?
Is Low Unemployment Good Or Bad For Stocks?
Increased government infrastructure spending should help cyclical sectors. The US Congress is set to pass a 10-year $500 billion package. The EU’s €750 billion Next Generation fund is finally up and running. Chinese local government infrastructure spending is poised to accelerate over the remainder of the year. Chart 10The Dollar Is A Countercyclical Currency
The Dollar Is A Countercyclical Currency
The Dollar Is A Countercyclical Currency
Chart 11Past Another Covid Wave
Is Low Unemployment Good Or Bad For Stocks?
Is Low Unemployment Good Or Bad For Stocks?
A weaker US dollar should also buoy cyclical stocks (Chart 10). As a countercyclical currency, the greenback usually weakens when global growth is strong. A cresting in the Delta variant wave should help jumpstart global growth over the coming months (Chart 11). Meanwhile, interest rate differentials have moved sharply against the US dollar, while the US trade deficit has widened noticeably (Charts 12A & B). Chart 12AInterest Rate Differentials Have Moved Against The Dollar
Interest Rate Differentials Have Moved Against The Dollar
Interest Rate Differentials Have Moved Against The Dollar
Chart 12BThe US Trade Deficit Has Widened Noticeably
The US Trade Deficit Has Widened Noticeably
The US Trade Deficit Has Widened Noticeably
Cyclical sectors are overrepresented outside the US (Table 1). Although not a classically cyclical sector, financials are also overrepresented in overseas indices. BCA’s global fixed-income strategists recommend a moderately underweight duration stance. As bond yields rise, bank shares should outperform (Chart 13). In contrast, tech stocks often lag in a rising yield environment. Table 1Cyclicals Are Overrepresented Outside The US
Is Low Unemployment Good Or Bad For Stocks?
Is Low Unemployment Good Or Bad For Stocks?
Chart 13Higher Rates: A Boon For Banks And A Bane For Tech
Higher Rates: A Boon For Banks And A Bane For Tech
Higher Rates: A Boon For Banks And A Bane For Tech
How Expensive Are Stocks? A high Shiller P/E predicts low future returns (Chart 14). Today, the Shiller P/E stands at 37 in the US. This is consistent with an expected 10-year total real return of close to zero for the S&P 500. Thus, the long-term outlook for US stocks is poor. We stress the words “long term.” As the bottom panel of Chart 14 shows, no matter what the starting point of valuations is, the average return over short-term horizons is very low relative to realized volatility. This is another way of saying that valuations provide a great deal of information about the long-term outlook for stocks, but little information about their near-term direction. Over horizons of about 12 months, the business cycle drives the stock market, as a simple comparison between purchasing manager indices and stock returns illustrates (Chart 15). Chart 14Valuation Is The Single Best Predictor Of Long-Term Equity Returns
Is Low Unemployment Good Or Bad For Stocks?
Is Low Unemployment Good Or Bad For Stocks?
Chart 15AThe Business Cycle Drives Cyclical Swings In Stocks
The Business Cycle Drives Cyclical Swings In Stocks
The Business Cycle Drives Cyclical Swings In Stocks
Chart 15BThe Business Cycle Drives Cyclical Swings In Stocks
The Business Cycle Drives Cyclical Swings In Stocks
The Business Cycle Drives Cyclical Swings In Stocks
Outside the US, the Shiller P/E stands at 20. In emerging markets, it is only 16 (Chart 16). This is significantly below US levels, implying that the long-term prospect for equities is much more attractive abroad. Thus, both medium-term cyclical factors and long-term valuation considerations favor non-US stocks. Peter Berezin Chief Global Strategist pberezin@bcaresearch.com Chart 16US Stocks Are Pricey
US Stocks Are Pricey
US Stocks Are Pricey
Footnotes 1 The Federal Reserve targets an average inflation rate of 2% for the personal consumption expenditures (PCE) index. The TIPS breakeven is based on the CPI index. Due to compositional differences between the two indices, CPI inflation has historically averaged 30-to-50 basis points higher than PCE inflation. This is why the Fed effectively targets a CPI inflation rate of about 2.3%-to-2.5%. Global Investment Strategy View Matrix
Is Low Unemployment Good Or Bad For Stocks?
Is Low Unemployment Good Or Bad For Stocks?
Special Trade Recommendations
Is Low Unemployment Good Or Bad For Stocks?
Is Low Unemployment Good Or Bad For Stocks?
Current MacroQuant Model Scores
Is Low Unemployment Good Or Bad For Stocks?
Is Low Unemployment Good Or Bad For Stocks?
Highlights Germany’s election on September 26 is more of an opportunity than a risk for global investors. Coalition formation will prolong uncertainty but the key takeaway is that early or aggressive fiscal tightening is off the table for Germany … and hence the EU. Germany’s left wing is surprising to the upside as predicted, but it is the Social Democrats rather than the Greens who have momentum in the polls. This is a market-positive development. A coalition of only left-wing parties is entirely possible, but there is a 65% chance that the Christian Democrats (or Free Democrats) will take part in the next coalition to get a majority government. This would constrain business unfriendly outcomes. The German economy is likely to slow for the remainder of 2021, but the outlook for 2022 remains bright as the current headwinds facing the country will dissipate, especially if the risk of an aggressive fiscal drag is low. The underperformance of German equities relative to their Eurozone counterparts is long in the tooth. A combination of valuation, earnings momentum and technical factors suggests that German stocks will beat their peers next year. German equities will also outperform Bunds, which offer particularly unattractive prospective returns. Feature Germany’s federal election will be held on September 26. Our forecast that the left wing will surprise to the upside remains on track, albeit with the Social Democrats rather than the Greens surging to the forefront of opinion polls (Chart 1). However, the precise composition of the next government is very much in the air. Chart 1German Election: Social Democrats Take The Lead
German Election: Social Democrats Take The Lead
German Election: Social Democrats Take The Lead
Our quantitative German election model – which we introduce in this special report – predicts that the ruling Christian Democratic Union will outperform their current 21% standing in opinion polls, winning as much as 33% of the popular vote. Subjectively, this seems like an overestimation, but it goes to show that outgoing Chancellor Angela Merkel’s popularity, a historically strong voting base, and the economic recovery will help the party pare its losses this year. This finding, combined with the strong momentum for the Social Democrats, suggests that the election outcome will not be decisive. Germany will end up with either a grand coalition that includes Merkel’s Christian Democrats or a left-wing coalition that lacks a majority in parliament.1 Investors should note that none of the election outcomes are hugely disruptive to domestic or foreign policy. The status quo is unexciting but not market-negative, while a surprise left-wing victory would mean more reflation in the short run but a roll back of some pro-business policies in the long run. More broadly Germany has established a national consensus that rests on European integration, looser fiscal policy, renewable energy, and qualified engagement with autocratic powers like Russia and China. The chief takeaway is that fiscal policy will not be tightened too soon – and could be loosened substantially. Germany’s Fiscal Question Outgoing Chancellor Angela Merkel is stepping down after ruling Germany since 2005. The Christian Democratic Union, and its Bavarian sister party the Christian Social Union, together form the “Union” that is hard to beat in German elections, having occupied the chancellor’s office for 57 out of 72 years. However, both the Christian Democrats and the Social Democrats, their main rivals, have been shedding popular vote share since 1990, as other parties like the Greens, Free Democrats, the Left, and Alternative for Germany have gained traction (Table 1). Table 1Germany: Traditional Parties Lose Vote Share Over Time
German Election: Winds Of Change
German Election: Winds Of Change
The Great Recession and European sovereign debt crisis ushered in a new geopolitical and macroeconomic context that Merkel reluctantly helped Germany and the EU navigate. Germany’s clashes with the European periphery ultimately resulted in deeper EU integration, in accordance with Germany’s grand strategy and Merkel’s own strategy. But just as the euro crisis receded, a series of shocks elsewhere threatened to upend Germany’s position as one of the biggest economic winners of the post-Cold War world. The sluggish aftermath of the financial crisis, the Russian invasion of Crimea, the Syrian refugee crisis, the Brexit referendum, and President Trump’s election in the US sparked a retreat from globalization, a direct threat to an export-oriented manufacturing economy like Germany. In the 2017 election the Union lost 13.4 percentage points compared to the 2013 election. Minor parties have gradually gained ground since then. However, through a coalition with the Social Democrats, Merkel and her party managed to retain control of the government. This grand coalition eased the country’s fiscal belt in response to the trade war and global slowdown in 2019, signaling Germany’s own shift away from fiscal austerity. Then COVID-19 struck, prompting a much larger fiscal expansion to tide over the economy amid social lockdowns. Germany was not the largest EU member in terms of fiscal stimulus but nor was it the smallest (Chart 2). It joined with France to negotiate a mutual debt plan to rescue the broader EU economy and deepen integration. Chart 2Germany’s Fiscal Stimulus Ranks In The Middle Of Major Countries
German Election: Winds Of Change
German Election: Winds Of Change
Germany’s pro-EU perspective has been reinforced by Brexit and is not on the ballot in 2021. Immigration and terrorism have temporarily subsided as voter concerns. The focus of the 2021 election is how to get through the pandemic and rebuild the German economy for the future. For investors the chief question is whether conservatives will have enough sway in the next government to try to semi-normalize policy and consolidate budgets in the coming years, or whether a left-wing coalition will take charge, expanding on Germany’s proactive fiscal turn. The latter has consequences for broader EU fiscal normalization as well since Germany is traditionally the prime enforcer of deficit limits. The latest opinion polls point to more proactive fiscal policy. The country’s left-leaning ideological bloc has taken the lead (Chart 3A) and the Social Democratic leader Olaf Scholz has sprung into first place among the chancellor candidates (Chart 3B). Chart 3AGermany: Voting Intentions Favor Left-Leaning Parties
Germany: Voting Intentions Favor Left-Leaning Parties
Germany: Voting Intentions Favor Left-Leaning Parties
Chart 3BSocial Democrats Likely To Take Chancellery
German Election: Winds Of Change
German Election: Winds Of Change
Scholz has served as finance minister and is the face of the country’s recent fiscal stimulus efforts. Public opinion is clearly rewarding him for this stance as well as his party, which was previously in the doldrums.2 The Social Democrats and Greens are calling for more fiscal expansion as well as wage hikes and tax hikes (wealth redistribution) in pursuit of social equality and a greener economy (Table 2). If the Christian Democrats retain a significant role in the future coalition, these initiatives will be blunted – not to say halted entirely. But if the left parties put together a ruling coalition without the Christian Democrats, then they will be able to launch more ambitious tax-and-spend policies. Opinion polls show that voters still slightly favor coalitions that include the Christian Democrats, although momentum has shifted sharply in favor of a left-wing coalition (Chart 4). Table 2German Party Platforms
German Election: Winds Of Change
German Election: Winds Of Change
Chart 4Voters Evenly Split On Whether Next Coalition Should Include CDU
German Election: Winds Of Change
German Election: Winds Of Change
This shift is what we forecast in previous reports but now the question is whether the left-wing parties can actually win enough seats to put together a majority coalition. That is a tall order. Our quantitative election model suggests that the Christian Democrats, having suffered a long overdue downgrade in expectations, will not utterly collapse when the final vote is tallied. While we do not expect them to retain the chancellorship, momentum will have to shift even further in the opposition’s favor over the next two weeks to produce a majority coalition that excludes the Union. Our Quantitative German Election Model Our model is based off the work of Norpoth and Geschwend, who created a simple linear model to predict the vote share that incumbent governing parties or coalitions will obtain in impending elections.3 Their model utilizes three explanatory variables and has a sample size of 18 previous elections, covering elections from 1953 to 2017. Our model updates their original work to make estimates for the 2021 election. Unlike our US Political Strategy Presidential Model, which makes use of both political and economic explanatory variables in real time, our German election model makes predictions based solely on historical political variables, all of which display a high degree of correlation with popular vote share. We will look at economic factors that may affect the election later in this report. The Three Explanatory Variables 1. Chancellor Approval Rating: This variable captures the short-term support rate of the incumbent chancellor. A positive relationship exists between chancellor approval and vote share: higher approval equates to higher vote share for the incumbent party. Merkel’s approval stands at 64% today which is a boon for the otherwise beleaguered Christian Democrats (Chart 5). Chart 5Merkel's Coattails A Boon But Not Enough To Save Her Party
Merkel's Coattails A Boon But Not Enough To Save Her Party
Merkel's Coattails A Boon But Not Enough To Save Her Party
2. Long-term partisanship: This variable shows the long-term support rate of voters for specific parties or coalitions in past elections. It is measured as the average vote share of the incumbent party over the past three elections. A positive relationship with vote share exists here too: higher historical partisanship equates to a higher share of votes in forthcoming elections, and vice versa. This variable clearly gives a boost to the Christian Democrats – although it could overrate them based on past performance, as occurred in 2017 when they underperformed the model’s prediction.4 3. “Time For Change”: This is a categorical variable measured by how many terms the parties or coalition have held office leading into an election. This variable has a negative relationship with vote share outcomes. The longer an incumbent party or coalition holds office, the less vote share they will receive. Effectively, our model punishes parties that hold office for long periods of time. In this case that would be the long-ruling Christian Democrats. Model Estimation And Results Our model is estimated by the following simple equation: Popular Vote Share = constant + ßChancellor Approval Rating + ßLong-Term Partisanship + ßTime For Change Estimating the above model for the 2021 election predicts that the Union will win 32.7% of the vote share (Table 3). If this prediction came true, it would suggest that the ruling party performed almost exactly the same as in 2017. In other words, the party’s strong voter base combined with Merkel’s long coattails are expected to shore up the party. This flies in opinion polling, however, so we think the model is overestimating the Christian Democrats. Table 3Our German Election Quant Model Says CDU Will Not Collapse
German Election: Winds Of Change
German Election: Winds Of Change
Note that even if the Union performs this well, it still will not win enough seats to govern on its own. Potential Union-led coalitions are shown in Table 3, excluding the Social Democrats (see below). For a majority government, a coalition with the Free Democrats and the Greens would need to be formed. This coalition would equate to 53% of the vote share. Otherwise, to obtain a majority, the Union would have to team up with the Social Democrats, which is today’s status quo. We can use the same methodology to predict the vote share for the Social Democrats. We use the support rate of Social Democratic chancellor-candidate Olaf Scholz and calculate the long-term partisanship variable using past Social Democratic vote shares. In this case our model predicts that the Social Democrats will win 22.1% of the vote. If this result were to come true, it would not be enough for the party to govern own its own. Potential Social Democratic-led coalitions are shown in Table 4. The best coalition would be with the Greens and either the Left or the Free Democrats. But in this case the Social Democrats cannot form a government with a vote share above 50%, unless it pairs up with the Christian Democrats. Table 4Our German Election Quant Model Says SPD Has Not Yet Won It All
German Election: Winds Of Change
German Election: Winds Of Change
In other words, either the left-wing parties must build on their current momentum and outperform their historical record in the final election tally, or they will need to form a coalition with the Christian Democrats. This kind of left-wing surge is precisely what we have predicted. But the model helps put into perspective how difficult it will be for the left-leaning parties to get a majority. Scholz is single-handedly trying to overcome the long downtrend of the Social Democrats. His party is rising at the expense of the Greens, and the Left, which puts a lid on the total left-wing coalition size. If these three parties all beat the model and slightly surpass their top vote share in recent memory (SPD at 26%, Greens at 11%, and the Left at 12%), they still only have 49% of the vote. While our model is reliant on historical political data, it is a robust predictor for past election results (Chart 6). The average vote share error between the predicted and realized outcomes over from 1953 to 2013 is 1.7 percentage points. The problem with relying on the model is that the Christian Democrats have broken down from their long-term trend in opinion polls. And while Merkel’s approval is strong, she is no longer on the ballot and her hand-picked successor, Armin Laschet, is floundering in the polls (see Chart 3B above). Chart 6Our German Election Quant Model Has Solid Track Record, But Merkel’s High Approval Rating Caused Overestimate In 2017 And May Do So In 2021
German Election: Winds Of Change
German Election: Winds Of Change
In short, the model is probably overrating the Union but it is also calling attention to the extreme difficulty of the left-wing parties forming a majority coalition. Scholz may have to form a coalition with the Free Democrats or pursue another grand coalition. And if the Social Democrats fail to get the largest vote share, German President Frank-Walter Steinmeier may ask Armin Laschet to try to form a government first. Still, Scholz is the most likely chancellor when all is said and done. Election Model Takeaway Our German election model predicts that the Union will receive 32.9% of the popular vote, while the Social Democrats will receive 22.1%. At the same time, the left-leaning parties, specifically the Social Democrats, clearly have the momentum. Therefore the model may be overrating the incumbent party. But it still calls attention to a high level of uncertainty, the likelihood of a messy election outcome, and a tricky period of coalition formation. The Social Democrats will have to pull off a major surprise, outperforming both history and our model, to lead a majority government without the Christian Democrats.5 We still think this is possible. But we will stick with our earlier subjective probabilities: 65% odds that the Christian Democrats take part in the next coalition, 35% odds that they do not. Bottom Line: The chancellorship will go to the Social Democrats but the coalition will constrain the business unfriendly aspects of their agenda. This is positive for Germany’s corporate earnings outlook. Macro Outlook: A Temporary Economic Dip Our election model does not account for the economic backdrop and hence ignores the “pocketbook voter.” Germany is recovering from the pandemic, which is marginally supportive for an otherwise faltering ruling party. However, the economic data is only good enough to suggest that the Union will not utterly collapse. A rise in unemployment, inflation, and the combination of the two (the “Misery Index”) is a tell-tale sign that the incumbent party will suffer a substantial defeat (Chart 7). However the German economy’s loss of momentum is temporary. Growth will re-accelerate in early 2022. The timing is politically inconvenient for the ruling party but positive news for investors. German economic confidence is deteriorating. The Ifo Business Climate survey has rolled over, lowered by a meaningful decline in the Expectations Survey. Additionally, consumer confidence is turning south, despite already being low (Chart 8). Chart 7Spike In German Misery Index A Tell-Tale Sign Of Poor Election For Incumbent Party
Spike In German Misery Index A Tell-Tale Sign Of Poor Election For Incumbent Party
Spike In German Misery Index A Tell-Tale Sign Of Poor Election For Incumbent Party
Chart 8Deteriorating German Confidence
Deteriorating German Confidence
Deteriorating German Confidence
A combination of factors weighs on German confidence: First, global supply chain bottlenecks are hurting growth. The automotive industry, which is paralyzed by a global chip shortage, accounts for about 20% of industrial production, and its output is once again declining after a sharp but short-lived rebound last year (Chart 9). Similarly, inventories of finished goods are collapsing, which is hurting growth today (Chart 9, second panel). Second, the Delta variant of COVID-19 is causing a spike in infections. The rise in cases prevents containment measures from easing as much as expected, while it also hurts the willingness of households to go out and spend their funds (Chart 9, third panel). Third, German real wages are weak. Negotiated wages are only growing at a 1.7% annual rate, and wages and salaries are expanding at 2.1% annually. Meanwhile, German headline CPI runs at 3.9%. The declining purchasing power of German households accentuates their current malaise. Three crucial forces counterbalance these negatives: First, German house prices are growing at a 9.4% annual rate, which is creating a potent, positive wealth effect (Chart 10). Chart 9Germany's Headwinds
Germany's Headwinds
Germany's Headwinds
Chart 10A Strong Wealth Effect
A Strong Wealth Effect
A Strong Wealth Effect
Second, German household credit remains robust. According to the Bundesbank, the strength in household credit mostly reflects the strong demand for mortgages. Historically, a healthy housing sector is an excellent leading indicator of economic vigor. Third, the Chinese credit impulse is too depressed for Beijing’s political security. The recent decline in the credit impulse to -2.4% of GDP reflects a policy decision in the fall of 2020 to trim down the credit expansion. As a result, Chinese economic growth is slowing. For example, both the Caixin Manufacturing and Services PMIs stand below 50, at post-pandemic lows of 49.2 and 46.7, respectively. In July authorities became uncomfortable and cut the Reserve Requirement Ratio as well as interbank rates to free liquidity and stabilize the economy. A boom is not forthcoming, but the drag on global activity will ebb by next year. Including the headwinds and tailwinds to the economy, German activity will slow down for the remainder of the year before improving anew in 2022. Our election case outlined above – that the conservatives will lose the chancellorship and either be excluded from power or greatly diminished in the Bundestag – means that fiscal policy will not be tightened abruptly and will not create a material risk to this outlook. Chart 11Vaccines Work
Vaccines Work
Vaccines Work
Many of the headwinds will dissipate. The Delta-wave of COVID-19 will diminish. Already, Germany’s R0 is tentatively peaking, which normally precedes a drop in daily new cases. Moreover, Germany’s vaccination campaign is progressing, which limits the impact of the current wave on hospitalization and intensive care-unit usage (Chart 11). Inflation will peak in Germany, which will salvage real wages. As European Investment Strategy wrote last Monday,6 European inflation remains concentrated in sectors linked to commodity prices or directly affected by bottlenecks. Instead, trimmed-mean CPI is muted (Chart 12), which implies that underlying inflationary pressures are small, especially as wage gains are still well contained. Moreover, the one-off impact of the end of the German VAT rebate will also pass. Finally, a stabilization and eventual revival of the Chinese credit impulse will put a floor under German exports, industrial production, and capex (Chart 13). For now, the previous decline in the Chinese credit impulse is consistent with slower German output growth for the remainder of 2021. However, next year, the German industrial sector will start to feel the effect of the current efforts to improve Chinese liquidity conditions. Chart 12Narrow European Inflation
Narrow European Inflation
Narrow European Inflation
Bottom Line: The German economy is set to deteriorate for the remainder of 2021. However, as the current wave of COVID-19 infections ebbs, real wages recover, and China’s credit impulse stabilizes, Germany’s economic activity will re-accelerate in 2022, especially if the upcoming election does not generate a meaningful fiscal shock. We do not think it will. Chart 13China: From Headwinds To Tailwind?
China: From Headwinds To Tailwind?
China: From Headwinds To Tailwind?
Market Implications: German Stocks To Shine German equities are set to outperform their European counterparts and will significantly beat Bunds over the coming 18 months. During the past 5 months, the German MSCI index has underperformed the rest of the Eurozone by 6.2%. The poor performance of German equities is worse than meets the eye. If we adjust for sectoral differences by building equal sector-weight indexes, Germany has underperformed the Euro Area by 22% since early 2017 (Chart 14). Chart 14Not Delivering The Goods
Not Delivering The Goods
Not Delivering The Goods
This underperformance is long in the tooth and should reverse because of four important dynamics. First, German equities are cheap relative to the European benchmark. As Chart 15 highlights, the relative performance of German stock prices has lagged that of profits. This underperformance is also true once we account for the different sectoral composition of the German market. As a result, Germany is cheap on a forward price-to-earnings, price-to-sales, and price-to-book basis versus the Euro Area. Additionally, analysts embed significantly lower long-term and one-year expected growth rates of earnings in Germany than in the rest of the Eurozone, which depresses the German PEG ratios. Second, German operating metrics do not justify the valuation discount of German equities. The return on equity of German stocks stands at 11.39%, which is similar to that of the Euro Area. Profit margins are also comparable, at 5.91% and 5.74%, respectively. However, German firms utilize their capital more efficiently, and their asset turnover stands at 0.3 times compared to 0.2 times for the Eurozone average. Meanwhile, German non-financial firms are less indebted than their Eurozone competitors, which implies that Germany’s return on assets is greater than that of Europe at large (Chart 16). Chart 15Lagging Prices, Not Earnings
Lagging Prices, Not Earnings
Lagging Prices, Not Earnings
Chart 16Why The Discount?
Why The Discount?
Why The Discount?
Third, the drivers of earnings support a German outperformance. Over the past thirty years, commodity prices led the performance of German stocks relative to that of the rest of the Eurozone (Chart 17). While the near-term outlook for natural resource prices is muddy, BCA’s commodity strategists expect Brent prices to average more than $80/bbl in 2023 and industrial metals to outperform energy over the coming years.7 Additionally, German Services PMI are bottoming compared to that of the Eurozone. Over the past decade, this process preceded periods of outperformance by German stocks (Chart 18). Similarly, the collapse in the Chinese credit impulse relative to the robust domestic economic activity in Europe is well reflected in the underperformance of German shares. The Eurozone’s Service PMI is near all-time highs and unlikely to improve further; however, the Chinese credit impulse should recover in the coming quarters. This phenomenon will help German stocks (Chart 19). Chart 17Commodity Bulls Pull Germany
Commodity Bulls Pull Germany
Commodity Bulls Pull Germany
Chart 18German Vs European Activity Matters
German Vs European Activity Matters
German Vs European Activity Matters
Chart 19German Vs Chinese Activity Matters
German Vs Chinese Activity Matters
German Vs Chinese Activity Matters
The German MSCI index is also oversold. The 52-week rate of change of its performance compared to the rest of the Eurozone plunged to its lowest reading since the introduction of the euro in 1999 (Chart 20). Meanwhile, the 13-week rate of change remains low but has begun to improve (not shown). This combination usually heralds a forthcoming rebound in German relative performance. In relation to equities, German Bunds remain an unappealing investment. Based on historical experience, the current yield of -0.36% offered by German 10-year bonds condemns investors to negative returns over the next five years (Chart 21). Chart 20Oversold!
Oversold!
Oversold!
Chart 21Bounded Bunds' Returns
Bounded Bunds' Returns
Bounded Bunds' Returns
Even if realized inflation ebbs in Germany and Europe, inflation expectations remain low and an eventual return to full employment will force CPI swaps higher, especially if the ECB maintains easy monetary conditions and invites further risk-taking in the Eurozone. The global economic cycle will also move from a friend to a foe for Bunds. As Chart 22 illustrates, the recent deceleration in global export growth was consistent with the fresh uptick in the returns of German paper. However, if Chinese credit flows stabilize by year-end and reaccelerate in 2022 while supply-chain bottlenecks dissipate, global export growth will improve. This should hurt Bund prices, especially as the long-term terminal rate proxy embedded in the German curve remains too low. As a result, not only should Bunds underperform German equities, but the German yield curve will also steepen further relative to that of the US, where the Fed will lift the short-end of the curve faster than the ECB. Chart 22Economic Momentum And Bunds Prices
Economic Momentum And Bunds Prices
Economic Momentum And Bunds Prices
Bottom Line: The underperformance of German equities relative to those of the rest of the Eurozone is well advanced, which makes German stocks a bargain. The current deceleration in global and German growth will not extend beyond 2021, which suggests that German stocks prices should converge toward their earnings outperformance next year. Our political forecast suggests that the odds of an early or aggressive fiscal retrenchment are very low. Additionally, German equities will outperform Bunds, which offer particularly poor prospective returns. Matt Gertken Vice President Geopolitical Strategy mattg@bcaresearch.com Mathieu Savary Senior Vice President Mathieu@bcaresearch.com Guy Russell Research Analyst GuyR@bcaresearch.com Jingnan Liu Research Associate JingnanL@bcaresearch.com Footnotes 1 Note that minority governments are rare and have a bad reputation in Germany, partly as a result of the series of weak governments leading up to the 1932 election and Nazi rule. 2 In addition, while the center-left parties can work with the far-left in the Bundestag, the center-right parties cannot work with the far-right Alternative for Germany. Indeed the slightest imputation of a willingness to work with Alternative for Germany cost Merkel’s first pick for successor, Annegret Kramp-Karrenbauer, her job. 3 See: Norpoth, Helmut & Gschwend, Thomas (2010) The chancellor model: Forecasting German elections, International Journal of Forecasting. 26. 42-53. 4 Our model performs well in back-testing but 2017 was an outlier. It correctly predicted the Union to win the highest share of the popular vote but overestimated that vote by seven percentage points. Our only short-term variable, the chancellor’s approval rate, caused a deviation from long-term voting trends. Our other two variables capture medium and long-term effects, which clearly favored the Union. The implication is that Merkel’s high approval rating today could give a misleading impression about the Christian Democrats’ prospects. 5 If they are forced to rely on the Free Democrats instead, that will also constrain the most anti-business elements of their agenda. 6 Please see BCA Research European Investment Strategy Weekly Report, "The ECB Taper Dilemma", dated September 6, 2021, available at eis.bcareseach.com. 7 Please see BCA Research Commodity & Energy Strategy Weekly Report, "Permian Output Approaches Pre-Covid Peak", dated August 19, 2021, available at ces.bcareseach.com.