Financial Markets
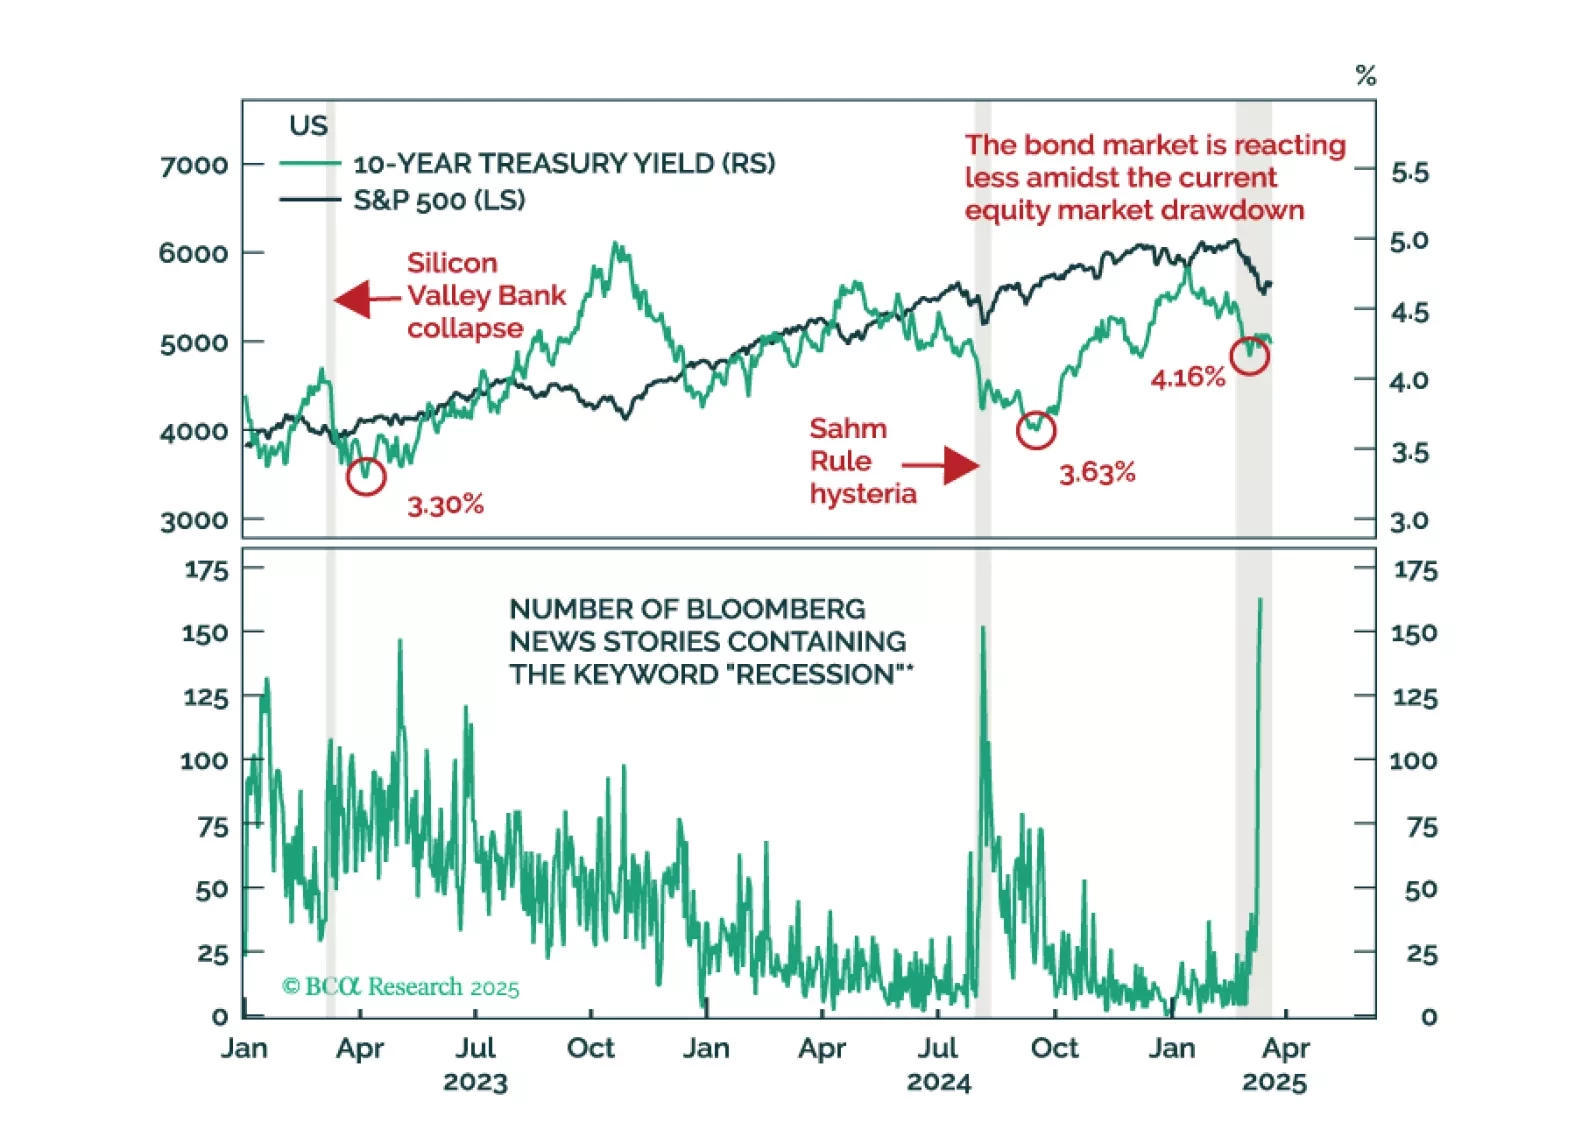
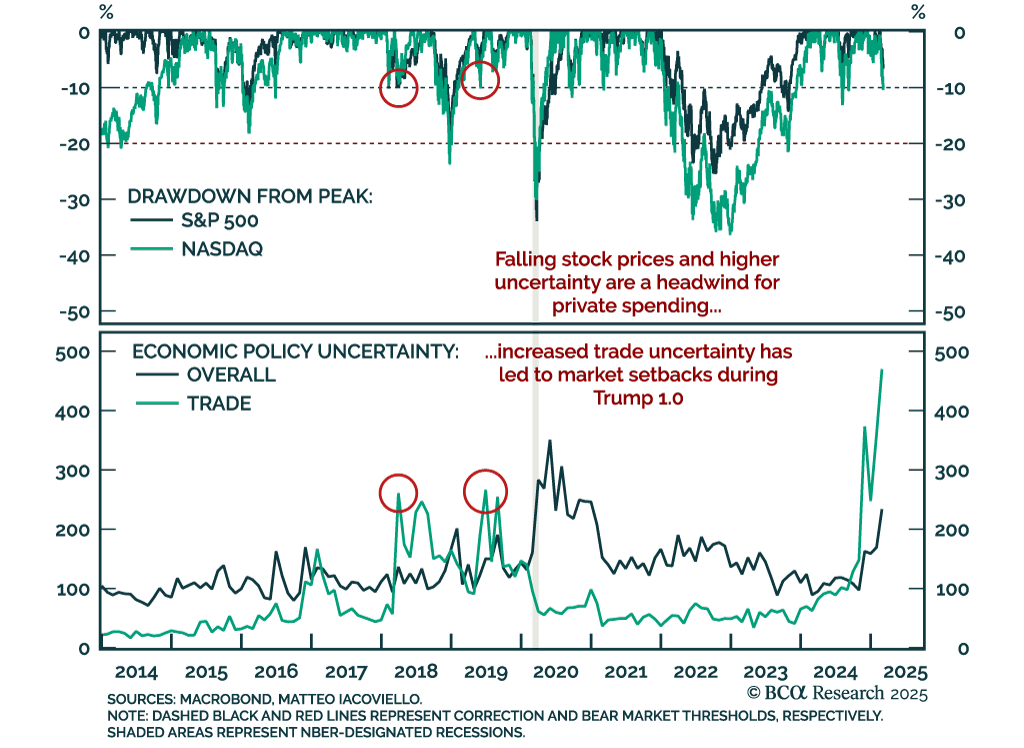
In this Special Report, GeoMacro Strategist Marko Papic argues that the Trump administration is flirting with high risk / low reward. Triggering a recession may be the end goal of the White House, but borrowing costs are not declining as much as they ought to be while President Trump’s political capital is on thin ice. Most recessions are caused by a “murder weapon.” It is rare that this weapon can be holstered. This may be one of those times.
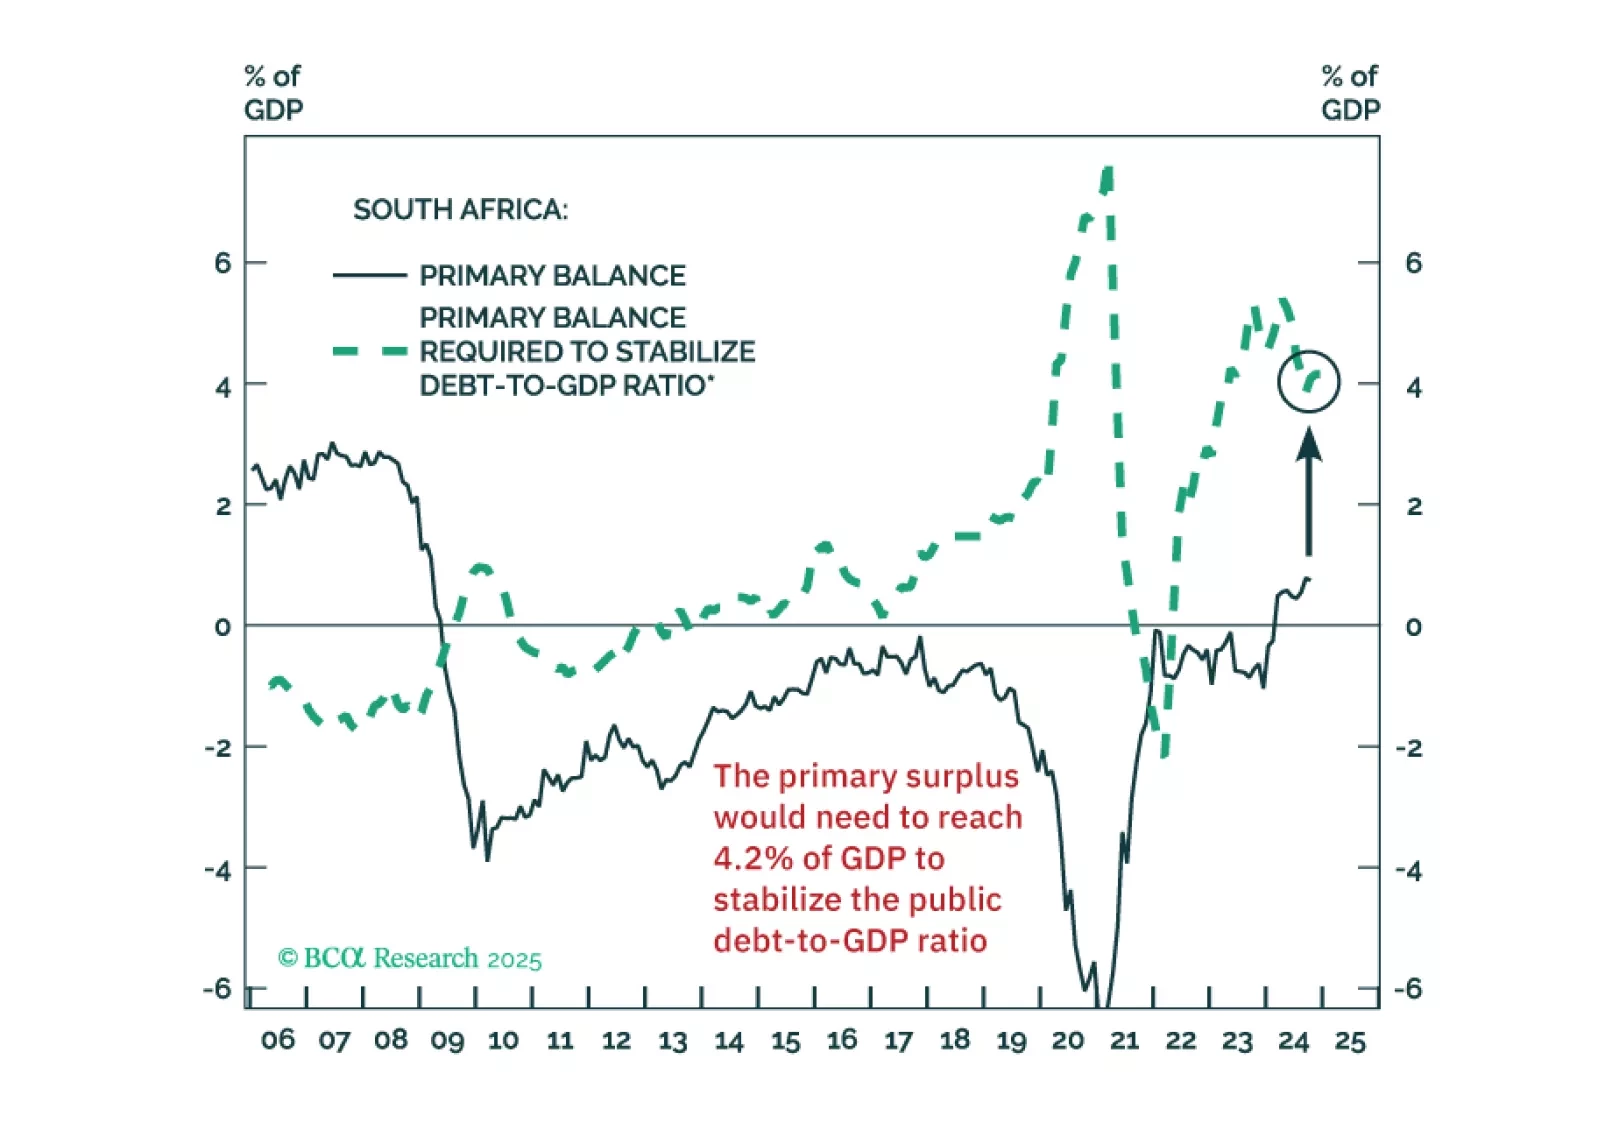
The South African government seems to believe that some fiscal retrenchment can stabilize the public debt-to-GDP ratio. But that’s a misconception. The country will need draconian spending cuts to achieve this.

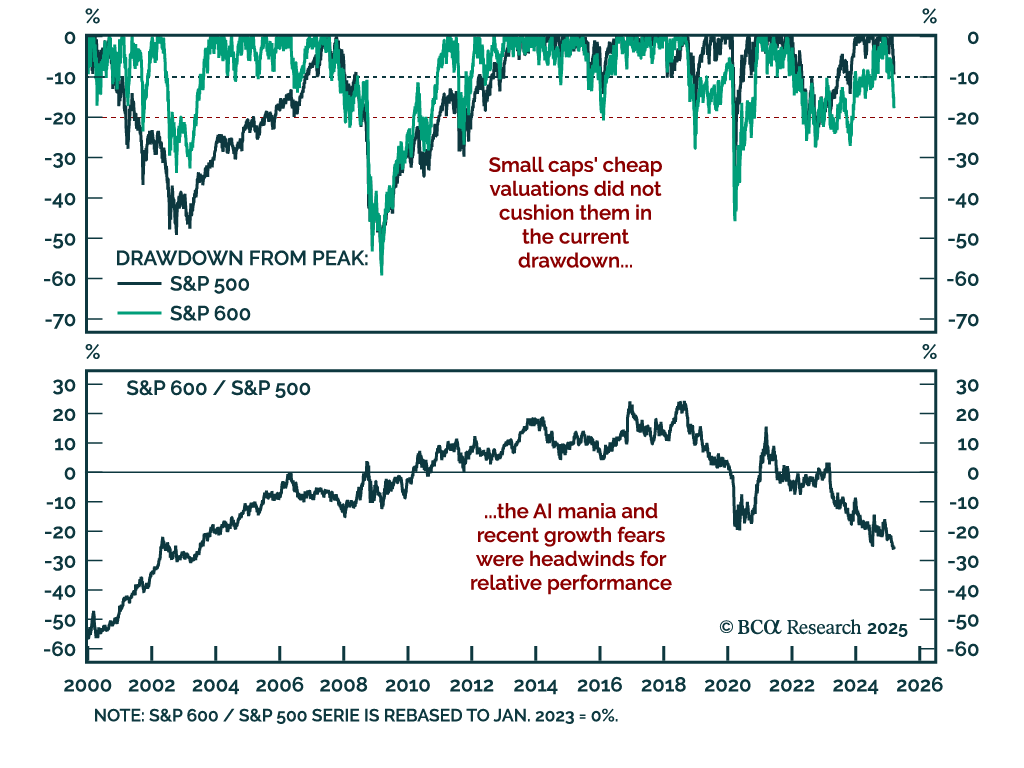
Despite our bearish predisposition towards stocks, we are open-minded to anything that could challenge our thesis. As such, in this report, we review five upside scenarios for equities.