Fixed Income

Executive Summary Our recommended model bond portfolio outperformed its custom benchmark index by +24bps in Q2/2022, improving the year-to-date outperformance to a solid +72bps. The Q2 outperformance came entirely from the credit side of the portfolio (+35bps), led by underweights to US investment grade corporates (+28bps) and EM hard currency debt (+24bps). The rates side of the portfolio was down slightly (-11bps), with gains from underweights in US and UK inflation-linked bonds (a combined +24bps) helping offset the hit from overweights to German and French government bonds (a combined -30bps). Looking ahead, we continue to see more defensive positioning in growth-sensitive credit sectors like US investment grade corporate bonds and EM hard currency debt, rather than duration management, as providing the better opportunity to generate alpha in bond portfolios over the latter half of 2022. GFIS Model Bond Portfolio Recommended Positioning For The Next Six Months
GFIS Model Bond Portfolio Q2/2022 Review & Outlook: Winning By Playing Defense
GFIS Model Bond Portfolio Q2/2022 Review & Outlook: Winning By Playing Defense
Bottom Line: In our model bond portfolio, we are maintaining an overall neutral duration stance and a moderate underweight of spread product versus developed market sovereign bonds. We are, however, reducing the recommended tilts in inflation-linked bonds by upgrading US TIPS to neutral and downgrading Canadian linkers to neutral. Feature Dear Client, We are about to take a mid-summer publishing break, as this humble bond strategist moves his family into a new home in a new city. Next week, you will be receiving a report written by BCA Research’s Chief US Bond Strategist, Ryan Swift. The following week, there will be no Global Fixed Income Strategy report published. Our next report will be published on July 26, 2022. Regards, Rob Robis Bond investors are running out of places to hide to avoid losses in 2022. The total return on the Bloomberg Global Aggregate index (hedged into USD) in the second quarter of this year was -4%, nearly matching the -6% loss seen in Q1. No sector, from government bonds to corporate debt to emerging market credit, could avoid the damage caused by hawkish central bankers belated responding to the worst bout of global inflation since the 1970s. Related Report Global Fixed Income StrategyGFIS Model Bond Portfolio Q1/2022 Review & Outlook: Trading The Consolidation Phase Global inflation rates will soon peak, led by slowing growth of goods prices and commodity prices. However, inflation will remain well above central bank targets across the bulk of the developed world, supported by more domestic sources like services prices, housing costs and wages. This will limit the ability for important central banks like the Fed and ECB to quickly pivot in a more dovish direction to support weakening growth – and bail out foundering bond markets. With that backdrop in mind, we present our quarterly review of the BCA Research Global Fixed Income Strategy (GFIS) model bond portfolio for the second quarter of 2022. We also present our recommended positioning for the portfolio for the next six months, as well as portfolio return expectations for our base case and alternative investment scenarios. As a reminder to existing readers (and to new clients), the model portfolio is a part of our service that complements the usual macro analysis of global fixed income markets. The portfolio is how we communicate our opinion on the relative attractiveness between government bond and spread product sectors. We do this by applying actual percentage weightings to each of our recommendations within a fully invested hypothetical bond portfolio. Q2/2022 Model Bond Portfolio Performance: All About Credit Chart 1Q2/2022 Performance: Gains From Defensive Credit Positioning
Q2/2022 Performance: Gains From Defensive Credit Positioning
Q2/2022 Performance: Gains From Defensive Credit Positioning
The total return for the GFIS model portfolio (hedged into US dollars) in the second quarter was -4.3%, outperforming the custom benchmark index by +24bps (Chart 1).1 In terms of the specific breakdown between the government bond and spread product allocations in our model portfolio, the former generated -11bps of underperformance versus our custom benchmark index while the latter outperformed by +35bps. In our previous quarterly portfolio performance review in April, we noted that the greater opportunities to generate outperformance for fixed income investors would come from more defensive allocations to spread product, rather than big directional moves in government bond yields. That forecast largely panned out, as global credit markets moved to price in the growing risk of a deep economic downturn. Declining nominal government bond yields provided some modest relief at the end of June, with markets modestly pricing out some of the rate hikes discounted over the next year amid deepening global recession fears. While we maintained a neutral stance on overall portfolio duration during the quarter, we did benefit from the fact that the decline in global bond yields in late June was concentrated more in lower inflation expectations than falling real yields. Thus, our underweight positioning in inflation-linked bonds, focused on the US and UK, helped add a combined +25bps of outperformance versus the benchmark (Table 1). Table 1GFIS Model Bond Portfolio Q2/2022 Overall Return Attribution
GFIS Model Bond Portfolio Q2/2022 Review & Outlook: Winning By Playing Defense
GFIS Model Bond Portfolio Q2/2022 Review & Outlook: Winning By Playing Defense
The bar charts showing the total and relative returns for each individual government bond market and spread product sector in our model portfolio are presented in Charts 2 & 3. Chart 2GFIS Model Bond Portfolio Q2/2022 Government Bond Performance Attribution
GFIS Model Bond Portfolio Q2/2022 Review & Outlook: Winning By Playing Defense
GFIS Model Bond Portfolio Q2/2022 Review & Outlook: Winning By Playing Defense
Chart 3GFIS Model Bond Portfolio Q2/2022 Spread Product Performance Attribution By Sector
GFIS Model Bond Portfolio Q2/2022 Review & Outlook: Winning By Playing Defense
GFIS Model Bond Portfolio Q2/2022 Review & Outlook: Winning By Playing Defense
Biggest Outperformers: Underweight US investment grade Industrials (+19bps) Underweight UK index-linked Gilts (+15bps) Underweight US TIPS (+9bps) Underweight US investment grade Financials (+7bps) Underweight US MBS (+6bps) Underweight US Treasuries with maturities beyond ten years (+6bps) Biggest Underperformers: Overweight euro area investment grade corporates (-19bps) Overweight German government bonds with maturities beyond ten years (-14bps) Overweight French government bonds with maturities beyond ten years (-8bps) Overweight UK Gilts with maturities beyond ten years (-6bps) Overweight US CMBS (-4bps) Chart 4 presents the ranked benchmark index returns of the individual countries and spread product sectors in the GFIS model bond portfolio for Q2/2022. Returns are hedged into US dollars (we do not take active currency risk in this portfolio) and adjusted to reflect duration differences between each country/sector and the overall custom benchmark index for the model portfolio. We have also color coded the bars in each chart to reflect our recommended investment stance for each market during Q2 (red for underweight, dark green for overweight, gray for neutral). Chart 4Ranking The Winners & Losers From The GFIS Model Bond Portfolio Universe In Q2/2022
GFIS Model Bond Portfolio Q2/2022 Review & Outlook: Winning By Playing Defense
GFIS Model Bond Portfolio Q2/2022 Review & Outlook: Winning By Playing Defense
Ideally, we would look to see more green bars on the left side of the chart where market returns are highest, and more red bars on the right side of the chart were returns are lowest. That pattern largely held true in Q2/2022, especially at the tail ends of the chart. During a quarter where all the major asset classes in our portfolio lost money on a hedged and duration-matched basis, we outperformed by selectively underweighting the worst performers within the credit side of the benchmark portfolio universe. Notably, we were underweight EM USD-denominated Sovereigns (-1099bps), EM USD-denominated corporates (-816bps) and US investment grade corporates (-686bps) on the extreme right side of the chart. Some of our key overweight positions did relatively well, led by overweights in US CMBS (-148bps), Australian government bonds (-288bps) and euro area investment grade corporates (-378bps), all of which were on the left side of Chart 4. One of our key recommendations throughout the first half of 2022 - overweighting German government bonds (-517bps) and French government bonds (-657bps) versus underweighting US Treasuries (-283bps) - performed poorly in Q2. This was due to investors rapidly pricing in a far more aggressive series of ECB rate hikes than we expected, resulting in some convergence of US-European bond yield differentials. Importantly, core European bond yields have pulled back substantially over the last month, and by much more than US yields have declined. Most notably, the 2-year German yield, which began Q2 at minus-7bps and hit a peak of 1.2% on June 14, has now fallen all the way back to 0.4% as this report went to press. The 2-year US-Germany yield differential has already widened by 35bps in the first week of July, suggesting that our overweight core Europe/underweight US allocation is already contributing positively to the model bond portfolio returns for Q3. Bottom Line: Our model bond portfolio outperformed its benchmark index in the second quarter of the year by +24bps – a positive result coming largely from underweight positions in US corporate bonds, EM spread product and inflation-linked bonds in the US and UK. Future Drivers Of Model Bond Portfolio Returns Just as in Q2/2022, the performance of the model bond portfolio in Q3/2022 will be driven more by relative allocations between countries and spread product sectors, rather than big directional moves in bond yields or credit spreads. Overall Duration Exposure Chart 5A More Stable Backdrop For Global Bond Yields
A More Stable Backdrop For Global Bond Yields
A More Stable Backdrop For Global Bond Yields
In terms of portfolio duration, we still see a stronger case for global bond yields to be more rangebound than trending, especially in the US. There has already been a major downward adjustment to global bond yields via lower inflation expectations and reduced rate hike expectations. A GDP-weighted average of major developed market 10-year inflation breakevens has already fallen from an April 2022 peak of 281bps to 216bps (Chart 5). That aggregate breakeven is now back to the levels that began 2022, before the Russian invasion of Ukraine that triggered a surge in global energy prices. We anticipate that additional declines in global inflation expectations – and the associated reductions in central bank rate hike expectations – will be harder to achieve over the latter half of 2022. “Stickier” inflation from services, housing costs and wages will remain strong enough to keep overall inflation rates above central bank targets, even as decelerating goods and commodity price inflation act to slow headline inflation rates. Our Global Duration Indicator, which is comprised of growth indicators like the ZEW expectations index for the US and Europe as well as our own global leading economic indicator, has fallen substantially and is signaling a decline in global bond yield momentum once realized inflation rates peak (Chart 6). Chart 6Our Duration Indicator Calling For Slowing Global Yield Momentum
Our Duration Indicator Calling For Slowing Global Yield Momentum
Our Duration Indicator Calling For Slowing Global Yield Momentum
Chart 7Overall Portfolio Duration: Stay Neutral
Overall Portfolio Duration: Stay Neutral
Overall Portfolio Duration: Stay Neutral
We see that as signaling more of a sideways action in bond yields over the next six months, rather than a big downward move, especially in the US. Thus, we are keeping the duration of the model bond portfolio close to that of the benchmark index (Chart 7). Government Bond Country Allocation We are sticking with our view that, for countries with active central banks (i.e. everyone but Japan), favoring markets where interest rate expectations are above plausible estimates of neutral policy rates should lead to outperformance from country allocation. In Chart 8, we show 10-year bond yields and 2-years-forward 1-month Overnight Index Swap (OIS) rates for the US, euro area, UK, Canada and Australia. The shaded regions in the chart represent estimates of the range of neutral policy rates. In the case of the US, rate expectations and Treasury yields are now below the upper level of the range of neutral fed funds rates estimates, between 2-3%, taken from the latest set of FOMC economic projections. Hence, we are sticking with an underweight stance on US Treasuries with yields offering less protection against the Fed following through on its current guidance and lifting the funds rate into restrictive territory above 3%. In the other countries, rate expectations are above the range of neutral rate estimates, which suggests that bond yields have a bit more protection against hawkish central bank actions. That leads us to stay overweight core Europe, the UK and Australia in the government bond portion of the model bond portfolio. We are only keeping Canada at neutral, however, as we suspect that the Bank of Canada is more willing than other central banks to follow the Fed’s lead on taking rates to a restrictive level to help bring down elevated Canadian inflation. For other countries, we are staying neutral on Italian government bond exposure, for now, and underweight Japan (Chart 9). Chart 8Favor Countries Where Markets Expect Above-Neutral Rates
Favor Countries Where Markets Expect Above-Neutral Rates
Favor Countries Where Markets Expect Above-Neutral Rates
Chart 9Underweight JGBs, Stay Neutral Italy (For Now)
Underweight JGBs, Stay Neutral Italy (For Now)
Underweight JGBs, Stay Neutral Italy (For Now)
For Italy, we await news from the July 21 ECB meeting on the details of a proposal to help support Italian bond markets in the event of additional yield increases or spread widening versus Germany. It is clear from the history of the past decade that Italian bond returns suffer when the ECB is either hiking rates or slowing the growth of its balance sheet (top panel). In other words, it is difficult to recommend overweighting Italian bonds without the support of easy ECB monetary policy. Chart 10Our Inflation-Linked Bond Country Allocations
Our Inflation-Linked Bond Country Allocations
Our Inflation-Linked Bond Country Allocations
For Japan, our recommendation is strictly related to our view on the move in overall global bond yields. The Bank of Japan is bucking the worldwide trend to tighten monetary policy because core Japanese inflation remains weak. This makes Japanese government bonds (JGBs) a good place for bond investors to “hide out” in when global bond yields are rising. Given our view that global bond yield momentum will slow – in line with the signal from our Global Duration Indicator – we do not see a strong cyclical case for overweighting low-yielding JGBs. On inflation-linked bonds, we are maintaining a cautious overall stance, with commodity prices decelerating, realized inflation momentum set to soon peak and central banks signaling more tightening ahead (Chart 10). This week, we are closing out our lone overweight recommendation on inflation-linked bonds in Canada, where we downgrading to neutral (3 out of 5, see the model bond portfolio table on page 24).2 At the same time, we are neutralizing our underweight stance on US TIPS, moving the allocation to neutral. We still see shorter-term TIPS breakevens as having downside from here, but longer-maturity breakevens have already made enough of a downward adjustment, in our view. Global Spread Product Turning to credit markets, we are maintaining our moderately cautious view on the overall allocation to credit versus government bonds. Slowing global growth momentum and tightening global monetary policy is not an environment where credit spreads can narrow, especially for growth-sensitive credit like corporate bonds and high-yield (Chart 11). Having said that – the spread widening seen in US and European corporate bond markets has introduced a better valuation cushion into spreads. Our preferred measure of spread product valuation – the historical percentile ranking of the 12-month breakeven spread – shows that investment grade spreads in the euro area are now in the top quartile (85%) of its history on a risk-adjusted basis (Chart 12). US investment grade spreads are now up into the second quartile (64%), which is a big improvement from the start of 2022 but not as much as seen in Europe. Chart 11Global Monetary Backdrop Turning More Negative For Credit
Global Monetary Backdrop Turning More Negative For Credit
Global Monetary Backdrop Turning More Negative For Credit
Chart 12Corporate Spread Valuations Have Improved In The US & Europe
Corporate Spread Valuations Have Improved In The US & Europe
Corporate Spread Valuations Have Improved In The US & Europe
European credit spreads likely need to be wide as a risk premium against the numerous risks the region is facing right now – slowing growth, an increasingly hawkish ECB, soaring energy prices and the lingering uncertainties stemming from the Ukraine war. However, a lot of bad news is now discounted in European spreads and, as a result, we are maintaining our overweight stance on European investment grade corporates, especially versus US investment grade where we remain underweight. High-yield spreads on both sides of the Atlantic look more attractive on a 12-month breakeven spread basis, but also on a default-adjusted spread basis (Chart 13). Assuming a moderate increase in the high-yield default rates in the US and Europe - consistent with a sharp slowing of economic growth but no deep recession - the current level of high-yield spreads net of expected default losses over the next year is above long-run averages. It is too soon to move to an overweight stance on high-yield, with the Fed and ECB set to tighten more amid ongoing growth uncertainty, but given the improved valuation cushion we see a neutral allocation to junk in both the US and Europe as appropriate in our model portfolio. Chart 13Junk Spreads Offer Value If Recession Can Be Avoided
Junk Spreads Offer Value If Recession Can Be Avoided
Junk Spreads Offer Value If Recession Can Be Avoided
Finally, we remain comfortably underweight emerging market USD-denominated sovereign and corporate debt. The backdrop is poor for emerging market bond returns, given slowing global growth, softening commodity prices, a tightening Fed and a strengthening US dollar (Chart 14). Chart 14Staying Cautious On EM Debt Exposure
Staying Cautious On EM Debt Exposure
Staying Cautious On EM Debt Exposure
Summing It All Up The full list of our recommended portfolio allocations can be seen in Table 2. The portfolio enters the second half of 2022 with the following high-level characteristics: Table 2GFIS Model Bond Portfolio Recommended Positioning For The Next Six Months
GFIS Model Bond Portfolio Q2/2022 Review & Outlook: Winning By Playing Defense
GFIS Model Bond Portfolio Q2/2022 Review & Outlook: Winning By Playing Defense
Chart 15Overall Portfolio Allocation: Underweight Spread Product Vs Governments
GFIS Model Bond Portfolio Q2/2022 Review & Outlook: Winning By Playing Defense
GFIS Model Bond Portfolio Q2/2022 Review & Outlook: Winning By Playing Defense
the overall duration exposure remains at-benchmark (i.e. neutral) the portfolio has an underweight allocation to overall spread products versus government bonds, equal to four percentage points of the portfolio (Chart 15) the tracking error of the portfolio, or its expected volatility in excess of that of the benchmark, is 77bps – below our self-imposed 100bps tracking error limit (Chart 16) the portfolio now has a yield below that of the custom benchmark index, equal to -31bps on a currency-unhedged basis but a more modest “carry gap” of -10bps on a USD-hedged basis given the gains from hedging into USD (Chart 17). Chart 16Overall Portfolio Risk: Moderate
Overall Portfolio Risk: Moderate
Overall Portfolio Risk: Moderate
Chart 17Overall Portfolio Yield: Below-Benchmark
Overall Portfolio Yield: Below-Benchmark
Overall Portfolio Yield: Below-Benchmark
Bottom Line: Looking ahead, our model bond portfolio performance will continue to be driven by the same factors in Q3/2022 as in the previous quarter: the relative performance of US bonds versus European equivalents for both government debt and corporate bonds, and the path for emerging market credit spreads. Portfolio Scenario Analysis For The Next Six Months After making the modest changes to our inflation-linked bond allocations in the US and Canada, which can be seen in the tables on pages 23-24, we now turn to our regularly quarterly scenario analysis to determine the return expectations for the portfolio for the next six months. On the credit side of the portfolio, we use risk-factor-based regression models to forecast future yield changes for global spread product sectors as a function of four major factors - the VIX, oil prices, the US dollar and the fed funds rate (Table 3A). For the government bond side of the portfolio, we avoid using regression models and instead use a yield-beta driven framework, taking forecasts for changes in US Treasury yields and translating those in changes in non-US bond yields by applying a historical yield beta (Table 3B). Table 3AFactor Regressions Used To Estimate Spread Product Yield Changes
GFIS Model Bond Portfolio Q2/2022 Review & Outlook: Winning By Playing Defense
GFIS Model Bond Portfolio Q2/2022 Review & Outlook: Winning By Playing Defense
Table 3BEstimated Government Bond Yield Betas To US Treasuries
GFIS Model Bond Portfolio Q2/2022 Review & Outlook: Winning By Playing Defense
GFIS Model Bond Portfolio Q2/2022 Review & Outlook: Winning By Playing Defense
For our scenario analysis over the next six months, we use a base case scenario plus two alternate “tail risk” scenarios. In the current environment, our scenarios center around the pace of global growth. Base Case (Slow Global Growth) Global growth momentum slows substantially, with firms cutting back on hiring and investing activity due to slowing corporate profit growth. An outright recession is avoided because softening energy prices help ease the drag on real spending power for consumers. China introduces more monetary and fiscal stimulus measures to boost growth. Global inflation peaks and eases on the back of slowing growth of goods prices and commodity prices, but the floor on inflation in the US and other developed markets is higher than central bank inflation targets due to sticky domestic price pressures. The Fed continues to hike at every policy meeting in H2/2022. There is a very mild bear flattening of the US Treasury curve, but with longer-term yields remain broadly unchanged over the full six month scenario period with the Fed not hiking by more than currently discounted. The Brent oil price retreats by -10%, the US dollar modestly appreciates by 2%, the VIX stays close to current levels at 28 and the fed funds rate reaches 3.25% by year-end. Resilient Growth Scenario Consumer spending surprises to the upside in the US and even Europe, as softer momentum of energy prices eases the relentless downward pressure on real incomes. Labor demand remains sold across the developed world, particularly with firms reluctant to do mass layoffs because of a perceived scarcity of quality labor. China enacts more policy stimulus with growth likely to fall below 2022 government targets. The Fed is forced to be more aggressive on rate hikes, given resilient US growth and inflation staying well above the Fed’s 2% target. The US Treasury curve bear-flattens into outright inversion, but with Treasury yields rising across the curve. The Brent oil price rises +20%, the VIX index climbs to 30, the US dollar appreciates by +3% thanks to a more aggressive Fed that lifts the funds rate to 3.75% by year-end. Recession Scenario A toxic combination of contracting corporate profits and negative real income growth drags the major developed economies into outright recession. Global inflation rates slow rapidly from current elevated levels, fueled by a rapid decline in commodity prices, but remain above central bank targets making it hard for the Fed and other major central banks to pivot dovishly to support growth. Chinese policymakers belatedly act to ease monetary and fiscal policy, but not by enough to offset the slow response from developed market policymakers. The Treasury curve moderately bull-steepens, although the absolute decline in nominal Treasury yields is relatively modest as the Fed will not pivot quickly to signaling policy easing with inflation still likely to remain above 2%. The Brent oil price falls -20%, the VIX index soars to 35, the US dollar depreciates by -3% (as lower US rates win out over slowing global growth) and the Fed pushes the funds rate to 2.75% before pausing after September. The excess return scenarios for the model bond portfolio, using the above inputs in our simple quantitative return forecast framework, are shown in Table 4A. The US Treasury yield assumptions are shown in Table 4B. For the more visually inclined, we present charts showing the model inputs and Treasury yield projections in Chart 18 and Chart 19, respectively. Table 4AGFIS Model Bond Portfolio Scenario Analysis For The Next Six Months
GFIS Model Bond Portfolio Q2/2022 Review & Outlook: Winning By Playing Defense
GFIS Model Bond Portfolio Q2/2022 Review & Outlook: Winning By Playing Defense
Table 4BUS Treasury Yield Assumptions For The 6-Month Forward Scenario Analysis
GFIS Model Bond Portfolio Q2/2022 Review & Outlook: Winning By Playing Defense
GFIS Model Bond Portfolio Q2/2022 Review & Outlook: Winning By Playing Defense
Chart 18Risk Factor Assumptions For The Scenario Analysis
Risk Factor Assumptions For The Scenario Analysis
Risk Factor Assumptions For The Scenario Analysis
Chart 19US Treasury Yield Assumptions For The Scenario Analysis
US Treasury Yield Assumptions For The Scenario Analysis
US Treasury Yield Assumptions For The Scenario Analysis
Given our neutral overall duration stance, the return scenarios will be driven by mostly by the credit side of the portfolio. In the recession scenario where Treasury yields decline, there is a modest projected outperformance from the rates side of the portfolio coming through the underweight to low-beta JGBs. In all scenarios, financial market volatility is expected to stay at, or above, current levels as central banks will be unable to ease policy, even in the event of an actual recession, because of lingering high inflation. Thus, the return on the credit side of the model portfolio will be the main driver of performance, delivering a range of excess return outcomes between +47bps and +60bps. Bottom Line: The model bond portfolio should benefit in H2/2022 from the ongoing cautious stance on global spread product, focused on underweights to US investment grade corporates and EM hard currency debt. Robert Robis, CFA Chief Fixed Income Strategist rrobis@bcaresearch.com Footnotes 1 The GFIS model bond portfolio custom benchmark index is the Bloomberg Barclays Global Aggregate Index, but with allocations to global high-yield corporate debt replacing very high-quality spread product (i.e. AA-rated). We believe this to be more indicative of the typical internal benchmark used by global multi-sector fixed income managers. 2 We are also closing out our Canadian breakeven widening trade in our Tactical Overlay portfolio. GFIS Model Bond Portfolio Recommended Positioning Active Duration Contribution: GFIS Recommended Portfolio Vs. Custom Performance Benchmark
GFIS Model Bond Portfolio Q2/2022 Review & Outlook: Winning By Playing Defense
GFIS Model Bond Portfolio Q2/2022 Review & Outlook: Winning By Playing Defense
The GFIS Recommended Portfolio Vs. The Custom Benchmark Index Global Fixed Income - Strategic Recommendations*
GFIS Model Bond Portfolio Q2/2022 Review & Outlook: Winning By Playing Defense
GFIS Model Bond Portfolio Q2/2022 Review & Outlook: Winning By Playing Defense
Executive Summary Buying a home is now more expensive than renting in many parts of the world. In the US and UK, disappearing homebuyers combined with a flood of home-sellers will weigh on home prices over the next 6-12 months. Falling employment and falling house prices risk becoming a self-reinforcing negative feedback loop that turns a mild recession into a severe recession. To stop such a vicious cycle running out of control, policymakers will eventually bring down mortgage rates. For this reason, on a time horizon of 6-12 months, overweight bonds. A collapse in Chinese property development and construction activity will have negative long-term implications for commodities, emerging Asia, and developing countries that produce raw materials. Structurally underweight. On the other hand, stay structurally overweight the China 30-year government bond. Fractal trading watchlist: US Biotech versus Utilities. Buying A Home Is Now More Expensive Than Renting!
Buying A Home Is Now More Expensive Than Renting!
Buying A Home Is Now More Expensive Than Renting!
Bottom Line: The decade-long global housing boom is over. Feature For the first time since 2018, the number of Brits wanting to buy a home is less than the number of Brits wanting to sell their home. The balance of homebuyers versus homes for sale is the main driver of any housing market. When multiple homebuyers are competing for a home for sale, the subsequent bidding war puts upward pressure on house prices. But when, multiple homes for sale are competing for a homebuyer, the subsequent discounting war puts downward pressure on house prices. The balance of homebuyers versus homes for sale is the main driver of any housing market. This makes the number of homebuyers versus homes for sale the best leading indicator of house prices. The recent collapse of this leading indicator in the UK warns that UK house prices are likely to soften through the remainder of 2022 and into 2023 (Chart I-1). Chart I-1With Fewer UK Homebuyers Than UK Home-Sellers, UK House Prices Are Set To Drop
With Fewer UK Homebuyers Than UK Home-Sellers, UK House Prices Are Set To Drop
With Fewer UK Homebuyers Than UK Home-Sellers, UK House Prices Are Set To Drop
Homebuyers Are Disappearing While Home-Sellers Are Flooding The Market Disappearing homebuyers combined with a flood of home-sellers is also evident in the US. According to Realtor.com: “Weary US homebuyers face not only sky-high home prices but also rising mortgage rates, and that financial double whammy is hitting homebuyers hard: Compared with just a year ago, the cost of financing 80 percent of a typical home rose 57.6 percent, amounting to an extra $745 per month.” Compared with just a year ago, the cost of financing 80 percent of a typical US home rose 57.6 percent, amounting to an extra $745 per month. Unsurprisingly, US mortgage applications for home purchase have recently plunged by a third (Chart I-2) and homebuyer demand has declined by 16 percent since last June.1 Meanwhile, the inventory of homes actively for sale on a typical day in June has increased by 19 percent, the largest increase in the data history. Chart I-2With The Cost Of Financing A US Home Purchase Surging, Mortgage Applications Have Collapsed
With The Cost Of Financing A US Home Purchase Surging, Mortgage Applications Have Collapsed
With The Cost Of Financing A US Home Purchase Surging, Mortgage Applications Have Collapsed
The flood of new homes on the market means that the dwindling pool of homebuyers will have more negotiating leverage on the asking price (Chart I-3 and Chart I-4). This will balance the highly lopsided negotiating dynamics in the raging seller’s market of the past two years. The shape of things to come can be seen in Austin, Texas, which was one of the hottest markets during the early pandemic real estate frenzy. Chart I-3US Homebuyers Are Disappearing...
US Homebuyers Are Disappearing...
US Homebuyers Are Disappearing...
Chart I-4...While US Home-Sellers Are Flooding The Market
...While US Home-Sellers Are Flooding The Market
...While US Home-Sellers Are Flooding The Market
“Prices are definitely starting to go down again… last Friday, an Austin home was listed at $825,000. The next day, at the open house, no one came. A few months ago, there would have been 20 or more buyers showing up. The sellers didn’t want to test the market, so on Sunday, they dropped it to $790,000. It sold for $760,000.” Buying A Home Is Now More Expensive Than Renting The nub of the problem for homebuyers is that the mortgage rate is higher than the rental yield. In simple terms, buying a home is now more expensive than renting (Chart I-5). The housing bulls counter that the high mortgage rate will force rental yields to adjust upwards by rents going up, but this argument is flawed. Chart I-5Buying A Home Is Now More Expensive Than Renting!
Buying A Home Is Now More Expensive Than Renting!
Buying A Home Is Now More Expensive Than Renting!
The most important driver of rent inflation is the unemployment rate (inversely). Because, to put it bluntly, you need a steady job to pay the rent! Today, the Federal Reserve’s inflation problem, in a nutshell, is that rent inflation is too high even versus the tight jobs market (Chart I-6). Chart I-6The Fed Needs To Push Up Unemployment To Pull Down Rent Inflation
The Fed Needs To Push Up Unemployment To Pull Down Rent Inflation
The Fed Needs To Push Up Unemployment To Pull Down Rent Inflation
Although the Fed cannot say this explicitly, its mechanism to bring down inflation is to push up unemployment, and thereby to pull down rent inflation, which constitutes almost half of the core inflation basket. In this case, the rental yield (rent divided by house price) would adjust upwards by the denominator – house prices – going down. The most important driver of rent inflation is the unemployment rate (inversely). Yet the housing bulls also argue that the housing boom is the result of a structural undersupply of homes. They claim that as this structural undersupply persists, it will underpin house prices. But this ‘housing shortage’ narrative is another myth, which we can debunk with two simple observations. Through the past decade, home prices have risen simultaneously and exponentially everywhere in the world. Now ask yourself, is it plausible that there could be a structural undersupply of homes everywhere in the world at the precisely the same time? If this doesn’t debunk the housing shortage narrative, then try this second observation. Through the past decade, gross rents have tracked nominal GDP. Theory says that gross rents should track nominal GDP, because the quality of the housing stock improves broadly in line with GDP, and therefore so too should rents. If there really was a structural undersupply of housing, then gross rents would be structurally outperforming nominal GDP. But that hasn’t happened in any major economy (Chart I-7). Chart I-7Rents Have Tracked GDP, So There Is No 'Structural Undersupply' Of Homes
Rents Have Tracked GDP, So There Is No 'Structural Undersupply' Of Homes
Rents Have Tracked GDP, So There Is No 'Structural Undersupply' Of Homes
As an aside, if rents track GDP, then why do they constitute almost half of the core inflation basket? The answer is that the rents included in inflation are ‘hedonically adjusted’, meaning that are supposedly deflated for quality improvements – though there is always a niggling doubt whether the statisticians do this adjustment correctly! Pulling all of this together, the synchronized global housing boom of the past decade was not the result of a structural undersupply. Instead, it was the result of a valuation boom – meaning, plummeting rental yields, which in turn were the result of plummeting mortgage rates, which in turn were the result of plummeting bond yields. But now that mortgage rates are much higher than rental yields, this ‘virtuous’ cycle risks turning vicious. Falling employment and falling house prices risk becoming a self-reinforcing negative feedback loop that turns a mild recession into a severe recession. To stop such a vicious cycle running out of control, policymakers will eventually have no other choice than to bring down mortgage rates. For this reason, on a time horizon of 6-12 months, overweight bonds. But The Prize For The Biggest Housing Boom Goes To… China The housing booms in the UK, US and other Western economies, extreme as they are, are small fry compared to the housing boom in China. Chinese real estate, now worth $100 trillion, is by far the largest asset-class in the world. And Chinese rental yields, at around 1 percent, are well below the yield on cash. Begging the question, how can Chinese real estate valuations be in such stratospheric territory, with a yield even less than that on ‘risk-free’ cash? The simple answer is that investors have been led to believe that Chinese real estate is a risk-free investment! Without a social safety net and with limited places to park their money, Chinese savers have for years been encouraged to buy homes, in the widespread belief that property is the safest investment, whose price is only supposed to go up (Chart I-8). Chart I-8Chinese Real Estate Is Perceived To Be A 'Risk Free' Investment
Chinese Real Estate Is Perceived To Be A 'Risk Free' Investment
Chinese Real Estate Is Perceived To Be A 'Risk Free' Investment
With the bulk of Chinese households’ wealth in property acting as a perceived economic safety net, even a 10 percent decline in house prices would constitute a major shock to the household sector’s hopes and expectations of what property is. In turn, the ensuing ‘negative wealth effect’ would be catastrophic for household spending in the world’s second largest economy. Therefore, in contrast to the US housing debacle in 2008, the Chinese government will ensure that its property market adjustment does not come from a collapse in home prices. Rather, it will come from a collapse in property development and construction activity, combined with keeping interest rates structurally low. This will have negative long-term implications for commodities, emerging Asia, and developing countries that produce raw materials. Structurally underweight. On the other hand, Chinese bonds are an excellent investment for those investors who can accept the capital control risks. Stay structurally overweight the China 30-year government bond. Fractal Trading Watchlist Biotech and Utilities are both defensive sectors, based on the insensitivity of theirs profits to economic fluctuations. But whereas Biotech is ‘long duration’, Utilities is ‘shorter duration’. Over the coming months, as the economy falters and bond yields back down, long duration defensives, such as Biotech, are likely to be the winners. This is supported by the recent underperformance reaching the point of fractal fragility that has indicated previous major turning points (Chart I-9). The recommended trade is long US Biotech versus Utilities, setting a profit target and symmetrical stop-loss at 20 percent. This replaces our long US Biotech versus Tech position, which achieved its 17.5 percent profit target, and is now closed. Chart I-9Biotech Is Set To Be A Big Winner
Biotech Is Set To Be A Big Winner
Biotech Is Set To Be A Big Winner
Chart 1CNY/USD Has Reversed
CNY/USD Has Reversed
CNY/USD Has Reversed
Chart 2US REITS Are Oversold Versus Utilities
US REITS Are Oversold Versus Utilities
US REITS Are Oversold Versus Utilities
Chart 3CAD/SEK Reversal Has Started
CAD/SEK Reversal Has Started
CAD/SEK Reversal Has Started
Chart 4Financials Versus Industrials To Reverse
Financials Versus Industrials To Reverse
Financials Versus Industrials To Reverse
Chart 5The Outperformance Of Resources Versus Biotech Has Started To Reverse
The Outperformance Of Resources Versus Biotech Has Started To Reverse
The Outperformance Of Resources Versus Biotech Has Started To Reverse
Chart 6The Outperformance Of Resources Versus Healthcare Is Vulnerable To Reversal
The Outperformance Of Resources Versus Healthcare Is Vulnerable To Reversal
The Outperformance Of Resources Versus Healthcare Is Vulnerable To Reversal
Chart 7FTSE100 Outperformance Vs. Euro Stoxx 50 Is Reversing
FTSE100 Outperformance Vs. Euro Stoxx 50 Is Reversing
FTSE100 Outperformance Vs. Euro Stoxx 50 Is Reversing
Chart 8Netherlands Underperformance Vs. Switzerland Has Been Exhausted
Netherlands Underperformance Vs. Switzerland Has Been Exhausted
Netherlands Underperformance Vs. Switzerland Has Been Exhausted
Chart 9The Sell-Off In The 30-Year T-Bond Is Approaching Fractal Fragility
The Sell-Off In The 30-Year T-Bond Is Approaching Fractal Fragility
The Sell-Off In The 30-Year T-Bond Is Approaching Fractal Fragility
Chart 10The Sell-Off In The NASDAQ Is Approaching Fractal Fragility
The Sell-Off In The NASDAQ Is Approaching Fractal Fragility
The Sell-Off In The NASDAQ Is Approaching Fractal Fragility
Chart 11Food And Beverage Outperformance Has Been Exhausted
Food And Beverage Outperformance Has Been Exhausted
Food And Beverage Outperformance Has Been Exhausted
Chart 12AT REVERSAL
AT REVERSAL
AT REVERSAL
Chart 13AT REVERSAL
AT REVERSAL
AT REVERSAL
Chart 14The Strong Trend In The 18-Month-Out US Interest Rate Future Is Fragile
The Strong Trend In The 18-Month-Out US Interest Rate Future Is Fragile
The Strong Trend In The 18-Month-Out US Interest Rate Future Is Fragile
Chart 15The Strong Trend In The 3 Year T-Bond Is Fragile
The Strong Trend In The 3 Year T-Bond Is Fragile
The Strong Trend In The 3 Year T-Bond Is Fragile
Chart 16A Potential Switching Point From Tobacco Into Cannabis
A Potential Switching Point From Tobacco Into Cannabis
A Potential Switching Point From Tobacco Into Cannabis
Chart 17Biotech Is A Major Buy
Biotech Is A Major Buy
Biotech Is A Major Buy
Chart 18Norway's Outperformance Could End
Norway's Outperformance Could End
Norway's Outperformance Could End
Chart 19Cotton's Outperformance Is Vulnerable To Reversal
Cotton's Outperformance Is Vulnerable To Reversal
Cotton's Outperformance Is Vulnerable To Reversal
Chart 20Fractal Trading Watch List
Fractal Trading Watch List
Fractal Trading Watch List
Chart 21The Rally In USD/EUR Could End
The Rally In USD/EUR Could End
The Rally In USD/EUR Could End
Chart 22The Outperformance Of MSCI Hong Kong Versus China Is Vulnerable To Reversal
The Outperformance Of MSCI Hong Kong Versus China Is Vulnerable To Reversal
The Outperformance Of MSCI Hong Kong Versus China Is Vulnerable To Reversal
Chart 23A Potential New Entry Point Into Petcare
A Potential New Entry Point Into Petcare
A Potential New Entry Point Into Petcare
Chart 24GBP/USD At A Turning Point
GBP/USD At A Turning Point
GBP/USD At A Turning Point
Chart 25Fractal Trading Watch List
Fractal Trading Watch List
Fractal Trading Watch List
Chart 26Fractal Trading Watch List
Fractal Trading Watch List
Fractal Trading Watch List
Dhaval Joshi Chief Strategist dhaval@bcaresearch.com Footnotes 1 Realtor.com gauge homebuyer demand by so-called ‘pending listings’, the number of listings that are at various stages of the selling process that are not yet sold. Fractal Trading System Fractal Trades
The Global Housing Boom Is Over, As Buying Becomes More Expensive Than Renting
The Global Housing Boom Is Over, As Buying Becomes More Expensive Than Renting
The Global Housing Boom Is Over, As Buying Becomes More Expensive Than Renting
The Global Housing Boom Is Over, As Buying Becomes More Expensive Than Renting
6-12 Month Recommendations Structural Recommendations Closed Fractal Trades Indicators To Watch - Bond Yields Chart II-1Indicators To Watch - Bond Yields - Euro Area
Indicators To Watch - Bond Yields - Euro Area
Indicators To Watch - Bond Yields - Euro Area
Chart II-2Indicators To Watch - Bond Yields - Europe Ex Euro Area
Indicators To Watch - Bond Yields - Europe Ex Euro Area
Indicators To Watch - Bond Yields - Europe Ex Euro Area
Chart II-3Indicators To Watch - Bond Yields - Asia
Indicators To Watch - Bond Yields - Asia
Indicators To Watch - Bond Yields - Asia
Chart II-4Indicators To Watch - Bond Yields - Other Developed
Indicators To Watch - Bond Yields - Other Developed
Indicators To Watch - Bond Yields - Other Developed
Indicators To Watch - Interest Rate Expectations Chart II-5Indicators To Watch - Interest Rate Expectations
Indicators To Watch - Interest Rate Expectations
Indicators To Watch - Interest Rate Expectations
Chart II-6Indicators To Watch - Interest Rate Expectations
Indicators To Watch - Interest Rate Expectations
Indicators To Watch - Interest Rate Expectations
Chart II-7Indicators To Watch - Interest Rate Expectations
Indicators To Watch - Interest Rate Expectations
Indicators To Watch - Interest Rate Expectations
Chart II-8Indicators To Watch - Interest Rate Expectations
Indicators To Watch - Interest Rate Expectations
Indicators To Watch - Interest Rate Expectations
BCA Research’s US Bond Strategy service recommends a neutral allocation to high-yield bonds within US fixed income portfolios. High-Yield underperformed the duration-equivalent Treasury index by 591 basis points in June, dragging year-to-date excess…
Highlights Chart 1Are Expectations Too Dovish?
Are Expectations Too Dovish?
Are Expectations Too Dovish?
The dominant market narrative has clearly shifted in the last few days. The primary concern among investors used to be that the Fed had fallen behind the curve on inflation. Now, asset prices are telling us that investors are more worried about an overly hawkish Fed and an increased risk of recession. The shift is evident in bond market prices. The yield curve is now priced for only 176 basis points of rate hikes over the next 12 months and only 90 bps of tightening over the next 24 months (Chart 1). What’s more, long-dated market-based inflation expectations have plunged to below the Fed’s target range (bottom panel). We recommend keeping portfolio duration close to benchmark for now, as bond yields could still have some downside during the next few months as both inflation and economic growth slow. That said, we suspect that the market is now pricing-in an overly dovish Fed tightening path for the next couple of years, a change that may soon warrant a shift back to below-benchmark portfolio duration. Stay tuned. Feature Table 1 Recommended Portfolio Specification Table 2Fixed Income Sector Performance
A Narrative Shift
A Narrative Shift
Investment Grade: Underweight Chart 2Investment Grade Market Overview
Investment Grade Market Overview
Investment Grade Market Overview
Investment grade corporate bonds underperformed the duration-equivalent Treasury index by 168 basis points in June, dragging year-to-date excess returns down to -379 bps. The average index option-adjusted spread widened 28 bps on the month and it currently sits at 158 bps. Similarly, our quality-adjusted 12-month breakeven spread moved up to its 61st percentile since 1995 (Chart 2). A report from a few months ago made the case for why investors should underweight investment grade corporate bonds on a 6-12 month investment horizon.1 The main rationale for this recommendation is that the slope of the Treasury curve is very flat, signaling that we are in the mid-to-late stages of the credit cycle. Corporate bond performance tends to be weak during such periods unless spreads start from very high levels. Despite our underweight 6-12 month investment stance, there’s a good chance that spreads will narrow during the next few months as inflation falls. That said, the persistent removal of monetary accommodation and flatness of the yield curve will limit how much spreads can compress. A recent report dug deeper into the corporate bond space and concluded that investment grade-rated Energy bonds offer exceptional value on a 6-12 month horizon.2 That report also concluded that long maturity investment grade corporates are attractively priced relative to short maturity bonds. Table 3A Corporate Sector Relative Valuation And Recommended Allocation* Table 3BCorporate Sector Risk Vs. Reward*
A Narrative Shift
A Narrative Shift
High-Yield: Neutral Chart 3High-Yield Market Overview
High-Yield Market Overview
High-Yield Market Overview
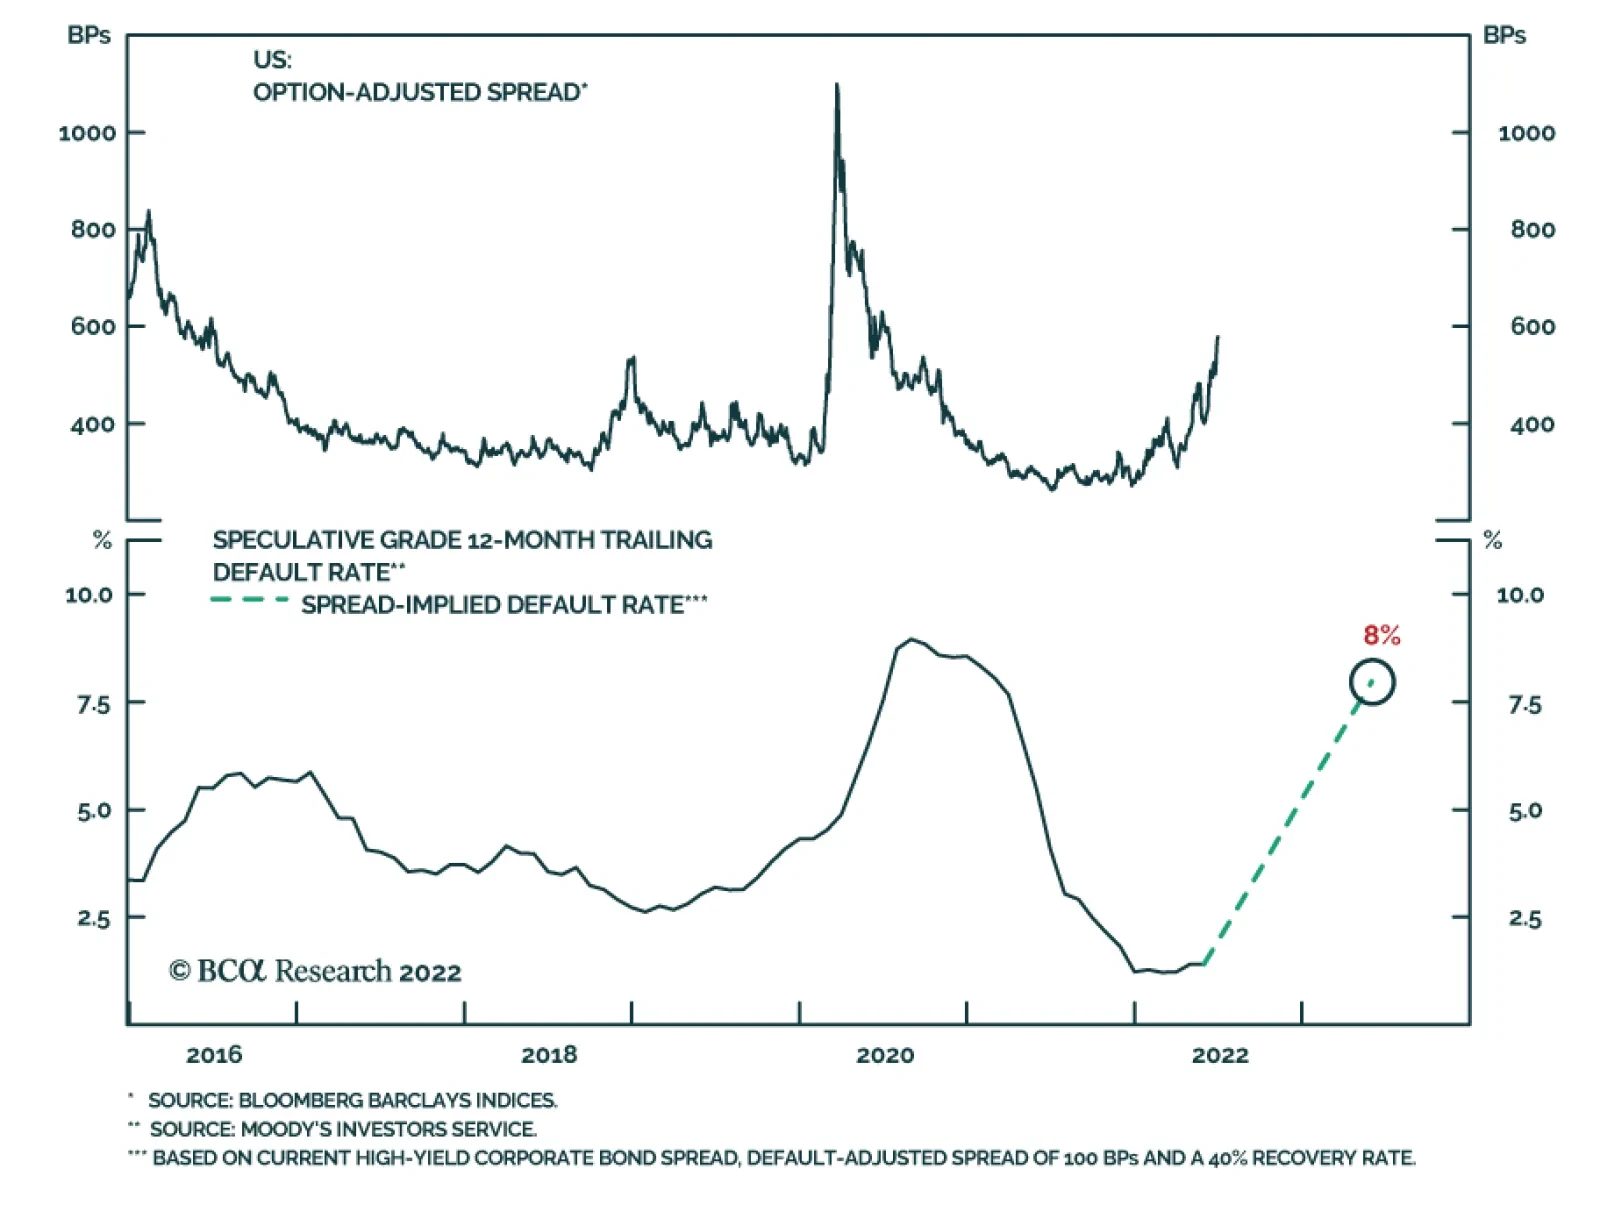
High-Yield underperformed the duration-equivalent Treasury index by 591 basis points in June, dragging year-to-date excess returns down to -889 bps. The average index option-adjusted spread widened 172 bps on the month to reach 578 bps, 209 bps above the 2017-19 average and 41 bps above the 2018 peak. The 12-month spread-implied default rate – the default rate that is priced into the junk index assuming a 40% recovery rate on defaulted debt and an excess spread of 100 bps – moved higher in June. It currently sits at 8% (Chart 3). As is the case with investment grade, there’s a good chance that high-yield spreads will stage a relief rally in the back half of this year as inflation falls. But due to the flatness of the yield curve, we think it will be difficult for spreads to move below the average seen during the last tightening cycle (2017-19). But even a move back to average 2017-19 levels would equate to roughly 11% of excess return for the junk index if it is realized over a six month period. This potential return is the main reason to prefer high-yield over investment grade in a US bond portfolio. While we maintain a neutral (3 out of 5) allocation to high-yield for now, we would be inclined to downgrade the sector if spreads tighten to the 2017-19 average or if core inflation falls back to 4%.3 MBS: Underweight Chart 4MBS Market Overview
MBS Market Overview
MBS Market Overview
Mortgage-Backed Securities underperformed the duration-equivalent Treasury index by 63 basis points in June, dragging year-to-date excess returns down to -171 bps. We discussed the outlook for Agency MBS in a recent report.4 We noted that MBS’s poor performance in 2021 and early-2022 was driven by duration extension. Fewer homeowners refinanced their loans as mortgage rates rose, and the MBS index’s average duration increased (Chart 4). But now, the index’s duration extension is at its end. The average convexity of the MBS index is close to zero (panel 3), meaning that duration is now insensitive to changes in rates. This is because hardly any homeowners have the incentive to refinance at current mortgage rates (panel 4). The implication is that excess MBS returns will be stronger going forward. That said, we still don’t see enough value in MBS spreads to increase our recommended allocation. The average index spread for conventional 30-year Agency MBS remains close to its lowest level since 2000 (bottom panel). At the coupon level, we observe that low-coupon MBS have much higher duration than high-coupon MBS and that convexity is close to zero for the entire coupon stack. This makes the relative coupon trade a direct play on bond yields. Given that we see some potential for yields to fall during the next six months, we recommend favoring low-coupon MBS (1.5%-2.5%) within an overall underweight allocation to the sector. Emerging Market Bonds (USD): Underweight Chart 5Emerging Markets Overview
Emerging Markets Overview
Emerging Markets Overview
Emerging Market bonds underperformed the duration-equivalent Treasury index by 182 basis points in June, dragging year-to-date excess returns down to -737 bps. EM Sovereigns underperformed the Treasury benchmark by 280 bps on the month, dragging year-to-date excess returns down to -925 bps. The EM Corporate & Quasi-Sovereign Index underperformed by 122 bps, dragging year-to-date excess returns down to -617 bps. The EM Sovereign Index underperformed the duration-equivalent US corporate bond index by 99 bps in June. The yield differential between EM sovereigns and duration-matched US corporates remains negative. Further, the relative performance of EM sovereigns versus US corporates has been tracking the performance of EM currencies versus the dollar and our Emerging Markets Strategy service sees further headwinds for EM currencies in the near term (Chart 5).5 The EM Corporate & Quasi-Sovereign Index outperformed duration-matched US corporates by 1 bp in June. The index continues to offer a significant yield advantage versus duration-matched US corporates (bottom panel), and as such, we continue to recommend a neutral (3 out of 5) allocation to the sector. Municipal Bonds: Overweight Chart 6Municipal Market Overview
Municipal Market Overview
Municipal Market Overview
Municipal bonds underperformed the duration-equivalent Treasury index by 89 basis points in June, dragging year-to-date excess returns down to -167 bps (before adjusting for the tax advantage). We view the municipal bond sector as better placed than most to cope with the recent bout of spread volatility. As we noted in a recent report, state & local government revenue growth has been strong and yet governments have also been slow to hire.6 The result is that net state & local government savings are incredibly high (Chart 6) and it will take some time to deplete these coffers even as economic growth slows and federal fiscal thrust turns to drag. On the valuation front, munis have cheapened up relative to both Treasuries and corporates during the past few months. The 10-year Aaa Muni / Treasury yield ratio is currently 94%, up significantly from its 2021 trough of 55%. The yield ratio between 12-17 year munis and duration-matched corporate bonds is also up significantly off its lows (panel 2). We reiterate our overweight allocation to municipal bonds within US fixed income portfolios, and we continue to have a strong preference for long-maturity munis. The yield ratio between 17-year+ General Obligation Municipal bonds and duration-matched US corporates is 92%. The same measure for 17-year+ Revenue bonds stands at 97%, just below parity even without considering municipal debt’s tax advantage. Treasury Curve: Buy 5-Year Bullet Versus 2/10 Barbell Chart 7Treasury Yield Curve Overview
Treasury Yield Curve Overview
Treasury Yield Curve Overview
The Treasury curve bear-flattened in June. The 2-year/10-year Treasury slope flattened 26 bps on the month and the 5-year/30-year slope flattened 13 bps. The 2/10 and 5/30 slopes now stand at 4 bps and 23 bps, respectively. In a recent Special Report we noted the unusually large divergence between flat slopes at the long end of the curve and steep slopes at the front end.7 This divergence has narrowed in recent weeks, but it remains wide by historical standards. For example, the 5-year/10-year Treasury slope is currently 0 bps while the 3-month/5-year slope is 122 bps. The divergence is happening because the market moved quickly to price-in a rapid near-term pace of rate hikes, but the Fed has only delivered 150 bps of tightening so far and this is holding down the very front-end of the curve. The oddly shaped curve presents us with an excellent trading opportunity. Specifically, we recommend buying the 5-year Treasury note versus a duration-matched barbell consisting of the 2-year and 10-year notes. The 5 over 2/10 butterfly spread has narrowed during the past month, but the trade continues to look attractive on our model (Chart 7). We also continue to recommend a position long the 20-year bullet versus a duration-matched 10/30 barbell as an attractive carry trade. TIPS: Underweight Chart 8TIPS Market Overview
TIPS Market Overview
TIPS Market Overview
TIPS underperformed the duration-equivalent nominal Treasury index by 246 basis points in June, dragging year-to-date excess returns down to -14 bps. The 10-year TIPS breakeven inflation rate fell 31 bps on the month, landing back inside the Fed’s 2.3% - 2.5% comfort zone (Chart 8). Consistently, our TIPS Breakeven Valuation Indicator is drifting toward neutral territory, signaling that TIPS are becoming less expensive (panel 2). At the front-end of the yield curve, the 2-year TIPS breakeven inflation rate fell 57 bps in June – from 3.86% to 3.29% - and the 2-year TIPS yield rose 96 bps – from -1.33% to -0.37% (bottom 2 panels). The large drop in short-maturity breakevens is the result of increasing investor conviction that inflation has indeed peaked. In a recent report we made the case that core CPI inflation can fall to a range of 4%-5% (from its current 6.0% rate) without the Fed needing to cause a recession. We also argued that a recession will be required to push inflation from 4% back down to 2%.8 The upshot for bond investors is that TIPS breakeven inflation rates will drop further as core inflation rolls over. This will be particularly true at the front-end of the yield curve. We also noted in last week’s report that Fed policymakers have increasingly indicated a desire for positive real yields across the entire curve.9 This tells us that investors should continue to short 2-year TIPS, targeting a positive real 2-year yield. ABS: Overweight Chart 9ABS Market Overview
ABS Market Overview
ABS Market Overview
Asset-Backed Securities outperformed the duration-equivalent Treasury index by 21 basis points in June, bringing year-to-date excess returns up to -42 bps. Aaa-rated ABS outperformed by 25 bps on the month, bringing year-to-date excess returns up to -33 bps. Non-Aaa ABS underperformed by 5 bps on the month, dragging year-to-date excess returns down to -93 bps. During the past two years, substantial federal government support for household incomes caused US households to build up an extremely large buffer of excess savings. Nowhere is this more evident than in the steep drop in the amount of outstanding credit card debt that was witnessed in 2020 and 2021 (Chart 9). In 2022, consumers have started to re-lever. The personal savings rate was just 5.4% in May and the amount of outstanding credit card debt has recovered to its pre-COVID level (bottom panel). But while household balance sheets are starting to deteriorate, they remain exceptionally strong in level terms. In other words, it will be some time before we see enough deterioration to cause a meaningful uptick in consumer credit delinquencies. Investors should remain overweight consumer ABS and should take advantage of the high quality of household balance sheets by moving down the quality spectrum, favoring non-Aaa rated securities over Aaa-rated ones. Non-Agency CMBS: Overweight Chart 10CMBS Market Overview
CMBS Market Overview
CMBS Market Overview
Non-Agency Commercial Mortgage-Backed Securities underperformed the duration-equivalent Treasury index by 5 basis points in June, dragging year-to-date excess returns down to -194 bps. Aaa Non-Agency CMBS outperformed Treasuries by 12 bps on the month, bringing year-to-date excess returns up to -141 bps. Non-Aaa Non-Agency CMBS underperformed by 52 bps on the month, dragging year-to-date excess returns down to -340 bps. CMBS spreads remain wide compared to other similarly risky spread products and are currently slightly above their historic averages (Chart 10). Meanwhile, weak commercial real estate (CRE) investment continues to drive strong CRE price appreciation (panel 4). Agency CMBS: Overweight Agency CMBS outperformed the duration-equivalent Treasury index by 32 basis points in June, bringing year-to-date excess returns up to 9 bps. The average index option-adjusted spread tightened 3 bps on the month. It currently sits at 47 bps, close to its long-term average (bottom panel). Agency CMBS spreads also continue to look attractive compared to other similarly risky spread products. Stay overweight. Appendix A: The Golden Rule Of Bond Investing We follow a two-step process to formulate recommendations for bond portfolio duration. First, we determine the change in the federal funds rate that is priced into the yield curve for the next 12 months. Second, we decide – based on our assessments of the economy and Fed policy – whether the change in the fed funds rate will exceed or fall short of what is priced into the curve. Most of the time, a correct answer to this question leads to the appropriate duration call. We call this framework the Golden Rule Of Bond Investing, and we demonstrated its effectiveness in the US Bond Strategy Special Report, “The Golden Rule Of Bond Investing”, dated July 24, 2018. Chart 11 illustrates the Golden Rule’s track record by showing that the Bloomberg Barclays Treasury Master Index tends to outperform cash when rate hikes fall short of 12-month expectations, and vice-versa. Chart 11The Golden Rule's Track Record
The Golden Rule's Track Record
The Golden Rule's Track Record
At present, the market is priced for 176 basis points of rate hikes during the next 12 months. We can also use our Golden Rule framework to make 12-month total return and excess return forecasts for the Bloomberg Barclays Treasury index under different scenarios for the fed funds rate. Excess returns are relative to the Bloomberg Barclays Cash index. To forecast total returns we first calculate the 12-month fed funds rate surprise in each scenario by comparing the assumed change in the fed funds rate to the current value of our 12-month discounter. This rate hike surprise is then mapped to an expected change in the Treasury index yield using a regression based on the historical relationship between those two variables. Finally, we apply the expected change in index yield to the current characteristics (yield, duration and convexity) of the Treasury index to estimate total returns on a 12-month horizon. The below tables present those results, along with excess returns for a front-loaded and a back-loaded rate hike scenario. Excess returns are calculated by subtracting assumed cash returns in each scenario from our total return projections.
A Narrative Shift
A Narrative Shift
Appendix B: Butterfly Strategy Valuations The following tables present the current read-outs from our butterfly spread models. We use these models to identify opportunities to take duration-neutral positions across the Treasury curve. The following two Special Reports explain the models in more detail: US Bond Strategy Special Report, “Bullets, Barbells And Butterflies”, dated July 25, 2017, available at usbs.bcaresearch.com US Bond Strategy Special Report, “More Bullets, Barbells And Butterflies”, dated May 15, 2018, available at usbs.bcaresearch.com Table 4 shows the raw residuals from each model. A positive value indicates that the bullet is cheap relative to the duration-matched barbell. A negative value indicates that the barbell is cheap relative to the bullet. Table 4Butterfly Strategy Valuation: Raw Residuals In Basis Points (As Of June 30, 2022)
A Narrative Shift
A Narrative Shift
Table 5 scales the raw residuals in Table 4 by their historical means and standard deviations. This facilitates comparison between the different butterfly spreads. Table 5Butterfly Strategy Valuation: Standardized Residuals (As Of June 30, 2022)
A Narrative Shift
A Narrative Shift
Table 6 flips the models on their heads. It shows the change in the slope between the two barbell maturities that must be realized during the next six months to make returns between the bullet and barbell equal. For example, a reading of -9 bps in the 5 over 2/10 cell means that we would expect the 5-year to outperform the 2/10 if the 2/10 slope flattens by less than 9 bps during the next six months. Otherwise, we would expect the 2/10 barbell to outperform the 5-year bullet. Table 6Discounted Slope Change During Next 6 Months (BPs)
A Narrative Shift
A Narrative Shift
Appendix C: Excess Return Bond Map The Excess Return Bond Map is used to assess the relative risk/reward trade-off between different sectors of the US bond market. It is a purely computational exercise and does not impose any macroeconomic view. The Map’s vertical axis shows 12-month expected excess returns. These are proxied by each sector’s option-adjusted spread. Sectors plotting further toward the top of the Map have higher expected returns and vice-versa. Our novel risk measure called the “Risk Of Losing 100 bps” is shown on the Map’s horizontal axis. To calculate it, we first compute the spread widening required on a 12-month horizon for each sector to lose 100 bps or more relative to a duration-matched position in Treasury securities. Then, we divide that amount of spread widening by each sector’s historical spread volatility. The end result is the number of standard deviations of 12-month spread widening required for each sector to lose 100 bps or more versus a position in Treasuries. Lower risk sectors plot further to the right of the Map, and higher risk sectors plot further to the left. Chart 12Excess Return Bond Map (As Of June 30, 2022)
A Narrative Shift
A Narrative Shift
Ryan Swift US Bond Strategist rswift@bcaresearch.com Footnotes 1 Please see US Bond Strategy / Global Fixed Income Strategy Special Report, “Turning Defensive On US Corporate Bonds”, dated April 12, 2022. 2 Please see US Bond Strategy / Global Fixed Income Strategy Special Report, “Looking For Opportunities In US & European Corporates After The Recent Selloff”, dated May 31, 2022. 3 For more details on this call please see US Bond Strategy Weekly Report, “When The Dual Mandates Clash”, dated June 28, 2022. 4 Please see US Bond Strategy Weekly Report, “The Bond Market Implications Of A 5% Mortgage Rate”, dated April 26, 2022. 5 Please see Emerging Markets Strategy Charts That Matter, “Beware Of Another Downleg In Risk Assets”, dated June 30, 2022. 6 Please see US Bond Strategy Weekly Report, “Echoes Of 2018”, dated May 24, 2022. 7 Please see US Bond Strategy / US Investment Strategy / US Equity Strategy Special Report, “The Yield Curve As An Indicator”, dated March 29, 2022. 8 Please see US Bond Strategy Weekly Report, “No End In Sight For Fed Tightening”, dated June 21, 2022. 9 Please see US Bond Strategy Weekly Report, “When Dual Mandates Clash”, dated June 28, 2022. Recommended Portfolio Specification Other Recommendations Treasury Index Returns Spread Product Returns
In this <i>Strategy Outlook</i>, we present the major investment themes and views we see playing out for the rest of the year and beyond.
Highlights We now recommend that investors maintain a neutral stance towards stocks versus bonds in a global multi-asset portfolio. We also recommend that investors increase their allocation to government bonds within a global fixed income portfolio (to overweight), at the expense of corporate bonds. We still believe that the US will likely avoid a recession over the coming year, but we are less convinced that this is true than we were a few months ago. The fact that mortgage rates have risen to neutral territory means it is possible that the usual ingredients for a recession – tight monetary policy plus a shock to aggregate demand in the form of a sharp decline in real wages – are currently present or soon will be. In addition, the Fed is now very concerned that long-term household inflation expectations may become unanchored to the upside. Headline inflation has seemingly been a more impactful driver of long-term inflation expectations than core measures, implying that the Fed may have to crowd out demand for goods and services that are comparatively less affected by supply-side constraints in order to contain rising inflation expectations. That would be clearly negative for economic growth and is potentially recessionary in nature. We see no compelling signs of an acceleration in European or Chinese growth that could act as a ballast to support the global economy. The European energy situation is worsening, China’s post-lockdown rebound has so far been tepid, and market-based indicators of Chinese economic growth are deteriorating. The US equity market is not priced for a typical “income-statement” recession induced by monetary policy. We expect the S&P 500 to fall to 3100 in a recession scenario, driven mostly by declining earnings. In a recession scenario, we do not expect long-maturity government bond yields to fall enough to offset a likely increase in the equity risk premium. Financial markets rarely trend sideways over 6-to-12 month periods. We regard a neutral global asset allocation stance as a temporary stepping stone to either a further downgrade of risky assets to underweight, or an increase in risky asset exposure back to a high-conviction overweight. The latter is still possible, especially if we soon see a substantial slowdown in the US headline inflation rate. Thus, additional changes to our recommended cyclical allocation may occur over the coming few months, in response to the incoming data and our assessment of the likely implications for monetary policy. Downgrading Risky Assets To Neutral Every month, BCA strategists hold a house view meeting to discuss the most important issues driving the macroeconomy and financial markets. As highlighted in a recent Special Alert from our Global Investment Strategy service,1 BCA strategists voted at our June meeting to change our House View to a neutral asset allocation stance towards equities, with a slight plurality favoring an outright underweight. Table I-1We Now Recommend More Conservative Positioning Than We Did In May
July 2022
July 2022
The view of the Bank Credit Analyst service is in line with the consensus of BCA strategists on this issue, and we consequently recommend a neutral stance towards stocks versus bonds in a global multi-asset portfolio. We also recommend that investors increase their allocation to government bonds within a global fixed income portfolio (to overweight), at the expense of corporate bonds (Table I-1). We noted in our April report2 – when the S&P 500 index stood at 4530 – that the outlook for equities had deteriorated meaningfully since the beginning of the year and that investors should maintain at most a very modest overweight toward equities in a global multi-asset portfolio. A formal downgrade to neutral is thus not a large change in our recommended positioning, but it reflects what we view as a legitimate increase in the odds of a US recession over the coming year. It is not yet our view that a US recession is a probable outcome, but it is important to distinguish between one’s forecast of the economic outlook and the appropriate investment strategy. The unique inflationary pressure created by the COVID-19 pandemic has created a large confidence interval around our forecast, underscoring that an aggressive stance towards risky assets is not warranted. Financial markets rarely trend sideways over 6-to-12 month periods. We regard a neutral stance as a temporary stepping stone to either a further downgrade of risky assets to underweight or an increase in risky asset exposure back to a high-conviction overweight. The latter is still possible, especially if we see a substantial slowdown in the US headline inflation rate. But as we will discuss below, that slowdown will have to materialize soon in order for us to recommend an overweight risky asset stance. Reviewing Our Previously Constructive View On US Economic Growth Chart I-1Recessionary Concerns Have Escalated Significantly Since The 2-10 Yield Curve Inverted
Recessionary Concerns Have Escalated Significantly Since The 2-10 Yield Curve Inverted
Recessionary Concerns Have Escalated Significantly Since The 2-10 Yield Curve Inverted
Concerns about a potential US recession have been growing since the Fed’s hawkish pivot in November, especially following Russia’s invasion of Ukraine. Previously, these concerns centered around two core issues: the aggressive pace at which the Fed communicated it would raise the policy rate, and the fact that the 2-10 yield curve flattened sharply in the first quarter and finally inverted (based on closing prices) on April 1st (Chart I-1). We had pushed back against those concerns, for several reasons. Our deeply-held view is that recessions typically occur when a significant shock to aggregate demand emerges against the backdrop of tight monetary policy. Sometimes the debt-service and credit demand impact of high interest rates itself is the shock. In other cases, recessions have been triggered in an environment of restrictive monetary policy by a sudden change in key input costs (such as oil prices), the bursting of a financial asset bubble, or a major shift in fiscal spending (typically following a period of war). But the core point is that recessions rarely occur when monetary policy is easy, even when shocks to aggregate demand occur. We abstract here from special cases such as the recession that occurred during the early phase of the COVID-19 pandemic. That event saw the introduction of government policies that purposely arrested economic activity, which in our view would have caused a recession under any conceivable fiscal and/or monetary policy alignment. As a business cycle indicator, the yield curve is significant for investors because it essentially represents the bond market’s assessment of the monetary policy stance. The 2-10 yield curve inversion in early April occurred, in part, because of the speed at which the Fed signaled it would raise interest rates, but also because the 10-year Treasury yield stood just under 2.4% at the point of inversion. This level of long-maturity bond yields reflected the view of both the Fed and most investors that the neutral rate of interest permanently fell following the 2008/2009 global financial crisis (GFC), a view that we have argued against in several previous reports.3 As such, the first reason we pushed back against earlier recessionary concerns is that we believe that the natural/neutral rate of interest is higher than the Fed and investors believe (even though we warned that a recessionary scare was quite likely). Chart I-2A Large Portion Of Currently Elevated Inflation Is Due To Supply-Side And Pandemic-Related Factors
July 2022
July 2022
The second reason that we had pushed back against recessionary concerns was our view that a meaningful portion of currently elevated US inflation is a function of supply-side and pandemic-related factors that will eventually abate. Chart I-2 highlights credible estimates showing that roughly half of the year-over-year change in the headline PCE deflator is the result of supply-side factors, versus 40-50% for core inflation. It has been and remains our view that a substantial portion of these supply-side and pandemic-related factors will dissipate as the pandemic continues to recede in importance, with several price categories likely to deflate outright. Chart I-3Excess Savings Should Still Support Higher Services Spending
Excess Savings Should Still Support Higher Services Spending
Excess Savings Should Still Support Higher Services Spending
Finally, we have argued in several reports that US goods spending has been well above-trend and is likely to slow, but also that services spending is far too low and is likely to rise. Chart I-3 highlights that close to $3 trillion in excess savings have accrued during the pandemic, which formed because of a combination of rising disposable income and falling services spending. We noted that the continued transition of the US and global economies towards a post-pandemic state would boost services spending, providing (an admittedly atypical) source of support for overall aggregate demand. Why The Odds Of A US Recession Have Increased We still believe that the US will more likely than not avoid a recession over the coming year, but it is true that the strength of all three of the arguments presented above has weakened. Regarding the stance of monetary policy, Charts I-4 and I-5 highlight that it is still true that the Fed funds rate and 5-year/5-year forward Treasury yields remain below our estimate of the neutral rate (nominal potential GDP growth). However, Chart I-6 highlights that the sharp rise in consumer price inflation has caused a substantial reduction in real wage growth, which certainly constitutes a non-monetary aggregate demand shock. Chart I-4The Policy Rate Is Not Yet At Neutral, But Mortgage Rates Are
The Policy Rate Is Not Yet At Neutral, But Mortgage Rates Are
The Policy Rate Is Not Yet At Neutral, But Mortgage Rates Are
Chart I-5Long-Maturity Government Bond Yields Would Have Room To Move A Lot Higher Absent Any Shocks To Demand...
Long-Maturity Government Bond Yields Would Have Room To Move A Lot Higher Absent Any Shocks To Demand...
Long-Maturity Government Bond Yields Would Have Room To Move A Lot Higher Absent Any Shocks To Demand...
Chart I-6...Unfortunately, US Consumers Are Clearly Experiencing A Shock In The Form Of Sharply Lower Real Wages
...Unfortunately, US Consumers Are Clearly Experiencing A Shock In The Form Of Sharply Lower Real Wages
...Unfortunately, US Consumers Are Clearly Experiencing A Shock In The Form Of Sharply Lower Real Wages
Panel 2 of Chart I-4 also shows that the 30-year mortgage rate in the US is now at neutral levels, in contrast to government bond yields and the US policy rate. Chart I-7 highlights that our models for US home sales and starts, featured in last month’s report,4 are still not pointing to a severe slowdown in the housing market. However, the fact that mortgage rates have risen to neutral territory means that it is possible that the usual ingredients for a recession – tight monetary policy plus a shock to aggregate demand – are currently present or soon will be. On the question of services spending acting as a support for US economic growth as goods spending slows, we continue to believe that services spending will recover back towards its pre-pandemic trend – funded by excess savings that accrued during the pandemic. However, Chart I-8, presented by my colleague Arthur Budaghyan in a recent Emerging Markets Strategy report,5 underscores the extent of the wealth destruction that has occurred because of the joint effect of falling stock and bond prices. At least some of the services-boosting effect of excess savings will likely be blunted by a negative wealth effect stemming from these financial market losses, especially since the remaining excess savings in the US are likely held by middle-to-upper income households – who are the disproportionate holders of publicly-traded financial assets. Chart I-7No Sign Yet Of A Sharp Slowdown In The Housing Market, But The Ingredients Of A Typical Recession May Be Present
No Sign Yet Of A Sharp Slowdown In The Housing Market, But The Ingredients Of A Typical Recession May Be Present
No Sign Yet Of A Sharp Slowdown In The Housing Market, But The Ingredients Of A Typical Recession May Be Present
Chart I-8A Significant Wealth Shock May Blunt The Deployment Of The Excess Savings Accrued During The Pandemic
A Significant Wealth Shock May Blunt The Deployment Of The Excess Savings Accrued During The Pandemic
A Significant Wealth Shock May Blunt The Deployment Of The Excess Savings Accrued During The Pandemic
On the inflation front, the May CPI release – and the Fed’s reaction to it – underscores that the US economy is at risk of a recession unless supply-side inflation dissipates quickly. Chart I-9 highlights that the May CPI release directly contradicted the view that the monthly rate of change in inflation has peaked. In addition, Chart I-10 presents a breakdown of the percent change in May’s headline consumer price index, with each bar in the chart representing the contribution of that category to headline CPI rising faster than 4% (annualized). The note next to each bar highlights our view of the main driver of that price category, and the color of the bars denotes how probable it is that we will soon see a significant easing in price pressure. Chart I-9The May CPI Report Was Clearly Inconsistent With A Peak Inflation Narrative
The May CPI Report Was Clearly Inconsistent With A Peak Inflation Narrative
The May CPI Report Was Clearly Inconsistent With A Peak Inflation Narrative
Chart I-10Some Elements Of Outsized CPI Will Dissipate Soon. Others May Not.
July 2022
July 2022
The chart makes it clear that certain price categories that have been strongly contributing to outsized headline inflation are likely to peak or even turn deflationary over the next few months. Gasoline and fuel oil inflation is clearly being driven by the trend in crude oil prices, which in our view will likely be flat for the rest of the year. In addition, motor vehicles and parts inflation continues to be driven by the impact of supply-chain shortages on vehicle production. Over the past year, the volume of industrial production of motor vehicle assemblies has averaged just 83% of its pre-pandemic level, which we noted in last month’s report now finally seems to be normalizing (Chart I-11). And while airlines have experienced legitimate cost increases due to rising fuel prices and COVID-related labor shortages, panel 2 of Chart I-11 highlights that real airfares have risen well above their pre-pandemic level. This underscores that a moderation in airfares is quite likely over the coming several months. However, Chart I-10 also highlights that there are several price categories that are less likely to ease quickly. Outsized food and energy services inflation has recently been tied to natural gas prices, given that natural gas is used to generate electricity and is a key element used in the production of fertilizer. Chart I-12 highlights that food inflation has been strongly correlated with the producer price index for pesticide, fertilizer, and other agricultural chemicals, and that there is no sign yet of the latter abating. Despite the fact that global wheat prices have recently been falling, the recent increase in European natural gas prices is likely to exacerbate US food inflation, as fertilizer is used to produce all major planted crops. In addition, European energy insecurity has created an even stronger link between the US and European natural gas markets than what prevailed prior to the Ukrainian war, because of what is likely to be permanently higher LNG demand from Europe. Chart I-11Vehicle And Airfare Inflation Is Likely To Ease Soon
Vehicle And Airfare Inflation Is Likely To Ease Soon
Vehicle And Airfare Inflation Is Likely To Ease Soon
Chart I-12Food Inflation May Remain Elevated For Some Time
Food Inflation May Remain Elevated For Some Time
Food Inflation May Remain Elevated For Some Time
On top of what is likely to be persistent food and energy services inflation, shelter inflation is likely to stay elevated for some time – a point highlighted by my esteemed former colleague, Martin Barnes, in Section 2 of this month’s report. The unemployment rate and house prices are the two main drivers of shelter inflation, and the effect of the latter clearly lags because owner’s equivalent rent is a surveyed measure. The fact that mortgage rates have risen so significantly points to a meaningful slowdown in house price appreciation and possibly even mild deflation, so shelter inflation will eventually slow. The Federal Reserve has made it clear, however, that they are now focused on quickly bringing down consumer prices, even at the cost of a recession. The justification for the Fed’s impatience comes straight from the Modern-Day Phillips Curve, which we discussed in great detail in our January 2021 Special Report.6 Economic theory dictates that inflation should be “normal” when the economy is in equilibrium – defined as economic growth in line with potential growth, no economic/labor market slack, and no supply-side shocks affecting prices. In the minds of many investors, “normal” inflation means the central bank’s target for inflation, but that is not necessarily the case. The experience of the 1970s highlighted that “normal” inflation is the rate that is expected by households and firms, and that the Fed will only succeed at achieving target inflation under normal economic conditions if inflation expectations are consistent with its target. The Fed’s failure to prevent inflation expectations from shifting higher on a structural basis led to two debilitating recessions in the early 1980s, and a prolonged period over which the Fed had to maintain comparatively tight monetary policy. This is a mistake that the Fed does not want to make again. Chart I-13Headline Inflation, Not Core, Is Driving Long-Term Inflation Expectations
Headline Inflation, Not Core, Is Driving Long-Term Inflation Expectations
Headline Inflation, Not Core, Is Driving Long-Term Inflation Expectations
Consistent with that view, Jerome Powell made it clear during the June FOMC meeting press conference that the Fed is now very concerned that long-term household inflation expectations may become unanchored to the upside. Powell implicitly referenced the University of Michigan’s 5-10 year median household inflation expectations survey during the press conference, which we have described in several previous reports as one of the most important macro data series for investors to monitor. The final reading for June came in materially lower than what was suggested by the preliminary report, but they were already at risk of a breakout even before the June release. In addition, Chart I-13 highlights that it is headline inflation (not core) that appears to be the main driver of rising long-term household inflation expectations, which raises a troubling point. If the Fed decides that inflation expectations need to be quickly reined in even at the cost of a higher unemployment rate, that decision implies that it is headline inflation that needs to return rapidly towards the Fed’s target, not just core. Given that some price categories shown in Chart I-10 are likely to be sticky for some time, and that the chart accounted for deviations in headline inflation from 4% (which itself is above the Fed’s target), the implication is that the Fed may have to crowd out demand for goods and services that are comparatively less affected by supply-side constraints. That would be clearly negative for economic growth, and is potentially recessionary in nature. As a final point, it is not just the potential for future economic weakness that concerns us. The US economy was already slowing prior to the Fed’s hawkish pivot and Russia’s invasion of Ukraine, and important indicators for economic activity continue to deteriorate. Chart I-14 highlights that the S&P Global US manufacturing and services PMIs fell meaningfully in June, and Chart I-15 highlights that the Conference Board’s US leading economic indicator continues to deteriorate. In fact, the Conference Board’s LEI has now decreased for three consecutive months, and the bottom panel of Chart I-15 highlights that four consecutive month-over-month declines have all essentially been associated with a recession. 2006 seemingly stands out as an exception to this rule, but given the fact that the housing market downturn began two years before the recession officially started, we simply regard this as an early recessionary signal rather than a false one. Chart I-14The US Is Losing Economic Momentum
The US Is Losing Economic Momentum
The US Is Losing Economic Momentum
Chart I-15The Conference Board's LEI May Soon Send A Recessionary Signal
The Conference Board's LEI May Soon Send A Recessionary Signal
The Conference Board's LEI May Soon Send A Recessionary Signal
No Help From Europe Or China An overweight stance towards global equities might still be warranted in the face of a significant slowdown in US economic activity if economic growth in Europe or China were accelerating. However, the European outlook has been strongly tied to natural gas flows from Russia since the invasion of Ukraine, which tightened meaningfully in June in response to Europe’s oil ban, the looming expansion of NATO, and Europe’s success at replenishing its amount of natural gas in storage. Russia has not fully weaponized its natural gas exports and its actions so far have fallen well short of a complete cutoff, but prices have risen close to 70% over the past month, forcing Germany to trigger the alert level of its emergency gas plan. Aside from the negative impact that higher natural gas prices will have on headline inflation globally, this is obviously incrementally negative for European economic activity. Chart I-16 highlights that the German IFO business climate indexes have led the S&P Global Germany PMI lower over the past few months, and that they imply further manufacturing weakness. And while the services climate index for Germany ticked higher, it remains meaningfully below the levels that prevailed last summer and implies a deterioration in German services activity over the coming few months. In China, we see no compelling signs of a sustainable pickup in economic activity that will provide a ballast to slowing growth in the DM world. We have seen a bounce back in some activity indicators following the significant easing of restrictions in Shanghai and Beijing (Chart I-17). These indicators, however, are still quite weak, and it is likely that China will experience significant further COVID outbreaks over the coming 6-12 months. Chart I-16Europe's Economy Is Likely To Slow Further
Europe's Economy Is Likely To Slow Further
Europe's Economy Is Likely To Slow Further
Chart I-17China's Post-Lockdown 'Recovery' Remains Tepid
China's Post-Lockdown 'Recovery' Remains Tepid
China's Post-Lockdown 'Recovery' Remains Tepid
While Chinese stocks have been rallying in absolute terms over the past few weeks, Chart I-18 highlights that this is essentially the only positive market-based signal about the pace of economic activity in China. The chart highlights that our market-based China Growth Indicator has experienced a renewed down leg, and that the diffusion index never rose above the boom/bust line earlier this year. The recent decline in industrial metals prices is also not a positive market-based signal for Chinese economic activity (Chart 19). Some investors have argued that weak metals prices reflect growth concerns outside of China, but even if that is the case, it implies that China’s reopening will not be forceful enough to offset slowing global ex-China growth. Chart I-18Market-Based Signals Are Not Pointing To An Improvement In Chinese Economic Activity
Market-Based Signals Are Not Pointing To An Improvement In Chinese Economic Activity
Market-Based Signals Are Not Pointing To An Improvement In Chinese Economic Activity
Chart I-19Metals Prices Are Now Falling, Highlighting Mounting Global Growth Fears
Metals Prices Are Now Falling, Highlighting Mounting Global Growth Fears
Metals Prices Are Now Falling, Highlighting Mounting Global Growth Fears
Has The US Equity Market Already Priced In A Recession? One very important question for investors to answer is how much further downside is likely to occur for US equities in the event of a US recession. At its worst point in mid-June, the S&P 500 fell close to 24% from its early January high, and many investors have since questioned whether the US equity market is already priced for a potential contraction in output. Chart I-20The S&P 500 Is Not Currently Priced For A US Recession
July 2022
July 2022
We disagree with this perspective, and believe that the S&P 500 would fall close to 3100 in a typical recession scenario. Chart I-20 presents a range of estimates for the S&P 500 based on a Monte Carlo approach, using what we believe are feasible ranges for the US equity risk premium, real 10-year government bond yields, and the extent of the decline in 12-month forward earnings per share. The chart shows that the equity market only has a positive return at the 5th percentile, which can be interpreted as just a 5% chance that the US equity market has already priced in the impact of a recession. Charts I-21 and I-22 highlight the range of possible outcomes that we used when modeling the likely decline in stock prices in a recession scenario. We assume that the equity risk premium, defined here as the difference between the S&P 500 12-month forward earnings yield and 10-year TIPS yields, rises on average to its early-March level in the wake of Russia’s invasion of Ukraine. We assume that both 10-year nominal Treasury yields and 10-year breakeven inflation rates fall to 2%, reflecting an expectation that 10-year TIPS yields will not return to negative territory in a recessionary scenario. Finally, we expect that S&P 500 forward EPS will decline by 15% from current levels, which is in line with the historical average decline in 12-month trailing operating EPS during recessions. Chart I-21We Do Not Expect Real Bond Yields To Fall Back Into Negative Territory In A Typical Recession Scenario
We Do Not Expect Real Bond Yields To Fall Back Into Negative Territory In A Typical Recession Scenario
We Do Not Expect Real Bond Yields To Fall Back Into Negative Territory In A Typical Recession Scenario
Chart I-22We Expect Earnings To Decline Between 10-20% In A Recession
We Expect Earnings To Decline Between 10-20% In A Recession
We Expect Earnings To Decline Between 10-20% In A Recession
One key takeaway from our analysis is that the likely recessionary equity market decline projected by our approach is fairly close to our estimate of the likely decline in earnings. One potential pushback against our view that earnings will fall in line with what usually occurs during recessions is the fact that nominal revenue growth may only mildly contract or may not contract at all in a recession that is occurring due to high rates of inflation (and thus higher prices charged by firms). Chart I-23 highlights that 12-month trailing S&P 500 sales per share growth never turned negative in the 1970s, even following the 1970 and 1974 recessions. Chart I-23Revenue Growth Did Not Contract In The 1970s, And May Not Contract Significantly If A Recession Occurs Today...
Revenue Growth Did Not Contract In The 1970s, And May Not Contract Significantly If A Recession Occurs Today...
Revenue Growth Did Not Contract In The 1970s, And May Not Contract Significantly If A Recession Occurs Today...
There are two counterpoints to this argument. First, the current risk of a recession mostly stems from the Fed’s determination not to repeat the mistakes that it made during the 1970s, meaning that inflation expectations are unlikely to rise to the level that they did during that period in advance of a recession. That implies that actual inflation, and thus corporate pricing power, will come down significantly during a recession. Second, even in a scenario in which a recession occurs and S&P 500 revenue growth contracts less aggressively than it has during previous recessions, Chart I-24 highlights that the mean-reversion risks to earnings from falling profit margins are quite high. The chart shows that even if profit margins were merely to return to their pre-pandemic levels during a recession (which would actually be a comparatively mild decline given the historical behavior of margins during recessions), it would imply close to a 20% contraction in earnings if sales per share growth were flat. Given this, we feel that our assumption of a 10-20% decline in earnings per share in a recessionary scenario is reasonable. Chart I-24But Profit Margins Are At Great Risk Of A Significant Decline If The Economy Contracts
But Profit Margins Are At Great Risk Of A Significant Decline If The Economy Contracts
But Profit Margins Are At Great Risk Of A Significant Decline If The Economy Contracts
There is another important takeaway from our analysis, which is that the decline in bond yields that will occur in a recessionary scenario will likely be more than offset by a rise in the equity risk premium. Another potential pushback against our view that the US equity market has already priced in a recession is focused on our assumption that the 10-year US Treasury yield will only fall back to 2%, and that real 10-year yields will not return to negative territory. For some investors, this assumption seems far too high, given the structural decline in long-maturity bond yields over the past decade and the fact that the 10-year yield stood below 2% at the beginning of the year when the odds of a recession were lower than they are today. In response to this, we offer three points for structurally-bullish bond investors to consider. The first is that the decline in the nominal 10-year US Treasury yield to 0.5% in 2020 was extremely irregular and it occurred because of the extent of the essentially unprecedented economic weakness wrought by the pandemic. This is absolutely the wrong yield benchmark to use in a typical recession scenario, because the Fed’s response to the recession will be much less aggressive. The second point is related to the first, in that negative real 10-year government bond yields have been heavily driven by the secular stagnation narrative and the general view that the natural/neutral rate of interest has permanently fallen. We agree that the neutral rate of interest fell for a time following the global financial crisis, but we believe strongly that it rose in the latter half of the last economic expansion as US households aggressively deleveraged their balance sheets. Academic estimates of R-star, such as that derived from the previously popular (but now discontinued) Laubach-Williams model, continued to point to a low neutral rate from 2015-2019 because of the deflationary impact of an energy-driven decline in long-term inflation expectations on actual inflation, a factor that is clearly no longer present. Chart I-25We Doubt That The Fed Will Resort To QE When The Next Recession Occurs
We Doubt That The Fed Will Resort To QE When The Next Recession Occurs
We Doubt That The Fed Will Resort To QE When The Next Recession Occurs
Finally, we agree that the existence of the Fed’s asset purchase program has likely had some impact on the 10-year term premium over the past decade. We doubt that the Fed would resort to QE as a monetary policy tool in response to a conventional recession, implying that the term premium will not fall as low as it has over the past decade when growth slowed or contracted. Chart I-25 highlights one important reason for this. Since 2008, the Fed’s use of asset purchases has been part of a strategy to ease monetary policy further when the policy rate had already fallen to zero, to meet its dual mandate of maximum employment and price stability. The chart highlights that even just prior to the pandemic, a persistent gap existed between the headline and core PCE deflator and the level that would have prevailed if both deflators had grown at a 2% annual rate since the onset of the 2008 recession. The chart makes it clear that this gap will completely disappear within the next 12 months for both the headline and core deflator, if the recent pace of change in prices is sustained. In effect, Chart I-25 highlights that the entire post-GFC missed inflation-target era is almost over, which severely undercuts the idea that the Fed will resort to QE as a monetary policy tool in a recession scenario unless the contraction is very severe as it was in 2008 and 2020. We doubt that this will be the case if a recession does occur, implying that both a deeply negative term premium and a significant decline in the 5-year/5-year forward bond yield in a typical recession scenario is unlikely. Investment Conclusions Wayne Gretsky’s famous quotation, that he “skate[s] to where the puck is going, not where it has been” is often invoked by BCA strategists. Successful active investing requires anticipation rather than reaction, and it is legitimate for investors to ask whether downgrading risky assets at the current juncture represents the latter rather than the former. We are cognizant of that risk, but we are also mindful of the importance of capital preservation. When we wrote our annual outlook last year, we believed fairly confidently that inflation would peak and specifically that supply-side inflation would wane. We still believe that pandemic-related effects on consumer prices will eventually dissipate, and it is still possible that inflation is in the process of peaking. Recent evidence, however, about the pace of price advances, the clear impact that high inflation is having on real wage growth, and the Fed’s desire to see consumer prices fall quickly back toward its target, means that the cyclical economic outlook is now highly dependent on the speed at which prices normalize – not just whether it will occur. To us, that implies that investors need to have a high-conviction view that supply-side inflation will normalize soon in order to stay overweight risky assets, and that the Fed will look through elevated housing-related inflation that is likely to persist for several months. At least in the case of supply-side inflation, we think normalization is probable but we no longer have high conviction about the speed of adjustment. As such, we recommend that investors maintain no more than a neutral stance towards stocks versus bonds in a global multi-asset portfolio. We also recommend that investors increase their allocation to government bonds within a global fixed income portfolio (to overweight), at the expense of corporate bonds, as part of an overall shift towards more defensive positions. In terms of other important asset class allocations, we recommend the following: Within a global equity portfolio, maintain a neutral regional allocation, a neutral stance toward cyclicals versus defensives, and a neutral stance towards small-cap stocks versus their large-cap peers. Modestly favor value stocks over growth stocks, as most of the outsized outperformance of growth stocks during the pandemic has already reversed. Within a fixed-income portfolio, a modestly short stance is warranted over the coming 6- to 12-months. Extremely stretched technical and valuation conditions point to a bearish view towards the US dollar over the coming 6- to 12-months, but USD will likely remain well-bid over the nearer-term. We are only likely to upgrade our cyclical USD call in a scenario in which we recommend underweighting global equities within a multi-asset portfolio. As noted above, financial markets rarely trend sideways over 6-to-12 month periods. We regard a neutral global asset allocation stance as a temporary stepping stone to either a further downgrade of risky assets to underweight or an increase in risky asset exposure back to a high-conviction overweight. Thus, additional changes to our recommended cyclical allocation may occur over the coming few months, in response to the incoming data and our assessment of the likely implications for monetary policy. Stay tuned! Jonathan LaBerge, CFA Vice President The Bank Credit Analyst June 30, 2022 Next Report: July 28, 2022 II. Inflation Whipsaw Ahead Dear Client, This month’s Special Report has been written by Martin Barnes, BCA’s former Chief Economist. Martin, who retired from BCA Research last year after a long and illustrious career, discusses the long-run outlook for inflation. The views expressed in this report are his, and may not be consistent with those of the Bank Credit Analyst or other BCA Research services. But Martin’s warning of future stagflation is sobering, and I trust you will find his report both interesting and insightful. Jonathan LaBerge, CFA The Bank Credit Analyst Overly stimulative policies meant that inflation was set to rise even before the disruptions caused by the pandemic and Ukraine conflict. Inflation should decline sharply over the coming year in response to weaker economic growth and an easing in supply problems. But it will be a temporary respite. Central banks will not have the stomach to keep policy tight enough for long enough to squeeze inflation out of the system. Price pressures will return as economies bottom and the environment will become one of stagflation. Financial assets will rally strongly when inflation fears subside but subsequent stagflation will not be bullish for markets. Former Federal Reserve Chairman Alan Greenspan once defined price stability as existing when “households and businesses need not factor expectations of changes in the average level of prices into their decisions”. Until recently, that state of affairs was the case for much of the past 30 years and for many, inflation was quiescent during their entire working lives. But inflation is now back as a huge issue and there is massive debate and uncertainty about whether it will be a temporary or lasting problem. I lean toward the latter view. Major changes in the economic and/or financial environment more often are identified in hindsight than in real time. It is easier to attribute large trend deviations to temporary factors than to make bold predictions about structural shifts. Obviously, the pandemic and conflict in Ukraine have had a significant impact on the near-term inflation picture via massive supply-side disruptions and represent temporary events. Thus, inflation will retreat from current elevated levels as those disruptions diminish. But the conditions for higher inflation were already in place before those two unfortunate events occurred. Specifically, central banks have been erring on the side of stimulus for several years and they will find it extremely difficult, if not impossible, to put the inflation genie back into the bottle. Inflation has moved from a non-issue to the most important factor driving markets. Over the next year, the next big surprise might be how fast inflation retreats and investors and policymakers will then breathe a big sigh of relief. However, this will prove to be a temporary respite because it will not take long for inflation to move back up and remain stubbornly above central bank targets. In other words, a whipsaw is in prospect over the next few years as inflation goes from up, to down, and to up again. The Current Inflation Problem The biggest increases in consumer prices have occurred in areas most affected by supply problems, with energy attracting the most attention. Nevertheless, in most countries, inflation has risen across the majority of goods and services. The core inflation rate (i.e. consumer prices excluding food and energy) in the G7 economies climbed from 2% to 4.8% between April 2021 and April 2022 (Chart II-1). Meanwhile, the Cleveland Fed’s trimmed mean measure of US consumer price inflation has spiked dramatically higher, consistent with a broad-based acceleration in inflation.7 The rise in underlying inflation is a bigger problem in the US, UK and Canada than in Japan or the Euro Area. Chart II-2 shows current core inflation rates relative to the target rate of 2% pursued by most central banks. That geographical divergence will be touched on later and in the meantime, the focus will be on the US situation. Chart II-1A Broad-Based Pickup In Inflation
A Broad-Based Pickup in Inflation
A Broad-Based Pickup in Inflation
Chart II-2The US, UK And Canada Have A Bigger Inflation Problem
July 2022
July 2022
The latest US inflation data for a range of goods and services is shown in Table II-1. The table shows the three- and six-month annualized changes in prices because 12-month rates can be affected by a base effect given the impact of pandemic-related shutdowns and disruptions a year ago. Also, a comparison of the three- and six-month rates shows if momentum is building or fading. The trends are not encouraging in that momentum has accelerated, not diminished in many key areas. Table II-1Selected Inflation Rates In The US CPI
July 2022
July 2022
Even if the data show a moderation in core inflation in the months ahead, it is important to note that rent inflation – the CPI component with the biggest weight – is seriously underestimated. This is one of the few items where prices are collected with a lag and real estate industry reports highlight that rent inflation is running at double-digit rates in the major cities. According to one report, average rents nationally increased by more than 25% in the year to May.8 The CPI data will eventually catch up with reality, providing at least a partial offset to any inflation improvements in other areas. Another problem for inflation is the acceleration in wage growth against the backdrop of an unusually tight labor market. Currently, the number of unfilled vacancies is almost twice the number of unemployed and it is thus no surprise that wage growth has picked up sharply (Chart II-3). The Atlanta Fed’s measure of annual wage inflation has risen above 6%, its highest reading since the data began in 1997. Wage growth is unlikely to suddenly decline absent a marked rise in the unemployment rate. There is much debate about whether the US economy is on the verge of recession, but let’s not get bogged down in semantics. Regardless of whether the technical definition of recession is met (at least two consecutive quarters of negative GDP growth), the pace of activity is set to slow sharply. Plunging consumer and business confidence, contracting real incomes and a peaking in housing activity all point to a significant weakening in growth, even if the labor market stays healthy (Chart II-4). Chart II-3A Very Tight US Labor Market
A Very Tight US Labor Market
A Very Tight US Labor Market
Chart II-4The US Economy Is In Trouble
The US Economy is in Trouble
The US Economy is in Trouble
Softer economic growth eventually will take the edge off inflationary pressures in many goods and services. Combined with an easing in supply-side disruptions, the inflation rate is certain to decline in the coming year, even if oil prices move higher in the short run. Currently, the Fed is talking tough about dealing with inflation and there is little doubt that further rate hikes are on the way. However, policymakers will have little stomach for inflicting enough economic pain to completely squeeze inflation out of the system. Once there are clear signs of a significant economic slowdown, the Fed will back off quickly. What Causes Inflation Anyway? Economics 101 teaches that prices are determined by the interaction of supply and demand. If the demand for a good or service exceeds supply, then prices will rise to bring things back into balance. Seems simple enough but, unfortunately, this leaves many unanswered questions. How much must prices rise and for how long in order to restore balance? What if there are structural impediments to supply? What if there are monopolies in key commodities or services? What if policy interferes with the operation of market-clearing solutions? And, finally, what measure of inflation should we be looking at? Chart II-5Inflation Is A 'Modern' Issue
Inflation is a 'Modern' Issue
Inflation is a 'Modern' Issue
For much of economic history, deflation was just as prevalent as inflation, with the latter only being a problem during periods of war (Chart II-5). As the pre-WWII world pre-dated fiat money, automatic stabilizers (e.g. the welfare state), and counter-cyclical fiscal policy, economies were prone to regular depressions that served to wash out financial and economic excesses and any inflationary pressures. But those days are long gone and free market forces should not be expected to keep inflation under wraps. I rather like the simple explanation of inflation’s roots as being “too much money chasing too few goods”. In that sense, the control of inflation lies firmly at the door of central banks. In the “old days” (i.e. before the 1990s), it was possible to use the growth in the money supply to gauge the stance of policy because there was a fairly stable and predictable relationship between monetary and economic trends. That all ended when financial deregulation and the explosion in non-bank financial activities meant that monetary trends ceased to be a reliable indicator of economic growth and inflation. As a result, the Fed stopped setting monetary growth targets more than 20 years ago and since then, money supply data has rarely been mentioned in FOMC discussions. Chart II-6A Simple Measure Of The Monetary Stance
A Simple Measure of the Monetary Stance
A Simple Measure of the Monetary Stance
Fortunately, all is not lost. The gap between the federal funds rate and nominal GDP growth is a reasonably good proxy for the stance of monetary policy. Conditions are easy when rates are persistently below GDP growth and vice versa when they are above. As can be seen in Chart II-6, rates were below GDP growth during most of the 1960s and 1970s, a period when inflation rose sharply. And inflation fell steadily in the 1980s into the first half of the 1990s when the Fed kept interest rates above GDP growth. And look at what has happened in the past decade: rates have been significantly below GDP growth, suggesting an aggressively easy monetary stance. It was only a matter of time before inflation picked up, even without the recent supply-side disruptions. The FOMC’s latest projections show long-run growth of 3.8% in nominal GDP while the fed funds rate is expected to average only 2.5%. That implies a continued accommodative stance, yet inflation is forecast to be in line with the 2% target. That all seems very unlikely. Fed policymakers spend a lot of time trying to figure out the level of the equilibrium real interest rate – the level consistent with steady non-inflationary economic growth. It would be very helpful to have this number but coming up with an accurate measure is a largely futile exercise. It cannot be measured empirically and its estimation requires a lot of assumptions, explaining why there is no broad agreement on what the right number is. I think there is a case for the simpler approach of using the nominal growth in GDP as a proxy for where rates should be in normal circumstances. As noted above, that suggests monetary policy was excessively accommodative for an extended period. If US Policy Was Too Easy, Why Was Inflation Low For So Long? The Fed’s preferred measure of underlying inflation is the change in the personal consumption deflator, excluding food and energy. In the 25 years to 2019, inflation by this measure averaged only 1.7%, compared to the Fed’s desired level of 2%. Thus, even though the level of interest rates implied very accommodative policy over that period, inflation remained tame. This leads to an important caveat. The stance of monetary policy plays the key role in driving inflation, but it is not everything. Offsetting forces on inflation (in both directions) can mute or even swamp the impact of policy. There were several disinflationary forces in operation during the past 25 years. Specifically: In the second half of the 1990s, the explosive growth of the internet and accompanying boom in technology spending led to a marked pickup in productivity growth. The entry of China into the World Trade Organization at the end of 2001 unleashed a wave of offshoring and downward pressure on traded goods prices. A series of deflationary shocks hit the US and global economy including the 1998 financial crisis in South-East Asia and Russia, the bursting of the tech bubble after 2000, and of course the global financial meltdown in 2007-09. Unstable economic conditions undermined labor’s bargaining power, keeping a tight lid on wage growth. This was highlighted by the dramatic decline in labor’s share of income after 2000. Importantly, the above forces are no longer in place and in some cases are reversing. The key technological advances of the past decade have not been particularly good for productivity. Indeed, one could argue that the activities of most so-called FANG stocks – especially those involved in social media - have had a negative impact on productivity. Time spent on FaceBook, Twitter and Netflix do not have obvious benefits for increased economic efficiency. Chart II-7Globalization In Retreat
Globalization in Retreat
Globalization in Retreat
Even before the pandemic’s impact on supply chains, there were signs that globalization had peaked (Chart II-7). Indeed, BCA first suggested in 2014 that globalization was running out of steam. More recently, the interruption to supply chains has highlighted the downside of relying excessively on overseas production for key goods such as semi-conductors and pharmaceuticals. Onshoring rather than offshoring will become more common with higher prices being the cost for greater control over supply. Globalization is not dead, but, at the margin, it no longer is a powerful source of disinflation. US import prices from China are back to their highest level in a decade after falling steadily during the eight years to 2020. The inflationary impact of the pandemic and the war in Ukraine via supply-side disruptions are more than offsetting any disinflationary effects of softer economic growth. In other words, they have represented stagflationary rather than deflationary shocks. Finally, with regard to income shares, the pendulum has swung more in favor of labor. Demographic trends (e.g. slow growth in the working-age population) suggest that the labor market will remain relatively tight in the years ahead, notwithstanding short-term weakness as the economy slows. Profit margins are likely to weaken and labor’s share of income will rise. The bottom line is that easy money policies will no longer be offset by a number of powerful external forces that served to keep consumer price inflation under wraps in the pre-pandemic period. And this raises another important point. If monetary policy is too easy, then it will show up somewhere, even if consumer price inflation is under control. There Is More Than One Kind Of Inflation Inflation most commonly refers to the change in the prices of consumer goods and services. That is understandable because consumer spending accounts for more than half of GDP in the major developed economies (and almost 70% in the US). And because consumers are the ones who vote, it is the inflation rate that politicians care most about. However, there are other kinds of inflation. If there are structural impediments to increased consumer prices, then excessively easy monetary policy most likely will show up in higher asset prices. This is a very different kind of inflation because it is welcomed by the owners of assets and by politicians. Nobody is happy to face higher prices for the goods and services they buy, but asset owners love the wealth-boosting effect of higher prices for homes and shares. Consumer inflation may have been subdued in the pre-pandemic decade, but the same is not true for asset prices. During the period that the Fed ran accommodative policies, there were several periods of rampant asset inflation such as the tech stock bubble of the late 1990s, the housing bubble of the 2000s, and the bond bubble of 2016-2020. And both equity and home prices surged in response to monetary stimulus triggered by the pandemic. Central banks may fret about the potential financial stability implications of surging asset prices, but in practice they do not act to curb them. Policymakers argue that it is hard to determine when an asset bubble exists and even when one is obvious, monetary policy is a crude tool to deal with it. If rising asset prices occur alongside an economy that is characterized by stable growth and moderate inflation, then acting to burst a bubble could inflict unnecessary economic damage. That is an understandable position, but it means ignoring the longer-term problems that occur when bubbles inevitably burst. This was highlighted by the economic and financial chaos after the US housing bubble burst in 2007. The reality is that central banks have been forced to rely more heavily on asset inflation as a source of monetary stimulus. An easing in monetary policy affects economic conditions in three primary ways: boosting credit demand and supply, raising asset prices, and lowering the exchange rate.9 Historically, the credit channel was by far the most important. BCA has written extensively about the Debt Supercycle and the role of monetary policy in fueling ever-rising levels of private sector indebtedness (see the Appendix for a brief description of the Debt Supercycle). Chart II-8No Releveraging Cycle In Household Debt
No Releveraging Cycle in Household Debt
No Releveraging Cycle in Household Debt
The environment changed dramatically after the 2007-09 financial meltdown. The collapse of the credit-fueled housing bubble drove a stake through the heart of the household sector’s love affair with debt. The ratio of household debt to income peaked in early 2009 and ten years later it was back to the levels of 2001 (Chart II-8). Even an extended period of record low interest rates has failed to trigger a new leveraging cycle. If the Fed can’t persuade consumers and businesses to fall back in love with debt, then it must rely on the other two transmission channels for monetary policy – asset prices and the exchange rate. And the Fed really has limited control over the latter channel given that it also depends on the actions of other central banks. The deleveraging of the household sector in the post-2009 period could have been very bearish for the economy, but the Fed’s easy money policies underpinned the stock market, allowing household net worth to revive. There was an explosive rise in household net worth in 2020-21 as surging house prices added to stock market gains. Between end-2019 and end-2021, the household sector’s direct holdings of equities plus owner’s equity in real estate increased in value by around $20 trillion, equal to more than one year’s personal disposable income. The recent decline in equity prices has reversed some of the gains, but net worth remains elevated by historical standards. The bottom line is that it was wrong to suggest that the Fed’s accommodative stance did not create inflation. Consumer price inflation was tame in the pre-pandemic period, but there was lots of asset inflation and that gathered pace in 2020 and 2021. There was always going to be some leakage of this into more generalized inflation but this was accelerated by the double whammy of the supply disruptions caused by the pandemic and the Ukraine war. The Strange Case Of Japan If higher inflation in the US has seemed inevitable, how can one explain the situation in Japan? In contrast to other developed countries, Japan’s annual core inflation rate was only 0.2% in May. While this was an increase from the average -1.3% rate in the prior six months, it is impressive given the country’s continued highly stimulative monetary policy and the same exposure to supply disruptions as elsewhere. Most importantly, Japan has suffered structural deflation for so long that inflation expectations are totally dormant for both consumers and businesses. In other words, raising prices is seen as a desperate measure and something to be avoided. Japan’s poor demographics may also have played a role. A sharply declining labor force and rapidly aging population are disinflationary rather than inflationary influences and help reinforce the corporate sector’s reluctance to raise prices. While Japan seems an outlier, it is worth noting that core inflation also has remained relatively subdued in many European countries. For the overall Euro area, the latest core inflation rate is 3.8%, well below that of the US and UK. Two common features of the higher inflation countries are that they tended to have more aggressively-easy fiscal policies in recent years and greater asset inflation – especially in real estate. Unfortunately, inflation expectations and business pricing behavior in the US and other Anglo-Saxon economies have not followed Japan’s example. Employees have become more aggressive in demanding higher wages, and most companies have no problem in passing on higher costs to their customers. The UK is facing a wave of public sector strikes over pay the likes of which have not been seen for decades. The Outlook Chart II-9A Peaking In Supply Problems?
A Peaking in Supply Problems?
A Peaking in Supply Problems?
Inflation may prove sticky over the next few months, but as noted earlier, it should move significantly lower over the coming year. Crude oil prices have risen by around 75% in the past year and that pace of rise cannot be sustained. Meanwhile, while shipping rates remain historically high, they are down sharply from earlier peaks (Chart II-9). Together with a revival in Chinese exports, this suggests some easing in supply chain problems. And as mentioned above, the pace of economic activity is set to slow sharply. But a return to pre-pandemic inflation levels is not in the cards. The Fed currently is talking tough and further rate hikes are on the way. But the tightening will end as soon as it becomes clear that the economy is heading south. A deep recession is not likely because there are not the worrying imbalances such as excessive consumer debt or inventories that typically precede serious downturns. However, policymakers will not take any risks and policy will return quickly to an accommodative stance, even though inflation is unlikely to return to the desired 2% level. On a positive note, inflation may be the highest in 40 years in many countries, but we are not facing a return to the destructive high-inflation environment of the 1970s. Inflation back then was institutionalized and a self-feeding cycle of higher wages and rising prices was deeply embedded. I was working as an economist for BP in London in the 1970s and remember receiving large quarterly pay rises just to compensate for inflation. In the absence of inflation-accounting practices, companies seriously underestimated the destruction that inflation was creating to balance sheets and profitability, making them complacent about the problem. Moreover, there were not the same global competitive pressures that exist today. Inflation in the US likely will form a new base of 3% to 4% over the medium term, with occasional fluctuations to 5% or above. An environment of stagflation is in prospect: growth will not be weak enough to suppress inflation and not strong enough to allow the Fed to maintain a restrictive stance. This puts the Fed in a difficult spot as it will be reluctant to admit defeat by raising the inflation target from its current 2%, even though that level will be out of reach in practical terms. A counter view is that I am too pessimistic by underestimating the disinflationary effects of technological advances. A sustained improvement in productivity would certainly help lower inflation but how likely is this? Technological advances are occurring all the time, but in recent years they largely have been incremental in nature and it is hard to think of any new breakthrough productivity-enhancing technologies. There is a difference between new technologies that simply represent better ways to do existing tasks (3D printing would fall into that category) and general purpose technologies that completely change the way economies operate (e.g. electricity and the internet). While businesses are still exploiting the benefits of the digital world, we await innovations that will trigger a new sustained upsurge in productivity. A game changer would be the development of unlimited cheap energy (cold fusion?) but that does not seem likely any time soon. Nevertheless, I will keep an open mind about the potential for productivity to surprise on the upside, despite my current skepticism. Chart II-10Inflation Expectations Spike Higher
Inflation Expectations Spike Higher
Inflation Expectations Spike Higher
What does all this mean for the markets? Not surprisingly, shifts in market expectations for future inflation are highly correlated with the current rate and have thus spiked higher in recent months, hurting both bonds and stocks (Chart II-10). Obvious inflation hedges would be inflation-protected bonds and resources, but neither group currently is attractively priced. The good news is that the current panic about inflation is setting the scene for a buying opportunity in both stocks and bonds. The exact timing is tricky to predict but both stocks and bonds will rally strongly later this year when inflation expectations retreat as it becomes clear that the economy is weakening and the Fed softens its hawkish tones. The bad news is that this bullish phase will not last much more than a year because a re-emergence of inflationary pressures will bring things back to earth. The long-run outlook is one of stagflation and that will be a tough environment for financial assets. Martin H. Barnes Former Chief Economist, BCA Research mhbarnes15@gmail.com Appendix: A Primer On The Debt Supercycle The Debt Supercycle is a description of the long-term decline in U.S. balance-sheet liquidity and rise in indebtedness during the post-WWII period. Economic expansions have always been associated with a buildup of leverage. However, prior to the introduction of automatic stabilizers such as the welfare state and deposit insurance, balance-sheet excesses tended to be fully unwound during economic downturns, albeit at the cost of severe declines in activity. The pain of the Great Depression led governments to intervene to smooth out the business cycle, and their actions were given legitimacy by the economic theories of John Maynard Keynes. Fiscal and monetary reflation, together with the introduction of automatic stabilizers such as unemployment insurance, were successful in preventing the frequent depressions that plagued the pre-WWII economy, but the downside was that balance-sheet imbalances and financial excesses built up during each expansion phase were never fully unwound. Periodic "cyclical" corrections to the buildup of debt and illiquidity occurred during recessions, but these were never enough to reverse the long-run trend. Although liquidity was rebuilt during a recession, it did not return to its previous cyclical high. Meanwhile, the liquidity rundown during the next expansion phase established new lows. These trends led to growing illiquidity, and vulnerability in the financial markets. The greater the degree of illiquidity in the economy, the greater is the threat of deflation. Thus, the bigger that balance-sheet excesses become, the more painful the corrective process would be. So, the stakes became higher in each cycle, putting ever-increasing pressure on the authorities to reflate demand, by whatever means were available. The Supercycle process was driven over time by the building tension between rising underlying deflationary risks in the economy, and the ability of policymakers to create inflation. The Supercycle reached an important inflection point in the recent economic and financial meltdown, with the authorities reaching the limit of their ability to get consumers to take on more leverage. This forced the government to leverage itself up instead, representing the Debt Supercycle's final inning. III. Indicators And Reference Charts BCA’s equity indicators paint a bearish picture for stock prices. Our monetary indicator is now at its weakest in almost three decades and our valuation indicator highlights that stocks are still overvalued, albeit less so than they were last year. Meanwhile, both our sentiment and technical indicators have now broken down very significantly, and are not yet providing a contrarian buy signal. The odds of a US recession over the next 12 months have recently risen, and we now recommend a neutral stance for stocks versus bonds over the coming year. Forward earnings are no longer being significantly revised up, but bottom-up analysts’ expectations for earnings are still too rosy. Although earnings growth is still likely to be positive over the coming year if a US recession is avoided, it will be in the mid-to-low single-digits. Within a global equity portfolio, we recommend a neutral stance on cyclicals versus defensives, small caps versus large, and a neutral stance on regional equity allocation. Within a fixed-income portfolio, investors should stay modestly short duration. The increase in commodity prices that followed Russia’s invasion of Ukraine has cooled, and prices are now rolling over significantly on the back of global growth concerns. Our composite technical indicator has dropped meaningfully, indicating that commodities are now no longer overbought. Our base-case view is that oil prices have peaked, but there some risk to that view given the current geopolitical situation. In addition, the recent rise in European natural gas prices suggests that global food inflation could remain elevated, given that natural gas is used in the production of fertilizer. We remain structurally bullish on industrial metals, but metals prices are likely to decline further until recessionary concerns abate. US and global LEIs have rolled over significantly and are now edging towards negative territory. The Conference Board’s LEI has now decreased for three consecutive months, and four consecutive month-over-month declines have historically been associated with a recession. Our global LEI diffusion index has bottomed, but we are not convinced that this heralds a major upturn in the LEI itself. EQUITIES: Chart III-1US Equity Indicators
US Equity Indicators
US Equity Indicators
Chart III-2Willingness To Pay For Risk
Willingness To Pay For Risk
Willingness To Pay For Risk
Chart III-3US Equity Sentiment Indicators
US Equity Sentiment Indicators
US Equity Sentiment Indicators
Chart III-4US Stock Market Breadth
US Stock Market Breadth
US Stock Market Breadth
Chart III-5US Stock Market Valuation
US Stock Market Valuation
US Stock Market Valuation
Chart III-6US Earnings
US Earnings
US Earnings
Chart III-7Global Stock Market And Earnings: Relative Performance
Global Stock Market And Earnings: Relative Performance
Global Stock Market And Earnings: Relative Performance
Chart III-8Global Stock Market And Earnings: Relative Performance
Global Stock Market And Earnings: Relative Performance
Global Stock Market And Earnings: Relative Performance
FIXED INCOME: Chart III-9US Treasurys And Valuations
US Treasurys And Valuations
US Treasurys And Valuations
Chart III-10Yield Curve Slopes
Yield Curve Slopes
Yield Curve Slopes
Chart III-11Selected US Bond Yields
Selected US Bond Yields
Selected US Bond Yields
Chart III-1210-Year Treasury Yield Components
10-Year Treasury Yield Components
10-Year Treasury Yield Components
Chart III-13US Corporate Bonds And Health Monitor
US Corporate Bonds And Health Monitor
US Corporate Bonds And Health Monitor
Chart III-14Global Bonds: Developed Markets
Global Bonds: Developed Markets
Global Bonds: Developed Markets
Content Chart III-15Global Bonds: Emerging Markets
Global Bonds: Emerging Markets
Global Bonds: Emerging Markets
CURRENCIES: Chart III-16US Dollar And PPP
US Dollar And PPP
US Dollar And PPP
Chart III-17US Dollar And Indicator
US Dollar And Indicator
US Dollar And Indicator
Chart III-18US Dollar Fundamentals
US Dollar Fundamentals
US Dollar Fundamentals
Chart III-19Japanese Yen Technicals
Japanese Yen Technicals
Japanese Yen Technicals
Chart III-20Euro Technicals
Euro Technicals
Euro Technicals
Chart III-21Euro/Yen Technicals
Euro/Yen Technicals
Euro/Yen Technicals
Chart III-22Euro/Pound Technicals
Euro/Pound Technicals
Euro/Pound Technicals
COMMODITIES: Chart III-23Broad Commodity Indicators
Broad Commodity Indicators
Broad Commodity Indicators
Chart III-24Commodity Prices
Commodity Prices
Commodity Prices
Chart III-25Commodity Prices
Commodity Prices
Commodity Prices
Chart III-26Commodity Sentiment
Commodity Sentiment
Commodity Sentiment
Chart III-27Speculative Positioning
Speculative Positioning
Speculative Positioning
Chart III-28US And Global Macro Backdrop
US And Global Macro Backdrop
US And Global Macro Backdrop
ECONOMY: Chart III-29US Macro Snapshot
US Macro Snapshot
US Macro Snapshot
Chart III-30US Growth Outlook
US Growth Outlook
US Growth Outlook
Chart III-31US Cyclical Spending
US Cyclical Spending
US Cyclical Spending
Chart III-32US Labor Market
US Labor Market
US Labor Market
Chart III-33US Consumption
US Consumption
US Consumption
Chart III-34US Housing
US Housing
US Housing
Chart III-35US Debt And Deleveraging
US Debt And Deleveraging
US Debt And Deleveraging
Chart III-36US Financial Conditions
US Financial Conditions
US Financial Conditions
Chart III-37Global Economic Snapshot: Europe
Global Economic Snapshot: Europe
Global Economic Snapshot: Europe
Chart III-38Global Economic Snapshot: China
Global Economic Snapshot: China
Global Economic Snapshot: China
Jonathan LaBerge, CFA Vice President The Bank Credit Analyst Gabriel Di Lullo Research Associate Footnotes 1 Please see Global Investment Strategy Special Alert "Hard Or Soft Landing? BCA Strategists Debate The Question," dated June 21, 2022, available at gis.bcaresearch.com 2 Please see The Bank Credit Analyst "April 2022," dated March 31, 2022, available at bca.bcaresearch.com 3 Please see Global Investment Strategy "Revisiting The Neutral Rate Of Interest: A Contrarian View In A Time Of Crisis," dated March 20, 2020, available at gis.bcaresearch.com; The Bank Credit Analyst "R-star, And The Structural Risk To Stocks," dated March 31, 2021, available at bca.bcaresearch.com; The Bank Credit Analyst "Do Excess Savings Explain Low US Interest Rates?" dated March 31, 2022, available at bca.bcaresearch.com 4 Please see The Bank Credit Analyst "Is The US Housing Market Signaling An Imminent Recession?" dated May 26, 2022, available at bca.bcaresearch.com 5 Please see Emerging Markets Strategy "A Conversation With Ms. Mea: Navigating An Inflation Storm," dated June 16, 2022, available at ems.bcaresearch.com 6 Please see The Bank Credit Analyst "The Modern-Day Phillips Curve, Future Inflation, And What To Do About It," dated December 18, 2020, available at bca.bcaresearch.com 7 This trimmed mean measure excludes the top 8% of CPI components with the largest monthly price gains and the bottom 8% with the smallest monthly gains. 8 Rent.com, https://www.rent.com/research/average-rent-price-report/, June 2022. 9 A fourth channel can be via a psychological boost to business and consumer confidence, but this can cut both ways if an easing in policy is interpreted as a sign of worsening economic conditions rather than as a reason for optimism.
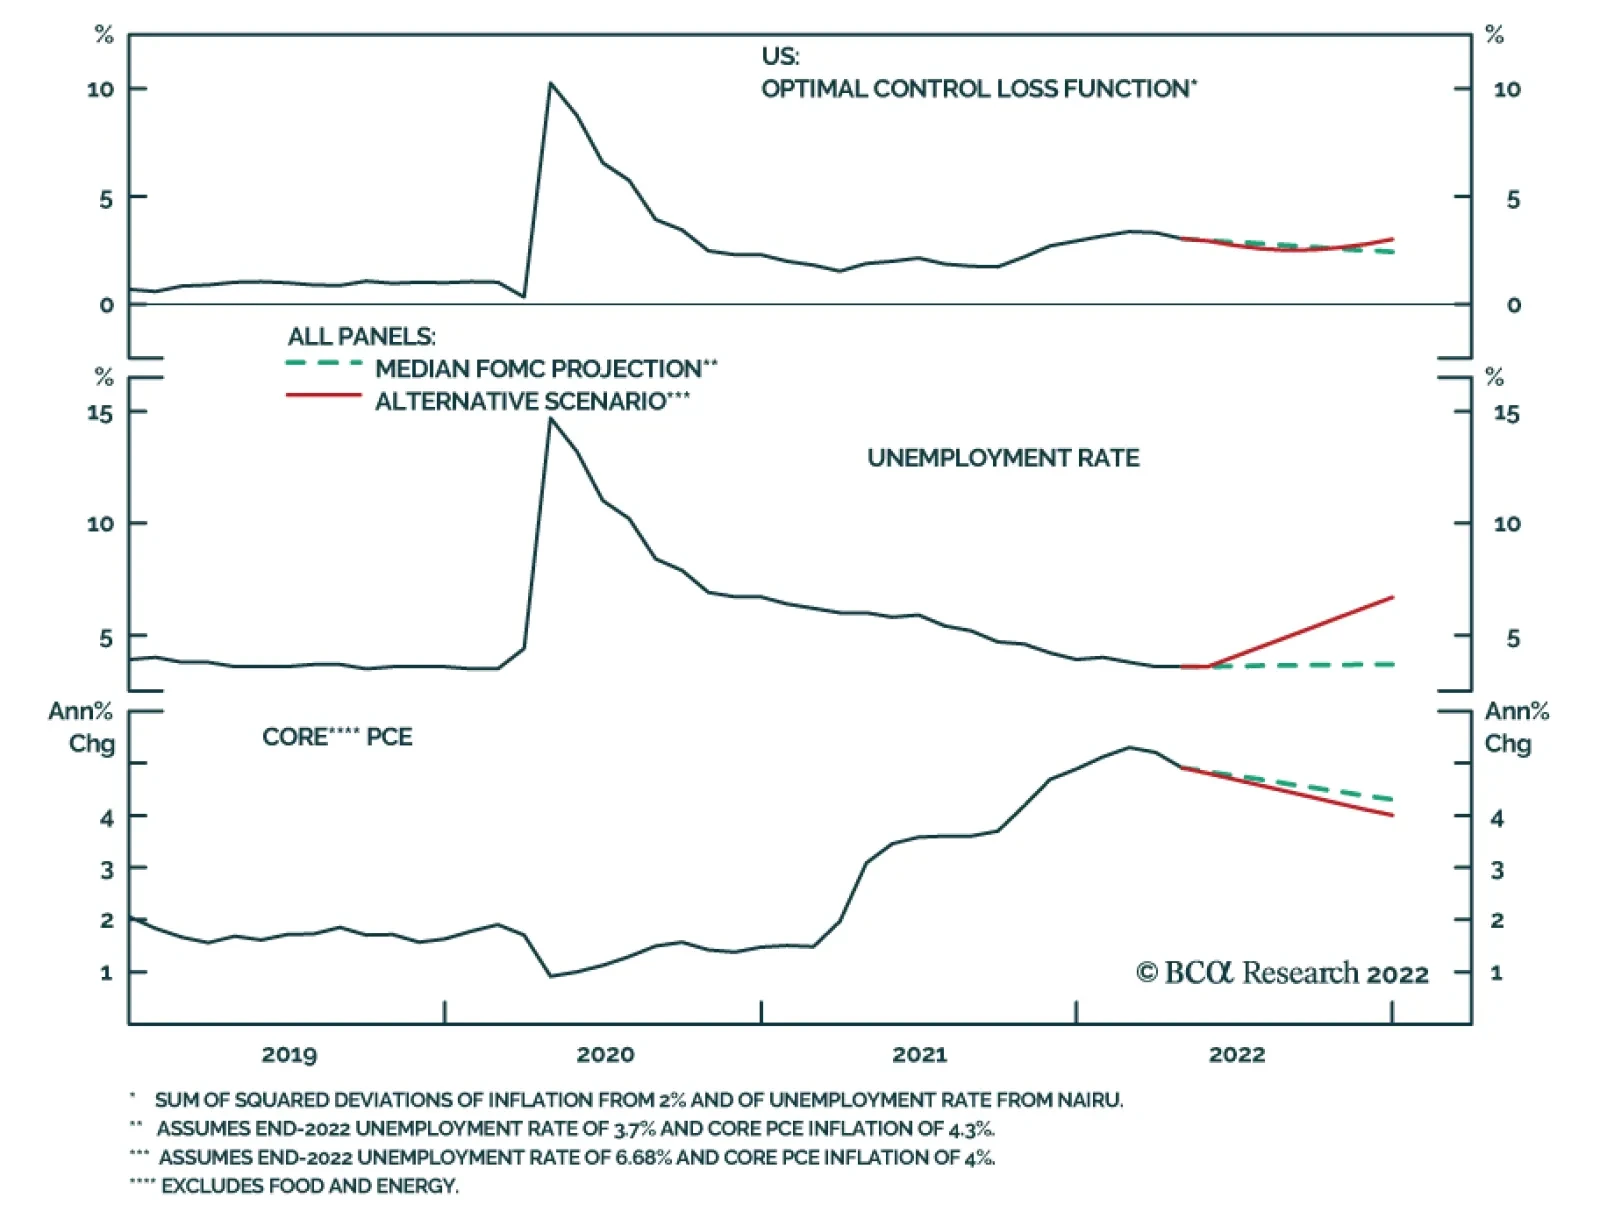
BCA Research’s US Bond Strategy service cautions against turning overly bullish on bonds even if you anticipate a recession within the next 6-12 months. There is a risk that the Fed’s two mandates of price stability and maximum employment could come into…
Executive Summary An Optimal Control Policy
An Optimal Control Policy
An Optimal Control Policy
We could see some modest near-term downside in Treasury yields as inflation rolls over during the next few months, but we caution against turning overly bullish on bonds even if you anticipate a recession. An optimal control approach to monetary policy tells us that the Fed should be willing to accept a significant increase in the unemployment rate to tame inflation. The implication is that the next recession may not be met with the dramatic easing of monetary policy we have become accustomed to. Short-maturity real yields remain deeply negative, but they will move into positive territory before the end of the economic cycle. Indicators of corporate balance sheet health are not flashing red, but they are moving in the wrong direction. Bottom Line: Investors should keep portfolio duration close to benchmark, maintain a defensive posture on corporate bonds and short 2-year TIPS. The Return Of Optimal Control Bonds rallied into the close last week and, as of Monday morning, their gains have only been partially unwound. The 2-year Treasury yield is down to 3.07% from its recent high of 3.45% and the 10-year yield is down to 3.16% from its recent high of 3.49% (Chart 1). The 2-year/10-year Treasury slope remains close to inversion at 9 bps (Chart 1, bottom panel). Increasingly, the message from the Treasury market is that the Fed is no longer playing catch-up to runaway inflation. Rather, the dominant market narrative is that the Fed may have to moderate its hiking pace to avoid an economic recession. With the unemployment rate at 3.6% and nonfarm payroll growth averaging +408k during the past three months, the US economy is clearly not in a recession today. That said, leading indicators are pointing to increased risk of a downturn within the next 12 months. For example, the S&P Global Manufacturing PMI fell sharply last week from 57.0 to 52.4 (Chart 2). The more widely tracked ISM Manufacturing PMI remains elevated at 56.1, but regional Fed surveys and trends in financial conditions suggest that the ISM could dip into contractionary territory during the next few months (Chart 2, bottom 2 panels). Chart 1Treasury Yields
Treasury Yields
Treasury Yields
Chart 2Recession Risk Is Rising
Recession Risk Is Rising
Recession Risk Is Rising
This is obviously a tricky situation for the Fed as there is a risk that its two mandates of price stability and maximum employment could come into conflict. Not surprisingly, the Fed has a playbook for these sorts of situations, one that was described by Janet Yellen as “optimal control” in a 2012 speech.1 Under an optimal control approach to policymaking the Fed specifies a loss function that is based on deviations of inflation from its 2% target and of the unemployment rate from its estimated full employment level. Understanding that it will be impossible to perfectly achieve both of its objectives, the Fed attempts to set policy so that the output of the loss function is minimized. One example of a simple loss function was given by St. Louis Fed President James Bullard in a speech from 2014.2 That function is as follows: Distance From Goals = (π – π*)2 + (μ - μ*)2 Where: π = inflation π* = The Fed’s target inflation rate μ = the unemployment rate μ* = The Fed’s estimate of the unemployment rate consistent with full employment Chart 3An Optimal Control Policy
An Optimal Control Policy
An Optimal Control Policy
Let’s apply Bullard’s loss function to the present-day economic situation. The top panel of Chart 3 shows the square root of the function’s output. The Fed’s goal, of course, is to get that line as close to zero as possible. First, let’s see what happens if we input the median FOMC member’s forecast for core PCE inflation and the unemployment rate. That forecast has core PCE inflation falling to 4.3% by the end of this year and it has the unemployment rate edging up to 3.7%. Not surprisingly, this scenario leads to a modest improvement in Bullard’s loss function. Now let’s examine an alternative scenario where core PCE inflation falls to 4% by the end of the year but we set the loss function to remain at its current level. That outcome can be achieved even with the unemployment rate rising to 6.68%. This scenario is instructive. It tells us that, from an optimal control perspective, the Fed would be willing to tolerate an increase in the unemployment rate all the way up to 6.68% if it meant that inflation would fall back down to 4%. Why is this example important? It’s important because it gives us some perspective on what sort of labor market pain the Fed may be willing to tolerate to tame inflation. More specifically, there is a growing sense among some market participants that the US economy will soon fall into recession and that recessions are usually accompanied by Fed rate cuts. However, the magnitude of the increase in the unemployment rate that is shown in our alternative scenario would almost certainly be classified as a recession, but an optimal control perspective tells us that the Fed shouldn’t back away from tightening if that were to occur. The bottom line is that while we could see some modest near-term downside in Treasury yields as inflation rolls over during the next few months, we caution against turning overly bullish on bonds even if you anticipate a recession within the next 6-12 months. Given where inflation is today, there are strong odds that the Fed would respond to a rising unemployment rate by simply tempering its pace of rate hikes or perhaps temporarily pausing. Optimal control tells us that we would need to see an extremely large employment shock for the Fed to consider reversing course and cutting rates. Investors should stick with ‘at benchmark’ portfolio duration for the time being. A Quick Note On Real Yields Chart 4Short 2-Year TIPS
Short 2-Year TIPS
Short 2-Year TIPS
The 2-year real yield has risen to -0.70% from a 2021 low of -3.05%, but we have high conviction that it has further to run (Chart 4). At the press conference following the June FOMC meeting, Fed Chair Powell hinted that he viewed positive real yields across the entire Treasury curve as a reasonable intermediate-term goal. He then made similar claims when testifying before the Senate last week: It’s really only the very short end of the curve where our rates are still in negative territory from a real perspective. If you look further out, real rates are positive right across the curve and that’s really what you’re trying to achieve in a situation like this where we have 40 year highs in inflation.3 One way or another, we think it is highly likely that the Fed will achieve its goal of positive real yields across the entire curve. This could happen in a benign scenario where falling inflation expectations push short-maturity real yields higher. Or, it could happen in a more dramatic fashion where inflation expectations remain elevated but that only quickens the pace of Fed tightening. In that scenario, rising short-maturity nominal yields would drag real yields with them. Either way, investors should continue to hold outright short positions in 2-year TIPS. Corporate Health Check-Up In prior reports we noted the extremely good condition of corporate balance sheets, while also suggesting that balance sheet health would deteriorate going forward.4 An updated read on the status of corporate balance sheets suggests that conditions are still favorable, but much less so than even a few months ago. We begin with our Corporate Health Monitor (CHM), a composite indicator of six financial ratios calculated from the US National Accounts data for the nonfinancial corporate sector. This indicator was deep in “improving health” territory at the end of 2021, but it moved close to neutral in 2022 Q1 (Chart 5). Ratings trends, meanwhile, send a similar message. Through the end of May, upgrades continued to dramatically outpace downgrades in the investment grade space (Chart 5, panel 2), but the rate of net upgrades slowed somewhat in high-yield (Chart 5, bottom panel). Digging deeper, we find that the main culprit behind the CHM’s recent jump is a large drop in the ratio of Free Cash Flow to Total Debt (Chart 6). This drop occurred because after-tax cash flows held roughly flat in Q1 but capital expenditures surged, causing free cash flow to dip (Chart 6, panel 2). Chart 5Corporate Health Monitor
Corporate Health Monitor
Corporate Health Monitor
Chart 6Capex Surged In Q1
Capex Surged In Q1
Capex Surged In Q1
This trend is confirmed by another important indicator of corporate balance sheet health, the financing gap. The financing gap is the difference between capital expenditures and retained earnings. A positive financing gap means that retained earnings are insufficient to cover capital expenditures and firms therefore have an incentive to tap debt markets. We see that the financing gap jumped sharply in Q1, from deeply negative into positive territory (Chart 7). Chart 7The Financing Gap Is Positive
The Financing Gap Is Positive
The Financing Gap Is Positive
A positive financing gap on its own does not send a negative signal for corporate defaults. However, when a positive financing gap coincides with tightening lending standards, then an increase in the default rate becomes likely. For now, lending standards are close to unchanged (Chart 7, bottom panel), but there is a strong chance that continued Fed hiking will push them into ‘net tightening’ territory in the months ahead. Investment Implications Chart 8Attractive Value In HY
Attractive Value In HY
Attractive Value In HY
Corporate balance sheet health isn’t quite flashing red, but it is certainly trending in the wrong direction. With continued Fed tightening likely to weigh on lending standards and interest coverage going forward, a defensive posture toward corporate bonds is warranted. We continue to recommend an underweight allocation (2 out of 5) to investment grade corporate bonds in US fixed income portfolios. We maintain a somewhat higher neutral (3 out of 5) allocation to high-yield bonds for the time being. This is because high-yield valuation is quite attractive, and we see potential for some near-term spread tightening as inflation rolls over (Chart 8). That said, the sector’s long-term return prospects are not good, and we will consider turning more defensive should the average high-yield spread narrow to its 2017-19 average or should core inflation move closer to our 4% target. Ryan Swift US Bond Strategist rswift@bcaresearch.com Footnotes 1 https://www.federalreserve.gov/newsevents/speech/yellen20120606a.htm 2 https://www.stlouisfed.org/from-the-president/-/media/project/frbstl/stlouisfed/files/pdfs/bullard/remarks/bullardowensborokychamberofcommerce17july2014final.pdf 3 https://www.c-span.org/video/?521106-1/federal-reserve-chair-jerome-powell-testifies-inflation-economy 4 Please see US Bond Strategy / Global Fixed Income Strategy Special Report, “Turning Defensive On US Corporate Bonds”, dated April 12, 2022. Recommended Portfolio Specification Other Recommendations Treasury Index Returns Spread Product Returns
Executive Summary Biden Can Take Risks With Russia
Third Quarter US Political Outlook: Last Ditch Effort
Third Quarter US Political Outlook: Last Ditch Effort
President Biden will make a last-ditch effort to mitigate Democratic losses in the midterm elections and the effect will be still-high policy uncertainty and erratic US behavior. Biden can take several executive actions against inflation but we do not expect them to resolve the global supply shock or to save the Democrats from a Republican takeover of Congress this fall. There is substantial risk of a direct US-Russia crisis ahead of the election that would sustain bearish sentiment. US policy remains a headwind for equities in 2022 but possibly a tailwind in 2023. A rally after the midterm is fairly likely. Recommendation (Tactical) Initiation Date Return Long DXY (Dollar Index) 23-FEB-22 8.8% Bottom Line: Maintain a defensive posture in the third quarter but look for opportunities to buy oversold assets with long-term macro and policy tailwinds. Feature President Biden and the Democratic Party will make a last-ditch effort in the third quarter to mitigate their large expected losses in the midterm elections. The president will concentrate on fighting inflation, which is weighing on wages, incomes, and consumer and business sentiment (Chart 1). Related Report US Political StrategyBiden Opens The Border Biden’s frantic efforts will induce additional market volatility. The president has a few limited tools to address global energy and supply shocks that probably will not work. Inflation will remain problematic even if it slows down over the next three months as our bond strategists expect. The odds of recession have risen sharply. Our Chief Global Strategist Peter Berezin suggests that the odds are 40% – a point underscored by inversion of some parts of the yield curve and a falling leading economic indicator (Chart 2). President Biden recently met with outside economic adviser Larry Summers and concluded that a recession is “not inevitable.” Not very comforting. Chart 1Inflation's Toll
Inflation's Toll
Inflation's Toll
Chart 2Odds Of Recession Rising
Odds Of Recession Rising
Odds Of Recession Rising
Summers, who warned Biden and the Democrats not to add $1.9 trillion in spending at the beginning of 2021, has put forward research showing recession odds at 60%-70% over the next 12-24 months.1 However, BCA’s own recession checklist is still ambivalent (Table 1). BCA’s House View is now neutral on equities. Table 1BCA Recession Checklist
Third Quarter US Political Outlook: Last Ditch Effort
Third Quarter US Political Outlook: Last Ditch Effort
What could change the US policy outlook? Not much. Avoiding recession, reducing inflation, mobilizing women voters, and clashing directly with Russia could mitigate some of the Democrats’ expected losses this fall, but the outcome would probably be the same. Betting markets give a 72%probability to Democrats losing control of both the House of Representatives and the Senate. Our own election models show Democrats losing 22 seats in the House and two seats in the Senate (see Appendix), reinforcing our February forecast. The implication is congressional gridlock in 2023-24. Gridlock is marginally positive for the broad US equity market beginning in Q4 2022 … but marginally negative before then. Checking Up On Our Three Key Views For 2022 Our three key views for 2022 remain intact at the halfway point of the year. : 1. From Single-Party Rule To Gridlock: The Democrats are highly likely to lose control of the House of Representatives this fall, meaning that unified government will end with the lame duck legislative session in November and December. The Democrats’ fiscal 2022 budget reconciliation bill is less likely to pass now that midterm campaigning has begun. A fiscally expansive bill would add to inflation. A deficit-reducing bill – i.e. one with substantial tax hikes – would increase the odds of recession. Biden no longer has an interest in pushing the bill until he is reasonably sure a recession can be avoided. It is very hard to garner 218 votes in the House and 51 votes in the Senate now that Biden’s and Democrats’ popular support is melting down. Democrats are polling comparably to Republicans who lost 41 House seats in the 2018 midterms (Chart 3). Thus while it is still possible for Democrats to pass an energy security and climate change bill under Biden’s presidency, we have no conviction that they can do it before the midterm. More likely it would have to pass during the lame-duck session in the fourth quarter – or as a compromise law with a Republican Congress in 2023-24. Until 2025, at earliest, US government will be divided, which means that the post-election drop in policy uncertainty will be short-lived, as fears will emerge of breaching the debt ceiling in early 2023. Chart 3Democratic Party Troubles
Third Quarter US Political Outlook: Last Ditch Effort
Third Quarter US Political Outlook: Last Ditch Effort
2. From Legislative To Executive Power: With the legislature stymied, Biden will resort to executive power to keep his presidency afloat. So what will he do? Fight inflation. Biden’s anti-inflation plan consists of three prongs. The first is “letting” the Fed raise interest rates, which is well under way. The Fed hiked rates by 75 basis points on June 15 and plans to raise the Fed funds rate to 3.25% or 3.5% by end of year. The second prong is passing his Build Back Better plan and the third is consolidating the fiscal deficit. But these two options are bogged down in Congress – no new belt-tightening will occur until 2023 at earliest. So Biden’s remaining options consist of administrative maneuvers and executive orders. Biden could stop collecting the federal gas tax, although the tax has not risen since 1993 and its removal will have a marginal impact (Chart 4). He has already tapped the strategic petroleum reserve, to an unprecedented degree, without preventing the surge in prices at the pump (Chart 5). Chart 4Biden To Defer Federal Gas Tax
Biden To Defer Federal Gas Tax
Biden To Defer Federal Gas Tax
Chart 5Strategic Petroleum Reserve Already Tapped
Strategic Petroleum Reserve Already Tapped
Strategic Petroleum Reserve Already Tapped
3. From Domestic To Foreign Policy: Part of Biden’s turn toward executive power will be a turn toward foreign policy orientation. However, before the midterm, Biden’s foreign policy will be defensive or reactive. That is, with the exception of Russia, he will attempt to placate foreign threats and mitigate the energy shock. On China, Biden is considering pulling back on some of President Trump’s extraordinary tariffs, though probably not the Section 301 tariffs related to technology theft. He has the authority to do so unilaterally just as Trump had the authority to put them on. The problem is that easing the China tariffs will have little effect on inflation, and only after the midterm, while it would weaken Biden’s political standing in the Rust Belt and undermine the US’s strategic competition with China. Tariff relief would only temporarily benefit the renminbi, if at all, given China’s need for a weak currency amid its economic slowdown (Chart 6). Hence Biden may reduce some tariffs but it will be underwhelming. Not a reliable way to bring down inflation. Chart 6Biden Can Ease China Tariffs (But Don't Bet On It)
Biden Can Ease China Tariffs (But Don't Bet On It)
Biden Can Ease China Tariffs (But Don't Bet On It)
Second, Biden has proposed to ease sanctions on Iran if it will freeze its nuclear program and come back into compliance with the 2015 nuclear deal that the Trump administration rejected. But the Iranians can export oil anyway at today’s prices, they have customers in China and India, and they have immense military leverage over Iraqi production, which means they are not forced to capitulate (Chart 7). Not a reliable way to bring down inflation. Third, Biden is courting the Gulf Arab states and tinkering with easing sanctions on Venezuela and others. OPEC support is a better option than Iran/Venezuela. However, OPEC will decide when and how much support to give. The Arab states will act to prolong the global business cycle but will not base their strategy on helping Democrats win an election. Hence they may not come to the rescue as early as the third quarter (Chart 8). Chart 7Biden Can Ease Iran Sanctions (But Don't Bet On It)
Biden Can Ease Iran Sanctions (But Don't Bet On It)
Biden Can Ease Iran Sanctions (But Don't Bet On It)
Chart 8Biden Casting About For Oil Providers
Biden Casting About For Oil Providers
Biden Casting About For Oil Providers
Moreover if the Biden administration makes amends with Saudi Arabia, then Iran’s nuclear progress will steam ahead and ignite tensions in the Middle East within the year. That would vitiate the impact of increased OPEC production. Not a reliable way to bring down inflation. Biden has even sought to exempt Russia from some sanctions for the sake of reducing inflation, such as with grain exports. However, these arrangements may not last. Given Biden’s weak domestic support and given the way that the Cuban Missile Crisis helped President Kennedy to mitigate his party’s losses in 1962, Biden can afford to be confrontational and even provocative toward Russia (Chart 9). After all, Russia is already pulling levers to add to inflation. The problem is that a direct US-Russia showdown would increase inflation while heightening global risk aversion. Bottom Line: Gridlock is coming, which is marginally negative for US equities in Q3 2022 but marginally positive as early as Q4 2022 and in 2023. It is not good for equities in 2022 because of elevated uncertainty – uncertainty not so much about the election results as about the volatile and unpredictable impacts of the president’s last-ditch efforts to fight inflation. Chart 9Biden Can Take Risks With Russia
Third Quarter US Political Outlook: Last Ditch Effort
Third Quarter US Political Outlook: Last Ditch Effort
Checking Up On Our Strategic Themes For The 2020s Looking beyond the short term, this year’s inflation outbreak and geopolitical events will largely reinforce our three long-term US political themes, in the following ways: 1. Millennials/GenZ Rising: In the coming 12 months, a fall in job openings due to the economic slowdown, combined with a recovering labor participation rate, could reduce wage pressures and inflation, in accordance with the Federal Reserve’s plan for a “soft landing” (Chart 10). Of course, that is not happening yet. And conversely labor participation will fall again if recession risks materialize. So there will be a lot of noise in the short run. Over the long run, a rising dependency ratio, in the context of a growing population, has inflationary implications. It decreases the pool of savings, increases the need for public investment, and increases the cost of each prime-age worker. Today the headline labor participation rate has mostly recovered but workers over the age of 55 are failing to return to pre-pandemic levels of participation, as are young people, which will keep wage pressures up (Chart 11). Chart 10The Fed's Idea Of A Soft Landing
The Fed's Idea Of A Soft Landing
The Fed's Idea Of A Soft Landing
Chart 11Generational Shift In Labor Market
Generational Shift In Labor Market
Generational Shift In Labor Market
Thus generational change will be marginally inflationary and will have powerful political effects. An increasingly multi-ethnic and educated population will hold different opinions from previous generations. Political parties will evolve to capture these voters. Underlying the shift will be the fact that government support will be necessary for the rising share of dependents, yet fiscal discipline will be necessary to restrict inflation. The current quarrel between older and younger generations will intensify before it subsides. The Silent Generation, along with the conservative Baby Boomers, will remain the decisive voting bloc in the 2022 midterm and will seek to freeze fiscal policy. That brings us to our next theme … 2. Peak Polarization: Political polarization has declined since the 2020 election, as we predicted. All voters dislike high inflation (Chart 12). However, polarization will remain at historically high levels at least over the short and medium term. Chart 12Everyone Loathes Inflation
Everyone Loathes Inflation
Everyone Loathes Inflation
Chart 13Women’s Turnout Will Matter
Third Quarter US Political Outlook: Last Ditch Effort
Third Quarter US Political Outlook: Last Ditch Effort
Polarization will remain high in part because of the generational divide, which is still very wide and underpins stark ideological divides. For example, a short-term driver of polarization will be abortion. The Supreme Court is likely, though not certain, to overturn the 1972 Roe v. Wade decision that guarantees nationwide access to abortion. If it does, protests and civil unrest will occur. Women turned out in droves against President Trump’s Republicans in the 2018 midterms and will do so again in 2022 (Chart 13), helping Democrats to mitigate some of their losses. Polarization will also remain high due to the electoral system and intra-party dynamics. While Democrats ensconce themselves in formal institutions, Republicans continue to transform into a populist party. So far in the Republican primary elections, candidates endorsed by former President Trump are winning the nomination at a 94% rate. Table 2 shows the outcomes in the GOP primary elections for the House of Representatives so far. A GOP House majority is likely to impeach President Biden for one or another reason, even though they will not be able to remove him from office. Table 2Polarization Will Stay Near Historic Peaks Over 2022-24 Cycle
Third Quarter US Political Outlook: Last Ditch Effort
Third Quarter US Political Outlook: Last Ditch Effort
Today’s extreme polarization entails that congressional gridlock will return and that the US remains at high risk of social unrest, political violence, and domestic terrorism (Chart 14). A terrorist attack that affects critical infrastructure, high-level personnel, or the electoral system would lead to greater sociopolitical instability. Especially if violence tips the narrow political balance of one of the branches of government and has a concrete impact on national policy.2 Social unrest alone will hardly move markets but unrest that fundamentally damages US political stability is possible and would engender risk-aversion. Over the long run, however, the US will avoid a second civil war since Washington possesses the world’s most powerful military and intelligence apparatus, which is highly unlikely to be coopted or defeated by an extremist movement. The military swears allegiance to the constitution. For example, neither the military nor the political institutions (as opposed to individuals) showed any serious sign of breaking down during the January 6, 2021 insurrection. The vast majority of voters will recoil from any major incidents of terrorism or militancy. While opinion polls show non-negligible support for political violence, such polls need to be interpreted carefully (Chart 15). A recent study shows that these polls overstate public support for violence.3 Chart 14Major Risk Of Domestic Terrorism, Political Violence
Third Quarter US Political Outlook: Last Ditch Effort
Third Quarter US Political Outlook: Last Ditch Effort
Chart 15Opinion Growing More Militant … Until Militancy Happens
Third Quarter US Political Outlook: Last Ditch Effort
Third Quarter US Political Outlook: Last Ditch Effort
The emerging Russo-Chinese strategic challenge, combined with generational change, will force political elites to cooperate to prevent domestic insurrections, regime fracture, and foreign humiliation. Polarization will give way to a new American consensus which is largely directed at domestic stabilization and fighting the Second Cold War. 3. Limited Big Government: The inflation outbreak has dealt a blow to arguments in favor of unlimited government, including Modern Monetary Theory. While the US rediscovered the need for “Big Government” during the deflationary 2010s, it is already starting to rediscover the need for limited government via the inflationary 2020s (Chart 16). The next Congress will reimpose some fiscal discipline – and future governments will face some checks and balances on spending due to their fear of an inflationary surge and negative consequences at the voting booth. Unless Democrats somehow retain control of Congress this fall, they will reinforce the precedent set by the Carter administration that high inflation is politically undesirable. Chart 16Inflation Outbreak Will Limit Big Government
Third Quarter US Political Outlook: Last Ditch Effort
Third Quarter US Political Outlook: Last Ditch Effort
Fiscal policy will be more expansive in the coming decade than in recent decades due to structural factors. But it will still face limitations from democratic politics, i.e. gridlock. As long as polarization does not spiral out of control, the US government will not become authoritarian or autocratic and fiscal policy will not result in Big Government Socialism or No Government Anarchism. A new compromise will be found which will be Limited Big Government. Bottom Line: Generational tensions will rise and then fall – and so will political polarization. The US faces a high risk of sociopolitical instability in the short term. The 2022 midterm will become a source of uncertainty, volatility, and a still-elevated equity risk premium. After the midterm, uncertainty and risk premiums will dissipate temporarily. But avoiding a recession will become the critical factor in maintaining policy continuity and national stability through the 2024 election cycle. Investment Takeaways BCA has shifted its House View to a neutral asset allocation stance on equities relative to bonds, as noted. US Political Strategy remains defensively positioned, as midterm elections typically provide a tailwind to defensive sectors for the first three quarters of the election year. This is also true when unified governments shift to divided governments – and in that case bond yields tend to be higher than usual (Chart 17). While the inflation outbreak makes this year different from many recent midterm years, these trends have persisted. For this reason, and our Geopolitical Strategy views, we will maintain our defensive bias in the third quarter. Chart 17Stocks Flat, Bond Yields High, Until After Midterm Elections
Stocks Flat, Bond Yields High, Until After Midterm Elections
Stocks Flat, Bond Yields High, Until After Midterm Elections
We remain overweigh health care relative to the broad market and overweight nominal Treasuries relative to inflation-protected securities. Having said that, we are putting our long US dollar (DXY) trade on downgrade watch. We do not doubt that the dollar can go higher this year but our bearish views have come to fruition both within the US and in the geopolitical space and they are now largely priced. It may soon be time to step back and reassess, especially because interest rate differentials are turning against the dollar (Chart 18). In addition China’s government will take a pro-growth turn to try to secure the economic recovery over the next 12 months. In the energy space, we expect volatility. The Biden administration is focused on fighting inflation and could pull various levers to affect the oil market, outlined above. If Biden succeeds against expectations, then the oil price would suffer a substantial setback. Moreover OPEC has an independent interest in prolonging the business cycle now that global prices have become punitive. Hence we are neutral on oil prices and booked gains on our long energy trades for the time (Chart 19). Chart 18Put US Dollar On Downgrade Watch
Put US Dollar On Downgrade Watch
Put US Dollar On Downgrade Watch
If inflation subsides and bond yields moderate, then growth stocks should rebound against value stocks. However, we implemented this idea prematurely earlier this year and suffered for it. Therefore we remain neutral on the question of portfolio styles for now. Our cyclical plays remain the same: long cyber security stocks, defense stocks, and infrastructure stocks. We also remain long renewable energy, although for now we only recommend it as a tactical trade (Chart 20). Chart 19Energy Prices Will Be Volatile
Energy Prices Will Be Volatile
Energy Prices Will Be Volatile
Chart 20Stick With Cyber Security, Defense, And Renewables
Stick With Cyber Security, Defense, And Renewables
Stick With Cyber Security, Defense, And Renewables
Matt Gertken Senior Vice President Chief US Political Strategist mattg@bcaresearch.com Footnotes 1 See Lawrence H. Summers and Alex Domash, “History Suggests a High Chance of Recession over the Next 24 Months,” Harvard Kennedy School, March 15, 2022, www.hks.harvard.edu. 2 Consider the January 6 insurrection, the recent plot against Supreme Court Justice Brett Kavanaugh’s life, the gun attack on Republican Senators in 2017, and the risk of assassinations or other extremist incidents. 3 See Sean J. Westwood et al, “Current research overstates American support for political violence,” Proceedings of the National Academy of Sciences, 119:12 (2022), pnas.org. Strategic View Open Tactical Positions (0-6 Months) Open Cyclical Recommendations (6-18 Months) Table A2Political Risk Matrix
Third Quarter US Political Outlook: Last Ditch Effort
Third Quarter US Political Outlook: Last Ditch Effort
Table A3US Political Capital Index
Third Quarter US Political Outlook: Last Ditch Effort
Third Quarter US Political Outlook: Last Ditch Effort
Chart A1Presidential Election Model
Third Quarter US Political Outlook: Last Ditch Effort
Third Quarter US Political Outlook: Last Ditch Effort
Chart A2Senate Election Model
Third Quarter US Political Outlook: Last Ditch Effort
Third Quarter US Political Outlook: Last Ditch Effort
Table A4House Election Model
Third Quarter US Political Outlook: Last Ditch Effort
Third Quarter US Political Outlook: Last Ditch Effort
Table A5APolitical Capital: White House And Congress
Third Quarter US Political Outlook: Last Ditch Effort
Third Quarter US Political Outlook: Last Ditch Effort
Table A5BPolitical Capital: Household And Business Sentiment
Third Quarter US Political Outlook: Last Ditch Effort
Third Quarter US Political Outlook: Last Ditch Effort
Table A5CPolitical Capital: The Economy And Markets
Third Quarter US Political Outlook: Last Ditch Effort
Third Quarter US Political Outlook: Last Ditch Effort
Executive Summary Calculating Trend Inflation
Calculating Trend Inflation
Calculating Trend Inflation
Investors should anticipate 50 basis point rate hikes at each FOMC meeting, eventually transitioning to 25 bps per meeting once inflation shows clear and convincing evidence of trending down. This transition should occur later this year. Core inflation has peaked for the year and it can fall to a range of 4-5% even in the absence of an economic recession or meaningful labor market weakness. A recession will eventually be required to push inflation from 4% down to the Fed’s 2% target. Economic growth will slow going forward, but we won’t see enough weakness for the Fed to abandon its tightening cycle within the next 6-12 months. Bottom Line: US bond investors should keep portfolio duration close to benchmark, underweight TIPS versus nominal Treasuries and maintain a defensive posture on corporate bond spreads (underweight IG and neutral HY). The Fed Goes Big Chart 1Inflation Expectations
Inflation Expectations
Inflation Expectations
The US Federal Reserve continued to prove its inflation-fighting mettle last week with a 75 basis point rate hike, the largest single-meeting increase since 1994. Chair Powell had initially telegraphed 50 basis point rate increases for both the June and July FOMC meetings, but he made it clear during last week’s press conference that the committee was spooked by May’s surprisingly high CPI number and by the recent jump in 5-10 year household inflation expectations (Chart 1). Alongside the 75 basis point rate hike, committee members revised up their fed funds rate forecasts. The median FOMC member now expects the funds rate to reach a range of 3.25% to 3.5% by the end of 2022. That is consistent with three more 50 basis point rate hikes and one more 25 basis point hike at this year’s four remaining FOMC meetings. Looking further out, the median committee member anticipates 25-50 bps additional upside in the fed funds rate in 2023 but is then forecasting a modest reduction in 2024. Critically, the fed funds rate is still expected to be above estimates of long-run neutral by the end of 2024. Chart 2 shows how current market expectations compare to the Fed’s forecasts. We see that, even after the Fed’s upward forecast revisions, the market still anticipates a somewhat faster pace of tightening this year. The market is also priced for rate cuts in 2023, likely due to the increasingly widespread expectation that a recession is coming within the next 12 months. Chart 2Rate Expectations: Market Versus Fed
Rate Expectations: Market Versus Fed
Rate Expectations: Market Versus Fed
The Fed’s Near-Term Plan As for what we can expect going forward, we found two comments from Chair Powell’s press conference particularly enlightening. First, he called last week’s 75 basis point rate increase “unusually large” and said that he “doesn’t expect moves of that size to be common.” Second, Powell said that the Committee will need to see “convincing” and “compelling” evidence of falling inflation before it starts to moderate its tightening pace.1 From these statements we deduce the following near-term plan: 1. The Fed’s baseline expectation is to lift rates by 50 bps at each meeting. 2. A significant upside surprise in either the monthly core CPI data or long-dated inflation expectations would cause the Fed to lift by 75 bps instead of 50 bps. 3. The Fed will not reduce the pace of tightening to 25 bps per meeting until there is clear and convincing evidence that inflation is trending down. Bottom Line: Investors should anticipate 50 basis point rate hikes at each FOMC meeting, eventually transitioning to 25 bps per meeting once inflation shows clear and convincing evidence of trending down. This transition from 50 bps per meeting to 25 bps per meeting should occur later this year, meaning that the Fed will tighten no more quickly than what is already priced into the yield curve for the remainder of 2022. Inflation: All Clear To 4%, 2% Will Be More Challenging It’s evident from the above discussion that inflation remains the critical input for both monetary policy and US bond yields. In particular, the key questions are: 1. Will inflation trend down, and if so, how quickly? 2. Is an economic recession required to curtail inflation? Our answer to these questions is that core US inflation should fall naturally to a trend rate of roughly 4-5%, even in the absence of recession. However, an economic recession and its associated labor market weakness are likely required to move inflation from 4% back to the Fed’s 2% target. Chart 3Calculating Trend Inflation
Calculating Trend Inflation
Calculating Trend Inflation
To arrive at these conclusions, we seek out different ways of estimating inflation’s underlying trend (Chart 3). The first method we consider is the Atlanta Fed’s decomposition of core inflation into “flexible” and “sticky” components. As defined by the Atlanta Fed, “flexible” items tend to change price more frequently compared to “sticky” items. Items like hotels and new & used vehicles fall into the flexible index, while rent and medical care fall into the sticky index.2 As of May, 12-month core flexible inflation is running at a rate of 12.3%. Meanwhile, core sticky inflation is running at 5.0% (Chart 3, top panel). Second, we consider the New York Fed’s Underlying Inflation Gauge (UIG). The UIG uses a dynamic factor model to derive a measure of trend inflation from a broad set of data.3 In total, the measure uses 346 data series encompassing price measures and other nominal, real and financial variables. The New York Fed has demonstrated that the UIG provides better forecasts of CPI inflation than other measures of core and trimmed mean inflation. At present, the UIG is running at 4.9% (Chart 3, panel 2). A second “prices only” UIG measure that includes only price data and no other economic or financial variables is running hotter at 6.0%. Finally, we can assess inflation’s underlying trend by looking at wage growth. Specifically, we can look at unit labor costs, a measure of wages relative to productivity. Unit labor costs are volatile, but they tend to track core inflation over long periods of time. Unit labor costs grew at an extremely high rate of 8.2% in the four quarters ending in Q1, but this is partly due to huge post-pandemic swings in productivity growth. If we create a more stable measure of underlying wage pressure by subtracting annualized 5-year productivity growth from the 12-month growth rate in average hourly earnings, we see that this trend inflation measure is running at only 3.8% (Chart 3, bottom panel). Chart 4Auto Inflation Will Slow
Auto Inflation Will Slow
Auto Inflation Will Slow
We conclude from our analysis that 12-month core CPI inflation will fall from its current 6.0% back down to its trend level of roughly 4-5% without the Fed needing to slam the brakes on economic growth. This will occur because we will finally see the normalization of some prices that were pushed dramatically higher during the pandemic. Auto price inflation, for example, shot up above 20% last year because the pandemic and the fiscal response to the pandemic conspired to cause a surge in auto sales at the same time as a slump in production (Chart 4). Now, for reasons that have nothing to do with monetary policy but everything to do with the waning impact of the pandemic, we see auto sales rolling over as production ramps up. This will push prices lower in the second half of this year. All that said, once core inflation reaches its 4-5% trend level, more economic pain will be required to push it lower. Shelter, for example, carries a huge weight in the Atlanta Fed’s core sticky CPI and it is highly correlated with the economic cycle. A rising unemployment rate, and an economic recession, will eventually be required to push shelter inflation down. Bottom Line: Core inflation has peaked for the year and it can fall to a range of 4-5% even in the absence of an economic recession or meaningful labor market weakness. A recession and a rising unemployment rate will eventually be required to push inflation from 4% down to the Fed’s 2% target. The Risk Of Recession Just because US inflation can fall to 4% in the absence of recession doesn’t mean that the Fed won’t get impatient and cause one anyways. In fact, the Fed made it clear last week that it isn’t interested in nuanced inflation forecasts. The Fed will tighten aggressively until it is apparent that inflation is rolling over, even if it causes economic pain. In this section, we run through several economic and financial market indicators that often send signals near the peak of Fed tightening cycles and in advance of recessions. We conclude that economic growth is slowing, but we do not yet see any evidence of an imminent recession or of any growth slowdown that would be large enough for the Fed to pause or reverse its tightening cycle. First, we look at financial conditions (Chart 5). The Goldman Sachs Financial Conditions Index has tightened rapidly during the past few months and that tightening is broad-based across all five of the index’s components. That said, the index has still not quite moved into “restrictive” territory. Typically, Fed tightening cycles only end once financial conditions are already restrictive, and in this cycle, high inflation means that the Fed will likely tolerate even more tightening of financial conditions than usual. Second, we observe that the end of a Fed tightening cycle is often marked by a dip in the ISM Manufacturing PMI to below 50. Presently, the PMI is a solid 56.1 but it is falling, and regional Fed surveys suggest that it may soon dip into contractionary territory (Chart 6). Chart 5Financial Conditions
Financial Conditions
Financial Conditions
Chart 6PMIs Are Slowing
PMIs Are Slowing
PMIs Are Slowing
Third, residential construction activity is a strong predictor of both recession and the end of Fed tightening cycles. Specifically, we have observed that Fed tightening cycles tend to terminate once the 12-month moving average of housing starts falls below the 24-month moving average.4 At present, there is strong evidence that higher mortgage rates are starting to bite the housing market. Housing starts dipped sharply in May and homebuilder confidence is trending down (Chart 7). That said, our housing starts indicator still has a long way to go before it signals the end of the Fed’s tightening cycle (Chart 7, bottom panel). Finally, we turn to the labor market where we do not yet see any evidence of an economic slowdown. Nonfarm payroll growth usually turns negative prior to recession, but right now it is running at a rate of 4.5% during the past 12 months and 3.3% during the past three months (Chart 8). The unemployment rate, for its part, is extremely low, but this only reinforces the idea that the Fed won’t be inclined to abandon its tightening cycle anytime soon. Chart 7US Housing
US Housing
US Housing
Chart 8The US Labor Market
The US Labor Market
The US Labor Market
Consider that the Congressional Budget Office estimates that the natural unemployment rate is 4.4% and the median FOMC member estimates that it is 4.0%. In other words, the Fed would still consider the labor market tight even if the unemployment rate rose from its current 3.6% level to around 4%. Even though such an increase in the unemployment rate might technically be consistent with a recession, the Fed would not be inclined to ease monetary policy into such a labor market if inflation is still above its 2% target. Additionally, we must also consider that the labor force participation rate is trending up and it still has breathing room before it reaches its pre-pandemic level. Further increases in labor force participation – which seem likely – could support employment growth going forward even if the unemployment rate stops falling. Bottom Line: The Fed’s rate hikes, and tighter financial conditions more generally, will slow economic growth going forward. However, we don’t see any evidence that growth will be weak enough for the Fed to abandon its tightening cycle within the next 6-12 months. This is especially true because above-target inflation increases the amount of financial conditions tightening and labor market pain that the Fed will tolerate. Investment Implications Portfolio Duration & US Treasury Curve May’s surprisingly elevated CPI number caused US Treasury yields to move above their 2018 peaks across the entire yield curve (Chart 9). But we wouldn’t be surprised to see that uptrend take a breather during the next few months as inflation descends toward its 4-5% underlying trend. As noted above, falling inflation will likely cause the Fed to tighten by no more than what is already discounted between now and the end of the year, this should keep US Treasury yields rangebound. As a result, we advise investors to keep duration close to benchmark in US bond portfolios, with an eye toward re-evaluating this positioning once core inflation moves closer to its underlying trend. Chart 9US Treasury Yields
US Treasury Yields
US Treasury Yields
On the Treasury curve, the 5-year note continues to trade cheap relative to the 2-year/10-year slope (Chart 9, bottom panel). We recommend buying the 5-year note versus a duration-matched barbell consisting of the 2-year and 10-year notes. TIPS Chart 10Underweight TIPS Versus Nominals
Underweight TIPS Versus Nominals
Underweight TIPS Versus Nominals
Investors should position for inflation falling back to trend by underweighting TIPS versus duration-matched nominal US Treasuries. Not only will falling inflation weigh on TIPS breakeven inflation rates during the next few months but a resolutely hawkish Fed will also apply downward pressure (Chart 10). We are particularly bearish on short-maturity TIPS, and we advise investors to initiate outright short positions in 2-year TIPS (Chart 10, bottom panel). In last week’s press conference, Chair Powell pointed to negative short-maturity real yields as evidence that financial conditions have room to tighten further. To us, this suggests that the Fed will not quit until real yields move into positive territory across the entire yield curve. In an environment of falling inflation, this is likely to occur because of falling TIPS breakeven inflation rates. However, the Fed has now demonstrated that even if inflation doesn’t fall it will push real yields higher with its policy rate actions and forward guidance. Corporate Credit The combination of slowing economic growth and increasingly restrictive Fed policy compels us toward a defensive positioning on corporate bond spreads. Specifically, we advise investors to carry an underweight (2 out of 5) allocation to investment grade US corporate bonds and a neutral (3 out of 5) allocation to high-yield US corporate bonds. Our slight preference for high-yield comes from the view that spread widening is likely to take a breather this year as inflation turns down and the Fed tightens by no more than what is already discounted in the yield curve. Though the long-run prospects for corporate bond returns remain bleak, if inflation moderates this year as we expect, then spreads could easily re-tighten to the average levels seen during the last tightening cycle (2017-19). That would equate to 31 bps of spread tightening for investment grade US corporate bonds (Chart 11), or roughly 300 bps of excess return versus duration-matched US Treasuries.5 For high-yield, a return to average 2017-19 spread levels would equate to 133 bps of spread tightening (Chart 12), or roughly 875 bps of excess return versus duration-matched US Treasuries.6 Chart 11IG Spreads
IG Spreads
IG Spreads
Chart 12HY Spreads
HY Spreads
HY Spreads
In our view, this warrants a slightly higher allocation to high-yield for the time being, though we will likely turn increasingly bearish should spreads tighten to average 2017-19 levels or once inflation converges with its 4-5% trend. Ryan Swift US Bond Strategist rswift@bcaresearch.com Footnotes 1 https://www.federalreserve.gov/mediacenter/files/FOMCpresconf20220615.pdf 2 For more info on the Atlanta Fed’s sticky and flexible CPIs please see: https://www.atlantafed.org/research/inflationproject/stickyprice 3 For more info on the Underlying Inflation Gauge please see https://www.newyorkfed.org/research/policy/underlying-inflation-gauge 4 For more details on this indicator please see US Bond Strategy Weekly Report, “The Bond Market Implications Of A 5% Mortgage Rate”, dated April 26, 2022. 5 This excess return estimate is roughly 31 bps of spread tightening multiplied by average index duration of 7.5. We then add half of the index OAS as an estimate of the carry earned during the next six months. 6 This excess return estimate is roughly 133 bps of spread tightening multiplied by average index duration of 4.3. We then add half of the index OAS, less estimated default losses of 200 bps, as an estimate of the carry earned during the next six months. Recommended Portfolio Specification Other Recommendations Treasury Index Returns Spread Product Returns