Fixed Income

Executive Summary Return Of The 'Pocketbook Voter'
Biden's Anti-Inflation Campaign
Biden's Anti-Inflation Campaign
President Biden’s pledge to fight inflation ahead of the midterm elections got a boost with the Gulf Arab states pledging to increase oil production in July and August. Yet OPEC’s action should not be overrated. The Saudis are not clearly bailing out Biden … at least not yet. Biden’s other inflation-fighting tools are also limited. The Fed will hike rates, which will weigh on inflation, at least in the short run. A short-term moderation in inflation will cause big shifts in financial markets. It will not save the midterms for Democrats, but gridlock is disinflationary so the effect is the same. Inflation risks will persist over the long run. Recommendation (Cyclical) Inception Level Inception Date Return Small Vs. Large Cap Energy 0.6485 26-JAN-22 14.2% Oil And Gas Transportation And Storage Vs. S&P 500 0.0527 30-MAR-22 16.5% Bottom Line: Expect inflation to moderate in the short run. Oil prices will be volatile. Book a 14% profit on small cap versus large cap energy stocks and a 16.5% profit on the oil and gas transportation sub-sector relative to the broad market. Feature President Biden kicked off the summer – and the midterm election campaign – by defending his record thus far and pledging a three-pronged strategy to fight inflation. His options are limited but he received a boost from OPEC right off the bat. The bottom line is that disinflationary pressures are emerging. These include congressional gridlock, which is likely to return in January 2023. Biden’s policies will not save his party from a defeat in the midterms but moderating inflation will have huge investment consequences. Biden’s Three-Pronged Plan Consumer confidence is hurting while inflation eats away at real wage growth for Americans (Chart 1). Confidence is 14% higher than when Biden took office but 17.5% lower than when it peaked in June 2021. The latest survey from the Conference Board showed another decrease in May. This is foul weather for a ruling party that already stands to suffer a major check on its power when voters go to the polls in the fall. Biden’s approval rating is likely to stabilize but only at the current low level of 41.4%. Voters are focusing on the economy more than other issues like health care, the environment, or foreign affairs (Chart 2). Chart 1Consumer Confidence And Real Wages Tumble
Biden's Anti-Inflation Campaign
Biden's Anti-Inflation Campaign
Chart 2Return Of The 'Pocketbook Voter'
Biden's Anti-Inflation Campaign
Biden's Anti-Inflation Campaign
In the Wall Street Journal Biden laid out his party’s election pitch.1 First, he argued that the US economy is transitioning from rapid recovery to stable growth – i.e. that it is not going into recession. That would be good, but a recession is possible and the slowdown is politically deadly: Household Savings: Aggregate household savings have risen from $1Tn in 2019 to $3.9Tn today, which Biden cited as evidence of improving financial security. The problem is that inequality skews the picture and the average American is unlikely to feel secure. Low and middle income earners have depleted their savings or seen only a small increase (Chart 3). The Biden administration failed to improve inequality as promised while the uneven economic recovery means that lower-paid Americans do not have as much ability to buffer spending as the aggregate savings imply. They will be unhappy in November. Chart 3Normal Households No Longer Flush With Savings
Biden's Anti-Inflation Campaign
Biden's Anti-Inflation Campaign
Jobs And Wages: Biden highlighted the role of his economic stimulus in lowering unemployment and argued that Americans have better paying jobs. But inflation has eroded real wages and incomes, as highlighted in Chart 1 above. Business Investment: Biden argued that business investment is brisk. But sentiment is turning. New orders of core capital goods have rolled over and capex intentions are falling (Chart 4). Manufacturing Comeback: Biden also touted the US manufacturing comeback, claiming that factory jobs are growing at fastest rate in 30 years. But again the tide is shifting against him, with the employment component of manufacturing purchasing manager indexes now signaling contraction (Chart 5). Biden, like Presidents Trump and Obama, has invested heavily in the “Buy America” re-industrialization narrative, so this trend is threatening. Chart 4Business Investment Setback
Biden's Anti-Inflation Campaign
Biden's Anti-Inflation Campaign
Chart 5Manufacturing Employment Weakening
Biden's Anti-Inflation Campaign
Biden's Anti-Inflation Campaign
A recession may indeed be avoided but the risk will not go away in time for the election. A recent study showed that at today’s extremely high level of inflation and extremely low level of unemployment, the odds of recession range from 60%-70% over the next 12-24 months.2 Second, Biden promised voters that he will fight inflation with all the powers of the White House. He laid out a three-pronged approach. However, his options are fairly limited and voters will not change their minds easily over the next five months: The Fed will hike rates: Biden argued that it is the Fed’s job to fight inflation and he will not interfere with rate hikes. While Biden offered admirable verbal support for an independent and non-partisan central bank, the truth is that real interest rates have not been this low since the highly politicized Fed chairmanship of Arthur Burns (Chart 6). While Biden has no reason to discourage rate hikes at the moment, he may change his tune as rates rise, growth slows, and the presidential election approaches. So may Powell, but by then it may be too late. In short, the Fed will hike, which will weigh on inflation, but it will not help Biden win voters this fall or avoid a recession by 2024. Congress will expand capacity: Biden argued that the bipartisan infrastructure bill that he signed into law and his other legislative proposals will boost the supply side of the economy. We are moderately optimistic about Congress’s ability to pass a party-line reconciliation bill that provides subsidies for the energy sector. This could pass under the consensus-building rubric of fighting Russia and climate change at the same time. But this measure, along with Biden’s Housing Supply Action Plan, child care and elderly care subsidies, and other proposals often look more like demand-side stimulus than supply-side reforms. They would fan inflation by increasing government spending and budget deficits. Moreover the administration cannot fix broken supply chains while China remains subject to strict Covid-19 lockdowns (Chart 7). In short, Congress may pass a reconciliation bill but it would be mildly stimulating for the economy (i.e. inflationary) and none of the supply-side improvements would reduce inflation in time for the midterms. Chart 6Biden Doesn't Need To Interfere With The Fed
Biden's Anti-Inflation Campaign
Biden's Anti-Inflation Campaign
Chart 7Supply Snarls Will Continue While China Struggles With Covid
Biden's Anti-Inflation Campaign
Biden's Anti-Inflation Campaign
The budget deficit will fall: Biden argued that budget consolidation will reduce inflation, pointing to this year’s estimated $1.7 trillion drop in the budget deficit and arguing that the deficit is falling lower than pre-pandemic levels. He also argued that robust tax revenues from the economic recovery justified his previous fiscal stimulus (the American Rescue Plan Act). However, the budget is merely normalizing from extreme pandemic heights – there have obviously not been any long-term fiscal reforms (Chart 8). If Congress passes a reconciliation bill then Biden may succeed at passing a minimum corporate tax, which would mark an important success. But while the fiscal drag is negative for inflation, it is also negative for the economy this year and for Biden’s party in the midterms, and long-term budget trends are inflationary. Chart 8No Sign Of Budget Control Over Long Run – Budget Deficits Are Inflationary
Biden's Anti-Inflation Campaign
Biden's Anti-Inflation Campaign
The takeaway is that the Fed’s actions are disinflationary. Congress may or may not pass a climate bill before the election, but if it does, the budget deficit will be the same or larger and the economy will be the same or slightly stimulated. In brief Biden’s anti-inflation plan is to avoid interfering at the Fed. Extremely low unemployment will not save Biden and the Democrats this election season, any more than it saved Trump and the Republicans in 2018 (Chart 9). The Fed will rein in inflation at least in the short run. The election will lead to gridlock, which will freeze fiscal policy. Bottom Line: Inflation expectations will moderate but not because of any supply-side reform or fiscal consolidation coming from the Biden administration this year. Chart 9Low Unemployment Will Not Save Democrats
Biden's Anti-Inflation Campaign
Biden's Anti-Inflation Campaign
Will Biden Ease Russian Energy Tensions? No. Biden’s other avenues for reducing inflation – not addressed in his editorial – lie in the foreign policy realm. The Biden administration is turning toward foreign policy as gridlock settles over Capitol Hill. Biden’s foreign policy will be insular, reactive, and focused on the midterm elections. Could Biden facilitate ceasefire talks in Ukraine so as to ease energy pressures stemming from Russia? The short answer is no. Biden imposed an oil embargo on Russia and ultimately agreed to the EU’s embargo. Biden can afford to run large risks with Russia this year because a larger confrontation or crisis with Russia would not hurt the Democrats in the midterm elections. Indeed the best hope for the Democrats is to recreate the 1962 congressional election, when John F. Kennedy stared down Soviet leader Nikita Krushchev in the Cuban Missile Crisis in October just before the election. Kennedy’s Democrats lost four seats in the House, gained four in the Senate, and kept control of both. Biden’s approval rating is nowhere near Kennedy’s but his party’s outlook is bad enough that he may be willing to run the risk of a crisis that could lead to a favorable rally-around-the-flag effect in the fall (Chart 10). Biden’s clearance this week of the highly mobile artillery rocket system for Ukraine – despite the risk that Ukrainians would launch attacks into Russian territory – underscores this point. Bottom Line: Biden will not ease tensions with Russia ahead of the midterm to try to reduce energy prices. Chart 10Biden Can Risk A Bigger Russia Crisis
Biden's Anti-Inflation Campaign
Biden's Anti-Inflation Campaign
Will Biden Lower China Tariffs? No. What about China – will Biden ease the Trump administration’s tariffs on China to reduce inflation before the midterm election? Treasury Secretary Janet Yellen has repeatedly signaled support for this idea. The Trump administration marked a historic increase in US tariffs and the Biden administration has so far offered relief only for US allies (Chart 11). Again the short answer is no. Protectionist sentiment will prevail during midterm election season and US voters have turned decisively unfavorable toward China in recent years (Chart 12). The China tariffs have not been the driver for US inflation so tariff relief would bring minimal price relief while exacting a high political cost of making Biden look weak, wishy-washy on his pro-democracy values, and (according to Republicans) corrupt. Biden would be offering unilateral benefits to China without gaining Chinese trade concessions. Chart 11Biden Keeps Trump's Tariffs On China
Biden's Anti-Inflation Campaign
Biden's Anti-Inflation Campaign
Chart 12Protectionist Sentiment To Prevail Amid Midterms
Biden's Anti-Inflation Campaign
Biden's Anti-Inflation Campaign
Recently the Biden administration gave some indications of where it stands on China policy. Biden visited US allies in Asia Pacific and provoked China over the Taiwan Strait. Secretary of State Antony Blinken unveiled the administration’s comprehensive China policy and declared that the US would remain focused on China as the “most serious long-term challenge” despite Russia’s open belligerence in Europe.3 On paper, US-China trade relations do not look that bad. While China is falling short of its Phase One trade deal import promises, the truth is that a global recession intervened – and those promises were made under duress when the US slapped sweeping sanctions on Chinese exports. The commodity trade is booming, as is to be expected amid global energy shortages (Chart 13). The problem is that neither the US nor China has the domestic political capital to offer structural concessions in the short run, while both sides are girding for a century-long power struggle over the long run. Supply insecurity will result in the commodity trade suffering as a vast global substitution effect takes place. This is due to Russia’s energy breakup with Europe, growing Russia-China trade linkages, and ongoing US-China tensions. Global trade and US-China trade are set to slow, while China’s surge in energy imports from the US will abate for reasons of state security. Chart 13US-China Trade Faces Strategic Limits
Biden's Anti-Inflation Campaign
Biden's Anti-Inflation Campaign
Bottom Line: No reduction in US tariffs on China is likely. Any reduction will have minimal macroeconomic effects and will be replaced by other punitive measures, given the underlying strategic competition and protectionist election politics. Meanwhile China’s “Zero Covid” policy will weigh on trade ties and sustain price pressures in the short run, as mentioned. Will Biden Lift Iran Sanctions? Probably Not. What about the Middle East? Can Biden convince the core OPEC states to pump more oil in lieu of Russian production? Or can Biden lift sanctions on Iran to undercut soaring gasoline prices? On this front Biden received welcome news on June 2 when Gulf Arab states promised to increase production by 638,000 barrels per day in July and August, up from an expected 430,000. At the same time news broke that Biden will visit Saudi Arabia, including potentially Crown Prince Mohammed bin Salman (MBS), and other Gulf partners sometime in June. There is not yet a clear understanding between Biden and MBS but it is possible that one will develop. The trigger for OPEC’s declaration is the EU oil embargo on Russia. EU is finalizing an embargo on 90% of oil imports – everything except the oil flowing through the Southern Druzhba pipeline to land-locked eastern European states. The embargo will impair Russian energy production: it could fall by as much as 2-3 million barrels per day, distribution interruptions will occur as Russia transitions to Asian buyers, and Russia’s long-term production capacity could be damaged. The result could be a destabilizing price spike. While the core OPEC states have just enough spare capacity to cover that gap in theory (Chart 14), they will not want to commit all spare capacity at once. Chart 14OPEC Spare Capacity
Biden's Anti-Inflation Campaign
Biden's Anti-Inflation Campaign
There is still a lot of uncertainty about how rapidly the embargo will be enforced, how much Russian production will suffer, whether the OPEC states will meet these new production increases (all except Saudi have been falling short), and what will be the OPEC policy beyond August. But for now it is clear that the Gulf Arab states are helping the US and EU by signaling some extra supplies at a critical time. The Gulf Arabs benefit from high oil prices and have previously ignored the G7’s pleas to increase production. But they also need to prolong the business cycle – a cycle-killing price shock from Russia is not in their interest. They are interested in keeping up revenues, maintaining domestic stability, and maintaining their position as the gatekeepers of the global oil supply and price. Secondarily, they are interested in maintaining close relations with the US, which guarantees their national security. OPEC supply easing at this juncture is obviously beneficial to Biden ahead of the US midterm election in November. But there is not yet an understanding on this front because the US is also negotiating to rejoin the 2015 nuclear agreement with Iran, which Saudi Arabia and the Gulf states oppose. Biden’s trip to the Gulf suggests that nothing is settled yet. The OPEC production increase is not proof alone that the US is breaking off talks with Iran. If the Gulf states thought the US were going to strike a deal with Iran, they might produce more oil to preempt the deal and grab more market share, which is what they did in 2014 in advance of the original 2015 US-Iran nuclear deal. The Saudis do not want US shale producers and Iranian exporters to form an unholy alliance that steals market share and compromises Saudi security. Still, we expect the US-Iran deal to fall apart. The Biden administration does not have a unified international coalition to enforce sanctions on Iran. Nor does it have the political capital or longevity to give Iran credible security guarantees that would convince it to freeze its nuclear program. Recent events support our view. The UN atomic watchdog says that Iran’s stockpile of highly enriched uranium has risen by 30% in three months. Meanwhile the US seized an Iranian tanker off Greece, Iran seized two Greek tankers, and Greece warned about dangers to shipping in the Persian Gulf. To develop a better understanding between Biden and MBS, the US needs to assure the Saudis that it will not renew the deal with Iran. The Saudis will not provide oil at Biden’s whim but they may provide if they have satisfaction that the US will scrap the deal, or otherwise compensate them, such as through increased defense assistance (which Biden threatened to cut off when he entered office). Investors should expect OPEC to fall short of its current promises – and yet to try to provide the minimum production increases necessary to prevent a destabilizing oil spike. OPEC’s interest is to make a windfall for as long as possible, which means not killing the cycle out of greed. This policy could be positive for oil prices after the immediate downward price adjustment. But for now investors should merely expect oil volatility as the EU’s embargo enforcement, Russian retaliation, Russian oil production, OPEC implementation, and US sanctions on Iran are all up in the air. A successful US-Iran deal would deepen the drop in oil prices. But odds are 60/40 that that deal will fail, leading to an escalation of tensions in the Middle East. Biden will have to underscore the US’s red line against Iranian nuclear weaponization. Oil supply disruptions will increase in frequency across the region. Bottom Line: OPEC has given Biden’s anti-inflation campaign a boost but it is too soon to declare that oil prices will substantially abate. The US-Iran deal will likely fail, increasing Middle Eastern instability and supply risks. Investment Takeaways Given that we expect continued volatility in the oil space, we are booking a 14% gain on our long small cap energy versus large cap energy trade. We are also booking a 16.5% gain on our overweight position in the oil and gas transportation and storage sub-sector. We will revisit these trades in future reports. Overall we maintain a defensive portfolio strategy. Biden’s anti-inflation campaign is meeting with some success in the Middle East but the US confrontation with Russia and the likely failure of US-Iran talks suggests that price spikes can still kill more demand and lead to further growth upsets. Matt Gertken Senior Vice President Chief US Political Strategist mattg@bcaresearch.com Footnotes 1 See Joseph R. Biden, Jr, “Joe Biden: My Plan for Fighting Inflation,” Wall Street Journal, May 30, 2022, wsj.com. 2 See Lawrence H. Summers and Alex Domash, “History Suggests a High Chance of Recession over the Next 24 Months,” Harvard Kennedy School, March 15, 2022, www.hks.harvard.edu. 3 See Antony J. Blinken, “The Administration’s Approach to the People’s Republic of China,” US Department of State, May 26, 2022, state.gov. Strategic View Open Tactical Positions (0-6 Months) Open Cyclical Recommendations (6-18 Months) Table A2Political Risk Matrix
Biden's Anti-Inflation Campaign
Biden's Anti-Inflation Campaign
Table A3US Political Capital Index
Biden's Anti-Inflation Campaign
Biden's Anti-Inflation Campaign
Chart A1Presidential Election Model
Biden's Anti-Inflation Campaign
Biden's Anti-Inflation Campaign
Chart A2Senate Election Model
Biden's Anti-Inflation Campaign
Biden's Anti-Inflation Campaign
Table A4House Election Model
Biden's Anti-Inflation Campaign
Biden's Anti-Inflation Campaign
Table A5APolitical Capital: White House And Congress
Biden's Anti-Inflation Campaign
Biden's Anti-Inflation Campaign
Table A5BPolitical Capital: Household And Business Sentiment
Biden's Anti-Inflation Campaign
Biden's Anti-Inflation Campaign
Table A5CPolitical Capital: The Economy And Markets
Biden's Anti-Inflation Campaign
Biden's Anti-Inflation Campaign
Executive Summary Investors face a dilemma. The faster that inflation comes down, the better it will be for valuations via a stronger rally in the bond price. But if a collapse in inflation requires a sharp deceleration in growth, the worse it will be for profits. Bond yields are likely in a peaking process, but the sharpest declines may come a few months down the road, after an unambiguous roll-over in food and energy inflation. The stock market’s valuation-driven sell-off is likely over, but the danger is that it morphs into a profits-driven sell-off. As such, the stock market will remain under pressure through 2022, though it is likely to be higher 12 months from now in June 2023. High conviction recommendation: Overweight healthcare versus basic resources. In other words, tilt towards sectors that benefit the most from rising bond prices and that suffer the least from contracting profits. New high conviction recommendation: Go long the Japanese yen. As bond yield differentials re-tighten, the yen will rally. Additionally, the yen will benefit from its haven status in a period of recessionary risk. Fractal trading watchlist: JPY/USD, GBP/USD, and Australian basic resources. If 2022-23 = 1981-82, Then This Is What Happens To The Stock Market
If 2022-23 = 1981-82, Then This Is What Happens To The Stock Market
If 2022-23 = 1981-82, Then This Is What Happens To The Stock Market
Bottom Line: The risk is that the valuation-driven sell-off morphs into a profits-driven sell-off. Feature In May, many stock markets reached the drawdown of 20 percent that defines a technical bear market. Yet what has caught many people off guard is that the bear market in stocks has happened during a bull market in profits. Since the start of 2022, US profits are up by 5 percent.1 The bear market in stocks has happened during a bull market in profits… so far. This shatters the shibboleth that bear markets only happen when there is a profits recession. The 2022 bear market has been a valuation-driven bear market. US profits rose 5 percent, but the multiple paid for those profits collapsed by 25 percent, taking the market into bear territory. None of this should come as any surprise to our regular readers. As we have pointed out many times, a stock market can be likened to a bond with a variable rather than a fixed income. So, just as with a bond, every stock market has a ‘duration’ which establishes which bond it most behaves like. It turns out that that long-duration US stock market has the same duration as a 30-year bond. This means that: The US stock market = (The 30-year T-bond price) multiplied by (US profits) It follows that if the 30-year bond price falls by more than profits rise, then the stock market will sell off. And if the 30-year bond price falls by much more than profits rise, then the stock market will enter a valuation-driven bear market. Therein lies the story of 2022 so far (Chart I-1). Chart I-1The Bear Market Is Valuation-Driven. Profits Are Up... For Now
The Bear Market Is Valuation-Driven. Profits Are Up... For Now
The Bear Market Is Valuation-Driven. Profits Are Up... For Now
Just As In 1981-82, Will The Sell-Off Morph From Valuation-Driven To Profits-Driven? In Markets Echo 1981, When Stagflation Morphed Into Recession, we argued that a good template for what happens to the economy and the markets in 2022-23 is the experience of 1981-82. Does 2022-23 = 1981-82? Then, just as now, the world’s central banks were obsessed with ‘breaking the back’ of inflation, and piloting the economy to a ‘soft landing’. Then, just as now, the central banks were desperate to repair their badly damaged credibility in managing the economy. And then, just as now, an invasion-led war between two major commodity producers – Iran and Iraq – was disrupting commodity supplies and adding to inflationary pressures. In 1981, just as now, the equity market sell-off started as a valuation sell-off, driven by a declining 30-year T-bond price. Profits held up through most of 1981, just as they have so far in 2022. In September 1981, US core inflation finally peaked, with bond yields following soon after. In the current experience, March 2022 appears to have marked the equivalent peak in US core inflation (Chart I-2 and Chart I-3). Chart I-2Does September 1981...
Does September 1981...
Does September 1981...
Chart I-3...Equal March 2022?
...Equal March 2022?
...Equal March 2022?
In late 1981, when the 30-year T-bond price rebounded, the good news was that beaten-down equity valuations also reached their low point. The bad news was that just as the valuation-driven sell-off ended, profits keeled over, and the valuation-driven sell-off morphed into a profits-driven sell-off (Chart I-4). In 2022-23, could history repeat? Chart I-4In September 1981, The Sell-Off Morphed From Valuation-Driven To Profits-Driven
In September 1981, The Sell-Off Morphed From Valuation-Driven To Profits-Driven
In September 1981, The Sell-Off Morphed From Valuation-Driven To Profits-Driven
Recession Or No Recession? That Is Not The Question History rhymes, it rarely repeats exactly. What if the 2022-23 experience can avoid the outright economic recession of the 1981-82 experience? This brings us to another shibboleth that needs to be shattered. You don’t need the economy to go into recession for profits to go into recession. To understand why, we need to visit the concept of operational leverage. Profits is a small number that comes from the difference of two large numbers: sales and the costs of generating those sales. As any company will tell you, sales can be volatile, but costs – which are dominated by wages – are sticky and much slower to change. The upshot is that if sales growth exceeds costs growth, there is a massively leveraged impact on profits growth. This is the magic of operational leverage. But if sales growth falls below sticky cost growth, the magic turns into a curse. The operational leverage goes into reverse, and profits collapse. Using US stock market profits as an example, the magic turns into a curse at real GDP growth of 1.25 percent, above which profits grow at six times the difference, and below which profits shrink at six times the difference (Chart I-5). Chart I-5A Model For US Profits Growth: (Real GDP Growth - 1.25) Times 6
A Model For US Profits Growth: (Real GDP Growth - 1.25) Times 6
A Model For US Profits Growth: (Real GDP Growth - 1.25) Times 6
Strictly speaking, we should compare US profits growth with world GDP growth because multinationals generate their sales globally rather than domestically. But to the extent that the US has both the world’s largest stock market and the world’s largest economy, it is a reasonable comparison. We should also compare both profits and sales in either nominal or real terms, rather than a mixture. But even with these tweaks, we would still find that the dominant driver of profit growth is operational leverage. ‘Recession or no recession?’ is a somewhat moot question, because even non-recessionary low growth is enough to tip profits into contraction. Therefore, the conclusion still stands – ‘recession or no recession?’ is a somewhat moot question, because even non-recessionary low growth is enough to tip profits into contraction. Such a period of low growth is now likely. If 2022-23 = 1981-82, What Happens Next? To repeat: The US stock market = (The 30-year T-bond price) multiplied by (US profits) This means that investors face a dilemma. The faster that inflation comes down, the better it will be for valuations via a stronger rally in the bond price. But if a collapse in inflation requires a sharp deceleration in growth, the worse it will be for profits. This was the precise set-up in December 1981, the equivalent of June 2022 in our historical template. In which case, what can we expect next? 1. Bond yields are likely in a peaking process, but the sharpest declines may come a few months down the road, after an unambiguous roll-over in food and energy inflation (Chart I-6). Chart I-6If 2022-23 = 1981-82, Then This Is What Happens To The Bond Yield
If 2022-23 = 1981-82, Then This Is What Happens To The Bond Yield
If 2022-23 = 1981-82, Then This Is What Happens To The Bond Yield
2. The stock market’s valuation-driven sell-off is likely over, but the danger is that it morphs into a profits-driven sell-off. As such, the stock market will remain under pressure through 2022, though it is likely to be higher 12 months from now in June 2023 (Chart I-7). Chart I-7If 2022-23 = 1981-82, Then This Is What Happens To The Stock Market
If 2022-23 = 1981-82, Then This Is What Happens To The Stock Market
If 2022-23 = 1981-82, Then This Is What Happens To The Stock Market
3. Long-duration defensive sectors will outperform short-duration cyclical sectors. In other words, tilt towards sectors that benefit the most from rising bond prices and suffer the least from contracting profits. As such, a high conviction recommendation is to overweight healthcare versus basic resources (Chart I-8). Chart I-8If 2022-23 = 1981-82, Then This Is What Happens To Healthcare Versus Resources
If 2022-23 = 1981-82, Then This Is What Happens To Healthcare Versus Resources
If 2022-23 = 1981-82, Then This Is What Happens To Healthcare Versus Resources
4. In foreign exchange, the setup is very bullish for the Japanese yen through the next 12 months. The yen’s recent sell-off is explained by bond yields rising outside Japan. As these bond yield differentials re-tighten, the yen will rally. Additionally, the yen will benefit from its haven status in a period of recessionary risk. A new high conviction recommendation is to go long the Japanese yen (Chart I-9). Chart I-9The Yen's Sell-Off Is Due To Bond Yields Rising Outside Japan
The Yen's Sell-Off Is Due To Bond Yields Rising Outside Japan
The Yen's Sell-Off Is Due To Bond Yields Rising Outside Japan
Fractal Trading Watchlist Supporting our bullish fundamental case for the Japanese yen, the sell-off in JPY/USD has reached the point of fragility on its 260-day fractal structure that marked previous major turning points in 2013 and 2015 (Chart 10). Hence, a first new trade is long JPY/USD, setting the trade length at 6 months, and the profit target and symmetrical stop-loss at 5 percent. Chart I-10The Sell-Off In JPY/USD Has Reached A Potential Turning Point
The Sell-Off In JPY/USD Has Reached A Potential Turning Point
The Sell-Off In JPY/USD Has Reached A Potential Turning Point
Supporting our bearish fundamental case for resources stocks, the outperformance of Australian basic resources has reached the point of fragility on its 130-day fractal structure that marked previous turning points in 2013, 2015, and 2021 (Chart I-11). Hence, a second new trade is short Australian basic resources versus the world market, setting the trade length at 6 months, and the profit target and symmetrical stop-loss at 10 percent. Chart I-11The Australian Basic Resources Sector Is Vulnerable To Reversal
The Australian Basic Resources Sector Is Vulnerable To Reversal
The Australian Basic Resources Sector Is Vulnerable To Reversal
Finally, we are adding GBP/USD to our watchlist, given that its 260-day fractal structure is close to the point of fragility that marked major turns in 2014, 2015, and 2016. Our full watchlist of 29 investments that are at, or approaching turning points, is available on our website: cpt.bcaresearch.com Fractal Trading Watchlist: New Additions GBP/USD At A Turning Point
GBP/USD At A Turning Point
GBP/USD At A Turning Point
Chart 1AUD/KRW Is Vulnerable To Reversal
AUD/KRW Is Vulnerable To Reversal
AUD/KRW Is Vulnerable To Reversal
Chart 2Canada Versus Japan Is Reversing
Canada Versus Japan Is Reversing
Canada Versus Japan Is Reversing
Chart 3Canada's TSX-60's Outperformance Might Be Over
Canada's TSX-60's Outperformance Might Be Over
Canada's TSX-60's Outperformance Might Be Over
Chart 4US Healthcare Providers Vs. Software At Risk of Reversal
US Healthcare Providers Vs. Software At Risk of Reversal
US Healthcare Providers Vs. Software At Risk of Reversal
Chart 5BRL/NZD At A Resistance Point
BRL/NZD At A Resistance Point
BRL/NZD At A Resistance Point
Chart 6Homebuilders Versus Healthcare Services Has Turned
Homebuilders Versus Healthcare Services Has Turned
Homebuilders Versus Healthcare Services Has Turned
Chart 7CNY/USD Has Reversed
CNY/USD Has Reversed
CNY/USD Has Reversed
Chart 8CAD/SEK Reversal Has Started
CAD/SEK Reversal Has Started
CAD/SEK Reversal Has Started
Chart 9Financials Versus Industrials To Reverse
Financials Versus Industrials To Reverse
Financials Versus Industrials To Reverse
Chart 10The Outperformance Of Resources Versus Biotech Has Started To Reverse
The Outperformance Of Resources Versus Biotech Has Started To Reverse
The Outperformance Of Resources Versus Biotech Has Started To Reverse
Chart 11The Outperformance Of Resources Versus Healthcare Is Vulnerable To Reversal
The Outperformance Of Resources Versus Healthcare Is Vulnerable To Reversal
The Outperformance Of Resources Versus Healthcare Is Vulnerable To Reversal
Chart 12FTSE100 Outperformance Vs. Euro Stoxx 50 Is Reversing
FTSE100 Outperformance Vs. Euro Stoxx 50 Is Reversing
FTSE100 Outperformance Vs. Euro Stoxx 50 Is Reversing
Chart 13Netherlands Underperformance Vs. Switzerland Has Been Exhausted
Netherlands Underperformance Vs. Switzerland Has Been Exhausted
Netherlands Underperformance Vs. Switzerland Has Been Exhausted
Chart 14The Sell-Off In The 30-Year T-Bond Is Approaching Fractal Fragility
The Sell-Off In The 30-Year T-Bond Is Approaching Fractal Fragility
The Sell-Off In The 30-Year T-Bond Is Approaching Fractal Fragility
Chart 15The Sell-Off In The NASDAQ Is Approaching Fractal Fragility
The Sell-Off In The NASDAQ Is Approaching Fractal Fragility
The Sell-Off In The NASDAQ Is Approaching Fractal Fragility
Chart 16Food And Beverage Outperformance Has Been Exhausted
Food And Beverage Outperformance Has Been Exhausted
Food And Beverage Outperformance Has Been Exhausted
Chart 17The Strong Trend In The 18-Month-Out US Interest Rate Future Is Fragile
The Strong Trend In The 18-Month-Out US Interest Rate Future Is Fragile
The Strong Trend In The 18-Month-Out US Interest Rate Future Is Fragile
Chart 18The Strong Trend In The 3 Year T-Bond Is Fragile
The Strong Trend In The 3 Year T-Bond Is Fragile
The Strong Trend In The 3 Year T-Bond Is Fragile
Chart 19A Potential Switching Point From Tobacco Into Cannabis
A Potential Switching Point From Tobacco Into Cannabis
A Potential Switching Point From Tobacco Into Cannabis
Chart 20Biotech Is A Major Buy
Biotech Is A Major Buy
Biotech Is A Major Buy
Chart 21Norway's Outperformance Could End
Norway's Outperformance Could End
Norway's Outperformance Could End
Chart 22Cotton Versus Platinum Is Reversing
Cotton Versus Platinum Is Reversing
Cotton Versus Platinum Is Reversing
Chart 23Switzerland's Outperformance Vs. Germany Has Started To End
Switzerland's Outperformance Vs. Germany Has Started To End
Switzerland's Outperformance Vs. Germany Has Started To End
Chart 24The Rally In USD/EUR Has Ended
The Rally In USD/EUR Has Ended
The Rally In USD/EUR Has Ended
Chart 25The Outperformance Of MSCI Hong Kong Versus China Is Vulnerable To Reversal
The Outperformance Of MSCI Hong Kong Versus China Is Vulnerable To Reversal
The Outperformance Of MSCI Hong Kong Versus China Is Vulnerable To Reversal
Chart 26A Potential New Entry Point Into Petcare
A Potential New Entry Point Into Petcare
A Potential New Entry Point Into Petcare
Chart 27Czech Outperformance Near Exhaustion
Czech Outperformance Near Exhaustion
Czech Outperformance Near Exhaustion
Chart 28US REITS Are Oversold Versus Utilities
US REITS Are Oversold Versus Utilities
US REITS Are Oversold Versus Utilities
Chart 29GBP/USD At A Turning Point
GBP/USD At A Turning Point
GBP/USD At A Turning Point
Dhaval Joshi Chief Strategist dhaval@bcaresearch.com Footnotes 1 Defined as 12-month forward earnings per share. Fractal Trading System
More On 2022-23 = 1981-82, And The Danger Ahead
More On 2022-23 = 1981-82, And The Danger Ahead
More On 2022-23 = 1981-82, And The Danger Ahead
More On 2022-23 = 1981-82, And The Danger Ahead
6-Month Recommendations Structural Recommendations Closed Fractal Trades Indicators To Watch - Bond Yields Chart II-1Indicators To Watch - Bond Yields - Euro Area
Indicators To Watch - Bond Yields - Euro Area
Indicators To Watch - Bond Yields - Euro Area
Chart II-2Indicators To Watch - Bond Yields - Europe Ex Euro Area
Indicators To Watch - Bond Yields - Europe Ex Euro Area
Indicators To Watch - Bond Yields - Europe Ex Euro Area
Chart II-3Indicators To Watch - Bond Yields - Asia
Indicators To Watch - Bond Yields - Asia
Indicators To Watch - Bond Yields - Asia
Chart II-4Indicators To Watch - Bond Yields - Other Developed
Indicators To Watch - Bond Yields - Other Developed
Indicators To Watch - Bond Yields - Other Developed
Indicators To Watch - Interest Rate Expectations Chart II-5Indicators To Watch - Interest Rate Expectations
Indicators To Watch - Interest Rate Expectations
Indicators To Watch - Interest Rate Expectations
Chart II-6Indicators To Watch - Interest Rate Expectations
Indicators To Watch - Interest Rate Expectations
Indicators To Watch - Interest Rate Expectations
Chart II-7Indicators To Watch - Interest Rate Expectations
Indicators To Watch - Interest Rate Expectations
Indicators To Watch - Interest Rate Expectations
Chart II-8Indicators To Watch - Interest Rate Expectations
Indicators To Watch - Interest Rate Expectations
Indicators To Watch - Interest Rate Expectations
Executive Summary EU Embargoes Russian Oil
Energy Cutoff Continues (GeoRisk Update)
Energy Cutoff Continues (GeoRisk Update)
The EU imposed an embargo on 90% of Russian oil imports, which will provoke retaliation. Russia will squeeze Europe’s economy ahead of critical negotiations over the coming 6-12 months. Russian gains on the battlefield in Ukraine point to a ceasefire later, but not yet – and Russia will need to retaliate against NATO enlargement. The Middle East and North Africa face instability and oil disruptions due to US-Iran tensions and Russian interference. China’s autocratic shift is occurring amid an economic slowdown and pandemic. Social unrest and internal tensions will flare. China will export uncertainty and stagflation. Inflation is causing disparate effects in South Asia – instability in Pakistan and Sri Lanka, and fiscal populism in India. Asset Initiation Date Return Long Brazilian Financials / Indian Equities (Closed) Feb 10/22 22.5% Bottom Line: Markets still face three geopolitical hurdles: Russian retaliation; Middle Eastern instability; Chinese uncertainty. Feature Global equities bounced back 6.1% from their trough on May 12 as investors cheered hints of weakening inflation and questioned the bearish consensus. BCA’s Global Investment Strategy correctly called the equity bounce. However, as BCA’s Geopolitical Strategy service, we see several sources of additional bad news. Throughout the Ukraine conflict we have highlighted two fundamental factors to ascertain regarding the ongoing macroeconomic impact: Will the war cut off the Russia-EU energy trade? Will the war broaden beyond Ukraine? Chart 1Russian-Exposed Assets Will Suffer More
Russian-Exposed Assets Will Suffer More
Russian-Exposed Assets Will Suffer More
In this report we update our views on these two critical questions. The takeaway is that the geopolitical outlook is still flashing red. The US dollar will remain strong and currencies exposed to Russia and geopolitical risk will remain weak (Chart 1). In addition, China’s politics will continue to produce uncertainty and negative surprises this year. Taken together, investors should remain defensive for now but be ready to turn positive when the market clears the hurdles we identify. The fate of the business cycle hangs in the balance. Energy Ties Eroding … Russia Will Retaliate Over Oil Embargo Chart 2AEU Embargoes Russian Oil
Energy Cutoff Continues (GeoRisk Update)
Energy Cutoff Continues (GeoRisk Update)
Europe is diversifying from Russian oil and natural gas. The European Union adopted a partial oil embargo on Russia that will cut oil imports by 90% by the end of 2022. It also removed Sberbank from the SWIFT banking communications network and slapped sanctions on companies that insure shipments of Russian crude. The sanctions will cut off all of Europe’s seaborne oil imports from Russia as well as major pipeline imports, except the Southern Druzhba pipeline. The EU made an exception for landlocked eastern European countries heavily dependent on Russian pipeline imports – namely Hungary, Slovakia, the Czech Republic, and Bulgaria (Chart 2A). Focus on the big picture. Germany changed its national policy to reduce Russian energy dependency for the sake of national security. From Chancellors Willy Brandt to Angela Merkel, Germany pursued energy cooperation and economic engagement as a means of lowering the risk of war with Russia. Ostpolitik worked in the Cold War, so when Russia seized Crimea in 2014, Merkel built the Nord Stream 2 pipeline. But Merkel’s policy failed to persuade Russia that economic cooperation is better than military confrontation – rather it emboldened President Putin, who viewed Europe as divided and corruptible. Chart 2BRussia Squeezes EU’s Natural Gas
Energy Cutoff Continues (GeoRisk Update)
Energy Cutoff Continues (GeoRisk Update)
Russia’s regime is insecure and feels threatened by the US and NATO. Russia believed that if it invaded Ukraine, the Europeans would maintain energy relations for the sake of preserving overall strategic stability. Instead Germany and other European states began to view Russia as irrational and aggressive and hence a threat to their long-term security. They imposed a coal ban, now an oil ban the end of this year, and a natural gas ban by the end of 2027, all formalized under the recently announced RePowerEU program. Russia retaliated by declaring it would reduce natural gas exports to the Netherlands and probably Denmark, after having already cut off Finland, Poland, and Bulgaria (Chart 2B). As a pretext Russia points to its arbitrary March demand that states pay for gas in rubles rather than in currencies written in contracts. This ruble payment scheme is being enforced on a country-by-country basis against those Russia deems “unfriendly,” i.e. those that join NATO, adopt new sanctions, provide massive assistance to Ukraine, or are otherwise adverse. Chart 3Russia Actively Cutting Gas Flows
Russia Actively Cutting Gas Flows
Russia Actively Cutting Gas Flows
Russia and Ukraine are already reducing natural gas exports through the Ukraine and Turkstream pipelines while the Yamal pipeline has been empty since May – and it is only a matter of time before flows begin to fall in the Nord Stream 1 pipeline to Germany (Chart 3). German government and industry are preparing to ration natural gas (to prioritize household needs) and revive 15 coal plants if necessary. Europe is attempting to rebuild stockpiles for the coming winter, when Russian willingness and capability to squeeze natural gas flows will reach a peak. The big picture is demonstrated by game theory in Diagram 1. The optimal situation for both Russia and the EU is to maintain energy exports for as long as possible, so that Russia has revenues to wage its war and Europe avoids a recession while transitioning away from Russian supplies (bottom right quadrant, each side receives four points). The problem is that this solution is not an equilibrium because either side can suffer a sudden shock if the other side betrays the tacit agreement and stops buying or selling (bottom left and top right quadrants). Diagram 1EU-Russia Standoff: What Does Game Theory Say?
Energy Cutoff Continues (GeoRisk Update)
Energy Cutoff Continues (GeoRisk Update)
The equilibrium – the decision sets in which both Russia and the EU are guaranteed to lose the least – is a situation in which both states reduce energy trade immediately. Europe needs to cut off the revenues that fuel the Russian war machine while Russia needs to punish and deter Europe now while it still has massive energy leverage (top left quadrant, circled). Once Europe diversifies away, Russia loses its leverage. If Europe does not diversify immediately, Russia can punish it severely by cutting off energy before it is prepared. Russian energy weaponization is especially useful ahead of any ceasefire talks in Ukraine. Russia aims for Ukrainian military neutrality and a permanently weakened Ukrainian state. To that end it is seizing territory for the Luhansk and Donetsk People’s Republics, seizing the southern coastline and strategic buffer around Crimea, and controlling the mouth of the Dnieper river so that Ukraine is forever hobbled (Map 1). Once it achieves these aims it will want to settle a ceasefire that legitimizes its conquests. But Ukraine will wish to continue the fight. Map 1Russian Invasion Of Ukraine, 2022
Energy Cutoff Continues (GeoRisk Update)
Energy Cutoff Continues (GeoRisk Update)
Russia will need leverage over Europe to convince the EU to lean on Ukraine to agree to a ceasefire. Something similar occurred in 2014-15 when Russia collaborated with Germany and France to foist the Minsk Protocols onto Ukraine. If Russia keeps energy flowing to EU, the EU not only gets a smooth energy transition away from Russia but also gets to keep assisting Ukraine’s military effort. Whereas if Russia imposes pain on the EU ahead of ceasefire talks, the EU has greater interest in settling a ceasefire. Finally, given Russia’s difficulties on the battlefield, its loss of European patronage, and potential NATO enlargement on its borders, Moscow is highly likely to open a “new front” in its conflict with the West. Josef Stalin, for example, encouraged Kim Il Sung to invade South Korea in 1950. Today Russia’s options lie in the Middle East and North Africa – the regions where Europe turns for energy alternatives. Not only Libya and Algeria – which are both inherently fertile ground for Russia to sow instability – but also Iran and the broader Middle East, where a tenuous geopolitical balance is already eroding due to a lack of strategic understanding between the US and Iran. Russia’s capabilities are limited but it likely retains enough influence to ignite existing powder kegs in these areas. Bottom Line: Investors still face a few hurdles from the Ukraine war. First, the EU’s expanding energy embargo and Russian retaliation. Second, instability in the Middle East and North Africa. Hence energy price pressures will remain elevated in the short term and kill more demand, thus pushing the EU and the rest of the world toward stagflation or even recession. War Contained To Ukraine So Far … But Russia To Retaliate Over NATO Enlargement At present Russia is waging a full-scale assault on eastern and southern Ukraine, where about half of Donetsk awaits a decision (Map 2). If Russia emerges victorious over Donetsk in the summer or fall then it can declare victory and start negotiating a ceasefire. This timeline assumes that its economic circumstances are sufficiently straitened to prevent a campaign to the Moldovan border.1 Map 2Russia May Declare Victory If It Conquers The Rest Of Donetsk
Energy Cutoff Continues (GeoRisk Update)
Energy Cutoff Continues (GeoRisk Update)
There are still ways for the Ukraine war to spill over into neighboring areas. For example, the Black Sea is effectively a Russian lake at the moment, which prevents Ukrainian grain from reaching global markets where food prices are soaring. Eventually the western maritime powers will need to attempt to restore freedom of navigation. However, Russia is imposing a blockade on Ukraine, has more at stake there than other powers, and can take greater risks. The US and its allies will continue to provide Ukraine with targeting information against Russian ships but this assistance could eventually provoke a larger naval conflict. Separately, the US has agreed to provide Ukraine with the M142 High Mobility Artillery Rocket System (HIMARS), which could lead to attacks on Russian territory that would prompt a ferocious Russian reaction. Even assuming that the Ukraine war remains contained, Russia’s strategic conflict with the US and the West will remain unresolved and Moscow will be eager to save face. Russian retaliation will occur not only on account of European energy diversification but also on account of NATO enlargement. Finland and Sweden are attempting to join NATO and as such the West is directly repudiating the Putin regime’s chief strategic demand for 22 years. Finland shares an 830 mile border with Russia, adding insult to injury. The result will be another round of larger military tensions that go beyond Ukraine and prolong this year’s geopolitical risk and uncertainty. Russia’s initial response to Finland’s and Sweden’s joint application to NATO was to dismiss the threat they pose while drawing a new red line. Rather than forbidding NATO enlargement, Russia now demands that no NATO forces be deployed to these two states. This demand, which Putin and other officials expressed, may or may not amount to a genuine Russian policy change. Russia’s initial responses should be taken with a grain of salt because Turkey is temporarily blocking Finland’s and Sweden’s applications, so Russia has no need to respond to NATO enlargement yet. But the true test will come when and if the West satisfies Turkey’s grievances and Turkey moves to admit the new members. If enlargement becomes inevitable, Russia will respond. Russia will feel that its national security is fundamentally jeopardized by Sweden overturning two centuries of neutrality and Finland reversing the policy of “Finlandization” that went so far in preventing conflict during the Cold War. Chart 4Military Balances Stacking Up Against Russia
Energy Cutoff Continues (GeoRisk Update)
Energy Cutoff Continues (GeoRisk Update)
Russia’s military options are limited. Russia has little ability to expand the war and fight on multiple fronts judging by the army’s recent performance in Ukraine and the Red Army’s performance in the Winter War of 1939. This point can be illustrated by taking the military balance of Russia and its most immediate adversaries, which add up to about half of Russian military strength even apart from NATO (Chart 4). Russian armed forces already demonstrated some pragmatism in April by withdrawing from Kyiv and focusing on more achievable war aims. Unless President Putin turns utterly reckless and the Russian state fails to restrain him, Russia will opt for defensive measures and strategic deterrence rather than a military offensive in the Baltics. Hence Russia’s military response will come in the form of threats rather than outright belligerence. However, these threats will probably include military and nuclear actions that will raise alarm bells across Europe and the United States. President Dmitri Medvedev has already warned of the permanent deployment of nuclear missiles in the Kaliningrad exclave.2 This statement points to only the most symbolic option of a range of options that will increase deterrence and elevate the fear of war. Otherwise Russia’s retaliation will consist of squeezing global energy supply, as discussed above, including by opening a new front in the Middle East and North Africa. Instability should be expected as a way of constraining Europe and distracting America. Higher energy prices may or may not convince the EU to negotiate better terms with Russia but they will sow divisions within and among the allies. Ultimately Russia is highly unlikely to sacrifice its credibility by failing to retaliate for the combination of energy embargo and NATO enlargement on its borders. Since its military options are becoming constrained (at least its rational ones), its economic and asymmetrical options will grow in importance. The result will be additional energy supply constraints. Bottom Line: Even assuming that the war does not spread beyond Ukraine – likely but not certain – global financial markets face at least one more period of military escalation with Russia. This will likely include significant energy cutoffs and saber-rattling – even nuclear threats – over NATO enlargement. China’s Political Situation Has Not Normalized China continues to suffer from a historic confluence of internal and external political risk that will cause negative surprises for investors. Temporary improvements in government policy or investor sentiment – centered on a relaxation of “Zero Covid” lockdowns in major cities and a more dovish regulatory tone against the tech giants – will likely be frustrated, at least until after a more dovish government stance can be confirmed in the wake of the twentieth national party congress in October or November this year. At that event, Chinese President Xi Jinping is likely to clinch another ten years in power and complete the transformation of China’s governance from single-party rule to single-person rule. This reversion to autocracy will generate additional market-negative developments this year. It has already embedded a permanently higher risk premium in Chinese financial assets because it increases the odds of policy mistakes, international aggression, and ultimately succession crisis. The most successful Asian states chose to democratize and expand free markets and capitalism when they reached a similar point of economic development and faced the associated sociopolitical challenges. But China is choosing the opposite path for the sake of national security. Investors have seen the decay of Russia’s economy under Putin’s autocracy and would be remiss not to upgrade the odds of similarly negative outcomes in China over the long run as a result of Xi’s autocracy, despite the many differences between the two countries. China’s situation is more difficult than that of the democratic Asian states because of its reviving strategic rivalry with the United States. US Secretary of State Antony Blinken recently unveiled President Biden’s comprehensive China policy. He affirmed that the administration views China as the US’s top strategic competitor over the long run, despite the heightened confrontation with Russia.3 The Biden administration has not eased the Trump administration’s tariffs or punitive measures on China. It is unlikely to do so during a midterm election year when protectionist dynamics prevail – especially given that the Xi administration will be in the process of reestablishing autocracy, and possibly repressing social unrest, at the very moment Americans go to the polls. Re-engagement with China is also prohibited because China is strengthening its strategic bonds with Russia. President Biden has repeatedly implied that the US would defend Taiwan in any conflict with China. These statements are presented as gaffes or mistakes but they are in fact in keeping with historical US military actions threatening counter-attack during the three historic Taiwan Strait crises. The White House quickly walks back these comments to reassure China that the US does not support Taiwanese independence or intend to trigger a war with China. The result is that the US is using Biden’s gaffe-prone personality to reemphasize the hard edge (rather than the soft edge) of the US’s policy of “strategic ambiguity” on Taiwan. US policy is still ambiguous but ambiguity includes the possibility that a president might order military action to defend Taiwan. US attempts to increase deterrence and avoid a Ukraine scenario are threatening for China, which will view the US as altering the status quo and penalizing China for Russia’s actions. Beijing resumed overflights of Taiwan’s air defense identification zone in the wake of Biden’s remarks as well as the decision of the US to send Senator Tammy Duckworth to Taiwan to discuss deeper economic and defense ties. Consider the positioning of US aircraft carrier strike groups as an indicator of the high level of strategic tensions. On January 18, 2022, as Russia amassed military forces on the Ukrainian border – and the US and NATO rejected its strategic demands – the US had only one publicly acknowledged aircraft carrier in the Mediterranean (the USS Harry Truman) whereas it had at least five US carriers in East Asia. On February 24, the day of Russia’s invasion of Ukraine, the US had at least four of these carriers in Asia. Even today the US has at least four carriers in the Pacific compared to at least two in Europe – one of which, notably, is in the Baltics to deter Russia from attacking Finland and Sweden (Map 3). The US is warning China not to take advantage of the Ukraine war by staging a surprise attack on Taiwan. Map 3Amid Ukraine War, US Deters China From Attacking Taiwan
Energy Cutoff Continues (GeoRisk Update)
Energy Cutoff Continues (GeoRisk Update)
Of course, strategic tensions are perennial, whereas what investors are most concerned about is whether China can secure its economic recovery. The latest data are still disappointing. Credit growth continues to falter as the private sector struggles with a deteriorating demographic and macroeconomic outlook (Chart 5). The credit impulse has entered positive territory, when local government bonds are included, reflecting government stimulus efforts. But it is still negative when excluding local governments. And even the positive measure is unimpressive, having ticked back down in April (Chart 6). Chart 5Credit Growth Falters Amid Economic Transition
Credit Growth Falters Amid Economic Transition
Credit Growth Falters Amid Economic Transition
Chart 6Silver Lining: Credit Impulse Less Negative
Silver Lining: Credit Impulse Less Negative
Silver Lining: Credit Impulse Less Negative
Bottom Line: Further monetary and fiscal easing will come in China, a source of good news for global investors next year if coupled with a broader policy shift in favor of business, but the effects will be mixed this year due to Covid policy and domestic politics. Taken together with a European energy crunch and Middle Eastern oil supply disruptions, China’s stimulus is not a catalyst for a sustainable global equity market rally this year. South Asia: Inflation Hammers Sri Lanka And Pakistan Since 2020 we have argued that the global pandemic would result in a new wave of supply pressures and global social unrest. High inflation is blazing a trail of destruction in emerging markets, notably in South Asia, where per capita incomes are low and political institutions often fragile. Chart 7South Asia: Surging Inflation
Energy Cutoff Continues (GeoRisk Update)
Energy Cutoff Continues (GeoRisk Update)
Sri Lanka has been worst affected (Chart 7). Inflation surged to an eye-watering 34% in April and is expected to rise further. Surging inflation has affected Sri Lanka disproportionately because its macroeconomic and political fundamentals were weak to begin with. The tourism-dependent Sri Lankan economy suffered a body blow from terrorist attacks in 2019 and the pandemic in 2020-21. Then 2022 saw a power struggle between Sri Lanka’s President Gotabaya Rajapaksa and members of the national assembly including Prime Minister (PM) Mahinda Rajapaksa. The crisis hit a crescendo when the country defaulted on external debt obligations last month. These events weigh on Sri Lanka’s ability to transition from a long civil war (1983-2009) to a path of sustained economic development. While the political crisis has seemingly stabilized following the appointment of new Prime Minister Ranil Wickremesinghe, we remain bearish on a strategic time horizon. This is mainly because the new PM is unlikely to bring about structural solutions for Sri Lanka’s broken economy. Moreover, Sri Lanka holds more than $50 billion of foreign debt, or 62% of GDP. Another country that has been dealing with political instability alongside high inflation in South Asia is Pakistan, where inflation hit a three-year high in April (see Chart 7 above). The latest twist in Pakistan’s never-ending cycle of political uncertainty comes from the ousted Prime Minister Imran Khan. The former PM, who commands an unusual popular support group due to his fame as a cricketer prior to entering politics, is demanding fresh elections and otherwise threatening to hold mass protests. Pakistan’s new coalition government and Prime Minister Shehbaz Sharif, who came to power amid parliamentary intrigues, are refusing elections and ultimatums. From a structural perspective Pakistan is characterized by a weak economy and an unusually influential military. Now it faces high inflation and rising food prices – indeed it is one of the countries that is most dangerously exposed to the Russia-Ukraine war as it depends on these two for over 70% of its grain imports. Bottom Line: MSCI Sri Lanka has underperformed the MSCI EM index by 58.3% this year to date. Pakistan has underperformed the same index by 41.6% over the same period. Against this backdrop, we remain strategic sellers of both bourses. Instability in these countries is also one of the factors behind our strategic assessment of India as a country with a growing domestic policy consensus. South Asia: India’s Fiscal Populism And Geopolitics Inflation is less rampant in India, although still troublesome. Consumer prices nearly jumped to an 8-year high in April (see Chart 7). With a loaded state election calendar due over the next 12-18 months, the jump in inflation naturally triggered a series of mitigating policy responses. Ban On Wheat Exports: India produces 14% of the world’s wheat and 11% of grains, and exports 5% and 7%, respectively. India’s exports could make a large profit in the context of global shortages. But Prime Minister Narendra Modi is entering into the political end of the business cycle, with key state elections due that will have an impact on the ruling party’s political standing two years before the next federal election. He fears political vulnerability if exports continue amid price pressures at home. The emphasis on food security is typical but also bespeaks a lack of commitment to economic reform. Chart 8India's Real Interest Rates Fall
India's Real Interest Rates Fall
India's Real Interest Rates Fall
Surprise Rate Hikes: The Reserve Bank of India (RBI) increased the policy repo rate by 40 basis points at an unscheduled meeting on May 4, thereby implementing its first rate hike since August 2018. With real rates in India lower than those in China or Brazil (Chart 8), the RBI will be forced to expedite its planned rate hikes through 2022. Tax Cuts On Fuel: India’s central government also announced steep cuts in excise duty on fuel. This is another populist measure that reduces political pressures but fails to encourage the private sector to adjust. These measures will help rein in inflation but the rate hikes will weigh on economic growth while the tax cuts will add to India’s fiscal deficit. Indeed, India is resorting to fiscal populism with key state elections looming. Geopolitical risk is less of a concern for India – indeed the Ukraine war has strengthened its bargaining position. In the short run, India benefits from the ability to buy arms and especially cheap oil from Russia while the EU imposes an embargo. But over the long run its economy and security can be strengthened by greater interest from the US and its allies, recently highlighted by the fourth meeting of the Quadrilateral Security Dialogue (Quad) and the launch of the US’s Indo-Pacific Economic Framework (IPEF). These initiatives are modest but they highlight the US’s need to replace China with India and ASEAN over time, a trend that no US administration can reverse now because of the emerging Russo-Chinese strategic alliance. At the same time, the Quad underscores India’s maritime interests and hence the security benefits India can gain from aligning its economy and navy with the other democracies. Bottom Line: Fiscal populism in the context of high commodity prices is negative for Indian equities. However, our views on Russia, the Middle East, and China all point to a sharper short-term spike in commodity prices that ultimately drives the world economy deeper into stagflation or recession. Therefore we are booking a 22.5% profit on our tactical decision to go long Brazilian financials relative to Indian equities. Matt Gertken Chief Geopolitical Strategist mattg@bcaresearch.com Ritika Mankar, CFA Editor/Strategist ritika.mankar@bcaresearch.com Chart 9Russia: GeoRisk Indicator
Russia: GeoRisk Indicator
Russia: GeoRisk Indicator
Chart 10Other Measures Of Russian Geopolitical Risk
Other Measures Of Russian Geopolitical Risk
Other Measures Of Russian Geopolitical Risk
Chart 11China: GeoRisk Indicator
China: GeoRisk Indicator
China: GeoRisk Indicator
Chart 12United Kingdom: GeoRisk Indicator
United Kingdom: GeoRisk Indicator
United Kingdom: GeoRisk Indicator
Chart 13Germany: GeoRisk Indicator
Germany: GeoRisk Indicator
Germany: GeoRisk Indicator
Chart 14France: GeoRisk Indicator
France: GeoRisk Indicator
France: GeoRisk Indicator
Chart 15Italy: GeoRisk Indicator
Italy: GeoRisk Indicator
Italy: GeoRisk Indicator
Chart 16Canada: GeoRisk Indicator
Canada: GeoRisk Indicator
Canada: GeoRisk Indicator
Chart 17Spain: GeoRisk Indicator
Spain: GeoRisk Indicator
Spain: GeoRisk Indicator
Chart 18Australia: GeoRisk Indicator
Australia: GeoRisk Indicator
Australia: GeoRisk Indicator
Chart 19Taiwan: GeoRisk Indicator
Taiwan: GeoRisk Indicator
Taiwan: GeoRisk Indicator
Chart 20Korea: GeoRisk Indicator
Korea: GeoRisk Indicator
Korea: GeoRisk Indicator
Chart 21Turkey: GeoRisk Indicator
Turkey: GeoRisk Indicator
Turkey: GeoRisk Indicator
Chart 22South Africa: GeoRisk Indicator
South Africa: GeoRisk Indicator
South Africa: GeoRisk Indicator
Chart 23Brazil: GeoRisk Indicator
Brazil: GeoRisk Indicator
Brazil: GeoRisk Indicator
Footnotes 1 Recent diplomatic flaps between core European leaders and Ukrainian President Volodymyr Zelensky reflect Ukraine’s fear that Europe will negotiate a “separate peace” with Russia, i.e. accept Russian territorial conquests in exchange for economic relief. 2 Dmitri Medvedev explicitly states ‘there can be no more talk of any nuclear-free status for the Baltic - the balance must be restored’ in warning Finland and Sweden joining NATO. Medvedev is suggesting that nuclear weapons will be placed in this area where Russia has its Kaliningrad exclave sandwiched between Poland and Lithuania. Guy Faulconbridge, ‘Russia warns of nuclear, hypersonic deployment if Sweden and Finland join NATO’, April 14, 2022, Reuters. 3 See Antony J Blinken, Secretary of State, ‘The Administration’s Approach to the People’s Republic of China’, The George Washington University, Washington D.C., May 26, 2022, state.gov. Additionally, see President Joe Biden’s remarks on China and getting involved military to defend Taiwan in a joint press conference with Japan’s Prime Minister Kishida Fumio. ‘Remarks by President Biden and Prime Minister Kishida Fumio of Japan in Joint Press Conference’, Akasaka Palace, Tokyo, Japan, May 23, 2022, whitehouse.gov. Strategic Themes Open Tactical Positions (0-6 Months) Open Cyclical Recommendations (6-18 Months) Regional Geopolitical Risk Matrix Section III: Geopolitical Calendar
Listen to a short summary of this report. Executive Summary Recession Checklist
Monthly Portfolio Update: Recession Or No Recession?
Monthly Portfolio Update: Recession Or No Recession?
US stocks were down almost 20% at their lowest point in May. Any lower and they would be pricing in recession. Central banks will raise rates to or above neutral to ensure that inflation comes back down to their targets. This will cause growth to slow. Markets will now start to worry more about faltering growth than about high inflation. In our recession checklist (see Table), no indicator is yet pointing to recession, but some may do so soon. The jury is likely to be out for some time on whether there will be a recession in the next 12-18 months. In the meantime, equities are likely to move sideways, amid high volatility.
Monthly Portfolio Update: Recession Or No Recession?
Monthly Portfolio Update: Recession Or No Recession?
Bottom Line: Investors should stay cautiously positioned for now, with only a neutral weighting in equities, and tilts towards more defensive markets and sectors. We recommend a large holding in cash to allow for funds to be redeployed quickly when there is a better entry-point. The narrative driving global markets has shifted from worries about inflation, to fretting about the risk of recession. Although headline inflation remains high (8.3% year-on-year in the US and 8.1% in the eurozone), inflation pressures have clearly peaked (for now, at least): Broad measures, such as the US trimmed-mean PCE, have started to ease significantly (Chart 1). Recommended Allocation
Monthly Portfolio Update: Recession Or No Recession?
Monthly Portfolio Update: Recession Or No Recession?
Chart 1Inflationary Pressures Are Starting To Ease
Monthly Portfolio Update: Recession Or No Recession?
Monthly Portfolio Update: Recession Or No Recession?
But now signs are emerging of a slowdown in economic growth. The Citigroup Economic Surprise Indexes in all the major regions have turned down (Chart 2), and global industrial production is falling year-on-year (albeit partly because of lingering supply-side bottlenecks) (Chart 3). Chart 2Global Growth Is Turning Down
Global Growth Is Turning Down
Global Growth Is Turning Down
Chart 3IP Growth Has Turned Negative
IP Growth Has Turned Negative
IP Growth Has Turned Negative
Equity markets – with US stocks down 19% from their peak to the May low, and global stocks 17% – are pricing in a slowdown, but not yet a recession. As we have often argued, it is almost unheard of to have a bear market (defined as a greater than 20% decline in US stocks) without a recession – the last time that happened was in 1987 (and all on one day, Black Monday) (Chart 4). Note from the chart how often stocks correct by 19-20%, on concerns about recession, without tipping into a bear market. That is where we stand today. Chart 4US Stocks Don't Fall More Than 20% Without A Recession
US Stocks Don't Fall More Than 20% Without A Recession
US Stocks Don't Fall More Than 20% Without A Recession
Table 1Recession Checklist
Monthly Portfolio Update: Recession Or No Recession?
Monthly Portfolio Update: Recession Or No Recession?
So the key question is: Will we have a recession over the next 12-18 months? We have dug out the recession checklist we last used in 2019 (Table 1). While none of the indicators are yet clearly pointing to recession, several may do so by year-end (Chart 5). And there are a number of warning signs starting to flash. The US housing market – the most interest-rate sensitive part of the economy – could soon see home prices falling, after the 200 BPs rise in the 30-year mortgage rate since the start of the year (Chart 6). Wages have failed to rise in line with inflation, which has led to retail sales falling year-on-year in real terms (Chart 7). And there are even some signs that companies are slowing their hiring, presumably on worries about the durability of the recovery: In the latest ISM surveys, the employment component fell to close to 50 (Chart 8). Chart 5Some Recession Indicators Look Worrying
Some Recession Indicators Look Worrying
Some Recession Indicators Look Worrying
Chart 6Housing Is The Most Vulnerable Sector
Housing Is The Most Vulnerable Sector
Housing Is The Most Vulnerable Sector
Chart 7Real Retail Sales Are Falling
Real Retail Sales Are Falling
Real Retail Sales Are Falling
Chart 8Signs That Companies Are Growing Wary Of Hiring?
Signs That Companies Are Growing Wary Of Hiring?
Signs That Companies Are Growing Wary Of Hiring?
The strongest argument against there being a recession is the $2.2 trillion of excess savings held by US households (and $5 trillion among households in all major developed economies). The argument is that, even if interest rates rise and real wage growth is negative, consumers can continue to spend by dipping into these accumulated savings. But there are some problems here. The savings are highly concentrated among the rich, who have a lower propensity to spend (Chart 9). Because of “mental accounting” biases, people may think only of current income, not savings, when considering how much to spend. And, as spending shifts back from goods to services, now that pandemic rules are largely over (Chart 10), spending on manufactured products is likely to fall below trend (since many purchases were brought forward). But it is hard to catch up on previously missed services spending (you can’t take three vacations this year to make up for those you missed in 2020 and 2021), and so services spending will, at best, only return to trend. Chart 9The Rich Have All The Money
The Rich Have All The Money
The Rich Have All The Money
Chart 10Can Services Take Over From Goods Spending?
Can Services Take Over From Goods Spending?
Can Services Take Over From Goods Spending?
Meanwhile, central banks will be focused on fighting inflation. All of them are expected to take rates to or above neutral over the next 12 months (Chart 11) – implying a squeeze on aggregate demand. Although inflation may be peaking, it is still well above most central banks’ comfort zones. In the US, for example, the FOMC expects core PCE to ease to 4.1% by year-end and 2.6% by end-2023, but that is still higher than its 2% target. The Fed is likely to remain focused on the upside risks to inflation: From rising services prices (Chart 12), and the risk of a price-wage spiral (Chart 13). BCA Research’s bond strategists expect the Fed to hike by 50 BPs at each of the next two meetings (in June and July), and then to revert to 25 BPs a meeting, as long as it is clear by then that inflation is trending down.1 Chart 11Rates Are Going To Or Above Neutral Everywhere
Rates Are Going To Or Above Neutral Everywhere
Rates Are Going To Or Above Neutral Everywhere
Chart 12Inflation Risks: Rising Services Prices...
Inflation Risks: Rising Services Prices...
Inflation Risks: Rising Services Prices...
Our conclusion is that the jury is out on the probability of recession – and is likely to stay out for a while. So far this year, equities and bonds have both performed poorly – with a 60:40 equity/bond portfolio producing the worst start to a year in three decades (Chart 14). Equities have wobbled because of tight monetary policy and worries about slowing growth; bonds because of inflation concerns. This is likely to remain the case until there is more clarity about the risk of recession. In this environment, we expect global equities to move sideways, with significant volatility – falling on signs of weakening growth, but rallying on hopes that the Fed may change its course.2 Chart 13...And A Price-Wage Spiral
...And A Price-Wage Spiral
...And A Price-Wage Spiral
Chart 14Nowhere To Hide This Year
Nowhere To Hide This Year
Nowhere To Hide This Year
We continue, therefore, to recommend fairly cautious portfolio positioning, with a neutral weight in global equities (and a preference for defensive country and sector allocations). Investors should keep a healthy holding in cash, giving them dry powder to use when a better entry-point into risk assets presents itself. Fixed Income: Bond yields have fallen over the past month, with the US 10-year Treasury yield slipping to 2.8% from 3.1% in early May. As per BCA Research’s Golden Rule of Bond Investing, the level of yields will be determined by whether the Fed (and other central banks) surprise dovishly or hawkishly relative to market expectations (Chart 15).3 The Fed is likely to hike slightly less this year than the market is pricing in, but may continue to raise rates beyond mid-2023, compared to a market expectation of rate cuts then (see Chart 11, panel 1 above). This points to the 10-year yield remaining broadly flat for the rest of this year, but possibly rising after that. Historically, rates tend to peak in line with trend nominal GDP growth (Chart 16). This means that, if the expansion continues for another couple of years, the 10-year yield could reach 4%. We, therefore, recommend an underweight on bonds. However, government bonds do now represent a good hedge again, with strong capital gain in the event of recession (Table 2). We recommend a neutral weight on government bonds within the fixed-income category. Chart 15The Golden Rule Of Bond Investing
The Golden Rule Of Bond Investing
The Golden Rule Of Bond Investing
Chart 16Rates Tend To Peak In Line With Trend Nominal GDP Growth
Rates Tend To Peak In Line With Trend Nominal GDP Growth
Rates Tend To Peak In Line With Trend Nominal GDP Growth
Table 2Government Bonds Now Offer Good Returns In A Recession
Monthly Portfolio Update: Recession Or No Recession?
Monthly Portfolio Update: Recession Or No Recession?
Chart 17Credit Now Offers Attractive Valuations
Monthly Portfolio Update: Recession Or No Recession?
Monthly Portfolio Update: Recession Or No Recession?
The recent rise in credit spreads has opened some opportunities. Valuations for both investment-grade (IG) and high-yield (HY) bonds are now attractive again, with all but the highest-quality bonds trading at a breakeven spread higher than the long-run median (Chart 17). The likelihood of defaults is rising, however, so we lower our weighting in HY (whilst remaining slightly overweight) and raise the weight in IG, also to a small overweight. We fund this by cutting our recommendation in Emerging Market debt to underweight. Credit, especially in the US, now offers tempting returns as long as the economy avoids recession, and is a relatively low-risk way to gain exposure to upside surprises. Chart 18US Performance Has Lagged This Year
US Performance Has Lagged This Year
US Performance Has Lagged This Year
Equities: US relative equity performance has been a little disappointing year-to-date, dragged down by the performance of the IT sector (Chart 18). Nonetheless, we stick to our overweight, given the market’s lower beta and the likely greater resilience of the US economy. Among sectors, we raise our weighting in Energy to overweight from neutral. Our energy strategists recently lifted their forecast for end-2022 Brent crude to $120 from $90, and raise the possibility of even $140 (see below for more on why). Despite the sharp outperformance of Energy stocks over the past six months, the sector has barely registered net inflows – presumably because of ESG (Chart 19). As we argued in a recent report, oil producers could be the new “sin stocks”, making the sector attractive over the next few years to investors who do not have ethical restraints on investing in it. We fund the overweight in Energy by lowering our weighting in Industrials to neutral. Capex is a late-cycle play and capital-goods makers benefited as manufacturers rushed to increase production during the recent consumer boom. But signs are now emerging that companies are becoming more cautious on capex (Chart 20). Chart 19Weak Flows Into The Energy Sector Despite Strong Performance
Monthly Portfolio Update: Recession Or No Recession?
Monthly Portfolio Update: Recession Or No Recession?
Chart 20Companies Are Becoming More Cautious On Capex
Companies Are Becoming More Cautious On Capex
Companies Are Becoming More Cautious On Capex
Commodities: China’s growth remains very weak and, although commodity prices have started to fall (with copper down 9% and iron ore 11% in Q2), they have not yet caught up with the slowdown in Chinese imports (Chart 21). The key question is whether China will now roll out a big stimulus. Given the government’s determination to persevere with the zero-Covid policy, and its need to achieve the 5.5% GDP growth target this year, it will eventually have no choice. But it is reluctant to trigger another housing boom, and there are doubts about how effective stimulus would be given the property market’s dysfunction. For now, we remain cautious on the Materials sector, and on commodities as an alternative asset – though the long-term structural story (because of the build-out of alternative energy) remains strong. Oil and natural-gas prices are likely to remain high due to disruptions in supply from Russia. Russia will probably have to shut 1.6 m b/d of production following the EU embargo on Russian oil imports. The EU is rushing to build up natural-gas inventories before the winter, in case Russia bans gas exports to Europe in retaliation (Chart 22). Higher oil prices are positive for the Energy sector, and for countries such as Canada (whose equity market we raise to neutral, funding this by trimming the overweight in the US). Chart 21Commodity Prices Dragged Down By Weak Chinese Growth
Commodity Prices Dragged Down By Weak Chinese Growth
Commodity Prices Dragged Down By Weak Chinese Growth
Chart 22The EU Will Need To Buy Lots Of Natural Gas
Monthly Portfolio Update: Recession Or No Recession?
Monthly Portfolio Update: Recession Or No Recession?
Currencies: Momentum, cyclical factors, and interest-rate differentials still favor the US dollar. Although the Fed will not raise rates quite as much as futures are pricing in, other central banks – especially the ECB and the Reserve Bank of Australia – will miss by more (Table 3). Nevertheless, the USD looks very overvalued (Chart 23) and speculators are long the currency. This means that, once global growth bottoms, there could be a sharp depreciation in the dollar. We remain neutral on the USD. Our preferred defensive currency is the CHF, since the other usual safe haven, the JPY, will remain depressed if, as we expect, the Bank of Japan persists with its yield curve control, limiting the 10-year JGB yield to 0.25%. Table 3Most Central Banks Will Not Hike As Much As Futures Predict
Monthly Portfolio Update: Recession Or No Recession?
Monthly Portfolio Update: Recession Or No Recession?
Chart 23US Dollar Is Very Overvalued
US Dollar Is Very Overvalued
US Dollar Is Very Overvalued
Garry Evans, Senior Vice President Global Asset Allocation garry@bcaresearch.com Footnotes 1 Please see US Bond Strategy Report, “Echoes Of 2018” dated May 24, 2022. 2 BCA Research’s US equity strategists call this a “Fat and Flat” market. Please see “What Is Next For US Equities? They Will Be Fat And Flat”. 3 Please see “Updating Our Global Golden Rule Of Bond Investing As Inflation Momentum Peaks” for an explanation of how the Golden Rule works in different countries. Recommended Asset Allocation Model Portfolio (USD Terms)
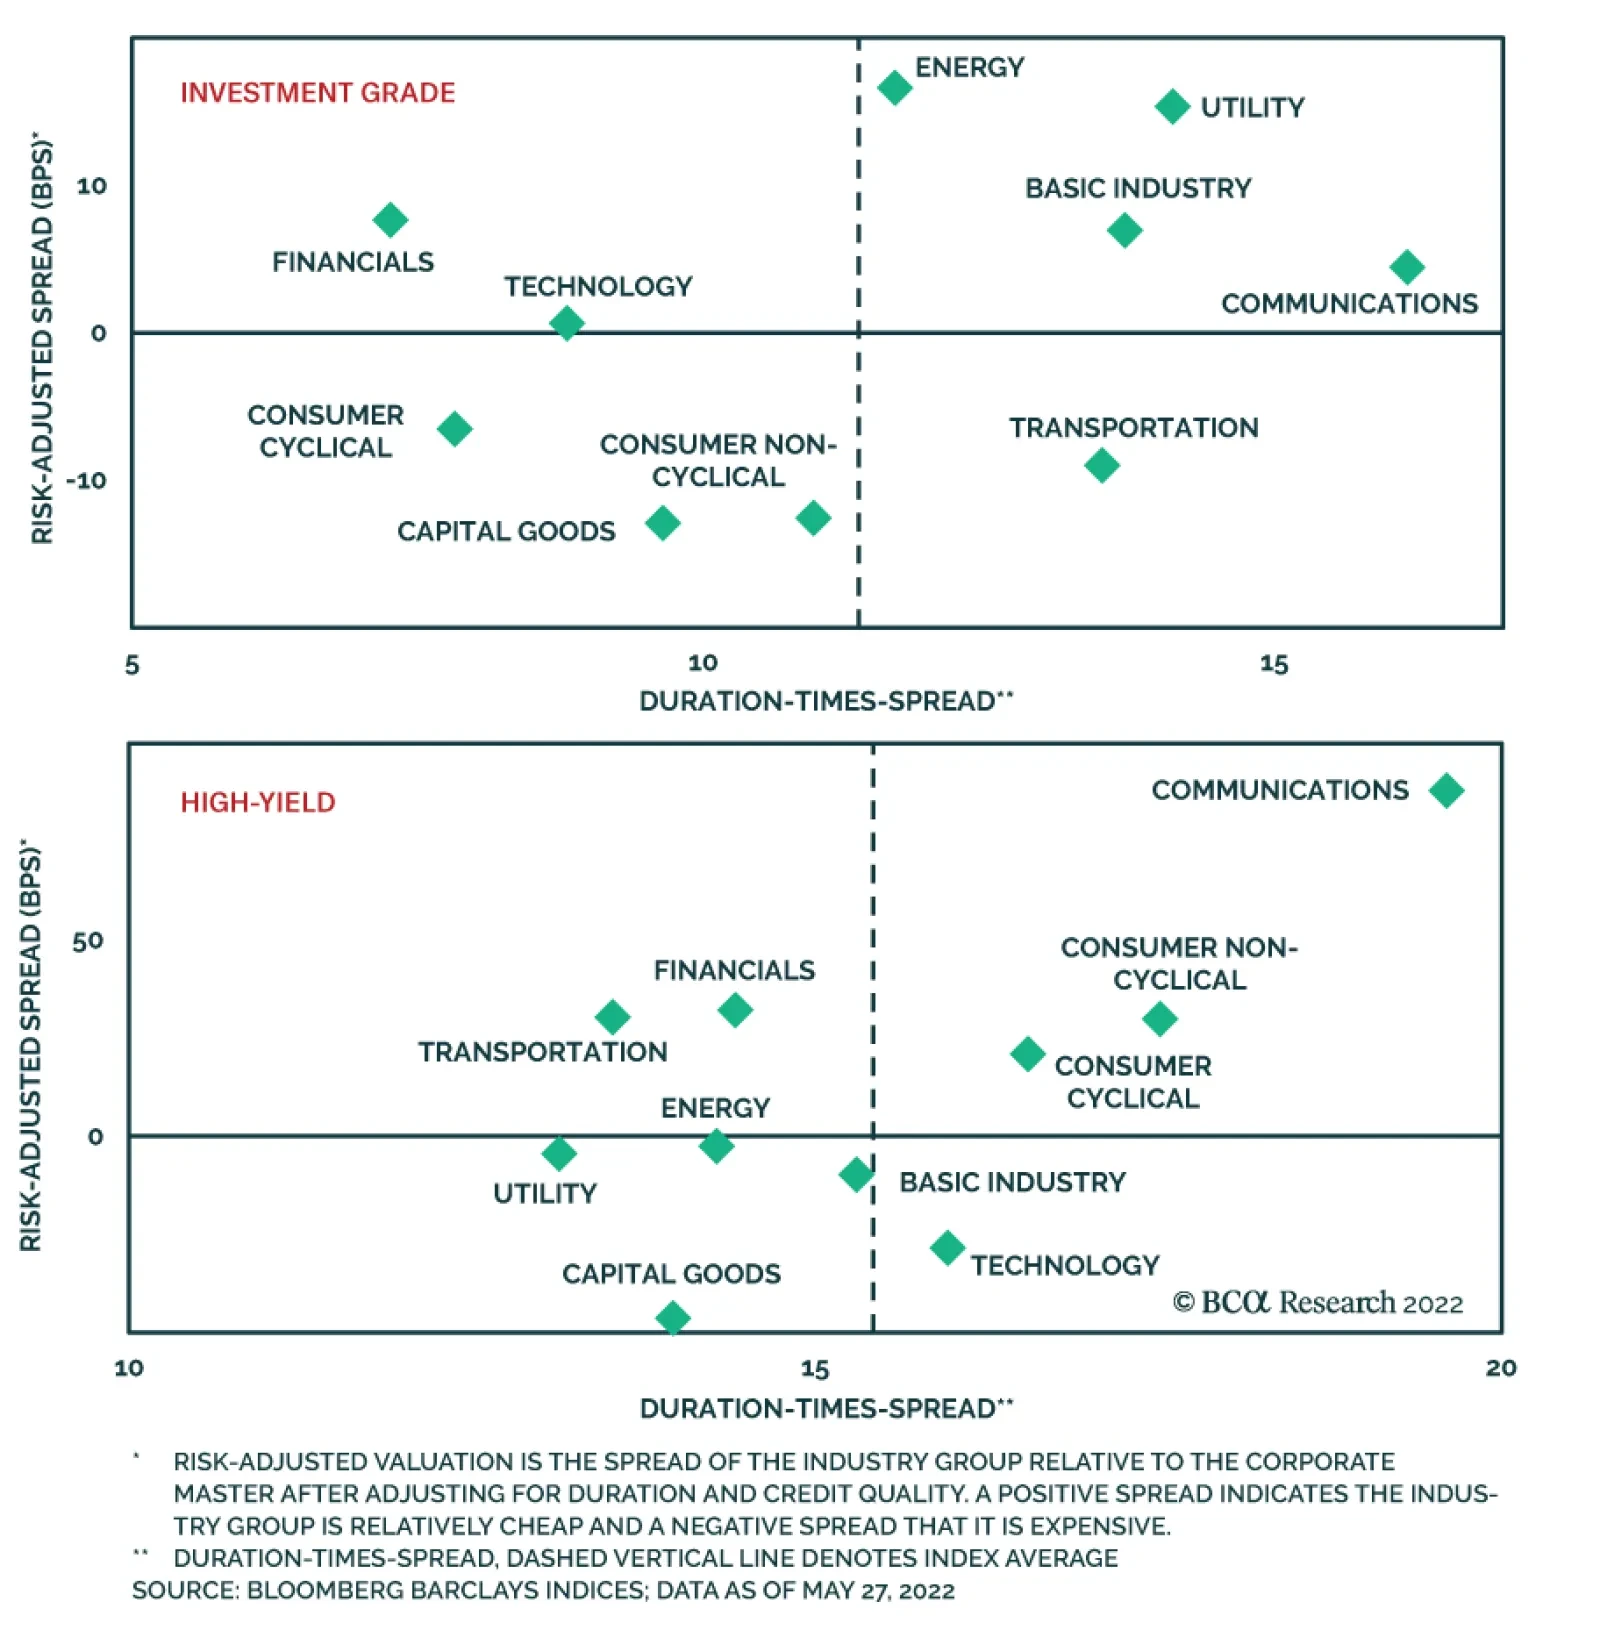
According to BCA Research’s Global Fixed Income Strategy & US Bond Strategy services energy bonds offer the most compelling combination of valuation and fundamental support within US investment grade. Despite the strong outperformance of high-yield…
Executive Summary European Spreads Have Cheapened Up More Than US Spreads
European Spreads Have Cheapened Up More Than US Spreads
European Spreads Have Cheapened Up More Than US Spreads
Corporate bond spreads in the US and Europe have widened since early April, with European credit taking a bigger hit because of worsening growth and inflation momentum. European corporate bond valuations look fairly cheap, both for investment grade and high-yield. This is true in absolute terms but also relative to the US, where spread valuations are more mixed. An easing of stagflation fears in Europe is a necessary condition for a valuation convergence with the US. The US investment grade credit curve is steep relative to the overall level of credit spreads, making longer-maturity corporates more attractive. Energy bonds offer the most compelling combination of valuation and fundamental support (from high oil prices) within US investment grade. Within US high-yield, Energy valuations look much less compelling after the recent outperformance. The best medium-term industry values in European credit are in investment grade Financials and high-yield Consumer Cyclicals & Non-Cyclicals. Bottom Line: Continue to favor both US high-yield and European investment grade corporates versus US investment grade. Stay neutral high-yield exposure on both sides of the Atlantic. Within Europe, stay up in quality within both investment grade and high-yield until near-term macro risks on growth & inflation subside. Feature Corporate bonds in the US and Europe have gone through a rough patch in recent weeks, underperforming government bonds in response to the “triple threat” of high inflation, tightening monetary policy and slowing growth momentum. European credit has taken the more severe hit compared to the US, with markets pricing in greater risk premia because of additional regional threats to growth (and inflation) from the Ukraine war. In this Special Report, jointly presented by BCA Research US Bond Strategy and Global Fixed Income Strategy, we assess credit spread valuations in US and European corporates after the latest selloff, across credit tiers, maturities and industry groups. Stay Cautious On US Corporate Bonds Chart 1US Credit Spreads
US Credit Spreads
US Credit Spreads
In a recent Special Report, we argued in favor of a relatively defensive allocation to US corporate bonds. Specifically, we advised investors to adopt an underweight (2 out of 5) allocation to US investment grade corporates and a neutral (3 out of 5) allocation to US high-yield. Our rationale was that a flat US Treasury curve signaled that we were in the middle-to-late stages of the economic recovery. Additionally, at the time, corporate bond spreads weren’t all that attractive compared to the average levels seen during the last Fed tightening cycle (Chart 1). Spreads have widened somewhat since we downgraded our allocation and, as such, we see some scope for spread tightening during the next few months as inflation rolls over and the Fed lifts rates by no more than what is already priced in the curve. That said, with the Fed in the midst of a tightening cycle, we think it’s unlikely that spreads can stay below average 2017-19 levels for any meaningful length of time. As a result, we maintain our current cautious allocation to US corporate bonds. US High-Yield Versus US Investment Grade The recent period of US corporate bond underperformance can be split into two stages based on the relative performance of investment grade and high-yield. US investment grade underperformed junk in the early stages of the selloff (between September and mid-March), as spread widening was driven by the Fed’s shift toward a more restrictive policy stance and not a meaningful uptick in the perceived risk of a recession and/or default wave (Chart 2A). Chart 2ACorporate Bond Excess Returns* Versus Duration-Times-Spread: September 27, 2021 To March 14, 2022
Looking For Opportunities In US & European Corporates After The Recent Selloff
Looking For Opportunities In US & European Corporates After The Recent Selloff
But recession and default fears started to ramp up in mid-March, and this caused high-yield to join the selloff (Chart 2B). In fact, US investment grade corporates managed to recoup some of their earlier losses while lower-rated junk bonds struggled to keep pace. Chart 2BCorporate Bond Excess Returns* Versus Duration-Times-Spread: March 14, 2022 To Present
Looking For Opportunities In US & European Corporates After The Recent Selloff
Looking For Opportunities In US & European Corporates After The Recent Selloff
We contend that the risk of a meaningful uptick in corporate defaults during the next 12 months is low. In fact, we estimate that the US high-yield default rate will fall to between 2.7% and 3.7% during the next year, well below the 5.2% currently priced into junk spreads. Going forward, we expect the US corporate bond landscape to be defined by increasingly restrictive monetary policy and a benign default outlook. As we noted in the aforementioned Special Report, this environment is reminiscent of the 2004-06 Fed tightening cycle when high-yield bonds performed much better than investment grade. Investors should maintain a preference for high-yield over investment grade within an otherwise defensive allocation to US corporate bonds. US Industry Groups Chart 3A shows the performance of US corporate bonds in the early stages of the recent selloff, but this time split by industry group. High-yield Energy sticks out as a strong outperformer, though we also notice that every high-yield sector performed better than its investment grade counterpart. Chart 3ACorporate Bond Excess Returns* Versus Duration-Times-Spread: September 27, 2021 To March 14, 2022
Looking For Opportunities In US & European Corporates After The Recent Selloff
Looking For Opportunities In US & European Corporates After The Recent Selloff
Chart 3B once again shows how the relative performance between investment grade and high-yield has flipped since mid-March, though we see that high-yield Energy, Transportation and Utilities have performed better than the rest of the index. Chart 3BCorporate Bond Excess Returns* Versus Duration-Times-Spread: March 14, 2022 To Present
Looking For Opportunities In US & European Corporates After The Recent Selloff
Looking For Opportunities In US & European Corporates After The Recent Selloff
Interestingly, despite the strong outperformance of high-yield Energy bonds, investment grade Energy credits performed mostly in line with other investment grade sectors. We believe this presents an excellent opportunity. The vertical axis of Chart 4A shows our measure of the risk-adjusted spread available in each investment grade industry group. Our risk-adjusted spread is the residual after adjusting for each sector’s credit rating and duration. The horizontal axis shows each sector’s Duration-Times-Spread as a simple measure of risk. Our model shows that Financials, Technology, Energy, Utilities, Communications and Basic Industry all stand out as attractive within the investment grade corporate bond universe. We identify the investment grade Energy sector as a particularly compelling buy. Chart 4AUS Investment Grade Corporate Sector Valuation
Looking For Opportunities In US & European Corporates After The Recent Selloff
Looking For Opportunities In US & European Corporates After The Recent Selloff
In a prior report, we demonstrated, unsurprisingly, that the oil price is an important determinant of whether Energy bonds perform better or worse than the rest of the corporate index. With our commodity strategists calling for the Brent crude oil price to average $122/bbl next year, this will provide strong support to Energy bond returns. Cheap starting valuations for investment grade Energy bonds make them look even more compelling. Chart 4B repeats our valuation exercise but for high-yield industry groups. Within high-yield, we find that Financials, Transportation, Communications and Consumer sectors stand out as attractive. Interestingly, high-yield Energy bonds now look slightly expensive compared to the rest of the junk bond universe, a result of the sector’s recent incredibly strong performance. Chart 4BUS High-Yield Corporate Sector Valuation
Looking For Opportunities In US & European Corporates After The Recent Selloff
Looking For Opportunities In US & European Corporates After The Recent Selloff
US Credit Curve We define the credit curve as the difference in option-adjusted spread between the “Long Maturity” and “Intermediate Maturity” sub-indexes for each investment grade credit tier, as defined by Bloomberg. We exclude high-yield from this analysis because very few high-yield bonds are classified as “Long Maturity”. To analyze the credit curve, we observe that credit curves tend to be steeper when credit spreads are tight, and vice-versa. This is because tight spreads indicate that the perceived near-term risk of default is low. As a result, short-maturity spreads tend to be lower than spreads at the long-end of the curve. Conversely, a wide spread environment indicates that the perceived near-term risk of default is high, and this risk will be more reflected in shorter maturity credits. Charts 5A, 5B and 5C show the slopes of the credit curves for Aa, A and Baa-rated securities. Immediately we notice that credit curves are positively sloped in each case, and also that each credit curve is somewhat steeper than would be predicted based on the average spread for the overall credit tier. Chart 5AAa-Rated Credit Curve
Looking For Opportunities In US & European Corporates After The Recent Selloff
Looking For Opportunities In US & European Corporates After The Recent Selloff
Chart 5BA-Rated Credit Curve
Looking For Opportunities In US & European Corporates After The Recent Selloff
Looking For Opportunities In US & European Corporates After The Recent Selloff
Chart 5CBaa-Rated Credit Curve
Looking For Opportunities In US & European Corporates After The Recent Selloff
Looking For Opportunities In US & European Corporates After The Recent Selloff
This strongly suggests that investors should favor long-maturity over short-maturity US investment grade corporate bonds. European Corporates Look Cheap Vs. US Equivalents – For Patient Investors Chart 6European Credit Spreads At Past 'Non-Crisis' Peaks
European Credit Spreads At Past 'Non-Crisis' Peaks
European Credit Spreads At Past 'Non-Crisis' Peaks
Turning to the euro area, the Bloomberg investment grade OAS and high-yield OAS currently sit at 167bps and 490bps, respectively (Chart 6). These levels are well below the peaks seen during the 2020 COVID recession and the 2011/12 European debt crisis, but are in line with the spread widening episodes in 2014/15 and 2018. Our preferred measure of credit spread valuation, 12-month breakeven spreads, show that European investment grade and high-yield spreads are in the 75th and 67th percentile of outcomes, respectively, dating back to the inception of the euro in 1998 (Chart 7).1 These are both higher compared to the breakeven percentile rankings for US investment grade (48%) and US high-yield (52%). The gap between the breakeven percentile rankings for investment grade bonds in the euro area versus the US is the widest seen over the past two decades. That gap reflects the fact that European economic growth has softened versus the US according to the S&P Global manufacturing PMIs, while European inflation has accelerated towards very elevated US levels (Chart 8). Chart 7European Spreads Have Cheapened Up More Than US Spreads
European Spreads Have Cheapened Up More Than US Spreads
European Spreads Have Cheapened Up More Than US Spreads
Chart 8European Corporate Underperformance Reflects Relative Growth & Inflation
European Corporate Underperformance Reflects Relative Growth & Inflation
European Corporate Underperformance Reflects Relative Growth & Inflation
Both of those trends are a product of the Ukraine war, which has led to a massive spike in European energy costs given the region's huge reliance on Russian energy supplies, particularly for natural gas. While the US has also suffered a massive increase in its own energy bills, the inflation spike has been higher in Europe, leading to a bigger drag on economic confidence and growth. Thus, the widening spread differential between corporate bonds in Europe relative to the US likely reflects a growth-related risk premium. Chart 9A Turning Point For European Corporate Bond Performance?
A Turning Point For European Corporate Bond Performance?
A Turning Point For European Corporate Bond Performance?
As euro area inflation has ratcheted higher, so have expectations of ECB monetary tightening. The euro area overnight index swap (OIS) curve now discounts 172bps over the next 12 months, a huge swing from the start of 2022 when markets were expecting the European Central Bank (ECB) to stand pat on the interest rate front. In comparison, markets are pricing in another 224bps of Fed tightening over the next 12 months, even after the Fed has already delivered 75bps of tightening since March. Importantly, the gap between our 12-month discounters, which measure one-year-ahead interest rate changes discounted into OIS curves, for the US and Europe has proven to be a reliable leading indicator – by around nine months - of the relative year-over-year excess returns (on a USD-hedged basis) of European and US corporate bonds, especially for investment grade (Chart 9). The fact that this is a leading relationship suggests that the upward repricing of ECB rate expectations seen so far in 2022 is not yet a reason to turn more cyclically negative on European corporate bonds versus the US. The earlier upward repricing of expected Fed tightening is the more relevant factor, and is signaling that both US investment grade and high-yield corporates should underperform European equivalents over at least the rest of 2022. BCA Research Global Fixed Income Strategy already has a recommended allocation along those lines, with an overweight to euro area investment grade and an underweight to US investment grade. While the trade has underperformed of late, the combined messages from the relative 12-month breakeven spread rankings (cheaper European valuations) and 12-month discounters (the Fed is further ahead in the tightening cycle) leads us to stick with that relative cross-Atlantic tilt. The main risk to that stance is any deterioration of the flow of energy supplies from Russia to Europe that results in a stagflationary outcome of a bigger growth slowdown with even faster inflation. That is a scenario that would make it difficult for the ECB to back down from its recent hawkish forward guidance, resulting in European corporate spreads incorporating an even wider risk premium. Given that near-term uncertainty, we are advocating that investors maintain no relative tilt on more growth-sensitive, and riskier, European high-yield relative to the US – stay neutral on both. Stay Up In Quality On European Corporates Looking at euro area corporate debt across credit ratings and maturity buckets, there are few compelling immediate valuation stories in absolute terms, although there are potential opportunities unfolding on a relative basis. Within investment grade, credit quality curves have steepened during the recent selloff, with lower-rated credit seeing larger spread widening (Chart 10). The gap between Baa-rated and A-rated European corporate spreads now sits at 52bps, right in the middle of the 25-75bps range since 2014. In high-yield, the gap between Ba-rated and B-rated credit spreads is 222bps, and the gap between B-rated and Caa-rated spreads is 370bps (Chart 11) – both are still below the previous peaks in those relationships seen in 2012, 2015 and 2020. Chart 10European IG Credit Quality Curve Can Steepen ##br##More
European IG Credit Quality Curve Can Steepen More
European IG Credit Quality Curve Can Steepen More
Chart 11European HY Credit Quality Curve Still Below Previous Peaks
European HY Credit Quality Curve Still Below Previous Peaks
European HY Credit Quality Curve Still Below Previous Peaks
For both investment grade and high-yield, there is still room for credit curves to steepen if European growth expectations continue to deteriorate. However, when looking at spread valuations across the credit quality spectrum, and across maturity buckets, euro area corporate spreads look much cheaper than US equivalents. In Chart 12, we show a snapshot of the current 12-month breakeven percentile rankings for individual credit quality tiers and maturity groups, for investment grade and high-yield in the euro area and US. The relative attractiveness of European credit relative to the US is evident, with European spreads now at higher percentile rankings across all quality tiers and maturity buckets. The largest gaps between 12-month breakeven percentile rankings are in the +10 year maturity bucket, the AAA-rated and AA-rated investment grade credit tiers, and the Ba-rated high-yield credit tier. This suggests any trades favoring European corporates versus the US should stay up in credit quality. Chart 12Corporate Spread Valuations By Maturity & Credit Rating Favor Europe
Looking For Opportunities In US & European Corporates After The Recent Selloff
Looking For Opportunities In US & European Corporates After The Recent Selloff
Comparing European & US Industry Spread Valuations When looking at the industry composition of the euro area and US corporate bond indices, there are a few major notable differences. Within investment grade, there is a greater concentration of Energy and Technology names in the US, while Financials are more represented in the European index (Chart 13). Those same three industries also have the largest relative weightings in the high-yield indices (Chart 14), although there is also a slightly larger weighting of high-yield Transportation companies in Europe compared to the US. This means that a bet on European credit versus the US is essentially a bet on European Financials versus US Energy and Technology. Chart 13Investment Grade Corporate Bond Market Cap Weights
Looking For Opportunities In US & European Corporates After The Recent Selloff
Looking For Opportunities In US & European Corporates After The Recent Selloff
Chart 14High-Yield Corporate Bond Market Cap Weights
Looking For Opportunities In US & European Corporates After The Recent Selloff
Looking For Opportunities In US & European Corporates After The Recent Selloff
When looking at the same sector metrics that were shown earlier in this report for the US – comparing risk-adjusted spreads to Duration-Times-Spread – we find some interesting cross-Atlantic valuation differentials. For investment grade in Europe (Chart 15), only Energy and Financials have positive risk-adjusted spread valuations (after controlling for duration and credit quality), while having the highest level of risk expressed via Duration-Times-Spread. This contrasts to the US where more sectors have positive risk-adjusted spreads - Energy, Financials, Utilities, Basic Industry and Communications. Investors should favor the latter three industries in the US relative to Europe. Chart 15Euro Area Investment Grade Corporate Sector Valuation
Looking For Opportunities In US & European Corporates After The Recent Selloff
Looking For Opportunities In US & European Corporates After The Recent Selloff
Within high-yield in Europe, Energy and Financials also offer positive risk-adjusted valuations, but so do Consumer Cyclicals and Consumer Non-Cyclicals (Chart 16). This lines up similarly to US high-yield valuations. The notable valuation gaps exist in Transportation and Communications, which look cheap in the US and expensive in Europe, creating potential cross-Atlantic relative value trade opportunities between those sectors (and within an overall neutral allocation to junk in both regions). Chart 16Euro Area High-Yield Corporate Sector Valuation
Looking For Opportunities In US & European Corporates After The Recent Selloff
Looking For Opportunities In US & European Corporates After The Recent Selloff
Ryan Swift US Bond Strategist rswift@bcaresearch.com Robert Robis, CFA Chief Fixed Income Strategist rrobis@bcaresearch.com Footnotes 1 12-month breakeven spreads measure the amount of spread widening that would be necessary to make the return on corporate bonds equal to that of duration-matched government bonds over a one-year horizon. The spread is calculated as a ratio of the index OAS and index duration for the relevant credit market. We look at the historical percentile ranking of that ratio to make a more “apples for apples” comparison of spreads that factors in index duration changes over time. Recommended Portfolio Specification Other Recommendations Treasury Index Returns Spread Product Returns
Executive Summary Selloffs across financial markets and evidence of decelerating growth have reminded us to play it close to the vest, but they haven't made us bearish. The stability of intermediate- and long-run inflation expectations suggests that the inflation genie has not yet gotten out of the bottle and that the Fed will be able to hold off on squashing the expansion until late 2023 or early 2024. Households' willingness to dip into their excess savings to maintain their spending in the face of inflationary pressures bodes well for the economy for the remaining year and a half that the excess savings cushion can be expected to last. The definitive causes of reduced labor force participation continue to elude researchers but we expect participation will improve over the rest of the year as the low-paid workers responsible for the exodus return to the grind. The Fed Fever Has Broken
The Fed Fever Has Broken
The Fed Fever Has Broken
Bottom Line: Investors have no end of things to worry about, but we remain disposed to see the glass as half-full. We expect the expansion to continue at least into the second half of 2023 and that risk assets will generate positive excess returns over Treasuries and cash for the next twelve months. Feature We have begun meeting clients face-to-face again, in addition to continuing with conference calls. Our discussions with investors and colleagues highlight how uncertain the market and economic landscapes remain. Conditions remain especially uncertain and our views depend on the flow of data; as more pieces of the puzzle emerge, the way we assemble it is subject to change. Conviction Levels In Uncertain Times You are among the optimists at BCA and have been for a while. Are the equity selloff and the current slowdown making you nervous? Do you still see the glass as half-full? It’s our job to be nervous. The way we see the money management ecosystem, managers are responsible for worrying for their clients and we’re responsible for worrying for the managers. We continually ask how we could be getting it wrong and actively seek out information that challenges our view. We are neither foolish nor inexperienced enough to be overconfident; we’re always looking over our shoulder and our head has been on a swivel ever since the pandemic arrived. Related Report US Investment StrategyIt All Depends On Whom You Ask The recent equity decline and growth deceleration have not materially changed our already low conviction level. All investment researchers look backward to look forward. That is to say that we review past interactions between macro variables and financial assets for guidance about future interactions. We even build regression models to formalize our empirical studies, though we keep them in their proper place. We know that models have blind spots and do not rely solely on them any more than we would change lanes on the highway based only on a glance at our rear-view mirrors. A central challenge of the last two-plus years has been that real-time conditions are so unusual that there is little historical framework for evaluating them. Much of what has occurred over that stretch has lacked a close precedent: vast swaths of the economy had not previously been idled in the interest of public safety; Congress did not appropriate 25% of a year’s GDP for distribution to households, businesses and state and local governments in any prior 13-month stretch; job losses had not been so starkly concentrated among unskilled workers while leaving knowledge workers largely unscathed; aggregate household savings and net worth have never risen so much, so fast; and central banks have launched campaigns that would make William McChesney Martin’s head spin, much less Walter Bagehot’s. The scope of the economic challenges and the novelty of the policy responses limit the usefulness of analytical methods that depend on the notion that the future will largely resemble the past. It is therefore too soon to tell if we should be more nervous. As we write, the S&P 500 has blasted 8% off its intraday lows five sessions ago and incoming economic data continue to resist a blanket bullish or bearish interpretation. We empathize with investors’ impatience; one would think that the key macro questions should be settled by now, given how long we’ve been discussing them. They are not settled, though, and we will revisit open debates as new data arrive. The Term Structure Of Inflation Expectations Real-time inflation prints are terrible and much more concerning than tame inflation expectations. Why are you focusing almost exclusively on inflation expectations? We have been keeping a close eye on the course of inflation expectations over time, or their term structure, ever since inflation began to emerge from its extended hibernation. As unsettling as it has been to witness 40-year highs in inflation, we have taken solace from the fact that market prices have uniformly indicated that businesses and investors expect that inflation will recede to familiar levels over the longer run. As indicated by the arrows in the right-hand column, long-term inflation expectations are considerably lower than near-term expectations as implied by the TIPS and nominal Treasury markets (Table 1, top panel) and directly indicated by CPI swaps (Table 1, bottom panel). Expressed as a continuous time series, neither the Treasury (Chart 1, top panel) nor the CPI swaps (Chart 1, bottom panel) market has wavered in its view that high inflation will not persist beyond the near term. Table 1The Inflations Expectations Curve Is Sharply Inverted
Another Round Of Questions
Another Round Of Questions
That is important because it suggests that neither businesses nor investors will need to adjust their strategies to accommodate a lasting upward inflection in price pressures. For businesses, that means that they don’t foresee a need to fight tooth and nail to pass along increased costs. Investors continue to be content with nominal long-term Treasury yields vastly below current year-over year inflation, investment-grade corporate yields that are about half of it and high-yield corporate yields that are a percentage point below it. Chart 1Investors And Businesses Don't Foresee A Lasting Change ...
Another Round Of Questions
Another Round Of Questions
Chart 2... And Neither Do Households
... And Neither Do Households
... And Neither Do Households
Although high inflation seems to have spooked the households responding to University of Michigan consumer sentiment survey takers, they remain unperturbed about its long-run direction. The difference between University of Michigan respondents’ long-run and near-term inflation expectations remains around multi-year lows (Chart 2), as 5-year expectations have held steady at 3% for three straight months. The inference that University of Michigan survey respondents expect high inflation to be fleeting is supported by their views on the advisability of big-ticket purchases. The share of respondents who deem it a bad time to buy a car because prices are (temporarily) high remains near all-time high levels (Chart 3, middle panel), while those who think buying now is auspicious because prices won’t come down is near all-time lows (Chart 3, top panel). The difference between the two continues to set record lows (Chart 3, bottom panel). The consensus view on consumer durables purchases is the same – now is a bad time to buy because high prices won’t last (Chart 4). The economic takeaway is that consumers are willing to bide their time until prices come back to earth and will not exacerbate upward price pressures by clamoring to buy before prices go even higher. Chart 3Consumers Are Willing To Wait Out Supply-And-Demand Imbalances, ...
Consumers Are Willing To Wait Out Supply-And-Demand Imbalances, ...
Consumers Are Willing To Wait Out Supply-And-Demand Imbalances, ...
Chart 4... Instead Of Exacerbating Them By Rushing To Buy Now
... Instead Of Exacerbating Them By Rushing To Buy Now
... Instead Of Exacerbating Them By Rushing To Buy Now
Bottom Line: Economic participants adjust their behavior based on their long-run inflation expectations. If they think the current fever will break, businesses, investors and consumers will not act in ways that fuel a self-reinforcing cycle in which high prices beget still higher prices. The longer that economic actors expect inflation pressures will abate, the greater the chance that they will. Interest Rates And The Fed You’ve been calling for interest rates to stop backing up, but it still feels like they only want to rise. It has been quite a ride from 1.72% on 10-year Treasuries from the beginning of March to 3.12% at the beginning of May, but we have gotten 40 basis points of retracement over the last three weeks (Chart 5). The nearly unanimous view that rates would keep rising was a contrarian sign that the move may have been played out. Reduced expectations for Fed rate hikes have also played a part in bringing yields down. After peaking at 3.45% on May 3rd, the day before the FOMC wrapped up its May meeting, the expected fed funds rate in twelve months is down to 3.09% (Chart 6). Chart 5The Benchmark Treasury Yield ...
The Benchmark Treasury Yield ...
The Benchmark Treasury Yield ...
Chart 6... Has Moved With Rate-Hike Expectations
... Has Moved With Rate-Hike Expectations
... Has Moved With Rate-Hike Expectations
Chart 7Everything, All At Once
Everything, All At Once
Everything, All At Once
While the prevailing view among commentators is that the Fed waited too long to begin removing monetary accommodation, financial markets have moved swiftly to price in a policy shift. Chair Powell and his colleagues have been taking every opportunity to communicate their seriousness about combating inflation and financial conditions have responded to their public relations campaign without delay (Chart 7, top panel) – yields have backed up (Chart 7, second panel), spreads have widened (Chart 7, third panel), stocks have fallen (Chart 7, fourth panel) and the dollar has surged (Chart 7, bottom panel). Our Global Investment Strategy colleagues argue that the Fed may soon perceive that tighter financial conditions threaten its soft landing goals and dial back the hawkish rhetoric if inflation eases in line with our house view. The Fed’s hawkish surprises might be behind us for the time being. Lightning Round You have argued that households will be more inclined to spend their excess pandemic savings than hoard them and that those savings will provide a buffer against inflation’s bite. The latest Personal Income Report showed that April’s savings rate was nearly half of its pre-pandemic level; are you now worried that the savings are going too fast to cushion the economy? We stand by our view that households will spend their excess savings and continue to think our guesstimate that they will spend half of them will prove to be conservative. We consider the declining savings rate – 6% in January, 5.9% in February, 5% in March and 4.4% in April, versus February 2020’s 8.3% – to be good news, indicating that socked-away stimulus payments are having the beneficial time-release effect of keeping the consumer afloat despite high inflation. We calculate that April’s accelerated consumption as a share of disposable income amounted to $60 billion of dis-savings relative to our no-pandemic baseline estimate, knocking excess savings down to $2,150 billion. At that rate, one-half of the excess balance will last for another 17 months. Will labor force participation ever get back to its pre-pandemic levels? If it doesn’t, upward wage pressures could be greater than you expect, and a wage-price spiral could be brewing. No one has satisfactorily determined why participation remains muted. It seems most likely to us that COVID fears, as indicated by the Census Bureau’s Household Pulse Survey, are the principal driver. Lavish stimulus measures may have played a role as well, though their tailwind has surely faded for households at the bottom rungs of the wealth and income distribution. We expect that participation will recover across the rest of the year as COVID morphs from acute threat to manageable nuisance and as the low-income workers who account for the shrinkage in the labor force (Chart 8) are pressed by financial exigency to return to the grind (Chart 9). Chart 8Those Who Have Left The Work Force ...
Those Who Have Left The Work Force ...
Those Who Have Left The Work Force ...
Chart 9... May Have To Come Back Soon
... May Have To Come Back Soon
... May Have To Come Back Soon
What is your view on inflation? If you think recession fears are overblown, you must not think inflation will be bad enough over the rest of the year to induce the Fed to kill the expansion. The difference between our view and the recession-is-imminent crowd’s is merely one of timing. We expect inflation will abate enough over the rest of the year that the Fed won’t have to break up the party until late 2023/early 2024. We do think, however, that Congress and the Fed overstimulated demand in the wake of the pandemic and sowed the seeds for the eventual end of the expansion and the bull markets in equities and credit. We don’t think the overstimulation will manifest itself until late 2023 or early 2024, however, so we expect that the expansion and the bull markets in risk assets will trundle along for another year. Housekeeping We planned to dial up the risk exposures in our ETF portfolio this week, in line with BCA’s recent tactical equity upgrade to overweight from neutral. It isn’t always easy to make tactical recommendations on a weekly publication schedule and while waiting out a five-and-a-half-hour flight delay at O'Hare last Friday, we wished that we could have pushed a button to increase our equity allocation. Now that the S&P 500 has rallied over 6.5% week-to-date as we go to press, we are going to hold off on making any adjustments until next week at the earliest. With apparent short-term resistance just 1% away at 4,200 (the previous triple-bottom support level), we expect that we may find a better entry point and are willing to wait patiently for it. Doug Peta, CFA Chief US Investment Strategist dougp@bcaresearch.com
Executive Summary Inflationary Pressures To Fade
Inflationary Pressures To Fade
Inflationary Pressures To Fade
The biggest problem for the European economy is surging inflation. Inflation has eroded household real disposable income and is hurting consumption. Inflation is set to roll over this summer, which should allow European economies to begin recovering in the fourth quarter of 2022. The ECB is likely to pause after exiting negative interest rates in Q3. European credit is becoming more attractive, but the risks to our view of European growth could still cause major problems for this asset class. Swiss stocks are vulnerable to a pullback relative to German ones. In France, President Emmanuel Macron is likely to get a legislative majority in June. Bottom Line: European growth should recover after inflation rolls over this summer. The peak in inflation will allow the ECB to pause after its deposit rate gets to zero. Despite this positive view, the large risks hanging over Europe suggest prudence is still warranted. European assets are rebounding in conjunction with the decline in risk aversion visible around global markets. The euro is catching a welcome bid too. However, as we wrote last week, while the conditions are falling in place to see a rally in Europe, too many risks continue to lurk in the background. Therefore, we maintain our conservative approach to European markets, and we still recommend a defensive portfolio. Related Report European Investment StrategyDon’t Be A Hero To shift to a less defensive stance, we want first to observe a peak in European inflation. Inflation represents the greatest problem for the European economy. If inflation continues to surge, the purchasing power of households will deteriorate further and the ECB will ratchet up its hawkish rhetoric, which will cause considerable mayhem in the European economy. A Reprieve For Europe? Only when the income suppressing impact of inflation recedes will European growth strengthen. Chart 1Paying More For The Same
Paying More For The Same
Paying More For The Same
Higher prices continue to hurt European consumption. As witnessed in the US, European retail sales are rising in nominal terms (Chart 1). However, households are not consuming more; they are spending more to purchase the same amount of goods, which is illustrated by the stagnation in retail sales volumes over the past twelve months. Households are not increasing the size of their consumption baskets, because their incomes are not keeping up with inflation. Unlike in the US, Eurozone households never saw their real disposable income spike during the pandemic because European governments focused on preserving jobs rather than distributing large handouts to households. As a result, European real disposable income began to lag its pre-pandemic trend (Chart 2). As the economy recovered, disposable income did not converge back to trend. Now that food and energy prices have spiked, the gap between real disposable income and its trend is only widening. Wages are not coming to the rescue either. The European labor market has been incapable of generating the same kind of wage growth that the US labor market has enjoyed. Even the recent uptick in negotiated wages is not as strong as it seems. German workers benefited from a one-off payment that caused wages to spike by 6.7%, elevating the Euro Area average to 2.8% from 1.6%. However, without that adjustment, German underlying wage growth fell from 3.9% to 1.6% (Chart 3), which means that the underlying European wage only rose by 2%. Chart 2Inflation Destroys Purchasing Power
Inflation Destroys Purchasing Power
Inflation Destroys Purchasing Power
Chart 3Not As Strong As It Seems
Not As Strong As It Seems
Not As Strong As It Seems
The distinction between one-off payments and underlying wages matters. As per Milton Friedman’s permanent income hypothesis, households are unlikely to shift their consumption pattern based on a temporary boost to income. They will save it, or in today’s case, use their one-off payment to cover their food and energy price increases. If today’s wage boost is not repeated, but inflation remains elevated, consumption will suffer. Europe’s tourism industry would be another major beneficiary from the peak in inflation. Prior to the pandemic, tourism contributed to 13%, 14% and 9% of the Italian, Spanish, and French economies, respectively. This sector was decimated during the pandemic after travel came to a halt. We are seeing positive signs emerge on this front. In the spring of 2021, nights spent at hotels were 80% below their spring 2019 levels for the Euro Area (Chart 4). As of March 2022, this variable is now between 15% and 30% below their March 2019 levels in Italy and France, respectively. Moreover, Google Mobility indices for the retail and recreation sectors have almost fully recovered (Chart 5). Thus, we can expect these trends to gather steam once inflation slows, because it will free up household disposable income. Europe’s periphery is particularly well placed to benefit from this eventual positive development. Chart 4Improving Tourism Sector
Improving Tourism Sector
Improving Tourism Sector
Chart 5Mobility Pick-Up
Mobility Pick-Up
Mobility Pick-Up
Positively, European inflation will peak soon. Commodity prices remain elevated, but commodity inflation has decelerated significantly. Hence, the commodity impulse is consistent with an imminent decline in Euro Area HICP (Chart 6). A simulation using BCA’s Commodity & Energy forecast for Brent, which also assumes that European natural gas prices will continue to hover around EUR100/MWh and that EUR/USD will hit 1.1 by year-end, confirms that energy inflation will swoon (Chart 7). Even if we assume a sudden surge in energy prices due to a Russian natural gas cutoff, energy inflation will recede in the second half of 2022 after spiking this summer. Chart 6Peak Inflation?
Peak Inflation?
Peak Inflation?
Chart 7Beware The Russia Cutoff Risk
Beware The Russia Cutoff Risk
Beware The Russia Cutoff Risk
Chart 8Less Pressure From The Consumer Of Last Resort
Less Pressure From The Consumer Of Last Resort
Less Pressure From The Consumer Of Last Resort
Beyond the energy market, global forces also point toward a peak in European inflation in the coming months. The surge in US goods consumption over the past 24 months was felt globally and generated inflationary pressures in Europe as well. However, US durable goods consumption is declining (Chart 8). As a result, this important driver of European inflation will recede. Bottom Line: European consumption will not recover until inflation peaks. Without a deceleration in inflation, household disposable income will remain weak and consumers will remain careful. The good news is that European inflation is still on track to begin its descent this summer, which will boost the prospect for consumer spending and tourism. ECB Update: A Fall Pause? In a blog post last Monday, ECB president Christine Lagarde confirmed that the central bank will lift interest rates in July and will push the deposit rate to zero by September. Chart 9Too Much Priced In
Too Much Priced In
Too Much Priced In
The economy is likely able to handle those two rate hikes. Our ECB monitor highlights the need to remove monetary accommodation in the Eurozone (Chart 9). Moreover, the German 2-/10-year yield curve has steepened this year, despite the hawkish shift in the ECB’s rhetoric, which confirms that monetary conditions are extremely accommodative. We expect the ECB to pause its rate hike campaign after exiting negative rates this fall to reassess economic conditions. Constraints on the ECB remain potent. If the central bank ignores these limiting factors, a policy mistake will ensue. Inflation is likely to decelerate by the end of the summer, which will undercut the hawks driving the consensus at the Governing Council today. Inflation is the factor pushing the ECB Monitor higher right now, not growth conditions (Chart 9, second panel). Thus, the case for lifting rates will weaken considerably when inflation slows. Growth is unlikely to have recovered enough by September to justify additional rate hikes after inflation slows. The expected improvement in consumption and household finances discussed earlier will be embryonic by the end of the summer and will not offer a clear case to lift rates further. Instead, the ECB will still have to juggle the tightening in financial conditions created by wider bond spreads in the European periphery and the impact of China’s slowdown on European exports. Meanwhile, capex is unlikely to strengthen meaningfully as long as global trade softens. As a result, we stay long the June 2023 Euribor futures. An extended pause after the September meeting will prevent the ECB from hiking rates as much as money markets expect over the coming twelve months (Chart 9, bottom panel). If the ECB goes ahead and continues to lift rates in the fall and early winter, the European economy will weaken considerably more and the previous rate hikes will have to be undone. Both scenarios are bullish for the June 2023 Euribor contract. Bottom Line: The ECB is likely to pause after pushing its deposit rate to zero in the third quarter in order to reassess economic conditions. Inflation is the main factor behind higher rates, and it will peak this summer. Meanwhile, the economy is still not strong enough to justify significantly higher interest rates. The market’s pricing in the ESTR curve is much too aggressive considering this context. Stay long June 2023 Euribor futures. Credit Update: Don’t Be A Hero Chart 10Cautious In Absolute Terms, Positive On Relative Performance
Cautious In Absolute Terms, Positive On Relative Performance
Cautious In Absolute Terms, Positive On Relative Performance
Credit markets are experiencing a second episode of spread widening this year. The first episode was triggered by the invasion of Ukraine by Russia. The current one reflects strong inflation, weaker growth prospects, and the ECB’s policy shift. Year-to-date, European investment grade and high-yield corporate bond option-adjusted spreads have widened by 74bps and 188bps, respectively (Chart 10, top panel). As we wrote last week, if the global economic situation were to stabilize, then European assets would be a buy at current levels. This is especially true for European credit. Beyond attractive valuations, corporate bond issuers’ balance sheets are in good shape and the default risk is low. However, the same risks that prevent us from being buyers of the euro and European stocks today also hang over the credit market. Specifically, a further deterioration of the energy flows between Russia and the EU and/or a policy mistake, whereby the ECB delivers the seven rate hikes priced in the overnight index swap market, would cause spreads to widen meaningfully from their current elevated levels. Therefore, we recommend investors remain on the sidelines and wait for a safer entry point over the coming weeks. Once inflation has peaked and stagflation/recession fears recede, then credit spreads will have ample room to narrow, especially if the ECB decides to pause after lifting the deposit rate to 0% (Chart 10, second panel). In the meantime, expected policy rate differentials are still supportive of an overweight on European credit relative to US credit (Chart 10, bottom panel). Bottom Line: European spreads are most likely peaking. However, the same risks that hang over EUR/USD and European equities prevent us from buying this asset class just yet. Swiss Stocks Are Getting Expensive Chart 11Swiss Stocks Getting Ahead Of Earnings
Swiss Stocks Getting Ahead Of Earnings
Swiss Stocks Getting Ahead Of Earnings
The defensive Swiss market has greatly outperformed its Euro Area counterpart this year. However, the recent bout of Swiss outperformance has been completely dissociated from the trend in Swiss EPS relative to those of the Euro Area (Chart 11). Now, Swiss equities are particularly expensive and sport multiples 45% greater than the P/E ratio of the Eurozone MSCI benchmark. This bifurcation between the relative performance of Swiss stocks and their relative earnings represents a trading opportunity. Specifically, Swiss shares look vulnerable against German ones, which have been seriously beaten down in recent years. Chart 12Priced For The Apocalypse
Priced For The Apocalypse
Priced For The Apocalypse
Swiss stocks have been re-rated on the back of many forces. First, the valuations of Swiss stocks relative to German ones have risen in tandem with the Eurozone’s headline and core inflation (Chart 12, top and second panel). Swiss relative valuations have also benefited from the significant tailwind created by higher 2-year rates in the Eurozone (Chart 12, third panel) and from the weakness in the euro (Chart 12, fourth panel). Finally, Swiss relative valuations seem to have already priced in a significant deterioration in European manufacturing activity, which would have lifted their appeal as a defensive play (Chart 12, bottom panel). We recommend selling Swiss stocks against German ones. We anticipate European inflation to peak this summer. Our ECB view is consistent with a decline in Germany’s 2-year bond yields. We also expect the euro to bottom and, even though we have written about a deterioration in European manufacturing activity, the recent explosion of Swiss multiples relative to German ones looks overdone. This trade may be seen as our first attempt to dip our toe into cyclical assets, even if we generally favor capital preservation over risk taking at this juncture. Bottom Line: The outperformance of Swiss equities is overextended and is already pricing in a dire outcome for European economies. Selling Swiss shares relative to German stocks is an attractive way to add tentatively some risk to a European portfolio. France Update: Likely Legislative Majority For Macron Chart 13French Polls Suggest Macron Will Get His Legislative Majority
Looking Beyond Europe’s Inflation Peak
Looking Beyond Europe’s Inflation Peak
President Emmanuel Macron’s political party, Renaissance (previously En Marche!), may surprise to the upside in this year’s legislative election. An aggregate of recent polls (Chart 13) suggests that the presidential coalition (which includes Renaissance and its allies) will obtain between 295 and 340 seats in the Assemblée Nationale, more than the 289 seats needed to achieve a majority. The odds of seeing an historically low voter turnout should also play in the French president’s favor. Chart 14Favor French Small-Caps & Avoid Consumer Stocks
Favor French Small-Caps & Avoid Consumer Stocks
Favor French Small-Caps & Avoid Consumer Stocks
Macron will not have to compromise to build a coalition in favor of his reform agenda, which bodes well for French productivity and trend growth. This election should not have an impact on French assets beyond that. We continue to recommend investors favor French small-caps, as they will benefit from an improvement in domestic consumer confidence and an eventual strengthening in the euro (Chart 14). Meanwhile, we still see more downside for French consumer stocks (Chart 14, bottom panel). Mathieu Savary, Chief European Strategist Mathieu@bcaresearch.com Jeremie Peloso, Editor/Strategist JeremieP@bcaresearch.com Tactical Recommendations Cyclical Recommendations Structural Recommendations
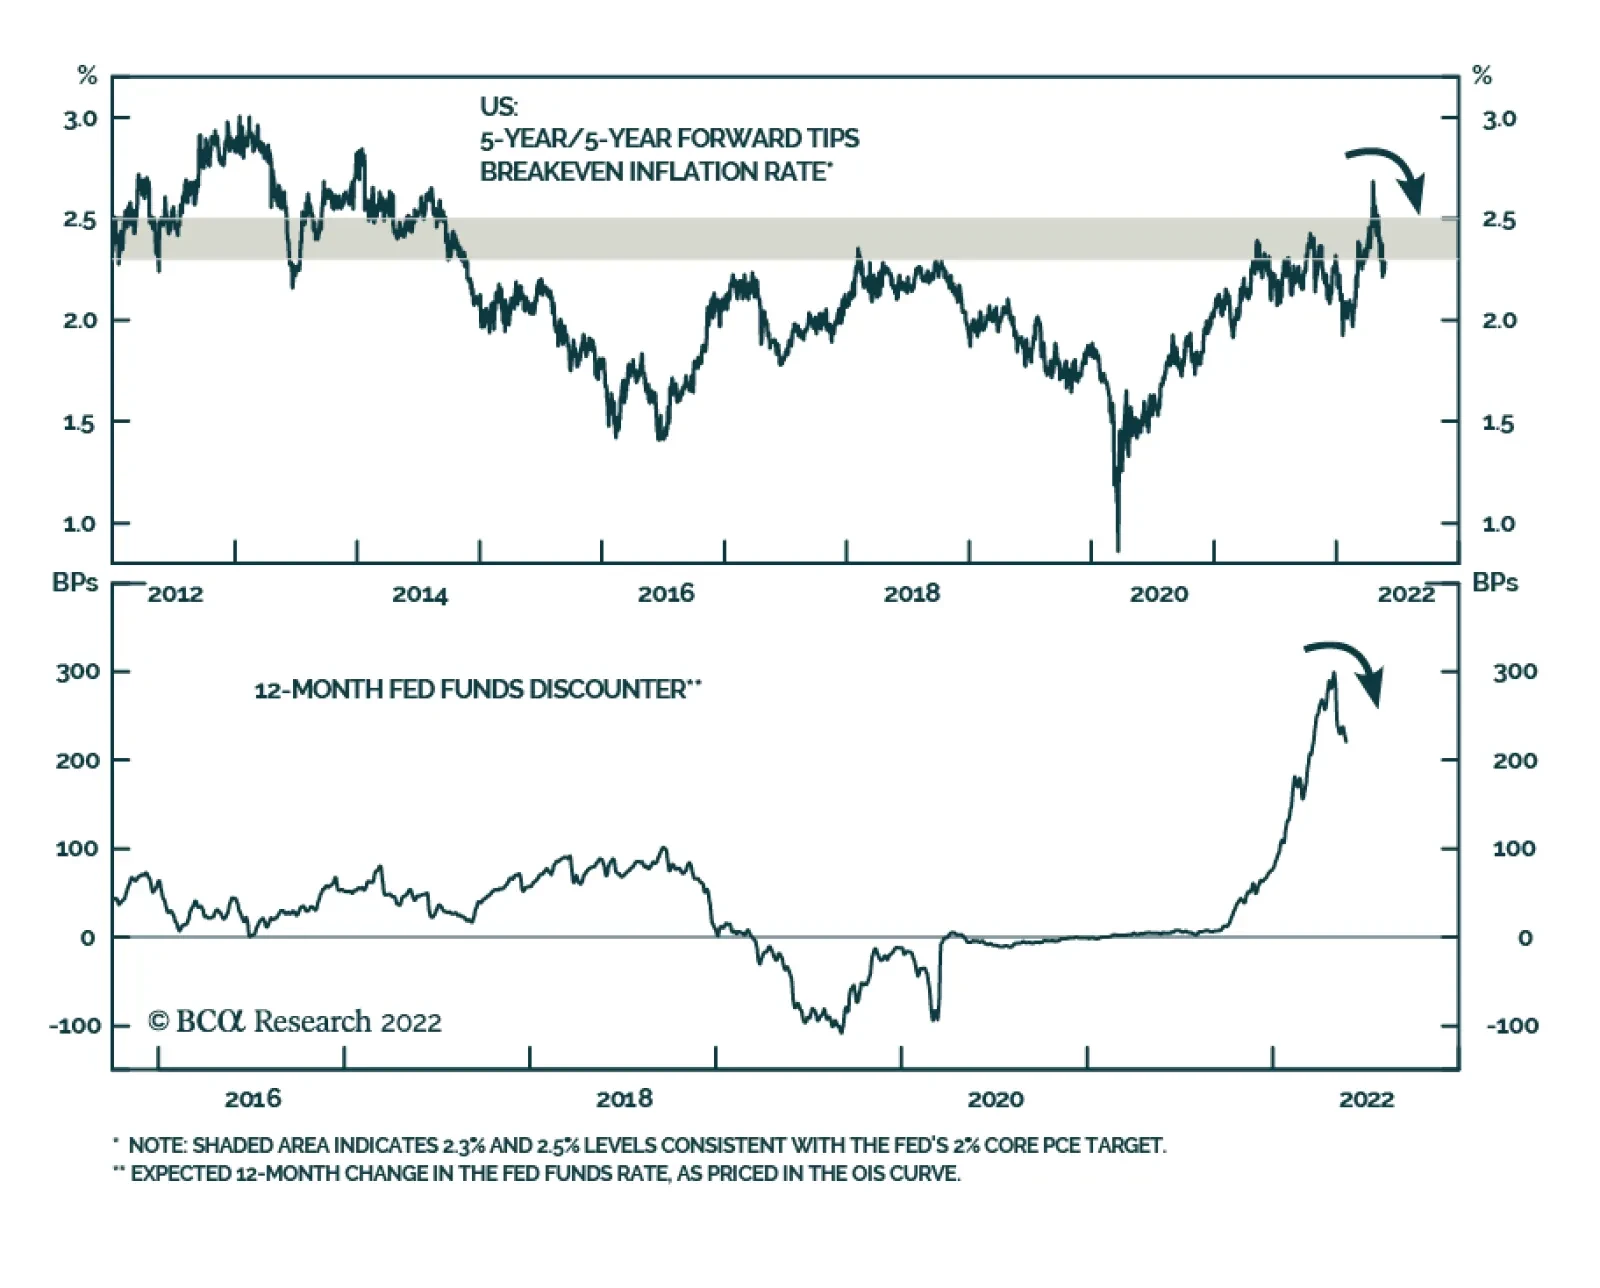
American consumers’ 1-year ahead inflation expectations were revised slightly lower in the final release of the May University of Michigan Consumer Sentiment survey. The median estimate is now 5.3% y/y, down from 5.4% in April, marking the first decline this…
Listen to a short summary of this report. Executive Summary US Financial Conditions Have Tightened Significantly This Year
US Financial Conditions Have Tightened Significantly This Year
US Financial Conditions Have Tightened Significantly This Year
US financial conditions have tightened by enough that the Fed no longer needs to talk up interest rate expectations. If inflation decelerates faster than anticipated over the coming months, as we expect will be the case, the Fed’s messaging will soften further. Bond yields in the US and abroad are likely to fall over the next 6-to-12 months, even if they do rise over a longer-term horizon. Stay overweight stocks, favoring non-US equities over their US peers. We are closing our short 10-year Gilts trade, initiated at a yield of 0.85%, for a gain of 7.5%. We are also opening a new trade going long Canadian short-term interest rate futures versus their US counterparts. Investors expect Canadian rates to exceed US rates in 2024, which seems unlikely to us given that the Canadian housing market is much more sensitive to higher rates than the US market. Bottom Line: After having tightened significantly over the past seven months, financial conditions should loosen modestly during the remainder of the year. This should benefit risk assets. Fed Focused on Financial Conditions Chart 1Tighter Financial Conditions Will Hurt Growth
Tighter Financial Conditions Will Hurt Growth
Tighter Financial Conditions Will Hurt Growth
Like many central banks, the Fed sees financial conditions as a key driver of the real economy. While there are many financial conditions indices (FCIs), most include bond yields, credit spreads, equity prices, and the exchange rate as inputs. Higher bond yields, wider credit spreads, lower equity prices, and a strong currency all lead to tighter financial conditions and a weaker economy, and vice versa. Goldman’s US FCI is especially popular among market participants. It is calibrated so that 100 bps in tightening corresponds, all things equal, to a 100 basis-point decline in US real GDP growth over the subsequent four quarters. The Goldman FCI has tightened by 212 bps since the start of the year and by 225 points from its loosest level in November 2021. If the historic relationship between the FCI and the economy holds, the tightening in financial conditions would be enough to push US growth to a below-trend pace by the second quarter of 2023. In fact, the tightening in the Goldman FCI over the past 12 months already suggests that the manufacturing ISM will fall below 50 (Chart 1). Along the same lines, the Chicago Fed’s Adjusted National FCI, which measures financial conditions relative to current economic conditions, has moved slightly into restrictive territory. Aside from a brief period at the outset of the pandemic, the index has been consistently in expansionary territory since early 2013 (Chart 2). Chart 2The Chicago Fed Financial Conditions Index Has Moved Into Slightly Restrictive Territory
Are Financial Conditions Tight Enough?
Are Financial Conditions Tight Enough?
Other data are consistent with the message from the FCIs. Most notably, growth estimates for the US and for other major economies have come down over the past few months (Chart 3). Economic surprise indices have also fallen, especially in the US. Chart 3AGrowth Forecasts Have Softened As Economic Data Have Surprised To The Downside (I)
Growth Forecasts Have Softened As Economic Data Have Surprised To The Downside (I)
Growth Forecasts Have Softened As Economic Data Have Surprised To The Downside (I)
Chart 3BGrowth Forecasts Have Softened As Economic Data Have Surprised To The Downside (II)
Growth Forecasts Have Softened As Economic Data Have Surprised To The Downside (II)
Growth Forecasts Have Softened As Economic Data Have Surprised To The Downside (II)
Mission Accomplished? Chart 4The Fed Expects To Lift Rates Above Its Estimate Of Neutral
The Fed Expects To Lift Rates Above Its Estimate Of Neutral
The Fed Expects To Lift Rates Above Its Estimate Of Neutral
Given the recent tightening in financial conditions and weaker growth expectations, the Fed is likely to soften its tone. Already this week, Atlanta Fed President Raphael Bostic suggested that the Fed could pause raising rates in September in order to assess the impact of the Fed’s tightening campaign. The Fed minutes also conveyed a sense of flexibility and data-dependence about the timing and magnitude of future hikes once rates reach 2%. It’s worth stressing that the Fed expects rates to rise in 2023 to about 40 bps above its estimate of the terminal rate (Chart 4). Jawboning rate expectations higher would potentially undermine the Fed’s goal of achieving a soft landing for the economy. Inflation Will Dictate How Much Easing Lies Ahead There is a big difference between not wanting financial conditions to tighten further and wanting them to loosen. The Fed would only want to see an easing in financial conditions if inflation were to fall faster than expected. Chart 5 shows how the year-over-year change in the core PCE deflator would evolve over the remainder of the year depending on different assumptions about the month-over-month change in the deflator. The Fed would be able to reach its expectation of year-over-year core PCE inflation of 4.1% for end-2022 if the month-over-month change averages 0.33%. Monthly core PCE inflation averaged 0.3% in February and March and is expected to clock in at around the same level for April once the data is released tomorrow. Chart 5AUS Inflation Will Fall By More Than The Fed Expects If The Monthly Change In Core PCE Is Less Than 0.3% (I)
US Inflation Will Fall By More Than The Fed Expects If The Monthly Change In Core PCE Is Less Than 0.3% (I)
US Inflation Will Fall By More Than The Fed Expects If The Monthly Change In Core PCE Is Less Than 0.3% (I)
Chart 5BUS Inflation Will Fall By More Than The Fed Expects If The Monthly Change In Core PCE Is Less Than 0.3% (II)
US Inflation Will Fall By More Than The Fed Expects If The Monthly Change In Core PCE Is Less Than 0.3% (II)
US Inflation Will Fall By More Than The Fed Expects If The Monthly Change In Core PCE Is Less Than 0.3% (II)
Regardless of tomorrow’s data print, as we discussed last week, we expect the monthly inflation rate to average less than 0.3 in the back half of the year. If that happens, inflation will surprise to the downside relative to the Fed’s expectations. Consistent with the observation above, market-based inflation expectations have already declined. The 5-year TIPS inflation breakeven has fallen from 3.64% in March to 2.98% at present. The widely watched 5-year/5-year forward breakeven rate is back down to 2.29%, at the bottom of the Fed’s comfort zone of 2.3%-to-2.5% (Chart 6).1 The Citi US Inflation Surprise Index has also rolled over (Chart 7). Chart 6Market-Based Inflation Expectations Have Come Down Of Late
Market-Based Inflation Expectations Have Come Down Of Late
Market-Based Inflation Expectations Have Come Down Of Late
Chart 7The US Inflation Surprise Index Has Rolled Over
The US Inflation Surprise Index Has Rolled Over
The US Inflation Surprise Index Has Rolled Over
Financial Conditions Abroad Financial conditions indices in the other major developed economies have tightened somewhat less than in the US because equities represent a smaller share of household net worth abroad and also because most currencies have weakened against the US dollar (Chart 8). Nevertheless, with growth momentum having already deteriorated sharply, central banks are signaling a more balanced approach towards policy normalization. Chart 8Financial Conditions Have Tightened More In The US Than Elsewhere This Year
Are Financial Conditions Tight Enough?
Are Financial Conditions Tight Enough?
ECB: Wait and See? In a blog post published on Monday, Christine Lagarde observed that inflation expectations have risen from pre-pandemic levels, implying that real policy rates are currently lower than they were two years ago. In her mind, this warrants ending net purchases under the Asset Purchase Programme early in the third quarter. It also warrants raising the deposit rate by 25 bps at both the July and September meetings, bringing it back to zero from -0.5% at present. Beyond then, Lagarde was circumspect about what should be done, stressing the need for “gradualism, optionality and flexibility.” She noted that “The euro area is clearly not facing a typical situation of excess aggregate demand or economic overheating … Both consumption and investment remain below their pre-crisis levels, and even further below their pre-crisis trends.” She then added: “The outlook is now being clouded by the negative supply shocks hitting the economy … households’ expectations of their future financial situation dropped to their second-lowest level on record in March and remained close to that level in April.” The market expects the ECB to raise rates by 170 bps over the next 12 months, bringing the deposit rate to 1.2% by mid-2023 (Chart 9). BCA’s Global Fixed Income team, led by Rob Robis, foresees only 50 bps of tightening over the next 12 months. Chart 9Markets Expect Rates To Rise The Most In The Anglo-Saxon World
Are Financial Conditions Tight Enough?
Are Financial Conditions Tight Enough?
The UK, Canada, and Australia: Frothy Housing Markets Will Limit Rate Hikes The Bank of England (BoE) hiked rates by 90 bps over the past 12 months. The UK OIS curve is priced for another 140 bps of rate hikes over the next year. According to the BoE’s forecasting models, this would raise the unemployment rate by two percentage points while lowering inflation to below 2% within the next two-to-three years. In our opinion, that is more tightening than the BoE would like to see. BCA’s strategists expect the BoE to deliver only another 75 bps of hikes over the next year. Chart 10Buildup In Leverage And Frothy Housing Markets Pose A Challenge To Monetary Policy In Some Developed Market Countries
Buildup In Leverage And Frothy Housing Markets Pose A Challenge To Monetary Policy In Some Developed Market Countries
Buildup In Leverage And Frothy Housing Markets Pose A Challenge To Monetary Policy In Some Developed Market Countries
The Canadian economy has been quite strong, with the unemployment rate falling to 5.2% in April, the lowest since 1974. The Canadian OIS curve is discounting 195 bps of interest rate hikes over the next 12 months, substantially more than the 150 bps of tightening our fixed income team foresees. By mid-2024, investors expect Canadian policy rates to be about 25 bps above US rates. This seems unreasonable to us, and as of this week, we are expressing this view by going long the June 2024 3-month Canadian Bankers’ Acceptance (BAX) futures contract (BAM4) versus the corresponding 3-month US SOFR futures contract (SFRM4). A more liquid option is to simply go long the 10-year Canadian government bond versus the 10-year US Treasury note. At present, Canadian 10-year government bonds are yielding 5 bps more than their US counterparts. Unlike in the US, where household debt has fallen over the past 14 years, debt in Canada has risen, fueled by a massive housing boom (Chart 10). High indebtedness and the prevalence of variable rate/short-term fixed-rate mortgages will limit the ability of the BoC to raise rates. The Australian OIS curve is currently discounting 262 bps of rate hikes over the next year which, if realized, would take the cash rate to 3.3% – a level last seen in 2013 when the neutral rate in Australia was much higher by the RBA’s own reckoning. BCA’s fixed income strategists expect only 150 bps of tightening over the next 12 months. Japan: Yield Curve Control Will Continue Chart 11Japan: Long-Term Inflation Expectations Are Far Lower Than In The Rest Of The World
Japan: Long-Term Inflation Expectations Are Far Lower Than In The Rest Of The World
Japan: Long-Term Inflation Expectations Are Far Lower Than In The Rest Of The World
The Bank of Japan expects inflation excluding fresh food prices to remain at about 2% in the second half of 2022, but then to slow to 1.1% in the fiscal year starting April 2023. The Japan OIS curve is discounting almost no tightening over the next 12 months. Long-term inflation expectations are far lower in Japan than in any other major economy, which makes ultra-low rates a necessity for the foreseeable future (Chart 11). China: Outright Easing Chart 12Covid Restrictions Have Eased Only Modestly In China
Are Financial Conditions Tight Enough?
Are Financial Conditions Tight Enough?
China faces a trifecta of problems: A weakening housing market; slowing external demand for manufactured goods; and the ongoing threat of Covid-related lockdowns. Despite a steep drop in the number of new Covid cases over the past month, China’s lockdown index has only eased modestly, as the authorities continue to fret about the next outbreak (Chart 12). The leadership in Beijing has responded with policy easing. The PBoC lowered the 5-year loan prime rate by 15 bps last week, the largest such cut since 2019. This followed a cut in the floor rate for first-home mortgages that was announced on May 15. BCA’s China strategists believe these measures will arrest the deep contraction in the property market but will not spark a full-blown recovery due to the ongoing commitment of the government to the “three red lines” policy.2 In normal times, a Chinese real estate slump would be a cause of grave concern for global investors. These are not normal times, however. Public enemy number one these days is inflation. A weaker Chinese property market would curb commodity demand, thus helping to cool inflation. That would be a welcome development for global investors. Investment Conclusions Global financial conditions have tightened to the point that betting on ever-higher rates, at least for the next 12 months, no longer makes sense. If global inflation decelerates faster than anticipated during the remainder of the year, as we expect will be the case, central banks will dial back the hawkish rhetoric. We took partial profits on our short 10-year Treasury trade earlier this month (initiated at a yield of 1.45%). As of this week, consistent with the earlier decision of BCA’s fixed income strategists to upgrade UK Gilts, we are closing our short 10-year Gilt position (initiated at a yield of 0.85%) for a gain of 7.5%. The coming Goldilocks environment of falling inflation and supply-side led growth will buttress equities. We expect global stocks to rise 15%-to-20% over the next 12 months, with non-US markets outperforming the US. Looking further out, the fate of Goldilocks will rest on where the neutral rate of interest resides. If the neutral rate in the US turns out to be substantially lower than 2.5%, then any growth recovery will falter as the lagged effects of restrictive monetary policy work their way through the economy. Conversely, if the neutral rate turns out to be substantially higher than 2.5%, then inflation will reaccelerate as the economy overheats. Given the choice, we would wager on the latter outcome. Thus, while we expect global bond yields to decline over a 12-month horizon, we foresee them rising over a 2-to-5-year time frame. Similarly, while stocks will strengthen over the next 12 months, they are likely to encounter another bout of turbulence starting late next year or in 2024 as central banks initiate a second round of rate hikes. Peter Berezin Chief Global Strategist peterb@bcaresearch.com Follow me on LinkedIn Twitter Footnotes 1 The Federal Reserve targets an average inflation rate of 2% for the Personal Consumption Expenditures (PCE) index. The TIPS breakeven is based on the CPI index. Due to compositional differences between the two indices, CPI inflation has historically averaged 30-to-50 basis points higher than PCE inflation. This is why the Fed effectively targets a CPI inflation rate of 2.3%-to-2.5%. 2 The People’s Bank of China and the housing ministry issued a deleveraging framework for property developers in August 2020, consisting of a 70% ceiling on liabilities-to-assets, a net debt-to-equity ratio capped at 100%, and a limit on short-term borrowing that cannot exceed cash reserves. Developers breaching these “red lines” run the risk of being cut off from access to new loans from banks, while those who respect them can only increase their interest-bearing borrowing by 15% at most. Global Investment Strategy View Matrix
Are Financial Conditions Tight Enough?
Are Financial Conditions Tight Enough?
Special Trade Recommendations Current MacroQuant Model Scores
Are Financial Conditions Tight Enough?
Are Financial Conditions Tight Enough?