Fixed Income

Executive Summary No Contagion Yet
No Contagion Yet
No Contagion Yet
The risk of contagion into other FX pairs from the collapse of the RUB remains contained but is rising. The main transmission mechanism will be a global rush into dollars, should the crisis trigger a global recession. For now, European countries with big trade and financial relationships with Russia are the ones in the firing range of any escalation. The euro has already adjusted lower. As such, while the crisis could get worse before it gets better, the broad DXY index is unlikely to rally much beyond 100. Meanwhile, the Federal Reserve will be swift in addressing any offshore dollar funding crises, via facilities revived during the depths of the COVID-19 crisis. Crude prices could be near capitulation highs. A reversal in oil prices (as the forward curve suggests) will benefit oil consumers versus producers. Long EUR/CAD and short NOK/SEK positions are on our shopping list. Recommendations Inception Level Inception Date Return Short NOK/SEK 1.11 Mar 3/2022 - Bottom Line: Bottom Line: If a further escalation in the crisis triggers a global recession, it will lead to another down leg in stocks, and a rally in the dollar. Meanwhile, a détente will allow the bull market in stocks to continue, and the dollar rally to reverse. As we argue below, while the crisis could get worse before it gets better, the broad DXY index is unlikely to rally much beyond 100. Feature The market is treating the Russo-Ukrainian conflict as a localized event that is unlikely to trigger a global recession. While the DXY index is fast approaching the psychological 100 level, other FX pairs forewarning a major risk-off event on the horizon remain rather sanguine. For example, the AUD/JPY cross is toppy but has tracked the mild correction in global stocks. The big losers in the DXY index have been the Swedish krona and the euro, currencies directly in the firing range of any escalation in the crisis (Chart 1). Chart 2Investors Have Bought FX Hedges
Investors Have Bought FX Hedges
Investors Have Bought FX Hedges
Chart 1No Contagion Yet
No Contagion Yet
No Contagion Yet
Specific to the euro, risk reversals — the difference in implied volatility between out-of-the-money calls versus puts — have collapsed below COVID-19 lows. Across a broad spectrum of currencies, investors have been building hedges against losses (Chart 2). The mirror image of this is near record-high net speculative positioning in the dollar. Given this market configuration, the key question is where next? Clearly, if a further escalation in the crisis triggers a global recession, it will lead to another down leg in stocks, and a rally in the dollar. Meanwhile, a détente will allow the bull market in stocks to continue, and the dollar rally to reverse. As we argue below, while the crisis could get worse before it gets better, the broad DXY index is unlikely to rally much beyond 100. A Review Of The Fed Put Chart 3The Fed And Liquidity Crises
The Fed And Liquidity Crises
The Fed And Liquidity Crises
Both a global pandemic and fear of a global war are existential threats which have occurred throughout history. As such, should we survive an escalation in tensions, the DXY could behave as it did during the COVID-19 crisis. Specifically, the pandemic triggered a rush into dollars amidst a global shortage. This was a key reason why the DXY punched above 100. Fast forward to today, and a lot of the facilities that were tapped into during the COVID-19 crisis can be reactivated. A review of the sequence of events back then is instructive: The Fed began by offering unlimited funding through swap lines to five major central banks at the overnight index swap + 25 basis points.1 This was effective as of the week of March 16, 2020 (Chart 3). When this proved insufficient to satiate the demand for dollars, the swap lines were extended to nine more central banks, with a cap of US$60 billion and a maturity of 84 days.2 This was announced on March 19, 2020. Finally, FIMA account holders were allowed to temporarily exchange their Treasury securities held with the Fed for US dollars. This was announced on March 24, 2020. In hindsight, it turned out that the Fed’s actions on March 19 marked the peak in the dollar at 103, even though we continue to live with Covid-19 today. That peak was 5% above current levels. What ensued was a period of volatility, with periodic rallies towards 100, but these provided excellent shorting opportunities for the DXY. The behavior of the DXY today could be more sanguine, with the benefit of hindsight. Barometers Of Contagion Chart 4Defaults Less Likely Outside Russia
Defaults Less Likely Outside Russia
Defaults Less Likely Outside Russia
No two crises are the same. It is likely that holders of Russian US dollar debt will never be made whole, with coupon payments already suspended. As a result, the risk is that investors liquidate other holdings of emerging market dollar bonds to cover margin calls. This will lead to a self-reinforcing spiral which will transform a localized liquidity crisis into a global solvency one. Credit default swaps in major EM economies are rising, as they blow out for Russian debt (Chart 4). That said, there are a few similarities with past Russian incursions: The selloff in Russian debt during the invasion of Crimea was a localized event. The invasion of Georgia took place at the heart of the global financial crisis of 2008. In the former, a self-reinforcing feedback loop of higher refinancing rates and defaults did not ensue. The reaction from other EM currencies and equity markets has been rather constructive, despite the wholesale liquidation in Russian assets (Chart 5). As adjustment mechanisms, currencies are good at sniffing out the risk of contagion. That is not the case yet. Finally, the DXY and the RUB have already decoupled, as they did in previous episodes of a Russian invasion (Chart 6). In the past, this was a good indication that the event was localized, even though the RUB only bottomed after falling 35% and 47% in 2008 and 2014, respectively. While the risk today can be characterized as much greater, this dynamic remains the same (the dollar is up only 1.6% since the incursion). Chart 5Spot The Outlier
Spot The Outlier
Spot The Outlier
Chart 6The Dollar And Rouble Have Already Decoupled
The Dollar And Rouble Have Already Decoupled
The Dollar And Rouble Have Already Decoupled
What is clear is that the longer the conflict lasts, the less likely it is that the Fed will deliver the aggressive rate hikes originally priced by the market this year. This will keep US policy very accommodative, at a time when the real fed funds rate is still well below estimates of neutral (Chart 7). Chart 7The Fed Is Still Very Accomodative
The Fed Is Still Very Accomodative
The Fed Is Still Very Accomodative
The message from the Bank of Canada this week could be a model for other central banks, where quantitative tightening (QT) and rate hikes complement each other. This could signal a slower pace of hikes than the market expects and, in turn, could help lead to a steeping of yield curves, especially as growth eventually recovers. Applying The Russian Template The bigger question for currency markets longer term is what happens to foreign holders of US assets when the dust settles. Russian holdings of US Treasurys peaked during the Georgian war and have since fallen to nearly 0% of total reserves (Chart 8). This has been replaced by gold, RMB assets, euro assets, and other currencies. With US geopolitical rivals having seen how vulnerable the Russian economy has been to a cut-off from the SWIFT messaging system, currency alliances outside the scope of the dollar are likely to solidify. China is the number one contributor to the US trade deficit, which is hitting record lows. It is also the largest holder of US Treasurys, which it continues to destock. This could be a subtle retaliation against past US policies, or perhaps a way to make room for the internationalization of the RMB (Chart 9). What is clear is that nations getting cutoff from the US financial system can only accelerate this trend. Chart 8Template For US Geopolitical Rivals?
Template For US Geopolitical Rivals?
Template For US Geopolitical Rivals?
Chart 9China Has Stopped Recycling Surpluses Into Treasurys
China Has Stopped Recycling Surpluses Into Treasurys
China Has Stopped Recycling Surpluses Into Treasurys
From a broader perspective, the process of reserve diversification out of US dollars, into other currencies has been accelerating in recent years. International Monetary Fund (IMF) data shows that the global allocation of foreign exchange reserves to the US dollar peaked at about 72% in the early 2000s and has been in a downtrend ever since. Meanwhile, allocations to other currencies as well as gold have been surging. Ever since the trend began to accelerate in 2015, the DXY has been unable to sustainably punch through the 100 level (Chart 10). Chart 10The DXY: 100 Is The Line In The Sand
The DXY: 100 Is The Line In The Sand
The DXY: 100 Is The Line In The Sand
Portfolio Strategy Deflationary shocks tend to be bullish for US Treasurys and the dollar. An inflationary dislocation will push investors towards gold (and currencies that act as an inflation hedge such as the NOK, CAD, AUD, and NZD). So far, the market seems to be betting on stagflation, where both Treasury yields and gold rise in tandem (Chart 11). The response of the Federal Reserve will be the key arbiter. A growth slowdown arising from the pandemic will slow the pace of rate hikes. As such, rising inflation and low real yields will reduce the appeal of US Treasurys and boost the appeal of gold in the near term. Historically, this has been bearish for the US dollar (Chart 12). Chart 11Competing Safe-Haven Assets Have Diverged
Competing Safe-Haven Assets Have Diverged
Competing Safe-Haven Assets Have Diverged
Chart 12The Bond-To-Gold Ratio And The Dollar
The Bond-To-Gold Ratio And The Dollar
The Bond-To-Gold Ratio And The Dollar
In our portfolio, we have two trades: A short CHF/JPY position, as we believe the yen will be a better hedge than the franc given higher real rates in Japan; and a long EUR/GBP position, given that the euro is closer to pricing in a recession, compared to the pound (or even the Canadian dollar). We will adjust our positions accordingly as the crisis unfolds. Chester Ntonifor Foreign Exchange Strategist chestern@bcaresearch.com Footnotes 1 These included the Bank of Canada, the Bank of Japan, the Bank of England, the European Central Bank, and the Swiss National Bank. 2 These include the Reserve Bank of Australia, the Banco Central do Brasil, the Danmarks Nationalbank (Denmark), the Bank of Korea, the Banco de Mexico, the Norges Bank, the Reserve Bank of New Zealand, the Monetary Authority of Singapore, and the Sveriges Riksbank. Trades & Forecasts Strategic View Tactical Holdings (0-6 months) Limit Orders Forecast Summary
Executive Summary We look at the Ukraine crisis in the broader context of shocks, what we can learn from them, and how we can incorporate them into our strategy for investment, and life in general. Our high-conviction view is that the Ukraine crisis will be net deflationary, because the economic and financial sanctions imposed on Russia will lead to a generalized demand destruction. Bond yields will be lower in the second half of the year. Underweight cyclicals such as banks, ‘value’ sectors, and value-heavy stock markets such as the FTSE 100. Stay structurally overweight the 30-year T-bond. The ultimate low in the 30-year T-bond yield is yet to come, and will be a long way below the current 2.1 percent. Fractal trading watchlist: We focus on banks, add alternative electricity, and review bitcoin. Every Shock Is Always Supplanted By A New Shock
Every Shock Is Always Supplanted By A New Shock
Every Shock Is Always Supplanted By A New Shock
Bottom Line: The recent rise in bond yields and the associated outperformance of cyclical sectors such as banks, ‘value’, and value-heavy stock markets such as the FTSE 100 was just a short-lived countertrend move within a much bigger structural downtrend. This structural downtrend is now set to resume. Feature Suddenly, nobody is worried about Covid and everybody is worried about nuclear war. Or as Vladimir Putin warns, “such consequences that you have never experienced in your history.” The life lesson being that every shock is always supplanted by a new shock. Hence, in this report we look at the Ukraine crisis through a wider lens. We look at the broader context of shocks, what we can learn from them, and how we can incorporate them into our strategy for investment, and life in general. The Predictability Of Shocks Shocks are very predictable. This sounds like a contradiction, but we don’t mean the timing or nature of individual shocks. As specific events, Russia’s full-scale invasion of Ukraine and the global pandemic were ‘tail-events’ that did come as shocks. Yet the statistical distribution of such tail-events is very predictable. This predictability of shocks forms the bedrock of the world’s $5 trillion insurance industry, and should also form the bedrock of any long-term strategy for investment, or life in general. The predictability of shocks forms the bedrock of the world’s $5 trillion insurance industry, and should also form the bedrock of any long-term investment strategy. We define a shock as any event that causes the long-duration bond price in a major economy to rally or slump by at least 20 percent, albeit this is just one definition.1On this definition, the Ukraine crisis is not yet a far-reaching economic or financial shock, but it is certainly well-placed to become one. Applying this definition of a shock through the last 60 years, the statistical distribution of shocks over any long period is well-defined and very predictable. For example, over a ten-year period the number of shocks exhibits a Poisson distribution with parameter 3.33 (Chart I-1), while the time between shocks exhibits an Exponential distribution with parameter 3.33. Chart 1The Statistical Distribution Of Shocks Is Very Predictable
The Predictable Anatomy Of Shocks
The Predictable Anatomy Of Shocks
Many economists and investment strategists present their long-term forecasts for the economy and financial markets, yet completely ignore this very predictable distribution of shocks – making their long-term forecasts worthless! The question to such economists and strategists is why are there no shocks over your forecasting horizon? Their typical answer is that it is not an economist’s job to predict ‘acts of god’ or ‘black swans.’ But if insurance companies can incorporate the very predictable distribution of acts of god and black swans, then why can’t economists and strategists? Over any ten-year period, the likelihood of suffering a shock is a near-certainty, at 95 percent; in any five-year period, it is an extremely high 80 percent; in a two-year period, it is a coin toss at 50 percent; and even in one year it is a significant 30 percent (Chart I-2). Chart I-2On A Multi-Year Horizon, Another Shock Is A Near-Certainty
The Predictable Anatomy Of Shocks
The Predictable Anatomy Of Shocks
Witness that since just 2016 we have experienced Brexit, and the election of Donald Trump as US president. These were binary-outcome events where we could ‘visualise’ the tail-event in advance, but many dismissed it as implausible. Then we had a global pandemic, and now Russia’s full-scale invasion of Ukraine. Therefore, the crucial question is not whether we will experience shocks. We always will. The crucial question is, will the shock be net deflationary or net inflationary? Our high-conviction view is that the Ukraine crisis will be net deflationary. Meaning that even if it starts as inflationary, it will quickly morph into deflationary. The Danger From Higher Energy Prices: The Obvious And The Not So Obvious Many people have noticed the suspicious proximity of oil price surges to subsequent economic downturns – most recently, the 1999-2000 trebling of crude and the subsequent 2000-01 downturn, and the 2007-2008 trebling of crude and the subsequent 2008-09 global recession. Begging the question, should we be concerned that the Ukraine crisis has lifted the crude oil price to a near-trebling since October 2020, not to mention the massive spike in natural gas prices? Many people have noticed the suspicious proximity of oil price surges to subsequent economic downturns. Of course, we know that the root cause of both the 2000-01 downturn and the 2008-09 recession was not the oil price surge that preceded them. As their names make crystal clear, the 2001-01 downturn was the dot com bust and the 2008-09 recession was the global financial crisis. And yet, and yet… while the oil price surge was not the culprit, it was certainly the accessory to both murders. The obvious way that high energy prices hurt is that they are demand destructive to both energy and non-energy consumption. In this regard, the good news is that the economy is becoming much less energy-intensive – every unit of real output requires about 40 percent less energy than at the start of the millennium (Chart I-3). Nevertheless, even if the scope to hurt is lessening, higher energy prices are still demand destructive. Chart I-3The Economy Is Becoming Less Energy-Intensive
The Economy Is Becoming Less Energy-Intensive
The Economy Is Becoming Less Energy-Intensive
The not so obvious way that high energy prices hurt is that they risk driving up the long-duration bond yield and thereby tipping more systemically important economic and financial fragilities over the brink. This was the where the greater pain came from in both 2000 and 2008 (Chart I-4 and Chart I-5). Chart I-4Fears Of Energy-Driven Inflation Drove Up The Bond Yield In 1999
Fears Of Energy-Driven Inflation Drove Up The Bond Yield In 1999
Fears Of Energy-Driven Inflation Drove Up The Bond Yield In 1999
Chart I-5Fears Of Energy-Driven Inflation Drove Up The Bond Yield In 2008
Fears Of Energy-Driven Inflation Drove Up The Bond Yield In 2008
Fears Of Energy-Driven Inflation Drove Up The Bond Yield In 2008
Fortunately, the recent decline in the 30-year T-bond yield suggests that the bond market is looking through the short-term inflationary impulse of higher energy prices (Chart I-6). Instead, it is focussing on the deflationary impulse that will come from the demand destruction that the higher prices will trigger. Chart I-6Today, The Bond Market Is Looking Through The Inflationary Impulse From Higher Energy Prices
Today, The Bond Market Is Looking Through The Inflationary Impulse From Higher Energy Prices
Today, The Bond Market Is Looking Through The Inflationary Impulse From Higher Energy Prices
The economic and financial sanctions imposed on Russia will only lead to additional demand destruction. Sanctions restrict trade and economic and financial activity – therefore they hurt both the side that is sanctioned and the side that is sanctioning. This mutuality of pain caused the West to balk at both the timing and severity of its sanctions. But absent an unlikely backdown from Russia, the sanctions noose will tighten, choking growth everywhere. If bond yields were to re-focus on inflation and move higher, it would add a further headwind to the economy and markets, forcing the 30-year T-bond yield back down again from a ‘line in the sand’ at around 2.4-2.5 percent. So, the long-duration bond yield will go down directly or via a short detour higher. Either way, bond yields will be lower in the second half of the year. Given the very tight connection between bond yields and stock market sector, style, and country allocation, it will become clear that the recent outperformance of cyclicals such as banks, ‘value’ sectors, and value-heavy stock markets such as the FTSE 100 was just a short-lived countertrend move in a much bigger structural downtrend (Chart I-7). This structural downtrend is set to resume. Chart I-7When Bond Yields Decline, Banks Underperform
When Bond Yields Decline, Banks Underperform
When Bond Yields Decline, Banks Underperform
Underweight cyclicals such as banks, ‘value’ sectors, and value-heavy stock markets such as the FTSE 100. Yet, the over-arching message from the anatomy of shocks is that the ultimate structural low in the 30-year T-bond yield is yet to come, and will be a long way below the current 2.1 percent. Stay structurally overweight the 30-year T-bond. Fractal Trading Watchlist This week’s analysis focusses on banks, adds alternative electricity, and reviews bitcoin. Supporting the fundamental arguments in the main body of this report, the recent outperformance of banks has reached the point of fractal fragility that has signalled several important turning-points through the past decade (Chart 1-8). Accordingly, this week’s recommended trade is to go short world banks versus world consumer services, setting the profit target and symmetrical stop-loss at 12 percent. Chart I-8The Recent Outperformance Of Banks May Soon End
The Recent Outperformance Of Banks May Soon End
The Recent Outperformance Of Banks May Soon End
Alternative Electricity Is Rebounding From An Oversold Position
Alternative Electricity Is Rebounding From An Oversold Position
Alternative Electricity Is Rebounding From An Oversold Position
Bitcoin's Support Is Holding
Bitcoin's Support Is Holding
Bitcoin's Support Is Holding
Dhaval Joshi Chief Strategist dhaval@bcaresearch.com Footnotes 1 As bond yields approach their lower limit, this definition of a shock will need to change as it will become impossible for long-duration bond prices to rally by 20 percent. Fractal Trading System Fractal Trades
The Predictable Anatomy Of Shocks
The Predictable Anatomy Of Shocks
The Predictable Anatomy Of Shocks
The Predictable Anatomy Of Shocks
6-Month Recommendations Structural Recommendations Closed Fractal Trades Indicators To Watch - Bond Yields Chart II-1Indicators To Watch - Bond Yields ##br##- Euro Area
Indicators To Watch - Bond Yields - Euro Area
Indicators To Watch - Bond Yields - Euro Area
Chart II-2Indicators To Watch - Bond Yields ##br##- Europe Ex Euro Area
Indicators To Watch - Bond Yields - Europe Ex Euro Area
Indicators To Watch - Bond Yields - Europe Ex Euro Area
Chart II-3Indicators To Watch - Bond Yields ##br##- Asia
Indicators To Watch - Bond Yields - Asia
Indicators To Watch - Bond Yields - Asia
Chart II-4Indicators To Watch - Bond Yields ##br##- Other Developed
Indicators To Watch - Bond Yields - Other Developed
Indicators To Watch - Bond Yields - Other Developed
Indicators To Watch - Interest Rate Expectations Chart II-5 Indicators To Watch - Interest Rate Expectations
Indicators To Watch - Interest Rate Expectations
Indicators To Watch - Interest Rate Expectations
Chart II-6 Indicators To Watch - Interest Rate Expectations
Indicators To Watch - Interest Rate Expectations
Indicators To Watch - Interest Rate Expectations
Chart II-7Indicators To Watch - Interest Rate Expectations
Indicators To Watch - Interest Rate Expectations
Indicators To Watch - Interest Rate Expectations
Chart II-8Indicators To Watch - Interest Rate Expectations
Indicators To Watch - Interest Rate Expectations
Indicators To Watch - Interest Rate Expectations

Our Global Fixed Income Strategy team has cut their recommended exposure to European high-yield and Emerging Markets (EM) USD-denominated hard currency debt in response to the Russia/Ukraine conflict. While the geopolitical uncertainty created by the Russian…
Executive Summary Upgrade Global Duration Exposure To Neutral
Upgrade Global Duration Exposure To Neutral
Upgrade Global Duration Exposure To Neutral
The Russian invasion of Ukraine is a stagflationary shock that comes at a difficult time for developed market central banks that have been laying the groundwork for a tightening cycle. We tactically upgraded our recommended duration exposure in the US to neutral last week, as the market was pricing in too much Fed tightening in 2022. We are doing similar upgrades in non-US government bonds this week for the same reason. We are maintaining our cyclical country allocations, however, as those remain in line with interest rate pricing beyond 2022. We are underweight markets where terminal rate expectations remain too low (the US, UK & Canada) and overweight countries where markets are discounting too many rate hikes in 2023/24 (Germany, Japan, Australia). In light of the instability caused by the Russian invasion of Ukraine, we are reducing weightings in our model bond portfolio to credit sectors highly exposed to the war - European high-yield and emerging market hard currency debt. Bottom Line: The Ukraine war comes at a time when global growth momentum was already starting to roll over and with global inflation momentum set to peak soon. Upgrade duration exposure to neutral from underweight in global bond portfolios. Feature Among the tail risks that investors contemplated in their planning for 2022, World War III was likely not ranked too highly on the list. The horrific images of the Russian invasion of Ukraine – and the sharp response of the West to isolate Russia through unprecedented economic and financial sanctions - have shocked global financial markets that had been focused on relatively mundane concerns like the timing of interest rate hikes. BCA sent a short note to all clients late last week that discussed the investment implications of the invasion for several asset classes. In this report, we consider the bond market ramifications of war in Eastern Europe. Our main conclusion is that the Ukraine situation will produce a brief “stagflationary” shock that will boost global inflation and slow global growth, on the margin. High energy prices will be the main driver of that stagflation, given the uncertainties over the availability of Russian oil and natural gas supplies (Chart 1). Tighter financial conditions - beyond what has already occurred so far this year as global equity and credit markets have sold off (Chart 2) – will also contribute to the moderation of the pace of global growth. Chart 1A Mild Inflationary Shock From The Russian Invasion
A Mild Inflationary Shock From The Russian Invasion
A Mild Inflationary Shock From The Russian Invasion
Chart 2The Ukraine War Is Adding To 2022 Risk-Off Trends
The Ukraine War Is Adding To 2022 Risk-Off Trends
The Ukraine War Is Adding To 2022 Risk-Off Trends
The stagflation shock should be relatively short, perhaps 3-6 months. BCA’s Commodity & Energy Strategy service expects OPEC to eventually supply more oil to the global market – a move that was already likely before the Russian invasion – helping to reduce the Russian supply premium in oil prices. Putin will likely have to be satisfied with claiming eastern Ukraine rather than being stuck in a protracted battle with fierce Ukrainian resistance while Russia suffers under crippling sanctions. BCA’s Geopolitical Strategy service does not expect the conflict to spread beyond Ukraine’s borders, as neither Russia nor NATO have an interest in war with each other (despite the nuclear saber-rattling by Russian President Putin in response to Western sanctions). A mild bout of stagflation will only delay, and not derail, the cyclical move towards tighter global monetary policies in response to elevated inflation and tightening labor markets, particularly in the US. This will take some of the upward pressure off global bond yields as central banks will be less hawkish than expected in 2022, but does not change the outlook for higher bond yields in 2023 and 2024. In terms of changes to our fixed income investment recommendations, and the allocations to our Model Bond Portfolio, we come to the following three conclusions. Upgrade Tactical Non-US Duration Exposure To Neutral We recently upgraded our recommended tactical duration exposure in the US to neutral, with the Fed likely to deliver fewer rate hikes this year than what is discounted by markets. The Ukraine situation makes it even more likely that the Fed will underwhelm expectations. A 50bp rate hike at the March FOMC meeting is now off the table, as the equity and credit market selloffs in response to the conflict have tightened US (and global) financial conditions on the margin. However, the war is not enough of a negative shock to US growth to derail the Fed from starting a gradual tightening process this month with a 25bp hike. Our decision to change our US duration stance was largely predicated on a view that US inflation will soon peak and slow significantly over the rest of 2022. However, there is a strong case to increase non-US duration exposure, as well. Our Global Duration Indicator - comprised of leading cyclical growth indicators and which itself leads the year-over-year change in our “Major Countries” GDP-weighted aggregate of 10-year government bond yields by around six months - peaked back in February 2021 (Chart 3). The Global Duration Indicator is now at a “neutral” level consistent with more stable bond yield momentum. Declines in the ZEW economic expectations survey in the US and Europe, and in our global leading economic indicator, are the main culprits behind the fall in the Global Duration Indicator (Chart 4). Chart 3Upgrade Global Duration Exposure To Neutral
Upgrade Global Duration Exposure To Neutral
Upgrade Global Duration Exposure To Neutral
Chart 4Growth Expectations Have Turned Less Bond Bearish ... For Now
Growth Expectations Have Turned Less Bond Bearish ... For Now
Growth Expectations Have Turned Less Bond Bearish ... For Now
While the ZEW series have rebounded in the first two months of 2022, which could set the stage for a move back to higher yields later this year, the Ukraine situation will likely hurt economic expectations (particularly in Europe) in the near-term. We expect our Global Duration Indicator to continue signaling a more neutral backdrop for global bond yields over the next few months. In our Model Bond Portfolio on pages 13-14, we are expressing our view change by increasing the duration for all countries such that the overall duration of the portfolio is in line with the custom benchmark index (7.5 years). Importantly, we view this as only a tactical view change for the next few months, as developed economy interest rate markets are still discounting too few rate hikes – and in some countries like the UK and US, actual rate cuts – in 2023/24 (Chart 5). Chart 5Priced For Short, Shallow Hiking Cycles
Priced For Short, Shallow Hiking Cycles
Priced For Short, Shallow Hiking Cycles
Maintain Cyclical Government Bond Country Allocations That Favor Lower Inflation Regions Chart 6Oil Is Inflationary Now, Will Be Disinflationary Later
Oil Is Inflationary Now, Will Be Disinflationary Later
Oil Is Inflationary Now, Will Be Disinflationary Later
While we are neutralizing our global duration stance over a tactical time horizon (0-6 months), we are sticking with our current recommended cyclical (6-18 months) government bond country allocations. These are based on underlying inflation trends and the expected monetary policy response over the next couple of years. As noted earlier, BCA’s commodity strategists expect oil prices to fall from current war-elevated levels in response to increased supply from OPEC. The benchmark Brent oil price is forecasted to reach $88/bbl at the end of this year and $87/bbl and the end of 2023. The result will be a sharp decline in the year-over-year growth rate of oil prices that will help bring down headline inflation in all countries (Chart 6). Lower energy inflation, however, will not be the only factor reducing overall inflation across the developed world. Goods price inflation should also slow from current elevated levels over the next 6-12 months, as consumer spending patterns shift away from goods towards services with fewer pandemic-related restrictions on activity. Less goods spending will help ease some of the severe supply chain disruptions that have fueled the surge in global goods price inflation over the past year. That process has likely already begun – indices of global shipping costs have peaked and supplier delivery times have been shortening according to global manufacturing PMI surveys. The shift from less goods spending towards more services spending will lead to trends in overall inflation being determined more by services prices than goods prices. The central banks in countries that have higher underlying inflation, as evidenced by faster services inflation, will be under more pressure to tighten policy over the next couple of years. Therefore, our current cyclical recommended country allocations (and our Model Bond Portfolio weightings) within developed market government bonds reflect the relative trends in services inflation. We are currently recommending underweights in the US, UK and Canada where services inflation is currently close to 4%, well above the central bank 2% inflation targets (Chart 7). At the same time, we are recommending overweights in core Europe (Germany and France) and Australia, where services inflation is around 2.5%, and Japan where services prices are deflating (Chart 8). Chart 7Higher Underlying Inflation In Our Recommended Underweights
Higher Underlying Inflation In Our Recommended Underweights
Higher Underlying Inflation In Our Recommended Underweights
Chart 8Lower Underlying Inflation In Our Recommended Overweights
Lower Underlying Inflation In Our Recommended Overweights
Lower Underlying Inflation In Our Recommended Overweights
Chart 9Faster Wage Growth In Our Recommended Underweights
Faster Wage Growth In Our Recommended Underweights
Faster Wage Growth In Our Recommended Underweights
The trends in services inflation are also reflected in wage growth in those same groups of countries – much higher in the US, UK and Canada compared to Australia, the euro area and Japan (Chart 9). We expect these relative trends to continue over the next 12-24 months, with higher underlying inflation pressures forcing the Fed, the Bank of England (BoE) and the Bank of Canada (BoC) to be much more hawkish, on a relative basis, than the European Central Bank (ECB), the Reserve Bank of Australia (RBA) and the Bank of Japan (BoJ). Our current bond allocations not only fit with underlying inflation trends, but also with market-based interest rate expectations. In Table 1, we show the pricing of interest rate expectations over the next few years, taken from Overnight Index Swap (OIS) forwards. We show the OIS projection for 1-month interest rates 12 months from now and 24 months from now. We also include 5-year/5-year forward OIS rates as a measure of market expectations of the terminal rate, a.k.a. the peak central bank policy rate over the next tightening cycle. In the table, we also added neutral policy rate estimates taken from central bank sources.1 Table 1Medium-Term Interest Rate Expectations Still Too Low In The US & UK
Adjusting Our Bond Recommendations For A More Uncertain World
Adjusting Our Bond Recommendations For A More Uncertain World
In the US and UK, the OIS rate projections two years out, as well as the 5-year/5-year forward rate, are below the range of neutral rate estimates. This justifies an underweight stance on both US Treasuries and UK Gilts with both the Fed and BoE now in tightening cycles. In Japan and Australia, the OIS projections are already within the range of neutral rate estimates, but the RBA and, especially, the BoJ are not yet signaling a need to begin normalizing the level of policy rates. This justifies an overweight stance on Australian government bonds and Japanese government bonds. In the euro area, OIS projections are below the range of neutral rate estimates, but the ECB is now signaling that any monetary tightening actions will need to be delayed because of the growth uncertainties stemming from the Ukraine conflict and high energy prices. Thus, an overweight stance on core European government debt is still warranted. In Canada, the OIS projections are within the range of neutral rate estimates, but the BoC has been preparing markets for a series of rate hikes. This makes our underweight stance on Canadian government bonds a more “mixed” call, although we remain confident that Canadian bonds will underperform in a global bond portfolio context versus European and Japanese government bonds. In sum, we see our recommended country allocations as the most efficient way to express our cyclical (medium-term) central bank views, given the strong link between forward interest rate expectations and longer-term bond yields (Chart 10). This is why we are not making changes to our country allocation recommendations alongside our move to tactically upgrade our global duration stance to neutral. Chart 10Too Much Tightening Priced Over The Next Year
Too Much Tightening Priced Over The Next Year
Too Much Tightening Priced Over The Next Year
Chart 11Bond Markets Not Priced For A Relatively More Hawkish Fed
Bond Markets Not Priced For A Relatively More Hawkish Fed
Bond Markets Not Priced For A Relatively More Hawkish Fed
Given our high-conviction view that markets are underestimating how high the Fed will need to lift interest rates in the upcoming tightening cycle – likely more than any other major developed economy central bank - positioning for US Treasury market underperformance on a 1-2 year horizon still looks like an attractive bet with forward rates priced for little change in US/non-US bond spreads (Chart 11). A wider US Treasury-German Bund spread remains our highest conviction cross-country spread recommendation. Reduce Spread Product Exposure In Europe & Emerging Markets Chart 12Cut EM & European High-Yield Exposure, But Stay O/W Italian BTPs
Cut EM & European High-Yield Exposure, But Stay O/W Italian BTPs
Cut EM & European High-Yield Exposure, But Stay O/W Italian BTPs
The geopolitical uncertainty stemming from the Ukraine war and the stagflationary near-term impact of high energy prices are negatives for all risk assets, on the margin. That leads us to tactically reduce the allocation to spread product to neutral versus government debt in our Model Bond Portfolio. We are implementing this by cutting allocations to riskier fixed income sectors that are most impacted by the Russia/Ukraine conflict – European high-yield corporate debt and emerging market (EM) USD-denominated hard currency debt (Chart 12). We had already been cautious on EM debt before the Russian invasion, with an underweight allocation to both USD-denominated sovereigns and corporates, so the latest moves just increase the size of the underweight. European high-yield, on the other hand, had been one of our highest conviction overweight positions – particularly versus US high-yield - entering 2022. However the Ukraine war is likely to have a bigger negative impact on the European economy than the US economy, thus we are cutting our recommended exposure to European high-yield only. The uncertainty of a war on European soil, combined with the spike in energy prices (especially natural gas), is negative for European growth momentum, reducing 2022 euro area real GDP growth by as much as 0.4 percentage points according to ECB estimates. This raises the hurdle for any ECB monetary tightening this year. An early taper of bond buying in the ECB’s Asset Purchase Program, an outcome that ECB officials claim is a required precursor to rate hikes, is now highly unlikely. Fears of reduced ECB bond buying had weighed on the relative performance of Italian government bonds last month, but a more dovish ECB policy stance should lead to lower Italian yields and a narrowing of the BTP-Bund spread (bottom panel). We continue to recommend a cyclical overweight stance on Italian government debt. A Final Thought We need to reiterate that the recommended changes made in this report – increasing global duration exposure to neutral and cutting EM and European high-yield – are over a tactical time horizon, largely in response to the Ukraine conflict. This is more of a “risk management” exercise, rather than a change in our fundamental cyclical views. We still believe global growth will remain above trend in 2022 and likely 2023, which will prevent a complete unwind of last year’s inflation surge, particularly in the US. We expect global bond yields to begin climbing again later this year and into 2023, and we envision an eventual return to a below-benchmark duration stance. Robert Robis, CFA Chief Fixed Income Strategist rrobis@bcaresearch.com Footnotes 1 The sources of the neutral rate estimates are listed in the footnotes of Table 1. GFIS Model Bond Portfolio Recommended Positioning Active Duration Contribution: GFIS Recommended Portfolio Vs. Custom Performance Benchmark
Adjusting Our Bond Recommendations For A More Uncertain World
Adjusting Our Bond Recommendations For A More Uncertain World
The GFIS Recommended Portfolio Vs. The Custom Benchmark Index
Adjusting Our Bond Recommendations For A More Uncertain World
Adjusting Our Bond Recommendations For A More Uncertain World
Global Fixed Income - Strategic Recommendations* Tactical Overlay Trades
Executive Summary Russian Stocks Are Breaking Below Their 2008 And 2015 Lows
Russian Stocks Are Breaking Below Their 2008 And 2015 Lows
Russian Stocks Are Breaking Below Their 2008 And 2015 Lows
The Kremlin will not halt its military operations in Ukraine for now. The strategic objective of Putin is to bring Ukraine back into its geopolitical and economic orbit. His immediate goal is to unseat the current government in Kyiv and install a pro-Kremlin administration. Russia is embracing a long period of economic and financial isolation. Russian financial markets will remain uninvestable for an extended period. We are downgrading Central European equities and local currency bonds to underweight within their respective EM portfolios. As a new trade, we recommend shorting the Polish zloty versus the US dollar. Recommendation Inception Date Return Short PLN / Long USD Mar 02, 2022 Bottom Line: The security situation in Europe will continue to deteriorate, especially if the Russian army fails to secure a rapid military victory. This poses a risk to global and EM risk assets. Within a global equity portfolio, investors should overweight the US, and underweight EM and Europe. Feature Global macro has taken a back seat and geopolitics has become the dominant driver of financial markets. Still, we believe geopolitical risks are underappreciated by global financial markets. Will Western Sanctions Halt Russia’s Military Operation? While sanctions have started and will continue to hurt the Russian economy and its financial system, the Kremlin will not halt its military operations in Ukraine for now. The strategic objective of Putin is to bring Ukraine back into its geopolitical and economic orbit. His immediate goal is to unseat the current government in Kyiv and install a pro-Kremlin administration. In fact, having already incurred considerable economic and financial costs, Russia will not pull back its army anytime soon. If anything, Russia’s rhetoric and actions will get more aggressive in the coming weeks. For now, the Kremlin will not agree to anything short of the surrender of Ukraine’s government and its army. In turn, Ukraine authorities and its military intend to continue fighting with the support of arms supplies from the West. As a result, any peace talks will be futile. The situation will thus continue to escalate and the risk premium in global financial markets will rise further. The global political uncertainty index will be rising and, as a rule of thumb, it heralds a lower P/E ratio for global equities (Chart 1). Chart 1Rising Geopolitical Risks = Lower P/E Ratio
Rising Geopolitical Risks = Lower P/E Ratio
Rising Geopolitical Risks = Lower P/E Ratio
The main question is, therefore, how bad could it get? We believe the conflict might take a turn for the worse. If the Russian military fails to achieve its goal to remove the current government in Kyiv, Putin will go all out. Losing this war is not an option for him. The failure of the Kremlin to secure a rapid military victory implies a massive escalation on two fronts: (1) the military actions of the Russian army in Ukraine will intensify and civilian infrastructure and potentially the population at large might be threatened; and (2) Russia will become more aggressive in its threats to the West. If and when Putin perceives that his military operation is failing or his power is threatened at home, he will resort to the extreme actions he has been warning about. Putin will bolster his military threats to Europe and to the US. In such a scenario, global risk assets will tank. Bottom Line: The security situation in Europe will continue to deteriorate, especially if the Russian army fails to secure a rapid military victory. Investors should position their portfolio to account for the fact that things will get worse before they improve. Russian Markets Are Uninvestable Chart 2No Buyers For Russian Bonds
No Buyers For Russian Bonds
No Buyers For Russian Bonds
Russian markets have become uninvestable and will remain so for some time (Chart 2). The elevated odds of further military escalation in Ukraine entails more downside in Russian financial assets. Additional sanctions on the Russian economy cannot be ruled out at this point. These sanctions as well as the capital controls imposed by Russia on both residents and non-residents make Russian financial markets uninvestable. We downgraded Russian stocks to underweight within an EM equity portfolio on December 17, 2021, arguing that geopolitical tensions surrounding Ukraine would escalate. Chart 3 suggests that Russian share prices in USD terms are about to break below their 2008 and 2015 lows. Technically speaking, if this transpires, it will entail considerable downside. Similarly, the ruble versus an equally-weighted basket of the US dollar and euro on a total return basis has formed a technically bearish head-and-shoulders configuration (Chart 4, top panel). Notably, the ruble’s real effective exchange rate based on both CPI and PPI is not as cheap as it was in 1998 and 2015 (Chart 4, bottom panel). Chart 4More Downside In The Ruble
More Downside In The Ruble
More Downside In The Ruble
Chart 3Russian Stocks Are Breaking Below Their 2008 And 2015 Lows
Russian Stocks Are Breaking Below Their 2008 And 2015 Lows
Russian Stocks Are Breaking Below Their 2008 And 2015 Lows
The sanctions have effectively cut off the largest Russian commercial banks1 from the SWIFT electronic system and frozen the central bank of Russia’s (CBR) foreign exchange reserves deposited at foreign institutions. As of June 2021, roughly US$ 377 billion out of US$ 585 billion of Russian foreign exchange reserves were held in Western commercial banks or institutions, most of it in liquid financial securities. Meanwhile, the rest were held either in gold physical holdings (US$ 127 billion) or at Chinese institutions (US$ 80 billion). If all western countries freeze the CRB’s assets held at their banks, Russia’s effective foreign exchange reserves will be down to US$ 207 billion. This assumes the amount of international reserves at western banks has not changed since June 2021. As a result, the ratio of the central bank’s foreign reserves-to-broad money supply (all household and corporate local currency deposits) has dropped from 0.9 to 0.6 (Chart 5). This suggests that the central bank’s available amount of foreign exchange reserves coverage of broad money supply has been reduced dramatically in recent days due to economic and financial sanctions. This and a massive flight of capital out of the country has led the authorities to impose capital controls. Also, the government is compelling domestic exporting firms to sell 80% of their foreign generated revenues. Will the West lift sanctions right after the war in Ukraine ends? We doubt it. In our view, Russia is embracing a long period of economic and financial isolation. Besides, Russia lacks the manufacturing capabilities needed to mitigate the effects of these sanctions. Chart 6 shows that Russia has been investing little outside resource sectors and real estate. At 8-8.5% of GDP, investment in non-resource sectors excluding properties has been too low for too long. Chart 5Russia: FX Reserves' Coverage Of Money Supply
Russia: FX Reserves' Coverage Of Money Supply
Russia: FX Reserves' Coverage Of Money Supply
Chart 6Russia Has Not Been Investing Much
Russia Has Not Been Investing Much
Russia Has Not Been Investing Much
This entails that Russia cannot become self-sufficient in many manufacturing sectors and technology. Trade with China will be the main channel that Russia can secure the manufacturing goods, machinery and technology it requires. Still, this will not allow the Russian economy to avoid a prolonged period of stagflation. Bottom Line: Odds are high that Russian financial markets will remain uninvestable for an extended period. The Russia economy is facing years of stagflation. Central European Financial Markets: Contagion Or An Existential Threat? Chart 7Central European Currencies Will Depreciate
Central European Currencies Will Depreciate
Central European Currencies Will Depreciate
Although Central European countries are not at risk from Russia’s military attack, their financial markets will remain jittery for a while. We are downgrading Polish, Czech and Hungarian equities, currencies and domestic bonds to underweight (Chart 7). The likelihood of strikes on Poland, the Baltic states or any other neighboring NATO member country is very low. Attacking a NATO member would trigger Article V of NATO and force the organization to defend its member. Importantly, we do not think the Kremlin has the appetite for war against NATO. Even though Russia is unlikely to stage an attack on any NATO member, there could still be threats from Moscow and escalation involving central European countries. This will be especially so if Putin fails to secure the change of government in Kyiv in the coming weeks and starts threatening the West due to the latter’s support of Ukraine. As a result, Central European financial markets will continue selling off further in response to this potential escalation. Bottom Line: We are downgrading Central European equities and local currency bonds to underweight within a respective EM universe. We are maintaining the long CZK / short HUF trade. As a new trade, we recommend shorting the Polish zloty versus the US dollar. Investment Recommendations Global share prices will continue selling off. Our US equity capitulation indicator has fallen significantly but is not yet at 2010, 2011, 2015-16 and 2018 levels (Chart 8). It will at least reach this level before the S&P 500 bottoms. Chart 8The S&P 500 Selloff Is Not Over
The S&P 500 Selloff Is Not Over
The S&P 500 Selloff Is Not Over
Our capitulation indicator for EM stocks is not low yet either (Chart 9). Hence, there is more downside. Investors should continue to take a defensive stance. Chart 9EM Stocks: Is There A Capitulation Phase Still Ahead?
EM Stocks: Is There A Capitulation Phase Still Ahead?
EM Stocks: Is There A Capitulation Phase Still Ahead?
Chart 10US Stocks Are About To Resume Their Relative Outperformance
US Stocks Are About To Resume Their Relative Outperformance
US Stocks Are About To Resume Their Relative Outperformance
Within a global equity portfolio, investors should overweight the US, and underweight EM and Europe. As US/global bond yields drop due to geopolitical jitters, the US stock market and growth stocks will resume their outperformance, at least for a period of time (Chart 10). Within an EM equity portfolio, we recommend overweighting Brazil, Mexico, Chinese A-shares, Singapore and Korea and underweighting Russia, Central Europe, South Africa, Indonesia, Turkey, Peru, Chinese Investable Stocks, Colombia and Chile. EM currencies and fixed-income markets remain vulnerable as the global risk off move causes the US dollar to spike. Arthur Budaghyan Chief Emerging Markets Strategist arthurb@bcaresearch.com Andrija Vesic Associate Editor andrijav@bcaresearch.com Footnotes 1 Following the invasion of Ukraine on February 26, the US administration added the two largest Russian banks, Sberbank and VTB Bank, to the sanction lists. Both banks combined total assets represent close to 40% of total Russian banking system assets.
Executive Summary Wars Don’t Usually Affect Markets For Long
Monthly Portfolio Update: Keep Calm And Stay Invested
Monthly Portfolio Update: Keep Calm And Stay Invested
We expect the war in Ukraine to stay within its borders, and therefore to have little impact on global growth. Markets will be volatile, but we recommend allocators stay invested – with some moderate hedges in place. The Fed won’t tighten as fast as markets expect, and US long rates will not rise much further this year. So, within fixed-income, we raise government bonds to neutral. Flat rates remove a positive for the Financials equity sector, which we lower to neutral. The oil price will fall back to $85 by the second half, as Saudi and others increase supply. We reduce our recommendation for Canadian equities and the CAD. Recommendation Changes
Monthly Portfolio Update: Keep Calm And Stay Invested
Monthly Portfolio Update: Keep Calm And Stay Invested
Bottom Line: Stay invested in risk assets, but have some hedges. We shift from Financials to the defensive-growth IT sector, raise our weight in UK equities, and suggest long positions in cash, CHF and JPY. Recommended Allocation
Monthly Portfolio Update: Keep Calm And Stay Invested
Monthly Portfolio Update: Keep Calm And Stay Invested
The war in Ukraine is likely to have only a limited impact on markets beyond the short term. As disturbing as the human tragedy is, Russia’s aims are limited to regime change in Kyiv. The European Union and US face restraints on how draconian sanctions against Russia can be, balking (so far at least) at blocking imports of Russian energy to the EU, given how much this would hurt the economy. The risk of the conflict spreading beyond Ukraine’s borders is low, limited perhaps to cyberattacks on Western targets. A Russian attack on a NATO member, such as Poland or one of the Baltic states, is extraordinarily unlikely – though Moldova and Georgia (not NATO members) might be more vulnerable at some point in the future. For more detailed analysis, please read the two reports on the Ukraine situation by our Geopolitical Service that we have made available to all BCA Research subscribers.1 Asset allocators need to look at these events dispassionately. Markets are likely to remain volatile over the coming months, as events in Ukraine unfold. But the lesson of most major conflicts is that they typically do not have a long-lasting impact on asset performance (Chart 1). There is little chance that the Ukraine war will significantly dent global growth. The only exception would be if the oil price were to rise much further to, say, $120 a barrel as some are forecasting. Certainly, in the past, a jump in the oil price has often been associated with recessions – even though the causality is unclear (Chart 2). But BCA’s Energy strategists expect to see an increase in oil supply by Saudi Arabia and Gulf states which will bring Brent crude back to $85 by the second half (from $98 now). Chart 1Wars Don't Usually Affect Markets For Long
Wars Don't Usually Affect Markets For Long
Wars Don't Usually Affect Markets For Long
Chart 2But A Jump In Oil Prices Would
But A Jump In Oil Prices Would
But A Jump In Oil Prices Would
Meanwhile, global growth remains robust, with all major economies expected to continue to grow well above trend this year, supported by robust consumption and capex (Chart 3). And sentiment towards equities has turned very pessimistic since the start of the year, with indicators such the US Association of Individual Investors’ weekly survey at its most bearish level since 2008 (Chart 4). These sort of sentiment levels have typically pointed to a rebound in risk assets. Chart 4Sentiment Is At Rock-Bottom
Sentiment Is At Rock-Bottom
Sentiment Is At Rock-Bottom
Chart 3Economic Growth Still Above Trend
Monthly Portfolio Update: Keep Calm And Stay Invested
Monthly Portfolio Update: Keep Calm And Stay Invested
Our advice now would be to stay invested, but with some moderate safe-haven hedges in place – largely as we have recommended since late last year. We continue to recommend an overweight in cash, but will look to allocate this to risk assets when it becomes clearer how the situation in Ukraine will pan out. The trajectory of markets over the rest of this year still largely comes down to what the Fed and other central banks will do. The hawkish turn by the Fed in December has been the driver of markets in the past two months, with the result that none of the major asset classes have produced positive returns year to-date – only inflation hedges such as commodities and gold (Chart 5). Chart 5Most Asset Classes Are Down Year-To-Date
Monthly Portfolio Update: Keep Calm And Stay Invested
Monthly Portfolio Update: Keep Calm And Stay Invested
The futures market is pricing the Fed to raise rates seven times over the next 12 months, the fastest rate of predicted tightening since the early 2000s (Chart 6). We think that is a little excessive. Inflation, as we have argued previously, is likely to fade over the coming quarters, as the supply response to strong consumer demand for manufactured goods brings down the price of cars, semiconductors, shipping and other major items. The Fed may well start in March with the intention of raising rates by 25bps every meeting, but the slowing of inflation we expect, and the tightening of financial conditions already under way (Chart 7), make it unlikely that it will continue at that pace. And remember that Fed policy will need to be even more hawkish than the market is currently pricing in for it to have an incrementally negative impact on risk assets. Chart 6Market Believes Fed Will Hike Fast
Market Believes Fed Will Hike Fast
Market Believes Fed Will Hike Fast
Chart 7Financial Conditions Have Already Tightened
Financial Conditions Have Already Tightened
Financial Conditions Have Already Tightened
There are certainly risks to this scenario. The forward yield curve is pointing to inversion one year ahead, something which normally presages recession over the following 1-3 years (Chart 8). Higher prices are starting to hurt consumer confidence, though there is a big disparity between the two main US indicators (Chart 9). Chart 8Will Yield Curve Invert Within A Year?
Will Yield Curve Invert Within A Year?
Will Yield Curve Invert Within A Year?
Chart 9Inflation May Be Hurting Consumer Confidence
Inflation May Be Hurting Consumer Confidence
Inflation May Be Hurting Consumer Confidence
What all this boils down to is how high a level of interest rates the economy is able to withstand. The futures markets imply that, in most countries, central banks will raise rates aggressively this year, but then be forced to stop or even cut rates after that because their actions cause an economic slowdown (Table 1). Our view is that the terminal rate is much higher than what is priced by markets and projected by central banks: In the US perhaps 3-4% in nominal terms.2 Even with seven Fed hikes over the next year, the policy rate would therefore remain well below neutral – an environment in which historically equities have outperformed bonds (Chart 10). Table 1Central Banks Will Hike Aggressively – But Then Stop Soon
Monthly Portfolio Update: Keep Calm And Stay Invested
Monthly Portfolio Update: Keep Calm And Stay Invested
Chart 10Even In A Year, Rates Will Be Well Below Neutral
Even In A Year, Rates Will Be Well Below Neutral
Even In A Year, Rates Will Be Well Below Neutral
One final comment: On long-term returns. As a result of the recent moderate equity correction, strong earnings growth, and higher long-term rates, the outlook is somewhat rosier than when we published our most recent report on Return Assumptions in May 2021 – though admittedly forward long-term returns are still likely to be lower than over the past 20 years (Table 2). This is not, then, a time to turn defensive. Table 2Long-Term Return Outlook No Longer Looks So Gloomy
Monthly Portfolio Update: Keep Calm And Stay Invested
Monthly Portfolio Update: Keep Calm And Stay Invested
Fixed Income: In the short-term, government bonds look oversold (Chart 11). With inflation set to peak and the Fed likely to be less hawkish than the market has priced in, we do not see the 10-year US Treasury yield rising more than another 25 basis points or so above its current level this year. Accordingly, we are changing our duration call from underweight to neutral, and raise our recommendation for government bonds within the (still underweight) fixed-income bucket to neutral. For more cautious investors, a slight increase in government bond holdings might be warranted. Within credit, investment-grade bonds still offer little pickup, despite the moderate rise in spreads this year (from 92 to 121 in the US, for example), and so we lower this asset class to underweight. We continue to prefer high-yield bonds, which in the US now imply a jump in the default rate from 1.2% over the past 12 months to 4.5% over the coming year (Chart 12). As long as the economy grows in line with our expectations, that is very unlikely. Chart 11Government Bonds Look Oversold
Government Bonds Look Oversold
Government Bonds Look Oversold
Chart 12Will Defaults Really Jump This Much?
Will Defaults Really Jump This Much?
Will Defaults Really Jump This Much?
Equities: With the economy continuing to grow above-trend, global earnings should remain robust. This will not be a classic year for equity returns, but we expect them to do better than bonds. We continue to prefer US over European equities. As was seen in the aftermath of the invasion of Ukraine, US stocks are more defensive, and European growth will continue to be under threat from higher energy prices (Chart 13). We also move our recommended portfolio a little in the defensive direction by going overweight UK equities (which have a particularly high weight in defensive growth sectors, such as a 13 point overweight in Consumer Staples); we fund this by lowering Canadian equities to underweight, given their close linkage with oil (Chart 14), and the vulnerability of the Canadian housing market to rising rates. We remain underweight EM, but Chinese stocks (which were very oversold in late 2021) have been a relative safe haven as China started to stimulate, and so we continue with our neutral position for now. Chart 13Higher Energy Prices Threaten Europe
Higher Energy Prices Threaten Europe
Higher Energy Prices Threaten Europe
Chart 14Canadian Stocks Move With The Oil Price
Canadian Stocks Move With The Oil Price
Canadian Stocks Move With The Oil Price
Chart 15Financials Not So Attractive If Rates Don't Rise
Financials Not So Attractive If Rates Don't Rise
Financials Not So Attractive If Rates Don't Rise
Our view that long-term rates have limited upside this year makes us more cautious on Financials stocks, which are closely correlated with rates, and so we cut this sector to neutral (Chart 15). A period of slowing growth points towards a preference for defensive growth, and so we raise our recommended weight in the IT sector to overweight from neutral. It is tempting to think of this sector as being composed of ridiculously overvalued speculative internet names, but it is in fact dominated by established hardware and software titans with deep competitive moats (Table 3). While the sector is not exactly cheap, its risk premium over bonds is quite reasonable by historical standards (Chart 16). Table 3Tech Sector Is Not Made Up Of Speculative Stocks
Monthly Portfolio Update: Keep Calm And Stay Invested
Monthly Portfolio Update: Keep Calm And Stay Invested
Chart 16Tech Is Not Unreasonably Priced
Tech Is Not Unreasonably Priced
Tech Is Not Unreasonably Priced
Chart 17Relative Rates Suggest Some Upward Pressure On USD
Relative Rates Suggest Some Upward Pressure On USD
Relative Rates Suggest Some Upward Pressure On USD
Currencies: A neutral position on the US dollar still makes sense. Short-term rates are likely to rise somewhat faster in the US, relative to expectations, than in Europe or Japan (Chart 17). Nevertheless, the USD is expensive, and long-dollar is a consensus trade – reasons why the dollar has risen by less than 1% year-to-date on a trade-weighted basis, despite all the higher rate expectations and geopolitical shocks. Investors looking for hedges against downside risk might look to the Japanese yen, which is particularly cheap, and the Swiss franc. By contrast, the Canadian dollar, like Canadian equities, is closely linked to the oil price and a fallback in the Brent price would be negative; we move underweight. We also raise the CNY to neutral, since it may become a safe haven currency in the current geopolitical situation, though the Chinese authorities won’t let it rise too much since that would slow the economy. Commodities: China’s stimulus remains somewhat halfhearted (Chart 18). Although the credit and fiscal impulse has bottomed, we expect to see it rebound only moderately, with just minor cuts in interest rates and the reserve ratio. This will stabilize Chinese growth, but not cause a boom as in 2020, 2016 or 2013. The rise in industrial commodities prices, therefore, is likely to be limited from here. For oil, as mentioned above, we expect to see Brent crude return to around $85 by the second half, as new supply comes onto the market. Gold has done well, as expected, in the face of a major geopolitical event. But it is expensive by historical standards, vulnerable to a rise in real (as opposed to nominal rates) as inflation eases (Chart 19), and faces cryptocurrencies as a rival. We keep our neutral, as a hedge against the tail-risk of much higher inflation, but would not chase the price at this level. Chart 18China's Stimulus Isn't Enough To Help Metals Prices
China's Stimulus Isn't Enough To Help Metals Prices
China's Stimulus Isn't Enough To Help Metals Prices
Chart 19Rising Real Rates Are Negative For Gold
Rising Real Rates Are Negative For Gold
Rising Real Rates Are Negative For Gold
Garry Evans, Senior Vice President Global Asset Allocation garry@bcaresearch.com Footnotes 1 Please see Geopolitical Strategy Special Reports, “Russia Takes Ukraine: What Next?” dated February 24, 2022, and "From Nixon-Mao To Putin-Xi," dated February 25, 2022. 2 Please see Global Investment Strategy, “The New Neutral” dated January 14, 2022. Recommended Asset Allocation Model Portfolio (USD Terms)
Executive Summary The heightened uncertainty of the current situation means it makes sense to keep portfolio duration close to benchmark. The recent market turmoil means that a 50 bps rate hike is off the table for the March FOMC meeting, but the Fed will proceed with a 25 bps rate hike this month and signal a further steady pace of tightening. As of Monday morning, the market is priced for close to 150 bps of tightening during the next 12 months. This is reasonable assuming that inflation moderates in the second half of the year and that long-dated inflation expectations remain well contained. A moderation of inflation in H2 remains our base case, but the war in Ukraine increases the risk that inflation will be sticky and that long-dated inflation expectations will move higher. The Golden Rule Of Bond Investing
The Golden Rule Of Bond Investing
The Golden Rule Of Bond Investing
Bottom Line: An ‘at benchmark’ portfolio duration stance makes sense for now, but the recent drop in Treasury yields could eventually present us with an opportunity to re-initiate a ‘below-benchmark’ portfolio duration position. Stay tuned. Feature The Russian invasion of Ukraine is ongoing and financial markets will surely remain volatile until a resolution is reached. For more details on how we see the crisis evolving please refer to last week’s BCA Special Report.1 As we go to press on Monday, the market is trying to digest the impact of sanctions that will block the access of some Russian banks to the SWIFT financial messaging system and freeze some Russian central bank reserves that are held abroad in USD and EUR. Taken together, the sanctions will impart a large stagflationary impulse to the Russian economy and, as would be expected, the Ruble is depreciating rapidly on Monday morning. The reaction in US bond markets is so far more muted. The 10-year Treasury yield is currently 1.86% - down from 1.99% last Wednesday – and the 2-year Treasury yield is 1.44% - down from 1.58% last Wednesday (Chart 1). Movements in the real and inflation components of US Treasury yields do show that the US market is pricing-in some stagflationary contagion. The real 10-year Treasury yield is down to -0.71% (from -0.54% last Wednesday) and the 10-year TIPS breakeven inflation rate is up to 2.57% (from 2.53% last Wednesday). The same divergence between a falling real yield and rising cost of inflation compensation is seen at the 2-year maturity point (Chart 1, bottom 2 panels). The market has also moved to price-in a shallower path for Fed rate hikes compared to last week (Chart 2). The market-implied odds of a 50 bps rate hike this month are now slim and the market is now looking for only 139 bps of cumulative tightening (just under six 25 basis point rate hikes) by the end of this year. Chart 2Fed Funds Rate Expectations
Fed Funds Rate Expectations
Fed Funds Rate Expectations
Chart 1A Stagflationary Shock
A Stagflationary Shock
A Stagflationary Shock
We agree with the market that the heightened uncertainty and tightening of financial conditions takes a 50 bps rate hike off the board for the March FOMC meeting. A 25 bps rate hike this month remains the most likely scenario. However, we also think the market might be over-estimating the extent to which contagion from Russia will limit the pace of Fed tightening later in the year. In fact, we are inclined toward the view that the lasting impact of the crisis on the US economy might be more inflationary than deflationary. Chart 3Expect US/German Yield Differential To Widen
Expect US/German Yield Differential To Widen
Expect US/German Yield Differential To Widen
The inflationary risk is that a sustained upward shock to the oil price could keep headline inflation higher than it would otherwise be. This could also bleed through into other commodity prices and possibly even to inflation expectations. The textbook central bank response should be to ignore a commodity price shock and set policy based on trends in core inflation. However, in the current environment it will be difficult for the Fed to ignore yet another inflationary shock, especially if long-dated inflation expectations move higher. On the other hand, the economic fallout from a Russian recession will be much worse for Europe than for the United States. European Central Bank (ECB) Chief Economist Philip Lane recently estimated that the Ukrainian war could shave 0.3%-0.4% off Eurozone GDP this year.2 If the shock leads to a wider divergence between Fed and ECB policy expectations, then we would expect to see a widening of US yields versus European yields and upward pressure on the US dollar. Given that US bond yields can only diverge so far from yields in the rest of the world, a stronger dollar may cap any increase in US bond yields and eventually limit the extent of Fed tightening. So far, trends in the dollar and dollar sentiment have been supportive of rising US bond yields, but it will be important to watch this situation in the coming months to see if it changes (Chart 3). Investment Conclusions The heightened uncertainty of the current situation means it makes sense to keep portfolio duration close to benchmark. The Fed is likely to proceed with tightening policy at a steady pace, starting with a 25 bps rate hike this month. Trends in inflation and financial conditions will determine the pace of rate hikes in H2 2022. Right now, our sense is that the lasting impact of the Ukrainian crisis on the US economy will prove to be more inflationary than deflationary. With that in mind, the recent drop in Treasury yields may eventually present us with an opportunity to re-initiate a ‘below-benchmark’ portfolio duration position. Checking In With Our Golden Rule Given the current market turmoil, we think it’s a good time to step back and check in with our Golden Rule of Bond Investing.3 The Golden Rule is a framework that investors can use to implement portfolio duration trades. It states that investors should determine the expected change in the fed funds rate that is priced into markets for the next 12 months and then decide whether the actual change in the funds rate will be greater or less than what is priced in the market. If you expect the fed funds rate to rise by more than what is priced in (a hawkish surprise), you should keep portfolio duration low. If you expect the fed funds rate to rise by less than what is priced in (a dovish surprise), you should keep portfolio duration high. It is admittedly a simple framework, but it does have a strong track record of performance. In general, hawkish surprises coincide with the Bloomberg Barclays Treasury index underperforming cash and dovish surprises coincide with the index outperforming cash (Chart 4). Chart 4The Golden Rule Of Bond Investing
The Golden Rule Of Bond Investing
The Golden Rule Of Bond Investing
More specifically, if we look at rolling 12-month periods going back to 1990, we see that dovish surprises have coincided with positive excess Treasury returns versus cash 85% of the time for an average 12-month excess return of 4.0%. Conversely, hawkish surprises have coincided with negative excess Treasury returns 72% of the time for an average 12-month excess return of -1.5% (Chart 5 & Table 1). Table 112-Month Treasury Excess Returns And Fed Funds Rate Surprises (1990 - Present)
Waiting For The Fog To Clear
Waiting For The Fog To Clear
Chart 5The Golden Rule’s Track Record
Waiting For The Fog To Clear
Waiting For The Fog To Clear
As of today, the market is priced for 149 bps of Fed tightening during the next 12 months. That is very close to six 25 basis point rate hikes at the next eight FOMC meetings. Given our view that inflation will moderate in the second half of the year, this seems like a reasonable forecast that is consistent with our ‘at benchmark’ portfolio duration stance. However, as noted above, we believe the war in Ukraine could lead to an increase in inflationary pressures in the United States. Therefore, we see the balance of risks as tilted toward more rate hikes than are currently discounted rather than fewer. It will be vital to monitor long-dated inflation expectations during the next few months to assess how the pace of Fed rate hikes will evolve. Using The Golden Rule To Forecast Treasury Returns One more application of our Golden Rule framework is that we can use it to create forecasts for Treasury index returns. This is done by first looking at the historical correlation between the Fed Funds Surprise – the difference between the expected 12-month change in the fed funds rate and the realized change – and the change in the Treasury index yield (Chart 6). A regression between these two variables allows us to estimate the change in the Treasury index yield based on an assumed Fed Funds Surprise. Chart 6The Correlation Between Treasury Yields And Fed Funds Surprises
Waiting For The Fog To Clear
Waiting For The Fog To Clear
Once we have an expected 12-month change in the Treasury index yield, we can translate that change into an expected return using the index’s average yield, duration and convexity. The result of this analysis is presented in Table 2. Table 2Using The Golden Rule To Forecast Treasury Returns
Waiting For The Fog To Clear
Waiting For The Fog To Clear
Table 2 shows that we would expect the Treasury index to deliver a total return of 1.82% in a scenario where the Fed lifts rates by 150 bps during the next 12 months. This would equate to the Treasury index beating a position in cash by between 0.07% and 0.83%, depending on whether rate hikes are front-loaded or back-loaded. A pace of one 25 basis point rate hike per meeting (+200 bps during the next 12 months) would lead to the Treasury index underperforming cash by between -2.35% and -3.02%. Conversely, we can see that the index is expected to beat cash by between 3.25% and 3.92% if the Fed only lifts rates four times during the next 12 months. Ryan Swift US Bond Strategist rswift@bcaresearch.com Footnotes 1 Please see BCA Special Report, “Russia Takes Ukraine: What Next?”, dated February 24, 2022. 2 https://www.reuters.com/business/exclusive-ecb-policymakers-told-ukraine-war-may-shave-03-04-off-gdp-2022-02-25/ 3 Please see US Bond Strategy Special Report, “The Golden Rule Of Bond Investing”, dated July 24, 2018. Treasury Index Returns Spread Product Returns Recommended Portfolio Specification
Waiting For The Fog To Clear
Waiting For The Fog To Clear
Other Recommendations
Waiting For The Fog To Clear
Waiting For The Fog To Clear
Executive Summary Through February 24th, our ETF portfolio outperformed its benchmark by 18 basis points. Its risk-friendly orientation helped it generate double that amount of outperformance in its first two weeks but cost it as markets broadly declined over the last two weeks. In line with our fixed income strategists’ recommendation, we are tactically shifting our fixed income positioning to neutral duration from below-benchmark duration. Our longer-run expectation for higher interest rates remains intact. We are not making any portfolio adjustments in response to Russia’s invasion of Ukraine. Although the situation is fluid, we share the BCA house view that the conflict will be narrowly confined to Ukraine and the Black Sea as long as the flow of energy between Russia and the EU continues unabated. Ukraine underscores the potential for volatility to surge from an already elevated base as news items interact with uncertainty about the Fed. We will continue to manage the ETF portfolio with a more tactical bent than we otherwise would. 2022 Rate Hike Expectations Have Gone Too Far
2022 Rate Hike Expectations Have Gone Too Far
2022 Rate Hike Expectations Have Gone Too Far
Bottom Line: Russia’s movements of troops and materiel have been weighing on equity markets. Now that it has made its move, the bottom of the range may be near. Feature This is the first of a series of monthly reports devoted to the ETF portfolio we launched at the end of January. Each report will review the previous month’s performance, tracking the portfolio's relative return and highlighting its key contributors. More importantly, it will reassess our forward-looking views and situate them in an asset allocation/portfolio construction context. This monthly report will also be our primary vehicle for making portfolio adjustments, though we will make intra-month changes if market prices or our views change enough to merit them. In the immediate future, the conflict in Ukraine looms large. Russia’s full-scale incursion into Ukraine on February 24th roiled global financial markets, especially in Europe, with US equities executing a stunning reversal, exemplified by the high-beta NASDAQ, which fell 3% in overnight futures trading before recovering all the decline en route to a 3% gain in the live session. The wild action highlighted the potential for volatility to spike while investors are already on edge over unusually high inflation and the Fed’s attempts to contain it. We reiterate that we expect volatility will remain elevated this year and perhaps across the entire rate hiking cycle. Looking Ahead On a call last week, a client asked us if we were more confident or less confident in our views than we were on our quarterly webcast two weeks ago. Though no major new data had arrived in the interim (and Russia had not yet invaded Ukraine), we responded that our conviction level was unchanged to slightly higher, given the comfort we derived from our fixed income colleagues’ well-reasoned argument for why they think rates have peaked in the near term and our own analysis of the University of Michigan consumer sentiment survey respondents’ perceptions of inflation. The Ukraine conflict has the potential to push energy prices higher in the very near term, but it does not alter our six-to-twelve-month view. Chart 1Entering The Fourth Wave Of Persistently High Volatility?
Entering The Fourth Wave Of Persistently High Volatility?
Entering The Fourth Wave Of Persistently High Volatility?
Chart 2A Whole Lot Of Dry Powder ...
A Whole Lot Of Dry Powder ...
A Whole Lot Of Dry Powder ...
We are still constructive on financial markets and the economy, as well, though we expect that geopolitics may well provide a catalyst for rolling surges in the already elevated VIX (Chart 1). The escalation of the Ukraine conflict will temporarily preserve the geopolitical risk premium embedded in crude oil prices, but the evergreen commodity rule that high prices are the best cure for high prices will soon assert itself. Our Commodity & Energy Strategy team projects that oil producers will ramp up supply sufficient to dislodge the risk premium by the end of the year, taking Brent crude down to $85 a barrel, where it expects it will remain throughout 2023. While high oil prices are a tax on economic activity, their adverse effect on the US is mitigated by its status as the world’s largest oil producer. Our positive outlook for the US economy rests on our expectation that flush American households will begin drawing down their mountain of pandemic savings (Chart 2, bottom panel) now that COVID infections are less numerous (Chart 3, top panel) and less serious (Chart 3, bottom panel). As the pandemic wanes, households will regain their full range of consumption options, from dining out and in-person entertainment to travel and lodging. Our base-case outlook has them spending about half of their $2-plus trillion of pandemic savings, but we note that they can draw upon other pools of capital. Household net worth has surged at a record rate over the eight quarters of the pandemic as the value of financial assets and homes surged, and banks are eager to help consumers deploy their idle credit capacity to top up their buying power (Chart 4). Chart 3... Is Ready To Be Deployed Now That Omicron Is Out Of The Way
... Is Ready To Be Deployed Now That Omicron Is Out Of The Way
... Is Ready To Be Deployed Now That Omicron Is Out Of The Way
Chart 4Banks Are Eager To Lend To Consumers
Banks Are Eager To Lend To Consumers
Banks Are Eager To Lend To Consumers
Persistent inflation could erode some of that buying power while weighing on consumer sentiment. The Russia-Ukraine conflict has the potential to push food costs higher along with energy costs, as Ukraine is a top ten producer of both corn and wheat and Russia is a global wheat heavyweight, but emerging markets are likely to bear the brunt of higher agricultural commodity prices as the US and the EU are net exporters of both grains. As detailed below, we expect inflation will soon peak and begin decelerating at a rapid clip, so we do not expect higher prices to weaken the consumption tailwind, no matter what the Ukraine affair may bring. We continue to have very high conviction that the US will grow well above trend in 2022 and expect that S&P 500 earnings per share will grow in the mid-to-high single digits. Yields Have Backed Up Enough (For Now) We expect that volatility will remain elevated throughout this year and perhaps over the course of the Fed’s entire rate-hiking campaign as investors navigate an unfamiliar inflation backdrop and the Fed grapples with the challenges of normalizing monetary policy after a decade and a half of extraordinary accommodation. We have therefore recommended that investors consider adopting a more tactical approach to portfolio management and we are committed to following our own advice in the ETF portfolio. Although our cyclical view of interest rates has not changed – we expect they are ultimately headed higher than bond market participants do – we are persuaded by our fixed income colleagues’ argument that they’ve backed up too much too soon. We are therefore unwinding our below-benchmark duration positioning in the fixed income segment of our portfolio and tactically shifting to benchmark duration. Our colleagues cite several reasons for their call, but they all coalesce around the way that relentless upside inflation surprises have prompted aggressive rate hike expectations. They argue that market participants have overestimated how much the FOMC will hike the fed funds rate this year, as the overnight index swap curve is now pricing in about 150 basis points (bps) of hikes (Chart 5). That is well above the FOMC’s median 75-bps projection in December, and even though the official projection will rise at the March meeting, there is almost no chance that the committee’s guidance will be more hawkish than what the market is already discounting. Since the FOMC cannot surprise to the upside, rate hike expectations cannot push yields any higher for now. Chart 5Interest Rate Markets Have Gotten Ahead Of Themselves
Interest Rate Markets Have Gotten Ahead Of Themselves
Interest Rate Markets Have Gotten Ahead Of Themselves
The uninterrupted run of upside US inflation surprises drove the bond market to ramp up its rate hike expectations, but we expect that US inflation will peak this spring and decelerate rapidly to less uncomfortable levels, even though they will remain well above the Fed’s 2% target. The Manufacturing ISM Prices Paid Index, which leads headline inflation by six months (Chart 6, middle panel), reflects the deceleration in commodity and other input prices that is already underway (Chart 6, top panel). The ISM Supplier Deliveries Indexes suggest that global supply chain pressures have already started to ease (Chart 6, bottom panel). Ukraine disruptions aside, our commodity and energy strategists see oil price momentum losing steam, with Brent crude falling to $85 per barrel in the second half of the year and holding at that level across 2023 (Chart 7). Chart 6Good Tidings From The ISM Survey ...
Good Tidings From The ISM Survey ...
Good Tidings From The ISM Survey ...
Chart 7... And Relief On The Oil Front
... And Relief On The Oil Front
... And Relief On The Oil Front
As COVID recedes and people can resume typical day-to-day activities, consumer spending will continue to shift from goods to services (Chart 8). High-demand goods in categories subject to supply constraints have undergone a natural experiment in surge pricing. With supply at a deficit relative to demand, prices have risen to ration items like new automobiles to purchasers with the greatest time preference. Easing supply chain bottlenecks will help on the supply side of the equation and the new availability of services alternatives – attending live events instead of upgrading home theater and audio systems, going to the gym instead of buying home exercise equipment, taking a summer vacation instead of building a new backyard deck – will help relieve some of the upward pressure on demand. Chart 8When Demand Shifts To Services ...
When Demand Shifts To Services ...
When Demand Shifts To Services ...
Chart 9... Inflation Will Ease
... Inflation Will Ease
... Inflation Will Ease
A shift in spending patterns favoring services will allow headline inflation to move away from extreme double-digit goods inflation to merely elevated services inflation (Chart 9). Chart 10No One Left To Sell
No One Left To Sell
No One Left To Sell
Our colleagues also expect that upward pressure on wages, which has been concentrated in service-sector positions at the low end of the scale, will ease as Omicron fades and workers are able to return to the labor force without fearing for their health. The tightening of financial conditions that has occurred as rates have backed up and equity prices have fallen will cool growth momentum and reduce the potential for overheating. With inflation soon peaking and longer-run inflation expectations having remained well anchored, the Fed will feel less pressure to hike rates according to markets’ accelerated timetable. Finally, Treasury market positioning is now so unbalanced to the short side that investors would appear to be nearly out of selling capacity to push yields higher (Chart 10). Bottom Line: We expect that Treasury yields will ultimately rise much higher than the bond market currently anticipates, but the forces that have pushed them sharply higher since early December are spent. The near-term path of least resistance for bond yields is to the downside and we are shifting to a tactically neutral duration position to prepare for it. Portfolio Changes We are leaving our current equity positioning intact, as it remains appropriate to overweight the energy, industrials and financials sectors while avoiding consumer staples and utilities and maintaining direct out-of-benchmark exposure to the S&P 500 Pure Value Index via RPV and to the S&P SmallCap 600 Index via IJR (please refer to Cyclical ETF Portfolio table on page 11). We are reducing our exposure to the 1- to 3-year segment of the Treasury curve by 200 bps (SHY) and to the 3- to 7-year segment by 60 bps (IEI) and increasing our exposure to the 7- to 10-year segment by 260 bps (IEF) to bring portfolio Treasury duration into balance with the benchmark. We are exiting LQDH, the rate-hedged investment-grade corporate bond ETF, and reallocating the proceeds to its unhedged LQD version to bring corporate bond duration into balance. Portfolio Performance Market volatility and equity declines over the past ten trading days have cut its alpha in half, but the risk-friendly cyclical ETF portfolio we introduced last month has nevertheless outperformed its benchmark by 18 basis points (“bps”) through last Thursday’s close. Our equity positioning accounted for most of the value-add (Chart 11). Rising yields were a significant tailwind given our short duration stance. They also supported our value and small-cap tilts and, to a lesser extent, our overweight position in financials. The surge in energy prices generously rewarded our energy equities overweight (XLE). Chart 11Direct Equity Sector Deviations
March 2022 Cyclical ETF Portfolio Review
March 2022 Cyclical ETF Portfolio Review
Widening spreads since the beginning of the year were a headwind to our positioning within the fixed-income space (Chart 12). Our overweight to variable-rate preferred stocks (VRP) as an alternative to dearly priced bonds was the main detractor. Chart 12Fixed Income Deviations
March 2022 Cyclical ETF Portfolio Review
March 2022 Cyclical ETF Portfolio Review
Doug Peta, CFA Chief US Investment Strategist dougp@bcaresearch.com Jennifer Lacombe Associate Editor jenniferl@bcaresearch.com Cyclical ETF Portfolio
March 2022 Cyclical ETF Portfolio Review
March 2022 Cyclical ETF Portfolio Review
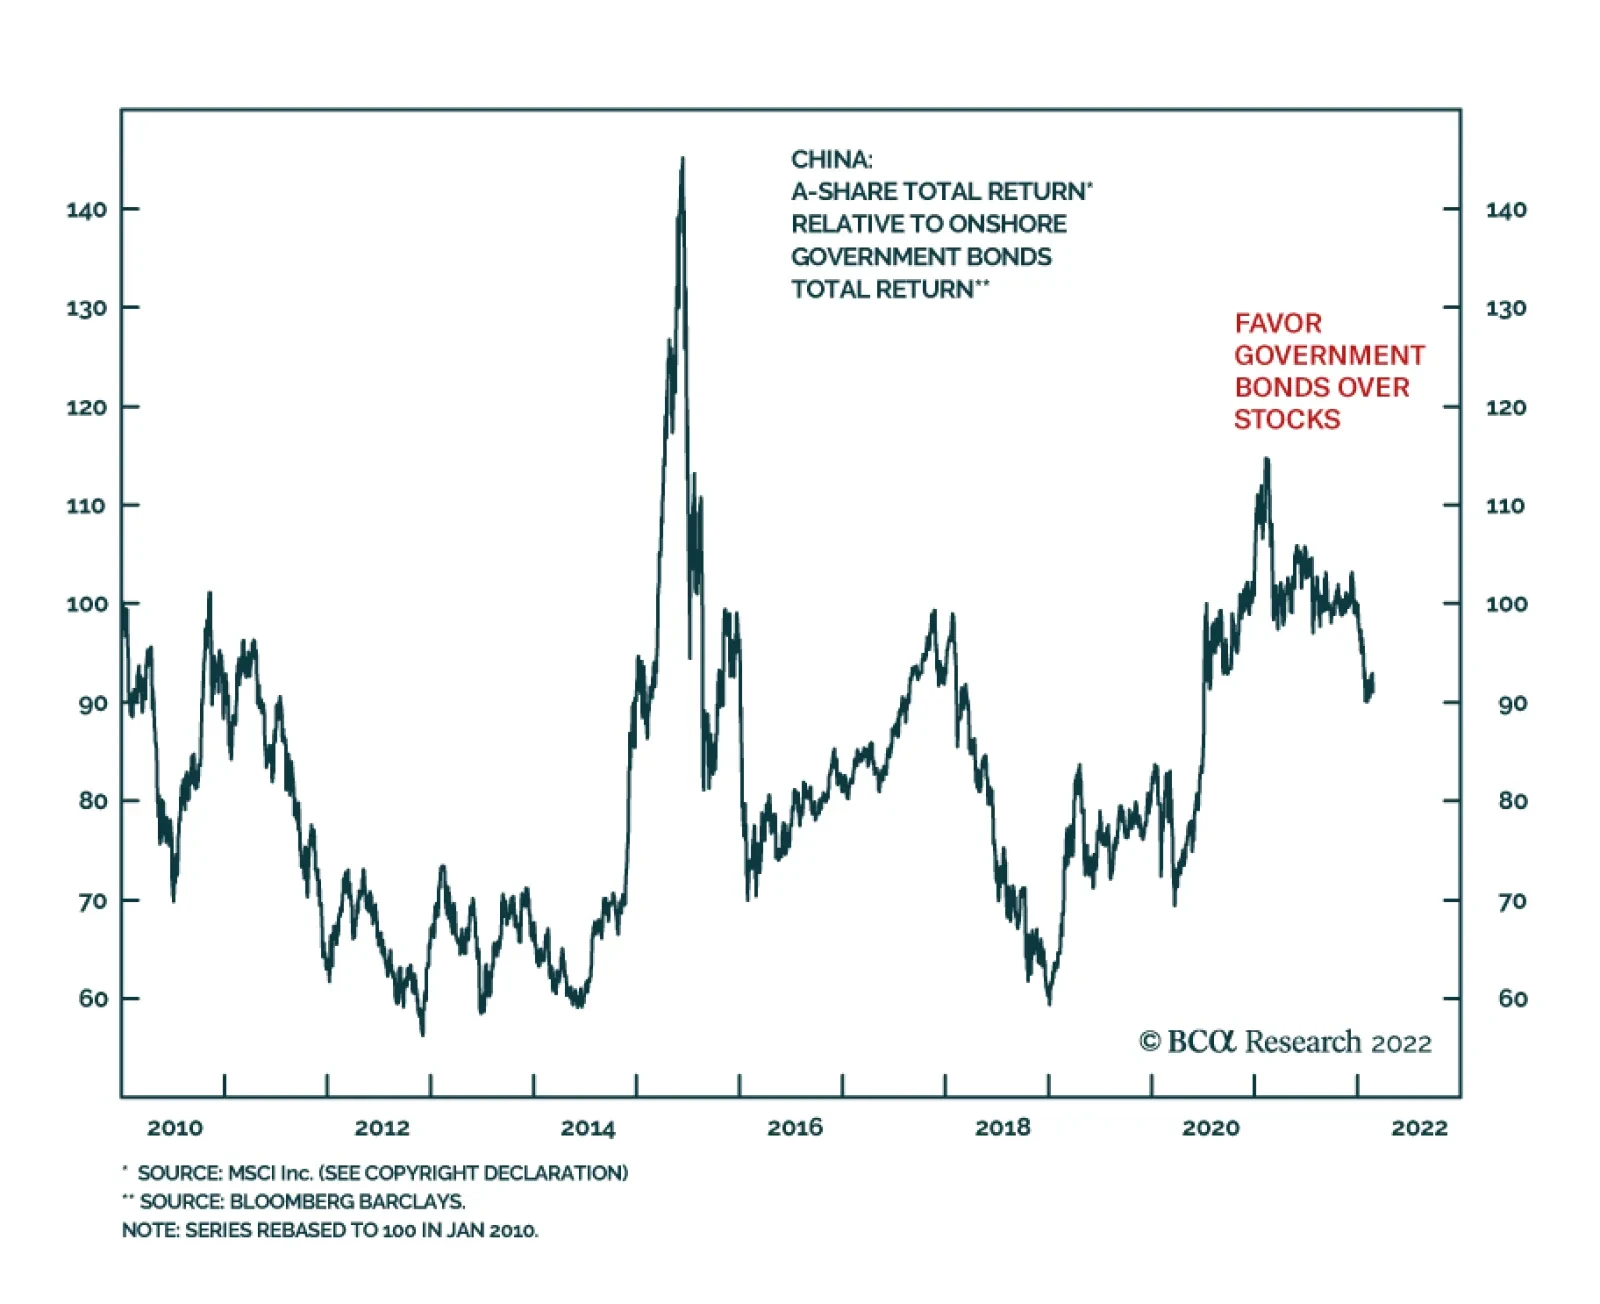
On Friday the PBoC boosted liquidity support in the financial system by injecting $45.8 billion through seven-day reverse repo agreements. This is the greatest liquidity injection since September 2020. There are two main reasons why the PBoC typically…
Executive Summary Stronger Capex Than Last Decade
Fallout From Ukraine
Fallout From Ukraine
The fog of war continues, but the worst potential outcome for the market—a freeze of Russian energy exports to Europe—has been avoided. Energy inflation is reaching its apex. Markets will remain volatile in the near term as uncertainty remains elevated in the coming days. Moreover, a transition from a recovery driven by consumer durable goods to services remains a hurdle against near-term European outperformance. Italian bonds and European banks are attractive, but it is not yet prudent to plunge headfirst into the euro. The longer-term consequences of the conflicts point toward greater capex and public deficits in Europe. This will boost the neutral rate of interest and European yields. Industrials and defense stocks are also key structural beneficiaries. Bottom Line: Keep hedges in place for the near term, as uncertainty remains rife. Buy Italian bonds and European banks, which will benefit from ECB support. Industrials still face near-term hurdles but should be a structural overweight position in European equity portfolios, along with financials and defense stocks. Feature The situation in Ukraine is reaching a climax. Following Russia’s recognition of the breakaway Luhansk and Donetsk People’s Republics (LPR and DPR) and its invasion of Ukraine, the S&P 500 entered correction territory. Importantly, the Dow Jones Euro Stoxx 50 is now down 10% since its January 5th high, which validates our repeated call over the past four weeks to hedge risk asset portfolios by selling EUR/CHF and EUR/JPY. An international conflict has begun and a human tragedy is unfolding; but, at the time of writing, it looks like the worst-case scenario for markets will be avoided. Germany is folding Nord Stream 2 indeterminably and Western allies have imposed painful economic sanctions on Russia. However, an expulsion of the SWIFT payment system is not in the cards. This is crucial because it greatly limits the risk that Russia will stop sending natural gas and oil to the EU. Ultimately, neither Russia nor the EU wants this outcome, since it imposes an enormous loss of revenues on the former (which needs hard currency to finance its war) and guarantees a recession for the latter (Chart 1). The war will still cost Europe. European natural gas prices surged again on Thursday, rising by more than 60% intraday. While a spike above EUR200/MWh is unlikely in the absence of an oil embargo, 20% of European natural gas imports pass through Ukraine. The conflict suggests that these flows will remain disrupted for now and that natural gas prices will remain between EUR80/MWh and EUR100/MWh for the next few months. This translates into elevated energy and electricity costs for the EU (Chart 2). Chart 1A European Recession Averted
Fallout From Ukraine
Fallout From Ukraine
Chart 2Peaking But Elevated
Fallout From Ukraine
Fallout From Ukraine
Chart 3Ebbing Energy Inflation
Fallout From Ukraine
Fallout From Ukraine
Oil markets are set to peak soon. The run-up in Brent prices in recent weeks was largely driven by geopolitical concerns. With the odds of an oil embargo declining, the pressure on Brent will also recede. Bob Ryan, BCA’s commodity and energy strategist, believes that Saudi Arabia, the UAE, and Kuwait will increase their own production in coming weeks to burnish their credentials as reliable oil producers, especially if oil experiences more turmoil. Bob expects crude prices to drop to $85/bbl by the second half of 2022. These dynamics are important because they imply that European headline inflation will soon peak. Yes, the recent spike in natural gas prices will keep energy inflation higher for a few more months, but, ultimately, ebbing base effects will bring down energy CPI. As Chart 3 highlights, even if Brent and natural gas prices stay at today’s levels for the remainder of the year, their year-on-year inflation rates will collapse, which will drive HICP lower. Near-Term Market Dynamics In this context, what to do with European assets? It is probably still too early to abandon our hedges, but we will likely do so next week or soon after. While the market has probably bottomed, prudence remains of prime consideration as a war is taking place and the situation on the ground may deteriorate. Chart 4A Buying Opportunity
Fallout From Ukraine
Fallout From Ukraine
The clearest near-term investment implication comes for European peripheral bonds. Italian spreads have widened significantly in the wake of the hawkish pivot by the ECB (Chart 4). However, we argued that, when interest rate expectations priced in 50bps of the hike for 2022, the move was excessive and that only one ECB hike in the fourth quarter was likely this year. Now that the Ukrainian crisis is reaching a climax, even some of the ECB’s most hawkish members, such as Robert Holzmann, Governor of the Austrian National Bank, indicate that the removal of liquidity will be slower than originally anticipated. This means that the ECB is likely to continue to backstop the European peripheral bond markets. Italian and Greek bonds, which offer spreads of 165bps and 249bps over German bunds, are appealing in light of this explicit backstop. European financials are another attractive buy. Investors should buy banks outright. As Chart 5 highlights, all the major Eurozone countries’ banking stocks have suffered widespread selloffs. However, the exposure to Russian debt is limited at $67 billion (Chart 6). Additionally, the European yield curve slope is unlikely to flatten significantly from here. The ECB will limit the upside in the German 2-year yields by not hiking until Q4 2022, while the terminal rate proxy in Europe has significant upside from here. A steeper yield curve will boost the appeal of banks, especially in a context in which peripheral spreads are likely to narrow. Chart 5Too Much Of A Dive
Fallout From Ukraine
Fallout From Ukraine
Chart 6Limited Russian Exposure
Fallout From Ukraine
Fallout From Ukraine
The outlook for the euro is more complex. Narrower peripheral spreads would boost the euro’s appeal, a cheap currency currently trading at a 17% discount to its PPP fair value. EUR/USD also trades at a 5% discount to the BCA Intermediate-Term Timing Model, which suggests that considerable bad news is already embedded in the exchange rate (Chart 7). The fact that the EUR/USD did not close below its January 27th low in the face of a major war on European soil adds to the notion that the euro already embeds a significant risk premium. However, there are still ample reasons to worry about additional volatility in the coming week or so. The ECB is sounding less hawkish, while the Fed is not changing its tone. Meanwhile, 1-month and 3-month risk reversals are not at levels consistent with a bearish capitulation, which suggests that the euro could suffer one last wave of liquidation (Chart 8). Thus, we are not buying the euro yet and are willing to forego the first few cents of gains for a clearer signal. Chart 7EUR/USD Is Cheap
Fallout From Ukraine
Fallout From Ukraine
Chart 8Sentiment Could Get More Negative
Fallout From Ukraine
Fallout From Ukraine
Circling back to the equity front, European equities had become very oversold after the 14-day RSI fell below 30. The diminishing risk of an energy crisis will also help. However, global equities face more risks than just Ukraine. As we wrote earlier this week, the transition away from consumer durable goods as the driver of global growth to services will involve some adjustments for stocks, especially in an environment in which the Fed is allowing global monetary conditions to deteriorate (Chart 9). Thus, the window of volatility in stocks is unlikely to close in the near term. The relative performance of European equities vis-a-vis the US is complex as well. European equities have undone most of the relative gains accrued so far in 2022 (Chart 10). On the one hand, the global growth transition will hurt European equities more than US ones, as a result of their greater exposure to manufacturing activity. Additionally, high energy costs are more of a problem for Europe right now than the US. On the other hand, the continued hawkishness of the Fed is likely to limit the ability of tech stocks to extend the rebound that began last Thursday. As a result, the most likely pattern is for some churning in the relative performance of Europe and the US in the coming week. Chart 10Vanishing Outperformance
Fallout From Ukraine
Fallout From Ukraine
Chart 9Tightening US Liquidity Conditions
Fallout From Ukraine
Fallout From Ukraine
For the remainder of the year, we expect the European equity outperformance to re-establish itself in view of the favorable relative profits picture for 2022, a topic that we will explore more deeply in the coming weeks. Bottom Line: The near-term outlook for European assets remains extremely murky. Not only is a war in Ukraine a major threat that can hurt sentiment further, but European assets still have to handle the short-term implications of a change in global growth leadership away from goods consumption. Nonetheless, the dovish message of the ECB in the wake of the Ukrainian invasion suggests that the collapse in Italian bonds and European banks in recent weeks is overdone. European stocks will likely continue to churn against US stocks in the near term but outperform for the remainder of the year. The sell-off in the euro is advanced, but prudence prevents us from buying EUR/USD today. Keep short EUR/CHF and short EUR/JPY hedges in place for now. Longer-Term Implications The crisis in Ukraine heightens Europe’s need to diversify its energy sourcing away from Russia. However, this is not a transition that can be executed on a dime. It will take years. For now, Europe remains dependent on Russian energy, which greatly limits the EU’s options. However, time offers many more possibilities. First, kicking Russia out of SWIFT will become feasible, because it will increase the robustness of the SPFS payment system, allowing Russia to receive funds for its energy, even if it is out of SWIFT. Second, and most importantly, time will allow Europe to find new energy sources. For example, Qatari LNG is often mentioned as a potential replacement for Russian natural gas. Qatar currently does not have the capacity to service Europe extensively, while fulfilling its previous contractual obligations, but the expansion of the production in its North Field East will increase capacity to 126MTPA by 2027. The LNG export capacity of the US may also increase over the coming years. Even if Qatar and the US could send enough LNG to satisfy the hole left by Russia tomorrow, Europe would not be able to accept delivery, as it does not have enough terminals to accommodate these shipments. Thus, investments in that sector will expand. Chart 11The Renewables Envelope Will Expand
Fallout From Ukraine
Fallout From Ukraine
Chart 12Nuclear Skepticism Remains
Fallout From Ukraine
Fallout From Ukraine
Most importantly, Europe will accelerate its transition toward renewable energy. Renewables are already a major focus of the NGEU program (Chart 11). However, we expect that, for the remainder of the decade, the NGEU program will be enlarged to allow greater investments in that space. Not only does it fit European green goals, but this policy would also increase the region energy security. More investment in nuclear electricity production is also possible but lacks popular support (Chart 12). The main message of these observations is that European infrastructure spending is likely to remain elevated in the coming years. As a result, industrial stocks may face some near-term headwinds as the global economy transitions away from the consumer goods-buying binge of COVID-19, but they will ultimately benefit greatly from an expansion of the capital stock around the world. Another long-term theme derived from the current crisis is that European defense stocks will fare well on a structural basis. The current crisis will force greater European unity. The presence of a common enemy will incentivize European nations to increase military spending, especially as the US continues to pivot toward Asia. Investors should overweight these stocks. In terms of bond market developments, more military spending and investment in energy infrastructures means that European budget deficits will be wider than if the Ukrainian crisis had not emerged. More accommodative fiscal policy will support aggregate demand, which will feed through greater capex (Chart 13). Thus, the experience of the last decade, whereby aggregate demand was curtailed by unnecessarily stringent European fiscal policy, will not be repeated. This confirms our expectation that the neutral rate of interest will rise in Europe and that Europe will escape an environment of zero rates (Chart 14). Therefore, German bunds yields have upside, the yield curve can steepen, and the outlook for European financials is positive on a long-term basis, not just on a near-term one. Chart 13Stronger Capex Than Last Decade...
Fallout From Ukraine
Fallout From Ukraine
Chart 14...Means Higher Yields And A steeper Curve
Fallout From Ukraine
Fallout From Ukraine
Chart 15Ebbing Fixed-Income Outflows?
Fallout From Ukraine
Fallout From Ukraine
Finally, the picture for the euro is murky. On the one hand, its inexpensiveness is a major advantage while a higher neutral rate of interest will limit the European fixed-income outflows that have plagues the Euro for the past decade (Chart 15). However, if we are correct that European capex will increase and that budget deficits will remain wider than in the last decade, this also means that the European current account surplus will narrow as excess savings recede. This implies that one of the key underpinnings of the euro will dissipate. In the end, productivity will be the long-term arbiter of the exchange rate. Europe still lags behind the US on this front, which augurs poorly for the performance of the euro (Chart 16). Reforms and capex may save the day, but it is too early to make this call. Chart 16The Productivity Handicap
Fallout From Ukraine
Fallout From Ukraine
Bottom Line: The events in Ukraine portend a structural shift in European capex. Europe will need to ween itself off its Russian energy dependency, which will require major investments in LNG facilities and renewable power. Moreover, European defense spending will rise. These will continue to support fiscal and infrastructure spending. As a result, industrials will benefit from a structural tailwind, as will European defense stocks. These same forces will put upward pressure on European risk-free yields, which will benefit beleaguered European financials and banks. The long-term outlook for the euro is murkier. More research must be conducted before making a definitive directional bet. Mathieu Savary, Chief European Strategist Mathieu@bcaresearch.com Tactical Recommendations Cyclical Recommendations Structural Recommendations