Fixed Income

Highlights Below-Benchmark Portfolio Duration: Bond investors should keep portfolio duration low in 2022. While the market’s pricing of the expected Fed liftoff date and initial pace of rate hikes is reasonable, terminal fed funds rate expectations are far too low. Own Treasury Curve Steepeners: The 2/10 Treasury slope will flatten by less than what is currently discounted in the forward curve in 2022. Investors should position for this by going long the 2-year note versus a duration-matched barbell consisting of cash and the 10-year note. Sell Short-Maturity TIPS: Investors should maintain a neutral allocation to long-maturity TIPS versus nominal Treasuries and an underweight allocation to short-maturity TIPS versus nominal Treasuries. We also recommend an outright short position in 2-year TIPS, as short-maturity real yields have a lot of upside in 2022. Overweight Corporate Bonds Versus Treasuries … For Now: We are overweight corporate bonds versus duration-matched Treasuries, for now, but expect to turn more defensive in the first half of 2022 once the yield curve sustainably moves into a flatter regime. Relative valuations suggest that investors should favor high-yield corporates over investment grade. Overweight Emerging Market Bonds Versus US Corporates: EM bonds offer an attractive spread advantage versus US corporates, and a weakening US dollar will help boost returns in 2022. A Maximum Overweight Allocation To Municipal Bonds: Municipal bonds offer exceptional value, especially at the long-end of the curve, and state & local government balance sheets are in excellent shape. Underweight Agency MBS: Agency Mortgage-Backed Securities don’t adequately compensate investors for the likely pace of refi activity in 2021. An up-in-coupon stance is also advisable to take advantage of rising bond yields. Feature BCA published its 2022 Outlook on December 1st. That report lays out the main macroeconomic themes that our strategists see driving markets next year. This Special Report explains how investors can profit from those themes in US fixed income markets. Specifically, we offer seven key US fixed income views for 2022. This report is limited to the seven key investment views, and only discusses Fed policy in the context of how it influences those views. Next week we will publish a more comprehensive “Fed In 2022” report that will delve into our outlook for the Fed next year. Outlook Summary First, a summary of the main economic views presented in BCA’s 2022 Outlook.1 On Economic Growth: The COVID-19 pandemic will recede in importance in 2022 allowing US economic growth to remain above trend. Sizeable household savings and wealth will support consumer spending, the composition of which will shift away from goods and towards services. Corporate capital expenditures also look set to surge. On Inflation: A transition in consumer spending from goods to services and an increase in labor supply will cause US inflation to fall in 2022, though it will remain above the Fed’s target. On Fed Policy: The first Fed rate hike will occur between June and December 2022, depending on the paths of inflation and inflation expectations during the next few months. Fed tightening will continue into 2023. On China and Emerging Markets: Further policy easing in H1 2022 will lead to a reacceleration in Chinese economic activity in the back half of the year. The BCA house view is negative on EM equities for now but will turn more bullish when clearer signs of Chinese policy easing emerge. Risks To The Outlook: The greatest risk to the outlook is that the spread of the Omicron variant leads to the re-imposition of public health measures that will weigh on economic activity. The effect of the Omicron variant remains uncertain, but increasingly widespread vaccination and the advent of anti-viral treatments should help mitigate any negative economic impacts. Key View #1: Below-Benchmark Portfolio Duration Bond investors should keep portfolio duration low in 2022, favoring the 2-year maturity over the 10-year. While the market’s pricing of the expected Fed liftoff date and initial pace of rate hikes is reasonable, terminal fed funds rate expectations are far too low. Our recommendation to keep portfolio duration low in 2022 stems directly from our assessment of Federal Reserve policy. Without going into too much detail – we will do that in next week’s “Fed In 2022” report – the Fed appears to have adopted a more hawkish reaction function during the past month. The Fed’s official forward guidance says that it will not lift rates until the labor market reaches “maximum employment”. However, Fed Chair Jay Powell weakened that commitment in recent Senate testimony. Powell said that persistently high inflation threatens the economic recovery and implied that to reach its maximum employment goal the Fed may need to act pre-emptively to tame inflation. To us, this means that the Fed’s “maximum employment” condition for lifting rates is no longer binding. The Fed will accelerate the pace of tapering when it meets this week and will start lifting rates between June and December of next year, depending on the interim trends in inflation and inflation expectations. After liftoff, Fed rate hikes will proceed at a predictable pace of 75-100 bps per year until economic growth slows significantly. We expect the fed funds rate to reach at least 2% before that occurs, consistent with survey estimates of the long-run neutral fed funds rate. Let’s compare our estimate of the future fed funds rate path with what is currently priced in the bond market (Chart 1). Chart 1The Market's Rate Expectations
The Market's Rate Expectations
The Market's Rate Expectations
Liftoff The overnight index swap (OIS) curve is priced for Fed liftoff in May 2022. This is a tad early compared to our projections, but not by much. Pace After liftoff, the OIS curve is priced for the fed funds rate to rise 79 bps during the subsequent 12 months. Again, this is roughly consistent with our own expectations that the Fed will deliver three or four 25 basis point rate hikes per year. Terminal Rate It is the market’s pricing of the endpoint of the next tightening cycle – the terminal fed funds rate – that disagrees significantly with our forecast. The OIS curve is priced for the funds rate to reach 1.5% in 2024 and then stabilize. This is too low. It is too low compared to the last tightening cycle when the fed funds rate reached 2.45% in 2019. It is also too low compared to survey estimates from market participants and primary dealers. The median respondent to the New York Fed’s Survey of Market Participants estimates that the long-run neutral fed funds rate is 2%. The median response to the same question from the Survey of Primary Dealers is 2.25% and the median FOMC participant pegs the long-run neutral rate at 2.5%. Meanwhile, the 5-year/5-year forward Treasury yield – a rough proxy for the long-run neutral interest rate that’s priced in the Treasury market – sits at only 1.73%. Historically, the 5-year/5-year forward yield converges with survey estimates of the long-run neutral rate as the Fed moves toward tightening (Chart 2). This means the 5-year/5-year forward Treasury yield has at least 27-52 bps of upside in 2022. Chart 25y5y Has Room To Rise
5y5y Has Room To Rise
5y5y Has Room To Rise
Treasury Yield Forecasts Chart 3Treasury Yield Forecasts
Treasury Yield Forecasts
Treasury Yield Forecasts
Chart 3 shows the 2-year, 5-year and 10-year Treasury yields along with the expected paths that are discounted in the forward curve for the next 12 months. The shaded regions in each panel represent our fair value estimates of where those yields will trade if the market moves to price-in our expected future path for the fed funds rate. The upper bound of the fair value range represents the most hawkish fed funds rate scenario that we think is feasible. It assumes that Fed liftoff occurs in June, that rate hikes proceed at a pace of 100 bps per year and that the fed funds rate levels-off at a terminal rate of 2.08% (8 bps above the lower-end of a 2%-2.25% target range). The lower bound of the fair value range represents the most dovish fed funds rate scenario that we think is feasible. It assumes that Fed liftoff occurs in December 2022, that rate hikes proceed at a pace of 75 bps per year and that the fed funds rate levels-of at a terminal rate of 2.08%. Chart 3 shows that the 10-year Treasury yield is well below even the lower-end of our fair value range. The 5-year Treasury yield is a bit too low compared to our target range and the 2-year yield is consistent with our fair value range, though at the very upper-end. The investment conclusions are obvious. Bond investors should keep portfolio duration low in 2022. They should avoid the 10-year maturity and allocate most funds to shorter maturities like the 2-year. It should be noted that we used a conservative 2.08% terminal rate estimate in the scenarios presented in Chart 3. This is at the low-end of most survey estimates. What’s more, the BCA Outlook makes a strong case that those survey estimates will be revised higher once it becomes apparent that interest rates will have to rise to well above 2% to contain inflation. We agree that survey estimates of the long-run fed funds rate are probably too low, but we don’t expect them to be revised higher in 2022. Upward terminal rate revisions are probably a story for 2023 or 2024, sometime after the Fed has delivered a few rate hikes and it becomes apparent that more will be needed to slow an overheating economy. Appendix A at the end of this report translates different fed funds rate scenarios into 12-month expected returns for every Treasury maturity. We show scenarios where the liftoff date varies between June 2022 and December 2022, where the pace of rate hikes varies between 75 bps and 100 bps per year and where the terminal fed funds rate varies between 2.08% and 2.58%. The 10-year Treasury note is projected to deliver negative returns in every scenario we tested. Meanwhile, the 2-year Treasury note is projected to deliver a small positive return in every single scenario. These results support our conclusion from Chart 3. Investors should maintain below-benchmark portfolio duration and favor short maturities over long maturities. Risks To The View The first risk to our bearish view on US Treasuries is a resurgence of the pandemic. The 10-year Treasury yield continues to track the “pandemic trade” in the stock market. That is, the 10-year yield rises when a basket of equities that benefit from economic re-opening outperforms a basket of equities that benefit from lockdowns, and vice-versa (Chart 4). So far, the news about the virulence of the Omicron COVID variant has been encouraging, and our base case scenario assumes a further easing of pandemic concerns over the course of 2022. The second risk to our view is that the Fed moves too aggressively toward rate hikes causing an abrupt tightening of financial conditions that weighs on economic growth and sends long-dated bond yields lower. The shaded region in Chart 5 shows that this exact dynamic played out in 2018. Fed rate hikes started to pressure the dollar higher and weigh on equities. This led to tighter financial conditions and slower economic growth. The impact of tighter financial conditions was not immediately evident in the bond market, but slower growth eventually caused the Fed to back away from rate hikes leading to a late-2018 peak in the 10-year yield. Chart 410yr Tracks The "Pandemic Trade"
10yr Tracks The "Pandemic Trade"
10yr Tracks The "Pandemic Trade"
Chart 5Watch Financial Conditions In 2022
Watch Financial Conditions In 2022
Watch Financial Conditions In 2022
Compared to the 2018 scenario, we see less risk of Fed over-tightening in 2022 mainly because the fed funds rate is starting out at a much lower level. However, it will be important to track financial conditions as the Fed moves toward liftoff. Undue tightening would cause us to reverse our positioning. Key View #2: Own Treasury Curve Steepeners The 2/10 Treasury slope will flatten by less than what is currently discounted in the forward curve in 2022. Investors should position for this by going long the 2-year note versus a duration-matched barbell consisting of cash and the 10-year note. We also recommend buying the 20-year bond versus a duration-matched barbell consisting of the 10-year note and 30-year bond as an attractive duration-neutral carry trade. The scenarios presented in the prior section show that the 2-year Treasury yield is priced within the bounds of our estimated fair value range while the 10-year Treasury yield looks too low. Logically, it makes sense to position for a steepening of the 2/10 Treasury curve to profit from this divergence. Chart 6 illustrates the implications of the prior section’s fair value estimates for different Treasury slopes. Our fair value range projects that the 2/10 Treasury slope will be between 38 bps and 89 bps in 12 months, above the 37 bps that is currently priced into the forward curve. The forward curve is also priced for too much flattening in the 2/5 Treasury slope, while the 5/10 slope is consistent with the lower end of our fair value range. The conclusion is that investors should implement 2/10 Treasury curve steepeners in 2022 on the expectation that the 2/10 slope will flatten by less than what is currently discounted in the forward curve. A comparison of the 5-year/5-year forward Treasury yield with a target range based on survey estimates of the long-run neutral fed funds rate also supports the case for 2/10 steepeners. Historically, an increase in the 5-year/5-year forward yield towards its target range corresponds with a steepening of the 2/10 slope (Chart 7). Bear-flattening moves in the 2/10 slope only occur when the 5-year/5-year forward is within its target band, as was the case in 2017/18. Given that the 5-year/5-year forward yield is currently well below its survey-derived target range, there is room for some 2/10 steepening as yields rise. Chart 6Treasury Slope Forecasts
Treasury Slope Forecasts
Treasury Slope Forecasts
Chart 7A Rising 5y5y Will Steepen The Curve
A Rising 5y5y Will Steepen The Curve
A Rising 5y5y Will Steepen The Curve
One way to position for a steeper 2/10 curve is to go long the 5-year Treasury note versus a duration-matched barbell consisting of the 2-year and 10-year notes. Presently, this trade looks very attractive. The 2/5/10 butterfly spread shows a significant yield advantage in the 5-year bullet over the 2/10 barbell, both in absolute terms and relative to our fair value model (Chart 8). While we view this as a good trade, we don’t think it’s the best way to position for 2/10 steepening. We prefer a position long the 2-year note versus a duration-matched barbell consisting of cash and the 10-year note. This trade gives you long exposure at the 2-year maturity instead of the 5-year maturity which will boost returns if the 2/5 slope steepens, as we anticipate it will (Chart 6, panel 2). Chart 8Curve Steepeners Are Cheap
Curve Steepeners Are Cheap
Curve Steepeners Are Cheap
In addition to our recommended 2/10 steepener, we advise clients to favor the 20-year bond versus a duration-matched barbell consisting of the 10-year note and 30-year bond. While we’d expect some flattening of the 10/30 slope in 2022, this trade should still perform well because of its huge carry advantage. The tables in Appendix A show that the 20-year bond earns a massive 12-month carry (income plus rolldown return) of 3.05% compared to 1.85% for the 10-year note and 1.80% for the 30-year bond. Key View #3: Sell Short-Maturity TIPS Chart 9TIPS Breakevens
TIPS Breakevens
TIPS Breakevens
Investors should maintain a neutral allocation to long-maturity TIPS versus nominal Treasuries and an underweight allocation to short-maturity TIPS versus nominal Treasuries. Other attractive positions include: an outright short position in 2-year TIPS, an inflation curve steepener (short 2yr TIPS/long 2yr nominal/long 10yr TIPS/short 10yr nominal), and a TIPS curve flattener (short 2yr TIPS/long 10yr TIPS). As noted at the beginning of this report, we see inflation trending down in 2022. Inflation will remain high enough for the Fed to feel comfortable lifting rates, but it won’t match the elevated readings that are currently discounted in TIPS. Interestingly, long-maturity TIPS breakeven inflation rates are roughly consistent with the Fed’s 2.3%-2.5% target range (Chart 9). The 5-year/5-year forward TIPS breakeven inflation rate is a bit too low, at 2.13%, and the 10-year TIPS breakeven inflation rate is currently 2.47%. With long-dated TIPS breakevens so close to the Fed’s target, we recommend a neutral allocation to long-maturity TIPS versus long-maturity nominal Treasuries heading into 2022. In our view, the mispricing in TIPS lies at the front-end of the curve. The 2-year TIPS breakeven inflation rate has risen to 3.23%, well above the Fed’s 2.3%-2.5% target range. This year’s surge in short-maturity TIPS breakevens has also resulted in a deeply inverted inflation slope (Chart 9, bottom panel). Table 1Regression of Monthly Changes In CPI Swap Rate Versus Monthly Changes In 12-Month Headline CPI Inflation (2010 - Present)
2022 Key Views: US Fixed Income
2022 Key Views: US Fixed Income
Short-maturity inflation expectations are highly sensitive to changes in CPI inflation, much more so than long-maturity expectations. In fact, monthly changes in the 2-year CPI swap rate are more than twice as sensitive to headline inflation than are monthly changes in the 10-year CPI swap rate (Table 1). This means that the cost of short-maturity inflation compensation will decline as inflation moderates in 2022. We recommend an underweight allocation to short-maturity TIPS versus short-maturity nominal Treasuries. We also think an outright short position in 2-year TIPS will be highly profitable in 2022. If we assume that the 2-year TIPS breakeven inflation rate falls to the middle of the Fed’s target range during the next 12 months, and additionally that the 2-year nominal Treasury yield converges with our fair value estimate using the scenario of a September Fed liftoff, 100 bps per year hike pace and 2.08% terminal rate, then we calculate that the 2-year TIPS yield will rise from its current -2.56% to -0.98% during the next 12 months (Chart 10). Chart 10A Lot Of Upside In Short-Maturity Real Yields Short 2-Year TIPS
A Lot Of Upside In Short-Maturity Real Yields Short 2-Year TIPS
A Lot Of Upside In Short-Maturity Real Yields Short 2-Year TIPS
Chart 10 also shows that the anticipated rise in the 2-year TIPS yield greatly outpaces the modest expected increase in the 10-year TIPS yield. This means that a position in 2/10 TIPS curve flatteners will turn a profit in 2022 (Chart 10, bottom panel). Key View #4: Overweight Corporate Bonds Versus Treasuries … For Now We are overweight corporate bonds versus duration-matched Treasuries, for now, but expect to turn more defensive in the first half of 2022 once the yield curve sustainably moves into a flatter regime. Relative valuations suggest that investors should favor high-yield corporates over investment grade. A key pillar of our corporate bond investment process is to split the economic cycle into three phases based on the slope of the yield curve (Chart 11). Phase 1 of the cycle is defined as the period from the end of the last recession until the 3-year/10-year Treasury slope breaks below 50 bps. Phase 2 of the cycle spans the period when the slope is between 0 bps and 50 bps. Phase 3 lasts from when the yield curve inverts until the start of the next recession. Chart 11The Three Phases Of The Economic Cycle
The Three Phases Of The Economic Cycle
The Three Phases Of The Economic Cycle
Our historical analysis shows that excess corporate bond returns versus duration-matched Treasuries tend to be strongest in Phase 1. They are usually positive, but much lower, in Phase 2 and are often negative in Phase 3 (Table 2). Table 2Corporate Bond Returns Across The Three Phases Of The Cycle
2022 Key Views: US Fixed Income
2022 Key Views: US Fixed Income
We have been firmly in Phase 1 since April 2020 and, as we would expect, excess corporate bond returns have been strong. However, we will not remain in Phase 1 much longer. The 3-year/10-year Treasury slope is currently 50 bps, right on the precipice between Phase 1 and Phase 2. We recommend an overweight allocation to corporate bonds versus Treasuries for now, but we will adopt a more defensive posture toward corporates once we transition into Phase 2. We expect this will happen sometime in the first half of 2022. Why Are We Not In Phase 2 Already? Chart 12Curve Flattening Is Overdone
Curve Flattening Is Overdone
Curve Flattening Is Overdone
The 3-year/10-year Treasury slope is hovering right around 50 bps. However, as is noted earlier in this report, we think that recent yield curve flattening is overdone and expect it to reverse somewhat in the coming months. Chart 12 shows the 3-year/10-year slope along with an expected fair value range. This range is based on a 100 bps Fed rate hike pace, a 2.08% terminal rate and varying the liftoff date between June 2022 and December 2022. This fair value range only breaks below 50 bps between March and September of next year. Given our yield curve view, we are positioned for one last period of strong corporate bond outperformance during the next few months. But we will turn more defensive once we judge that we have sustainably transitioned into a Phase 2 environment. Why Turn More Defensive In Phase 2? Chart 13IG Corporate Valuations
IG Corporate Valuations
IG Corporate Valuations
It’s correct to point out that excess corporate bond returns are still generally positive in Phase 2 environments, so ideally, we would remain overweight corporate bonds versus Treasuries throughout Phase 2. This makes sense theoretically, but strategically we think it will be wise to adopt a different approach this cycle. The main reason to err on the side of caution is that corporate bond valuations are extremely stretched. The 12-month breakeven spread for the investment grade corporate bond index is at its 6th percentile since 1995. This means that the investment grade corporate bond index has only been more expensive than today 6% of the time since 1995 (Chart 13). Tight spreads mean that expected returns will be modest, even in a favorable cyclical environment. In other words, we are not sacrificing much expected return by reducing exposure early in the cycle. Given that we can’t predict the start of the next Phase 3 period with exact precision, we think it makes sense to be more defensive this cycle. We will sacrifice some modest expected returns to ensure that we are well positioned for the next period of significant spread widening. Our corporate bond strategy is supported by an empirical study of historical returns. Table 3A shows average 12-month excess returns for the investment grade corporate bond index after certain combinations of the 3/10 Treasury slope and average index option-adjusted spread (OAS) are observed. Table 3B shows 90% confidence intervals for the averages presented in Table 3A.
Chart
Chart
The tables show that a strategy of remaining overweight corporate bonds versus Treasuries after the yield curve transitions into Phase 2 only works when the corporate index OAS is above 100 bps. A transition into Phase 2 portends negative excess corporate bond returns when the OAS is below 100 bps, as it is today. Favor High-Yield Over Investment Grade Chart 14HY Corporate Valuations
HY Corporate Valuations
HY Corporate Valuations
While investment grade corporate bonds look extremely expensive compared to history, high-yield corporate bonds look somewhat expensive, but much less so. The average High-Yield index OAS is 1 bp below its pre-COVID low, but investors still get a nice spread pickup for moving out of the Baa-rated credit tier and into the Ba-rated tier (Chart 14). Our prior research has shown that high-yield corporates tend to outperform duration-matched Treasuries when the excess index spread after accounting for default losses is above 100 bps.2 If we assume a minimum required excess spread of 100 bps and a 40% recovery rate on defaulted debt, we can calculate that the junk index is priced for a default rate of 3.4% during the next 12 months (Chart 14, bottom panel). All available evidence suggests that the default rate will come in below 3.4% during the next 12 months, leading to positive excess returns for high-yield corporate bonds. The default rate came in at 1.8% for the 12-month period ending in November and it has been dropping like a stone, consistent with the reading from our Default Rate Model (Chart 15). We also recently wrote about the exceptionally good health of corporate balance sheets.3 We expect the default rate will be in the mid-2% range in 2022, below what is priced into the junk index. Chart 15Corporate Defaults Will Stay Low In 2022
Corporate Defaults Will Stay Low In 2022
Corporate Defaults Will Stay Low In 2022
Junk’s valuation advantage leads us to recommend that investors maintain a preference for high-yield corporates over investment grade. We will turn more defensive on both investment grade and high-yield corporates once we transition into a Phase 2 environment, but we may still retain our preference for high-yield over investment grade at that time, as long as junk stays relatively cheap. Key View #5: Overweight Emerging Market Bonds Versus US Corporates Investment grade USD-denominated Emerging Market bonds (both sovereigns and corporates) will outperform US corporate bonds with the same credit rating and duration in 2022. EM bonds offer an attractive spread advantage versus US corporates, and 2022 returns will be boosted by a weakening US dollar. We see an opportunity in Emerging Market (EM) bonds for US investors in 2022. Note that we are only referring to investment grade EM bonds denominated in US dollars. We consider both investment grade USD-denominated EM sovereign bonds and investment grade USD-denominated EM corporate & quasi-sovereign bonds. EM Sovereigns Chart 16EM Sovereigns
EM Sovereigns
EM Sovereigns
EM sovereigns have modestly outperformed Treasuries so far this year (see Appendix B for a complete breakdown of year-to-date performance for different corporate bond sectors), and yet the sector remains attractively valued in the sense that the average index OAS has still not recovered its pre-COVID low (Chart 16). A look at recent performance trends shows that EM sovereigns outperformed credit rating and duration-matched US corporates in H2 2020 when the sector benefited from a huge yield advantage and a rapidly depreciating US dollar.4 This year, EM sovereigns lagged US corporates as the dollar strengthened. Looking ahead to 2022, we think that the recent bout of dollar strength is close to its end as the bond market has already moved to price-in an extremely hawkish Fed outlook at the front-end of the curve. A flat or depreciating dollar will benefit EM bonds in 2022, as will the yield advantage in EM sovereigns versus credit rating and duration-matched US corporates (Chart 16, panel 4). This yield advantage will only look more attractive as the Treasury curve flattens and the outlook for US corporate spreads deteriorates. At the country level, we see the best EM sovereign opportunities in Mexico, Russia, Chile, UAE, Qatar and Saudi Arabia. The bonds of all these countries outperformed credit rating and duration-matched US corporate bonds during the past 12 months, and they continue to offer a sizeable spread advantage (Chart 17).
Chart 17
EM Corporates & Quasi-Sovereigns The investment grade USD-denominated EM Corporate & Quasi-Sovereign index shows a similar relative return pattern to the EM Sovereign index, though overall performance has been better (Chart 18). We see that the index outperformed credit rating and duration-matched US corporates dramatically in H2 2020 when the dollar was under pressure. Relative returns have been more stable this year as the dollar has strengthened. Chart 18EM Corporates & Quasi-Sovereigns
EM Corporates & Quasi-Sovereigns
EM Corporates & Quasi-Sovereigns
EM corporates & quasi-sovereigns should continue to outperform credit rating and duration-matched US corporates in 2022. A weaker dollar will certainly help, but the main driver of outperformance will be the very attractive yield advantage (Chart 18, panel 4). Key View #6: A Maximum Overweight Allocation To Municipal Bonds Municipal bonds offer exceptional value, especially at the long-end of the curve, and state & local government balance sheets are in excellent shape. US bond investors should favor tax-exempt municipal bonds relative to both Treasuries and equivalently-rated corporate bonds. Long-maturity tax-exempt municipal bonds continue to be one the most attractively priced assets in the US fixed income space. As we discussed in a recent report, one big reason for the attractive valuation is that municipal bonds tend to pay premium coupon rates.5 This significantly reduces the duration risk in long-dated munis. The first two columns of Table 4 show the yield ratios and breakeven tax rates between different municipal bond sectors and duration-matched Treasury securities. We see that the breakeven tax rate – the tax rate that equalizes after-tax yields between the two sectors – is a mere 11% for 12-17 year general obligation munis. The breakeven tax rate between 12-17 year revenue munis and duration-matched Treasuries is only 3%, and the longest-maturity munis actually offer a before-tax yield advantage versus Treasuries! Table 4Muni/Treasury And Muni/Credit Yield Ratios
2022 Key Views: US Fixed Income
2022 Key Views: US Fixed Income
Table 4 shows that munis also offer excellent value compared to corporate bonds with the same credit rating and duration, especially at the long-end of the curve. Breakeven tax rates between munis and corporate credit range from 3% to 21% for maturities longer than 12 years. What’s even more impressive about municipal bonds is that their attractive valuations are buttressed by extremely high credit quality. State & local government balance sheets have received a huge boost from federal stimulus during the past two years, and this has sent net state & local government savings (revenues minus expenditures) surging into positive territory (Chart 19). But it’s not just federal stimulus that has aided state & local governments. Even if we exclude transfer payments altogether, we find that the difference between tax receipts and consumption expenditures is rising sharply relative to interest expense (Chart 19, panel 2). Ratings agencies have noticed the improvement in state & local government budgets and ratings upgrades have far outpaced downgrades during the past year (Chart 19, bottom panel). Chart 19State & Local Balance Sheets In Good Shape
State & Local Balance Sheets In Good Shape
State & Local Balance Sheets In Good Shape
Key View #7: Underweight Agency MBS Chart 20Poor MBS Performance Will Continue
Poor MBS Performance Will Continue
Poor MBS Performance Will Continue
Agency Mortgage-Backed Securities don’t adequately compensate investors for the likely pace of refi activity in 2021. An up-in-coupon stance is also advisable to take advantage of rising bond yields. We noted in a recent report that Agency Mortgage-Backed Securities have performed poorly in 2021.6 The main reason for the poor performance is that the compensation for prepayment risk embedded in MBS spreads (aka option cost) started the year at a very low level, but mortgage refinancing activity has been much higher than expected (Chart 20). The conventional 30-year MBS option cost has been rising, but it is still only back to where it was in 2019 (Chart 20, panel 2). This is not sufficiently attractive for us to advocate buying MBS. While rising bond yields will be a tailwind for refi activity in 2022, we still expect the pace of refinancings to be relatively strong because the rapid run-up in home prices has made it extremely enticing for households to tap the equity in their homes through cash-out refis. Within a recommended underweight allocation to MBS, we recommend that investors favor higher coupon securities over lower coupon ones. Higher-coupon MBS carry less duration than lower-coupon MBS and also wider OAS and greater convexity. This means that high-coupon MBS will outperform low-coupon MBS if bond yields rise in 2022, as we expect they will. Appendix A: Treasury Return Forecasts
Image
Image
Image
Image
Image
Image
Image
Image
Image
Image
Image
Image
Appendix B: US Bond Sector Year-To-Date Performance
Image
Image
Ryan Swift US Bond Strategist rswift@bcaresearch.com Footnotes 1 Please see The Bank Credit Analyst, “Outlook 2022: Peak Inflation – Or Just Getting Started?”, dated December 1, 2021. 2 Please see US Bond Strategy Weekly Report, “No Holding Back”, dated June 16, 2020. 3 Please see US Bond Strategy Weekly Report, “The Fed’s Inflation Problem”, dated November 23, 2021. 4 A weaker dollar tends to benefit USD-denominated EM bonds because it makes it easier for foreign issuers to service their dollar denominated debts. 5 Please see US Bond Strategy Weekly Report, “The Best & Worst Spots On The Yield Curve”, dated October 26, 2021. 6 Please see US Bond Strategy Weekly Report, “The Omicron Impact”, dated November 30, 2021. Recommended Portfolio Specification Other Recommendations Treasury Index Returns Spread Product Returns
Highlights The risk to European stocks from higher yields is overstated for 2022. Not only do equities possess a valuation cushion compared to bonds, but also the stock returns/bond yields correlation remains positive. This positive correlation is only two decades old, and it is a consequence of the stabilization of inflation and inflation expectations, which caused bond yield changes to mostly reflect adjustment in anticipated economic activity. As long as the recent inflation upsurge peters off next year, the equity/yield correlation will remain positive in 2022. Despite this sanguine short-term view, the long-term outlook is fraught with risks because next year’s inflation decline will be temporary; inflation is on a secular uptrend. The equity returns/bond yield correlation will become negative toward the middle of the decade, which will create a major headwind for the secular returns of both stocks and bonds. Feature Extremely low yields and elevated valuations constitute a potentially toxic mix for the equity outlook next year. The logic is straightforward: if yields rise enough, nosebleed multiples will become unjustifiable and the stock market will crash. Chart 1Protection Against Higher Yields
Protection Against Higher Yields
Protection Against Higher Yields
The picture is more complex and instead, European equities are likely to withstand higher yields. To begin with, BCA Research’s US Bond strategists anticipate a modest rise in Treasury yields to 2.25% in 2022, and our Global Fixed-Income strategists foresee an even more limited increase in German rates. Moreover, as we showed in our 2022 Key Views piece published last week, European equities embed a large valuation cushion in the form of a significant premium in their dividend yield relative to Bund yields (Chart 1). The correlation between yields and equities is another facet that will impact the effect of higher yields on the equity bull market. For now, it is premature to conclude that the positive correlation between yields and the absolute performance of European equities is poised to turn negative again in 2022. However, over the next couple of years, such a correlation reversal will take place, because inflation expectations are increasingly likely to become unmoored to the upside. Stocks Like Higher Yields Over the past two decades, one of the major financial market paradoxes has been the relationship between equity prices and bonds yields. Since 1998, the weekly returns of the MSCI Euro Area equity benchmark have correlated positively with the change in 10-year German yields (Chart 2). However, prior to the late 1990s, changes in bond yields and stocks prices were negatively correlated. Chart 2For Two Decades, Bond Yields And Stocks Prices Have Moved Together
For Two Decades, Bond Yields And Stocks Prices Have Moved Together
For Two Decades, Bond Yields And Stocks Prices Have Moved Together
The key to the shifting relationship between stocks and bonds is the link between yields and economic activity. Stock returns have always been procyclical because earnings are the most important driver of equity returns (Chart 3). However, bond yields have become increasingly pro-cyclical over time. Today, Bund yields and the German LEI move in tandem, but, prior to 1986, their five-year rolling correlation was negative (Chart 4). Chart 3Stocks Follow Earnings Who Follow Growth
Stocks Follow Earnings Who Follow Growth
Stocks Follow Earnings Who Follow Growth
Chart 4Shifting Link Between Bunds And German Growth
Shifting Link Between Bunds And German Growth
Shifting Link Between Bunds And German Growth
The positive correlation between German growth and German yields sheds light on why the correlation between yields and stocks is now positive, but it does not explain why this positive link emerged in the late 1990s and not earlier. Financial asset prices reflect global phenomena. Stock indices in advanced economies overrepresent multinationals which are affected by global economic fluctuations. Meanwhile, capital is fungible and flows freely across borders. As a result, German bond yields are not the unique factor that matters to the correlation between equities and stock. Instead, the behavior of global yields and equities is critical. Chart 5Living In The Shadow Of The Asian Crisis
Living In The Shadow Of The Asian Crisis
Living In The Shadow Of The Asian Crisis
According to this logic, the correlation between global yields and global growth becomes important. As Chart 5 illustrates, the relationship between global bond returns and global economic activity became much closer around 1998 than it was prior to this date. The key turning point was the Asian crisis of 1997/98. Why was the Asian crisis so fundamental? It was the end state of the disinflationary trend started under Federal Reserve Chairman Paul Volker. After the Asian crisis, the region’s newly industrialized economies switched from chronic current account deficits to chronic surpluses, which added to the global supply of savings. Moreover, Asian economies became hypercompetitive because of severely devalued exchange rates, which limited pricing power around the world. Finally, the Chinese economy became a force to be reckoned with and its share of global trade expanded massively. Together, these forces amplified competitive pressure around the world and made every inflation uptick self-limiting. The impact of the shock is visible in the inflation data. As Chart 6 shows, core inflation in the US and in the G7 has been stable since 1998, capped near 2.5%, except for 2021. Additionally, after the Asian crisis, the volatility of core inflation collapsed among both the G7 and Eurozone economies (Chart 7). Chart 62.5%, A 20-Year Old Ceiling
2.5%, A 20-Year Old Ceiling
2.5%, A 20-Year Old Ceiling
Chart 71998: RIP CPI Volatility
1998: RIP CPI Volatility
1998: RIP CPI Volatility
The effect of this steady inflation was to stabilize inflation expectations. Thus, after 1998, the most important driver of bond price annual changes has been fluctuations in anticipated real economic activity, which explains why the relationship between global bond returns and the global LEI became much tighter afterward (Chart 5, on page 4). This result is crucial to understand the impact of higher yields for equities. It suggests that, if rising yields reflect improving economic growth, then the correlation between yields and stocks will remain positive and equities may climb higher along with mounting long-term interest rates. Bottom Line: Higher yields do not necessarily portend the end of the equity bull market. Stock prices and bond yields have been positively correlated since the Asian crisis of 1997/98 because fluctuating growth expectations drive most of the change in yields. As long as this remains the case, equities can handle higher yields. Can The Correlation Shift Sign Again? The correlation between equities and bonds is not static. There are threats that could restore both temporarily or permanently the negative correlation between changes in bond yields and stock returns that prevailed prior to 1998. A Temporary Correlation Shift? Since their March 2020 lows, 10-year yields have increased 94bps and 51bps in the US and Germany, respectively. Meanwhile, the MSCI Eurozone equity benchmark is up 78%. We are clearly not yet in an environment in which rising long-term interest rates hurt stocks. In the short term, the correlation between yield changes and equity returns may turn negative if yield moves into constraining territory—this is to say, if they rise enough to risk a recession. In more academic terms, this equates to rates moving above the neutral rate of interest, or r-star. Chart 8A Long Way To Go Before Policy Becomes Tight
A Long Way To Go Before Policy Becomes Tight
A Long Way To Go Before Policy Becomes Tight
There is little indication that interest rates are moving above this level in the short term. US and European policy rates remain well below Taylor rule estimates of equilibrium (Chart 8), which suggests that policies are still highly accommodative. The most worrisome signal comes from the slope of the yield curve. Since March 2021, the US 2-/10-year yield curve has flattened by 76bps to 81bps and, since October 2021, the same yield curve has flattened by 23bps to 35bps in Germany. Moreover, the 20-/30-year US yield curve became inverted in October 2021. These dynamics may indicate that policy is already on the verge of becoming too tight, even if only five interest rate hikes are expected in the US over the next two years. Chart 9Term Premia Are Still Negative
Term Premia Are Still Negative
Term Premia Are Still Negative
A curve flattening episode is the normal course of events when central banks become less accommodative; it is not a sign of impending doom. Instead, an inverted yield curve is the indication that the policy rate is above r-star. After all, if interest rates genuinely constrain growth, they will slow economic activity in the future, which will necessitate lower rates and generate a negative curve slope. We are not there yet. Moreover, the term-premium remains negative across major advanced economies, which suggests that a recessionary signal will come from a deeper yield-curve inversion than in the past (Chart 9). Chart 10Upside To The Terminal Rate
Upside To The Terminal Rate
Upside To The Terminal Rate
Another factor likely to allow yields to rise without killing the equity market is that the expected terminal rate of interest remains too low, as we wrote in our 2022 Key Views piece last week. Historically, it is common for the expected terminal rate to rise as central banks begin to lift interest rates, especially if the economy handles the first hikes well. Today, the expected terminal rate is below the levels that prevailed after the GFC, despite a much firmer economy unburdened by private sector deleveraging and excessive fiscal tightening (Chart 10). As such, we anticipate the expected terminal rate to increase, which will limit how quickly the yield curve will flatten next year even if the Fed elevates interest rates and the ECB aggressively downshifts its pace of asset purchases once the PEPP ends. Chart 11Long-Term Inflation Expectations Are Not A Concern, Yet
Long-Term Inflation Expectations Are Not A Concern, Yet
Long-Term Inflation Expectations Are Not A Concern, Yet
Under this aperture, the biggest risk for stocks remains inflation. Further acceleration in inflation, especially if it pushes the 5-year/5-year forward inflation breakeven rate above the Fed’s comfort zone (Chart 11), could hurt stocks. Essentially, investors would price in a shift in the monetary policy environment whereby risks of a severe tightening would increase. However, as we recently wrote, the odds are mounting that short-term inflation will soon peak. Oil inflation is ebbing, while transportation costs are declining and supply bottlenecks are beginning to ease. Moreover, money growth in the US and the Eurozone, which proved relevant variables to explain inflation this year, is also waning (Chart 12). Finally, a mounting number of global central banks are tightening policy, which implies that maximum accommodation is behind us (Chart 13) In this context, we expect the positive correlation between stock returns and yield changes to remain broadly positive. A short-term rise in yields could easily contribute to equity market volatility and may even cause a deeper stock market correction than any experienced since April 2020. However, this will prove to be a temporary phenomenon, and thus we remain buyers of the dip. Chart 12Slowing Money Supply Growth, At Last
Slowing Money Supply Growth, At Last
Slowing Money Supply Growth, At Last
Chart 13Global Policy Is Becoming Less Easy
Global Policy Is Becoming Less Easy
Global Policy Is Becoming Less Easy
A Longer-Term Correlation Shift? A shift in the long-term correlation between equity returns and bond yield changes is a much more meaningful risk to stocks than short-term changes. BCA expects inflation to peak in the short term, but this will only be part of a stop-and-go process. Inflation is on a structural uptrend and so, any decline in 2022 and early 2023 will morph into renewed pressure, after the global output gap becomes positive again by the end of next year. Chart 14A Deflationary Tailwind Is Gone
A Deflationary Tailwind Is Gone
A Deflationary Tailwind Is Gone
Many structural forces are moving away from deflationary to inflationary. True, technological progress remains a deflationary anchor. However, this downward pressure on inflation is no longer buttressed by a deepening of globalization (Chart 14). Moreover, because of the rise of populism around the world over the past five years, fiscal policy is unlikely to move back to the austere Washington Consensus that dictated governance from President Reagan up to the moment President Trump took power. Additionally, ageing across advanced economies and China, as well as the so-called “Great Resignation,” will constrain the expansion of the global supply side. This background suggests that the period of flat inflation that prevailed from 1998 to 2020 is ending. As a corollary, inflation expectations will embark on a multi-year upward drift. This process is likely to loosen the correlation between economic activity and yields. As a result, the period of positive correlation between yield changes and equity returns is in its last innings. This will represent a major difficulty for asset allocators over the next ten to twenty years, as it points to poor long-term real returns for both bonds and stocks. Bottom Line: The correlation between stock returns and bond yield changes is likely to remain positive in 2022, which implies that European stocks will eke out another year of positive returns, despite BCA’s house view that yields will rise. However, the long-term outlook is more problematic. The growing likelihood that inflation is making a secular upturn means that the two-decades old positive correlation between equity returns and bond yield change will become negative again around the middle of the decade. This shift will have a profound and deleterious impact on both stocks’ and bonds’ secular returns. Mathieu Savary, Chief European Strategist Mathieu@bcaresearch.com Tactical Recommendations
The Correlation Convolution
The Correlation Convolution
Cyclical Recommendations
The Correlation Convolution
The Correlation Convolution
Structural Recommendations
The Correlation Convolution
The Correlation Convolution
Closed Trades Currency Performance Fixed Income Performance Equity Performance
Highlights The helicopter drops are over, … : The economic impact payments and supplemental unemployment insurance benefits may have stopped, but their full impact has yet to be felt. … but fiscal and monetary policy will continue to support demand, … : US households are sitting on more than $2 trillion of excess pandemic savings. If they were to spend just half of their stash over the next two or three years, the economy would gain a steady tailwind. … and the macro backdrop will remain equity-friendly, … : Monetary policy will be less accommodative going forward but it will remain solidly supportive of markets and the economy across all of 2022. … so investors should stick around for one last round: Equities and spread product outperform when monetary policy is easy. As long as COVID-19 doesn’t spring a nasty surprise, the expansion will continue and risk assets will once again generate positive excess returns over Treasuries and cash. Feature BCA editors’ annual sit-down with Mr. and Ms. X provides a welcome opportunity to gather our thoughts for the coming year and review how this year’s calls panned out. Looking back to this time last year,1 our risk-friendly recommendations performed well as the rationale behind them proved to be sound. Financial markets thrived in the wake of monetary and fiscal policy measures intended to err on the side of providing too much accommodation. The policy efforts were massive, and their support for markets and the economy has yet to be fully exhausted; indeed, their lengthy half-life is a key pillar of our sanguine 2022 outlook. Unlike last December, investors cannot look forward to peak accommodation in the year ahead; the peak is behind us and monetary and fiscal stimulus will be throttled back. The Fed is currently deliberating how much to accelerate its taper timetable, with an eye toward gaining the flexibility to hike rates sooner than previously planned. The hawkish turn foreshadowed by Chair Powell two weeks ago in Congressional testimony unsettled markets somewhat, but it is important to note that monetary policy settings are merely on track to become less accommodative – they are nowhere near crossing the line to restrictive and will not approach it anytime soon. Investors can be certain that markets will enjoy ample policy support across all of 2022 and we expect that equities will still be in a bull market when Mr. and Ms. X return to discuss the outlook for 2023. We are on board with the BCA consensus as detailed in the Bank Credit Analyst’s 2022 outlook.2 Early indications suggest that the Omicron variant will not be enough of a threat to provoke a negative growth surprise and we expect that the pandemic will recede in importance as the year unfolds. As it fades, supply chains should become less snarled, easing the near-term pressures that have been pushing prices higher. We expect that markets are overestimating inflation in the near term and that growth will be robust in the US and other developed economies. Despite the dialing back of some accommodation, monetary policy will remain easy, supporting economic activity and market valuations. We foresee another year of solidly positive excess returns for risk assets. The Economy Is Firing On All Cylinders You wouldn’t necessarily know it to talk with investors, much less consumer confidence survey respondents, but aggregate demand is surging and ought to remain robust going forward. Households are in fantastic shape. Although their net worth growth slowed in the third quarter, its 13% annualized seven-quarter (1Q20 through 3Q21) pace is within a whisker of all-time highs (Chart 1). They have accumulated $2.3 trillion of excess savings since the pandemic began and have plenty of capacity to borrow to augment their spending power. Just about anyone who wants a job can have one: the ratio of job openings to unemployed workers is making new highs (Chart 2) and the share of people in the labor force filing initial jobless claims is approaching the all-time lows set before the pandemic (Chart 3). Chart 1The Wealth Effect Will Support Consumption
The Wealth Effect Will Support Consumption
The Wealth Effect Will Support Consumption
Chart 2More Jobs Than People Without Them ...
More Jobs Than People Without Them ...
More Jobs Than People Without Them ...
Businesses are on a solid financial footing, as well. Debt as a share of net worth is near the lower end of its typical range since the high yield bond market got going in the late ‘80s (Chart 4). Borrowing costs are scraping all-time lows (Chart 5) and profit margins are wide (Chart 6). Banks and fixed income asset managers are falling all over themselves to lend to businesses and will continue to do so while default rates remain low. Chart 3... And Almost No Layoffs
... And Almost No Layoffs
... And Almost No Layoffs
Chart 4Corporations Have Less Debt And More Equity, ...
Corporations Have Less Debt And More Equity, ...
Corporations Have Less Debt And More Equity, ...
Chart 5... But Debt Has Never Cost Less ...
... But Debt Has Never Cost Less ...
... But Debt Has Never Cost Less ...
Chart 6... And Profit Margins Are Wide
... And Profit Margins Are Wide
... And Profit Margins Are Wide
Financial conditions will remain highly accommodative despite the Fed’s and other major developed world central banks’ moves to make them less easy at the margin. Below-equilibrium policy rates will continue to encourage financed purchases of homes, autos and other durable goods and entice investment via low hurdle rates. If sovereign bond yields rise modestly in 2022 in line with our high-conviction base case, governments won’t feel any pressure to tighten the fiscal screws. That may nourish modern monetary theory fantasies to the ultimate detriment of public finances, but it should ensure that all three engines of domestic demand – households, businesses and government – will hum in 2022. Omicron has reminded everyone that the pandemic is not over, but the shadow it casts on public health and economic activity is set to shrink. Booster shots of the Pfizer vaccine apparently provide effective protection, and Omicron’s mutations will not allow it to evade Merck’s and Pfizer’s soon-to-be-approved antiviral pills. The availability of pills to treat those who contract COVID could possibly be a game-changer in terms of neutralizing its global threat. Distributing shelf-stable pills is vastly simpler than delivering vaccines that need to be transported at temperatures below -70 degrees Fahrenheit. The Earnings Bar Has Been Set Very Low Our constructive view would not translate into risk friendly investment strategy if asset prices already discounted it or were expecting something even better. Just as the economy is on a better path than consumers seem to perceive and investors believe can persist, S&P 500 earnings per share are poised to grow over the next four quarters by more than the bottom-up analyst consensus expects. As compared to the simple annualized run rate of last quarter’s earnings ($215.76, or $53.89 times 4), the analyst consensus is calling for effectively no growth ($215.87) over the four quarters through 3Q22. That is a surprising prediction based on two sets of empirical evidence. First, earnings typically rise outside of recessions (Chart 7). Second, analysts have consistently forecast that forward four-quarter earnings would top the run rate of the last reported quarter’s earnings for four decades (Chart 8). This year, though, analysts have repeatedly called for quarter-over-quarter declines in earnings (Table 1), only to have reported numbers shred their estimates by jaw-dropping margins, just as they have in all six full quarters since COVID-19 arrived (Chart 9). We interpret the phase shift in the magnitude of earnings beats as evidence that companies have surprised themselves by how much they’ve been able to increase efficiency and/or cut costs during the pandemic. Our interactions with the investment community suggest that it has also been surprised but views the gains as one-off events that are unlikely to continue. Chart 7Earnings Declines Outside Of Recessions Are Rare
Earnings Declines Outside Of Recessions Are Rare
Earnings Declines Outside Of Recessions Are Rare
Chart 8This Has Been An Odd Time To Expect 40-Year Lows In Earnings Growth
This Has Been An Odd Time To Expect 40-Year Lows In Earnings Growth
This Has Been An Odd Time To Expect 40-Year Lows In Earnings Growth
Table 1Grim Expectations
2022 Key Views: Stay For One More Round
2022 Key Views: Stay For One More Round
Expectations of sequentially declining earnings would fit if the economy were flirting with falling below stall speed, as it regularly did during the sluggish post-GFC expansion. But they are completely at odds with the Bloomberg economist consensus that GDP will grow at a 5% real annualized rate this quarter and 3.9% in calendar 2022 (Table 2). Over time, S&P 500 revenue growth should converge with nominal GDP growth, so the current expectations for around 10% and 7% annualized nominal GDP growth in 4Q21 and 2022, respectively, are a decent starting point for estimating S&P 500 revenue growth over those periods. While we expect that S&P 500 profit margins have peaked, we do not foresee a sharp decline in 2022, and operating leverage should ensure that high single-digit revenue growth will translate into healthy earnings gains.
Chart 9
Table 2Above-Trend Growth Ahead
2022 Key Views: Stay For One More Round
2022 Key Views: Stay For One More Round
Bottom Line: The S&P 500 should have no trouble topping consensus estimates that foresee next to no growth in earnings over the next four quarters. There is ample room for corporate earnings to surprise to the upside. Our Major Disagreement With Markets Differences of opinion make markets and our biggest one pertains to the future direction of interest rates. We think the widespread conviction that the Fed will be unwilling or unable to raise the fed funds above 2%, if that, lest it crush financial markets and the real economy is way off base. The majority of investors seem to have taken the decade between the crisis and the pandemic as evidence that rates will remain very low for very long. Many of them must be buying the longer end of the Treasury curve in anticipation that an expedited liftoff date is the first step on the path to the next recession (Chart 10). Chart 10The Bond Market Sees Ice, Not Fire
The Bond Market Sees Ice, Not Fire
The Bond Market Sees Ice, Not Fire
The risk asset selloff that ensued in December 2018 after the FOMC marched the fed funds rate up to 2.5% looms large in the markets’ minds and feeds the widespread view that an ambitious program of rate hikes will pull the rug out from under financial assets and the economy. Many investors have also been conditioned by the post-crisis decade to assume that inflation cannot exceed 2% for a sustained period. The market view is rooted in honest-to-goodness evidence, but we think it is of little relevance now, given the way the massive pandemic fiscal stimulus programs have altered the backdrop. In the space of thirteen months from March 2020 through March 2021, Congress passed bills injecting over $5 trillion of aid – 25% of a year’s GDP – into the economy. The Herculean effort contrasted sharply with the skittish disbursement of less than 5% of GDP on the Bush and Obama administrations’ watch from 2008 through 2010. The aftermath of the crisis demonstrated that even multiple rounds of QE do not by themselves trigger inflation, especially if demoralized households and businesses are disinclined to borrow money to consume or invest, and chastened banks are subjected to regulatory strictures forcing them to maintain sizable new capital buffers and discouraging them from making any but plain-vanilla loans to highly rated borrowers. The Bernanke Fed’s three rounds of QE presumably tamped down interest rates, but the cash that bought the Treasury and agency securities barely tiptoed into the wider world before the primary dealer banks sent it right back to the Fed as excess reserves. With banks hiding their QE money under the mattress, the money supply didn’t expand in any notable way after the crisis. Thanks to Congress’ series of 2020-21 helicopter drops, the money supply has been growing at rates that would make the late Paul Volcker’s head spin (Chart 11). Inflation is fiendishly more complicated than Milton Friedman’s always-and-everywhere dictum suggests, but there’s now a whole lot of money chasing a limited amount of goods, services and assets. We expect that a receding pandemic will allow greater quantities of goods and services to be produced, and that securities underwriters and their clients are hard at work ramping up asset supply, but inflation has far more of a chance to gain traction now than it did in the decade before the pandemic. Chart 11Bringing "Always And Everywhere" Back Into Vogue?
Bringing "Always And Everywhere" Back Into Vogue?
Bringing "Always And Everywhere" Back Into Vogue?
We therefore think the lower-for-longer and lower-for-ever crowd will find itself offsides at some point in the next few years. We do not think it will get its comeuppance in 2022, however, as we see long yields rising only modestly, with the 10-year Treasury yield ending next year at 2-2.25%. Though we expect the fed funds rate will end the upcoming hiking cycle well north of 2%, bringing about the end of the bull markets in equities and credit, and quite possibly inducing the next recession, we do not think markets will abandon their new-normal rates view by the end of next year. This story will be continued, likely with a greater sense of urgency, in our 2023 outlook. Investment Recommendations Consistent with the foregoing, we make the following recommendations for 2022: Overweight equities in multi-asset portfolios. Although they are not cheap, and may experience a turbulent ride in 2022 as inflation concerns wax and wane, COVID-19 infections periodically surge and the Fed tries to adjust its messaging and actions on the fly, stocks should continue to generate sizable positive excess returns over Treasuries and cash. Overweight cyclical sectors and underweight defensive sectors within equity portfolios. If we’re right to be constructive on the global economy, Energy, Industrials, Materials and Financials are better positioned to benefit than Health Care, Staples and Utilities. Overweight small-cap equities versus large-cap equities. The S&P 600 SmallCap Index has greater exposure to our cyclicals-over-defensives call and our US Equity Strategy colleagues highlight that its constituents are cheaper than the S&P 500’s and are projected to have better earnings growth. Adding small-cap exposure to equity portfolios aligns with our constructive view on the economy and markets. Underweight fixed income in multi-asset portfolios. Underweight Treasuries within bond portfolios. Maintain below-benchmark duration within bond portfolios. Though we do not expect the bond market to see things entirely our way next year, we think the long end of the yield curve will shift out somewhat. We therefore have little appetite for duration and Treasuries and expect spread product will outperform Treasuries and high-yield corporate bonds will outperform investment-grade corporates. Consider hybrid alternatives to traditional fixed income securities. When we roll out our multi-asset ETF portfolio next month, it will include a hybrid bucket of income-generating assets to help multi-asset investors seeking income find low-beta destinations with a fighting chance of generating positive real total returns. Doug Peta, CFA Chief US Investment Strategist dougp@bcaresearch.com Footnotes 1 Please see the December 14, 2020 US Investment Strategy Report, "2021 Key Views: It’s The Policy, Stupid." 2 Please see the December 2021 Bank Credit Analyst, "OUTLOOK 2022: Peak Inflation – Or Just Getting Started?"
Highlights 1. How will the pandemic resolve? 2. Will services spending recover to its pre-pandemic trend? 3. Will we spend our excess savings? 4. How will central banks react to inflation? 5. Will cryptocurrencies continue to eat gold’s lunch? 6. How fragile is Chinese real estate? 7. Will there be another shock? Fractal analysis: Personal goods versus consumer services. Feature Chart of the WeekWill Services Spending Recover To Its Pre-Pandemic Trend?
Will Services Spending Recover To Its Pre-Pandemic Trend?
Will Services Spending Recover To Its Pre-Pandemic Trend?
“Judge a man by his questions, not by his answers” The quotation above is often misattributed to Voltaire instead of its true author, Pierre-Marc-Gaston de Lévis. Irrespective of the misattribution, we agree with the maxim. Asking the right questions is more important than finding answers to the wrong questions. In this vein, this report takes the form of the seven crucial questions for 2022 (and our answers). 1. How Will The Pandemic Resolve? As new variants of SARS-CoV-2 have arrived like clockwork, the number of new global cases of infection and the virus reproduction rate have formed a near-perfect mathematical ‘sine wave’. This near-perfect sine wave will propagate into 2022 (Chart I-2). Chart I-2The Pandemic's Sine-Wave Will Propagate Into 2022
The Pandemic's Sine-Wave Will Propagate Into 2022
The Pandemic's Sine-Wave Will Propagate Into 2022
But how will this sine wave of infections translate into mortality, morbidity, and stress on our healthcare systems? As we explained in RNA Viruses: Time To Tell The Truth, the answer depends on the specific combination of contagiousness, immuno-evasion, and pathogenicity of each variant. Yet none of this should come as any surprise. Flus and colds also come in waves, which is why we call them flu and cold seasons. And the morbidity of a given flu and cold season depends on the aggressiveness of that season’s flu and cold variant. So, just like the flu and the cold, Covid will become an endemic respiratory disease which comes in waves. The trouble is that our under-resourced health care systems can barely cope with a bad flu season, let alone with an additional novel disease that can be worse than the flu. Hence, until we add enough capacity to our healthcare systems, expect more disruptions to economic activity from periodic non-pharmaceutical interventions such as travel bans, vaccine passports, and face-mask mandates. 2. Will Services Spending Recover To Its Pre-Pandemic Trend? The pandemic has given us a crash course in virology and epidemiology. We now understand antigens, antibodies, and ‘reproduction rates.’ We understand that a virus transmits as an aerosol in enclosed unventilated spaces, and that singing, and yelling eject this viral aerosol. We understand that vaccinations for RNA viruses have limited longevity, do not prevent reinfections, and that certain environments create ‘super-spreader’ events. Armed with this new-found awareness, a significant minority of people have changed their behaviour. Services which require close contact with strangers – going to the dentist or in-person doctors’ appointments, going to the cinema or to amusement parks, or using public transport – are suffering severe shortfalls in demand. Given that this change in behaviour is likely long-lasting, demand for these services is unlikely to regain its pre-pandemic trend in 2022 (Charts I-3 - I-6). Chart I-3Dental Services Are Far Below The Pre-Pandemic Trend
Dental Services Are Far Below The Pre-Pandemic Trend
Dental Services Are Far Below The Pre-Pandemic Trend
Chart I-4Physician Services Are Far Below The Pre-Pandemic Trend
Physician Services Are Far Below The Pre-Pandemic Trend
Physician Services Are Far Below The Pre-Pandemic Trend
Chart I-5Recreation Services Are Far Below The Pre-Pandemic Trend
Recreation Services Are Far Below The Pre-Pandemic Trend
Recreation Services Are Far Below The Pre-Pandemic Trend
Chart I-6Public Transportation Is Far Below The Pre-Pandemic Trend
Public Transportation Is Far Below The Pre-Pandemic Trend
Public Transportation Is Far Below The Pre-Pandemic Trend
Therefore, to keep overall demand on trend, spending on goods will have to stay above its pre-pandemic trend. This will be a tough ask. Durables, by their very definition, last a long time. Even clothes and shoes, though classified as nondurables, are in fact quite durable. Meaning that are only so many cars, iPhone 13s, gadgets, clothes and shoes that any person can own before reaching saturation. If, as we expect, spending on goods falls back to its pre-pandemic trend, but spending on services does not recover to its pre-pandemic trend, then there will be a demand shortfall in 2022 (Chart of the Week). 3. Will We Spend Our Excess Savings? If spending falls short of income – as it did through the pandemic – then, by definition, our savings have gone up. Many people claimed that this war chest of savings would unleash a tsunami of spending. Well, it didn’t. And, it won’t. Previous episodes of excess savings in 2004, 2008, and 2012 had no impact on the trend in spending (Chart I-7).
Image
The explanation comes from a theory known as Mental Accounting Bias. The theory states that we segment our money into different accounts, which are sometimes physical, sometimes only mental, and that our willingness to spend money depends on which mental account it occupies. This contrasts with standard economic theory which assumes that money is perfectly fungible, meaning that a dollar in a current (checking) account is no different to a dollar in a savings or investment account. In practice, money is not fungible, because we attach different emotions to our different mental accounts. A dollar in our current account we will gladly spend, but a dollar in our savings account we will not spend. Hence, the moment we move the dollar from our current account into our savings account, our willingness to spend it collapses. This explains why consumption trends have no connection with windfall income receipts once those income receipts end up in our savings mental or physical account. Pulling all of this together, the war chest of savings accumulated during the pandemic is unlikely to change the overall trend in spending. 4. How Will Central Banks React To Inflation? The real story of the current ‘inflation crisis’ is that while goods and commodity prices have surged exactly as expected in a positive demand shock, services prices have not declined as would be expected in the mirror-image negative demand shock. The result is that aggregate inflation has surged even though aggregate demand has not (Chart I-8 and Chart I-9). Chart I-8Goods Prices Have Reacted To A Positive Demand Shock...
Goods Prices Have Reacted To A Positive Demand Shock...
Goods Prices Have Reacted To A Positive Demand Shock...
Chart I-9...But Service Prices Have Not Reacted To A Negative Demand Shock
...But Service Prices Have Not Reacted To A Negative Demand Shock
...But Service Prices Have Not Reacted To A Negative Demand Shock
Why have services prices remained resilient despite a massive negative demand shock? One answer, as explained in question 2, is that much of the shortfall in services demand is due to behavioural changes, which cannot be alleviated by lower prices. If somebody doesn’t go to the dentist or use public transport because he is worried about catching Covid, then lowering the price will not lure that person back. In fact, the person might interpret the lower price as a signal of greater risk, and might become more averse. In technical terms, the price elasticity of demand for certain services has flipped from its usual negative to positive. This creates a major problem for central banks, because if the price elasticity of services demand has changed, then surging aggregate inflation is no longer a reliable indicator of surging aggregate demand. To repeat, inflation is surging even though aggregate demand is barely on its pre-pandemic trend. Hence in 2022, central banks face a Hobson’s choice. Choke demand that does not need to be choked, or turn a blind eye to inflation and risk losing credibility. 5. Will Cryptocurrencies Continue To Eat Gold’s Lunch? Most of the value of gold comes not from its economic utility as a beautiful, wearable, and electrically conductive metal, but from its investment value as a hedge against the debasement of fiat money. The multi-year investment case for cryptocurrencies is that they are set to displace much of gold’s investment value. Still, to displace gold’s investment value, cryptocurrencies need to match its other qualities: an economic utility, and limited supply. A cryptocurrency’s economic utility comes from its means of exchange for the intermediation services that its blockchain provides. For example, if you issue a bond or smart-contract using the Ethereum blockchain, then you must pay in its cryptocurrency ETH. Which gives ETH an economic utility. Furthermore, the number of blockchains that will succeed as go-to places for intermediation services will be limited, and each cryptocurrency has a limited supply. Thereby, the supply of cryptocurrencies that have a utility is also limited. With an economic utility, a limited supply, and drawdowns that are becoming smaller, cryptocurrencies can continue to displace gold’s dominance of the $12 trillion anti-fiat investment market. Therefore, the cryptocurrency asset-class can continue its strong structural uptrend, albeit punctuated by short sharp corrections (Chart I-10). Chart I-10Cryptocurrencies Will Continue To Displace Gold's Investment Value
Cryptocurrencies Will Continue To Displace Gold's Investment Value
Cryptocurrencies Will Continue To Displace Gold's Investment Value
The corollary is that the structural outlook for gold is poor. 6. How Fragile Is Chinese Real Estate? A decade-long surge in Chinese property prices has lifted Chinese valuations to nosebleed levels. According to global real estate specialist Savills, prime real estate yields in China’s major cities are now barely above 1 percent, and the world’s five most expensive cities are all in China: Hangzhou, Shenzhen, Guangzhou, Beijing, and Shanghai (Chart I-11).
Chart I-11
Without a social safety net and with limited places to park their money, Chinese savers have for years been encouraged to buy homes, in the widespread belief that property is the safest investment, whose price only goes up. With the bulk of people’s wealth in property acting as a perceived economic safety net, even a modest decline in house prices would constitute a major shock to the household sector’s hopes and expectations of what property is. Therefore, in contrast to the US housing debacle in 2008, the Chinese government will ensure that its property market adjustment does not come from a collapse in home prices. Rather, it will come from a collapse in property development and construction activity. This will have negative implications for commodities, emerging Asia, developing countries that produce raw materials, and machinery stocks worldwide. 7. Will There Be Another Shock? Most strategists claim that shocks, such as the pandemic, are unpredictable. We disagree. Yes, the timing and source of an individual shock is unpredictable, but the statistical distribution of shocks is highly predictable. We define a shock as any event that causes the long-duration bond price in a major economy to rally or slump by at least 20 percent.1 Using this definition through the last 60 years, the statistical distribution of the number of shocks in any ten-year period is Poisson (3.33) and the time between shocks is Exponential (3.33). This means that in any ten-year period, the likelihood of suffering a shock is a near-certain 95 percent; in any five-year period, it is an extremely high 80 percent; in a two-year period it is a coin toss at 50 percent; and even in one year it is a significant 30 percent (Chart I-12).
Chart I-12
Therefore, on a multi-year horizon, another shock is a near-certainty even if we do not know its source or precise timing. The question is, will it be net deflationary, or net inflationary? Our high-conviction view is that it will be net deflationary. Meaning that even if it starts as inflationary, it will quickly morph into deflationary. The simple reason is that it is not just Chinese real estate that is fragile. Through the past ten years, world prime residential prices are up by 70 percent while rents are up by just 25 percent2 (Chart I-13). Meaning that the bulk of the increase in global real estate prices is due to skyrocketing valuations. The culprit is the structural collapse in global bond yields – which, in turn, is due to persistently ultra-low policy interest rates combined with trillions of dollars of quantitative easing. Chart I-13Property Price Inflation Has Far Exceeded Rent Inflation
Property Price Inflation Has Far Exceeded Rent Inflation
Property Price Inflation Has Far Exceeded Rent Inflation
This means that bond yields have very limited scope to rise before pulling the bottom out of the $300 trillion global real estate market. Given that this dwarfs the $90 trillion global economy, it would constitute a massive deflationary backlash to the initial inflationary shock. Some people counter that in an inflationary shock, property – as the ultimate real asset – ought to perform well even as bond yields rise. However, when valuations start off in nosebleed territory as now, the initial intense headwind from deflating valuations would obliterate the tailwind from inflating incomes. Investment Conclusions To summarise, 2022 will be a year in which: Covid waves continue to disrupt the economy; a persistent shortfall in spending on services is not fully countered by excess spending on goods; China’s construction boom comes to an end; inflation takes time to cool, pressuring central banks to raise rates despite fragile demand; and the probability of another shock is an underestimated 30 percent. We reach the following investment conclusions: Overweight the China 30-year bond and the US 30-year T-bond. There will be no sustained rise in long-duration bond yields, and the risk to yields is to the downside. Long-duration equity sectors and stock markets that are least sensitive to cyclical demand will continue to rally (Chart I-14). Chart I-14The US Stock Market = The 30-Year T-Bond Multiplied By Profits
The US Stock Market = The 30-Year T-Bond Multiplied By Profits
The US Stock Market = The 30-Year T-Bond Multiplied By Profits
Overweight the US versus non-US. Underweight Emerging Markets. Underweight old-economy cyclical sectors such as banks, materials, and industrials. Commodities will struggle. Underweight commodities that haven’t corrected versus those that have (Chart I-15). Chart I-15Underweight Commodities That Haven't Yet Corrected
Underweight Commodities That Haven't Yet Corrected
Underweight Commodities That Haven't Yet Corrected
Overweight the US dollar versus commodity currencies. Cryptocurrencies will continue their structural uptrend at the expense of gold. Goods Versus Services Is Technically Stretched Finally, this week’s fractal analysis corroborates the massive displacement from services spending into goods spending, highlighted by the spectacular outperformance of personal goods versus consumer services. This outperformance is now at the point of fragility on its 260-day fractal structure that has signalled previous reversals (Chart I-16). Therefore, a good trade would be to short personal goods versus consumer services, setting a profit target and symmetrical stop-loss at 12.5 percent. Chart I-16Underweight Personal Goods Versus Consumer Services
Underweight Personal Goods Versus Consumer Services
Underweight Personal Goods Versus Consumer Services
Dhaval Joshi Chief Strategist dhaval@bcaresearch.com Footnotes 1 As bond yields approach their lower limit, this definition of a shock will need to change as it will become impossible for long-duration bond prices to rally by 20 percent. 2 Based on Savills Prime Index: World Cities – Capital Values, and World Cities – Rents and Yields, June 2011 through June 2021. Fractal Trading System Fractal Trades 6-Month Recommendations Structural Recommendations Closed Fractal Trades Indicators To Watch - Bond Yields Chart II-1Indicators To Watch - Bond Yields - Euro Area
Indicators To Watch - Bond Yields - Euro Area
Indicators To Watch - Bond Yields - Euro Area
Chart II-2Indicators To Watch - Bond Yields - Europe Ex Euro Area
Indicators To Watch - Bond Yields - Europe Ex Euro Area
Indicators To Watch - Bond Yields - Europe Ex Euro Area
Chart II-3Indicators To Watch - Bond Yields - Asia
Indicators To Watch - Bond Yields - Asia
Indicators To Watch - Bond Yields - Asia
Chart II-4Indicators To Watch - Bond Yields - Other Developed
Indicators To Watch - Bond Yields - Other Developed
Indicators To Watch - Bond Yields - Other Developed
Indicators To Watch - Interest Rate Expectations Chart II-5Indicators To Watch - Interest Rate Expectations
Indicators To Watch - Interest Rate Expectations
Indicators To Watch - Interest Rate Expectations
Chart II-6Indicators To Watch - Interest Rate Expectations
Indicators To Watch - Interest Rate Expectations
Indicators To Watch - Interest Rate Expectations
Chart II-7Indicators To Watch - Interest Rate Expectations
Indicators To Watch - Interest Rate Expectations
Indicators To Watch - Interest Rate Expectations
Chart II-8Indicators To Watch - Interest Rate Expectations
Indicators To Watch - Interest Rate Expectations
Indicators To Watch - Interest Rate Expectations
Highlights Omicron vs. The Fed: The new COVID variant has thrown a growth scare into markets, but the bigger concern is the Fed belated playing catch up to high inflation and low unemployment. Fade the Omicron bond rally, and position for higher US Treasury yields over the next year with the Fed threatening to taper faster, and potentially hike sooner, than markets expect. New Zealand: Underlying growth and inflation fundamentals, soaring house prices, and the central bank’s historical reaction function indicate that the Reserve Bank of New Zealand will lift the cash rate to 2% by the end of 2022. However, markets are already priced for this, leaving little room for New Zealand debt to continue underperforming on a relative basis. We are upgrading New Zealand sovereigns to neutral and initiating a long NZ/short US 10-year spread trade. A Year-End Bout Of Uncertainty Chart of the WeekMarkets Have Been Worried About The Fed Since September
Markets Have Been Worried About The Fed Since September
Markets Have Been Worried About The Fed Since September
Over the past two weeks, we have published Special Reports and thus have not had an opportunity to comment on market moves and news. Needless to say, it has been an eventful period! The emergence of the new Omicron variant, and the hawkish shift in the Fed’s guidance on future policy moves, have injected fresh uncertainty and volatility into global financial markets. Since the existence of Omicron was revealed to the world on Nov 26, 30-year US Treasury yields have fallen by as much as -23bps and the S&P 500 index has been down by as much as -4.4%. Yet the evolving Fed stance, with Fed Chair Jerome Powell hinting last week that the end of tapering and start of rate hikes could begin sooner than expected next year, is having a more lasting influence on risk asset performance. Dating back to the September 23 FOMC meeting, when the Fed first signaled an imminent tapering of bond purchases and pulled forward the timing of liftoff into 2022, the 2-year US Treasury yield has gone up from 0.22% to 0.63%. Importantly, there has been little pullback on the pricing at the front-end of the US Treasury curve due to the Omicron shock. That pre-September-FOMC low in the 2-year Treasury yield also marked the peak in riskier fixed income market performance for 2021, with the Bloomberg Global High-Yield and Emerging Market USD-Denominated Sovereign total return indices down -2.0% and -1.8%, respectively, since Sept 23 (Chart of the Week). Other risk assets also appear to be responding more to news about the Fed than Omicron. Equity markets stopped climbing since the Fed announced the first taper of bond purchases at the November 3 FOMC meeting – three weeks before the world knew of Omicron - which also coincided with troughs in the VIX index and corporate credit spreads, not only in the US but in Europe and emerging markets as well (Chart 2). Of course, it is difficult to disentangle which is having a greater impact, the variant or the Fed, when details on both are evolving at the same time. Omicron Investors are understandably right to be nervous about a new COVID variant that can reportedly evade existing vaccines and even infect those who have had COVID previously. The whole idea of “putting COVID in the rearview mirror’ that has helped fuel booming equity and credit markets was predicated on vaccines being both effective and widely available. However, when investors see COVID case numbers start to pick up in the US and Europe, with vaccination rates twice that of South Africa where Omicron was first detected (Chart 3), this raises concern about a return to pre-vaccine economic restrictions and uncertainty. Chart 2A Typical Risk-Off Response To The Emergence Of Omicron
A Typical Risk-Off Response To The Emergence Of Omicron
A Typical Risk-Off Response To The Emergence Of Omicron
Chart 3Omicron Putting A Dent In Vaccine Optimism
Omicron Putting A Dent In Vaccine Optimism
Omicron Putting A Dent In Vaccine Optimism
The “Omicron effect” on fixed income markets has been most evident in the repricing of interest rate expectations. Since the presence of Omicron was revealed on November 26, there has been a reduction in the cumulative amount of tightening discounted to the end of 2024 in the overnight index swap (OIS) curves of the major developed economies (Table 1). The moves were most evident in the US (32bps of hikes priced out), Canada (37bps) and Australia (37bps). Table 1Pricing Out Some Rate Hikes Because Of Omicron
Blame The Fed, Not Omicron, For More Volatile Markets
Blame The Fed, Not Omicron, For More Volatile Markets
Much is still unknown about the dangers of the Omicron variant. The admittedly very early data out of South Africa, however, indicates that there has not been a major surge in hospitalizations related to Omicron cases. A new COVID strain that proves to be more virulent, but that does not strain health care systems, should help allay investor concerns over a major economic hit from Omicron. This presents an opportunity to put on positions that will profit from a rebound in global bond yields led by higher US Treasury yields. The Fed The Omicron threat to date has not been enough to move the Fed off its plans to rein in the monetary accommodation put in place in 2020 to fight the pandemic. If Omicron is to have any impact on the US economy, it will do so at a time when the economy continues to grow well above trend. The November reading on the ISM Manufacturing survey showed strength in the overall index, with a stabilization of the New Orders/Inventory ratio that leads overall growth, and only a very modest reduction in the still-elevated Prices Paid and Supplier Deliveries indices (Chart 4). The Atlanta Fed’s GDPNow model is suggesting that US real GDP growth could come in at a whopping 9.7% in Q4. As further evidence that the US economy is growing at a pace well above trend, just look to labor market data. New US jobless claims are at the lowest level since 1969. The November US Payrolls report showed that the headline unemployment rate fell 0.4 percentage points on the month to 4.2% - within the range of full employment estimates of the FOMC - even with actual job growth falling short of consensus forecasts (Chart 5, top panel). Chart 4Nothing Bond-Bullish In US Manufacturing
Nothing Bond-Bullish In US Manufacturing
Nothing Bond-Bullish In US Manufacturing
The improving health of the labor market is being felt more broadly, with big declines seen in unemployment rates for minorities and less-educated Americans (second panel). That point is of critical importance to the Powell Fed that has emphasized reducing racial and educational gaps in US unemployment as part of reaching its goal of “maximum employment”. Chart 5Nothing Bond-Bullish In US Labor Markets
Nothing Bond-Bullish In US Labor Markets
Nothing Bond-Bullish In US Labor Markets
Tightening labor markets are also evident in accelerating wage momentum. Excluding the 2020 spike driven by labor force compositional effects related to COVID lockdowns, the year-over-year growth in average hourly earnings reached a 39-year high of 5.9% in November (third panel). The Fed now seems willing to finally confront high US inflation and strong economic growth with some tightening of monetary policy. Chart 6A Near-Term Break From Supply-Fueled Inflation?
A Near-Term Break From Supply-Fueled Inflation?
A Near-Term Break From Supply-Fueled Inflation?
Powell caused some investor agita last week when he indicated that the taper could end before mid-2022, the previous FOMC guidance, which would open the door for rate hikes. We see Powell’s comments as less about signaling an intensifying hawkishness and more about giving the Fed optionality on when to start lifting rates next year in the event the US economy continues to overheat. The Fed strongly believes that tapering must end before rate hikes can begin, so a more accelerated taper allows for an earlier liftoff date, if necessary. To that end, the supply fueled surge in inflation this year, which has lingered for far longer than the Fed anticipated, may be showing some signs of easing. Several indices of global shipping container prices are off the highs, while there is a reduced backlog of container ships off key US ports like Los Angeles. Overall commodity price momentum has peaked, in line with slower, but still strong, global industrial activity (Chart 6). An easing of supply-driven price pressures would be welcome by the FOMC. It would allow time to evaluate both the Omicron threat and evolving US labor market dynamics, instead of being forced to fight a rearguard action against accelerating inflation. However, a shift away from goods/commodity inflation to more domestically driven inflation would not lessen the need for the Fed to begin lifting rates next year – in fact, it could even strengthen the case for the Fed to hike rates faster, and by more, than currently discounted in markets. Importantly, forward looking indicators are still pointing to solid US growth next year (Chart 7): The Conference Board’s leading economic indicator continues to grow at a pace signaling above-trend growth US financial conditions remain highly accommodative even with the recent market turbulence The New York Fed’s yield curve based recession probability model is indicating that the spread between the 10-year US Treasury yield and the 3-month US Treasury bill rate, currently 138bps, is consistent with only a 9% chance of a US recession over the next year (bottom panel) We continue to recommend a below-benchmark duration stance within US fixed income portfolios, with a yield target on the 10-year benchmark US Treasury yield of 2-2.25% to be reached by the end of 2022. We also continue to recommend positioning in Treasury curve steepening trades. This is admittedly a counter-intuitive suggestion given that the Fed is moving towards a rate hiking cycle, but we see too much flattening priced into the Treasury forward curve over the next year (Chart 8). Chart 7A Positive Message From US Leading Growth Indicators
A Positive Message From US Leading Growth Indicators
A Positive Message From US Leading Growth Indicators
Chart 8Our Favorite Bearish US Rates Trades
Our Favorite Bearish US Rates Trades
Our Favorite Bearish US Rates Trades
For global bond investors, our favorite trade that will benefit from higher US bond yields next year is to position for a wider 10-year US Treasury-German Bund spread (bottom panel). We expect the ECB to avoid any rate increases until at least mid-2023, well after the Fed has begun to tighten. Forward curves in the US and Germany currently discount a relatively stable Treasury-Bund spread in 2022, thus there is no negative carry incurred by positioning for a wider spread. Bottom Line: Omicron has thrown a growth scare into markets, but the bigger concern is that the Fed is belated starting to play catch up to high inflation and low unemployment. Fade the Omicron bond rally, and position for higher US Treasury yields over the next year. New Zealand: How Much Further Can The Bond Selloff Go? Chart 9NZ Sovereign Underperformance Has Been Driven By RBNZ Hawkishness
NZ Sovereign Underperformance Has Been Driven By RBNZ Hawkishness
NZ Sovereign Underperformance Has Been Driven By RBNZ Hawkishness
Over the past year, New Zealand bonds have sold off much faster than developed market peers (Chart 9). Markets correctly recognized the Reserve Bank Of New Zealand (RBNZ) as a central bank that would move more aggressively to tamp down on inflation and manage the financial stability and political risks arising from soaring house prices. The RBNZ has already delivered back-to-back hikes at its October and November meetings, after its plans to hike at the August meeting were thrown off by the Delta variant. Markets are now pricing in a further 172bps of tightening over the coming year, having largely faded any downside growth risk from the Omicron variant. Expectations of continued tightening have been buoyed by the response of New Zealand policymakers, who are largely looking past the Omicron variant. Restrictions have already begun to ease, with the country having entered its “Traffic Light” COVID-19 Protection Framework. The new variant is also unlikely to affect the RBNZ’s tightening path, with Chief Economist Yuong Ha stating that, given the lifting of restrictions, the RBNZ would have raised rates even if Omicron had become known before its November 24 meeting. Given the bond-bearish backdrop, New Zealand government bonds have underperformed substantially this year. On a relative hedged and duration-matched basis, New Zealand sovereigns have underperformed by -6.6% year-to-date with -4.0 percentage points of that underperformance coming after July 21 when we formally moved to an underweight stance on New Zealand debt within global government bond portfolios (Chart 9, bottom panel). However, with monetary policy entering a new phase, led by an increasingly hawkish Fed, we believe it is appropriate to re-assess our New Zealand call and judge whether this underperformance can continue into 2022. The growth picture is broadly supportive of the RBNZ’s stated policy path. Real GDP as of Q2 was above its pre-Covid trend and 2.6% over the RBNZ’s own estimate of potential GDP, supported by an easing of travel restrictions and strong consumer spending (Chart 10). On a forward-looking basis, however, the risk is now that the economy is running too hot, jeopardizing future growth. Consumer and business sentiment has been worsening as inflation expectations soar, with consumers fearing a hit to purchasing power and businesses concerned about the impact of rising input costs on profit margins. Household and business inflation fears also have a strong basis in the realized inflation data, which has soared to a 10-year high of 4.9% (Chart 11). More troublingly, underlying inflation measures such as the trimmed mean and core (excluding food and energy) are now at series highs of 4.8% and 4%, respectively, indicating that higher inflation could prove to be sticky. The RBNZ now sees headline inflation peaking at 5.7% in Q1/2022 before settling to 2% by the end of its forecast horizon in 2024. Chart 10The NZ Economy Is Overheating
The NZ Economy Is Overheating
The NZ Economy Is Overheating
Chart 11The RBNZ Will Welcome A Slight Growth Slowdown
The RBNZ Will Welcome A Slight Growth Slowdown
The RBNZ Will Welcome A Slight Growth Slowdown
The RBNZ clearly attributes higher inflation to an economy running above longer-term capacity rather than short-term supply factors. The Bank’s measure of the output gap is now at the most positive level since 2007, and survey measures of capacity utilization remain elevated. In contrast to the Fed, which is still nominally focused on maximum employment, the RBNZ actually believes that employment is above its maximum sustainable level, and sees a rising unemployment rate as necessary to ease capacity constraints. Given that the RBNZ is clearly comfortable with, and will likely welcome, a gradual rise in unemployment, it will take much more than a slight growth shock to deter the RBNZ from its tightening path. Chart 12Higher Rates Necessary To Stabilize The NZ Housing Market
Higher Rates Necessary To Stabilize The NZ Housing Market
Higher Rates Necessary To Stabilize The NZ Housing Market
The newest, and most politically potent, part of the RBNZ’s remit—house prices – has further supported a bias to tighten monetary policy. However, while still dramatically elevated, house price growth looks to have peaked (Chart 12). The central bank’s hawkish shift earlier in the year has made a clear impact, with house price growth peaking shortly after mortgage rates started picking up in April of this year. Overall household mortgage credit has also begun to decelerate, indicating that the passthrough from monetary policy to credit demand and housing via the mortgage rate is working as intended. However, there is likely further to go. The last time house price growth was somewhat stable around 6.6% in the 2012-2019 period, benchmark 5-year mortgage rates averaged 6.1%. Assuming the spread between the 5-year mortgage and policy rates remains around 4%, history indicates that we would need to see the policy rate rise to at least 2% to cool down the housing market. That 2% level is also the RBNZ’s mean estimate of a “neutral” cash rate—a level at which policy would be neither accommodative nor restrictive (Chart 13). Current market pricing is quite consistent with the RBNZ’s own projected path of rates as of the November meeting—both of which are set to exceed the neutral rate by the end of 2022. Historical experience from the pre-crisis period indicates that this is not uncommon, and that a bout of restrictive policy might be needed to cool down an overheating economy.
Chart 13
Indeed, if the RBNZ’s historical reaction to inflation is any guide, it seems likely that policymakers will want to push rates above inflation. The top two panels of Chart 14 show how anomalous deeply negative real policy rates are in New Zealand. Even if we make the case that developed market real rates are in a structural downtrend, as realized real rates have peaked out at successively lower levels with each tightening cycle, the current gap between the cash rate and core inflation seems obviously unsustainable and requires a tightening of policy. Chart 14NZ Real Rates Are Too Low
NZ Real Rates Are Too Low
NZ Real Rates Are Too Low
Chart 15Go Long The 10-Year NZ Government Bond/US Treasury Spread
Go Long The 10-Year NZ Government Bond/US Treasury Spread
Go Long The 10-Year NZ Government Bond/US Treasury Spread
Another way to think about where policy rates are in relation to a “neutral” level is to look at the yield curve (Chart 14, bottom panel). Typically, the yield curve inverts when markets judge that monetary policy is too restrictive and that short rates are too high relative to a long-run average. However, the New Zealand government bond curve has historically remained inverted for extended periods of time, troughing at around -100bps. This again indicates that the RBNZ is comfortable raising rates above neutral and keeping policy restrictive when needed. Putting together the four factors we have looked at—growth, inflation, asset prices, and the RBNZ’s reaction function—it looks likely that the RBNZ will continue along the tightening path it has set out and chances of any dovish surprise seem slim. At the same time, markets are priced to perfection in terms of the pace and amount of tightening discounted. For New Zealand sovereigns to continue underperforming, however, we will need to see markets price in, on the margin, even more tightening from the RBNZ relative to its peers. With the Fed and other central banks having become more focused on responding to US inflation dynamics, bond-bearish upside shocks to market rate expectations will increasingly come from outside New Zealand. At the same time, in the event of a negative global growth shock, perhaps relating to COVID-19, there is relatively more room for hikes to be priced out in New Zealand. Given our view that bond and rates markets have appropriately priced in the extent of the RBNZ’s likely tightening cycle, we are upgrading New Zealand sovereign debt to neutral, taking profits on our current underweight stance. While we do not include New Zealand debt in our model bond portfolio, we are expressing our view via a new tactical cross-country spread trade: long New Zealand 10-Year government bonds vs. US 10-Year Treasuries (Chart 15). Forwards are currently pricing in a flat spread between the two countries, meaning that any future spread tightening will put our trade in the black. Given that there is more space for markets to price in increased hawkishness from the Fed, we believe that spread compression is likely. We are implementing this trade by going long New Zealand cash bonds and shorting 10-year US Treasury futures. Details can be found on Page 18. Bottom Line: Underlying growth and inflation fundamentals, soaring house prices, and the central bank’s historical reaction function indicate that the Reserve Bank of New Zealand will lift the cash rate to 2% by the end of 2022. However, markets are already priced for this, leaving little room for New Zealand debt to continue underperforming on a relative basis. We are upgrading New Zealand sovereigns to neutral and initiating a long NZ/short US 10-year spread trade. Robert Robis, CFA Chief Fixed Income Strategist rrobis@bcaresearch.com Shakti Sharma Senior Analyst ShaktiS@bcaresearch.com GFIS Model Bond Portfolio Recommended Positioning Active Duration Contribution: GFIS Recommended Portfolio Vs. Custom Performance Benchmark
Image
The GFIS Recommended Portfolio Vs. The Custom Benchmark Index Global Fixed Income - Strategic Recommendations* Duration Regional Allocation Spread Product Tactical Overlay Trades
Highlights Chart 1Curve Flattening Is Overdone
Curve Flattening Is Overdone
Curve Flattening Is Overdone
Fed Chair Jay Powell made big news last month. During Senate testimony, Powell not only signaled that the Fed is likely to accelerate the pace of asset purchase tapering when it meets in December, he also suggested that the Fed won’t necessarily wait until “maximum employment” is achieved before lifting rates. Powell’s comments suggest that the first Fed rate hike could come as early as June 2022 and as late as December 2022, and the exact timing will depend on how inflation and inflation expectations move during the next few months. The front-end of the Treasury curve is fairly priced for either scenario. The 2-year Treasury yield is currently 0.60%. If we assume that the Fed eventually lifts rates at a pace of 100 bps per year until reaching a 2.08% terminal rate, we calculate a fair value range for the 2-year yield of 0.39% to 0.74%, depending on whether Fed liftoff occurs in June or December. In contrast, the same assumptions give us a fair value range of 1.69% to 1.79% for the 10-year Treasury yield, well above its current level of 1.40% (Chart 1). The investment implications are clear. Investors should maintain below-benchmark portfolio duration and put on Treasury curve steepeners, overweight the 2-year note and underweight the 10-year. Feature Table 1Recommended Portfolio Specification
Powell’s Pivot
Powell’s Pivot
Table 2Fixed Income Sector Performance
Powell’s Pivot
Powell’s Pivot
Investment Grade: Neutral Chart 2Investment Grade Market Overview
Investment Grade Market Overview
Investment Grade Market Overview
Investment grade corporate bonds underperformed the duration-equivalent Treasury index by 89 basis points in November, dragging year-to-date excess returns down to +102 bps. The index option-adjusted spread widened 12 bps on the month and our quality-adjusted 12-month breakeven spread is now at its 7th percentile since 1995. This indicates that valuations remain stretched even after the recent widening (Chart 2). The back-up in spreads was driven by the combination of the Fed’s shift toward a more hawkish policy stance and concerns about the new omicron COVID variant. This led to a large flattening of the yield curve in addition to wider corporate bond spreads. The slope of the yield curve is a critical indicator for our corporate bond call. We are very comfortable owning corporate bonds when the 3-year/10-year Treasury slope is above 50 bps, but our work suggests that returns to credit risk take a significant step down once the slope flattens into a range of 0 – 50 bps.1 The 3-year/10-year Treasury slope currently sits at 49 bps, just below our 50 bps threshold. However, our range of fair value estimates suggests that the 3/10 slope should be between 63 bps and 86 bps today, and that it should only break below 50 bps between March and September of next year (bottom panel). All in all, we expect the pace of Treasury curve flattening to abate during the next couple of months and this will allow spreads to tighten back to their recent lows. We will turn more cyclically defensive on corporate bonds next year when the break below 50 bps in the 3/10 slope is confirmed by our fair value readings. Table 3ACorporate Sector Relative Valuation And Recommended Allocation*
Powell’s Pivot
Powell’s Pivot
Chart
High-Yield: Overweight Chart 3High-Yield Market Overview
High-Yield Market Overview
High-Yield Market Overview
High-Yield underperformed the duration-equivalent Treasury index by 121 basis points in November, dragging year-to-date excess returns down to +444 bps. The index option-adjusted spread widened 50 bps on the month, leading to a significant rise in the spread-implied default rate. The spread-implied default rate is the 12-month default rate that is priced into the junk index, assuming a 40% recovery rate on defaulted debt and an excess spread of 100 bps. At present, the spread-implied default rate sits at 3.8% (Chart 3). For context, defaults have come in at an annualized rate of 1.6% so far this year and we showed in a recent report that corporate balance sheets are in excellent shape.2 Specifically, the ratio of total debt to net worth for the nonfinancial corporate sector has fallen to 41%, the lowest ratio since 2010 (bottom panel). We conclude that the default rate will be comfortably below 3.8% during the next 12 months, allowing high-yield bonds to outperform duration-matched Treasuries. We recommend that investors favor high-yield over investment grade corporate bonds, and we expect that last month’s spread widening will reverse in relatively short order. However, as noted on page 3, we will turn more defensive on credit risk (including high-yield bonds) next year once we are confident that the 3/10 Treasury curve has sustainably moved into a flatter regime (0 – 50 bps). MBS: Underweight Chart 4MBS Market Overview
MBS Market Overview
MBS Market Overview
Mortgage-Backed Securities underperformed the duration-equivalent Treasury index by 46 basis points in November, dragging year-to-date excess returns down to -90 bps. The zero-volatility spread for conventional 30-year agency MBS widened 13 bps on the month, driven by an 11 bps widening of the option-adjusted spread and a 2 bps increase in the compensation for prepayment risk (option cost) (Chart 4). We wrote in last week’s report that MBS’ recent poor performance is attributable to an option cost that is too low relative to the pace of mortgage refinancings, noting that the MBA Refinance Index has been slow to fall this year despite the back-up in yields.3 The robust pace of home price appreciation has been an important factor boosting refis, as homeowners have been increasingly incentivized to tap the equity in their homes. With no indication that cash-out refi activity is about to slow, we expect refi activity will remain sticky going forward. This will put upward pressure on MBS spreads. We recommend adopting an up-in-coupon bias within an overall underweight allocation to MBS. Higher coupon MBS exhibit more attractive option-adjusted spreads and higher convexity than lower coupon MBS. This makes high-coupon MBS (4%, 4.5%) more likely to outperform low-coupon MBS (2%, 2.5%, 3%) in an environment where bond yields are flat or rising (bottom panel). Government-Related: Neutral Chart 5Government-Related Market Overview
Government-Related Market Overview
Government-Related Market Overview
The Government-Related index underperformed the duration-neutral Treasury index by 35 basis points in November, dragging year-to-date excess returns down to +33 bps. Sovereign debt underperformed duration-equivalent Treasuries by 157 basis points in November, dragging year-to-date excess returns down to -220 bps. Foreign Agencies underperformed the Treasury benchmark by 9 bps on the month, dragging year-to-date excess returns down to +36 bps. Local Authority bonds underperformed by 16 bps in November, dragging year-to-date excess returns down to +406 bps. Supranationals outperformed by 2 bps, bringing year-to-date excess returns up to +18 bps. The investment grade Emerging Market Sovereign bond index outperformed the equivalent-duration US corporate bond index by 42 bps in November. The Emerging Market Corporate & Quasi-Sovereign index underperformed duration-matched US corporates by 16 bps (Chart 5). Both EM indexes continue to offer significant yield advantages versus US corporate bonds with the same credit rating and duration. We continue to recommend overweighting USD-denominated EM sovereigns and corporates versus investment grade US corporates with the same credit rating and duration.4 Within EM sovereigns, attractive countries include: Russia, Mexico, Indonesia, Saudi Arabia, UAE and Qatar. Municipal Bonds: Maximum Overweight Chart 6Municipal Market Overview
Municipal Market Overview
Municipal Market Overview
Municipal bonds outperformed the duration-equivalent Treasury index by 29 basis points in November, bringing year-to-date excess returns up to +371 bps (before adjusting for the tax advantage). The economic and policy back-drop remains favorable for municipal bond performance. Trailing 4-quarter net state & local government savings are incredibly high (Chart 6) and 2021’s federal spending splurge will support state & local government coffers for some time. A recent report showed that the average duration of municipal bond indexes has fallen significantly during the past few decades, a trend that has implications for how we should perceive municipal bond valuation.5 Specifically, the trend makes municipal bonds more attractive relative to both Treasury securities and investment grade corporates. Long-maturity bonds are especially compelling. We calculate that 12-17 year maturity Revenue Munis offer a breakeven tax rate of 14% relative to credit rating and duration matched US corporate bonds. 12-17 year General Obligation Munis offer a breakeven tax rate of 22% versus corporates (panel 2). High-yield muni spreads are reasonably attractive compared to high-yield corporates (panel 4), but we recommend only a neutral allocation to high-yield munis versus high-yield corporates. The deep negative convexity of high-yield munis makes them susceptible to extension risk if bond yields rise. Treasury Curve: Buy 2-Year Bullet Versus Cash/10 Barbell Chart 7Treasury Yield Curve Overview
Treasury Yield Curve Overview
Treasury Yield Curve Overview
The Treasury curve flattened dramatically in November. Increasingly hawkish rhetoric from the Fed pushed front-end yields higher as news about the omicron COVID strain pressured long-dated yields lower. The 2-year/10-year Treasury slope flattened 16 bps on the month, it currently sits at 75 bps. The 5-year/30-year Treasury slope flattened 11 bps on the month, it currently sits at 56 bps. As noted on the front page, long-dated Treasury yields have fallen to well below levels consistent with a reasonable Fed rate hike cycle. This drop in long-maturity yields has pushed the 2/5/10 butterfly spread to extremely high levels, both in absolute terms and relative to our model’s fair value (Chart 7). This signals that 2/10 yield curve steepeners are incredibly cheap. Indeed, we observe that the 2/10 slope has already flattened to below the levels that were witnessed on the last two Fed liftoff dates in 2015 and 2004 (panel 4). A trade long the 5-year bullet and short a duration-matched 2/10 barbell does indeed look attractive in this environment. However, we note that the 2/5 Treasury slope has also flattened to below levels seen on the prior two Fed liftoff dates (bottom panel). In other words, the 2/5 slope also has room to steepen during the next 6-12 months, and we prefer to focus our long positions on the 2-year Treasury note rather than the 5-year. This leads us to recommend a position long the 2-year note and short a duration-matched barbell consisting of cash and the 10-year note. We also advise investors to own a position long the 20-year bond versus a duration-matched barbell consisting of the 10-year note and 30-year bond. This latter position offers a very attractive duration-neutral yield advantage of 24 bps. TIPS: Neutral Chart 8TIPS Market Overview
TIPS Market Overview
TIPS Market Overview
TIPS performed in line with the duration-equivalent nominal Treasury index in November, leaving year-to-date excess returns unchanged at +739 bps. The 10-year TIPS breakeven inflation rate fell 8 bps on the month while the 2-year TIPS breakeven inflation rate rose 17 bps. The 10-year and 2-year rates currently sit at 2.44% and 3.24%, respectively. The Fed’s preferred 5-year/5-year forward TIPS breakeven inflation rate rose 8 bps on the month. It currently sits at 2.16%, below the Fed’s 2.3% - 2.5% target range. Our valuation indicator shows that 10-year TIPS are slightly expensive compared to 10-year nominal Treasuries (Chart 8), and we retain a neutral allocation to TIPS versus nominals at the long-end of the curve. We acknowledge the risk that a prolonged period of high inflation could lead to a break-out in long-dated TIPS breakevens, but this now looks less likely given the Fed’s increasing hawkishness. We see better trading opportunities at the front-end of the TIPS curve, where the 2-year TIPS breakeven inflation rate remains well above the Fed’s target range (panel 4). Short-maturity breakevens are more sensitive to swings in CPI than those at the long-end. Therefore, the 2-year TIPS breakeven inflation rate has considerable downside during the next 6-12 months, assuming inflation moderates as we expect it will. We recommend an underweight allocation to TIPS versus nominals at the front-end of the curve. Given our view that CPI inflation will be lower in 6-12 months, we recommend shorting 2-year TIPS outright, positioning in 2/10 TIPS breakeven inflation curve steepeners (bottom panel) and 2/10 TIPS (real) yield curve flatteners. All three trades will profit from falling short-maturity inflation expectations. ABS: Overweight Chart 9ABS Market Overview
ABS Market Overview
ABS Market Overview
Asset-Backed Securities underperformed the duration-equivalent Treasury index by 9 basis points in November, dragging year-to-date excess returns down to +26 bps. Aaa-rated ABS underperformed by 11 bps on the month, dragging year-to-date excess returns down to +13 bps. Non-Aaa ABS performed in line with Treasuries in November, keeping year-to-date excess returns steady at +93 bps. During the past two years, substantial federal government support for household incomes has caused US households to build up an extremely large buffer of excess savings. During this period, many households have used their windfalls to pay down consumer debt and credit card debt levels have fallen to well below pre-COVID levels (Chart 9). The result is that the collateral quality backing consumer ABS is exceptionally high. Investors should remain overweight consumer ABS and should take advantage of the high quality of household balance sheets by moving down the quality spectrum, favoring non-Aaa rated securities over Aaa-rated ones. Non-Agency CMBS: Neutral Chart 10CMBS Market Overview
CMBS Market Overview
CMBS Market Overview
Non-Agency Commercial Mortgage-Backed Securities underperformed the duration-equivalent Treasury index by 40 basis points in November, dragging year-to-date excess returns down to +155 bps. Aaa Non-Agency CMBS underperformed Treasuries by 30 bps in November, dragging year-to-date excess returns down to +63 bps. Non-Aaa Non-Agency CMBS underperformed Treasuries by 70 bps, dragging year-to-date excess returns down to +469 bps (Chart 10). Though returns have been strong this year and spreads remain attractive, particularly for lower-rated CMBS, we continue to recommend only a neutral allocation to the sector because of the structurally challenging environment for commercial real estate. Agency CMBS: Overweight Agency CMBS underperformed the duration-equivalent Treasury index by 47 basis points in November, dragging year-to-date excess returns down to +58 bps. The average index option-adjusted spread widened 9 bps on the month. It currently sits at 40 bps (bottom panel). Though Agency CMBS spreads have recovered to well below their pre-COVID levels, they still look attractive compared to other similarly risky spread products. Stay overweight. Ryan Swift US Bond Strategist rswift@bcaresearch.com Appendix A: Butterfly Strategy Valuations The following tables present the current read-outs from our butterfly spread models. We use these models to identify opportunities to take duration-neutral positions across the Treasury curve. The following two Special Reports explain the models in more detail: US Bond Strategy Special Report, “Bullets, Barbells And Butterflies”, dated July 25, 2017, available at usbs.bcaresearch.com US Bond Strategy Special Report, “More Bullets, Barbells And Butterflies”, dated May 15, 2018, available at usbs.bcaresearch.com Table 4 shows the raw residuals from each model. A positive value indicates that the bullet is cheap relative to the duration-matched barbell. A negative value indicates that the barbell is cheap relative to the bullet. Table 5 scales the raw residuals in Table 4 by their historical means and standard deviations. This facilitates comparison between the different butterfly spreads. Table 6 flips the models on their heads. It shows the change in the slope between the two barbell maturities that must be realized during the next six months to make returns between the bullet and barbell equal. For example, a reading of -62 bps in the 5 over 2/10 cell means that we would expect the 5-year to outperform the 2/10 if the 2/10 slope flattens by less than 62 bps during the next six months. Otherwise, we would expect the 2/10 barbell to outperform the 5-year bullet. Table 4Butterfly Strategy Valuation: Raw Residuals In Basis Points (As Of November 30th, 2021)
Powell’s Pivot
Powell’s Pivot
Table 5Butterfly Strategy Valuation: Standardized Residuals (As Of November 30th, 2021)
Powell’s Pivot
Powell’s Pivot
Table 6Discounted Slope Change During Next 6 Months (BPs)
Powell’s Pivot
Powell’s Pivot
Appendix B: Excess Return Bond Map The Excess Return Bond Map is used to assess the relative risk/reward trade-off between different sectors of the US bond market. It is a purely computational exercise and does not impose any macroeconomic view. The Map’s vertical axis shows 12-month expected excess returns. These are proxied by each sector’s option-adjusted spread. Sectors plotting further toward the top of the Map have higher expected returns and vice-versa. Our novel risk measure called the “Risk Of Losing 100 bps” is shown on the Map’s horizontal axis. To calculate it, we first compute the spread widening required on a 12-month horizon for each sector to lose 100 bps or more relative to a duration-matched position in Treasury securities. Then, we divide that amount of spread widening by each sector’s historical spread volatility. The end result is the number of standard deviations of 12-month spread widening required for each sector to lose 100 bps or more versus a position in Treasuries. Lower risk sectors plot further to the right of the Map, and higher risk sectors plot further to the left.
Chart 11
Footnotes 1 Please see US Bond Strategy Weekly Report, “Expected Returns In Corporate Bonds”, dated September 21, 2021. 2 Please see US Bond Strategy Weekly Report, “The Fed’s Inflation Problem”, dated November 23, 2021. 3 Please see US Bond Strategy Weekly Report, “The Omicron Impact”, dated November 30, 2021. 4 Please see US Bond Strategy Weekly Report, “Damage Assessment”, dated September 28, 2021. 5 Please see US Bond Strategy Weekly Report, “The Best & Worst Spots On The Yield Curve”, dated October 26, 2021.
Highlights Economy: Chair Powell retired the term “transitory” last week, signaling that the Fed may take a harder line on inflation in the coming year: The Fed coined the transitory term to describe the current inflation backdrop, and publicly throwing in the towel on the idea allows the FOMC to open the door to a more hawkish approach in 2022. Markets: Financial markets continued their post-Thanksgiving gyrations, but the Omicron variant was a more meaningful driver than Fedspeak: Powell’s hints simply brought the Fed’s liftoff date closer to the markets' estimate. Omicron was the main force behind the fall in interest rates, as evidenced by the swoon in oil and pandemic-exposed equities. Strategy: Don’t fight the crowd in the near term, but position for a higher-than-expected terminal rate down the road: We expect rates will remain well behaved in 2022, but we do not share the seeming market conviction that rates will be permanently lower. Feature A US investor who called it a week the day before Thanksgiving may think twice about leaving his/her desk for even a day going forward. Stocks and other risk assets were hammered in the abbreviated Black Friday session on concerns about Omicron, COVID’s latest variant. The S&P 500 recovered much of its losses last Monday, only to be jolted again on Tuesday, as Fed Chair Powell testified before a Senate committee. Stocks duly surged on Wednesday, leaving the S&P off just over 1% from its pre-Thanksgiving close, until news that the Omicron variant had been discovered in California sparked a sharp intra-day reversal. They then came back very strong on Thursday – lather, rinse, repeat. The action was a reminder that volatility often picks up as a perceived inflection point nears. The VIX, which measures implied volatility on S&P 500 index options, spent the week ensconced above the 20 level that has mostly contained it since the financial crisis faded and effective COVID vaccines became widely available (Chart 1). Despite the recent gyrations, our base-case cyclical outlook, as described in last week’s report, remains in place. We expect US growth will come in well above trend for this quarter and all of 2022, monetary policy settings will likely remain easy for another two years, and the accumulated monetary and fiscal stimulus that’s already been injected into the economy will keep the expansion going at least through 2023. Chart 1An Eventful Stretch
An Eventful Stretch
An Eventful Stretch
What The Chair Said Fed Chair Powell testified before the Senate and the House Tuesday and Wednesday last week, respectively. His comments on the pace of tapering, the economy’s progress in meeting the Fed’s inflation criteria for hiking rates, the way inflation might thwart employment gains and the word "transitory" captured the attention of investors and the financial media. On tapering: “At this point, the economy is very strong, and inflationary pressures are high. It is therefore appropriate in my view to consider wrapping up the taper of our asset purchases, which we … announced at our November meeting, perhaps a few months sooner.” On the inflation criteria for hiking rates: “The test that we’ve articulated clearly has been met [.] … Inflation has run well above 2% for long enough now [given recent data releases].” On inflation as a threat to full employment: “What I am taking on board is it is going to take longer to get labor force participation back. … That means to get back to the kind of great labor market we had before the pandemic, we’re going to need a long expansion. To get that we’re going to need price stability, and in a sense, the risk of persistent high inflation is also a major risk to getting back to such a labor market.” On “transitory” inflation: Though some people interpreted it as short-lived, we used “transitory” to “mean that it won’t leave a permanent mark in the form of higher inflation. I think it’s probably a good time to retire that word and try to explain more clearly what we mean.” How Powell’s Comments Might Shift Monetary Policy Table 1The Liftoff Checklist
Wiggle Room
Wiggle Room
The taper timetable will be sped up. It seems clear that the FOMC will vote to accelerate the taper at its meeting ending December 15th. Given how carefully the Fed has telegraphed its asset purchase actions, Powell would not have raised the issue unless it were a done deal. Instead of ending in June upon the purchase of an additional $420 billion of Treasury and agency securities, as per the November FOMC meeting's guidance, this round of QE will end sometime sooner after buying somewhat less. While we do not think that the parameters of the taper matter all that much in themselves, Powell has stated that the FOMC will not begin hiking rates until it has stopped purchasing securities and accelerating the tapering pace will afford it the flexibility to bring the liftoff date forward if it so chooses. Chart 2Hikes May Not Wait For Full Employment
Hikes May Not Wait For Full Employment
Hikes May Not Wait For Full Employment
The economic prerequisites for hiking rates are closer to being met. Our US Bond Strategy service has maintained a checklist of the three criteria the FOMC laid out as preconditions for hiking rates (Table 1). With consumer prices rising by more than the 2% target for several months, our bond colleagues checked the inflation boxes a while ago and noted that the full employment1 criterion would become the swing factor for rate hikes. Per the FOMC’s Summary of Economic Projections, it has been reasonable to assume that full employment would entail an unemployment rate at or below 4% (Chart 2, top panel), with the prime-age participation rate near its pre-pandemic level (Chart 2, middle panel), even if overall participation continues to lag (Chart 2, bottom panel). Powell’s Senate testimony indicated that the criterion has been relaxed, as his comments calling out too-high inflation as a threat to the labor market countered the Fed’s previously firm resolve to let the economy run hot until the economy achieved maximum employment. The bottom line is that Powell’s testimony has given the Fed some flexibility to raise rates sooner than the second half of next year if it sees fit. As Cleveland Fed president Loretta Mester, a 2022 FOMC voter, said after Powell wrapped up his appearances on Capitol Hill, “Making the taper faster is definitely buying insurance and optionality so that if inflation doesn’t move back down significantly next year we’re in a position to be able to hike if we have to. Right now, with the inflation data the way it is and with the job market as strong as it is, I do think we have to be in a position that if we need to raise rates a couple times next year, we’re able to do that.” The Fixed Income Market Reaction Chart 3What A Difference A Week Makes
What A Difference A Week Makes
What A Difference A Week Makes
Ahead of Powell’s testimony, the overnight index swap curve took out almost an entire hike for the next twelve months, falling from 66 basis points ("bps") (two hikes and a 64% chance of a third) on Thanksgiving to 43 bps on Monday (one hike and a 72% chance of a second). The same went for the next twenty-four months, which fell from 140 bps to 117 bps, or five hikes and a 60% chance of a sixth to four hikes and a 68% chance of a fifth by Thanksgiving 2023. Rate hike odds regained some ground on Powell’s remarks, though the ultimate rebound was half-hearted – at press time, the probability of a third hike in the next twelve months stood at just 8% (Chart 3, top panel); only two hikes were priced in for the following twelve months, with an 80% chance of a third hike (Chart 3, middle panel); and the chances of getting the fed funds rate above 1.5% by November 2024 were judged to be slim (Chart 3, bottom panel). How can it be that a hawkish shift in Fed rhetoric would coincide with a decline in fed funds rate expectations? The bulk of the decline resulted from the emergence of the Omicron variant and the toll it might take on economic activity. If Omicron fears prove to be overstated, fed funds rate expectations likely will as well, but as we showed last week, market terminal rate expectations were in line with the FOMC’s guidance – they just foresaw a sooner liftoff date. Powell’s comments and the increased tapering pace suggest that the Fed’s expectations are moving closer to market expectations. The other aspect is the fact that markets were on board with the transitory inflation narrative. Sharply downward sloping inflation expectations curves indicated that fixed income markets agreed that high near-term inflation would not leave a lasting mark on longer-run inflation. Since Thanksgiving, the curves derived from TIPS (Chart 4) and CPI swap prices (Chart 5) have put a new spin on Operation Twist, with the front end shifting in while the back end has stood pat. Omicron aside, if retiring the transitory term means the Fed will be more vigilant about upward inflation pressures, it increases the probability they will turn out to be transitory, as the Fed will give them less of a chance to take root.
Chart 4
Chart 5
Investment Implications In our view, adaptive expectations will keep long-end interest rates on a fairly tight leash over the next year. It seems that investors are unable to shake what they perceive to be the central lesson of the post-crisis era: rates will be permanently lower. That view rests on a conviction that inflation is kaput and the widely shared sense that the Fed can’t hike rates beyond 2% because it would be: a) too disruptive for a fundamentally fragile economy, b) too disruptive for financial markets weaned on ZIRP, and/or c) too disruptive for a prodigally indebted federal government. We don’t think those views will hold up over the next few years – encouraging inflation would seem to be the easiest way to wriggle out from c) – but we do not advise challenging them head-on in the near term. We also push back – rhetorically for now – on the view that long maturity Treasury yields are low, and the yield curve has flattened, because the Fed is on track to make a policy mistake by unnecessarily tightening into a recession. Monetary policy affects the economy with long and variable lags – our rule of thumb is somewhere from six to twelve months – and if the neutral fed funds rate is north of 2% (an admittedly out-of-fashion view), it appears as if it will take at least two years to get there. Under our rule-of-thumb lag, then, the economy will be subject to a tailwind from monetary accommodation at least until the middle or end of 2024. Given the additional consumption support from households' remaining $2.2 trillion of pandemic excess savings, we are confident that a recession is not on the horizon. We are therefore staying the course, overweighting equities and high yield while underweighting Treasuries, and remaining vigilant for threats to our base-case macro backdrop of strong growth and easy monetary policy. Doug Peta, CFA Chief US Investment Strategist dougp@bcaresearch.com Footnotes 1 “Full employment” is a somewhat ambiguous concept that turns on estimates of the natural slack that results from structural frictions in the labor market, like geographic and skills mismatches.
Dear Client, We are sending you our Strategy Outlook today where we outline our thoughts on the global economy and the direction of financial markets for 2022 and beyond. Next week, please join me for a webcast on Friday, December 10th at 10:00 AM EST (3:00 PM GMT, 4:00 PM CET, 11:00 PM HKT) to discuss the outlook. Also, we published a report this week transcribing our annual conversation with Mr. X, a long-standing BCA client. Please join my fellow BCA strategists and me on Tuesday, December 7th for a follow-up discussion hosted by my colleague, Jonathan LaBerge. Finally, you will receive a Special Report prepared by our Global Asset Allocation service on Monday, December 13th. Similarly to previous years, Garry Evans and his team have prepared a list of books and articles to read over the holiday period. This year they recommend reading materials on key themes of the moment, such as climate change, cryptocurrencies, supply-chain disruption, and gene technology. Included in this report are my team’s recommendations on what to read to understand the underlying causes of inflation. Best regards, Peter Berezin, Chief Global Strategist Highlights Macroeconomic Outlook: Despite the risks posed by the Omicron variant, global growth should remain above trend in 2022. Inflation will temporarily dip next year as goods prices come off the boil. However, the structural trend for inflation is to the upside, especially in the US. Equities: Remain overweight stocks in 2022, favoring cyclicals, small caps, value stocks, and non-US equities. Look to turn more defensive in mid-2023 in advance of a stagflationary recession in 2024 or 2025. Fixed income: Maintain below-average interest rate duration exposure. The US 10-year Treasury yield will rise to 2%-to-2.25% by the end of 2022. Underweight the US, UK, Canada, and New Zealand in a global bond portfolio. Credit: Corporate debt will outperform high-quality government bonds next year. Favor HY over IG. Spreads will widen again in 2023. Currencies: As a momentum currency, the US dollar could strengthen some more over the next month or two. Over a 12-month horizon, however, the trade-weighted dollar will weaken. The Canadian dollar will be the best performing G10 currency next year. Commodities: Oil prices will rise, with Brent crude averaging $80/bbl in 2022. Metals prices will remain resilient thanks to tight supply and Chinese stimulus. We prefer gold over cryptos. I. Macroeconomic Outlook Running out of Greek Letters Just as the world was looking forward to “life as normal”, a new variant of the virus has surfaced. While little is known about the Omicron variant, preliminary indications suggest that it is more transmissible than Delta. The emergence of the Omicron variant is coming in the midst of yet another Covid wave. The number of new cases has skyrocketed across parts of northern and central Europe, prompting governments to re-introduce stricter social distancing measures (Chart 1). New cases have also been trending higher in many parts of the US and Canada since the start of November.
Chart 1
Despite the risks posed by Omicron, there are reasons for hope. BioNTech has said that its vaccine, jointly developed with Pfizer, will provide at least partial immunity against the new strain. At present, 55% of the world’s population has had at least one vaccine shot; 44% is fully vaccinated (Chart 2). China is close to launching its own mRNA vaccine next year, which it intends to administer as a booster shot.
Chart 2
In a worst-case scenario, BioNTech has said that it could produce a new version of its vaccine within six weeks, with initial shipments beginning in about three months. New antiviral medications are also set to hit the market. Pfizer claims its newly developed pill cuts the risk of hospitalization by nearly 90% if taken within three days from the onset of symptoms. The drug-maker has announced its intention to produce enough of the medication to treat 50 million people in 2022. In addition, it is allowing generic versions to be manufactured in developing countries. The company has indicated that its antiviral pills will be effective in treating the new strain. Global Growth: Slowing but from a High Level Assuming the vaccines and antiviral drugs are able to keep the new strain at bay, global growth should remain solidly above trend in 2022. Table 1 shows consensus GDP growth projections for the major economies. G7 growth is expected to tick up from 3.6% in 2021Q3 to 4.5% in 2021Q4. Growth is set to cool to 4.1% in 2022Q1, 3.6% in 2022Q2, 2.9% in 2022Q3, 2.3% in 2022Q4, and 2.1% in 2023Q1. Table 1Growth Is Slowing, But From Very High Levels
Strategy Outlook - 2022 Key Views: The Beginning Of The End
Strategy Outlook - 2022 Key Views: The Beginning Of The End
Chart 3
According to the OECD, potential real GDP growth in the G7 is about 1.4% (Chart 3). Thus, while growth in developed economies will slow next year, it is unlikely to return to trend until the second half of 2023. Emerging markets face a more daunting outlook. The Chinese property market is weakening, and the recent collapse of the Turkish lira highlights the structural problems that some EMs face. Nevertheless, the combination of elevated commodity prices, forthcoming Chinese stimulus, and the resumption of the US dollar bear market starting next year should support EM growth. Relative to consensus, we think the risks to growth in both developed and emerging markets are tilted to the upside in 2022. Growth will likely start surprising to the downside in late 2023, however. The United States: No Shortage of Demand US growth slowed to only 2.1% in the third quarter, reflecting the impact of the Delta variant wave and supply-chain bottlenecks. The semiconductor shortage hit the auto sector especially hard. The decline in vehicle spending alone shaved 2.2 percentage points off Q3 GDP growth. Chart 4Durable Goods Spending Is Still Above Pre-Pandemic Trend, While Services Spending Is Catching Up
Durable Goods Spending Is Still Above Pre-Pandemic Trend, While Services Spending Is Catching Up
Durable Goods Spending Is Still Above Pre-Pandemic Trend, While Services Spending Is Catching Up
The fourth quarter is shaping up to be much stronger. The Bloomberg consensus estimate is for real GDP to expand by 4.9%. The Atlanta Fed’s GDPNow model is even more optimistic. It sees growth hitting 9.7%. The demand for goods will moderate in 2022. As of October, real goods spending was still 10% above its pre-pandemic trendline (Chart 4). In contrast, the demand for services will continue to rebound. While restaurant sales have recovered all their lost ground, spending on movie theaters, amusement parks, and live entertainment in October was still down 46% on a seasonally-adjusted basis compared to January 2020. Hotel spending was down 23%. Spending on public transport was down 25%. Spending on dental services was down 16% (Chart 5).
Chart 5
US households have accumulated $2.3 trillion in excess savings over the course of the pandemic. Some of this money will be spent over the course of 2022 (Chart 6). Increased borrowing should also help. After initially plunging during the pandemic, credit card balances are rising again (Chart 7). Banks are eager to make consumer loans (Chart 8). Chart 6Plenty Of Pent-Up Demand
Plenty Of Pent-Up Demand
Plenty Of Pent-Up Demand
Chart 7Credit Card Spending Is Recovering Following The Pandemic Slump
Credit Card Spending Is Recovering Following The Pandemic Slump
Credit Card Spending Is Recovering Following The Pandemic Slump
Household net worth has risen by over 100% of GDP since the start of the pandemic (Chart 9). In an earlier report, we estimated that the wealth effect alone could boost annual consumer spending by up to 4% of GDP. Chart 8Banks Are Easing Credit Standards For Consumer Loans
Banks Are Easing Credit Standards For Consumer Loans
Banks Are Easing Credit Standards For Consumer Loans
Chart 9A Record Rise In Household Net Worth
A Record Rise In Household Net Worth
A Record Rise In Household Net Worth
Business investment will rebound in 2022, as firms seek to build out capacity, rebuild inventories, and automate more production in the face of growing labor shortages. After moving sideways for the better part of two decades, core capital goods orders have broken out to the upside. Surveys of capex intentions have improved sharply (Chart 10). Nonresidential investment was 6% below trend in Q3 – an even bigger gap than for consumer services spending – so there is plenty of scope for capex to increase. Residential investment should also remain strong in 2022 (Chart 11). The homeowner vacancy rate has dropped to a record low, as have inventories of new and existing homes for sale. Homebuilder sentiment rose to a 6-month high in November. Building permits are 7% above pre-pandemic levels. Chart 10Business Investment Should Be Strong In 2022
Business Investment Should Be Strong In 2022
Business Investment Should Be Strong In 2022
Chart 11Residential Construction Will Be Well Supported
Residential Construction Will Be Well Supported
Residential Construction Will Be Well Supported
US Monetary and Fiscal Policy: Baby Steps Towards Tightening Policy is unlikely to curb US aggregate demand by very much next year. While the Federal Reserve will expedite the tapering of asset purchases and begin raising rates next summer, the Fed is unlikely to raise rates significantly until inflation gets out of hand. As we discuss in the Feature section later in this report, the next leg in inflation will be to the downside, even if the long-term trend for inflation is to the upside. The respite from inflation next year will give the Fed some breathing space. A major tightening campaign is unlikely until mid-2023. Reflecting the Fed’s dovish posture, long-term real bond yields hit record low levels in November (Chart 12). Despite giving up some of its gains in recent days, Goldman’s US Financial Conditions Index stands near its easiest level in history (Chart 13). Chart 12US Real Bond Yields Hitting Record Lows
US Real Bond Yields Hitting Record Lows
US Real Bond Yields Hitting Record Lows
Chart 13Easy Financial Conditions In The US
Easy Financial Conditions In The US
Easy Financial Conditions In The US
US fiscal policy will get tighter next year, but not by very much. In November, President Biden signed a $1.2 trillion infrastructure bill into law, containing $550 billion in new spending. BCA’s geopolitical strategists expect Congress to pass a $1.5-to-$2 trillion social spending bill using the reconciliation process. The emergence of the Omicron strain will facilitate passage of the bill because it will allow the Democrats to add some “indispensable” pandemic relief to the package. All in all, the IMF foresees the US cyclically-adjusted primary budget deficit averaging 4.9% of GDP between 2022 and 2026, compared to 2.0% of GDP between 2014 and 2019 (Chart 14).
Chart 14
It should also be noted that government spending on goods and services has been quite weak over the past two years (Chart 15). The budget deficit surged because transfer payments exploded. Unlike direct government spending, which is set to accelerate over the next few years, households saved a large share of transfer payments. Thus, the fiscal multiplier will increase next year, even as the budget deficit shrinks. Chart 15While Overall Consumption Has Recovered, Business Spending and Direct Government Expenditures Remain Below Trend
While Overall Consumption Has Recovered, Business Spending and Direct Government Expenditures Remain Below Trend
While Overall Consumption Has Recovered, Business Spending and Direct Government Expenditures Remain Below Trend
Chart 16European Banks Have Cleaned Up Their Act
European Banks Have Cleaned Up Their Act
European Banks Have Cleaned Up Their Act
Europe: Room to Grow The European economy faces near-term growth pressures. In addition to Covid-related lockdowns, high energy costs will take a bite out of growth. After having dipped in October, natural gas prices have jumped again due to delays in the opening of the Nord Stream 2 pipeline, strong Chinese gas demand, and rising risks of a colder winter due to La Niña. The majority of Germans are in favor of opening the pipeline, suggesting that it will ultimately be approved. This should help reduce gas prices. Meanwhile, the winter will pass and Chinese demand for gas should abate as domestic coal production increases. The combination of increased energy supplies, easing supply-chain bottlenecks, and hopefully some relief on the pandemic front, should all pave the way for better-than-expected growth across the euro area next year. After a decade of housecleaning, European banks are in much better shape (Chart 16). Capex intentions have risen (Chart 17). Consumer confidence is even stronger in the euro area than in the US (Chart 18).
Chart 17
Chart 18Consumer Confidence Is At Pre-Pandemic Levels In The Euro Area, Unlike In The US
Consumer Confidence Is At Pre-Pandemic Levels In The Euro Area, Unlike In The US
Consumer Confidence Is At Pre-Pandemic Levels In The Euro Area, Unlike In The US
Euro area fiscal policy should remain supportive. Infrastructure spending is set to increase as the Next Generation EU fund begins operations. Germany’s “Traffic Light” coalition will pursue a more expansionary fiscal stance. The IMF expects the euro area to run a cyclically-adjusted primary deficit of 1.2% of GDP between 2022 and 2026, compared to a surplus of 1.2% of GDP between 2014 and 2019. For its part, the ECB will maintain a highly accommodative monetary policy. While net asset purchases under the PEPP will end next March, the ECB is unlikely to raise rates until 2023 at the earliest. In contrast to the US, trimmed-mean inflation has barely risen in the euro area (Chart 19). Moreover, unlike their US counterparts, European firms are reporting few difficulties in finding qualified workers (Chart 20). In fact, euro area wage growth slowed to an all-time low of 1.35% in Q3 (Chart 21). Chart 19Trimmed-Mean Inflation: Higher In The US Than In The Euro Area And Japan
Trimmed-Mean Inflation: Higher In The US Than In The Euro Area And Japan
Trimmed-Mean Inflation: Higher In The US Than In The Euro Area And Japan
Chart 20
Chart 21Wage Growth Remains Contained Across The Euro Area
Wage Growth Remains Contained Across The Euro Area
Wage Growth Remains Contained Across The Euro Area
The UK finds itself somewhere between the US and the euro area. Trimmed-mean inflation is running above euro area levels, but below that of the US. UK labor market data remains very strong, as evidenced by robust employment gains, firm wage growth, and a record number of job vacancies. The PMIs stand at elevated levels, with the new orders component of November’s manufacturing PMI rising to the highest level since June. While worries about the impact of the Omicron variant will likely cause the Bank of England to postpone December’s rate hike, we expect the BoE to begin raising rates in February. Japan: Short-Term Stimulus Boost A major Covid wave during the summer curbed Japanese growth. Consumer spending rebounded after the government removed the state of emergency on October 1 but could falter again if the Omicron variant spreads. The government has already told airlines to halt reservations for all incoming international flights for at least one month. On the positive side, the economy will benefit from new fiscal measures. Following the election on October 31, the new government led by Prime Minister Fumio Kishida announced a stimulus package worth 5.6% of GDP. As with most Japanese stimulus packages, the true magnitude of fiscal support will be much lower than the headline figure. Nevertheless, the combination of increased cash payments to households, support for small businesses, and subsidies for domestic travel should spur consumption in 2022. The capex recovery in Japan has lagged other major economies. This is partly due to the outsized role of the auto sector in Japan’s industrial base. Motor vehicle shipments fell 37% year-over-year in October, dragging down export growth with it. As automotive chip supplies increase, Japan’s manufacturing sector should gain some momentum. Despite the prospect of stronger growth next year, the Bank of Japan will stand pat. Core inflation remains close to zero, while long-term inflation expectations remain far below the BOJ’s 2% target. We do not expect the BOJ to raise rates until 2024 at the earliest. China: Crosswinds The Chinese economy faces crosswinds going into 2022. On the one hand, the energy crisis should abate, helping to boost growth. China has reopened 170 coal mines and will probably begin re-importing Australian coal. Chinese coal prices have fallen drastically over the past 6 weeks (Chart 22). Coal accounts for about two-thirds of Chinese electricity generation. Chart 22Coal Prices Are Renormalizing In China
Coal Prices Are Renormalizing In China
Coal Prices Are Renormalizing In China
Chart 23China's Property Market Has Weakened
China's Property Market Has Weakened
China's Property Market Has Weakened
The US may also trim tariffs on Chinese goods, as Treasury Secretary Yellen hinted this week. This will help Chinese manufacturers. On the other hand, the property market remains under stress. Housing starts, sales, and land purchases were down 34%, 21%, and 24%, respectively, in October relative to the same period last year. The proportion of households planning to buy a home has plummeted. Loan growth to real estate developers has decelerated to the lowest level on record (Chart 23). Nearly half of their offshore bonds are trading at less than 70 cents on the dollar. The authorities have taken steps to stabilize the property market. They have relaxed restrictions on mortgage lending and land sales, cut mortgage rates in some cities, and have allowed some developers to issue asset backed securities to repay outstanding debt. Most Chinese property is bought “off-plan”. The government does not want angry buyers to be deprived of their property. Thus, the existing stock of planned projects will be built. Chart 24 shows that this is a large number; in past years, developers have started more than twice as many projects as they have completed. The longer-term problem is that China builds too many homes. Like Japan in the early 1990s, China’s working-age population has peaked (Chart 25). According to the UN, it will decline by over 400 million by the end of the century. China simply does not need to construct as many new homes as it once did. Chart 24Chinese Construction: Halfway Done
Chinese Construction: Halfway Done
Chinese Construction: Halfway Done
Chart 25Demographic Parallels Between China And Japan
Demographic Parallels Between China And Japan
Demographic Parallels Between China And Japan
Chart 26
Japan was unable to fill the gap that a shrinking property sector left in aggregate demand in the early 1990s. As a result, the economy fell into a deflationary trap. China is likely to have more success. Unlike Japan, which waited too long to pursue large-scale fiscal stimulus, China will be more aggressive. The authorities will raise infrastructure spending next year with a focus on clean energy. They will also boost social spending. A frayed social safety net has forced Chinese households to save more than they would otherwise for precautionary reasons. This has weighed on consumption. The fact that China is a middle-income country helps. In 1990, Japan’s output-per-worker was nearly 70% of US levels; China’s output-per-worker is still 20% of US levels (Chart 26). If Chinese incomes continue to grow at a reasonably brisk pace, this will make it easier to improve home affordability. It will also allow China to stabilize its debt-to-GDP ratio without a painful deleveraging campaign. II. Feature: The Long-Term Inflation Outlook Two Steps Up, One Step Down We expect inflation in the US, and to a lesser degree abroad, to follow a “two steps up, one step down” trajectory of higher highs and higher lows. The US is currently near the top of those two steps. Inflation should dip over the next 6-to-9 months as the demand for goods moderates and supply-chain disruptions abate. Chart 27 shows that container shipping costs have started to come down. The number of ships anchored off the ports of Los Angeles and Long Beach is falling. US semiconductor firms are working overtime (Chart 28). Chip production in Japan and Korea is rising swiftly. DRAM chip prices have already started to decline. Chart 27Signs Of Easing Supply Issues On The Rough Seas
Signs Of Easing Supply Issues On The Rough Seas
Signs Of Easing Supply Issues On The Rough Seas
Chart 28Semiconductor Manufacturers Are Stepping Up Their Game
Semiconductor Manufacturers Are Stepping Up Their Game
Semiconductor Manufacturers Are Stepping Up Their Game
Reflecting the easing of supply-chain bottlenecks, both the “prices paid” and “supplier delivery” components of the manufacturing ISM declined in November. The respite from inflation will not last long, however. The US labor market is heating up. So far, most of the wage growth has been at the bottom end of the income distribution (Chart 29). Wage growth will broaden out over the course of 2022, pushing up service price inflation in the process. Chart 29Wage Growth Has Picked Up, But Mainly At The Bottom Of The Income Distribution
Wage Growth Has Picked Up, But Mainly At The Bottom Of The Income Distribution (I)
Wage Growth Has Picked Up, But Mainly At The Bottom Of The Income Distribution (I)
Chart 30Rent Inflation Has Increased
Rent Inflation Has Increased
Rent Inflation Has Increased
Rent inflation will also rise, as the unemployment rate falls further. The Zillow rent index has spiked 14% (Chart 30). Rents account for 8% of the US CPI basket and 4% of the PCE basket. Biased About Neutral? Investors are assuming that the Fed will step in to extinguish any inflationary fires before they get out of hand. The widely-followed 5-year/5-year forward TIPS breakeven inflation rate has fallen back below the Fed’s comfort zone (Chart 31). Chart 31Long-Term Inflation Expectations Are Not A Source Of Worry For The Fed
Long-Term Inflation Expectations Are Not A Source Of Worry For The Fed (II)
Long-Term Inflation Expectations Are Not A Source Of Worry For The Fed (II)
Chart 32Both The Fed And Investors Have Lowered Their Estimate Of The Neutral Rate
Both The Fed And Investors Have Lowered Their Estimate Of The Neutral Rate
Both The Fed And Investors Have Lowered Their Estimate Of The Neutral Rate
This may be wishful thinking. Back in 2012, when the Fed began publishing its “dots”, it thought the neutral rate of interest was 4.25%. Today, it considers it to be around 2.5% (Chart 32). Market participants broadly agree. Both investors and policymakers have bought into the secular stagnation thesis hook, line, and sinker. If the neutral rate turns out to be higher than widely believed, the Fed could find itself woefully behind the curve. Given the “long and variable” lags between changes in monetary policy and the resulting impact on the economy, inflation is liable to greatly overshoot the Fed’s target. Structural Forces Turning More Inflationary Meanwhile, the forces that have underpinned low inflation over the past few decades are starting to fray: Globalization is in retreat: The ratio of global trade-to-manufacturing output has been flat for over a decade (Chart 33). Looking out, the ratio could decline as geopolitical tensions between China and the rest of the world continue to simmer, and more companies shift production back home in order to gain greater control over the supply chains of essential goods. Baby boomers are leaving the labor force en masse: As a group, baby boomers hold more than half of US household wealth (Chart 34). They will continue to run down their wealth once they retire. However, since they will no longer be working, they will no longer contribute to national output. Spending that is not matched by output tends to drive up inflation. Chart 33Globalization Plateaued Over a Decade Ago
Globalization Plateaued Over a Decade Ago
Globalization Plateaued Over a Decade Ago
Chart 34
Social stability is in peril: The US homicide rate increased by 27% in 2020, the biggest one-year jump on record. All indications suggest that crime has continued to rise in 2021, coinciding with the ongoing decline in the incarceration rate (Chart 35). Amazingly, the murder rate and inflation are highly correlated (Chart 36). If the government cannot credibly commit to keeping people safe, how can it credibly commit to keeping inflation low? Without trust in government, inflation expectations could quickly become unmoored. Chart 35The Homicide Rate Has Tended To Rise When The Institutionalization Rate Has Declined
The Homicide Rate Has Tended To Rise When The Institutionalization Rate Has Declined
The Homicide Rate Has Tended To Rise When The Institutionalization Rate Has Declined
Chart 36Bouts Of Inflation Tend To Coincide With Rising Crime
Bouts Of Inflation Tend To Coincide With Rising Crime
Bouts Of Inflation Tend To Coincide With Rising Crime
The temptation to monetize debt will rise: Public-sector debt levels have soared to levels last seen during World War II. If bond yields rise as the Congressional Budget Office expects, debt-servicing costs will triple by the end of the decade (Chart 37). Faced with the prospect of having to divert funds from social programs to pay off bondholders, the government may apply political pressure on the Fed to keep rates low.
Chart 37
A Post-Pandemic Productivity Boom?
Chart 38
Might faster productivity growth bail out the economy just like it did following the Second World War? Don’t bet on it. US labor productivity did increase sharply during the initial stages of the pandemic. However, that appears to have been largely driven by composition effects that saw many low-skilled, poorly-paid service workers lose their jobs. As these low-skilled workers have returned to the labor force, productivity growth has dropped. The absolute level of productivity declined by 5.0% at an annualized rate in the third quarter, leading to an 8.3% increase in labor costs. Productivity growth has been extremely weak outside the US (Chart 38). This gives weight to the view that the pandemic-induced changes in business practices have not contributed to higher productivity, at least so far. It is worth noting that a recent study of 10,000 skilled professionals at a major IT company revealed that work-from-home policies decreased productivity by 8%-to-19%, mainly because people ended up working longer. Increased investment spending should eventually boost productivity. However, the near-term impact of higher capex will be to boost aggregate demand, stoking inflation in the process. III. Financial Markets A. Portfolio Strategy Above-Trend Global Growth Will Support Equities Our golden rule of investing is about as simple as they come: Don’t bet against stocks unless you think that there is a recession around the corner. As Chart 39 shows, recessions and equity bear markets almost always overlap.
Chart 39
Chart 40Sentiment Towards Equities Is Already Bearish
Sentiment Towards Equities Is Already Bearish
Sentiment Towards Equities Is Already Bearish
Equity corrections can occur outside of recessionary periods. In fact, we are experiencing such a correction right now. Yet, with the percentage of bearish investors reaching the highest level in over 12 months in this week’s AAII survey, chances are that the correction will not last much longer (Chart 40). A sustained decline in stock prices requires a sustained decline in corporate earnings; the latter normally only happens during economic downturns. Admittedly, it is impossible to know for sure if a recession is lurking around the corner. If the Omicron variant is able to completely evade the vaccines, growth will slow considerably over the coming months. Yet, even in that case, the global economy is unlikely to experience a sudden-stop of the sort that occurred last March. As noted at the outset of this report, pharma companies have the tools to tweak the vaccines, and most experts believe that the soon-to-be-released antivirals will be effective against the new strain. If economic growth remains above trend, earnings will rise (Chart 41). S&P 500 companies generated $53.82 per share in profits in Q3. The bottom-up consensus is for these companies to generate an average of $54.01 in quarterly profits between 2021Q4 and 2022Q3, implying almost no growth from 2021Q3 levels. This is a very low bar to clear. We expect global equities to produce high single-digit returns next year. Chart 41Analysts Increased Earnings Estimates This Year
Analysts Increased Earnings Estimates This Year
Analysts Increased Earnings Estimates This Year
The Beginning of the End Our guess is that 2022 will be the last year of the secular equity bull market that began in 2009. In mid-2023 or so, the Fed will come around to the view that the neutral rate is higher than it once thought. Unfortunately, by then, it will be too late; a wage-price spiral will have already emerged. A nasty bear flattening of the yield curve will ensue: Long-term bond yields will rise but short-term rate expectations will increase even more. A recession will follow in 2024 or 2025. The most important real-time indicator we are focusing on to gauge when to turn more bearish on stocks is the 5y/5y forward TIPS breakeven rate. As noted earlier, it is still at the bottom end of the Fed’s comfort zone. If it were to rise above 3%, all hell could break loose, especially if this happened without a corresponding increase in crude oil prices. The Fed takes great pride in the success it has had in anchoring long-term expectations. Any evidence that expectations are becoming unmoored would cause the FOMC to panic. B. Equity Sectors, Regions, And Styles Favor Value, Small Caps, and Non-US Markets in 2022 Until the Fed takes away the punch bowl, a modestly procyclical stance towards equity sectors, styles, and regional equity allocation is warranted. Chart 42The Relative Performance Of Value Stocks Has Closely Tracked Bond Yields This Year
The Relative Performance Of Value Stocks Has Closely Tracked Bond Yields This Year
The Relative Performance Of Value Stocks Has Closely Tracked Bond Yields This Year
The relative performance of value versus growth stocks has broadly followed the trajectory of the 30-year Treasury yield this year (Chart 42). Rising yields should buoy value stocks, with banks being the biggest beneficiaries (Chart 43). In contrast, rising yields will weigh on tech stocks. Chart 43Rising Bond Yields Will Help Bank Shares But Hurt Tech Stocks
Rising Bond Yields Will Help Bank Shares But Hurt Tech Stocks
Rising Bond Yields Will Help Bank Shares But Hurt Tech Stocks
Chart 44The Winners And Losers Of Covid Waves
The Winners And Losers Of Covid Waves
The Winners And Losers Of Covid Waves
If we receive some good news on the pandemic front, this should disproportionately help value. As Chart 44 illustrates, the relative performance of value versus growth stocks has tracked the number of new Covid cases globally. The correlation between new cases and the relative performance of IT and energy has been particularly strong. Rising capex spending will buoy industrial stocks. Industrials are overrepresented in value indices both in the US and abroad (Table 2). Along with financials, industrials are also overrepresented in small cap indices (Table 3). US small caps trade at 15-times forward earnings compared to 21-times for the S&P 500. Table 2Breaking Down Growth And Value By Sector
Strategy Outlook - 2022 Key Views: The Beginning Of The End
Strategy Outlook - 2022 Key Views: The Beginning Of The End
Table 3Financials And Industrials Have A Larger Weight In US Small Caps
Strategy Outlook - 2022 Key Views: The Beginning Of The End
Strategy Outlook - 2022 Key Views: The Beginning Of The End
Time to Look Abroad? Given our preference for cyclicals and value in 2022, it stands to reason that we should also favor non-US markets. Table 4 shows that non-US stock markets have more exposure to cyclical and value sectors. Table 4Cyclicals Are Overrepresented Outside The US
Strategy Outlook - 2022 Key Views: The Beginning Of The End
Strategy Outlook - 2022 Key Views: The Beginning Of The End
Admittedly, favoring non-US stock markets has been a losing proposition for the past 12 years. US earnings have grown much faster than earnings abroad over this period (Chart 45). US stock returns have also benefited from rising relative valuations. Chart 45The US Has Been The Earnings Leader In Recent Years
The US Has Been The Earnings Leader In Recent Years
The US Has Been The Earnings Leader In Recent Years
At this point, however, US stocks are trading at a significant premium to their overseas peers, whether measured by the P/E ratio, price-to-book, or price-to-sales (Chart 46). US profit margins are also more stretched than elsewhere (Chart 47).
Chart 46
Chart 47US Profit Margins Look Stretched
US Profit Margins Look Stretched
US Profit Margins Look Stretched
Chart 48Non-US Stocks Tend To Do Best When The US Dollar Is Weakening
Non-US Stocks Tend To Do Best When The US Dollar Is Weakening
Non-US Stocks Tend To Do Best When The US Dollar Is Weakening
The US dollar may be the ultimate arbiter of whether the US or international stock markets outperform in the 2022. Historically, there has been a close correlation between the trade-weighted dollar and the relative performance of US versus non-US equities (Chart 48). In general, non-US stocks do best when the dollar is weakening. The usual relationship between the dollar and the relative performance of US and non-US stocks broke down in 2020 when the dollar weakened but the tech-heavy US stock market nonetheless outperformed. However, if “reopening plays” gain the upper hand over “pandemic plays” in 2022, the historic relationship between the dollar and US/non-US returns will reassert itself. As we discuss later on, while near-term momentum favors the dollar, the greenback is likely to weaken over a 12-month horizon. This suggests that investors should look to increase exposure to non-US stocks in a month or two. Around that time, the energy shortage gripping Europe will begin to abate, China will be undertaking more stimulus, and investors will start to focus more on the prospect of higher US corporate taxes. C. Fixed Income Maintain Below-Benchmark Duration The yield on a government bond equals the expected path of policy rates over the duration of the bond plus a term premium that compensates investors for locking in their savings at a fixed rate rather than rolling them over at the prevailing short-term rate. While expected policy rates have moved up in the US over the past 2 months, the market’s expectations of where policy rates will be in the second half of the decade have not changed much (Chart 49). Investors remain convinced of the secular stagnation thesis which postulates that the neutral rate of interest is very low.
Chart 49
As for the term premium, it remains stuck in negative territory, much where it has been for the past 10 years (Chart 50). Chart 50Negative Term Premium Across The Board
Negative Term Premium Across The Board
Negative Term Premium Across The Board
The Term Premium Will Increase The notion of a negative term premium may seem odd, as it implies that investors are willing to pay to take on duration risk. However, there is a good reason for why the term premium has been negative: The correlation between bond yields and stock prices has been positive (Chart 51). Chart 51Stocks And Bond Yields Have Not Always Been Positively Correlated
Stocks And Bond Yields Have Not Always Been Positively Correlated
Stocks And Bond Yields Have Not Always Been Positively Correlated
When bond yields are positively correlated with stock prices, bonds are a hedge against bad economic news. If the economy falls into recession, equity prices will drop; the value of your home will go down; you may not get a bonus, or even worse, you may lose your job. But at least the value of your bond portfolio will go up! There is a catch, however: Bonds are a hedge against bad economic news only if that news is deflationary in nature. The 2001 and 2008-09 recessions all saw bond yields drop as the economy headed south. Both recessions were due to deflationary shocks: first the dotcom bust, and later, the bursting of the housing bubble. In contrast, bond yields rose in the lead up to the recession in the 1970s and early 80s. Bonds were not a good hedge against falling stock prices back then because it was surging inflation and rising bond yields that caused stocks to fall in the first place. This raises a worrying possibility that investors have largely overlooked: The term premium may increase as it becomes increasingly clear that the next recession will be caused not by inadequate demand but by Fed tightening in response to an overheated economy. A rising term premium would exacerbate the upward pressure on bond yields stemming from higher-than-expected inflation as well as upward revisions to estimates of the real neutral rate of interest. Again, we do not think that a “term premium explosion” is a significant risk for 2022. However, it is a major risk for 2023 and beyond. Investors should maintain a modestly below-benchmark duration stance for now but look to go maximally underweight duration towards the end of next year. Global Bond Allocation BCA’s global fixed-income strategists recommend underweighting the US, Canada, the UK, and New Zealand in 2022. They suggest overweighting Japan, the euro area, and Australia. US Treasuries trade with a higher beta than most other government bond markets (Chart 52). Our bond strategists expect the US 10-year Treasury yield to hit 2%-to-2.25% by the end of next year. Chart 52High-And Low-Beta Bond Yields
High-And Low-Beta Bond Yields
High-And Low-Beta Bond Yields
As discussed earlier, neither the ECB nor the BoJ are in a hurry to raise rates. Both euro area and Japanese bonds have outperformed the global benchmark when Treasury yields have risen (Chart 53).
Chart 53
Chart 54UK Inflation Expectations Are Higher Than In Other Major Developed Economies
UK Inflation Expectations Are Higher Than In Other Major Developed Economies
UK Inflation Expectations Are Higher Than In Other Major Developed Economies
While rate expectations in Australia have come down on the Omicron news, the markets are still pricing in four hikes next year. With wage growth still below the RBA’s target, our fixed-income strategists think the central bank will pursue a fairly dovish path next year. In contrast, they think New Zealand will continue its hiking cycle. Like Canada, the Reserve Bank of New Zealand has become increasingly concerned about soaring home prices and household indebtedness. Inflation expectations are higher in the UK than elsewhere (Chart 54). With the BoE set to raise rates early next year, gilts will underperform the global benchmark. Overweight High-Yield Corporate Bonds… For Now Chart 55High-Yield Spreads Are Pricing In A Default Rate Of Close To 4%
High-Yield Spreads Are Pricing In A Default Rate Of Close To 4%
High-Yield Spreads Are Pricing In A Default Rate Of Close To 4%
The combination of above-trend economic growth and accommodative monetary policy will provide support for corporate bonds in 2022. For now, we prefer high yield over investment grade. According to our bond strategists, while high-yield spreads are quite tight, they are still pricing in a default rate of 3.8% (Chart 55). This is more than their fair value default estimate of 2.3%-to-2.8%. It is also above the year-to-date realized default rate of 1.7%. As with equities, the bull market in corporate credit will end in 2023 as the Fed is forced to accelerate the pace of rate hikes in the face of an overheated economy and rising long-term inflation expectations. D. Currencies and Commodities Dollar Strength Will Reverse in Early 2022 Since bottoming in May, the US dollar has been trending higher. The US dollar is a high momentum currency: When the greenback starts rising, it usually keeps rising (Chart 56). A simple trading rule that buys the dollar when it is trading above its various moving averages has delivered positive returns (Chart 57). This suggests that the greenback could very well strengthen further over the next month or two.
Chart 56
Chart 57
Over a 12-month horizon, however, we think the trade-weighted dollar will weaken. Both speculators and asset managers are net long the dollar (Chart 58). Current positioning suggests we are nearing a dollar peak. Rising US rate expectations have helped the dollar this year. Chart 59 shows that both USD/EUR and USD/JPY have tracked the spread between the yield on the December 2022 Eurodollar and Euribor/Euroyen contracts, respectively. While the Fed will expedite the pace of tapering, the overall approach will still be one of “baby-steps” towards tightening next year. BCA’s bond strategists do not expect US rate expectations for end-2022 to rise from current levels. Chart 58Long Dollar Positions Are Getting Crowded
Long Dollar Positions Are Getting Crowded
Long Dollar Positions Are Getting Crowded
Chart 59Interest Rates Have Played A Major Role On The Dollar's Performance This Year
Interest Rates Have Played A Major Role On The Dollar's Performance This Year
Interest Rates Have Played A Major Role On The Dollar's Performance This Year
The present level of real interest rate differentials is consistent with a much weaker dollar (Chart 60). Using CPI swaps as a proxy for expected inflation, 2-year real rates in the US are 42 basis points below other developed economies. This is similar to where real spreads were in 2013/14, when the trade-weighted dollar was 16% weaker than it is today. Chart 60AThe Dollar And Interest Rate Differentials (I)
The Dollar And Interest Rate Differentials (I)
The Dollar And Interest Rate Differentials (I)
Chart 60BThe Dollar And Interest Rate Differentials (II)
The Dollar And Interest Rate Differentials (II)
The Dollar And Interest Rate Differentials (II)
Meanwhile, growth outside the US will pick up next year as Europe’s energy crisis abates and China ramps up stimulus. If history is any guide, firmer growth abroad will put downward pressure on the dollar (Chart 61). Chart 61The Dollar Will Weaken As Global Growth Rotates From The US To The Rest Of The World
The Dollar Will Weaken As Global Growth Rotates From The US To The Rest Of The World
The Dollar Will Weaken As Global Growth Rotates From The US To The Rest Of The World
Chart 62Dollar Headwinds
Dollar Headwinds
Dollar Headwinds
Pricey Greenback The dollar’s lofty valuation has left it overvalued by nearly 20% on a Purchasing Power Parity (PPP) basis. The PPP exchange rate equalizes the price of a representative basket of goods and services between the US and other economies. Reflecting the dollar’s overvaluation, the US trade deficit has widened sharply. Excluding energy exports, the US trade deficit as a share of GDP is now the largest on record. Equity inflows have helped finance America’s burgeoning current account deficit (Chart 62). However, these inflows are starting to abate, and could drop further if global investors abandon their infatuation with US tech stocks. Favor Commodity Currencies We favor commodity currencies for 2022, especially the Canadian dollar, which we expect to be the best performing G10 currency. Canadian real GDP growth will average nearly 5% in Q4 and the first half of next year. The Bank of Canada will start hiking rates next April. Oil prices should remain reasonably firm next year, helping the loonie and other petrocurrencies. Bob Ryan, BCA’s chief Commodity Strategist, expects the price of Brent crude to average $80/bbl in 2022 and 81$/bbl in 2023, which is well above the forwards (Chart 63). Years of underinvestment in crude oil production have led to tight supply conditions (Chart 64). Proven global oil reserves increased by only 6% between 2010 and 2020, having risen by 26% over the preceding decade.
Chart 63
Chart 64
As with oil, there has been little investment in mining capacity in recent years. While a weaker property market in China will weigh on metals prices, this will be partly offset by Chinese fiscal stimulus. Looking further ahead, the outlook for metals remains bright. Whereas the proliferation of electric vehicles is bad news for oil demand over the long haul, it is good news for many metals. The typical electric vehicle requires about four times as much copper as a typical gasoline-powered vehicle. Huge amounts of copper will also be necessary to expand electrical grids. The RMB Will Be Stable in 2022 It is striking that despite the appreciation in the trade-weighted dollar since June and escalating concerns about the health of the Chinese economy, the RMB has managed to strengthen by 0.3% against the US dollar. Chinese export growth will moderate in 2022 as global consumption shifts from goods to services. Rising global bond yields may also narrow the yield differential between China and the rest of the world. Nevertheless, we doubt the RMB will weaken very much. China wants the RMB to be a global reserve currency. A weak RMB would run counter to that goal. Rather than weakening the yuan, the Chinese authorities will use fiscal stimulus to support growth. Gold Versus Cryptos? Gold prices tend to move closely with real bond yields (Chart 65). Since August 2020, however, the price of gold has slumped from a high of $2,067/oz to $1,768/oz, even though real yields remain near record lows. The divergence between real yields and gold prices may partly reflect growing demand for cryptocurrencies. Investors increasingly see cryptos as not just a disruptive economic force, but as the premier “anti-fiat” hedge. Whether that view pans out remains to be seen. So far, the vast majority of the demand for cryptocurrencies has stemmed from people hoping to get rich by buying cryptos. To the extent that people are using cryptos for online purchases, it is usually for illegal goods (Chart 66). Chart 65Gold Prices Tend To Correlate Closely With Real Interest Rates
Gold Prices Tend To Correlate Closely With Real Interest Rates
Gold Prices Tend To Correlate Closely With Real Interest Rates
Chart 66
Crypto proponents like to say that the supply of cryptos is finite. While this may be true for individual cryptocurrencies, it is not true for the sector as a whole. Over the past 8 years, the number of cryptocurrencies has swollen from 26 in 2013 to 7,877 (Chart 67). At least with gold, they are not adding any new elements to the periodic table.
Chart 67
At any rate, the easy money in the crypto space has already been made. Bitcoin has doubled in price seven times since the start of 2016. If it were to double just one more time to $120,000, it would be worth $2.2 trillion, equal to the entire stock of US dollars in circulation. Investors looking to hedge long-term inflation risk should shift back into gold. Peter Berezin Chief Global Strategist pberezin@bcaresearch.com Global Investment Strategy View Matrix
Image
Special Trade Recommendations
Image
Current MacroQuant Model Scores
Image
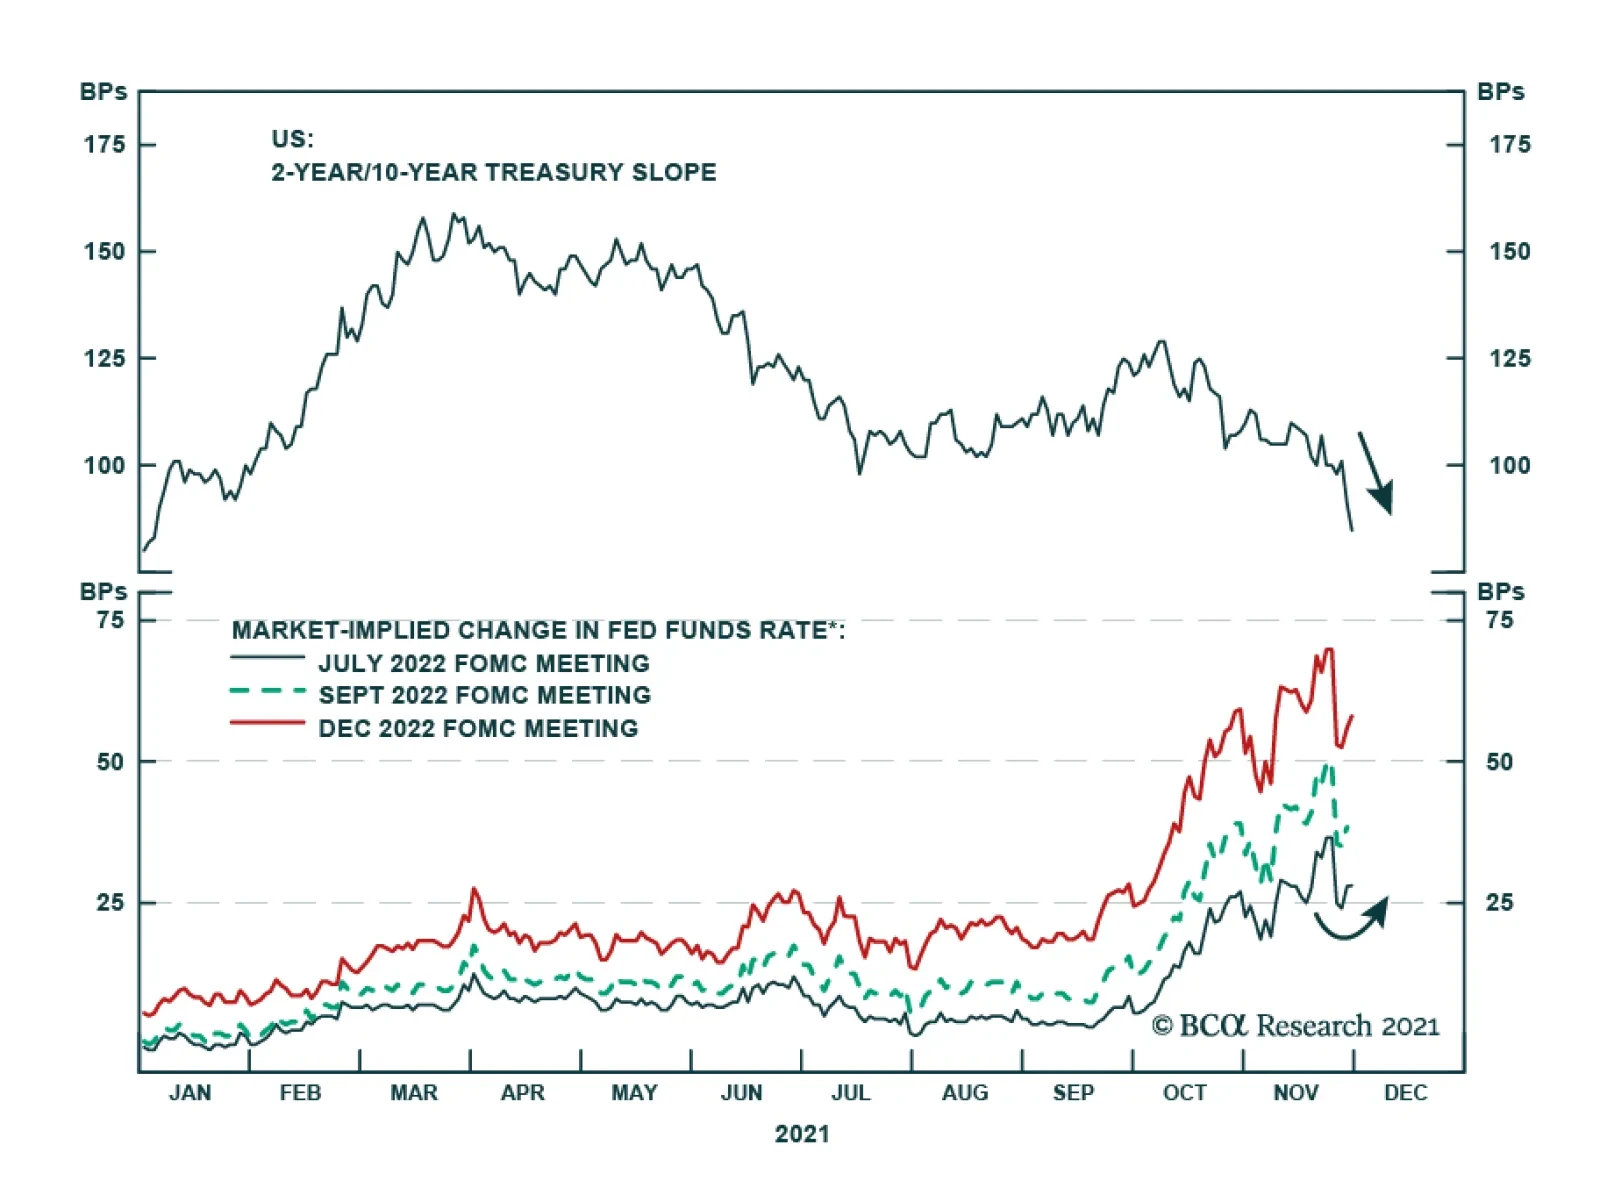
Fed Chair Jerome Powell’s comments during Tuesday’s congressional testimony mark a hawkish shift in Fed policy. Specifically, Powell noted that an earlier conclusion to the asset purchase program may be appropriate – making it likely that the pace of taper…
Mr. X and his daughter, Ms. X, are long-time BCA clients who visit our office toward the end of each year to discuss the economic and financial market outlook for the year ahead. This report is an edited transcript of our recent conversations, which we held remotely for a second year in a row due to the COVID-19 pandemic. Mr. X: It is typically the case that I look forward to our end of year conversations, as they always help clarify the investment landscape for my daughter and I. This year, the feeling of excitement has unusually given way to a sense of foreboding. As far as the pandemic is concerned, clearly this year was a better one than last year, and I am encouraged by the progress that has been made around the world at protecting people from COVID-19 – although I do have some questions about the recent discovery of the Omicron variant. Risky assets have generally performed well year-to-date, and our portfolio has benefitted from that. But the longer-term investment outlook has certainly deteriorated: equity market multiples remain extremely elevated, government debt loads are still extraordinarily high, and now we have finally seen a surge in inflation – which, as you know, I have been concerned about for several years. I feel strongly that investors are unprepared for the eventual policy consequences of what has happened this year. Financial markets have been underpinned by easy money for too long, and if interest rates have to rise on a structural basis to control inflation, the financial market consequences will be severe – let alone the potential political and social consequences! I have steeled myself for a depressing conversation. Ms. X: As you may have sensed during our discussions over the past few years, I tend to have a more optimistic outlook than my father does. At a minimum, I believe that there are always investment opportunities that one can pursue, regardless of whether the macro regime is bullish or bearish for economic activity and risky asset prices. But I do have to say that the extent of the rise in consumer prices this year has unnerved me and made me marginally more inclined to agree with my father’s pessimistic long-term outlook. It is very unsettling to see headline inflation in the US at its highest level in three decades, and I very much hope that you will be able to provide some perspective about whether elevated inflation is here to stay. But before we get into our discussion of the outlook, perhaps we can briefly review your predictions from last year? BCA: Certainly. A year ago, our key conclusions were the following: In 2021, stocks will outperform bonds thanks to the global economic recovery, the lack of immediate inflationary pressures and the prospects of a resolution to the pandemic. Imbalances in the global economy are growing, and the explosion in debt loads witnessed this year will carry significant future costs. Rising inflation is the most likely long-term consequence because of rising populism and the meaningful chance of financial repression. This change in inflation dynamics will generate poor long-term returns for a 60/40 portfolio, especially because asset valuations are so expensive. Compared to the past two years, geopolitical uncertainty will recede in 2021, but will remain elevated by historical standards. China and the US are interlocked in a structural rivalry, which means that flashpoints, such as Taiwanese independence, will remain a source of tensions. Europe will enjoy geopolitical tailwinds next year. For now, no central bank or government wants to remove economic support too quickly. Monetary policy will remain very stimulative as long as inflation is low, which means no tightening until late 2022, at the earliest. Fiscal deficits will narrow, but more slowly than private savings will decline. The US will grow faster than potential thanks to this policy backdrop. Moreover, household finances are robust and industrial firms are taking advantage of low interest rates as well as surprisingly resilient goods demand to increase their capex plans. Outside of the US, China’s stimulus and an inventory restocking will fuel a continued upswing in the global industrial cycle that will push 2021 GDP growth well above trend. However, at the beginning of the year, we will likely feel the remnants of the lockdowns currently engulfing Western economies. Bond yields can rise next year, but not by much. Ebbing deflationary pressures and the global industrial cycle upswing will lift T-Note and T-Bond yields. However, the extremely low probability of monetary tightening in 2021 and 2022 will create a ceiling for yields. We favor peripheral European bonds at the expense of German Bunds and US Treasuries. Corporate spreads should stay contained thanks to a very easy policy backdrop and the positive impact on cash flows and defaults of the ongoing recovery. We also like municipal bonds but worry about pre-payment risks for MBS. Global stocks should enjoy a robust advance in 2021, even if the market’s gains will be smaller and more volatile than from March 2020 to today. Easy monetary conditions will buttress valuations while recovering economic activity will support earning expectations. Within equities, we favor cyclical versus defensive names and value stocks relative to growth stocks. As a corollary, we prefer small cap to large cap and foreign DM-equities to US equities. We are neutral on EM equities due to their large tech sector weighting. The dollar bear market is set to continue, and high-beta European currencies will benefit most. The yen remains an attractive portfolio hedge. Oil and gold have upside next year. Crude will benefit from both supply-side discipline and a recovery in oil demand. Gold will strengthen as global central banks will maintain extremely accommodative conditions and global fiscal authorities will remain generous. A weaker dollar will flatter both commodities. A balanced portfolio is likely to generate average returns of only 1.0% a year in real terms over the next decade. This compares to average returns of around 6.1% a year between 1990 and 2020. Most of our investment recommendations panned out quite well this year (Table 1). Global stocks significantly outperformed long-maturity government bonds, advanced economies grew meaningfully above trend, monetary policy remained extremely easy, long-maturity bond yields rose moderately, and our call to favor cyclical sectors was a profitable one. Our bullish oil call worked out especially well, with Brent prices having risen roughly 60% from the beginning of the calendar year until the discovery of the Omicron variant. It remains 43% above its late-2020 level. Table 12021 Asset Market Returns
OUTLOOK 2022: Peak Inflation – Or Just Getting Started?
OUTLOOK 2022: Peak Inflation – Or Just Getting Started?
A few calls did not perform in line with our expectations, however. We favored value versus growth stocks this year, and this call did work out in the first half of 2021. However, growth rallied in the back half of the year, in response to a renewed decline in long-maturity bond yields that was catalyzed by the emergence of the Delta variant. We would note that financials did outperform broadly-defined technology stocks this year (the two main representative sectors of the value and growth styles, respectively), underscoring that other factors impacted the overall value versus growth call. DM ex-US stocks underperformed this year, contrary to our expectations. When considering the euro area as a proxy for DM ex-US and when examining combined sector effects (both sector weight and performance) in local currency terms, almost all of the underperformance this year occurred due to the euro area’s comparatively low weight in the information technology and communication services sectors, underscoring that there has been a value vs. growth dimension to European equity underperformance. But when measured in common currency terms, the underperformance of DM ex-US stocks has mostly occurred due to the rise in the US dollar. The dollar was flat to down for the first half of the year, in line with our prediction, but rallied in the back half – especially over the past month, as new COVID cases surged in several European countries. Within the commodity space, our oil call worked out extremely well but gold fared poorly. This underscores that gold is far more sensitive to real interest rate dynamics than it is to the US dollar trend, which likely has bearish long-term implications for the yellow metal. We can address that later when we discuss the commodity outlook. Finally, we argued last year that we were experiencing a secular inflection point in inflation, but we did not anticipate the magnitude of the rise in consumer prices this year. As we will discuss in a moment, that reflects major pandemic-induced supply-side effects affecting consumer prices, which we believe will wane next year on average. That does not, however, mean that demand-side factors are irrelevant, and we do believe that core inflation will come in higher than the Fed currently expects in 2022. Peak Inflation – Or Just Getting Started? Ms. X: You mentioned the pandemic in your comments about supply-side inflation, and I feel that it would be a good idea to get your thoughts about COVID-19 up front. As my father noted, there has been enormous progress made this year towards ending the pandemic, but it is not yet over – as evidenced both by Europe’s recent 5th wave, as well as this highly concerning Omicron variant. I understand that you are not medical professionals, but what is your base case view of what is likely to happen next year? BCA: When we discussed last year’s outlook, it was certainly our hope that we would have declared a decisive victory in the war against COVID-19 by this point. That has not occurred, due to three major factors. Chart 1Vaccination Rates Are Too Low To Stop COVID From Circulating
Vaccination Rates Are Too Low To Stop COVID From Circulating
Vaccination Rates Are Too Low To Stop COVID From Circulating
The first was the emergence of the Delta variant of COVID-19 in the middle of the year. Delta’s transmission and serious illness rate is higher than the original SARS-COV-2 virus and its Alpha variant, which rendered the goal of true herd immunity unachievable. The Delta variant of SARS-COV-2 has accounted for all new confirmed cases of COVID-19 around the world (until very recently), meaning that the bar for ending the pandemic has risen this year. Vaccine hesitancy and a slow approval process for vaccinating children is the second factor that has prolonged the end of the COVID-19 pandemic. While vaccine penetration has generally been high in most countries, a combination of hesitancy and the inability to vaccinate children under the age of 12 has left 1/4th to 1/3rd of the population of advanced economies unprotected against COVID-19. That might have been enough to prevent rising transmission of the original SARS-COV-2 virus, but it has proven to be too low to durably stop the ongoing spread of the Delta variant once disease control measures are relaxed or eliminated (Chart 1). In fact, as you noted, Chart 1 highlights that a 5th wave of the pandemic is in the process of occurring, especially within Europe. The vaccination of children has already begun in the United States and a few other countries, and many countries will likely follow suit in the weeks and months ahead. However, vaccination rates are likely to be lower among children given the considerably lower risk of severe illness, and it is clear that vaccine hesitancy among adults is sticky. The extent of vaccine hesitancy is most visible in the United States, where it has taken on a political dimension. Chart 2 highlights that US state vaccination rates are strongly predicted by the 2020 US Presidential election results, with states that voted for Donald Trump having on average a 12% lower vaccination rate than those that voted for Joe Biden.
Chart 2
The third factor that has prolonged the pandemic, which seems to be linked to the emergence of the Omicron variant, is the fact that poorer parts of the world have not been able to make as much progress in vaccinating their populations, at least in part due to vaccine nationalism. We do not pass judgement on the governments of richer economies for prioritizing their own citizens, and indeed it would be hypocritical for us to do so as most of us at BCA have personally benefitted from that. But the consequence of those decisions is that some parts of the world, especially in Africa, have been left as de-facto breeding grounds for new variants. While the Omicron variant only came to light in the days leading up to the publication of this report, it does appear based on the available data that the variant emerged in Africa. Given all of this, we would be considerably more cautious in our outlook for the global economy next year if the progression of the pandemic were only dependent on the vaccination rate, especially now given the emergence of Omicron. However, two other factors will strongly influence the evolution of the pandemic and its impact on economic activity over the coming 12 months. First, in the US, states with a comparatively low vaccination rates likely have higher acquired immunity levels from previous infections, given that these states have recorded higher confirmed cases on a per capita basis. Chart 3The Delta Strain On US Hospitals Has Fallen, And Will Fall Further With Anti-Viral Drugs
The Delta Strain On US Hospitals Has Fallen, And Will Fall Further With Anti-Viral Drugs
The Delta Strain On US Hospitals Has Fallen, And Will Fall Further With Anti-Viral Drugs
Second, and much more important, is the fact that anti-viral drug treatments with the ability to significantly reduce hospitalization and death have been discovered and are already under production. Molnupiravir, developed/produced by Merck and Ridgeback Biotherapeutics, has been shown to reduce the risk of hospitalization by 30%, and Merck is projecting that 10 million courses of treatment will be available by the end of December 2021, with at least 20 million courses to be produced next year. 1.7 million courses of treatments are set to be delivered to the US upon FDA approval, which compares with approximately 2 million COVID-related hospitalizations in the US over the past year. Chart 3 highlights that US ICU bed occupancy has already lessened, and the imminent deployment of effective drugs should lower ICU utilization even further over the winter months. Paxlovid, Pfizer’s oral anti-viral treatment for COVID-19, has been shown to be even more effective at reducing hospitalization, and news reports suggest the US government will order enough Paxlovid to treat 10 million Americans. Pfizer expects to produce roughly 50 million courses of treatment in 2022, and recently agreed to allow 95 developing countries to produce Paxlovid locally, suggesting that the impact of COVID-19 on the global medical system will be greatly reduced next year. This seems likely to be true even given the emergence of Omicron, as Paxlovid works by stopping the virus from replicating, by blocking an enzyme that does not appear to have mutated since the onset of the pandemic. Paxlovid does not target the spike protein, unlike monoclonal antibody treatments. Ms. X: The development of anti-viral treatments was seen as a very positive announcement because it had the strong potential to reduce or eliminate the impact of vaccine hesitancy on the medical system. But this new variant appears to be vaccine-resistant; doesn’t that mean that we might need far more of these drugs than we originally thought? BCA: Indeed. The fact that Omicron appears to be even more contagious than Delta and at least partially vaccine-resistant is legitimately concerning, because it could mean that many more courses of treatment of Molnupiravir and Paxlovid will be needed than will be available in the coming weeks and months to prevent a sharp rise in hospitalizations and deaths. At the same time, public comments by South African doctor Angelique Coetzee, who chairs the South African Medical Association and treated several patients suspected of having been infected with the Omicron variant, suggest that it may produce milder symptoms – which would be associated with a lower hospitalization rate.1 If Omicron outcompetes the Delta variant of the virus, but produces less severe disease, that could ironically prove to be a positive development. The fact that Omicron could render monoclonal antibody treatments useless could further reduce vaccine hesitancy in advanced economies and encourage the vaccination of children. That would further reduce the total incidence of severe illnesses even if Omicron is partially vaccine-resistant, and thus would be positive from the perspective of reducing the burden on the health care system. Still, South Africa’s population is considerably younger than those of advanced economies, and we will not know for some time whether a reduction in severe illness, if that proves to be true, applies also to those who are older. If Omicron threatens a significant hospitalization or fatality rate among the elderly who have been fully vaccinated, Omicron-specific booster shots for that age cohort will likely be required – which could take 3-4 months to become available. If that proves to be the path forward, the widespread reintroduction of “non-pharmaceutical interventions” (NPIs) – the policymaker codeword for travel bans, school closures, and lockdowns – is certainly a possible outcome in the first quarter. Omicron will have at least some impact on global travel over the coming month, as countries around the world decide to err on the side of caution and impose travel restrictions while more information is gathered about this new variant. To conclude on this question, as you noted, we are not medical experts. And frankly even if we were, we would not be able to project exactly how the pandemic will unfold next year. Thus, there is more uncertainty concerning our 2022 outlook than would normally be the case. Prior to the emergence of Omicron, our base case view was that the pandemic would meaningfully recede in importance next year, which would lay the groundwork for a more normal labor market, prices, and the supply of both goods and services. For the reasons that we have laid out, we have not yet seen enough information to change that view for 2022 as a whole, although the opposite will likely be true for the next few weeks at a minimum. We may have to have you both back for another discussion in the first half of next year to revisit our outlook, but for now it is not our expectation that we are back to square one on the pandemic front. Chart 4A 30-Year High In US Inflation
A 30-Year High In US Inflation
A 30-Year High In US Inflation
Mr. X: Thank you for your insights. Although this is clearly a concerning development, I suppose that there is no use panicking yet, as we do not have the information that we need to make an informed judgement. Perhaps we can turn to the question of inflation, given that seems likely to be an important economic and policy factor next year regardless of whether Omicron extends the duration of the pandemic. As both my daughter and I highlighted, this year’s rise in consumer prices was extreme, at least by the standard of the past three decades. As you know, I have my own views about why this has occurred, and I suspect that you do not fully agree with me. But for the sake of our discussion, please outline your views about what has occurred this year, and what that implies for policy and financial markets. BCA: As you noted, in both the US and euro area economies, headline consumer price inflation rose this year to their highest levels since the early-1990s (Chart 4). The rise in core inflation has been less extreme in the euro area, but it is also back to early-1990s levels in the US (panel 2). It is understandable that investors are worried about inflation remaining very elevated, and we agree that US inflation will likely be both above the Fed’s target as well as its forecast next year. However, our base case view is that investors are currently overestimating the magnitude of inflation over the coming 12 months, and that actual inflation will come in lower next year than what short-maturity inflation expectations are currently suggesting. As such, we do not expect that inflation next year will lead to a major shift in the monetary policy outlook, and we would continue to recommend that global investors stay overweight stocks versus bonds in 2022. Mr. X: I am surprised that you have a sanguine inflation outlook given how sharply consumer prices have risen this year. It sounds like you are blindly accepting the “transitory” narrative that central banks themselves are now questioning! This year’s surge in consumer prices has several causes, and a review of these factors is necessary to predict how future prices are likely to evolve. Fundamentally, any change in price can be traced to changes in supply and demand, and both of those effects worked in the direction of higher consumer prices this year. Chart 5 outlines the clear evidence of demand-side effects. The US fiscal response to the pandemic was more forceful than in the euro area, and US core consumer prices have correspondingly risen much more than in Europe. The chart highlights that US durable goods prices have been responsible for more of the surge in prices this year than has been the case for services, reflecting strong goods demand from US consumers. Chart 6 highlights that US real goods spending is 9.8% above its pre-pandemic trend, whereas it is 4.5% below for services. Extremely strong goods demand partially reflects the impact of fiscal and monetary stimulus, but also a shift in spending from services to goods owing to the nature of the pandemic and the type of activity that it has restricted. We expect that another shift in spending mix will occur next year in the opposite direction, barring a major extension of the pandemic from Omicron. Chart 5A Breakdown Of US Inflation Provides Clear Evidence For Demand-Pull Effects
A Breakdown Of US Inflation Provides Clear Evidence For Demand-Pull Effects
A Breakdown Of US Inflation Provides Clear Evidence For Demand-Pull Effects
Chart 6US Goods Demand Is Well Above Trend
US Goods Demand Is Well Above Trend
US Goods Demand Is Well Above Trend
You referenced the “transitory” debate in your question, and the answer to whether above-target inflation is likely to be transitory is both yes and no. Many of the supply-side effects that are driving prices are transitory, in the sense that they will not last beyond the pandemic. That view should not be controversial. But, some of the demand-side effects lifting prices are not. Chart 7A Shortage Of Service-Sector Workers Has Boosted Wages And Services Prices
A Shortage Of Service-Sector Workers Has Boosted Wages And Services Prices
A Shortage Of Service-Sector Workers Has Boosted Wages And Services Prices
In the US, supply effects are seen by observing services prices. Services prices in the US have risen despite a collapse in demand, pointing to supply-side effects as the dominant driver of higher prices. A significant decline in labor force participation has caused a shortage of workers, which is driving up wages for the first quartile of wage earners (the lowest paid) who often work in service-providing industries (Chart 7). Faced with higher labor costs alongside low operating margins and the expectation that demand will continue to recover, service providers have raised prices to stay afloat. The specific causes of the ongoing labor market shortage in the US are multifaceted, but most relate directly to the pandemic: There has been a surge in the number of retirees, mainly driven by a sharp slowdown in the number of older Americans (who are more vulnerable to COVID-19) shifting from “retired” to “in the labor force”. Workers in some sectors of the economy that experienced a surge in demand during the pandemic (technology, health care, food products, transportation, and manufacturing) have experienced burnout and have quit their jobs. Some service-sector workers have complained of difficult working conditions during the pandemic (the need to wear masks, the policing of masks and vaccination passports, overwork due to short-staffed conditions, negative interactions with customers, etc.) and have instead chosen not to work until these conditions improve. Some parents have been unable or unwilling to reenter the labor force due to increased childcare requirements resulting from daycare/school/classroom closures. Chart 8Fewer Immigrants = Higher Wages
Fewer Immigrants = Higher Wages
Fewer Immigrants = Higher Wages
Chart 8 highlights that legal immigration to the US collapsed during the pandemic following a restriction in worker visas last year, which has also likely exacerbated worker shortages in some industries. Illegal immigration has surged over the past year, but illegal workers do not necessarily immediately enter the labor market and are often employed in a narrow set of industries. Mr. X: But if these supply-side effects that you are pointing to are mostly on the services side, does that not imply that goods inflation will remain very elevated next year due to excessive demand? BCA: No. As we mentioned, some of this goods spending is being funded by income that would normally go towards services spending. We doubt that a services spending deficit will be sustained if the pandemic recedes next year, meaning that some spending will naturally be diverted away from goods. Chart 9Supply-Side Effects Have Significantly Boosted Global Shipping Costs
Supply-Side Effects Have Significantly Boosted Global Shipping Costs
Supply-Side Effects Have Significantly Boosted Global Shipping Costs
In addition, other supply-side factors are also impacting consumer prices for both goods and services, and on both sides of the Atlantic: Global shipping costs have surged, particularly for cargo containers traveling from China / East Asia to the west coast of the US. US demand for goods has certainly boosted shipping prices, but Chart 9 highlights that supply-side effects have also been present. The large rise in China/US shipping costs since late-June appears to have been caused by the one-month closure of the Port of Yantian that began in late-May, in response to an outbreak of COVID-19 in Guangdong province. Semiconductor shortages have limited automotive production, thereby significantly boosting US vehicle prices. These shortages have occurred, in part, due to a global surge in semiconductor demand stemming from work-from-home policies, but also demand/supply coordination failures last year (auto producers initially cut chip orders on the expectation of collapsing car sales) and COVID-driven plant shutdowns in some Asian countries such as Malaysia. Energy prices have risen this year, partially due to supply-side / policy decisions. In the case of oil & gasoline prices, OPEC’s production decisions clearly reflect a desire to maintain oil prices at roughly $80/bbl, 30% above the level that prevailed prior to the pandemic. US shale producers have focused on repairing their balance sheets over the past year, and have not been able to take advantage of higher prices to boost output. Chart 10 highlights that US tight oil production remains roughly 10% below its pre-pandemic peak. In Europe, the impact of higher energy prices has occurred mainly though a spike in the price of natural gas, mostly due to weather, carbon pricing, Russian supply issues, and a surge in China’s natural gas demand. Chinese natural gas demand has surged in response to very strong manufacturing activity / export demand, but also previous decisions by Beijing to shift towards cleaner energy sources and the limitation of coal imports from certain countries (which has contributed to a collapse in Chinese coal inventories). So while it is clear that there is a strong underlying demand component that has boosted goods prices, supply-side factors have magnified the acceleration in consumer prices this year. Most of these supply-side factors (except for oil) have been directly linked to the pandemic, and thus are likely to wane in 2022 if the pandemic recedes (as we currently expect). In the case of oil, our view is that spot prices in 2022 are likely to average the price that prevailed prior to the Omicron-driven collapse in prices, meaning that the energy component that has been boosting headline price indexes this year will likely disappear next year even if recent travel bans are not long lasting and oil prices fully recover. Ms. X: Even if the pandemic does recede in importance and household spending shifts from goods to services next year, you acknowledged that goods spending is also being boosted by policy. This implies that goods spending will remain above trend next year, and that it will continue to boost consumer prices. Doesn’t that argue for elevated inflation? BCA: We agree that several factors point to above-trend goods spending next year, and this is the basis – in addition to lingering supply-side effects – for our view that US inflation will likely be both above the Fed’s target as well as its forecast for 2022 (2.2% headline and 2.3% core). However, Chart 11 shows a historically unprecedented “goods spending gap” relative to the overall output gap. It is unlikely that this has occurred only due to stimulative policy. Services spending collapsed during the pandemic, as Chart 6 highlights. So while goods spending will likely remain above its trend, supported by policy as well as a large stock of excess savings, it is likely to decline next year. Chart 10US Shale Production Has Not Returned To Its Pre-Pandemic Level
US Shale Production Has Not Returned To Its Pre-Pandemic Level
US Shale Production Has Not Returned To Its Pre-Pandemic Level
Chart 11US Goods Spending Is Much Too Strong To Be Explained By Policy Alone
US Goods Spending Is Much Too Strong To Be Explained By Policy Alone
US Goods Spending Is Much Too Strong To Be Explained By Policy Alone
Lower goods demand in advanced economies will not only ease rising goods prices. It will also help ease Europe’s energy crisis, as it implies less competition for natural gas from China’s power companies which are struggling to supply the manufacturing sector. Chart 12Short-Term Inflation Expectations Have Exploded; Long-Term Expectations Are Contained
Short-Term Inflation Expectations Have Exploded; Long-Term Expectations Are Contained
Short-Term Inflation Expectations Have Exploded; Long-Term Expectations Are Contained
Ms. X: One thing that has concerned me is how significantly inflation expectations have risen. Won’t persistent price increases become self-fulfilling if consumers and businesses come to expect inflation? BCA: This is a risk, and the dynamic that you are referring to is explicitly incorporated into modern-day interpretations of the Phillips Curve. However, if this were likely to occur, we should be able to observe a dangerous rise in both short- and long-dated inflation expectations on the part of investors, businesses, and households. Chart 12 highlights that long-term inflation expectations are not out of control. Short-term expectations for inflation have indeed exploded higher, but longer-term expectations remain under control. Inflationary pressure during the pandemic has normalized longer-term household expectations for inflation, which fell following the 2014/2015 collapse in oil prices. And long-dated market-based expectations for inflation have not even risen back to pre-2014 levels, underscoring that investors do not believe that current inflationary pressures are likely to persist. A breakout in long-dated inflation expectations next year would negatively alter our monetary policy and economic outlook, but it is clear that economic agents believe that current price pressure is directly linked to the pandemic. We agree, for the most part, and thus expect concerns about inflation to step down next year. Mr. X: Let’s turn to the question of extremely elevated government debt. We discussed this issue last year, and you noted that the explosion in public debt loads would carry significant future costs. Governments have been kicking the can down the road for a long time now, and I am interested in your perspective about the timing of the endgame. When do you think the day of reckoning will arrive? BCA: It is true that government debt-to-GDP ratios have risen substantially over the past two decades, as a consequence of the fiscal response to both the global financial crisis and the COVID-19 pandemic. This has been truer in the US and UK than in the euro area, which has seen a comparatively smaller rise in government net debt as a % of GDP since the early 2000s (Chart 13). In the US, the government debt-to-GDP is now nearly as high as it was at the end of the Second World War.
Chart 13
Chart 13 also highlights that the IMF is forecasting a reduction in government net debt as a share of GDP in the euro area over the coming 5 years, a modest rise in the UK, and larger rise in the US. Over a 30-year time horizon, the US government debt-to-GDP ratio is projected by the US Congressional Budget Office (CBO) to explode higher over the coming 30 years (Chart 14). Part of the CBO’s forecast of a catastrophic rise in government debt-to-GDP is due to projections of a persistent primary deficit that will grow over time. But it is also the case that the net interest component of the CBO’s projected deficit begins to rise significantly as a share of the total deficit at the start of the next decade. This rise in net interest payments occurs significantly because the CBO assumes that interest rates will eventually exceed the prevailing rate of economic growth due to crowding out effects (Chart 15). Chart 14The CBO's Long-Term Budget Outlook Is Dire...
The CBO's Long-Term Budget Outlook Is Dire...
The CBO's Long-Term Budget Outlook Is Dire...
Chart 15...Partially Because Of The CBO's Interest Rate Assumptions
...Partially Because Of The CBO's Interest Rate Assumptions
...Partially Because Of The CBO's Interest Rate Assumptions
We doubt that this will occur, at least not in the linear fashion the CBO is projecting. It is true that central banks only control the short-end of the yield curve (absent yield curve control policies), meaning that investors could force yields on long-maturity government bond yields to rise above the prevailing level of nominal growth. But in a world of scarce absolute returns, it is unlikely that investors will price long-maturity US government bonds with an elevated term premium until the US government’s debt service burden becomes extreme. Given that a significant portion of the US government’s debt is issued with a short maturity, that debt service burden is at least partially a function of the Fed’s decisions, not those of bond investors. Chart 16US Taxes Are Low, Contributing To Its Primary Deficit
US Taxes Are Low, Contributing To Its Primary Deficit
US Taxes Are Low, Contributing To Its Primary Deficit
An increase in real short-term interest rates over the coming several years might, ironically, be the best thing for US government debt sustainability over the long term, even though it would cause the US government’s debt service burden to rise. Ultimately, debt sustainability requires a balanced primary budget, and the structural US primary balance is heavily impacted by elevated medical costs and the fact that US government revenue as a share of GDP is considerably lower than in other countries (Chart 16). Given the political costs involved, primary balance reform in the US is unlikely to occur without some form of budgetary pressure from rising interest costs, and the longer the US government’s debt service burden remains low the longer that this reform is delayed. You asked about the timing of the endgame, and a potential tipping point may be when US government spending on net interest as a share of GDP exceeds the prior high reached in the early-1990s, which could occur as soon as 5 years from now were the Fed to raise interest rates towards the pace of nominal GDP growth.2Without such an increase, the US government’s debt burden will likely remain serviceable for decades, even without primary balance reform. Mr. X: I am happy that you referenced the Fed in your answer, because I wanted to address the question of central bank independence. Will elevated government debt prevent the Fed from raising rates if needed to control inflation? With the Fed projecting a very low Federal funds rate in the future, it seems like today’s central bankers may be incapable of acting as Volker did, should they need to do so. BCA: It is true that the Fed is projecting a very low average long-term Fed funds rate, but this projection is not due to political pressure or concerns about the US government’s future debt service burden. It reflects the Fed’s belief that the neutral rate of interest has fallen, based on the economic experience of the past decade, as well as the belief that an asymmetry exists in the economic costs of errors associated with estimating the neutral rate. On the latter point, the Fed believes that the cost of overestimating the neutral rate is likely to be higher than the cost of underestimating it, given the inability to cut interest rates meaningfully below zero. During our discussion last year, we noted that rising populism will make it very difficult for fiscal authorities to take preemptive action to address the US’s primary deficit, and it is possible that public opposition to normalized interest rates could cause the Fed to maintain easier monetary policy than is otherwise warranted – especially if the public perceives a link between Fed tightening and painful fiscal reform. However, our base case view remains that the Fed would resist these pressures, and would act in a way that the central bank felt was the best course of action to pursue its mandate. We would underscore that the risk of an overshoot in inflation from too-easy monetary policy does not require the Fed’s independence to become compromised. The Fed could be wrong in its assessment of the neutral rate of interest, and also wrong in its assessment of the costs of that error. Leaving the latter issue aside for now, there are good arguments in favor of the view that the neutral rate of interest is higher than the Fed currently believes. We can discuss those arguments in detail when we turn to the bond market outlook, but this does imply that inflation may be even more above the Fed’s target over the medium term than we believe will be the case next year. Ms. X: I have one last question related to inflation before we move on to your economic outlook. In terms of the usage of technology, the pandemic caused major behavioral changes to occur very quickly. Is it possible that we are on the cusp of a productivity boom, similar to what occurred during the 1990s, that will act to restrain inflation over the coming few years? BCA: It is possible that the pandemic has catalyzed some changes that will end up boosting productivity, given that many consumers, workers, and businesses were forced to embrace innovation quickly over the past 18 months. Governments have also made historic investments in both hard and soft infrastructure, including high-speed internet and renewable energy. But, for now, there is little evidence to support the idea that a major, technologically-driven productivity boom is occurring.
Chart 17
Chart 17 highlights that measured productivity has fallen outside of the US since the pandemic began, and the US surge is likely explained by three factors: labor market composition effects, the fact that US productivity normally rises during recessions, and the fact that US fiscal response was more forceful than elsewhere (boosting spending and output relative to the number of workers). The cyclical characteristics of US measured productivity were particularly evident in Q3, when output per hour of all employees fell by roughly 5% on an annualized basis. It is also the case that the pandemic has likely lowered potential output in some areas of the economy, particularly sectors related to office worker presence in central business districts. Even if employer plans for workers to return to the office prevail and office presence increases significantly in 2022, it is very likely that some work-from-home activity will permanently stick and that this will structurally increase the US unemployment rate.3 For now, our sense is that this increase will be modest, but the key point is that the rapid adoption of new technology and ways of working during the pandemic have not occurred without cost, and it is far from clear that this will be productivity-enhancing on a net basis. The ongoing, typical pace of technological development may help ease inflationary pressures over the longer-term, but investors should not yet conclude that the pandemic has accelerated this process. The Economic Outlook Chart 18On Average, We Expect Above-Trend Growth In The DM World Next Year
On Average, We Expect Above-Trend Growth In The DM World Next Year
On Average, We Expect Above-Trend Growth In The DM World Next Year
Ms. X: Thank you. I am not entirely sure that I am convinced, but I take your point that the productivity issue needs to be examined on a net basis. Let’s turn now to the outlook for growth next year. Starting first with developed markets, what do you expect in terms of the pace of economic growth, and how does that expectation differ from consensus market expectations? BCA: While we are less concerned about short-term inflation than most investors, we generally agree with consensus expectations for growth next year. Chart 18 shows that both official and private forecasts for real GDP growth in the US and euro area are well above trend, and that the US and euro area output gaps are likely to turn positive next year. In Q4 2021 and Q1 2022, it is possible that the Omicron variant will negatively impact economic growth. But assuming that the pandemic does recede in importance for the year as a whole, the basis for expecting above-trend growth in advanced economies next year is straightforward: we expect that monetary policy will remain extremely accommodative in the US and euro area, and will likely remain so even if the Fed begins to raise interest rates. In addition, the collapse in spending that occurred last year, arrayed against stable-to-higher income, has caused households to accumulate a massive amount of savings that will support consumption. Chart 19Households In The US And Europe Have Accumulated Excess Savings
Households In The US And Europe Have Accumulated Excess Savings
Households In The US And Europe Have Accumulated Excess Savings
Chart 19 highlights that this has occurred in both the US and the euro area. In the euro area, income was relatively stable, and spending has yet to fully recover – supporting the view that a catch-up in European consumption will boost euro area growth to above-trend levels. In the US, personal income rose during the pandemic, because the US government issued stimulus checks to Americans who did not lose their job. Some of these excess savings have been spent or used to pay down debt, but a sizeable portion remains to support spending. Chart 20 highlights that US household net worth has exploded higher over the past 7 quarters, by a magnitude that far exceeds any other instance since the Second World War. It is true that fiscal policy will subtract from growth in both the US and euro area next year, although it remains an open question how much drag will occur in the US. Chart 21 presents the Hutchins Center Fiscal Impact Measure from the Brookings Institution, which suggests that US fiscal drag will be significant in 2022. This measure does not include the recent infrastructure bill, or the Build Back Better plan. However, Chart 22 presents the IMF’s projections for the US and euro area cyclically-adjusted budget balance, which suggest meaningfully less drag next year for the US. Chart 20US Household Net Worth Has Surged
US Household Net Worth Has Surged
US Household Net Worth Has Surged
Chart 21
Chart 22
In the case of the euro area, Chart 22 highlights that the IMF is forecasting considerable fiscal drag next year, which seemingly contradicts optimistic expectations for euro area growth. There are two reasons to believe that euro area growth will be meaningfully above-trend in 2022, despite fiscal retrenchment. First, the IMF’s projected reduction in the euro area’s cyclically-adjusted primary deficit reflects the expiry of employment support programs such as the Kurzarbeit scheme in Germany, a social insurance program that incentivizes employers to reduce employee hours rather than laying off workers. The expiry of these types of programs is politically tied to a continued recovery in domestic consumption and further gains in service-sector employment, meaning that some of the fiscal drag projected in Chart 22 is necessarily linked to a growth impulse from the private sector. Certainly, these programs will be renewed or extended if the Omicron variant significantly weakens near-term economic growth in the euro area. Second, while the positive contribution to euro area growth from goods exports will likely wane over the coming year as spending in advanced economies shifts from goods to services, European services exports will eventually improve. Chart 23 highlights that the recovery in foreign tourist visits to the euro area is in its very early innings, and a normalization of tourist travel will eventually act as a significant contributor to income and employment growth in the region. According to the World Travel & Tourism Council, Europe was the third most impacted region globally from the decline in travel, after the Caribbean and Asia Pacific.4 It is clear that tourist travel will not pick up as long as Omicron-related travel bans are in effect, but Europe’s peak tourist season typically runs from June to August, which is beyond the range of time supposedly needed by vaccine manufacturers to produce Omicron-specific booster shots (should they be required). Chart 23European Tourism Will Eventually Recover, Adding To A Domestic Consumer Spending Tailwind
European Tourism Will Eventually Recover, Adding To A Domestic Consumer Spending Tailwind
European Tourism Will Eventually Recover, Adding To A Domestic Consumer Spending Tailwind
Mr. X: I would like to challenge you on your growth view. First, the economy was already slowing, and now there is a risk that the Omicron variant might slow at least some economic activity even further in the near term. You have stated that there will be some degree of fiscal drag next year, and that savings might be deployed to support spending – but might not. Should I not be concerned that growth might fall back to trend or even below it? BCA: The pandemic was economically unprecedented, and investors should thus be careful about what growth rates are used to characterize the pace of ongoing economic activity. For example, Chart 24 highlights that euro area real GDP growth is slowing on a year-over-year basis, but it accelerated fractionally on a sequential basis in Q3 and grew substantially above-trend. It should not be surprising that advanced economies are no longer reporting double-digit growth rates given the ongoing recovery from extremely depressed rates of economic activity last year. The question is whether growth will slow dramatically further, and whether at or below trend growth is likely on average next year. Prior to the discovery of the Omicron variant, investors had little reason to be concerned about significantly below trend growth in 2022. Forward-looking economic indicators were not pointing to this outcome; Chart 25 shows our global Nowcast indicator, a high-frequency measure of economic activity that is designed to predict global industrial production, alongside our global leading economic indicator. The chart shows that both the Nowcast and global leading economic indicator (LEI) are indeed declining, but that this decline is occurring from an extremely elevated level. It is therefore correct to say that the global economy is at an inflection point in terms of the pace of growth, but Chart 25 still points to above-trend growth – and certainly not to a major cyclical downturn. Chart 24Growth In DM Economies Is Slowing, But Remains Above-Trend
Growth In DM Economies Is Slowing, But Remains Above-Trend
Growth In DM Economies Is Slowing, But Remains Above-Trend
Chart 25Leading Indicators Continue To Point To Above-Trend Growth
Leading Indicators Continue To Point To Above-Trend Growth
Leading Indicators Continue To Point To Above-Trend Growth
The US economy did experience a very significant sequential slowdown in Q3, with activity having increased at only a trend rate. Chart 26 makes it clear that this occurred due to the impact of the semiconductor shortage on automotive production and the impact that the Delta wave of COVID-19 had on services spending. Real-time estimates for US growth in the fourth quarter are (for now) quite strong, and growth estimates for next year already likely incorporate the expectation of supply-side limitations. In fact, those expectations could surprise to the upside next year if these limitations ease more quickly than many investors currently expect, and if the Omicron variant turns out to be economically insignificant. If, however, the new variant does end up causing the return of lockdowns and other large-scale “NPIs” – especially in emerging market countries – the risk of further bottlenecks or an extension of existing supply-side problems will certainly rise.
Chart 26
Chart 27
Ms. X: Could you provide us some scenarios that combine your growth and inflation views, as well as the odds that you would assign to them? BCA: Certainly. Chart 27 presents our odds of three scenarios for global growth and inflation next year. We assign a 60% chance to above-trend growth and above-target inflation, a 30% chance to a “stagflation-lite” scenario of growth at or below potential and inflation well above target, a 10% chance of a recession. We describe the second scenario as “stagflation-lite” because true stagflation, as experienced in the late-1970s, involved a very elevated unemployment rate. Using the US Misery Index as real-time stagflation indicator for advanced economies (Chart 28), investors should note that true stagflation is not likely unless the unemployment rate rises. Despite the ongoing impact of component and labor shortages, there is no evidence yet of a contraction in goods-producing or service-producing jobs. For now, the impact of outright component shortages appears to be limited to the auto sector. Chart 28It's Not True Stagflation Unless The Unemployment Rate Rises
It's Not True Stagflation Unless The Unemployment Rate Rises
It's Not True Stagflation Unless The Unemployment Rate Rises
Even if goods-producing employment slows anew over the coming few months due to supply constraints, the unemployment rate is still likely to fall if services spending normalizes. This underscores the importance of services spending in advanced economies as a core driver of global economic activity over the coming year, given the ongoing weakness in several segments on China’s economy. Mr. X: My daughter and I have been closely watching China’s economy this year, and we have been getting increasingly concerned by the extent of the slowdown in activity there. Do you anticipate a pickup in Chinese growth in 2022? BCA: Yes, but a reacceleration in Chinese economic activity is more likely in the back half of next year than over the coming 6 months. There are three reasons for this. First, economic output in China will continue to be restrained over the coming months by the country’s ongoing energy crisis, which caused a sharp slowdown in electricity production in August (Chart 29). Production rebounded somewhat in September and October, but remained fairly weak. China’s energy crisis has occurred due to a combination of very strong electricity demand from the country’s manufacturing sector, as well as a significant reduction in coal emphasis, including coal imports from key producers that otherwise would have helped close the supply-demand gap (Chart 30). China’s coal stocks remain extremely low, underscoring that Chinese policymakers would not be capable of pushing through traditionally energy-intensive stimulus even if they were inclined to do so. Chart 29China's Energy Crisis Will Linger
China's Energy Crisis Will Linger
China's Energy Crisis Will Linger
Second, strong external demand is supporting Chinese manufacturing employment (Chart 31), so Chinese policymakers feel less of a sense of urgency to boost economic growth despite a significant slowdown in China’s credit impulse and the ongoing slowdown in real-estate activity. Social stability will always remain the paramount objective of Chinese policymakers, and we fully expect a policy response if economic growth slows to the point that it impacts employment. Chart 30China's Energy Crisis: Strong Power Demand, Constrained Coal Supply
China's Energy Crisis: Strong Power Demand, Constrained Coal Supply
China's Energy Crisis: Strong Power Demand, Constrained Coal Supply
Chart 31Strong External Demand Is Supporting Chinese Employment
Strong External Demand Is Supporting Chinese Employment
Strong External Demand Is Supporting Chinese Employment
But because of the extreme rise in private-sector debt that has accumulated in China over the past decade, Chinese policymakers now perceive a tradeoff between economic growth and additional leveraging. This implies that the timing and magnitude of reflationary efforts from China’s policymakers are likely to be carefully calibrated to avoid a dramatic overshoot of credit growth, in line with what occurred in 2018 and 2019. In fact, while many investors regard China’s policy response during that time as having been too timid, within China many commentators have lauded it as an example of finely balanced decision-making. Third, China’s zero-tolerance COVID policy will likely remain in effect at least until the Beijing Olympics in February, and potentially until the 20th National Party Congress in October. The potential risk from the Omicron variant will only reinforce the resolve of Chinese policymakers on this issue, which implies that Chinese consumption and services activity could follow a stop-and-go pattern over the coming 6 months. Chinese policymakers are likely aware that a zero-tolerance policy towards COVID is ultimately unsustainable, but we expect policymakers to react aggressively towards outbreaks next year in advance of these two major events. Ms. X: It sounds like Chinese policymakers do not want to stimulate at all. Why is a reacceleration in activity even likely? BCA: We expect further easing from Chinese policymakers next year because the strong demand for Chinese goods that is currently supporting employment is likely to slowly wane over the coming several months. Chinese export volume has been very closely tied to US real goods consumption over the past year (Chart 32), which, as we noted earlier, is 9.8% above the level implied by its pre-pandemic trend. A likely decline in US goods spending from current levels, even if it remains above trend, suggests that Chinese manufacturing employment will not be as strong on average next year as is currently the case. Chart 33 highlights the extent of the weakness in China’s credit impulse and its real estate sector, underscoring that China is currently a “one-legged” economy that is supported by manufacturing. Chart 32China's Exports And US Goods Spending Are Closely Linked
China's Exports And US Goods Spending Are Closely Linked
China's Exports And US Goods Spending Are Closely Linked
Chart 33China's Economy Is Now Entirely Supported By External Demand
China's Economy Is Now Entirely Supported By External Demand
China's Economy Is Now Entirely Supported By External Demand
In addition, for political reasons, policymakers in China are very likely to want stable-to-improving economic conditions in the lead up to the National Party Congress in October. Given the lags between the implementation of stimulus and its effect on the economy, this points to further easing and/or outright stimulus in Q1 or Q2, and a reacceleration in economic activity in the latter half of the year. Chart 34Inflation Expectations, Not Real Rates, Have Been Driving The Bond Market
Inflation Expectations, Not Real Rates, Have Been Driving The Bond Market
Inflation Expectations, Not Real Rates, Have Been Driving The Bond Market
Ms. X: Let’s turn now to monetary policy. You mentioned that monetary policy will remain very easy next year, but investors have moved to price between one and two interest rate hikes from the Federal Reserve in 2022. Do you agree with the market’s assessment? BCA: Our base case view is that investors are now overly hawkish and that an initial rate hike will most likely occur only in September or December 2022 – despite a seemingly hawkish pivot from the Fed. It is important to note that investors have moved up their expectations for rate hikes next year entirely in response to elevated inflation. Chart 34 highlights that the sharp increase in the US 2-year Treasury yield over the past few months has occurred alongside a decline in the real 2-year yield, underscoring that investors believe that inflation will force the Fed to raise interest rates earlier than it currently expects. We expect the pressure on prices to wane next year rather than intensify, meaning that rate-hike bets have likely been driven by the wrong factor. A dangerous rise in long-dated inflation expectations would change our view and validate market pricing. But, as we noted above, this has not yet occurred despite very elevated inflation this year and expectations of elevated inflation next year. This underscores that economic agents view the current pace of inflation as strongly linked to the pandemic, and thus see it as a temporary phenomenon. Table 2The Fed’s Liftoff Criteria
OUTLOOK 2022: Peak Inflation – Or Just Getting Started?
OUTLOOK 2022: Peak Inflation – Or Just Getting Started?
Table 2 presents the three factors that will determine when the Fed decides to lift rates, based on the Fed’s official forward guidance. The two inflation-related criteria are currently checked, but the remaining labor market criterion is not checked. The Fed has officially pledged not to lift rates until “maximum employment” is reached, although that pledge may change in December. Still, we expect that progress towards “maximum employment” will influence the timing of the first rate hike unless there are no signs of easing inflation over the next several months. Our sense is that an unemployment rate close to 3.8% and a working-age participation rate close to its pre-pandemic level will be required to check the third box shown in Table 2. Chart 35The Working-Age Participation Rate Still Has Further To Rise
The Working-Age Participation Rate Still Has Further To Rise
The Working-Age Participation Rate Still Has Further To Rise
Importantly, it is not clear that these factors will be in place before September next year. Chart 35 highlights that while the working-age participation rate has moved back closer to its pre-pandemic level, it still has further to go. If the rate increases at the pace that occurred in the first half of this year, it would not return to its pre-pandemic level until August/September at the earliest, which would certainly narrow the window for two rate hikes next year. The bar for the Fed’s unemployment rate criterion is also high enough that betting on two rate hikes next year appears excessive. Table 3 presents the average monthly jobs growth needed to reach an unemployment rate of 3.8% at different points over the next year. This highlights that a meaningful and sustained acceleration in jobs growth is required for the Fed to raise interest rates in July. Table 3Calculating The Time To Maximum Employment
OUTLOOK 2022: Peak Inflation – Or Just Getting Started?
OUTLOOK 2022: Peak Inflation – Or Just Getting Started?
Mr. X: But these projections are based on the overall participation rate, and we have seen a surge in retirements during the pandemic. Doesn’t that mean that the unemployment rate will fall faster than the Fed currently expects, and that investors are right to move up their rate hike expectations? BCA: We have seen a huge increase in the number of retirees, and you are correct that a more rapid reduction in the unemployment rate could occur if pandemic retirements turn out to be “sticky”. However, we would point to two facts that suggest at least a portion of the surge in retirements will reverse. Chart 36Retirements Have Significantly Overshot Their Demographic Trend
Retirements Have Significantly Overshot Their Demographic Trend
Retirements Have Significantly Overshot Their Demographic Trend
First, the surge in retirement during the pandemic is more than what would be implied by underlying demographic trends. Chart 36 shows that while the share of the US population that is retired has been steadily rising, it is now significantly above its 2010-2019 trend. Second, a recent study from the Kansas City Fed suggests that the non-demographic component of the recent surge in retirements has mainly been driven by a decline in the number of retirees rejoining the labor force,5 a phenomenon that we would expect to reverse as the pandemic abates. If the Omicron variant turns out to be threatening to the health of the older population even if they have been vaccinated, then we would not expect retiree reentry into the labor force until variant-specific booster shots are available. Chart 37Investors Expect The ECB To Lag The Fed, And We Agree
Investors Expect The ECB To Lag The Fed, And We Agree
Investors Expect The ECB To Lag The Fed, And We Agree
Uncertainty over the status of retired workers is why we believe the Fed will focus on the working-age participation rate in judging whether the labor market has returned to a state of maximum employment. If the unemployment rate falls more quickly than expected because of a retiree-effect on the overall participation rate, the Fed will then turn to the working-age participation rate to judge the extent of labor market slack. It is only if non-supply driven wage growth is excessive and/or long-dated inflation expectations move sharply higher that the Fed will move in line with current market pricing. Mr. X: What about the ECB? Do you expect any monetary policy tightening in the euro area in 2022? BCA: Chart 37 highlights that investors had previously been expecting the ECB to raise interest rates once next year, lagging the Fed by roughly one rate hike. These expectations have been dialed back recently in response to the COVID situation in Europe as well as the news about Omicron. Chart 38Euro Area Inflation Is Not Broad-Based
Euro Area Inflation Is Not Broad-Based
Euro Area Inflation Is Not Broad-Based
We agree that the ECB will raise rates after the Fed does, but we do not think that a euro area rate hike will occur next year – even once the pandemic situation improves. As is the case for the Fed, investors had been expecting that the ECB will be forced to respond to very elevated inflation. But Chart 38 highlights that euro area core inflation is barely above 2%, and panel 2 makes it clear that the rise in core euro area prices is not broad-based. This underscores that much of the rise in euro area prices is driven by commodities and problems with the global supply chain, neither of which will be fixed by higher euro area interest rates. As such, we agreed with ECB President Christine Lagarde’s pushback against market expectations for a rate hike next year, barring a much faster labor market recovery in advanced economies than we currently expect. Bond Market Prospects Mr. X: Thank you. Our monetary policy discussion serves as an excellent segue to the bond market outlook, and a question that I have been eager to pose to you. I find it astounding that long-maturity government bond yields remained so low this year given the longer-term inflationary risk, and given recent bets that central banks would be forced to move earlier than they had previously anticipated. Even if those bets unwind as a result of Omicron, I would like an explanation of what kept bond yields so low this year. In particular, I would like you to share your thoughts about what could cause bond yields to eventually react to the potential for higher inflation? Chart 39Investors, And The Fed, Continue To Subscribe To The Secular Stagnation Narrative
Investors, And The Fed, Continue To Subscribe To The Secular Stagnation Narrative
Investors, And The Fed, Continue To Subscribe To The Secular Stagnation Narrative
BCA: The behavior of long-maturity government bonds this year reflects the view of both the Fed and market participants that the neutral rate of interest (“R-star”) remains very low relative to the potential growth rate of the economy (Chart 39). According to the Federal Reserve’s Statement on Longer Run Goals And Monetary Policy Strategy, the FOMC “judges that the level of the federal funds rate consistent with maximum employment and price stability over the longer run has declined relative to its historical average.” Bond investors agree with the Fed’s view, bolstered by previously low academic estimates of the neutral rate of interest such as those presented by the Laubach-Williams model. We agree that R-star fell in the US for a time following the Global Financial Crisis (GFC), but it is far from clear that it remains as low as the Fed and investors believe. The neutral rate of interest fell during the first half of the last economic cycle because of a persistent period of household deleveraging and balance-sheet repair, which was a multi-year consequence of the financial crisis and the insufficient fiscal response to the 2008-09 recession. Academic estimates of R-star are misleading,6 and it is clear that US household balance sheets are now in a much better state than they were in the lead-up to the GFC. Debt to disposable income for US households has fallen back to 2001 levels (Chart 40), the ratio of total liabilities to net worth has fallen meaningfully for most income categories (panel 2), and the household debt service ratio is now the lowest it has been since the 1970s (Chart 41), underscoring the capacity of US consumers to withstand higher interest rates. It is true that the US corporate sector leveraged itself over the course of the last economic cycle, but at least some of this increase in debt has served to fund capital structure changes, rather than the accumulation of a large stock of “deadweight” excess capacity. Chart 40US Household Balance Sheets Are In Far Better Shape Than They Used To Be
US Household Balance Sheets Are In Far Better Shape Than They Used To Be
US Household Balance Sheets Are In Far Better Shape Than They Used To Be
Chart 41The US Household Debt Service Burden Is At A 40-Year Low
The US Household Debt Service Burden Is At A 40-Year Low
The US Household Debt Service Burden Is At A 40-Year Low
Investors should certainly be on the lookout for signs that market expectations for “R-star” are rising, but it is not probable that this will occur before the Fed begins to normalize monetary policy. This means that the bond market outlook over the coming year is dependent on the market’s assessment of the timing and pace of Fed rate hikes. Ms. X: You noted earlier that you disagree with the bond market’s outlook for US rate hikes next year. What are the fixed-income portfolio implications of that view? BCA: It is possible that the Fed may begin raising interest rates as early as next summer, but this is only likely to occur if jobs growth meaningfully accelerates, the surge in net retirements during the pandemic is durably sticky (beyond any potential impact from the Omicron variant), or long-dated inflation expectations become unanchored. It is not likely to occur simply because actual inflation, driven significantly by supply-side factors, is elevated. Chart 42A Moderate Rise In US Long-Maturity Bond Yields Next Year
A Moderate Rise In US Long-Maturity Bond Yields Next Year
A Moderate Rise In US Long-Maturity Bond Yields Next Year
For short-maturity bonds, the investment implications of this view are more focused on the real versus inflation components of yields, rather than the existence of major mispricing of 2-year Treasury yields. US government bond yields have risen both at the short- and long-end due to rising inflation expectations, and real yields have fallen. We expect a more significant rise in real than nominal yields over the coming year. As such, investors should sell 2-year inflation protection, which is currently pricing too tepid of a deceleration in the pace of advance of consumer prices. For 10-year US Treasurys, we expect that yields will rise to between 2-2.25% over the coming year, as the Fed moves towards eventual rate hikes. Chart 42 presents FOMC-implied fair value estimates for the 2-, 5-, and 10-year Treasury yield, and underscores that bond yields are set to moderately rise next year. We are uncomfortable with the Fed’s projection of a permanently lower neutral rate of interest, but we see no evidence yet that surging inflation is changing the market’s assessment of the long-run average Fed funds rate. So for now, we recommend that fixed-income investors maintain a short-duration stance, but we do not expect a very severe rise in yields at the long-end of the curve next year. Ms. X: And what positioning would you recommend within a global fixed-income portfolio? BCA: The likely sequencing of central bank rate hikes over the coming 12-18 months suggests that global fixed-income investors should maintain an underweight stance towards US, UK, Canada, and New Zealand, and an overweight stance towards Japan, Europe, and Australia. Among our overweight recommendations, our view that the ECB will lag the Fed makes a clear case to be overweight euro area versus US bonds (both core and periphery), and Chart 43 highlights that rising US bond yields have been strongly correlated with the outperformance of euro area government bonds in US$ hedged terms over the past five years. For Japan, long-maturity JGB yields are likely to remain flat over the next year as they have been since 2016, underscoring that our allocation to JGBs is a strict function of our global duration call (with a short duration stance favoring Japan). In Australia, expectations for monetary policy have turned aggressively hawkish over the past month, with markets now discounting multiple rate hikes next year. While there is a growing case for the RBA to tighten, there are still enough lingering uncertainties about the trajectory for growth and inflation for the RBA to credibly remain on the sidelines next year. As such, we recommend that investors fade the aggressive 2022 rate hike profile discounted in Australian interest rate markets by staying overweight Australian government bonds in global bond portfolios. Among our underweight recommendations, the fact that the BOE is likely to be the next major developed economy central bank to raise interest rates supports a reduced allocation to UK government bonds. Relative to global government bonds, long-dated gilts have recovered somewhat from their earlier selloff in anticipation of a rate hike in early November, but we expect renewed underperformance in 2022. Unlike in the US, long-dated UK inflation expectations are meaningfully above their average of the past 15 years (Chart 44), which is motivating the BOE’s hawkishness. In Canada, the labor market has fully recovered the jobs lost during the pandemic, and the BOC has grown very concerned about the housing market and the potential for low interest rates to further inflate an already excessive amount of household sector debt. We expect a first rate hike from the BOC in the first half of 2022. Chart 43Rising US Treasury Yields Translates To Hedged Euro Area Government Bond Outperformance
Rising US Treasury Yields Translates To Hedged Euro Area Government Bond Outperformance
Rising US Treasury Yields Translates To Hedged Euro Area Government Bond Outperformance
Chart 44UK Long-Term Inflation Expectations Are Not Contained
UK Long-Term Inflation Expectations Are Not Contained
UK Long-Term Inflation Expectations Are Not Contained
Finally, a rate hike cycle has already begun in New Zealand, which also has an important link to the housing market. The New Zealand government has altered the remit of the Reserve Bank of New Zealand (RBNZ) to more explicitly factor in the impact of monetary policy on housing costs, suggesting that the RBNZ will prove to be one of the most hawkish central banks in the developed world over the next couple of years as the central bank attempts to cool off housing demand. Chart 45Speculative-Grade Corporate Bonds Offer Better Value
Speculative-Grade Corporate Bonds Offer Better Value
Speculative-Grade Corporate Bonds Offer Better Value
Ms. X: Given the reality of low government bond yields globally, corporate credit has become an increasingly important part of our fixed-income portfolio. My father and I have noticed that corporate bond spreads are very low; should we be making any changes to our allocation to corporate credit? The combination of above-trend economic growth and accommodative monetary policy provides strong support for corporate bond spreads. However, US investment-grade corporate bonds offer essentially no value, and we advise investors to seek out higher returns in speculative-grade corporates. The 12-month breakeven spread for US investment-grade bonds is currently at its 2nd historical percentile (Chart 45), and we currently expect excess returns for IG corporates versus duration-matched Treasuries to be capped at 85 bps. For US high-yield bonds, we recommend an overweight stance within a fixed-income portfolio. We estimate that spreads are currently pricing an expected default rate of 3.1%, assuming a 100 bps risk premium and a 40% recovery rate on defaulted debt. Based on gross corporate leverage (pre-tax profits over total debt) and C&I lending standards, we model that the 12-month default rate will stay between 2.3% and 2.8% next year, below what the market currently discounts. Notably, the corporate default rate is tracking at an annualized rate of roughly 1.7% through the first ten months of this year, well below the estimate generated by our model. The accommodative monetary backdrop provided by the Fed will start to shift at some point in 2022. For now, an elevated 2/10 Treasury slope 85-90 bps suggests that monetary conditions are still accommodative, and our prior work suggests that corporate bond returns are typically strong when the slope is above 50 bps. But when the slope breaks below 50 bps, which could happen as soon as the first half of 2022, we will likely turn more defensive on corporate bonds. A flatter curve suggests a more neutral monetary backdrop, and with valuations already tight it will make sense to take some money off the table. The shifting US monetary policy backdrop leads us to favor European high-yield over US equivalents, as the ECB will be more dovish than the Fed next year. From a fundamental perspective, default rates are projected to be a bit lower in Europe in 2022 (around 2%) compared to the US, in an environment of solid nominal corporate revenue growth and still-moderate borrowing rates. Although valuations are hardly cheap on either side of the Atlantic, we do see better relative value in Ba-rated European junk bonds over similarly rated US credits. 12-month breakeven spreads for European Ba-rated high-yield are in the 38th percentile of its historical distribution, while US Ba-rated junk sits in the 24th percentile. Equity Market Outlook Mr. X: Thank you for your bond market comments. My view that bond yields have potentially much further to rise over the coming few years suggests that we will earn very little in the way of returns from our fixed-income portfolio, but the equity market outlook is no better. In fact, the medium-to-long term equity outlook is probably the worst that I have seen in a long time. Next year’s outlook is arguably bad as well; equity valuation is extreme, and you are forecasting a rise in long-maturity bond yields next year. In addition, you acknowledge that the longer-term term risks of inflation have risen, and believe that the Fed and investors are underestimating the neutral rate of interest. All of that seems wildly bearish to me! Chart 46US Revenue Growth Will Be Stout In 2022...
US Revenue Growth Will Be Stout In 2022...
US Revenue Growth Will Be Stout In 2022...
BCA: Let’s address the longer-term outlook for stocks in a moment, and for now focus on what is likely to occur next year. Since the US equity market now accounts for 60% of global stock market capitalization, we will outline our US equity views first before turning to the rest of the world. The starting point for any cyclical view of the stock market should be one’s earnings outlook, and based on our economic view we agree with analyst expectations that US revenue growth will remain elevated next year relative to what has prevailed on average over the past decade (Chart 46). Above-trend growth and consumer price inflation point to revenue growth in the high single-digits, and this would normally serve as a conservative estimate for earnings growth given that profit margins have been trending higher since the beginning of the 2009 economic recovery. However, US profit margins have already risen to a new high both for the tech sector (broadly-defined) and ex-tech (Chart 47), and there are credible arguments in favor of an outright contraction in margins over the coming year.7 As such, we expect earnings growth to come in at or below revenue growth, which is currently expected to be about 7% next year. You referenced extreme overvaluation of the equity market, and Chart 48 highlights that the S&P 500 12-month forward P/E ratio is indeed now as high as it was during the stock market bubble of the late-1990s. But panel 2 of Chart 48 highlights that our proxy for the US equity risk premium (ERP) is in line with its historical average, in stark contrast to the lows that were reached in the late-1990s. Chart 47...But Profit Margins Are Extremely Elevated And May Fall
...But Profit Margins Are Extremely Elevated And May Fall
...But Profit Margins Are Extremely Elevated And May Fall
Chart 48US Equity Multiples Are Extremely High, But The ERP Is Normal
US Equity Multiples Are Extremely High, But The ERP Is Normal
US Equity Multiples Are Extremely High, But The ERP Is Normal
Chart 49Equity Multiples Are High Because Interest Rates Are Extremely Low
Equity Multiples Are High Because Interest Rates Are Extremely Low
Equity Multiples Are High Because Interest Rates Are Extremely Low
These seemingly contradictory perspectives are resolved by the observation that real bond yields are extremely low today. It is reasonable to expect a structural decline in real bond yields over time given a structural decline in the potential growth rate of the economy, but Chart 49 highlights that real long-maturity yields are already substantially lower than estimates of trend growth. If we believed that real US government bond yields were set to rise by 200 basis points over the coming year, we would be categorically bearish towards stocks as it would imply a substantially lower P/E ratio. That, however, is very unlikely to occur while the Fed and investors subscribe to the secular stagnation narrative. While R-star is probably higher than the Fed and investors think, we do not think that these expectations will change before the Fed begins to normalize monetary policy. As such, while equity multiples may fall over the coming year in response to somewhat higher bond yields, we expect the decline to be relatively modest. Putting this all together, given our base case view that the pandemic will recede in importance next year, we expect mid-to-high single-digit returns from US equities in 2022 – the net result of robust revenue growth and some return compression from profit margins and equity multiples. Mr. X: You showed the equity risk premium over the past 40 years, which was a period of rising financialization. Given the complacency that I see in markets, especially about the longer-term outlook, I strongly question the view that investors are demanding a normal premium as compensation for potential future volatility. Do your conclusions hold up if you use a much longer time horizon? BCA: They do. Chart 50 shows a long-history estimate of the US equity risk premium based on Robert Shiller’s Irrational Exuberance dataset. This indicates that the ERP today is in line with its long-term median. We do not use the cyclically-adjusted P/E ratio in this calculation; Chart 50 is simply calculated as the 12-month trailing reported earnings yield minus the real long-maturity bond yield. The chart shows that the ERP was quite low in the late-1990s, and above average for several years following the Global Financial Crisis. The conclusion is that while the US P/E ratio is extremely high today, it is so for a very different reason than what occurred in the late-1990s. At that time, the equity risk premium was extremely low, whereas today equity multiples are high because of very low interest rates. You asked about the longer-term outlook for stocks, and Chart 51 presents a range of possible 10-year total returns for US equities, based on a 100-200bps rise in real long-maturity bond yields and revenue growth on the order of 4-5% per year. These scenarios also assume flat profit margins, a constant 2% dividend yield, and a constant ERP. Chart 50The US Equity Risk Premium Is Normal Even Based On 150 Years Of History
The US Equity Risk Premium Is Normal Even Based On 150 Years Of History
The US Equity Risk Premium Is Normal Even Based On 150 Years Of History
Chart 51
These returns projections, on the order of 2-5% per year, would beat the returns offered by bonds and thus argue that investors should still be structurally overweight equities versus fixed-income assets. But they would also fall short of the absolute return goals of many investors, and thus we agree that the longer-term outlook for stocks is poor – unless the ERP falls dramatically as real interest rates rise. That would be calling for a return to the ebullient conditions of the late-1990s, and we struggle to envision how this could occur given the myriad economic and geopolitical risks today that did not exist at that time. Ms. X: I want to address the two important global equity calls that did not pan out quite how you expected when we spoke last year: regional equity allocation and value versus growth. What is your view about these positions in 2022? BCA: Financials did modestly outperform broadly-defined technology stocks in 2021, so elements of the value versus growth trade did pan out. But using the MSCI value and growth indexes as benchmarks, value did underperform, and the relative performance of global value versus growth this year has been strongly linked to the 30-year Treasury yield. This has not always been the case in the past, but this year very long-maturity bond yields have done a very good job at explaining the relative performance of value (Chart 52). In addition, Chart 53 highlights the strong correlation between the relative performance of the US equity market and the relative performance of growth since the onset of the pandemic, which is explained by the US’s comparatively large weighting in broadly-defined technology stocks. Chart 52Global Value Versus Growth Is Strongly Correlated With Interest Rates
Global Value Versus Growth Is Strongly Correlated With Interest Rates
Global Value Versus Growth Is Strongly Correlated With Interest Rates
Chart 53Growth / Value Is Impacting Regional Equity Performance Trends
Growth / Value Is Impacting Regional Equity Performance Trends
Growth / Value Is Impacting Regional Equity Performance Trends
Given our view that long-maturity bond yields are set to rise next year, we find it difficult to bet against value in 2022. At a minimum, a window exists for value’s outperformance, and we do recommend that investors overweight value versus growth next year. Considerable debate exists within BCA about the longer-term outlook for the trend in style, but for next year the majority of BCA strategists expect value to outperform at least for a time. Ms. X: And what about the performance of US stocks versus the rest of the world? BCA: The close link between growth / value and US / global ex-US stocks over the past two years suggests that the US will underperform at some point in 2022 relative to its global peers, although we acknowledge that this case is harder to make. The US did underperform global ex-US in the first quarter of 2021, and again from April to June, but the underperformance eventually gave way to substantial US outperformance. By contrast, the outperformance of global value vs. growth was more sustained in the first half of the year, and the reversal of that performance has been more closely aligned with the trend in bond yields. Our best answer as a firm is that investors should maintain a neutral allocation to the US versus global ex-US for now, with a bias towards increasing exposure to global ex-US at some point next year. Roughly 70% of global ex-US equity market cap is accounted for by DM economies, with the remaining 30% in emerging markets. Given our China economic view, it is difficult to make the case for EM stocks in the first half of 2022. We see more significant easing in China, potentially in Q2, is the most likely upgrade catalyst for EM. Within DM ex-US, the euro area is the most significant region by weight, and there are two arguments in favor of euro area outperformance at some point next year. First, Chart 54 highlights that euro area earnings have more post-pandemic catchup potential than US stocks, suggesting that the US may not fundamentally outperform other DM economies in 2022. Second, Chart 55 highlights that euro area stocks are the cheapest that they have been relative to the US since early-2009 and 2012. In both of these cases, the euro area subsequently outperformed US stocks. Chart 54Euro Area Earnings Have More Catch-Up Potential
Euro Area Earnings Have More Catch-Up Potential
Euro Area Earnings Have More Catch-Up Potential
Chart 55Euro Area Stocks Are Extremely Cheap, And Have Rallied From Similar Valuation Levels
Euro Area Stocks Are Extremely Cheap, And Have Rallied From Similar Valuation Levels
Euro Area Stocks Are Extremely Cheap, And Have Rallied From Similar Valuation Levels
As an additional point about richly valued US equities, it has been argued that a premium is warranted for US stocks given their comparatively high return on equity. But Chart 56 illustrates that this is not the case. The chart shows the relative price-to-book ratio for the US versus developed markets ex-US compared with regression-based predicted values based on relative return on equity. The chart clearly highlights that the US price-to-book ratio is meaningfully higher than it should be relative to other developed markets, underscoring that US stocks are expensive above and beyond what fundamental performance appears to justify. That perspective is echoed in Chart 57, which highlights that the US 12-month forward P/E ratio is 50% above that for global ex-US stocks. Chart 56The Premium Paid For US Stocks Is Not Justified By Higher Return On Equity
The Premium Paid For US Stocks Is Not Justified By Higher Return On Equity
The Premium Paid For US Stocks Is Not Justified By Higher Return On Equity
Chart 57US Stocks Are Extremely Expensive, No Matter How You Slice It
US Stocks Are Extremely Expensive, No Matter How You Slice It
US Stocks Are Extremely Expensive, No Matter How You Slice It
Given the news about Omicron, and the recent spike in COVID cases and natural gas prices in the euro area, it may be too early to position in favor of DM ex-US stocks versus the US. But a shift from US to global ex-US stocks should be on investors’ watch list for 2022. Chart 58Industrials Are Likely To Outperform Next Year
Industrials Are Likely To Outperform Next Year
Industrials Are Likely To Outperform Next Year
Mr. X: What about sector positioning, and small caps? BCA: Cyclical sectors have significantly outperformed defensives this year, and we expect further outperformance in 2022. Defensive sectors tend to underperform when bond yields are rising, and we expect that certain cyclical industries will continue to outperform next year. In particular, banks tend to outperform the broad market when interest rates are rising, pent-up demand will boost the consumer services and automobile industries within consumer discretionary, and industrials will continue to benefit from the surge in capital expenditures, as evidenced by the sharp increase in US core capital goods orders (Chart 58). Resource stocks, on the other hand, may not meaningfully outperform in 2022, at least not consistently. We will discuss our commodity views in a moment, but we expect flat oil prices next year, and our views on China imply that metals and mining stocks may at least passively underperform in the first half of the year. While we generally favor cyclical sectors next year, Chart 59 highlights that the trend in the performance of cyclicals versus defensives (shown in equally-weighted terms) has moved well past its pre-pandemic level, and is now challenging its early-2018 high. Cyclicals have further room to move higher when compared with the levels that prevailed in 2010-2011, but that period reflected resource price levels that we do not expect over the coming year. As such, the performance of cyclicals is getting somewhat late, and we expect to rotate away from cyclical sectors at some point over the coming year. In terms of capitalization, Chart 60 highlights that investors should favor small cap stocks versus large caps over the coming year. The chart highlights that the relative performance of global small caps had rebounded to its pre-trade war levels earlier this year, before falling anew in response to the economic consequences of the Delta wave of COVID-19 and the decline in government bond yields. Abstracting from longer-term trends, small cap stocks tend to outperform large caps over 1-year periods when bond yields are rising, and this has been especially true over the past decade (middle panel). Chart 59Cyclicals Have Some Room To Move Higher Versus Defensives, But Not Much
Cyclicals Have Some Room To Move Higher Versus Defensives, But Not Much
Cyclicals Have Some Room To Move Higher Versus Defensives, But Not Much
Chart 60Favor Small Caps Over Large Caps In 2022
Favor Small Caps Over Large Caps In 2022
Favor Small Caps Over Large Caps In 2022
Our view that government bond yields are set to rise next year, in combination with very attractive relative valuation (bottom panel), makes an overweight small cap stance one of our highest conviction positions with an equity allocation. Currencies And Commodities Mr. X: You mentioned earlier that you expect oil prices to be essentially unchanged next year from the levels that prevailed prior to the discovery of the Omicron variant. I would appreciate it if you could provide the basis for that view, and also your perspective on natural gas prices given how significantly that market is affecting the European economy. Chart 61We Expect Oil To Trade At -81/Bbl Next Year, On Average
We Expect Oil To Trade At $80-81/Bbl Next Year, On Average
We Expect Oil To Trade At $80-81/Bbl Next Year, On Average
BCA: Let’s deal first with crude oil prices. First, it should be noted that we will not have good information on Omicron’s impact on oil demand for a few more weeks, which makes it difficult to assess demand for next year as a whole. Prior to this news, our ensemble supply and demand estimates for crude oil projected an increase in supply from core OPEC 2.0 producers in 2022, on target to return to pre-pandemic levels around the middle of the year. Production from non-core OPEC producers will likely be flat to modestly down, consistent with the downward trend that has been in place over the past decade. On the demand side, our base case view suggests flat-to-modestly higher consumption growth in the DM world, and a pickup in non-OECD demand around the middle or back half of the year. Chart 61 highlights that the net result of these forecasts implies that brent oil prices will average around $80-81/bbl next year, essentially flat from pre-Omicron levels. Geopolitical tension with Iran will most likely persist next year, which contributes to upside risk to our forecast. Clearly, Omicron contributes to downside risk. The fact that spot oil prices are likely to be flat next year does not mean that investors cannot profit from energy-related positions. Chart 61 also highlighted that the oil market is currently backwardated, with a downward sloping forward curve that is below our projected spot price for most of 2022. This means that investors can still profit from the roll yield, and we are comfortable recommending the pursuit of a dynamic roll strategy focused on energy contracts (such as the COMT ETF). On the natural gas front, we expect that spot prices will remain elevated through the winter, especially in Europe. The US Climate Prediction Center maintains 90% odds that La Niña will continue through the winter in the Northern Hemisphere, implying a colder-than-normal winter and thus higher-than-normal natural gas demand. Russia’s restriction of supply for geopolitical advantage can continue well in 2022. Chart 62 highlights that European natural gas storage is well below that of previous years, which has contributed to the almost 400% rise in prices this year. European natural gas prices are rising in part due to competition from China because of its power shortage, and are likely to remain high through the winter. Aside from higher-than-average temperatures through the winter months, a reduction in US import demand is the most likely catalyst for lower natgas prices in Europe. The Nord Stream 2 pipeline is unlikely to begin operations early enough to provide relief in H1 2022, although it is possible. Ms. X: One question that I have about the commodity outlook pertains to China. We discussed earlier how China’s economy has slowed this year, and yet metals prices remain in an uptrend. That seems like an aberration, and we would appreciate your thoughts on what is driving the disconnect. BCA: The behavior of industrials metals prices has indeed been confusing for many investors given the slowdown in Chinese economic activity, as evidenced by Chart 63. The annual growth rate of the Bloomberg Industrial Metals Spot Index remains surprisingly elevated given slowing economic activity in China and a meaningful decline in China’s credit impulse.
Chart 62
Chart 63Metals Prices Are Seemingly Too High Given A Slowing Chinese Economy
Metals Prices Are Seemingly Too High Given A Slowing Chinese Economy
Metals Prices Are Seemingly Too High Given A Slowing Chinese Economy
What is missing from this picture is the fact that base metals inventories are very low, due in part to reduced refining activity in China. Charts 64 and 65 present two perspectives on copper inventories: the difference between global production and consumption of refined copper, and the level of warehouse and stock inventories tied to commodity exchanges. Both charts show that inventories have been drawn down heavily this year. Chart 64Global Metals Inventories Have Been Drawing Heavily This Year…
Global Metals Inventories Have Been Drawing Heavily This Year...
Global Metals Inventories Have Been Drawing Heavily This Year...
Chart 65…And Exchange Inventories Are Very Low
...And Exchange Inventories Are Very Low
...And Exchange Inventories Are Very Low
Our expectation that China is likely to slow further over the coming few months arrayed against low metals inventories suggests that the Q1 outlook for metals prices is murky. But as we noted earlier, we expect a reacceleration in Chinese economic activity in the back half of 2022, implying that base metals prices are likely to be higher in 2022 on average. Over a multi-year horizon, we are quite bullish towards base metals – copper in particular – given the critical role that these metals will play in the push to decarbonize the global economy.8 Base metals capex will have to increase at the mining and refining levels to meet renewables and EV demand, and policymakers will need to work towards diversifying metals' production and refining to reduce the concentration risks that currently exist. We strongly suspect that higher prices will have a role in incentivizing higher base metals production, meaning that longer-term investors should follow a “buy copper on dips” strategy. Mr. X: You noted at the outset that gold fell in nominal terms this year, which was surprising to me. My expectation is that gold would have performed better than it did during a year with the strongest inflation in three decades. You referenced the dollar and real interest rates as drivers of the price of gold; please elaborate on that if you can, and what you expect to see from gold in 2022. BCA: It is not particularly surprising to us that the price of gold has fallen this year in the face of surging inflation. We agree that precious metals are a good hedge against inflation over the very long term, but over the cyclical investment horizon the volatility of gold vastly exceeds that of consumer prices. On this point, a comparison to the stock market is apt. It is often the case that changes in P/E ratios are the dominant drivers of equity returns over 6-12 month periods, and in the case of gold it is almost always the case that the real price of gold determines cyclical returns – not changes in the price level. Chart 66Gold Prices Likely Already Reflect An Expectation Of Rising Real Bond Yields
Gold Prices Likely Already Reflect An Expectation Of Rising Real Bond Yields
Gold Prices Likely Already Reflect An Expectation Of Rising Real Bond Yields
Chart 66 highlights that real gold prices have been explained over the past 15 years by changes in the US dollar and especially real 10-year Treasury yields. The chart shows that gold prices are modestly lower today than this historical relationship would imply, possibly reflecting investor unease about the potential for monetary policy tightening next year (above and beyond what is currently reflected by real 10-year yields). Our view that real 10-year yields are likely to rise next year is thus ostensibly bearish for gold, but Chart 66 suggests that some of this effect may already be reflected in prices. As such, we expect that gold prices will be flat-to-modestly down, with the caveat that we would be aggressive buyers on any signs that one or more of today’s major geopolitical risks is materializing (e.g., conflict in the Middle East, Russia’s periphery, or China’s periphery). Chart 67Real Gold Prices Are Extremely Elevated Relative To Their History
Real Gold Prices Are Extremely Elevated Relative To Their History
Real Gold Prices Are Extremely Elevated Relative To Their History
Over the longer term, Chart 67 highlights that real gold prices are extremely elevated relative to their history. This largely reflects the fact that real interest rates are well below trend rates of economic growth. As such, we are bearish towards gold prices over the secular horizon, given our expectation that real interest rates are likely to move higher over the longer-term. Ms. X: What is your outlook for the US dollar next year? BCA: We recommend that investors stick with short US dollar positions for 2022. However, we acknowledge that the dollar may remain strong over the coming few months, which may persist as long as investors expect near-term economic weakness in the euro area. The Omicron variant impact on global travel, surging COVID cases, and European natural gas prices will likely cause negative near-term economic surprises, but we do not expect these conditions to last over the coming 12 months. Chart 68EUR-USD Is Pricing Too Much Of A Widening In Real Bond Yield Differentials
EUR-USD Is Pricing Too Much Of A Widening In Real Bond Yield Differentials
EUR-USD Is Pricing Too Much Of A Widening In Real Bond Yield Differentials
Versus major currencies, the broad trend in the dollar tends to be dominated by the USD-EUR exchange rate, and the recent collapse in the euro has contributed to the broad-based rise in the dollar. Chart 68 highlights that the euro area / US real 10-year government bond yield differential has done a good job of predicting the EUR-USD exchange rate since the Global Financial Crisis, and the chart highlights that the euro has fallen 5% below what this relationship would imply. Using Chart 68 as a guide, current pricing of the euro suggests that investors expect a 40 bps decline in the real 10-year yield differential. We expect US long-maturity real yields to rise on the order of 60-70 bps over the coming year, but the recent behavior of the euro is only fair if euro area real yields are mostly unchanged next year. We would bet against such an outcome, as the economic conditions that will eventually cause the Fed to raise interest rates also imply better economic outcomes for the euro area. Chinese economic growth is likely to be better in the second half of next year, which will boost global growth, and euro area consumers also have ample savings at their disposable to support consumer spending. The fact that euro area stocks have more earnings upside relative to pre-pandemic levels also argues against the dollar from the perspective of equity portfolio flows. Chart 69US Dollar And Indicator The US Dollar Is Overbought
US Dollar And Indicator The US Dollar Is Overbought
US Dollar And Indicator The US Dollar Is Overbought
Three additional factors support a bearish dollar view beyond a near-term period of temporary dollar strength. The first is that the Fed is likely to lag the Bank of England and Bank of Canada in terms of moving towards normalizing monetary policy, a bearish outlook for USD-GBP and USD-CAD. The second factor is that the US dollar is normally a counter-cyclical currency, and recent dollar strength is implying a degree of equity market weakness that we do not expect next year. Third, Chart 69 highlights that the US dollar is on the verge of entering extremely overbought territory, underscoring that euro bearishness is likely overdone. Mr. X: My daughter and I have been debating adding cryptocurrencies to our portfolio. As you might guess, she sees promise in cryptos, whereas I see them as a bubble waiting to burst. What are your thoughts? BCA: We have had a similar debate at BCA. There is little doubt that the blockchain technologies underpinning cryptocurrencies are here to stay. The only question is whether cryptocurrencies themselves are worth investing in. Bitcoin has doubled in price seven times since the start of 2016. If it were to double just one more time to $120,000, it would be worth $2.1 trillion, equal to the entire stock of US dollars in circulation. The easy profits in this sector have already been made. Then there is the issue of competition. Many new cryptocurrencies have emerged on the scene since Bitcoin was invented more than a decade ago. Ethereum is the best known, but others such as Solana, Cardano, XRP, and Polkadot are arguably technologically superior. If one invests in this space, at a minimum, one should buy a basket of cryptos, similar to what one would do if one were betting on a new technology but did not know which specific company would ultimately prevail. Mr. X: What about regulation? Is it not just a matter of time before the hammer comes down on the whole sector? BCA: China has banned cryptos, but they continue to thrive, so the sector has proven itself quite resilient to government scrutiny. In fact, regulation could help cryptocurrencies gain the air of respectability, while attracting more institutional investment in the sector. The bigger issue is again, competition, but this time from central banks. Most major central banks are working to develop their own digital currencies. Also keep in mind that governments derive a lot of revenue from “seigniorage” – the ability to create money out of thin air. They would not want to lose that revenue. Mr. X: I am all in favor of depriving governments of the ability to print as much money as they want. But if I wanted to hedge this risk, I would buy gold. BCA: We are inclined to agree, with the caveat that gold itself is already expensive insurance against monetary debasement. Geopolitics Ms. X: I am not sure that I find your arguments about cryptocurrencies to be compelling, but I sense that this is a topic upon which we will have to agree to disagree – at least for now. Perhaps we can close out our discussion with your geopolitical outlook, and what risks my father and I should be most attuned to.
Chart 70
BCA: As an overall summary of our view, we contend that the international system will remain unstable in 2022. Global multipolarity – or the existence of multiple, competing poles of political power – is the chief destabilizing factor, and is the first of three geopolitical themes that will persist next year and beyond. Multipolarity – or great power struggle – can be illustrated by the falling share of US economic clout relative to the rest of the world, including but not limited to strategic rivals like China (Chart 70). China’s GDP has risen to the top in purchasing power terms and will do so in nominal terms in around five years. China’s potential growth is slowing and financial instability will be a recurring theme in 2022 and beyond. But that very fact is driving Beijing to try to convert the past 40 years of economic success into broader strategic security. Since China is ultimately capable of creating an alternative political order in Asia Pacific, the United States is belatedly reacting by penalizing China’s economy and seeking to refurbish alliances in pursuit of a containment policy. Russia and other nationalist powers are also drivers of multipolarity. Chart 71Hypo-Globalization, Our Second Geopolitical Theme
Hypo-Globalization, Our Second Geopolitical Theme
Hypo-Globalization, Our Second Geopolitical Theme
The second geopolitical theme is “hypo-globalization,” in which globalization fails to live up to its potential. The trade intensity of global growth peaked with the Great Recession in 2008-10. The stimulus-fueled recovery in the wake of COVID-19 is seeing a trade rebound, which is positive for corporate earnings. But the upside will be limited by the negative geopolitical environment (Chart 71), which makes nations fearful of each other and hungry for self-sufficiency. The 2010s witnessed a retreat from globalization as developed economies saw private debt bubbles unwind, while emerging economies saw trade manufacturing unwind. Anti-globalization movements entered mainstream politics, in both democratic and authoritarian countries, from the East to the West. Today governments are not behaving as if they will engender a new era of ever-freer movement and ever-deepening international linkages. For example, the trade war between the US and China has morphed into a broader competition that limits cooperation to a few select areas, despite a leadership change in the United States. The further consolidation of central government power in China will exacerbate distrust. Chart 72The Risk Of Populism, Our Third Geopolitical Theme, Is Significant In Emerging Markets
The Risk Of Populism, Our Third Geopolitical Theme, Is Significant In Emerging Markets
The Risk Of Populism, Our Third Geopolitical Theme, Is Significant In Emerging Markets
A third theme is populism, or anti-establishment political sentiment, which we discussed at length last year and is likely to escalate in 2022. Even as unemployment declines, the rise in food and fuel inflation will make it difficult for low wage earners to make ends meet. Most of the developed markets have elected new governments since the pandemic, allowing voters to vent some frustration. But many of the emerging economies are either facing elections or have non-responsive political systems. Either way they may fail to address household grievances. This will be a source of social instability and economic uncertainty in the coming years. The “misery index,” which combines unemployment and inflation, spiked during the pandemic and stands at 15% on average for the major emerging markets, up from around 13% in 2016. The same countries have stimulated their economies, feeding inflationary pressures (Chart 72). Just as the “Arab Spring” unrest destabilized the Middle East and North Africa in the years after the Great Recession, so will new movements destabilize this region or other regions in the wake of COVID-19. Regime failures lead to wars and waves of immigration, which in turn create larger policy changes that can impact markets. Ms. X: What are the investment implications of your geopolitical views? BCA: These three themes – great power struggle, hypo-globalization, and populism – are inflationary in theory, though their impact will vary based on specific events. Multipolarity means that governments will boost industrial and defense spending to gear up for international competition. Hypo-globalization means countries will attempt to put growth on a more reliable domestic foundation rather than accept dependency on an unreliable international scene, thus constraining supplies from abroad. Populism leads to a range of unorthodox policies, such as belligerence abroad or extravagant social spending at home. Of course, the inflationary bias of these themes can be upset if they manifest in ways that harm growth and inflation expectations, which is also possible. For example, China’s historic confluence of internal and external political risks has already led to growth disappointments and financial instability. A conflict over the Taiwan Strait, which cannot be ruled out, could begin with deflation and end in inflation, as wars often do.
Chart 73
In this respect two geopolitical risks are worthy of repeating: Russia and Iran. Energy producers gain leverage as global energy supplies grow tight. That is why global conflicts, especially those involving petro-states, tend to rise and fall in line with oil prices (Chart 73). This will most likely be the case in 2022. Both of these states are vulnerable to social unrest at home and foreign strategic pressure abroad. Both have long-running conflicts with the US and West that are heating up for fundamental reasons, such as Russia’s fear of western influence in the former Soviet Union and Iran’s nuclear program. If these conflicts explode, they can lead to energy price shortages or shocks, which would clearly raise the odds of the stagflation-lite scenario that we described earlier. Conclusions Mr. X: Thank you very much for another interesting and thorough discussion of the outlook. Our discussion has not swayed me from my deep-seated concern that inflation over the medium-term will be much higher than investors think, and that there are likely to be enormous consequences from this for financial markets. You also acknowledged the long-term risk from a future rise in real interest rates – I suppose I simply see this risk materializing sooner than you do. Ms. X: Even if inflation is only moderately higher over the coming decade, say around 3% on average, that would still seem to have important implications for real portfolio returns. The main purpose of our meeting has been to discuss what will occur in 2022, but last year you provided us with long-term return projections across several asset classes compared with realized historical returns. An update to that would be very much appreciated. BCA: Table 4 presents an update of our long-term return projections based on a 3% inflation scenario, incorporating an allocation to alternative assets. As you highlighted, the projected real portfolio return is just 1% per year over the coming decade, compared with a 6.3% annualized historical real return. The table highlights an important dilemma for investors, which is that government bonds will offer very poor real returns over the coming decade if inflation is higher on average than it has been. Government bonds have traditionally been the core safe-haven assets in investor portfolios, underscoring that global investors may have to accept more volatility to achieve their desired return goals. In our view, this should come in the form of a reduced strategic allocation to US stocks within an equity portfolio, and an increased allocation to alternative assets such as real estate and alternative investments. Table 4Long-Term Return Scenarios In A World With 3% Inflation
OUTLOOK 2022: Peak Inflation – Or Just Getting Started?
OUTLOOK 2022: Peak Inflation – Or Just Getting Started?
Ms. X: Thank you. In conclusion, could you summarize your main economic and investment views for 2022? BCA: It would be our pleasure. Our main points are as follows: The COVID-19 pandemic is likely to recede in importance next year. The effect of the recently discovered Omicron variant remains unknown, but we expect any negative economic impact that occurs to be limited to the first half of the year. The existence of effective anti-viral treatments, that are not affected by the virus’s mutation, should help limit the impact of Omicron on the medical system. A receding pandemic will lay the groundwork for a more normal labor market, prices, and the supply of both goods and services. Investors are overestimating the magnitude of inflation over the coming 12 months, and we expect actual inflation will come in lower next year than what short-maturity inflation expectations are currently suggesting. Economic growth in advanced economies will be above-trend for the year on average, and we expect the US and euro area output gaps to close in 2022. Any economic activity disrupted by Omicron in the first half of 2022 will likely shift into the second half of the year. Above-trend growth will be supported by easy monetary policy, a shift in spending from goods to services, and a sizeable amount of excess savings that will support overall consumer spending. A reacceleration in Chinese economic activity is more likely in the back half of next year than over the coming 6 months. China is currently a “one-legged” economy that is supported by external demand, and a shift in advanced economy consumer spending from goods to services may be the catalyst for more aggressive easing from policymakers. Stocks will outperform bonds in 2022, but equity market returns will be in single-digit territory – the net result of robust revenue growth and some return compression from profit margins and equity multiples. Equity market volatility may rise in the lead-up to US monetary policy tightening at the end of the year, but we expect only a moderate rise in long-maturity bond yields – which will not threaten economic activity or cause a major decline in equity multiples. Fixed-income investors should maintain a short duration stance, and position for lower inflation expectations and higher real rates (especially at the short end of the curve). We recommend selling short-maturity inflation protection. Within a government bond portfolio, overweight Europe (core and periphery), Japan, and Australia. Underweight the US, UK, Canada, and New Zealand. Within a credit portfolio, favor speculative-grade over investment-grade corporate bonds, and European Ba-rated European junk bonds over similarly rated US credits. Equity investors should favor small cap over large cap stocks in 2022. Small cap stocks tend to outperform large caps over 1-year periods when bond yields are rising, and relative valuation levels are attractive. We generally favor cyclical sectors next year, but stretched relative performance versus defensives means that we expect to rotate away from cyclical sectors at some point over the coming year. A window exists for value’s outperformance versus growth in 2022 in response to higher long-maturity government bond yields, and we do recommend the former over the latter. Investors should maintain a neutral allocation to the US versus global ex-US for now, with a bias towards increasing exposure to global ex-US at some point next year. An underweight stance towards EM stocks in 1H 2022 is appropriate until clearer signs of Chinese policy easing emerge. Within DM ex-US, we expect euro area outperformance at some point next year: euro area earnings have more post-pandemic catchup potential than US stocks, and relative valuation argues for a euro area bounce. Aside from the potential for Omicron-related near-term economic weakness, a shift in investor expectations for the terminal Fed funds rate is a risk that investors should monitor. Our judgement is that this will probably not occur before the Fed begins to normalize monetary policy. Brent oil prices will average around $80-81/bbl next year, essentially flat from pre-Omicron levels. The oil market is currently backwardated, meaning that investors should pursue a dynamic roll strategy focused on energy contracts. European natural gas prices are likely to remain high through the winter. Aside from higher-than-average temperatures through the winter months, a reduction in US import demand is the most likely catalyst for lower natgas prices in Europe. The outlook for base metals in the first half of 2022 is murky. Metals inventories are low, but China is likely to slow further over the coming few months. Our expectation of a reacceleration in Chinese economic activity in the back half of 2022 means that, on average, base metals prices will be higher in 2022. We expect that gold prices will be flat-to-modestly down next year, although we would be aggressive buyers on any signs that one or more of today’s major geopolitical risks is materializing (e.g., conflict in the Middle East, Russia’s periphery, or China’s periphery). The US dollar may remain strong over the coming few months, depending on the extent of the economic impact from the Omicron variant. Beyond that, the dollar’s countercyclical nature, above-trend global growth, and overbought conditions suggest that investors should bet on a lower dollar. The international system will remain unstable in 2022. Multipolarity, “hypo-globalization”, and populism will remain important geopolitical themes next year (and beyond). The Editors December 1, 2021 Footnotes 1 “South African doctor who raised alarm about omicron variant says symptoms are ‘unusual but mild,” The Telegraph, November 27, 2021. 2 Please see The Bank Credit Analyst "In COVID’s Wake: Government Debt And The Path Of Interest Rates," dated April 29, 2021, available at bca.bcaresearch.com 3 Please see The Bank Credit Analyst "Work From Home “Stickiness” And The Outlook For Monetary Policy," dated June 24, 2021, available at bca.bcaresearch.com 4 June 2021, “Global Economic Impact Trends 2021”, World Travel & Tourism Council 5 What Has Driven the Recent Increase in Retirements? by Jun Nie and Shu-Kuei X. Yang, Federal Reserve Bank of Kansas City Economic Bulletin, August 11, 2021. 6 Please see Global Investment Strategy "Revisiting The Neutral Rate Of Interest: A Contrarian View In A Time Of Crisis," dated March 20, 2020, available at gis.bcaresearch.com 7 Please see US Equity Strategy "Marginally Worse," dated October 11, 2021, available at uses.bcaresearch.com 8 Please see Commodity & Energy Strategy "COP26 Meets During Policy-Induced Crisis," dated October 28, 2021, available at ces.bcaresearch.com