Fixed Income

Highlights Despite strong economic activity throughout most of 2021, economic surprises have decreased considerably. This helped the US equity market outperform Europe. It also significantly contributed to the euro’s depreciation versus the dollar. Even though growth will slow in 2022, economic surprises should increase. Growth expectations are much lower than they were entering 2021, and some key headwinds will fade. This picture is not without risks. China’s credit slowdown and the US’s elevated inflation represent the greatest threats. Based on the outlook for economic surprises, the euro will stage a rebound next year and small-cap stocks are attractive. Feature Global economic activity has been exceptionally robust this year, boosted by the re-opening of the world economy, as well as by the considerable fiscal and monetary stimuli injected globally over the past 20 months. However, market participants also anticipated such a rebound; as a result, global economic surprises peaked in September 2020, and they are now in negative territory. Unanticipated developments have a substantial effect on market prices. Under this lens, the deterioration in economic surprises has had a strong impact on financial markets. It helps explain why the defensive US market has outperformed, why the dollar has been strong, and why bond yields have been flat since March 2021, even though inflation has risen, growth has been high by historical standards, and many major central banks have been eschewing their accommodative biases. Going forward, the evolution of economic surprises will remain crucial to market trends. While we anticipate global economic activity will decelerate in 2022, it will likely remain above trend and surprise to the upside, which will allow global economic surprises to recover. There are significant risks to this view, with large unanswered questions about the Chinese economy and the outlook for inflation in the US. In this context, despite near-term risks, we continue to expect EUR/USD to appreciate in 2022 and European small-cap stocks to outperform large-cap equities. Deteriorating Surprises Matter This year, the underperformance of global equities (both EM and Europe) relative to the US, the weakness in the euro, and the limited increase in yields have all caught investors off guard. At the beginning of 2021, investors were massively short the greenback and duration, while surveys showed a large preference for non-US equities. These views grew out of the expectation that global growth would be strong. Global growth turned out to be strong but began to disappoint expectations by the middle of the year. Expectations had become extremely lofty, suggesting that the bar had been set too high. Additionally, the tightening credit conditions in China and the growing supply constraints around the world caused growth to decelerate somewhat. The deterioration in short-term economic momentum and in surprises harmed European equities relative to the US. As Chart 1 highlights, the relative performance of European stocks is greatly affected by the earnings revision ratio of cyclicals stocks vis-à-vis defensive ones. This relationship reflects the greater pro-cyclicality of European equities compared to those of the US. Moreover, the earnings revision ratio of cyclical stocks relative to that of defensive equities mimics the fluctuations in economic surprises (Chart 1, bottom panel), as weaker-than-expected growth invites analysts to lower their relative earning expectations. The dynamics in the economic surprise index also weighed heavily on the FX market. The dollar is a highly counter-cyclical currency; therefore, it performs poorly when growth is not only increasing, but also doing so at a rate faster than anticipated. However, economic surprises did the exact opposite this year, which boosted the dollar’s appeal and pushed EUR/USD lower (Chart 2). While the strength in the dollar was accentuated by the increasingly aggressive pricing of Fed hikes in the OIS curve, relative interest rate expectations between the US and the Euro Area are also influenced by global economic activity because of the European economy’s greater cyclicality than that of the US. Chart 1Where Surprises Go, European Stocks Follow
Where Surprises Go, European Stocks Follow
Where Surprises Go, European Stocks Follow
Chart 2Surprises Matter For The Dollar And The Euro
Surprises Matter For The Dollar And The Euro
Surprises Matter For The Dollar And The Euro
Bottom Line: Global growth has been very strong in 2021, but it has begun to decelerate. Moreover, economic surprises are now in negative territory. The evolution of economic surprises this year was a key component of the strength in the dollar, the weakness of the euro, and the underperformance of European equities. Improving Surprises In 2022? We anticipate economic surprises to pick up in 2022. First, investors and analysts around the world rightfully expect a slowdown in global growth next year. This means that the bar for the economy to generate positive surprises is lower than it was in 2021. Second, we are already seeing signs that global economic surprises are trying to stabilize. A GDP-weighted aggregate of 48 countries is forming a trough at a low level, which historically precedes a pick-up in broader aggregate measures (Chart 3). Third, economic surprises move closely with the global PMI diffusion index. The diffusion index has fallen to levels historically associated with a rebound (Chart 4). Moreover, the share of countries whose Leading Economic Indicator is rising is still very depressed for a mid-cycle slowdown (Chart 4, bottom panel). As vaccination rates are improving around the world, including those in emerging markets, and as the global economy continues to re-open, we anticipate both the PMI and LEI diffusion indexes to improve next year, which will boost economic surprises. Chart 3A Budding Rebound?
A Budding Rebound?
A Budding Rebound?
Chart 4The dispersion Of Growth Matters or Surprises
The dispersion Of Growth Matters or Surprises
The dispersion Of Growth Matters or Surprises
Fourth, the global capex outlook remains very positive. Capex intentions in the US and in the Euro Area are highly elevated and cash flows are strengthening. Moreover, US and European credit standards are very loose (Chart 5). This combination suggests that companies have the desire and the wherewithal to increase their investments next year, especially as capacity constraints limit their ability to meet final demand. Additionally, companies around the world need to rebuild inventory levels, which are depressed relative to sales, while customer inventories are still woefully low (Chart 6). Chart 5Capex Tailwinds
Capex Tailwinds
Capex Tailwinds
Chart 6Not Enough Inventories
Not Enough Inventories
Not Enough Inventories
Chart 7Households Are Rich
Households Are Rich
Households Are Rich
Fifth, households globally also have ample firepower to support their spending, despite some weakness in real income caused by rising inflation. As Chart 7 shows, household net worth in the US is up by 128% of GDP since December 2019. Additionally, the accumulated stocks of household excess savings have reached USD2.4 trillion in the US, EUR150 billion in German, EUR130 billion in France and GBP180 billion in the UK. With respect to the Eurozone specifically, fiscal and monetary policy will remain very accommodative. The fiscal thrust in 2022 will be negative 2.1%, which is significantly less onerous than the US’s -5.9% of GDP. Moreover, economies like Italy and Spain may have a negligible fiscal thrust because of the NGEU program’s disbursements. In addition, while the fiscal thrust will be slightly negative next year, government deficits will remain wide, which indicates that fiscal policy in Europe continues to support demand. Meanwhile, monetary policy still generates deeply negative interest rates on the continent, which sustains demand further. This view is not without risks. The first threat stems from the Chinese credit slowdown. BCA’s China strategists expect credit flows to bottom out by the second quarter of 2022, which implies that Chinese domestic activity should accelerate meaningfully in the second half of the year. Already, we are seeing tentative signs that authorities in China are trying to curb the credit slowdown. For example, Beijing cut the reserve requirement ratio last summer and excess reserves in the banking system are moving back up as liquidity injections grow (Chart 8). The problem is that, so far, Chinese credit demand is not responding to these small measures designed to ease policy. More will be needed as the tightening in financial conditions for real estate developers points to significant downside ahead in construction activity (Chart 9). For now, it is difficult for Beijing to ease policy much more than it has done so far: PPI has reached a 25-year high at 13.5%. Chart 8Not Enough...
Not Enough...
Not Enough...
Chart 9... Especially With Such A Drag
... Especially With Such A Drag
... Especially With Such A Drag
These Chinese inflationary pressures are likely to decline in the first months of 2022, which will allow Beijing to become more aggressive in its support to economic activity. First, Chinese demand is weak, unlike demand in the US. Second, the surge in the PPI is mostly driven by a 17% increase in the energy PPI and a 66% surge in the mining component. These jumps are unlikely to repeat themselves, which will reduce overall inflationary numbers in that economy. The second major risk is global inflation, which is hurting real wages. As a case in point, US real wages are contracting at a 3.2% annual rate, or their deepest cut in six decades. In Europe too, real wages are weak because of the increase in inflation. While these inflationary pressures have had limited effect on European consumer confidence so far, US consumer confidence is breaking down (Chart 10), driven by a collapse in the willingness to buy. If this trend continues, we might see a significant deceleration in global real consumer spending. Chart 10Not All Is Dark On The Inflation Front
Not All Is Dark On The Inflation Front
Not All Is Dark On The Inflation Front
We still expect the European inflationary risk to start dissipating in the first half of 2022. Unlike in the US, the spike in core CPI mostly reflects an increase in VAT and remains narrow, with trimmed-mean CPI lingering near record lows. Moreover, the 24-month rate of change of core CPI remains within the historical norm, which is not the case in the US. The US situation is more tenuous. Last week’s inflation data showed a broadening of inflationary pressures across major sectors of the economy unaffected by the pandemic, with shelter inflation being of particular concern. However, there are positives. Long-term inflation expectations, as approximated by the 5-year/5-year forward inflation breakeven rate, are still below the levels that prevailed before the oil price crash of 2014 (Chart 11, top panel). Additionally, shipping costs have started to ebb, with global container freight rates losing steam and the Baltic Dry index collapsing by 50% since beginning of October (Chart 11, bottom panel). Moreover, as health restrictions are being relaxed in Asia, Asian PMI’s are improving, while the production of semiconductors is rising again in the region (Chart 12). As a result, although there is still significant inflation risk over the next five years, 2022 is likely to witness a temporary pullback in CPI growth. Chart 11Not All Is Dark On The Inflation Front
Not All Is Dark On The Inflation Front
Not All Is Dark On The Inflation Front
Chart 12Semiconductor Production Is Picking Up
Semiconductor Production Is Picking Up
Semiconductor Production Is Picking Up
Bottom Line: Global investors are right to anticipate a decline in global growth next year. However, even if growth slows, it will remain above trend. Moreover, the considerable stimuli in the global economy and the decreased expectations of investors improve the odds that global economic surprises will increase in 2022. China’s domestic weakness and the rise in US inflation constitute the two greatest risks to this view. Investment Implications The level of the global economic surprise index as well as its evolution have important implications for many key European assets. Table 1 highlights the performance of various financial markets at three months, six months, and a year following various ranges of readings of the surprise index (the categories are based on one standard-deviation intervals from the mean). We highlight this methodology, because there remains significant uncertainty about the near-term outlook of the surprise index. Table 1Level Of Surprises And Subsequent Returns
Surprise, Surprise
Surprise, Surprise
Currently, the global economic surprise index stands at -20, or between its -1-sigma and its historical average. This level offers limited clear results for investors when it comes to the performance of the Eurozone benchmark relative to the MSCI All Country World Index (ACWI), and no clear results in terms of the performance of value stocks relative to growth. However, the current reading of the surprise index is consistent with an outperformance of growth stocks relative to momentum over both the three- and six-month horizons. It is also showing a 74% probability of small-cap equities beating large-cap ones over a 12-month basis. Table 2 shows the performance of the same assets over the same windows, following three consecutive months or more of an improving global economic surprise index. This is consistent with our main hypothesis that global economic surprises are set to increase by early next year. Table 2Surprise Upticks And Subsequent Returns
Surprise, Surprise
Surprise, Surprise
Using this method again shows no strong call for the Euro Area equity benchmark relative to the ACWI. There is a small improvement in performance, but Europe on average still underperforms, which reflects the thirteen years of a relative bear market in European equities. Similarly, results for European value stocks compared to growth equities are limited, as the sample is dominated by the structurally poor performance of value equities. However, this method highlights that the euro is likely to appreciate against the USD on both the three- and six-month investment horizon. This message is consistent with that of our Intermediate-Term Timing Model. Finally, this approach once again underscores the attractiveness of European small-cap equities on a three-, six-, and twelve-month investment horizon. Consequently, we maintain our buy recommendation on the euro. As we wrote three weeks ago, the near-term outlook for the common currency is fraught with risks and the low readings of the global economic surprise index confirm this reality. Moreover, markets might enter a phase when they aggressively discount Fed rates hikes next year, which would further hurt the euro. However, the outlook for global growth will ultimately put a floor under EUR/USD. Chart 13Small-Caps: Almost There
Small-Caps: Almost There
Small-Caps: Almost There
We also view European small-cap stocks as the premier equity vehicle in Europe over the coming 18 months because of their heightened pro-cyclicality. However, the timing around shifting toward overweighing small-cap remains risky in the near-term, as they have not fully worked out the overbought conditions we flagged four weeks ago (Chart 13). Thus, we maintain small-cap equities on an upgrade alert, and we are looking to pull the trigger very soon. Mathieu Savary, Chief European Strategist Mathieu@bcaresearch.com Tactical Recommendations
Surprise, Surprise
Surprise, Surprise
Cyclical Recommendations
Surprise, Surprise
Surprise, Surprise
Structural Recommendations
Surprise, Surprise
Surprise, Surprise
Closed Trades
Image
Currency Performance Fixed Income Performance Equity Performance
BCA Research’s Global Investment Strategy service concludes that investors need to throw the old playbook for dealing with growth slowdowns out the window. US growth will slow next year, not because demand will falter, but because supply-side constraints…
Highlights US growth will slow next year, not because demand will falter, but because supply-side constraints will prevent the economy from producing as much output as households and businesses want to buy. If aggregate demand exceeds aggregate supply, the price level will rise. We argue that the US aggregate demand curve is currently quite steep. This implies that the price level may need to rise a lot to restore balance to the economy. In fact, if the aggregate demand curve is not just steep but upward-sloping, which is quite possible, there may be no price level that brings aggregate demand in line with supply; the US economy could go supernova. When supply is the binding constraint to growth, investors need to throw the old playbook for dealing with growth slowdowns out the window. Rather than positioning for lower bond yields, investors should position for higher yields. Rather than expecting a stronger dollar, investors should expect a weaker one. Rather than favoring growth stocks, large caps, and defensives, investors should favor value stocks, small caps, and cyclicals. The Binding Constraint To Growth Is Now Supply After a post-Delta wave rebound in Q4, the US economy is expected to slow over the course of 2022. The Bloomberg consensus is for US growth to decelerate from 4.9% in 2021Q4 to 4.1% in 2022Q1, 3.9% in 2022Q2, 3.0% in 2022Q3, and 2.5% in 2022Q4. Growth in the first quarter of 2023 is expected to dip further to 2.3%. We agree that US growth will slow next year but think the market narrative around this slowdown is misguided. Chart 1Plenty Of Pent-Up Demand
Plenty Of Pent-Up Demand
Plenty Of Pent-Up Demand
The standard market playbook for dealing with an economic slowdown is to position for lower bond yields, a stronger US dollar, and a decline in commodity prices. On the equity side, the playbook calls for shifting equity exposure from cyclicals to defensives, favoring large caps over small caps, and growth stocks over value stocks. There are two major problems with this narrative. First, growth is peaking at much higher levels than before and is unlikely to return to trend at least until the second half of 2023. Second, and more importantly, US growth will slow due to supply-side constraints rather than inadequate demand. US final demand will remain robust for the foreseeable future. Households are sitting on $2.3 trillion in excess savings, equivalent to 15% of annual consumption (Chart 1). The household deleveraging cycle is over. After initially plunging during the pandemic, credit card balances are rising (Chart 2). Banks are falling over themselves to make consumer loans (Chart 3). Chart 2Revolving Credit On The Rise Again
Revolving Credit On The Rise Again
Revolving Credit On The Rise Again
Chart 3Banks Are Easing Credit Standards For Consumers
Banks Are Easing Credit Standards For Consumers
Banks Are Easing Credit Standards For Consumers
Chart 4A Record Rise In Household Net Worth
A Record Rise In Household Net Worth
A Record Rise In Household Net Worth
Household net worth has risen by over 100% of GDP since the start of the pandemic (Chart 4). As we discussed two weeks ago, the wealth effect alone could boost annual consumer spending by up to 4% of GDP. Investment demand should remain strong. Business inventories are near record low levels (Chart 5). Core capital goods orders, a leading indicator for corporate capex, have soared (Chart 6). Chart 5Business Inventories Are Near Record Low Levels
Business Inventories Are Near Record Low Levels
Business Inventories Are Near Record Low Levels
Chart 6Rise In Durable Goods Orders Bodes Well For Capex
Rise In Durable Goods Orders Bodes Well For Capex
Rise In Durable Goods Orders Bodes Well For Capex
Chart 7The Homeowner Vacancy Rate Is Signaling The Need For More Homebuilding
The Homeowner Vacancy Rate Is Signaling The Need For More Homebuilding
The Homeowner Vacancy Rate Is Signaling The Need For More Homebuilding
The Dodge Momentum Index, which tracks planned nonresidential construction, rose to a 13-year high in October. The homeowner vacancy rate is at multi-decade lows, signifying the need for more homebuilding (Chart 7). While increased investment will augment the nation’s capital stock down the road, the short-to-medium term effect will be to inflate demand. Policy Won’t Tighten Enough To Cool The Economy What is the mechanism that will push down aggregate demand growth towards potential GDP growth? It is unlikely to be policy. While budget deficits will narrow over the next few years, the IMF still expects the US cyclically-adjusted primary budget deficit to be nearly 3% of GDP larger between 2022 and 2026 than it was between 2014 and 2019 (Chart 8).
Chart 8
Chart 9The Fed And Investors Still Believe In Secular Stagnation
The Fed And Investors Still Believe In Secular Stagnation
The Fed And Investors Still Believe In Secular Stagnation
As Matt Gertken, BCA’s Chief Geopolitical Strategist, writes in this week’s US Political Strategy report, the passage of the $550 billion infrastructure bill has increased, not decreased, the odds of President Biden and the Democrats passing their social spending bill via the partisan budget reconciliation process. On the monetary side, the Federal Reserve will finish tapering asset purchases next June and begin raising rates shortly thereafter. However, the Fed has no intention of raising rates aggressively. Most FOMC members see the Fed funds rate rising to only 2.5% this cycle (Chart 9). The “dots” call for only one rate hike in 2022 and three rate hikes in both 2023 and 2024. Investors expect rates to rise even less by end-2024 than the Fed foresees (Chart 10).
Chart 10
The Inflation Outlook Hinges On The Slope Of The Aggregate Demand Curve If policy tightening will not suffice in cooling demand, the economy will overheat and inflation will rise. But by how much will inflation increase? The answer is of great importance to investors. It also hinges on a seemingly technical question: What is the slope of the aggregate demand curve? As Chart 11 illustrates, prices will rise more if the aggregate demand curve is steep than if it is flat.
Chart 11
Chart 12Wages Rose Faster Than Prices During The Inflationary Late-60s and 70s
Wages Rose Faster Than Prices During The Inflationary Late-60s and 70s
Wages Rose Faster Than Prices During The Inflationary Late-60s and 70s
It is tempting to think of the aggregate demand curve in the same way one might think of the demand curve for, say, apples. When the price of apples rises, there is both a substitution and an income effect. An increase in the price of apples will cause shoppers to substitute away from apples towards oranges. In addition, if apples are so-called “normal goods,” shoppers will buy fewer apples in response to lower real incomes. This chain of reasoning breaks down at the aggregate level. When economists say the price level has risen, they are referring to all prices; hence, there is no substitution effect. Moreover, since one person’s spending is another’s income, rising prices do not necessarily translate into lower overall real incomes. Granted, if nominal wages are sticky, as they usually are in the short run, an unanticipated increase in prices will reduce real wage income. However, this will be offset by higher business income. Over time, wages tend to catch up with prices. In fact, wage growth usually outstrips price growth during inflationary periods. For example, real wages rose during the late-1960s and 70s but fell during the disinflationary 1980s (Chart 12). Textbook Reasons For A Downward-Sloping Aggregate Demand Curve According to standard economic theory, there are three main reasons why aggregate demand curves are downward-sloping: The Pigou Effect: Higher prices erode the purchasing power of money, resulting in a negative wealth effect. The Keynes Effect: Higher prices reduce the real money supply. This pushes up real interest rates, leading to lower investment spending. The Mundell-Fleming Effect: Higher real rates push up the value of the currency, causing net exports to decline. None of these three factors are particularly important for the US these days. Chart 13Base Money Has Swollen Since The Subprime Crisis
Base Money Has Swollen Since The Subprime Crisis
Base Money Has Swollen Since The Subprime Crisis
Strictly speaking, the Pigou wealth effect applies only to “base money,” also known as “outside money.” Outside money includes cash notes, coins, and bank reserves. Inside money such as bank deposits are not included in the Pigou effect because while an increase in consumer prices decreases the real value of bank deposits, it also decreases the real value of commercial bank liabilities.1 In the US, the monetary base has swollen from 6% of GDP in 2008 to 28% of GDP as a result of the Fed’s QE programs (Chart 13). Nevertheless, even if one were to generously assume a wealth effect of 10% from changes in monetary holdings, this would still imply that a 1% increase in consumer prices would reduce spending by only 0.03% of GDP. Simply put, the Pigou effect is just not all that big.
Chart 14
In contrast to the Pigou effect, the Keynes effect has historically had a significant impact on the business cycle. However, the importance of the Keynes effect faded following the Global Financial Crisis as the Fed found itself up against the zero lower bound on interest rates. When interest rates are very low, there is little to distinguish money from bonds. Rather than holding money as a medium of exchange (i.e., for financing transactions), households and businesses end up holding money mainly as a store of wealth. In the presence of the zero bound, the demand for money becomes perfectly elastic with respect to the interest rate (Chart 14). As a result, changes in the real money supply have no effect on interest rates, and by extension, interest-rate sensitive spending. And if a decline in the real money supply does not push up interest rates, this undermines the Mundell-Fleming effect as well. Could The Aggregate Demand Curve Be Upward-Sloping? The discussion above, though rather theoretical in nature, highlights an important practical point: The aggregate demand curve may be quite steep. This means that the price level might need to rise a lot to equalize aggregate demand with aggregate supply. Chart 15US Real Bond Yields Hitting Record Lows
US Real Bond Yields Hitting Record Lows
US Real Bond Yields Hitting Record Lows
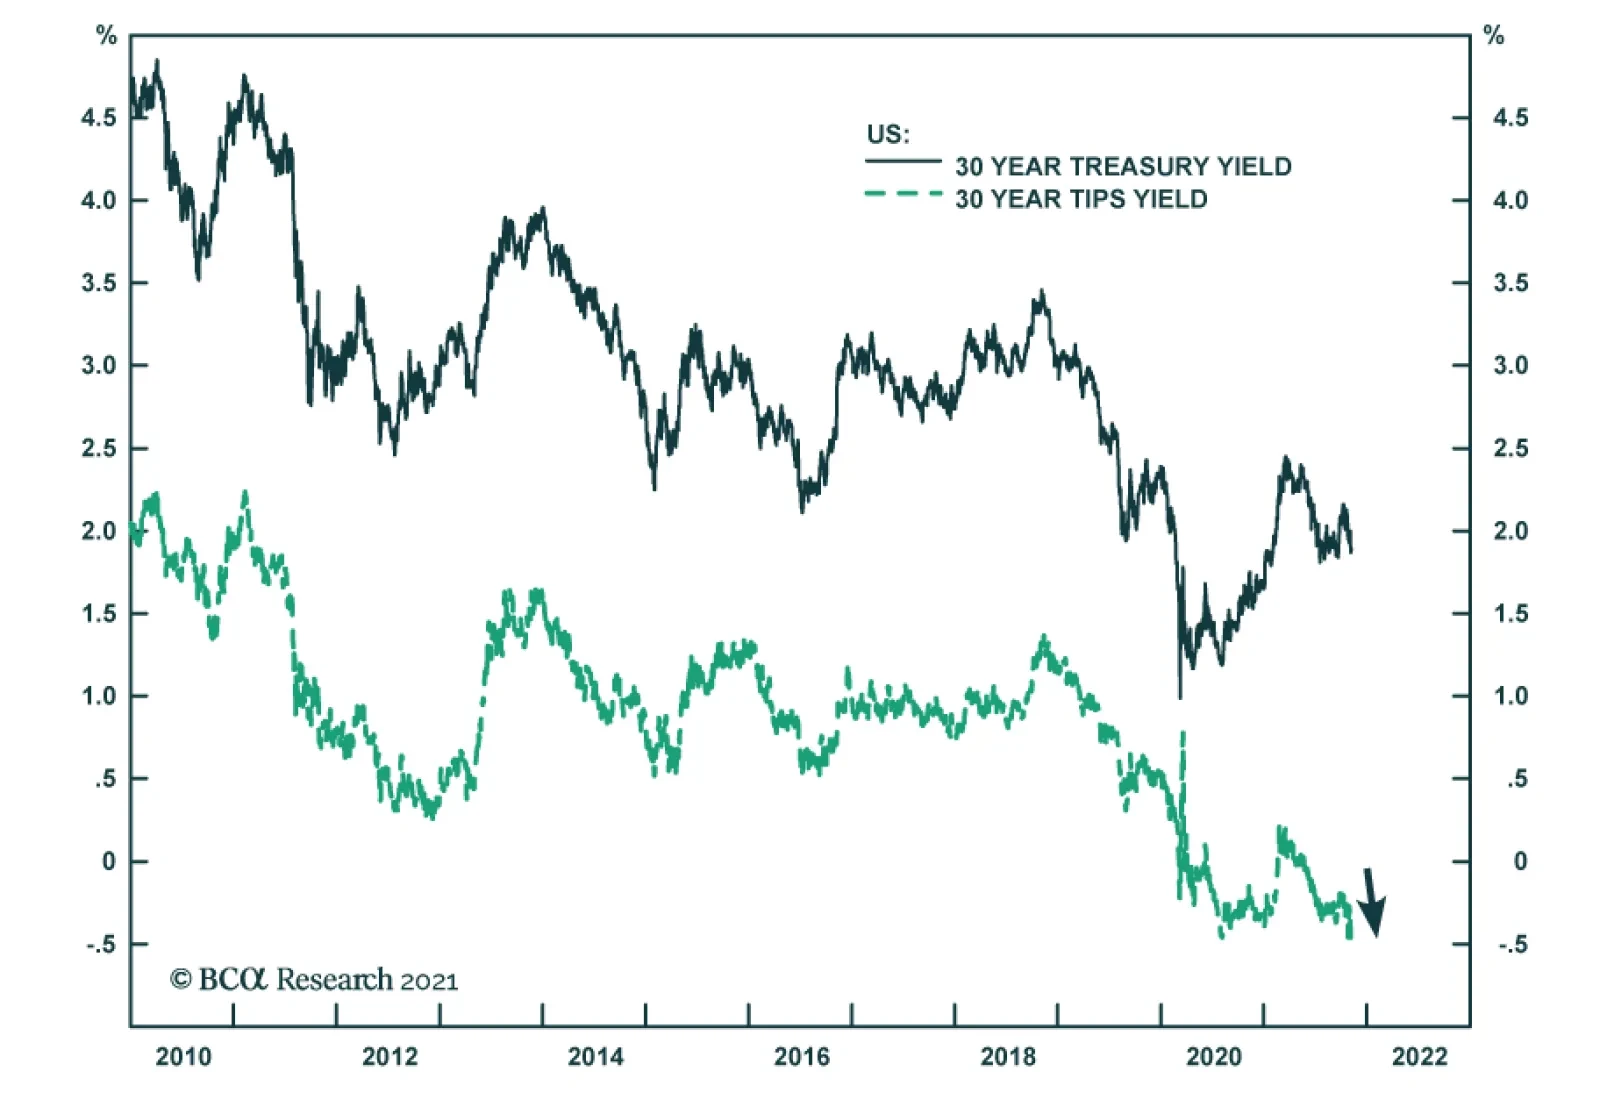
In fact, one can easily envision a scenario where a rising price level boosts spending; that is, where the demand curve is not just steep but upward-sloping. One normally assumes that higher inflation will prompt central banks to raise rates by more than inflation has risen, leading to higher real rates. However, if the Fed drags its feet in hiking rates, as it is wont to do given its concerns about the zero bound, rising inflation will translate into a decline in real rates. Lower rates will boost demand, leading to higher inflation, and even lower real rates. In addition, lower real rates will benefit debtors, who tend to have a higher marginal propensity to spend than creditors. This, too, will also boost aggregate demand. It is striking in this regard that real bond yields hit a record low this week, with the 10-year TIPS yield falling to -1.17% and the 30-year yield drooping to -0.57% (Chart 15). Black Holes Vs. Supernovas
Chart 16
In the case where the aggregate demand curve is upward-sloping, there is no stable equilibrium (Chart 16). If demand falls short of supply, demand will continue to shrink as the price level declines, leading to ever-rising unemployment. Unless policymakers intervene with stimulus, the economy will sink into a deflationary black hole. In contrast, if demand exceeds supply, demand will continue to rise as the price level increases exponentially. The economy will go supernova. Tick Tock Young stars fuse hydrogen into helium, releasing excess energy in the process. After the star has run out of hydrogen, if it is big enough, it will start fusing helium into heavier elements such as carbon and oxygen. The process of nucleosynthesis continues until it reaches iron. That is the end of the line. Fusing elements heavier than iron requires a net input of energy. Unable to generate enough external pressure through fusion, the star loses its battle to gravity. The core collapses, spewing material deep into interstellar space (a good thing since your body is mainly made from this stardust). Observing the star from afar, one would be hard-pressed to see anything abnormal until it explodes. The path to becoming a supernova is highly non-linear. The same is true for inflation. Just like a star with an ample supply of hydrogen, the Fed can burn through its credibility for a while longer. During the 1960s, it took four years for inflation to take off after the economy had reached full employment (Chart 17). By that time, the unemployment rate was two percentage points below NAIRU. Most of today’s inflation is confined to durable goods. This is not a sustainable source of inflation. The durable goods sector is the only part of the CPI where prices usually fall over time (Chart 18). Chart 17Inflation Spiked In The 1960s Only Once The Unemployment Rate Had Fallen Far Below Equilibrium
Inflation Spiked In The 1960s Only Once The Unemployment Rate Had Fallen Far Below Equilibrium
Inflation Spiked In The 1960s Only Once The Unemployment Rate Had Fallen Far Below Equilibrium
Chart 18Inflation Has Been Concentrated In Durable Goods, A Sector Where Prices Usually Fall Over Time
Inflation Has Been Concentrated In Durable Goods, A Sector Where Prices Usually Fall Over Time
Inflation Has Been Concentrated In Durable Goods, A Sector Where Prices Usually Fall Over Time
To get inflation to go up and stay up in modern service-based economies, wages need to rise briskly. While US wage growth has picked up, the bulk of the increase has been among low-wage workers, particularly in the services and hospitality sector (Chart 19). Chart 19Wage Growth Has Picked Up, But Mainly At The Bottom Of The Income Distribution
Wage Growth Has Picked Up, But Mainly At The Bottom Of The Income Distribution
Wage Growth Has Picked Up, But Mainly At The Bottom Of The Income Distribution
The most likely scenario for next year is that firms will simply ration output, fearful that raising prices too quickly will hurt brand loyalty and trigger accusations of price gouging. Shortages will persist, but this time they will be increasingly concentrated in the service sector. Such a state of affairs will not last, however. Competition for workers will cause wages to rise much more than they have so far. Keen to protect profit margins, firms will start jacking up prices. A wage-price spiral will develop. The US economy could go supernova. Investment Conclusions Chart 20Long-Term Inflation Expectations Are Near The Bottom End Of The Fed's Comfort Zone
Long-Term Inflation Expectations Are Near The Bottom End Of The Fed's Comfort Zone
Long-Term Inflation Expectations Are Near The Bottom End Of The Fed's Comfort Zone
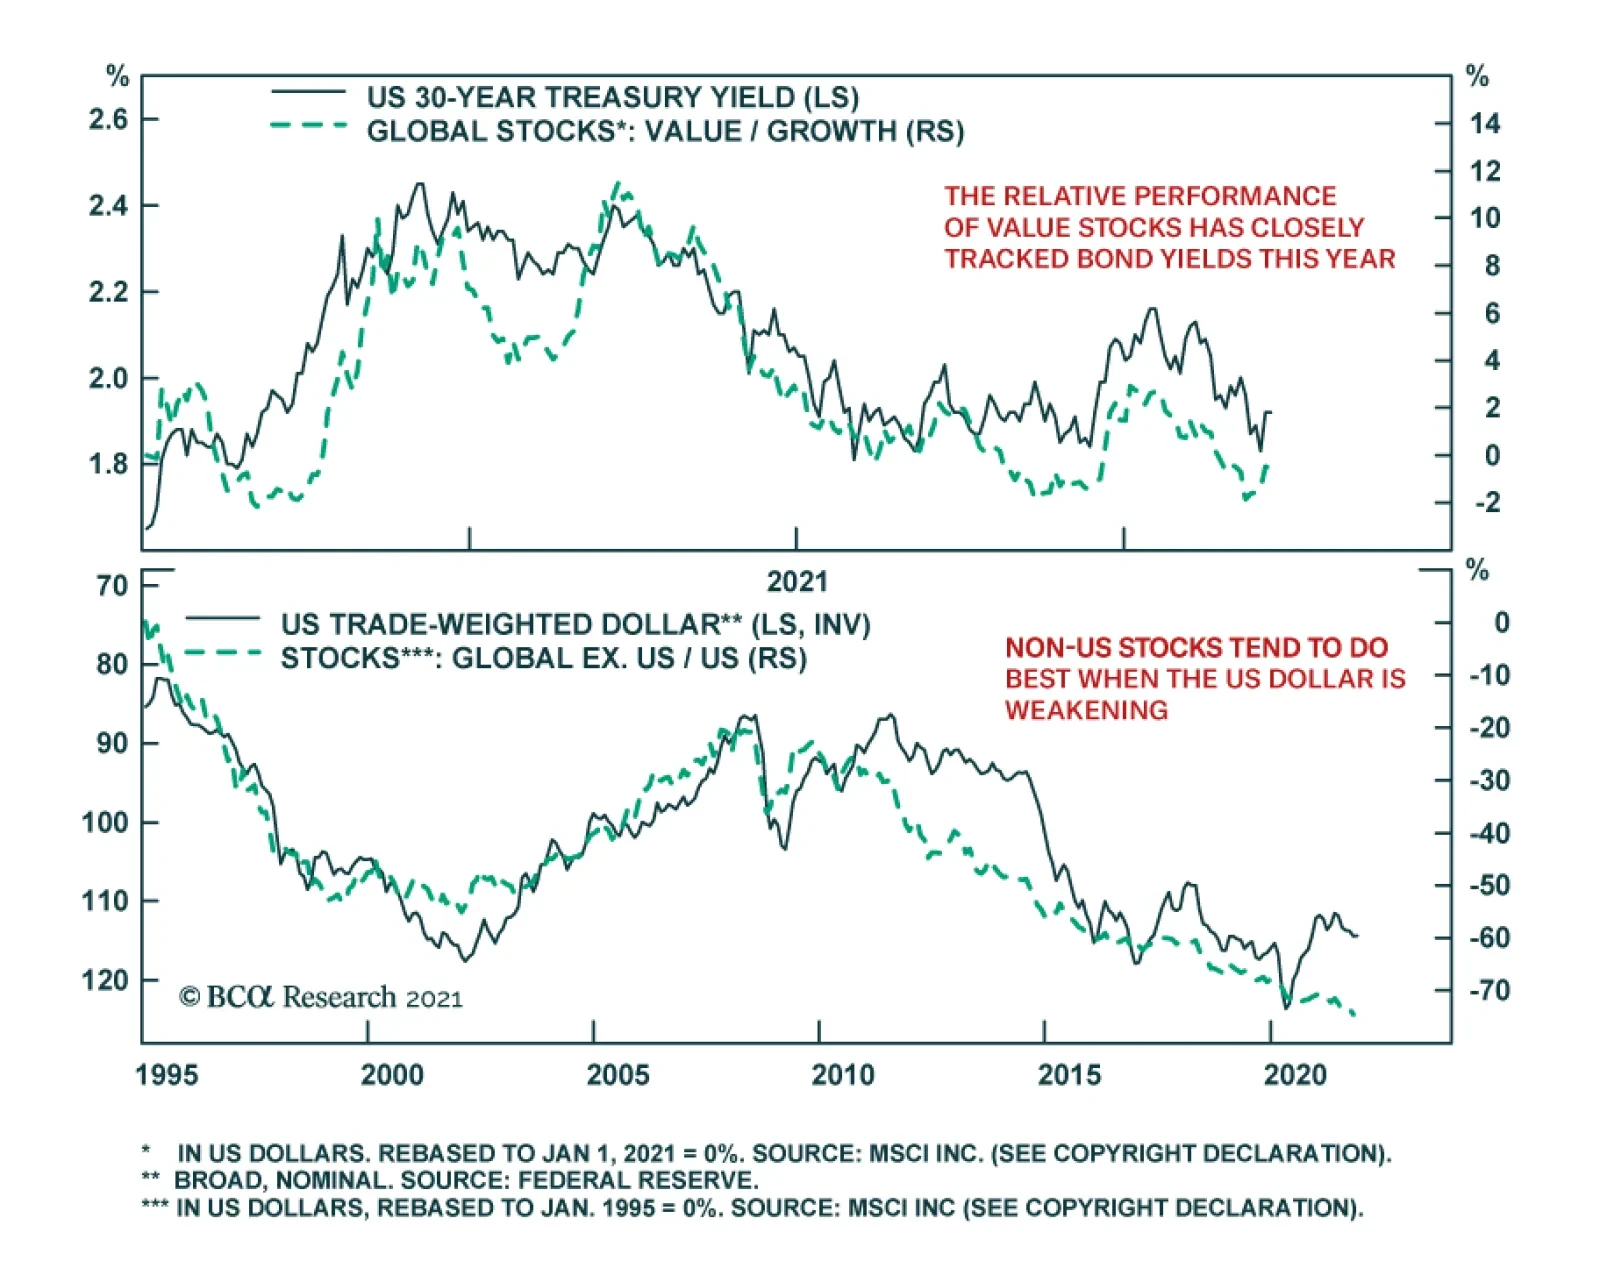
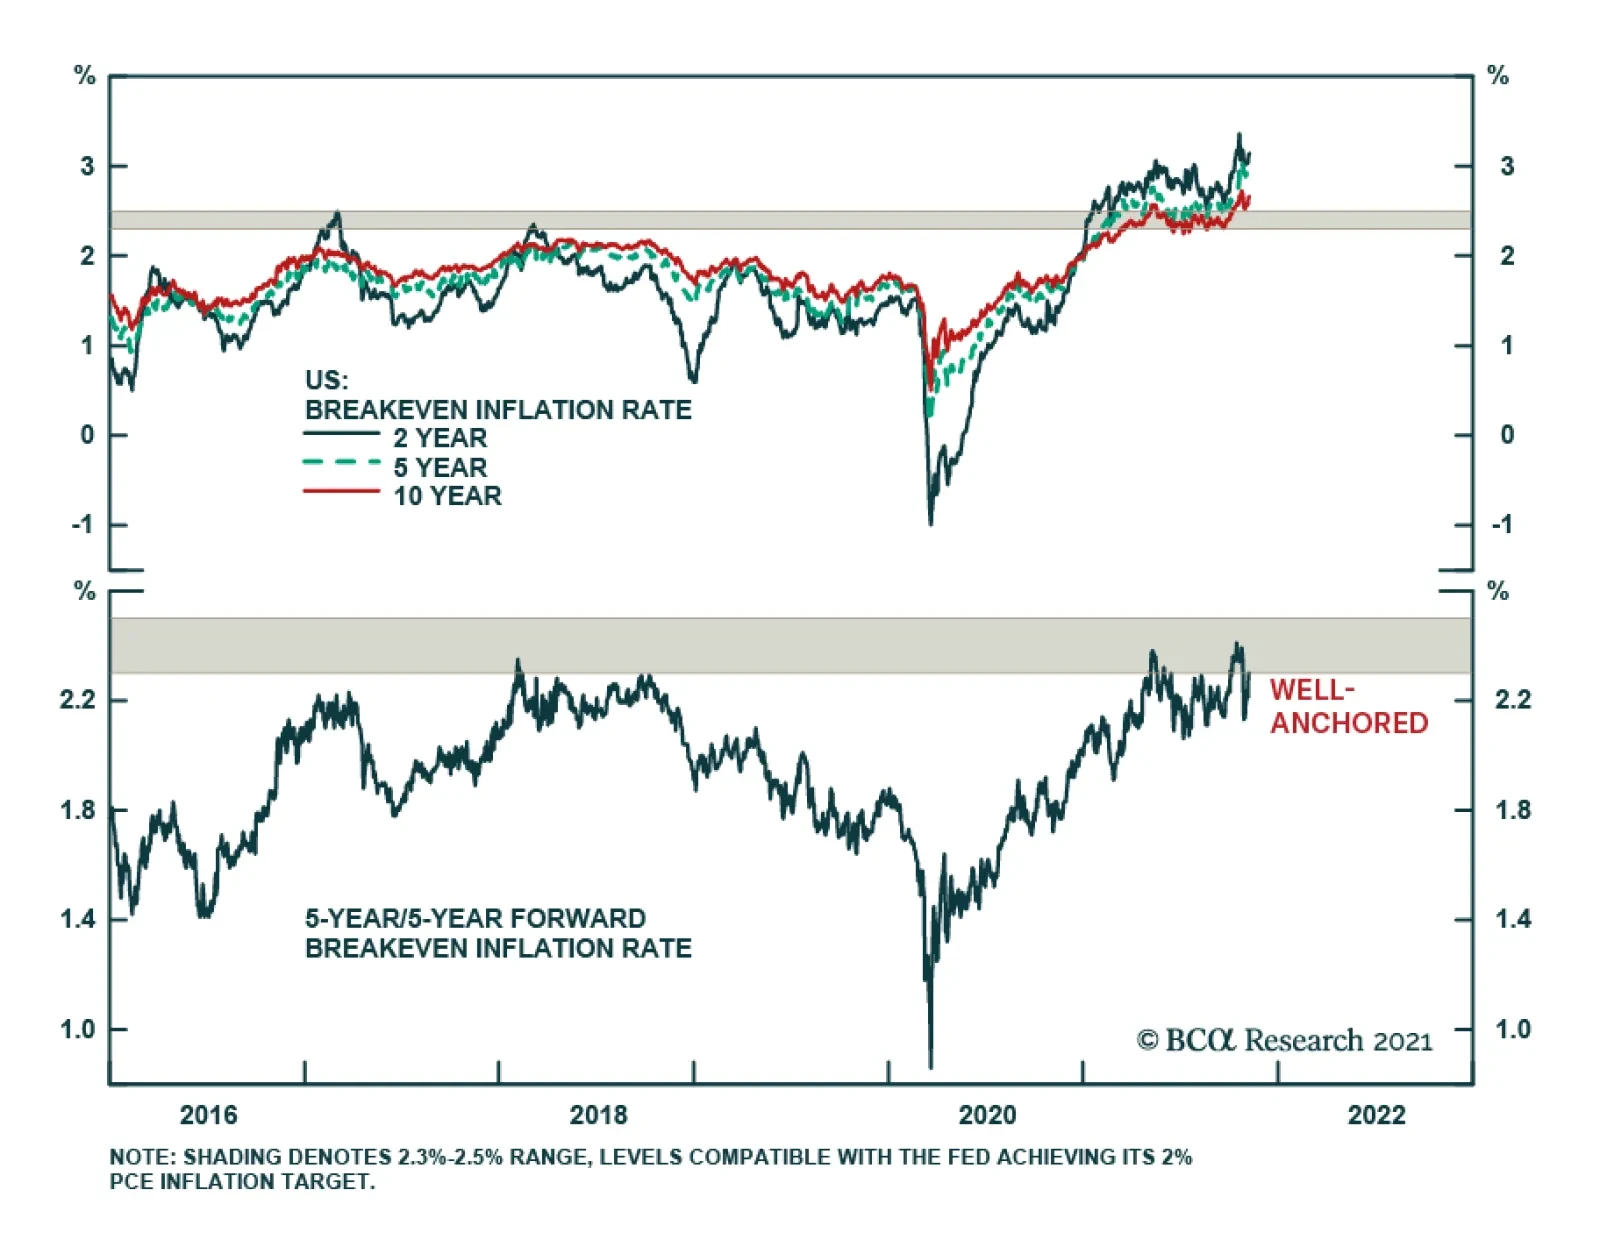
US growth will slow next year, not because demand will falter, but because supply-side constraints will prevent the economy from producing as much output as households and businesses want to buy. This means that the old playbook for dealing with growth slowdowns needs to be thrown out the window. Rather than positioning for lower bond yields, investors should position for higher yields. Rather than expecting a stronger dollar, investors should expect a weaker one. Rather than favoring growth stocks, large caps, and defensives, investors should favor value stocks, small caps, and cyclicals. While inflation expectations have recovered from their pandemic lows, the 5-year/5-year forward TIPS breakeven inflation rate is still near the bottom end of the Fed’s comfort zone (Chart 20). Rising inflation expectations will lift long-term bond yields, justifying a short duration stance in fixed-income portfolios. Higher bond yields will benefit value stocks. Chart 21 shows that there has been a strong correlation between the relative performance of growth and value stocks and the 30-year bond yield this year. Rising input prices will make the US export sector less competitive, leading to a weaker dollar. Historically, non-US stocks have done well when the dollar has been weakening (Chart 22). Chart 21The Relative Performance of Value Stocks Has Closely Tracked Bond Yields This Year
The Relative Performance of Value Stocks Has Closely Tracked Bond Yields This Year
The Relative Performance of Value Stocks Has Closely Tracked Bond Yields This Year
Chart 22Non-US Stocks Tend To Do Best When The US Dollar Is Weakening
Non-US Stocks Tend To Do Best When The US Dollar Is Weakening
Non-US Stocks Tend To Do Best When The US Dollar Is Weakening
As for the overall stock market, with the Fed still in the dovish camp, it is too early to turn negative on equities. An equity bear market is coming, but not until rising inflation forces the Fed to step up the pace of rate hikes. That will probably not happen until mid-2023. Short Gilt Trade Activated We noted last week that we would go short the 10-year UK Gilt if the yield broke below 0.85%. Our limit order was activated on November 5th and we are now short this security. Peter Berezin Chief Global Strategist pberezin@bcaresearch.com Footnotes 1 To distinguish between inside and outside money, one should ask where the liability resides. If the liability resides within the private sector, it is inside money. By convention, central bank reserves are classified as outside money. However, one could argue that since taxpayers ultimately own the central bank, an increase in the price level will benefit taxpayers by eroding the real value of the central bank’s liability. If one were to take this view, the Pigou effect would be even weaker. Global Investment Strategy View Matrix
Image
Special Trade Recommendations
Image
Current MacroQuant Model Scores
Image
BCA Research’s Emerging Markets Strategy service expects Philippine sovereign credit to outperform its EM counterparts. A negative outlook on overall EM sovereign credit warrants overweighting Philippine sovereign credit relative to its EM brethren. The…
Highlights So far, both the demand and supply side of the Philippine economy have been rather weak; yet there are signs that growth is set to revive. Fiscal expenditures have bottomed. Bank lending is also reviving. Acceleration in broad money supply is usually a good omen for stronger economic activity (Chart 1). Being a defensive market within EM, Philippine stocks will benefit in an impending period of weak EM stock prices. Upgrade this bourse from underweight to neutral in an EM equity portfolio. Philippine sovereign credit is also defensive in nature relative to its EM peers. Stay overweight in an EM portfolio. A deteriorating external accounts outlook makes the peso vulnerable. The central bank will also likely tolerate a weaker currency. Stay short the peso versus the US dollar. A vulnerable peso renders Philippine domestic bonds unappealing. Stay neutral in an EM domestic bonds portfolio. Feature The steep underperformance of Philippine stocks over the past several years is due for a pause. While this bourse may not see a sustainable rally in absolute terms, a period of flattish relative performance vis-à-vis the EM benchmark is likely. We recommend upgrading this market from underweight to neutral within an EM equity portfolio (Chart 2). Chart 1Accelerating Fiscal Spending And Credit Is A Good Omen For Economic Growth
Accelerating Fiscal Spending And Credit Is A Good Omen For Economic Growth
Accelerating Fiscal Spending And Credit Is A Good Omen For Economic Growth
Chart 2Philippine Stocks' Underperformance Is Set For A Breather But It's A Risk In Absolute Terms
Philippine Stocks' Underperformance Is Set For A Breather But It's A Risk In Absolute Terms
Philippine Stocks' Underperformance Is Set For A Breather But It's A Risk In Absolute Terms
One reason why Philippine stocks are unlikely to rally in absolute US dollar terms is a vulnerable peso. Philippine external accounts will likely deteriorate further, and therefore the peso is set to continue to trade on the weaker side. Currency investors should stick with our recommended short the peso versus US dollar trade for now. Philippine domestic bonds also remain unattractive to foreign investors. Local bond yields are not high enough relative to those of safe-haven bonds (US treasuries). As a result, the country is witnessing net debt portfolio outflows. The nation’s sovereign USD bonds, however, will likely outperform the EM benchmark going forward and merit an overweight stance in an EM sovereign bond portfolio. A Feeble Economy … The Philippine economy, so far, continues to be soft. Demand has been sluggish: manufacturing sales remain well below pre-pandemic levels – both in value and volume terms. So are car sales (Chart 3). On the supply side, production volume gives a similar message: they are still below pre-pandemic levels. Manufacturing PMI is barely in the expansion territory (Chart 4). In other words, there is palpable weakness in both the demand and supply side of the domestic economy. Chart 3The Demand Side Of The Economy Has Been Weak...
The Demand Side Of The Economy Has Been Weak...
The Demand Side Of The Economy Has Been Weak...
Chart 4...So Has Been The Supply Side
...So Has Been The Supply Side
...So Has Been The Supply Side
The soft domestic demand is also evident from the import cargo throughput in the country’s ports. While exports cargo has risen well above pre-pandemic levels, import cargo has not (Chart 5). Part of the reason behind the lingering frailty is muted fiscal spending. Over the past 12 months, the latter has decelerated measurably. To be sure, Philippine fiscal outlays during the entire pandemic period have not been extraordinary; and yet this has slowed further (Chart 6, top panel). Chart 5Weak Domestic Demand Is Also Evident In Still Subdued Imports
Weak Domestic Demand Is Also Evident In Still Subdued Imports
Weak Domestic Demand Is Also Evident In Still Subdued Imports
Chart 6Govt Spending Had Decelerated, Even As QE Proceeds Remained Unspent
Govt Spending Had Decelerated, Even As QE Proceeds Remained Unspent
Govt Spending Had Decelerated, Even As QE Proceeds Remained Unspent
The sharp widening seen in the country’s fiscal deficits had more to do with dwindling fiscal revenues, rather than strong spending. In fact, central bank data shows that most of its government bond purchase proceeds (‘QE’ proceeds) are unspent – still sitting in the government’s accounts with the central bank, i.e., they have not been channeled into the economy (Chart 6, bottom panel). … But Plenty Of Dry Powder Going forward, however, that picture is likely to change. The country is heading into general elections in May 2022. Lawmakers therefore have an incentive to spend the amount currently lying in the central bank. The amelioration in the number of new Covid-19 cases has enabled a re-opening of the economy, which will make stimulus spending easier. In addition, the federal budget for 2022 passed last month1 includes an 11.5% hike in government outlays. With core CPI at 3%, this translates into a robust 8.5% government expenditure growth rate in real terms. Chart 7Credit Is Finally Reviving
Credit Is Finally Reviving
Credit Is Finally Reviving
Beyond fiscal spending, the country’s bank credit might also gain some traction: During the pandemic, banks shunned loan disbursements. Lately, however, there are signs that credit is reviving (Chart 7). Real borrowing costs (prime lending rates deflated by core CPI) from banks are low, close to only 1%. Such low cost of credit should encourage new borrowing at a time when economic activity is resuming. On their part, banks have made sizeable provisions against the rising NPLs during the pandemic, and therefore have already taken a substantial hit on their books (Chart 8, top panel). Relatively cleaner balance sheets should encourage banks to lend. Banks have also been able to materially raise their operating efficiency in the past couple of years (by way of rising net interest income). As a result, operating margins have improved measurably. This has helped absorb part of the NPL-related losses and has somewhat cushioned the blow to banks’ bottom line (Chart 8, bottom panel). Relatively better margins (than otherwise would have been the case) should prompt banks to take relatively higher risks, i.e., expand their loan books going forward. Should fiscal authorities ramp up their spending, and should banks also begin to lend again, the activity that has resumed following a lessening of Covid-19 cases will get a fillip. Higher fiscal spending and bank credit will lift money supply in the economy, usually a good omen for stronger economic activity (see Chart 1 on page 1). Incidentally, inflation in the Philippines is under control. The relatively high headline inflation print is not indicative of any genuine inflationary pressures, and is due mostly to food prices, which account for 38% of the CPI basket. Core and trimmed mean CPI are much lower at around 3% (Chart 9, top panel). Chart 8Banks Have Cleaner Books Now As They Made Sizable NPL Provisions
Banks Have Cleaner Books Now As They Made Sizable NPL Provisions
Banks Have Cleaner Books Now As They Made Sizable NPL Provisions
Chart 9There Are No Genuine Inflationary Pressures In The Philippines
There Are No Genuine Inflationary Pressures In The Philippines
There Are No Genuine Inflationary Pressures In The Philippines
The central bank expects the headline inflation rate to decelerate to within its target band of 2% to 4% by the end of this year and settle close to the midpoint in 2022 and 2023. At the same time, Philippine nominal wages are barely growing (Chart 9, bottom panel). This implies that businesses have little margin pressures to raise their selling prices. Genuine inflationary pressures, therefore, are unlikely to become acute in the foreseeable future. That, in turn, will help keep fiscal and monetary policies accommodative. Domestic Bond Yields Will Stay Flattish With the resumption of economic activity, will come higher fiscal revenues. That should help the Philippine fiscal deficit to narrow. Narrower fiscal deficit in the Philippines is usually bond bullish (i.e., bond yields go down). Yet, lower bond yields will have negative implications for Philippine capital inflows. Foreign investors are the marginal buyers of Philippine bonds. And their appetite for the latter depends on how much extra yield the Philippines offers over safe-haven bonds (US treasuries). Chart 10 shows that whenever the yield differential narrows too much (to around 200 basis points), net debt portfolio inflows into the Philippines typically stop, and often turn into outflows. This is what is happening now. On the other end, when the differential widens enough (about 400 - 500 basis points), those outflows turn into inflows again. Chart 10The Philippines Need To Offer Relatively Higher Yields To Attract Capital Inflows
The Philippines Need To Offer Relatively Higher Yields To Attract Capital Inflows
The Philippines Need To Offer Relatively Higher Yields To Attract Capital Inflows
Given that we expect US long-term bond yields to rise, if Philippine bond yields do not rise at an even faster pace, its yield differential would stay low. Thus, the country will be hard-pressed to see any debt portfolio inflows in the near future. The absence of foreign buyers, in turn, would put a floor under bond yields. This will counterbalance any yield-suppressing forces coming from improving fiscal deficits. Thus, overall, the country will likely see flattish yields over the next six to nine months. And The Peso, Shaky Chart 11Debt Dominates The Philippines' Capital Inflows
Debt Dominates The Philippines' Capital Inflows
Debt Dominates The Philippines' Capital Inflows
Low bond yields and short-term interest rates will have negative ramifications for the currency: It’s the foreign debt flows, rather than equity investments, that dominate Philippine capital inflows. This is true for all categories of inflows: FDI, portfolio and other investments (Chart 11). The fact that debt investors are the dominant group among foreign investors has some implications. Debt investors do not like lower interest rates while equity investors do. As such, debt inflows into the Philippines diminish when the interest rates (bond yields) are relatively low. Muted foreign capital inflows, in turn, are bearish for the peso. The country’s current account outlook is also not rosy. The trade deficit has widened significantly, and the robust current account surplus has given way to deficits – in line with our forecast in our previous report. With domestic demand reviving (government spending, household consumption and business investment), imports will now likely grow faster than exports, and therefore, will weigh down on both trade and current account deficits further in the months ahead. Notably, the country’s overseas workers’ remittances have also rolled over in recent months. All these will be a headwind for the peso (Chart 12). As noted, the central bank does not expect inflation to overshoot their target in the next two years. They have also been a net buyer of US dollars year-to-date, i.e., they have been leaning against their currency. This implies that they would not mind a weaker currency – especially when the economy is still not strong, and inflation is not a threat. Incidentally, the peso is also about 7% expensive vis-à-vis the US dollar in purchasing power terms (Chart 13). Chart 12Current Account Balance Will Deteriorate As Rising Domestic Demand Fuels Imports
Current Account Balance Will Deteriorate As Rising Domestic Demand Fuels Imports
Current Account Balance Will Deteriorate As Rising Domestic Demand Fuels Imports
Chart 13The Peso Is Somewhat Expensive In PPP Terms And Is Vulnerable To A Downside
The Peso Is Somewhat Expensive In PPP terms And Is Vulnerable To A Downside
The Peso Is Somewhat Expensive In PPP terms And Is Vulnerable To A Downside
Equity Underperformance Is Late An improving fiscal balance is usually bullish news for Philippine stock multiples. The connection is via bond yields/interest rates. An improving fiscal balance leads to lower bond yields, which, in turn, boost this market which is dominated by interest rate sensitive sectors (real estate, financials/banks and utilities make up 50% of market cap). Chart 14Weak EM Stock Prices Herald Outperformance by The Defensive Philippine Markets
Weak EM Stock Prices Herald Outperformance by The Defensive Philippine Markets
Weak EM Stock Prices Herald Outperformance by The Defensive Philippine Markets
Yet, in this cycle, an improving fiscal balance may not herald a material fall in the country’s bond yields due to net debt portfolio outflows (as explained above). Thus, Philippine stocks would miss the tailwind from rising multiples. A dim outlook for the peso also calls for caution on the part of absolute-return foreign investors. That said, the resumption of economic activity will lead to rising earnings, and that should provide some tailwinds for this market. Moreover, as a defensive market within EM, Philippine stocks usually outperform the overall EM benchmark during periods of weak EM stock prices. Incidentally, we have a negative outlook on EM stock prices over the coming several months (Chart 14). Weighing all the pros and cons, we infer that Philippine stocks’ relative performance will likely be rangebound over the next six to nine months. Sovereign Credit Will Outperform Chart 15The Philippines' Sovereign Credit Outperforms During EM Risk-Off Periods, Stay Overweight
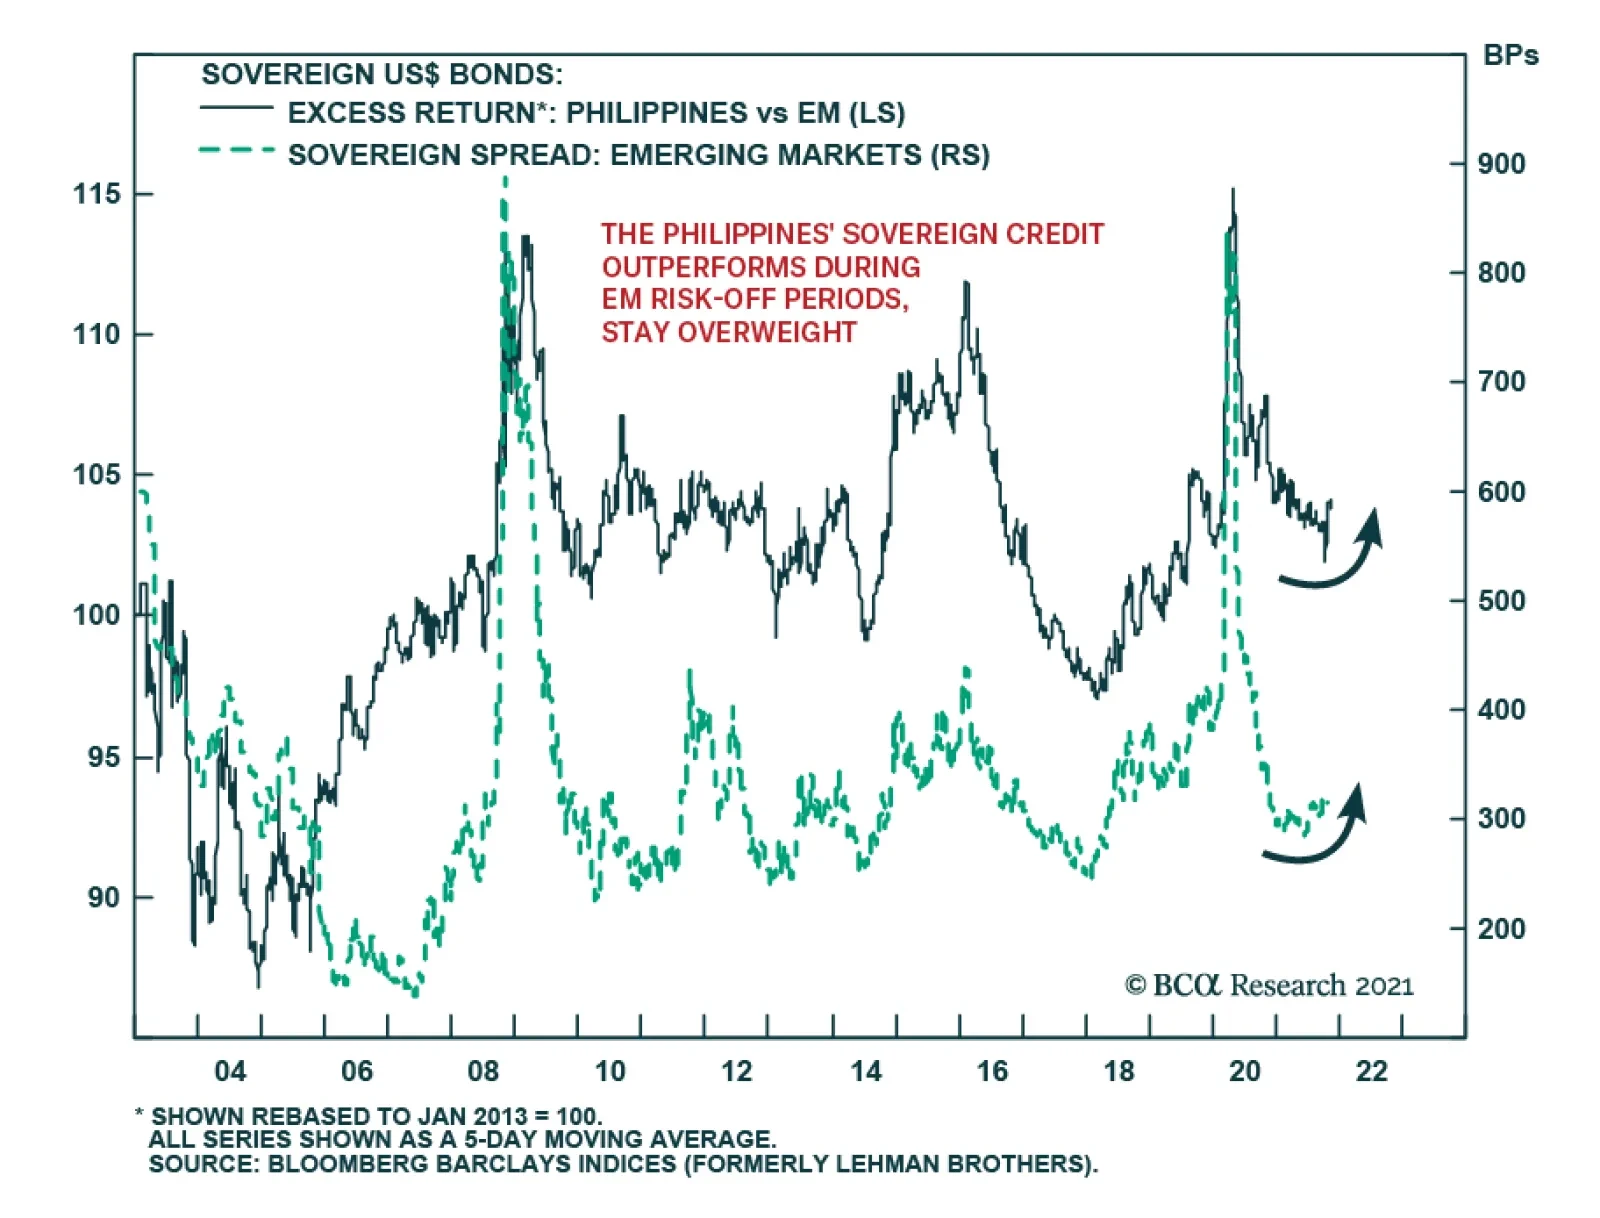
The Philippines' Sovereign Credit Outperforms During EM Risk-Off Periods, Stay Overweight
The Philippines' Sovereign Credit Outperforms During EM Risk-Off Periods, Stay Overweight
A negative outlook on overall EM sovereign credit warrants overweighting Philippine sovereign credit relative to its EM brethren. The reason is the defensive nature of the Philippine sovereign bond market – just like its equity market. During periods of stress, Philippine sovereign spreads widen much less than its EM peers. Chart 15 shows that in each of the last three risk-off periods (2008-09, 2015, 2020), Philippine sovereign credit massively outperformed the EM benchmark. The basis for the defensive features of Philippine sovereign credit is that the nation’s external public debt is quite low at 18% of GDP, down from 25% ten years back. Of this, foreign bonds outstanding are 10% of GDP, down from 12% ten years back (the rest being loans and contingent liabilities). Such low debt means the defensive nature of this market is unlikely to change soon. Hence, it makes sense to overweight Philippine sovereign bonds in view of impending sovereign credit spreads widening in the broader EM universe. Investment Conclusions Stocks: The Philippine economy will likely see some traction in the months ahead as fiscal spending rises and bank credit revives. This bourse’s relative performance will also benefit in an impending risk-off period in emerging markets. Asset allocators should upgrade this market from underweight to neutral in an EM equity portfolio. Our underweight call on this market vis-à-vis an EM equity portfolio has yielded a gain of 16% since we recommended it in October 2018. The Peso: The peso remains vulnerable in the face of deteriorating external accounts. Currency investors should stay with our recommended long USD/ short PHP trade for now. This call has yielded 2.1% so far since our recommendation on March 18, 2021. Chart 16Philippine Domestic Bonds Warrants A Neutral Allocation In An EM Portfolio
Philippine Domestic Bonds Warrants A Neutral Allocation In An EM Portfolio
Philippine Domestic Bonds Warrants A Neutral Allocation In An EM Portfolio
Domestic Bonds: Local currency bond yields in the Philippines are likely to stay flattish despite the slated improvements in the country’s fiscal balance. The peso is also set to stay weak. These call for a cautious stance on Philippine domestic bonds. Yet, they tend to do well relative to their EM counterparts during periods of EM stress – as they did in 2015 and in 2020 (Chart 16). Since another such period is around the corner, we recommend that investors maintain a neutral allocation of Philippine local currency bonds in an EM portfolio. Sovereign Bonds: Philippine sovereign bonds are set to outperform their EM counterparts. Asset allocators should stay overweight the Philippines in a dedicated EM sovereign bonds portfolio. Rajeeb Pramanik Senior EM Strategist rajeeb.pramanik@bcaresearch.com Footnotes 1 Passed in the third and final reading in the lower house and sent to the Senate, the upper house.
Highlights There is a high risk of a global demand shortfall in 2022. This is because consumer demand for services will remain well below its pre-pandemic trend… …while the recent booming demand for goods is crashing back to earth. Stay overweight 30-year T-bonds. In the equity market, underweight the ‘reflation’ sectors: specifically, underweight banks and basic resources. Stay overweight animal care. Overweight the interactive entertainment sector (look out for a Special Report on this sector coming out very soon). Fractal analysis: Overweight gas distribution. Feature Chart of the WeekSpending On Services In The US Is Still Far Below The Pre-Pandemic Trend. Will It Catch Up In 2022?
Spending On Services In The US Is Still Far Below The Pre-Pandemic Trend. Will It Catch Up In 2022?
Spending On Services In The US Is Still Far Below The Pre-Pandemic Trend. Will It Catch Up In 2022?
With inflation surging, you would be forgiven for thinking that global demand is red-hot. Sadly, global demand is not red-hot. Two years after the pandemic began, the lynchpin of demand – consumer spending on services – remains far below its pre-pandemic trend. For example, US consumer spending on services is around $420 billion, or 5 percent, below where it should be (Chart I-1). A similar story holds true in the UK and France (Chart I-2 and Chart I-3). Chart I-2Spending On Services Is Still Far Below The Pre-Pandemic Trend In The UK...
Spending On Services Is Still Far Below The Pre-Pandemic Trend In The UK...
Spending On Services Is Still Far Below The Pre-Pandemic Trend In The UK...
Chart I-3...And France
...And France
...And France
Still, overall US consumer spending is on trend. Just. But only thanks to an unprecedented largesse of fiscal and monetary stimulus. Begging the question, what will happen when the stimulus ends? If overall stimulated spending is just on trend while spending on services is in deficit, it means that spending on goods is in a mirror-image $420 billion surplus. Which, given the smaller share of spending on goods, equates to 8 percent above where it should be. One misconception is that the surplus in goods spending is concentrated in durables. While this was true six months ago, two-thirds of the current surplus is in nondurables, dominated by clothing and shoes, food and drink at home, and games, toys and hobbies (Chart I-4). Chart I-4US Overspend On Durables Is Now $140 Bn, While Overspend On Nondurables Is $280 Bn
US Overspend On Durables Is Now $140 Bn, While Overspend On Nondurables Is $280 Bn
US Overspend On Durables Is Now $140 Bn, While Overspend On Nondurables Is $280 Bn
Looking ahead, if the demand for goods crashes back to earth, as seems to be happening now, then the demand for services will have to catch up to its pre-pandemic trend. Otherwise there will be a deficit in aggregate demand. So, the crucial question for 2022 is, will services spending catch up to its pre-pandemic trend? Services Spending Will Remain Well Below Its Pre-Pandemic Trend Many people believe that the deficit in US services spending is due to the underspend in bars, restaurants, and hotels. In fact, this is another misconception. The underspending on ‘food services and accommodations’ is now a negligible $30 billion out of the $420 billion deficit. In which case, where is the deficit? Surprisingly, the biggest component is a $160 billion underspend on health care (Chart I-5). In particular, the spending on ‘outpatient physician services’ levelled off a year ago well below its pre-pandemic level (Chart I-6). A plausible explanation is that many doctor’s appointments have shifted to online, requiring much lower spending. The result is that health care consumption has slowed its convergence to the pre-pandemic trend, implying that a deficit could be persistent. Chart I-5US Underspend On Health Care ##br##Is $160 Bn
US Underspend On Health Care Is $160 Bn
US Underspend On Health Care Is $160 Bn
Chart I-6US Spending On Physician Services Is Far Below The Pre-Pandemic Trend
US Spending On Physician Services Is Far Below The Pre-Pandemic Trend
US Spending On Physician Services Is Far Below The Pre-Pandemic Trend
A second major component of the deficit is a $110 billion underspend on recreation services, as consumers have shunned the large or dense crowds in amusement parks, sports centres, spectator sports, and theatres. Some of this shunning of crowds will be long-lasting (Chart I-7). Chart I-7US Underspend On Recreation Services Is $110 Bn
US Underspend On Recreation Services Is $110 Bn
US Underspend On Recreation Services Is $110 Bn
A third major component of the deficit is a $60 billion underspend on public transportation, as people have likewise shunned the personal proximity required in mass transit systems and aeroplanes. Some of this shunning of transport that requires personal proximity will also be long-lasting (Chart I-8). Chart I-8US Underspend On Public Transportation Is $60 Bn
US Underspend On Public Transportation Is $60 Bn
US Underspend On Public Transportation Is $60 Bn
Worryingly, the recent spending on both recreation services and public transportation has stopped converging with the pre-pandemic trend. Admittedly, this might be a blip due to the delta wave of the pandemic, and spending could re-accelerate once this wave subsides. On the other hand, it would be prudent to assume that the delta wave was not the last wave of the pandemic and that further waves could arrive in 2022. Pulling all of this together, large parts of services spending will remain persistently below their pre-pandemic trend. Eventually, new and innovative types of services will plug this deficit, but this will take time. Therefore, we conservatively estimate that, at the end of 2022, US consumer spending on services will still be below its pre-pandemic trend by at least $200 billion, or 2.5 percent. Other major economies, like the UK and France, will suffer similar deficits. Goods Spending Will Crash Back To Earth Let’s now switch to the other side of the ledger, and assess to what extent the underspend in services can be countered by an overspend in goods. Spending on durables is already crashing back to earth. A surplus of $500 billion in March has collapsed to $140 billion now, and we fully expect it to fall back to zero. The reason is that durables, by their very definition, provide long-duration utility. Meaning that there are only so many cars, smartphones, and gadgets that any person can own. But what about the current $280 billion surplus on nondurables – can that be sustained? The biggest component of the nondurables surplus is a $85 billion, or 20 percent, overspend on clothes and shoes. Some of this overspend is justified by a wardrobe transition to the post-pandemic way of working and living. But clothes and shoes, though classified as nondurable, are in fact quite durable. Meaning that once the wardrobe transition is complete, we do not expect people to spend 20 percent more on clothes and shoes than they did before the pandemic (Chart I-9). Chart I-9US Overspend On Clothes And Shoes Is $85 Bn
US Overspend On Clothes And Shoes Is $85 Bn
US Overspend On Clothes And Shoes Is $85 Bn
A second major component of the nondurables surplus is a $75 billion, or 7 percent, overspend on food and beverages at home. To a large extent, this has been a displacement of the underspending on eating and drinking out. But given that this underspend on eating and drinking out has almost normalised, we expect the overspend on eating and drinking at home to fade (Chart I-10). Chart I-10US Overspend On Food And Drink At Home Is $75 Bn
US Overspend On Food And Drink At Home Is $75 Bn
US Overspend On Food And Drink At Home Is $75 Bn
A third major component of the nondurables surplus is a $45 billion, or 16 percent, overspend on recreational items: games, toys, hobbies, and pets and pet products (Chart I-11 and Chart I-12). To a large extent, this has been a displacement of the underspend on recreation services involving crowds, which will last. Hence, we expect the nondurable surplus on recreational items also to last, to the benefit of the animal care sector and the interactive (electronic) entertainment sector. Chart I-11US Overspend On Games, Toys, And Hobbies Is $45 Bn
US Overspend On Games, Toys, And Hobbies Is $45 Bn
US Overspend On Games, Toys, And Hobbies Is $45 Bn
Chart I-12Spending On Pets Is ##br##Booming
Spending On Pets Is Booming
Spending On Pets Is Booming
Pulling all of this together, we expect the $140 billion surplus on durables to disappear fully, and the $280 billion surplus on nondurables to fade to well below $200 billion. Therefore, given that the deficit on services is likely to be above $200 billion, there is a high risk of a consumer demand deficit in 2022. Four Investment Conclusions The ultra-long end of the bond market is figuring out that without sustained above-trend demand, you cannot get sustained inflation. And to repeat, if demand is barely on trend after an unprecedented largesse of fiscal and monetary stimulus, then what will happen when the stimulus ends? All of which leads to four investment conclusions: Stay overweight 30-year T-bonds. In the equity market, underweight the ‘reflation’ sectors: specifically, underweight banks and basic resources. Stay overweight animal care. Overweight the interactive entertainment sector (look out for a Special Report on this sector coming out very soon). Gas Distribution Is Oversold Finally, one of the paradoxes of skyrocketing natural gas prices is that it has badly hurt the gas distributors which, for the most part, have not been able to pass on the higher prices in full to end users. The resulting margin squeeze has caused a sharp recent underperformance, which is now fragile on its 65-day/130-day composite fractal structure (Chart I-13). Chart I-13Gas Distribution Is Oversold
Gas Distribution Is Oversold
Gas Distribution Is Oversold
Given this fractal fragility combined with the recent correction in natural gas prices, a recommended trade would be to overweight global gas distribution versus banks, setting a profit target and symmetrical stop-loss at 5 percent. Dhaval Joshi Chief Strategist dhaval@bcaresearch.com Fractal Trading System Fractal Trades 6-Month Recommendations Structural Recommendations Closed Fractal Trades Indicators To Watch - Bond Yields Chart II-1Indicators To Watch - Bond Yields ##br##- Euro Area
Indicators To Watch - Bond Yields - Euro Area
Indicators To Watch - Bond Yields - Euro Area
Chart II-2Indicators To Watch - Bond Yields ##br##- Europe Ex Euro Area
Indicators To Watch - Bond Yields - Europe Ex Euro Area
Indicators To Watch - Bond Yields - Europe Ex Euro Area
Chart I-3Indicators To Watch - Bond Yields ##br##- Asia
Indicators To Watch - Bond Yields - Asia
Indicators To Watch - Bond Yields - Asia
Chart I-4Indicators To Watch - Bond Yields ##br##- Other Developed
Indicators To Watch - Bond Yields - Other Developed
Indicators To Watch - Bond Yields - Other Developed
Indicators To Watch - Interest Rate Expectations Chart I-5Indicators To Watch - Interest Rate Expectations
Indicators To Watch - Interest Rate Expectations
Indicators To Watch - Interest Rate Expectations
Chart I-6Indicators To Watch - Interest Rate Expectations
Indicators To Watch - Interest Rate Expectations
Indicators To Watch - Interest Rate Expectations
Chart I-7Indicators To Watch - Interest Rate Expectations
Indicators To Watch - Interest Rate Expectations
Indicators To Watch - Interest Rate Expectations
Chart I-8Indicators To Watch - Interest Rate Expectations
Indicators To Watch - Interest Rate Expectations
Indicators To Watch - Interest Rate Expectations
US TIPS breakeven inflation rates surged on Wednesday following the hotter than expected CPI release. The 1-year breakeven inflation rate ended the day up 20 bps. Similarly, the 5-year breakeven inflation rate surged 11 bps to a record high of 3.1%. Market…
Highlights Fed/BoE: Both the Fed and the Bank of England found ways to talk down 2022 rate hike expectations discounted in US and UK bond markets. This is only a temporary reprieve, however, as the near-term uncertainties over the persistence of cost-push inflation will eventually be overwhelmed by medium-term certainties of demand-pull inflation confirmed by tightening labor markets. Stay underweight US Treasuries and UK Gilts in global bond portfolios. US Treasury Curve: Longer-term US Treasury yields are priced too low relative to the likely peak in the fed funds rate in the next cycle. Position for a steeper US Treasury curve until Fed rate hikes are imminent, which will likely not be until Q4/2022. Feature Chart of the WeekShifting Rate Expectations Driving Bond Yields As QE Fades
Shifting Rate Expectations Driving Bond Yields As QE Fades
Shifting Rate Expectations Driving Bond Yields As QE Fades
Bond market uncertainty about future monetary policy moves is on the rise. Bond volatility has picked up, most notably at the front end of yield curves that are most sensitive to rate hike expectations which have been intensifying. Yet last week, the Federal Reserve and Bank of England (BoE) were able to talk bond investors off the ledge – at least, temporarily - by pushing back against expectations of multiple rate hikes in the US and UK in 2022. Central bankers in those countries are stuck in a difficult spot. Inflation is high enough to warrant some tightening of monetary policy. Yet there are lingering concerns over how long the current upturn in global inflation will last. Meanwhile, there are just enough questions on the underlying pace of economic momentum to require policymakers to see more data, especially in labor markets, before feeling comfortable enough to pull the trigger on actual rate hikes. We now see that happening first in the UK early next year, and in the US in late 2022. One thing that is certain is that the ups and downs of interest rate expectations – and the central bank forward guidance that influences them – will increasingly become the more dominant driver of bond yields and yield curve shape as global pandemic bond-buying programs get wound down (Chart of the Week). On that front, we see more potential for bond-bearish steepening in the UK and US over the next several months. The BoE: Another Bad Date With The Unreliable Boyfriend The UK financial press infamously dubbed the BoE “the unreliable boyfriend”, under the leadership of former Governor Mark Carney, for hinting at interest rate increases that never materialized. At last week’s Monetary Policy Committee (MPC) meeting, rates were kept unchanged in a 7-2 vote despite some intense signaling in recent weeks that a rate hike was imminent. Under current BoE Governor Andrew Bailey, this edition of the MPC is more like an indecisive spouse than unreliable boyfriend. On the one hand, there is a clear overshoot of UK inflation (and inflation expectations) that would justify a rate hike as soon as possible (Chart 2). The BoE’s new economic forecasts presented in the November Monetary Policy Report (MPR) called for headline CPI inflation to reach a peak of 5% in April 2022 – significantly higher than the 4% late-2021 forecast from the August MPR. On the other hand, high current inflation is already having a dampening effect on economic sentiment. The GfK index of UK consumer confidence is down -10% from the peak seen in July, despite diminishing concerns over COVID seen in public opinion polls (Chart 3, middle panel). A similar divergence is evident in the BoE’s Decision Maker Panel survey of UK Chief Financial Officers, which showed that uncertainty over future sales was somewhat elevated compared to diminished concerns about COVID and Brexit (bottom panel). Chart 2Fed/BoE Cannot Stay Dovish For Much Longer
Fed/BoE Cannot Stay Dovish For Much Longer
Fed/BoE Cannot Stay Dovish For Much Longer
Chart 3High UK Inflation Raises Growth Uncertainty
High UK Inflation Raises Growth Uncertainty
High UK Inflation Raises Growth Uncertainty
The BoE highlighted these divergences in economic sentiment series in the November MPR as examples of how high inflation, fueled by global supply chain disruptions and soaring energy prices, introduced uncertainty into the central bank’s forecasts. Even more uncertainty exists in the BoE’s ability to assess the amount of spare capacity, and underlying inflationary pressure, in the UK economy. The BoE dedicated a 9-page section of the November MPR to a discussion about estimating the growth of the supply-side of the UK economy, evidence of how difficult that process has become during the COVID era. The BoE concluded that the pandemic would end up reducing the level of UK potential supply by -2% from pre-COVID levels, even though the growth rate would return to a pre-pandemic pace of around 1.5% by 2023-24. This is a combination that makes setting monetary policy tricky. Reduced supply indicates that the UK economy has a smaller output gap with more inflationary pressure that would require higher interest rates. Yet sluggish growth in potential supply implies that the UK equilibrium interest rate is likely still very low, thus the BoE would not have to raise rates much to get policy back to neutral. This uncertainty over the size of the output gap in the UK economy will force to BoE to focus more on the labor market as the best “real-time” measure of spare capacity. On that front, the evidence is also difficult to interpret. The UK unemployment rate fell to 4.5% over the three months to August, the last available data before the UK government’s COVID furlough schemes, which protected worker incomes hit by COVID job losses, ended on September 30. The UK Office of National Statistics estimates that there were between 900,000 and 1.4 million UK workers furloughed in late September, representing a significant source of labor supply to be absorbed when the government income assistance ends. Thus, the BoE would need to see at least a month or two of post-furlough employment reports – not just job growth, but labor force participation - to assess how quickly those workers were being reabsorbed into the UK labor market. By the BoE’s own estimates, the impact of the furlough schemes, combined with the compositional issues arising from pandemic job losses being borne more by lower-wage workers, boosted UK wage growth by 2.2% (Chart 4, bottom panel). “Underlying” wage growth, net of those effects, is 0.6%, above the pre-COVID peak, suggesting a tightening labor market before the return of furloughed workers to the labor force. In the end, we see the BoE’s November non-hike as nothing more than a delay of the inevitable. While a December hike is possible, this would represent a “double tightening” of monetary policy with the current BoE quantitative easing program set to expire at year-end. The more likely date for a rate hike is now February. This would give the MPC a few months of post-furlough labor data to assess the amount of spare capacity in UK labor markets. We expect the data to show enough underlying health in labor demand relative to supply for the BoE to conclude that accelerating wage growth represents a more sustainable form of UK inflation in 2022 than energy prices or supply-chain disruptions were in 2021, justifying a move to begin hiking rates. We continue to recommend positioning for a steeper UK Gilt curve, focused on longer-maturities where yields were too low relative to even a moderate future BoE rate hike cycle (Chart 5). We entered a new tactical butterfly spread trade last week, going long the 10-year Gilt bullet versus a duration-neutral 7-year/30-year barbell – we continue to like that trade as a way to play for eventual BoE rate hikes in the first half of 2022. Chart 4BoE Needs More Employment Data To Confirm Wage Uptrend
BoE Needs More Employment Data To Confirm Wage Uptrend
BoE Needs More Employment Data To Confirm Wage Uptrend
Chart 5Stay In UK Long-End Gilt Curve Steepeners
Stay In UK Long-End Gilt Curve Steepeners
Stay In UK Long-End Gilt Curve Steepeners
Bottom Line: The Bank of England is still on a path to begin rate hikes, either in December or, more likely, February of next year. Stay underweight UK Gilts. Position For A Steeper US Treasury Curve The Fed announced last week that tapering would begin right away in November, in a move that has been hinted at since the summer. The monthly pace of purchases of Treasuries and Agency MBS will decline by $10 billion and $5 billion, respectively in November and also December. The Fed declined to commit to any specific tapering amounts beyond that, although it seems likely that the same monthly pace of reduction will continue in 2022. This would take the buying of Treasuries and MBS, net of maturing debt, to zero by June of next year, clearing the first necessary hurdle before the FOMC could contemplate a hike in the funds rate. A completion of the taper by June has been hinted at in the speeches of several Fed officials in recent weeks. This is a bit faster than the expected pace of tapering seen in the most recent New York Fed Primary Dealer and Market Participant Surveys from September (Chart 6), but should not be categorized as a hawkish surprise. There were also few bond-bearish signals on future policy moves hinted at by Fed Chair Jay Powell in post post-FOMC meeting press conference.
Chart 6
Chart 7Upside Risk To UST Yields From A Tightening Labor Market
Upside Risk To UST Yields From A Tightening Labor Market
Upside Risk To UST Yields From A Tightening Labor Market
Powell did note that it was still not clear how long the current supply chain/commodity price driven surge in inflation would persist into next year. The expectation, however, was that these forces would eventually subside and allow US inflation to return back to levels much closer to the Fed’s 2% target. Given the uncertainties in the timing of that peak and decline in US inflation, the Fed has limited ability to calibrate any post-taper rate hikes by focusing solely on inflation - especially with longer-term inflation expectations still at levels consistent with the Fed’s target. The Fed will continue to look at US labor market developments to determine the timing and pace of future rate hikes. The last set of FOMC economic projections compiled for the September meeting have the US unemployment rate falling to 3.8% next year, below the median FOMC estimate of full employment at 4%, with one 25bp rate hike penciled in for 2022. We can use that as a baseline assumption on what the Fed considers to be the level of “maximum employment” that would need to be reached before rate hikes could begin. The US unemployment rate fell to 4.6% in October, thus there is still some more to go before hitting that 3.8% rate hike threshold. Yet among the FOMC members, the estimates of full employment range from 3.5%-4.5%, so the October print did knock on the door of that range (Chart 7, middle panel). With US wage growth already showing signs of breaking out – the Atlanta Fed Wage Tracker hit a 14-year high of 14% in September (bottom panel), while the Employment Cost Index rose by a record quarterly pace of 1.3% in Q3 – the Fed will likely be under a lot of pressure to begin hiking rates soon after the taper is expected to end next June. Chart 8UST Curve Forwards Too Flat Vs. Likely Fed Rate Hikes
UST Curve Forwards Too Flat Vs. Likely Fed Rate Hikes
UST Curve Forwards Too Flat Vs. Likely Fed Rate Hikes
We still see December 2022 as the most likely liftoff date, although a faster decline in unemployment could move that timetable forward. The bigger issue for the US Treasury market, however, is not the timing of liftoff but how fast the pace of hikes will be afterward. On that note, future rate expectations are still far too low. For example, according to the New York Fed’s Primary Dealer Survey, the fed funds rate is expected to average only 1.7% over the next ten years (top panel), a level that has proved to be a ceiling for the 10-year Treasury yield so far in 2021. Our colleagues at BCA Research US Bond Strategy recently made the case for expecting the US Treasury curve to bearishly steepen in the coming months. In their view, longer-maturity Treasury yield forward rates were too low compared to a fair value determined by the likely path for the funds rate that assumes rate hikes start in December of next year and rise by 100bps per year to a terminal rate of 2.08% (Chart 8). Interestingly, 2-year Treasury forward rates were in line with the projections of our US Bond Strategy team’s fair value framework. We fully agree with our US Bond colleagues on the likelihood of future Treasury curve steepening. This fits with our views on many developed market countries, not just the US, where longer-maturity bond yields were pricing in too few future rate hikes relative to what was likely to occur over the next few years. Even when taking a much longer perspective, the US Treasury curve looks too flat right now. Going back to the mid-1980s, the current 2-year/10-year US Treasury curve slope of just over 100bps has never been reached (in a flattening move) in the absence of actual Fed rate hikes (Chart 9). Chart 9UST Curve Has Never Been This Flat Without Some Actual Fed Rate Hikes
UST Curve Has Never Been This Flat Without Some Actual Fed Rate Hikes
UST Curve Has Never Been This Flat Without Some Actual Fed Rate Hikes
This week, we are adding a new trade to our Tactical Overlay table to benefit from this expected move in the US yield curve, a US Treasury 2-year/10-year curve steepener (combined with a position in cash, or US 3-month treasury bills, to make the entire trade duration-neutral). We are also taking profits on our previous Tactical US curve flattening trade, which has returned 0.84% since initiation back in June. The exact securities and weightings for our new trade can be found in the Tactical Overlay Trades table below. Bottom Line: Longer-term US Treasury yields are priced too low relative to the likely peak in the fed funds rate in the next cycle. Position for a steeper US Treasury curve until Fed rate hikes are imminent, which will likely not be until Q4/2022. Robert Robis, CFA Chief Fixed Income Strategist rrobis@bcaresearch.com Recommendations Duration Regional Allocation Spread Product Tactical Overlay Trades GFIS Model Bond Portfolio Recommended Positioning Active Duration Contribution: GFIS Recommended Portfolio Vs. Custom Performance Benchmark
Image
The GFIS Recommended Portfolio Vs. The Custom Benchmark Index
To determine how to position within the Treasury market, BCA Research’s US Bond Strategy service translates its views on the timing of Fed liftoff into fair value estimates for different segments of the Treasury curve. The team assumes a scenario where the…
Revelations that Lael Brainard was interviewed last week for the position of Fed chair sparked speculation that monetary policy will shift in a more dovish direction once Jerome Powell’s term expires in February. Inflation breakevens moved up in response to…