Fixed Income

Highlights Energy Prices & Bond Yields: Surging energy prices are lifting inflation expectations in the US and Europe, while at the same time dampening consumer confidence amid diminished perceptions of real purchasing power. These conflicting trends are putting central banks in a tricky spot in the near-term, but tightening labor markets will force a more enduring need for dialing back global monetary accommodation in 2022, led by the Fed and the Bank of England. Stay below-benchmark on global duration exposure, favoring euro area government debt over US Treasuries and UK Gilts. High-Yield: Trans-Atlantic junk bond performance has diverged of late, with euro area spreads widening versus the US. This is a temporary distortion created by the pop in oil prices, with the Energy sector that benefits from higher oil prices representing a far greater share of the high-yield universe in the US compared to Europe. Maintain an overweight stance on European high-yield corporates. Feature Chart of the WeekGlobal Bond Yield Breakout?
Global Bond Yield Breakout?
Global Bond Yield Breakout?
It is not easy being an inflation-targeting central bank these days. Soaring energy prices, with the Brent crude benchmark price climbing to a 3-year high of $86/bbl last week and natural gas prices up nearly four-fold year-to-date in Europe. These moves are adding upward pressure to inflation rates already elevated because of disrupted supply chains and rising labor costs. Government bond yields in the developed markets are moving higher in response, driven by rising inflation breakevens and increasing central bank hawkishness that is causing a stir in negative real yields (Chart of the Week). Among the three most important developed economy central banks - the Fed, the ECB and the Bank of England (BoE) – the most forceful signaling of a need for tighter policy is surprisingly coming from Threadneedle Street in London, home to one of the most dovish central banks since the 2008 crisis. Numerous BoE officials, including Governor Andrew Bailey, have strongly hinted that UK rate hikes could begin as soon as next month’s policy meeting. Fed officials have suggested a similar timetable for the start of the QE taper. By contrast, members of the ECB Governing Council have paid lip service to the recent sharp pickup in euro area inflation but, for the most part, have stuck to the view that it will not last long enough to justify a policy response. The relative hawkishness among “The Big Three” central banks fits with our current recommended strategy on global duration exposure, staying below-benchmark, and country allocation, with the largest underweights to US Treasuries and UK Gilts. Should Central Banks Focus More On Inflation Or Growth? Monetary policymakers are in a difficult spot at the moment. Rising energy prices have breathed new life into inflation, and inflation expectations, even as global growth momentum has cooled off somewhat. Given the magnitude and breadth of the global energy price surge – even coal prices in China have shot up 120% since late August - it will be difficult for central bankers to “see through” the inflationary implications and worry more about growth (Chart 2). Rising energy prices are likely to extend the current global inflation upturn that has already gone on for longer than expected because of supply-chain disruptions. This raises the risk that consumers could turn more cautious on spending behavior if they have to devote more of their incomes just to fuel their cars or heat their homes. In the US, this dynamic already appears to be playing out. The acceleration of inflation has broadened out, with the Cleveland Fed’s trimmed mean CPI inflation measure (which removes the most volatile components of the CPI) rising to 3.5% in September (Chart 3, top panel). With US consumers seeing higher prices on a wider range of goods and services, they have raised their inflation expectations. The preliminary October University of Michigan US consumer confidence survey showed that 1-year-ahead inflation expectations rose to a 13-year high of 4.8% (middle panel). Chart 2Pouring Gas On Global Inflation
Pouring Gas On Global Inflation
Pouring Gas On Global Inflation
The New York Fed’s consumer survey showed a similar 1-year-ahead inflation forecast (5.3%), which is well above the forecast for income growth in 2022 (2.9%). Combining those two measures shows that US consumers implicitly see a contraction in their real incomes over the next 12 months. Chart 3US Consumers Expect A Sharp Decline In Real Purchasing Power
US Consumers Expect A Sharp Decline In Real Purchasing Power
US Consumers Expect A Sharp Decline In Real Purchasing Power
This has likely played a big role in the sharp fall in the University of Michigan consumer confidence index since the peak back in June (bottom panel), despite favorable US labor market conditions. US consumer perceptions of inflation appear much greater than the reality of inflation evident in the official price indices. The New York Fed survey also asks US consumers what their 1-year-ahead expectations are for major spending categories, like food or rent (Chart 4). Consumers expect somewhat slower inflation for food (7.0%) and gasoline (5.9%) over the next year, yet they also expect much higher medical care costs (9.4%) and rent (9.7%). For the latter two, those are considerably higher than the latest actual inflation rates seen in the US CPI (2.4% for rent, 0.4% for medical care) or PCE deflator (2.1% for rent, 2.4% for medical care). Taking these survey results at face value, it is likely that US consumers are overestimating how much their real incomes will suffer next year from higher inflation. This is especially true as US household income growth will likely surpass the 2.9% estimate seen in the New York Fed survey. Yet that does not preclude the Fed from starting to turn more hawkish. Central bankers are always on the lookout for signs that higher realized inflation is feeding through into rising inflation expectations, which could require a policy tightening response to prevent an overshoot of inflation targets. The Fed has given itself a bit more leeway in that regard by altering their policy framework to allow temporary deviations of inflation from the central bank targets. The BoE, however, has not given itself the same sort of flexibility, which is why it is now signaling an imminent rate hike in response to survey-based inflation expectations, and breakeven inflation rates on longer-dated index-linked Gilts, climbing to close to 4% (Chart 5). Yet even the Fed, with its Average Inflation Targeting framework, has signaled that a tapering of its bond purchases will likely begin by year-end. Chart 4US Consumer Inflation Expectations Well Above Actual Inflation
US Consumer Inflation Expectations Well Above Actual Inflation
US Consumer Inflation Expectations Well Above Actual Inflation
Markets are looking at the persistence of high inflation and have priced in a more hawkish trajectory for interest rates in the US, UK and even Europe over the next 12-24 months (Chart 6, bottom panel). Chart 5Inflation Weighing On UK & European Consumer Confidence
Inflation Weighing On UK & European Consumer Confidence
Inflation Weighing On UK & European Consumer Confidence
Real bond yields in those regions are also starting to move higher in response to rising rate expectations (third panel) - a bond-bearish dynamic that we have discussed at length in recent reports.1 Between those three, the BoE’s hawkish turn has hammered the Gilt market the hardest. Yet there has definitely been a spillover into rate expectations and bond yields in other countries on the back of the BoE guidance. We have already seen rate hikes from smaller developed market central banks, Norway and New Zealand, over the past month. If a major central bank like the BoE soon follows suit because of overshooting inflation expectations, then markets are justified in thinking that the Fed or even the ECB could be next. Of those “Big 3” central banks, we see the ECB as being the least likely to respond to the current inflation upturn with rate hikes in 2022. There is simply not enough evidence suggesting that the energy/supply-chain driven inflation in the euro area is broadening out into other parts of the economy on a sustainable basis. Furthermore, there is already some degree of monetary tightening “scheduled” in 2022 when the ECB’s pandemic bond purchase program expires in March. The ECB will not want to compound that by moving into rate hiking mode soon after. On the other hand, the Fed will likely see enough further tightening of US labor market conditions to begin hiking rates in the fourth quarter of 2022 (Chart 7). In the UK, After next month’s likely rate hike, the BoE will need to deliver at least another 50-75bps of additional hikes in 2022 and likely more in 2023 with real policy rates already well below neutral before the latest spike in energy prices. Chart 6Expect Higher Real Yields As Central Banks Turn More Hawkish
Expect Higher Real Yields As Central Banks Turn More Hawkish
Expect Higher Real Yields As Central Banks Turn More Hawkish
Chart 7Labor Markets, Not Commodities, Will Dictate Monetary Policy In 2022
Labor Markets, Not Commodities, Will Dictate Monetary Policy In 2022
Labor Markets, Not Commodities, Will Dictate Monetary Policy In 2022
With the Fed and BoE set to be far more hawkish than the ECB next year, we see greater risks of government bond yields rising faster, and higher than current forward rates, in the US and UK compared to the euro area (Chart 8). This justifies an overall cautious strategic stance on duration exposure in global bond portfolios. With regards to inflation-linked bonds, however, we recommend only a neutral overall stance. Elevated inflation breakevens have converged to, or even above, central bank inflation targets in all developed market economies (excluding Japan). 10-year UK breakevens, in particular, look very expensive on our fair value model (Chart 9). Chart 8Our Recommended "Big 3" Country Allocations
Our Recommended 'Big 3' Country Allocations
Our Recommended 'Big 3' Country Allocations
Chart 9Maintain An Overall Neutral Stance On Inflation-Linked Bonds
Maintain An Overall Neutral Stance On Inflation-Linked Bonds
Maintain An Overall Neutral Stance On Inflation-Linked Bonds
Bottom Line: Our view on the policy decisions of the Big 3 central banks in 2022 informs our strategic (6-18 months) investment strategy within those markets. Stay below-benchmark on overall global duration exposure, favoring euro area government debt over US Treasuries and UK Gilts. Fade The Recent Backup In European High Yield Spreads Chart 10A Slight Pickup In European Junk Spreads
A Slight Pickup In European Junk Spreads
A Slight Pickup In European Junk Spreads
Corporate credit markets in the US and Europe have calmed down since the July/August “Delta fueled” selloff with one notable exception – European high-yield (HY). The Bloomberg European HY index spread now sits 39bps above the September low, noticeably diverging from the US HY index spread (Chart 10). We view those wider spreads as a tactical buying opportunity for European junk bonds, both in absolute terms and versus US junk bonds. The recent underperformance appears rooted in soaring European energy prices. The spread widening has been concentrated in European consumer sectors (both cyclicals and non-cyclicals) that would be more exposed to the drain on real incomes from booming natural gas prices. Energy is also a smaller part of the European high-yield index (2%) compared to the US HY index (13%), which helps explain the performance gap with the US – the US index is more exposed to companies that benefit from higher energy prices (Chart 11). Chart 11Sectoral Breakdown Of US & Euro Area High-Yield Indices
Central Banks Backed Into A Corner
Central Banks Backed Into A Corner
Over a more medium-term perspective, there is little reason why there should be a meaningful performance difference between US and European HY. The path of spreads and excess returns (versus duration-matched government debt) for the two markets have been highly correlated in recent years (Chart 12). When adjusting European HY returns to allow a proper apples-to-apples comparison to US HY – by hedging European returns into US dollars and controlling for duration differences between the two markets – there has been little sustained difference in returns dating back to 2018. Chart 12Euro Area HY Has Closed The Gap Vs. The US
Euro Area HY Has Closed The Gap Vs. The US
Euro Area HY Has Closed The Gap Vs. The US
Chart 13Junk Default Rates Will Stay Low In 2022
Central Banks Backed Into A Corner
Central Banks Backed Into A Corner
More fundamentally, there is little difference in default rates that would justify a major divergence of HY spreads on both sides of the Atlantic. Moody’s is forecasting a HY default rate for a rate of 2% in both the US and Europe for 2022 (Chart 13). Such similar default rate expectations make sense with economic growth likely to remain well above trend in 2022 in both the US and Europe. Higher inflation will also boost nominal GDP growth, helping lift corporate revenues and the ability to service debt. From a valuation perspective, there is also little to choose from between European and US HY: The default-adjusted spread, which takes the current HY index spread and subtracts expected default losses over the next twelve months, is 196bps in Europe and 166bps in the US (Chart 14). While those spreads are below the post-2000 mean in both markets, they are still above past valuation extremes. The percentile ranking of 12-month breakeven spreads (the amount of spread widening over one year that would eliminate the yield advantage of HY over duration-matched government bonds) are also similar, 25% for European HY and 26% for US HY (Chart 15). These suggest HY spreads are not particularly “cheap”, from a historical perspective, in either market, but they could move lower to reach previous historical extremes. Chart 14Low Expected Default Losses Supporting HY Valuations
Low Expected Default Losses Supporting HY Valuations
Low Expected Default Losses Supporting HY Valuations
Chart 15Overall HY Spreads Are Tight In The US & Europe
Overall HY Spreads Are Tight In The US & Europe
Overall HY Spreads Are Tight In The US & Europe
Chart 16Euro Area Ba-Rated HY Spreads Look More Attractive
Central Banks Backed Into A Corner
Central Banks Backed Into A Corner
Summing it all up, there is no discernable reason why European HY should trade at a sustainably wider spread to US HY, outside of the compositional issue related to the weight of the Energy sector in both markets. When breaking down the two markets by credit rating buckets, European Ba-rated corporates even look more attractive versus similarly-rated US corporates, based on 12-month breakeven spread percentile rankings (Chart 16). Bottom Line: Maintain a strategic overweight stance on European high-yield corporates, and tactically position for some relatively better performance of European junk bonds versus US equivalents. Robert Robis, CFA Chief Fixed Income Strategist rrobis@bcaresearch.com Footnotes 1 Please see BCA Research Global Fixed Income Strategy Report, "What If Higher Inflation Is Not Transitory?", dated September 23, 2021, available at gfis.bcaresearch.com. Recommendations Duration Regional Allocation Spread Product Tactical Trades GFIS Model Bond Portfolio Recommended Positioning Active Duration Contribution: GFIS Recommended Portfolio Vs. Custom Performance Benchmark
Central Banks Backed Into A Corner
Central Banks Backed Into A Corner
The GFIS Recommended Portfolio Vs. The Custom Benchmark Index
BCA Research’s US Bond Strategy service concludes that investors should position for higher short-maturity real yields. The market’s near-term rate expectations have risen considerably during the past few weeks. While our colleagues think that pricing looks…
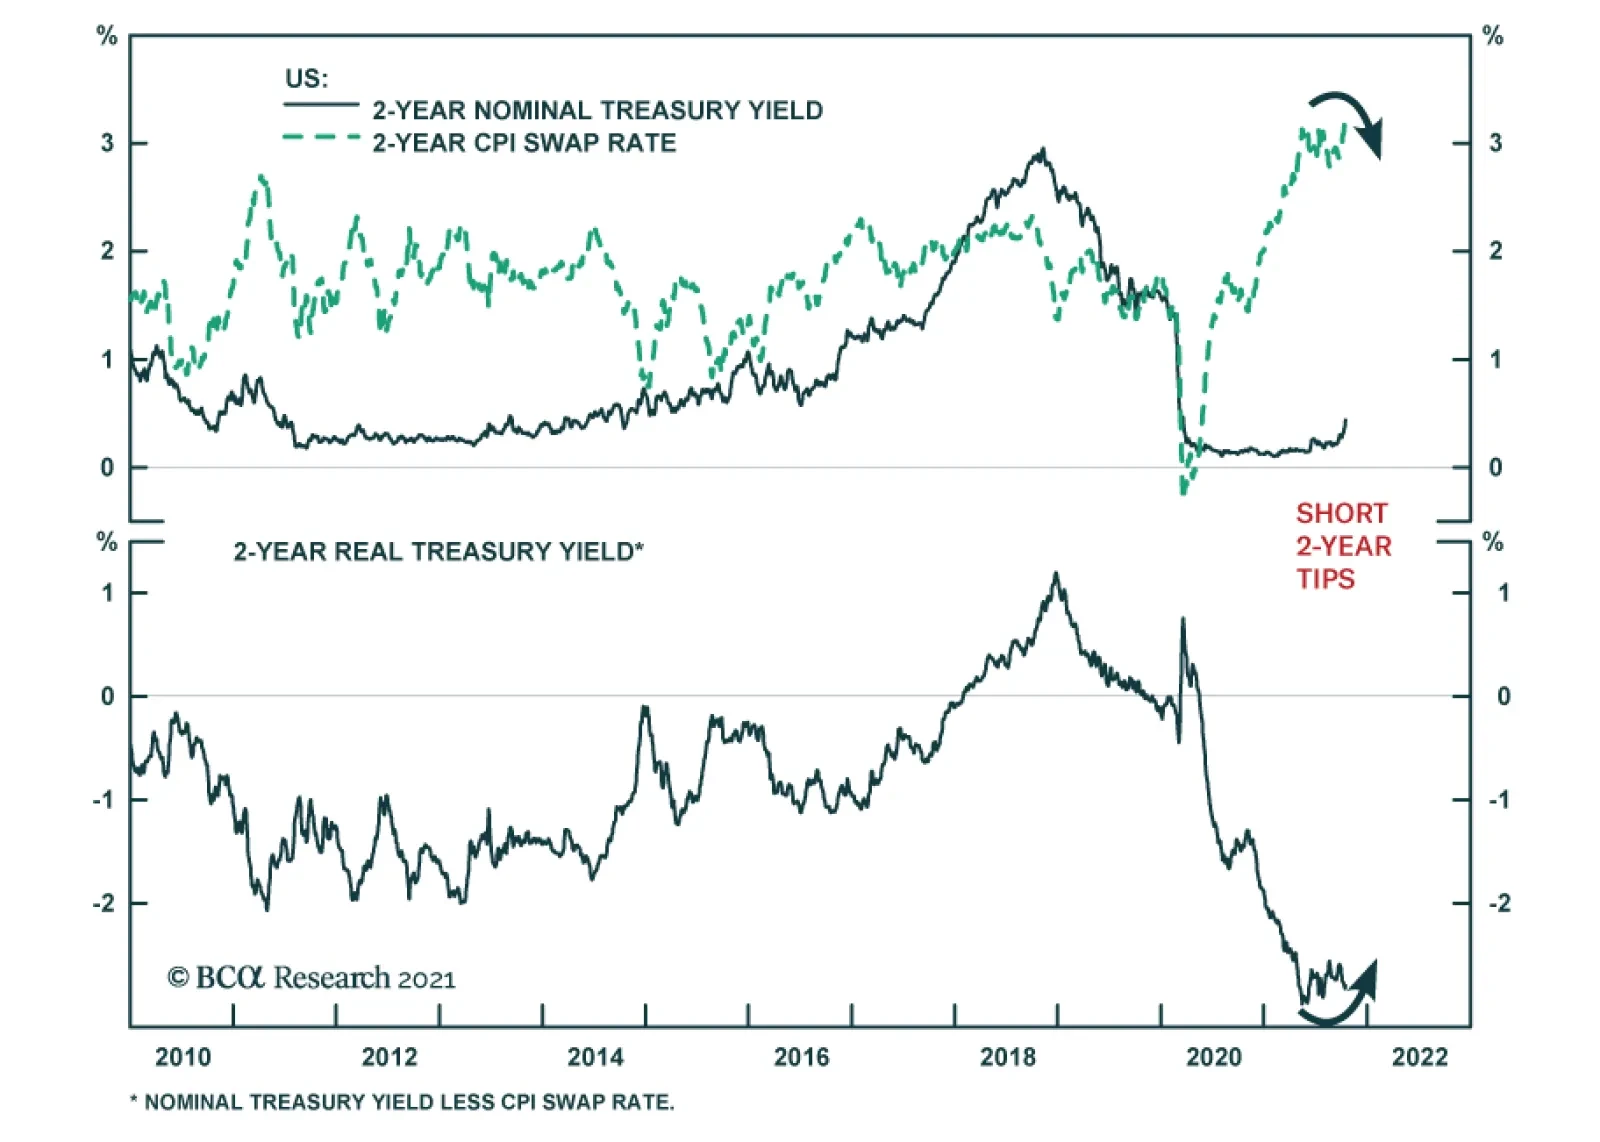
Highlights Duration: We recommend that investors run below-benchmark portfolio duration in US bond portfolios on the expectation that the Treasury curve will bear-flatten between now and Fed liftoff in December 2022. Nominal Treasury Curve: We recommend positioning for curve flattening by going short the 5-year Treasury note versus a duration-matched barbell consisting of the 2-year and 10-year notes. TIPS: Investors should position for higher short-maturity real yields. This can be done through an outright short position in 2-year TIPS, an inflation curve steepener or a real yield curve flattener. The Long And Short Of It Chart 1Short-End Joins The Selloff
Short-End Joins The Selloff
Short-End Joins The Selloff
It’s still a bit early for a 2021 retrospective, but unless something dramatic happens during the next 2 ½ months it’s likely that the year will go into the books as a bad one for US bonds. Looking back, we can identify three phases of bond market performance in 2021. First, a selloff in long-dated bonds early in the year driven by economic re-opening and fiscal stimulus. Second, a partial reversal of this long-end selloff that lasted through the spring and early summer. Finally, a renewed selloff involving both the long and short ends of the yield curve (Chart 1). The Long End Looking first at the long end of the curve, we don’t see any immediate signs that yields have risen too far. Estimates of the 10-year term premium created by taking the difference between the spot 10-year Treasury yield and survey estimates of the future 10-year average fed funds rate show that the term premium is not as elevated as it was when yields peaked last March or when they peaked in 2018 (Chart 2). The 25-delta risk reversal on 30-year Treasury futures – a technical indicator with a strong track record of calling turning points in the 30-year yield – also remains below the 1.5 level that has historically signaled a peak in the 30-year yield (Chart 3). Table 1 shows that while it is rare for the risk reversal to rise above 1.5, such a move usually indicates that yields have risen too far, too fast Chart 210-Year Term Premium Still Low
10-Year Term Premium Still Low
10-Year Term Premium Still Low
Chart 3Technicals Not Stretched
Technicals Not Stretched
Technicals Not Stretched
Table 1Track Record Of Risk Reversal Indicator
Right Price, Wrong Reason
Right Price, Wrong Reason
Finally, we look at the 5-year/5-year forward Treasury yield relative to a range of survey estimates of the long-run neutral fed funds rate (Chart 4). At 2.09%, the 5-year/5-year yield is close to median survey estimates of the long-run neutral fed funds rate.1 We take this to mean that the 5y5y yield has limited upside. Further increases in yields will take the form of the rest of the curve catching up to the 5y5y. Put differently, further increases in yields are more likely to coincide with curve flattening, not steepening.2 Chart 45y5y Is At Its Fair Value
5y5y Is At Its Fair Value
5y5y Is At Its Fair Value
The Short End While long-maturity bond yields have moved up during the past few months, it is the breakout in short-maturity Treasury yields that has been the most notable feature of the recent bond selloff (Chart 1, bottom panel). In particular, near-term interest rate expectations have adjusted sharply higher since the September FOMC meeting (Chart 5). Prior to the September FOMC meeting, the overnight index swap (OIS) market was priced for Fed liftoff in February 2023 and for a total of 80 bps of rate hikes by the end of 2023. Now, the OIS curve is priced for Fed liftoff in September 2022 and for a total of 113 bps of rate hikes by the end of 2023. Chart 5Fed Funds Rate Expectations
Fed Funds Rate Expectations
Fed Funds Rate Expectations
We continue to view the December 2022 FOMC meeting as the most likely date for the first rate hike. We also think it’s reasonable to expect the Fed to lift rates at a pace of 75-100 bps per year once tightening begins. In other words, we view fair pricing at the front-end of the curve as consistent with liftoff in December 2022 and a total of 100-125 bps of rate hikes by the end of 2023. The recent selloff has made front-end pricing more consistent with our assessment of fair value. Therefore, we don’t see any huge opportunities for directional bets on short-dated nominal yields. That said, we also contend that the bond market has arrived at the correct conclusion about the near-term pace of Fed tightening, but for the wrong reason. As is discussed in the next section of this report (see section titled “Massive Upside In Short-Maturity Real Yields”), this presents some attractive opportunities to trade short-maturity real yields and short-maturity inflation breakevens. One other observation from Chart 5 is that the market’s expected pace of Fed tightening flattens off considerably in 2024 and beyond. The market is priced for a mere 34 bps of tightening in 2024 and 2025 and the fed funds rate is still expected to be below 1.6% by the end of 2025. This highlights that, while pricing at the front-end of the yield curve looks reasonable, yields with slightly longer maturities remain too low. Bottom Line: We recommend that investors run below-benchmark portfolio duration in US bond portfolios on the expectation that the Treasury curve will bear-flatten between now and Fed liftoff in December 2022. We recommend positioning for curve flattening by going short the 5-year Treasury note versus a duration-matched barbell consisting of the 2-year and 10-year notes. Massive Upside In Short-Maturity Real Yields Table 2Yield Changes Since September FOMC (BPs)
Right Price, Wrong Reason
Right Price, Wrong Reason
The prior section noted that the market’s near-term rate expectations have risen considerably during the past few weeks. While we think that pricing looks reasonable compared to our own monetary policy expectations, we alluded to the idea that the market has brought forward its rate hike expectations for the wrong reason. Table 2 illustrates what we mean. Practically all the increase in nominal Treasury yields since the September FOMC meeting has been driven by a rising cost of inflation compensation. Real yields, on the other hand, have either been relatively stable (for long maturities) or have fallen massively (at the short-end of the curve). In fact, the 2-year real yield has declined 34 bps since the September FOMC meeting even as the 2-year nominal yield has increased by 16 bps. What the stark divergence between real yields and the cost of inflation compensation tells us is that the market is concerned that inflation may not fall as much as was previously assumed and the Fed may be forced to tighten more quickly in response. First off, we think concerns about persistently high inflation are a tad overblown. It’s certainly true that 12-month headline and core CPI inflation remain extremely high, at 5.4% and 4.0% respectively, but 3-month rates of change have moderated during the past few months and the 12-month figures will soon follow suit (Chart 6). Second, even if inflation is slow to moderate, the composition of what is driving that high inflation has implications for how the Fed will respond. Specifically, if elevated inflation continues to be driven by extreme readings from a few sectors that have been inordinately impacted by the pandemic, the Fed will be inclined to write-off that inflation as “transitory” while it awaits more broad-based inflationary pressures driven by tight labor markets and accelerating wages. It continues to be worth noting that after stripping out COVID-impacted services and cars, core inflation remains well contained near levels consistent with the Fed’s target (Chart 7). Chart 6Inflation Is Falling
Inflation Is Falling
Inflation Is Falling
Chart 7Inflation Pressures Are Narrow
Inflation Pressures Are Narrow
Inflation Pressures Are Narrow
In a speech last week, Atlanta Fed President Raphael Bostic said that the Fed should use the word “episodic” instead of “transitory” to describe the nature of the current inflationary shock.3 The problem with the word “transitory” is that it is linked to a notion of time. It implies that inflation pressures are expected to fade quickly, but this is not the message that the Fed meant to convey with that word. Rather, in Bostic’s words, the Fed meant to convey that “these price changes are tied specifically to the presence of the pandemic and, once the pandemic is behind us, will eventually unwind, by themselves, without necessarily threatening longer-run price stability.” In other words, the Fed will not tighten policy to lean against narrow inflationary pressures driven by a few sectors that can easily be traced back to the pandemic. Rather, the Fed will only respond if inflationary pressures are sufficiently broad and/or if long-run inflation expectations become un-anchored to the upside. On the first point, there is some evidence that inflation pressures are broadening. As of September, 49% of the CPI index was growing at a 12-month rate above 3%, up from a 2021 low of 22% (Chart 8). However, long-run inflation expectations remain well-anchored near the Fed’s target levels (Chart 9). Chart 8CPI Breadth Indicator
CPI Breadth Indicator
CPI Breadth Indicator
Chart 9Long-Term Inflation Expectations
Long-Term Inflation Expectations
Long-Term Inflation Expectations
Our sense is that inflationary pressures will fade during the next 12 months as pandemic fears abate. Long-dated inflation expectations will remain close to current levels, but short-dated inflation expectations will fall. The Fed will start to lift rates in December 2022 as broad-based inflationary pressures emerge, but inflation will be only slightly above the Fed’s target by then. The best way to position for this outcome is to go short 2-year TIPS. The cost of 2-year inflation compensation will fall as inflation moderates during the next 12 months, but the nominal 2-year yield will rise modestly as we advance toward a Fed tightening cycle. These two factors will combine to drive the 2-year real yield sharply higher (Chart 10). If you prefer not to put on an outright short 2-year TIPS position, there are a few other ways to position for the same trend. First, investors could position for a steeper inflation curve. Chart 11 shows that the cost of short-maturity inflation compensation is much further above the Fed’s target level than the cost of long-maturity inflation compensation. Further, Table 3 shows that monthly changes in the cost of short-maturity inflation compensation are more sensitive to CPI than are changes in the long-maturity cost of inflation compensation. This means that the inflation curve will steepen during the next 12 months as inflation moderates and the short-term cost of inflation compensation falls. Chart 10Short 2-Year TIPS
Short 2-Year TIPS
Short 2-Year TIPS
Chart 11Position For Inflation Curve Steepening...
Position For Inflation Curve Steepening...
Position For Inflation Curve Steepening...
Table 3Regression of Monthly Changes In CPI Swap Rate Versus Monthly Changes In 12-Month Headline CPI Inflation (2010 - Present)
Right Price, Wrong Reason
Right Price, Wrong Reason
Second, you could also position for a flatter TIPS yield curve (Chart 12). The combination of inflation curve steepening and nominal curve flattening will lead to a supercharged flattening of the real yield curve during the next 12 months. Chart 12... And Real Yield Curve Flattening
... And Real Yield Curve Flattening
... And Real Yield Curve Flattening
Bottom Line: Investors should position for higher short-maturity real yields. This can be done through an outright short position in 2-year TIPS, an inflation curve steepener or a real yield curve flattener. Ryan Swift US Bond Strategist rswift@bcaresearch.com Footnotes 1 The median response from the New York Fed’s Survey of Market Participants pegs the long-run neutral fed funds rate at 2.0%. The same measure from the Survey of Primary Dealers sits at 2.25%. 2 For more details on the relationship between the proximity of the 5-year/5-year yield to its fair value range and the slope of the yield curve please see US Bond Strategy Weekly Report, “A Bump On The Road To Recovery”, dated July 27, 2021. 3 https://www.atlantafed.org/news/speeches/2021/10/12/bostic-the-current-inflation-episode.aspx Recommended Portfolio Specification Other Recommendations Treasury Index Returns Spread Product Returns
Dear Client, There will be no weekly report next week. Instead, we will host our quarterly webcast on Tuesday, October 26 for the US and EMEA regions and Wednesday, October 27 for the Asia Pacific region. We will resume our regular publishing schedule on Monday, November 1. In the meantime, we look forward to seeing many of you at our BCA Research Investment Conference this week. Best regards, Mathieu Savary Highlights This year’s decline in EUR/USD has rendered this pair sufficiently inexpensive and oversold to account for the near-term risks we highlighted in March. Nonetheless, some risks remain—among them, the continued credit slowdown in China, diverging monetary policy trends, and the energy crisis hurting Europe. However, long-term fundamentals continue to support the euro’s 12- to 18-month outlook. Moreover, Chinese credit growth may soon stabilize and markets already largely factor in the policy divergence between the Fed and the ECB. As a result, we buy the euro today with a preliminary target at 1.25 and a stop loss at 1.1175. The Bank of England will lift rates this December, but the market already prices in a hawkish BoE. GBP/USD has upside, even if the euro should outpace the pound in the coming months. Look to upgrade UK small-cap stocks. Italian equities do not appear particularly appealing on a cyclical horizon, neither in absolute nor relative terms. Investors should favor Spanish stocks over Italian ones for the next 12-to-18 months. Feature EUR/USD recently flirted with 1.15. Did this move create a buying opportunity? Last March, we warned that the euro would correct to the 1.12 to 1.15 zone because short-term models flagged it as expensive, speculators carried a substantial net-long exposure, and Chinese credit growth was set to slow meaningfully. These forces have now mostly played out; thus, the euro’s near-term outlook is becoming more positive. Despite this more constructive view, EUR/USD still carries ample downside risks, especially if Chinese authorities remain reluctant to reflate their economy. Moreover, the energy crisis facing Europe clouds the euro. We are nonetheless buyers of EUR/USD, with a target at 1.25. Investors should set a wide stop in at 1.1175. Cheap And Oversold The internal dynamics of the euro indicate that the bulk of the sell-off is behind us. First, the euro is now cheap on a tactical basis. Back in March, our short-term fair value model for EUR/USD flagged at 7% overvaluation based on real rate differentials, on the slope of the German yield curve relative to that of the US, and on the copper-to-lumber prices ratio. Today, this same measure shows a 5% undervaluation. BCA’s Foreign Exchange Strategy Intermediate Term Timing Model (ITTM) flags an even clearer buy signal. The ITTM framework combines interest rate parity models, with risk aversion and considerations for the currency’s trend. Currently, this model is at -8% or nearly minus one standard error. Historically, such a depressed reading points to generous returns in the subsequent 12 months (Chart 1). Second, the euro is oversold. BCA’s Intermediate Term Technical Indicator has hit 7, which is consistent with past rebounds in EUR/USD (Chart 2). While some of these rallies have been extremely short-lived, the technical indicator’s message is stronger when it is matched by a buy signal from the ITTM. Chart 1Strong Buy Signal From Short-Term Valuations
Strong Buy Signal From Short-Term Valuations
Strong Buy Signal From Short-Term Valuations
Chart 2EUR/USD is Oversold
EUR/USD is Oversold
EUR/USD is Oversold
Chart 3Stale Euro Longs Have Been Purged
Stale Euro Longs Have Been Purged
Stale Euro Longs Have Been Purged
Third, speculators do not carry a large net long position in the euro anymore. This variable suggests that the worst of the selling pressure is behind us, but it has yet to send a strong buy signal on its own (Chart 3). Bottom Line: The euro is sufficiently inexpensive that our Intermediate-term timing model flags a strong buy signal. Moreover, our technical indicators paint an oversold picture consistent with a reversal. Nonetheless, speculators may not be long EUR/USD anymore, but they are not aggressively selling it either. Thus, macro dynamics remain important to the future trend of this currency. Macro Fog Remains The macro environment is not yet conducive to a euro rally, especially when Chinese credit growth remains weak. However, considering the euro’s valuation and technical picture, small changes in the macro environment could be enough to catalyze a jump in EUR/USD. A key problem for the euro is that the dollar remains well bid. The yen and the dollar are the two momentum currencies within the G-10 (Chart 4). This property of the dollar is a large handicap for the euro, because it remains the most liquid vehicle to bet on the USD. Thus, as long as the dollar’s momentum is strong, the euro will find it difficult to rally. Relative economic growth is another headwind for EUR/USD. European activity is weakening versus that of the US. Since 2019, the relative manufacturing PMIs between the Euro Area and the US track EUR/USD, and they currently confirm the euro’s weakness (Chart 5). Moreover, European economic surprises are significantly weaker than US ones, which adds to the euro’s malaise (Chart 5, bottom panel). Chart 4The Dollar Is A Momentum Currency
Time For The Euro To Shine?
Time For The Euro To Shine?
Chart 5Deteriorating European Growth Hurts EUR/USD
Deteriorating European Growth Hurts EUR/USD
Deteriorating European Growth Hurts EUR/USD
The near-term outlook does not signal a resolution of this issue until the first half of 2022. The declines in the expectation and current situation components of both the ZEW and Sentix surveys herald an additional deceleration in manufacturing activity (Chart 6). The Eurozone’s growth problems reflect China’s slowing credit flows. Europe economic activity is still extremely sensitive to the evolution of the global industrial cycle (Chart 7, top panel), much more so than the US GDP is. China’s business cycle is an essential determinant of the robustness of the global manufacturing sector. Consequently, when measures of China’s marginal propensity to consume decelerate, such as the gap between M1 and M2 growth, European PMIs and industrial production underperform those of the US (Chart 7, second and bottom panels). Chart 6A Bit More Time Before Europe's Slowdown Ends
A Bit More Time Before Europe's Slowdown Ends
A Bit More Time Before Europe's Slowdown Ends
Chart 7China's Travails Hurt Europe
China's Travails Hurt Europe
China's Travails Hurt Europe
The fourth quarter of 2021 is likely to represent the tail end of the Chinese headwind on EUR/USD. The Chinese credit impulse remains weak, but signs of a floor are beginning to appear. For example, the decline in Chinese commercial banks excess reserve growth warned us of the coming decline in the credit impulse. Today, excess reserves have begun to stabilize, which points to an upcoming imporvement in credit flows (Chart 8). Additionally, the Evergrande problems continue to weigh on Europe in the near-term because of the deceleration in Chinese construction activity; however, the crisis will also intensify the pressure on Beijing to revive credit growth in order to avoid a systemic collapse. Chart 8Will China's Credit Impulse Bottom Soon?
Will China's Credit Impulse Bottom Soon?
Will China's Credit Impulse Bottom Soon?
Monetary policy differentials also remain euro bearish. The US Federal Reserve will announce the start of its tapering program on November 3. The FOMC is set to hike rates by the end of 2022. Meanwhile, the ECB is unphased by the increase in European inflation, which remains mostly a reflection of energy prices and base effects. Thus, Europe will lag behind the US when it comes to monetary policy tightening. Nonetheless, investors already understand this dichotomy very well. The US OIS curve anticipates four hikes in 2023. Meanwhile, the EONIA curve shows a first 25-bps hike only by September 2023. Thus, the euro will suffer more from policy differentials if the Fed generates hawkish surprises relative to this pricing. The energy crisis shaking Europe is the last major headwind currently affecting the euro. Historically, EUR/USD and the ratio of European to US natural gas prices track each other (Chart 9). This relationship reflects relative growth dynamics. A stronger Eurozone economy relative to the US pushes up the value of the euro and European natural gas, which is a commodity with heavy industrial usage. However, since this summer, the spike in European natural gas prices has coincided with a decline in the euro. This divergence highlights the negative effect on European activity of the current energy shock, which raises fears of stagflation. The cross-Atlantic bond market dynamics confirm the notion that the energy shock increases the perceived stagflation risk in the Eurozone. German yields have risen relative to US ones because of a pick-up in inflation expectations, not real rates (Chart 10). The lack of traction for relative real rates is appropriate because market participants believe that the ECB wants to ignore the spike in energy prices. An environment of rising relative inflation expectations but stable relative real rates is very negative for any currency, including the euro. However, European inflation expectations should decrease relative to those of the US once European natural gas prices normalize, which we expect to take place in the coming months (Chart 10, bottom panel). This process will be very positive for the euro. Chart 9The European Energy Crisis Harms The Euro
The European Energy Crisis Harms The Euro
The European Energy Crisis Harms The Euro
Chart 10Pricing In European Stagflation?
Pricing In European Stagflation?
Pricing In European Stagflation?
Bottom Line: While euro pricing and technicals suggest EUR/USD will bottom soon, the economic environment is murkier. The dollar is a momentum currency, and its current strength feeds the euro’s weakness. China’s credit flows continue to decelerate, which hurts the euro; however, credit flows may stabilize in early 2022. The Fed is a tailwind for the dollar, but markets already price in this reality. Finally, the energy crisis hurts European growth and thus EUR/USD; nonetheless, the spike in natural gas prices will soon give way to a period of decline, which will lessen the pain for the euro. What To Do? When we balance the positives and negative for the euro, we are becoming more comfortable with buying EUR/USD outright, even if it is still a risky bet. To begin with, the big fundamental forces point to a firmer euro on an 18- to 24-month basis: BCA’s Foreign Exchange strategists see greater cyclical downside for the USD and believe the current rebound is a pronounced countertrend move within a multi-year dollar bear market. The euro will naturally benefit over the coming years from a weak greenback. EUR/USD is still inexpensive on long-term valuation metrics. Based on BCA’s purchasing power parity model, this pair trades 17% below its fair value. Moreover, the PPP estimate keeps rising in favor of the euro, a result of the Eurozone’s lower inflation compared to the US (Chart 11). The relative balance of payments favors the euro. The European economy generates a current account surplus of 3% of GDP compared to a current account deficit of 3.1% for the US. The US current account deficit is unlikely to narrow, even if the federal government’s budget hole declines because the private sector’s savings rate is falling even faster. Moreover, US real two-year rates remain well below those of its trading partners. Investors underweight Eurozone assets aggressively. For the past ten years, capital has consistently flowed out of the Euro Area relative to the US (Chart 12). European growth should converge toward the US next year, especially if Chinese credit activity stabilizes. Therefore, 2022 should witness a period of inflows into the Eurozone. Chart 11EUR/USD Significant Long-Term Discount
EUR/USD Significant Long-Term Discount
EUR/USD Significant Long-Term Discount
Chart 12Investors Underweight Eurozone Assets
Investors Underweight Eurozone Assets
Investors Underweight Eurozone Assets
We argued that the valuation and technical backdrop shows the Euro is becoming increasingly supportive and our timing model is clearly arguing against selling EUR/USD. However, the biggest technical risk is the momentum sensitivity of the dollar, which means that the euro’s weakness could last somewhat longer. Nevertheless, BCA’s Dollar Capitulation Index now warns of a pullback in the USD, especially as speculators are very long DXY futures (Chart 13). The biggest downside risk remains China’s credit trend. If it takes more time than we anticipate for Beijing to put an end to the credit impulse slowdown, the euro will experience greater downside pressure. Moreover, the longer it takes Beijing to reflate, the greater the chance of an uncontrolled selloff in the CNY, which would drag down the euro (Chart 14). Chart 13Is The Dollar Technically Vulnerable?
Is The Dollar Technically Vulnerable?
Is The Dollar Technically Vulnerable?
Chart 14China Remains The Euro's Main Risk
China Remains The Euro's Main Risk
China Remains The Euro's Main Risk
Despite this level of near-term uncertainty, we recommend investors buy the euro, with a target at 1.25, and a stop loss at 1.1175. Bottom Line: Conditions are falling in place for the countertrend decline in the euro to end soon. As a result, the euro should converge back toward the upward path driven by fundamentals. The greatest near-term risk remains the path of Chinese credit trends. We recommend investors buy the euro with a preliminary target at EUR1.25 and a stop loss at 1.1175. Country Focus: A Well Discounted BoE Hike The Bank of England will begin to increase interest rates at its December meeting. The BoE’s communication has been clear that it does not see a need to wait between the end of its tapering program in December and the beginning of its hiking campaign. Recent comments by senior MPC members, including new Chief Economist Huw Pill, also suggest a rate hike is looming. Chart 15The BoE's Inflation Problem
The BoE's Inflation Problem
The BoE's Inflation Problem
We see little reason to doubt the willingness of the MPC to start lifting the Bank Rate. UK Core CPI stands at 3.1% or 110 basis points above the BoE’s inflation target. Moreover, both market-based and survey-based long-term inflation expectations are well above 3.5%, which increases the risk of a dangerous dis-anchoring of UK inflation (Chart 15). UK economic activity remains inflationary. Wages are strong, climbing 7.2% in August. This number probably exaggerates the underlying wage growth due to compositional effects, but job creation remains robust and the unemployment rate fell to 5.2%. The BoE was concerned that the end of the furlough scheme last month would cause a jump in unemployment, but their fears have dwindled, because job vacancies stand at a record high and capex intentions are solid (Chart 16). The housing market continues to be a tailwind to growth. House prices are up 10% annually, which lifts household net worth considerably (Chart 17). The pace of transactions in the real estate market will slow this spring because the stamp duty holiday will end; however, low mortgage rates and expectations of further housing gains may fuel greater appreciation. This creates long-term financial stability risks for the UK because household leverage will rise. This worries the BoE. Chart 16The UK's Labor Market Strength Will Continue
The UK's Labor Market Strength Will Continue
The UK's Labor Market Strength Will Continue
Chart 17Rising Household Net Worth
Rising Household Net Worth
Rising Household Net Worth
Market participants already expect a hawkish BoE. A rate hike is priced in for December and the SONIA curve embeds almost two more increases in 2022. The 4.3% underperformance of the UK government bond index over the global benchmark in seven weeks also underscores the rapid adjustment in investors’ perceptions of the UK policy path. BCA’s Global Fixed-Income strategists have underweighted UK government bonds for two months, and they maintain a negative view over the coming quarters. Nonetheless, the risk of a short-lived countertrend rebound in UK bonds’ relative performance is significant. However, it would be a temporary position squaring, while hedge funds and CTAs take profits. BCA’s Foreign Exchange strategists expect GBP/USD to rebound. Cable is oversold and trades at a 12% discount to BCA’s PPP fair-value estimate. GBP/USD is also hurt by fears that the BoE hikes will damage the UK economy. From a contrarian perspective, this creates a positive entry point to buy cable, especially because the pound should benefit from the anticipated dollar weakness and the euro’s upcoming rally. However, BCA’s FX strategists also foresee some decline in the pound versus the euro, because GBP is a low beta play on EUR/USD. Hence, the trade-weighted pound could remain flat to slightly down in the coming months. We stay neutral on UK small-cap stocks relative to large-cap equities, but we are putting them on an upgrade alert. Small-cap stocks benefit from the strength in the domestic economy; however, they are also extremely expensive compared to large-cap ones (Chart 18). The arbiter of performance will be profits. The forward EPS of small-caps have lagged behind those of large-caps by 9% since the COVID recession, after underperforming since 2016 (Chart 19). Small-caps’ relative profits are currently trying to stabilize, but the durability of this trend will be tested if the trade-weighted pound remains flat in the coming months. Thus, the EPS of small-cap shares must regain more ground before moving more aggressively in this market. Chart 18UK Small Cap Are Pricey
UK Small Cap Are Pricey
UK Small Cap Are Pricey
Chart 19Follow The Profits
Follow The Profits
Follow The Profits
Bottom Line: On the back of a strong UK economy and significant inflationary forces, the BoE will start elevating interest rates this December. The market already prices in this outcome. Nonetheless, UK bonds should continue to underperform the global benchmark, and cable has upside, even if the near-term outlook favors the EUR over the GBP. We are putting UK small-cap stocks on a buy alert. They are expensive, but a turnaround in profits would solve this problem. Market Focus: A Quick Take On Italian Equities The Italian equity market remains Europe’s problem child. The Italian MSCI index has underperformed the rest of the Euro Area by 40% since 2010. This underperformance holds even after adjusting for sectoral differences, although it becomes less dramatic (Chart 20, top panel). Despite this underperformance, Italian equities have managed to outperform their Spanish counterparts by 27% since 2010, but this outperformance dissipates once sectoral difference are accounted for (Chart 20, bottom panel). The RoE of Italian non-financial listed equities is equivalent to the rest of the Eurozone, but it only reflects elevated financial leverage, as is the case in Spain (Chart 21). Italy’s RoA is poor, because Italy’s excess capital stocks hurts its return on capital. As a result, Italian equities continue to face a structural handicap. Chart 20A Problem Child
A Problem Child
A Problem Child
Chart 21Italy's Return On Asset Is Poor
Italy's Return On Asset Is Poor
Italy's Return On Asset Is Poor
The good run in Italian equities in absolute terms faces headwinds. Italian stocks are very sensitive to the global business cycle; however, they often respond with a delay and in an exaggerated fashion to decelerations in the global PMI (Chart 22, top panel). Moreover, since 2010, widening European high-yield corporate bond spreads have preceded falling Italian stock prices. Thus, the recent slide in the global PMI and the widening in European high-yield OAS create a period of vulnerability for Italian equities. Finally, Italian share prices have overshot the path implied by US yields (Chart 22, bottom panel). Nonetheless, Italian stocks may be sniffing out further increases in global yields. The cleanest way to play these vulnerabilities in the Italian is via a short bet against Spain. A steeper global yield curve will help both markets due to their heavy exposure to financials. However, we still favor Spanish financials, which benefit from higher RoEs than their Italian counterparts (Chart 23) and lower NPLs. As a result, the forward EPS of Spanish financials should begin to outperform those of Italian financials. Chart 22Some Risks To Italian Stocks
Some Risks To Italian Stocks
Some Risks To Italian Stocks
Chart 23Spanish Banks Are Better Placed To Benefit From Rising Global Yields
Spanish Banks Are Better Placed To Benefit From Rising Global Yields
Spanish Banks Are Better Placed To Benefit From Rising Global Yields
Mathieu Savary, Chief European Strategist Mathieu@bcaresearch.com Jeremie Peloso, Associate Editor JeremieP@bcaresearch.com Tactical Recommendations
Time For The Euro To Shine?
Time For The Euro To Shine?
Cyclical Recommendations
Time For The Euro To Shine?
Time For The Euro To Shine?
Structural Recommendations
Time For The Euro To Shine?
Time For The Euro To Shine?
Closed Trades
Time For The Euro To Shine?
Time For The Euro To Shine?
Currency Performance Fixed Income Performance Equity Performance
The Japanese yen has been performing poorly recently. It is the only G10 currency that has depreciated vis-à-vis the USD over the past week. Several factors explain the yen’s underperformance. First, after a period of strength in the run up to Prime…
Highlights As US and China’s grand strategies collide, expect major and minor geopolitical earthquakes whose epicenter will now lie in South Asia and the Indian Ocean basin. Another tectonic change will drive South Asia’s emergence as a new geopolitical battle ground - South Asia is now heavily weaponized. All key players operating in this theater are nuclear powers. South Asia’s democratic traditions are well-known but notable institutional and social fault lines exist. These could trigger major geopolitical events in Afghanistan, Pakistan and in pockets of India too. We are bullish on India strategically but bearish tactically. Dangerous transitions are underway to India’s east and west. Within India, key elections are approaching, and it is possible that growth may disappoint. For reasons of geopolitics, we are strategically bullish on Bangladesh but strategically bearish on Pakistan and Sri Lanka. We are booking gains of 9% on our long rare earths basket and 1% on our long GBP-CZK trade. Feature Over the 1900s, East Asia and the Middle East emerged as two key geopolitical focal points on the world map. Global hegemons flexed their muscles and clashed in these two theaters. Meanwhile South Asia was a geopolitical backstage at best. The majority of South Asia was a British colony until the second half of the twentieth century. After WWII it struggled with the difficulties of independence and mostly missed out on the prosperity of East Asia and the Pacific. But will the twenty-first century be any different? Absolutely so. We expect the current century to be marked by major and minor geopolitical earthquakes in which South Asia and the Indian Ocean basin will play a major part. This seismic change is likely to be the result of several tectonic forces: Population: A quarter of the world’s people live in South Asia today and this share will keep growing for the next four decades. India will be the most populous country in the world by 2027 and will account for about a fifth of global population. Supply: China’s growth model has left it heavily dependent on imports of raw materials from abroad. It is clashing with the West over markets and supply chains. Beijing is building supply lines overland while developing a navy to try to secure its maritime interests. These interests increasingly overlap with India’s, creating economic competition and security concerns over vital sea lines of communication. Access: Whilst the Himalayas and Tibetan plateau have historically prevented China from expanding its influence in South Asia, China’s alliance with Pakistan is strengthening. Physical channels like the China Pakistan Economic Corridor (CPEC), and other linkages under the Belt and Road Initiative, now provide China a foot in the South Asian door like never before (Map 1). Weapons: The second half of the twentieth century saw China, India, and Pakistan acquire nuclear arms. Consequently, South Asia today is one of the most weaponized geographies globally (Map 1). Map 1South Asia To Emerge As A Key Geopolitical Theater In The 21st Century
South Asia: A New Geopolitical Theater
South Asia: A New Geopolitical Theater
With the South Asian economy ever developing, and US-China confrontation here to stay, we expect China to make its presence felt in South Asia over the coming decades. The US’s recent withdrawal from Afghanistan, and the failure of democratization in Myanmar, are but two symptoms of a grand strategic change by which China seeks to prevent US encirclement and Indo-American cooperation develops to counter China. Throw in the abiding interests of all these powers in the Middle East and it becomes clear that South Asia and the Indian Ocean basin writ large will become increasingly important over the coming decades. The Lay Of The Land - India Is The Center Of Gravity Chart 1South Asia Managed Rare Feat Of ‘Steady’ Growth
South Asia: A New Geopolitical Theater
South Asia: A New Geopolitical Theater
South Asia stands out amongst developing regions of the world for its large and young population. In recent decades, South Asia has also managed to grow its economy steadily, surpassing Sub-Saharan Africa and rivaling the Middle East (Chart 1). While South Asia’s growth rates have not been as miraculous as East Asia post World War II, its growth engine has managed to hum slowly but surely. India and Bangladesh have been the star performers on the economic growth front (Chart 2). Despite decent growth rates, the South Asian region is characterized by very low per capita incomes due to large population. On per capita incomes, Sri Lanka leads whilst Pakistan finds itself at the other end of the spectrum (Chart 3). Chart 2India And Bangladesh Have Been Star Performers
South Asia: A New Geopolitical Theater
South Asia: A New Geopolitical Theater
Chart 3Per Capita Incomes In South Asia Have Grown, But Remain Low
South Asia: A New Geopolitical Theater
South Asia: A New Geopolitical Theater
Chart 4India Accounts For About 80% Of South Asia’s GDP
South Asia: A New Geopolitical Theater
South Asia: A New Geopolitical Theater
South Asia constitutes eight nations. However only four are material from an investment perspective: India, Pakistan, Sri Lanka, and Bangladesh. India is the center of gravity as it offers the most liquid scrips and accounts for 80% of the region’s GDP (Chart 4). In addition: India accounts for 101 of the 110 companies from South Asia listed on MSCI’s equity indices. MSCI India’s market capitalization is about $1 trillion. In fact, India’s equity market could soon become larger than that of the UK and join the world’s top-five club.1 The combined market cap of MSCI Bangladesh, Sri Lanka, and Pakistan amounts to only about $6 billion. Liquidity is a constraint that investors must contend with whilst investing in these three countries in South Asia. Pakistan is the home of 220 million – set to grow to 300 million by 2040. It lags its neighbors on economic growth and governance but has nuclear weapons and a 650,000-strong military. Bottom Line: India is the center of gravity for the regional economy and financial markets in South Asia. Sri Lanka and Bangladesh are small but are developing. Pakistan is the laggard, but is militarily strong, which raises political and geopolitical risks. South Asia: Major Consumer, Minor Producer Chart 5Manufacturing Capabilities Of South Asian Economies Are Weak
South Asia: A New Geopolitical Theater
South Asia: A New Geopolitical Theater
South Asia’s defining economic characteristic is that it is a major consumer. This feature contrasts with the region’s East Asian cousins, which worked up economic miracles based on their manufacturing capabilities. South Asia’s appetite to consume is partly driven by population and partly driven by the fact that this region’s economies have an unusually underdeveloped manufacturing base (Chart 5). It’s no surprise that all countries in South Asia (with the sole exception of Afghanistan) are set to have a current account deficit over the next five years (Charts 6A and 6B). Chart 6ASouth Asian Economies Tend To Be Net Importers
South Asia: A New Geopolitical Theater
South Asia: A New Geopolitical Theater
Chart 6BSouth Asian Economies Tend To Be Net Importers
South Asia: A New Geopolitical Theater
South Asia: A New Geopolitical Theater
India is set to become the third largest global importer of goods and services (after the US and UK) over the next five years. Its rise as a large client state of the world will be both a blessing and a curse, as increased business leverage will coincide with geopolitical insecurity. Structurally, Sino-Indian tensions are rising and growing bilateral trade will not be enough to prevent them. Meanwhile dependency on the volatile Middle East is a geopolitical vulnerability. Either way, India and its region become more important to the rest of the world over time. Whilst the structure of South Asia’s economy is relatively rudimentary, it is worth noting that Bangladesh and Sri Lanka present an exception. Bangladesh has embarked on a path of manufacturing-oriented development via labor-intensive production. Sri Lanka has a well-developed services sector (Chart 7). In particular: Bangladesh: Within South Asia, Bangladesh’s manufacturing sector stands out as being better developed than regional peers. More than 95% of Bangladesh’s exports are manufactured goods –a level that is comparable to China (Chart 8). China’s share in the global apparel and footwear market has been systematically declining and Bangladesh is one of the countries that has benefited most from this shift. Bangladesh’s share in global apparel and footwear exports to the US as well as EU has been rising steadily and today stands at 4.5% and 13% respectively.2 Chart 7Bangladesh’s And Sri Lanka’s Economies Are Relatively Modern
South Asia: A New Geopolitical Theater
South Asia: A New Geopolitical Theater
Chart 8Bangladesh Has The Most Developed Exports Franchise In South Asia
South Asia: A New Geopolitical Theater
South Asia: A New Geopolitical Theater
Sri Lanka: Whilst Sri Lanka social complexities are lower and per capita incomes are higher as compared to peers in South Asia, its transition from a long civil war to a focus on economic development recently suffered a body blow, first owing to terrorist attacks in 2019 and then owing to the pandemic. The economic predicament was then worsened by its government’s hasty transition to organic farming which hit domestic food production. Geopolitically it is worth noting that China is one of the largest lenders to Sri Lanka. Whilst Sri Lanka’s central bank may be able to convince markets of the nation’s ability to meet debt obligations for now, its foreign exchange reserves position remains precarious and public debt levels remain high. Sri Lanka’s vulnerable finances are likely to only increase Sri Lanka’s reliance on capital-rich China. Despite Democracy, South Asia Has Political Tinderboxes Another factor that sets South Asia apart from developing regions like Africa, the Middle East, and Central Asia is the region’s democratic moorings. India and Sri Lanka lead the region on this front, although the last decade may have seen minor setbacks to the quality of democracy in both countries (Chart 9). Pockets of South Asia are socially and politically unstable, characterized by religious or communal strife, terrorist activity, and even the occasional coup d'état. Risk Of Social Conflict Most Elevated In Pakistan And Afghanistan India’s demographic dividend is real, but its benefits should not be overstated. For instance, India’s northern region is a demographic tinderbox. It is younger than the rest of the country, yet per capita incomes are lower, youth underemployment is higher, and society is more heterogeneous. The rise of nationalism in India is an important consequence and could engender potential social unrest. Chart 9India’s Democracy Strongest, But May Have Had Some Setbacks
South Asia: A New Geopolitical Theater
South Asia: A New Geopolitical Theater
Chart 10South Asia Is Young And Will Age Slowly
South Asia: A New Geopolitical Theater
South Asia: A New Geopolitical Theater
Chart 11Social Complexities Are High In Afghanistan & Pakistan
South Asia: A New Geopolitical Theater
South Asia: A New Geopolitical Theater
A similar problem confronts South Asia as a whole. Pakistan and Afghanistan are younger than India by a wide margin (Chart 10). But both countries are economically backward and have either poor or non-existent democratic traditions. Lots of poor youths and inadequate political valves to release social tensions make for an explosive combination. These countries are highly vulnerable to social conflict that could cause political instability at home or across the region via terrorism (Chart 11). The Gatsby Effect Most Prominent In Pakistan While various regions struggle with inequality, South Asia has less of a problem that way (Chart 12). However South Asia is characterized by very low levels of social mobility as compared to peer regions. This can partially be attributed to two centuries of colonial rule as well as to endemic traditions of social stratification. Chart 12Gatsby Effect: Social Mobility Is Lowest In Pakistan
South Asia: A New Geopolitical Theater
South Asia: A New Geopolitical Theater
Within South Asia it is worth noting that social mobility is the lowest in Pakistan and highest in Sri Lanka. Chart 13Military’s Influence Most Elevated In Pakistan And Nepal Too
South Asia: A New Geopolitical Theater
South Asia: A New Geopolitical Theater
Military Influential In Pakistan (And Nepal) Events that transpired over January 2020 in the US showed that even the oldest constitutional democracy in the world is not immune to a breakdown of civil-military relations. South Asia has seen the occasional coup d'état, one reason for the political tinderboxes highlighted above. Obviously, Myanmar is the worst – it saw its nascent democratization snuffed out just last year. But other countries in the region could also struggle to maintain civilian order in the coming decades. The military’s influence is outsized in Pakistan as well as Nepal (Chart 13). India maintains high levels of defense spending but has a strong tradition of civilian control (Chart 14). Chart 14Pakistan’s Military Budget Is Most Generous, India A Close Second
South Asia: A New Geopolitical Theater
South Asia: A New Geopolitical Theater
South Asia: A New Global Battle Ground Historically global hegemons have sought to assert their dominance by staking claim over coastal regions in Europe and Asia. Over the past two centuries Asia has emerged as a geopolitical theater second only to Europe. Naval and coastal conflicts have emerged from the rise of Japan (the Russo-Japanese War) and the Cold War (the Korean War & the Vietnam War). Today the rise of China is the destabilizing factor. The “frozen conflicts” of the Cold War are thawing in Taiwan, South Korea, and elsewhere. China is pursuing territorial disputes around its entire periphery, including notably in the East and South China Seas but also South Asia. Meanwhile the US, fearful of China, is struggling to strike a deal with Iran and shift its focus from the Middle East to reviving its Pacific strategic presence. A budding US-China competition is creating conditions for a new cold war or a series of “proxy battles” in Asia. Over the next few decades, we expect disputes to continue. But the focal points are likely to cover South Asia too. In specific, landlocked regions in South Asia are likely to see rising tensions in the twenty-first century (Map 2). Also as mentioned above, China’s naval expansion and the US’s attempt to form a “quadrilateral” alliance with India, Japan, and Australia will generate tensions and potentially conflict. European allies are also becoming more active in Asia as a result of US alliances as well as owing to Europe’s independent need for secure supply lines. Map 2China’s Interest In Landlocked Regions Of South Asia Is Rising
South Asia: A New Geopolitical Theater
South Asia: A New Geopolitical Theater
While border clashes between India and China will ebb and flow, Indo-Chinese confrontations along India’s eastern border will become a structural theme. Arguably, Sino-Indian rivalries pre-date the twenty-first century. But in a world in which the Asian giants are increasingly economically and technologically developed, Sino-Indian confrontations are likely to persist and result in major geopolitical events. Consider: China is adopting nationalism and an assertive foreign policy to cope with rising socioeconomic pressures on the Communist Party as potential GDP growth slows. China is developing a navy as well as a stronger alliance with Pakistan, which includes greater lines of communication. North India is a key constituency for the political party in power in India today (i.e., the Bhartiya Janata Party or BJP) and this geography harbors especially unfavorable views of Pakistan (Chart 15). Thus, there is a risk that the India of today could respond far more decisively or aggressively to threats or even minor disputes. More broadly, nationalism is rising in India as well as China. India is shedding its historical stance of neutrality and aligning with the US, which fuels China’s distrust (Chart 16). Chart 15Northern India Views Pakistan Even More Unfavorably Than Rest Of India
South Asia: A New Geopolitical Theater
South Asia: A New Geopolitical Theater
Chart 16India Has Aligned With The QUAD To Counter The Sino-Pak Alliance
South Asia: A New Geopolitical Theater
South Asia: A New Geopolitical Theater
Turning attention to India’s western border, clashes between India and Pakistan relating to landlocked areas in Kashmir will also be a recurring theme. Whilst India currently has a ceasefire agreement in place with Pakistan, peace between the two countries cannot possibly be expected to last. This is mainly because: Kashmir: Core problems between the two countries, like India’s control over Kashmir and Pakistan’s use of militant proxies, remain unaddressed. India’s unexpected decision in 2019 to abrogate article 370 of the Indian constitution has reinforced Pakistan’s attention on Kashmir. Sino-Pak Alliance: Pakistan accounted for 38% of China’s arms exports over 2016-20. Pakistan accounts for the lion’s share of Chinese investments made in South Asia (Chart 17). Sino-India rivalries will spill into the Indo-Pak relationship (and vice versa). Revival Of Taliban: The US withdrawal from Afghanistan has revived Taliban rule in that country. Taliban’s rise will resuscitate a range of dormant terrorist movements in Afghanistan as well as in Pakistan. India has a long history of being targeted. South Asia today is very different from what it looked like for most of the post-WWII era: it is heavily weaponized. India, Pakistan, and China became nuclear powers in the second half of the twentieth century and have been steadily building their nuclear stockpiles ever since (Chart 18). North Korea’s growing arsenal is theoretically able to target India, while Iran (more friendly toward India) may also obtain nuclear weapons. Chart 17China And Pakistan: Joined At The Hip?
South Asia: A New Geopolitical Theater
South Asia: A New Geopolitical Theater
Chart 18South Asia: The New Epicenter For Nuclear Activity
South Asia: A New Geopolitical Theater
South Asia: A New Geopolitical Theater
While nuclear arms create a powerful incentive for nations to avoid total war, they can also create unmitigated fear and uncertainty during incidents of major strategic tension. This is especially true when countries have not yet worked out a mode of living with each other, as with the US and USSR in the early days of the Cold War. Investment Takeaways For investors with an investment horizon exceeding 12 months, we highlight that India presents a long-term buying opportunity for two key reasons: China’s Internal And External Troubles Will Benefit India: As long as US and China do not reengage in a major way, global corporations will fall under pressure to diversify from China and the US will pursue closer relations with India. China faces an array of challenges across its periphery, whereas India need only focus on the South Asian sphere. India Is Rising As A Global Consumer: As long as a major Middle East war and oil shock is avoided (not a negligible risk), India should see more benefits than costs from its growing importance as a client of the world. However, over the next 12 months we worry that India is priced for perfection. India currently trades at a punchy premium relative to emerging markets (Table 1) at a time of when both geopolitical and macroeconomic headwinds are at play. In particular: Table 1We Are Bearish On India Tactically, But Bullish On India & Bangladesh Strategically
South Asia: A New Geopolitical Theater
South Asia: A New Geopolitical Theater
Major Transitions Are Dangerous: Recent developments in South Asia have added to geopolitical risks for India. The assumption of power by Taliban in Afghanistan will activate latent terrorist forces that could target India. Pakistan’s chronic instability combined with the change of power in Afghanistan could set off an escalation in Indo-Pakistani tensions, sooner rather than later. On India’s eastern front, China’s need to distract its population from a souring economy could trigger a clash between China and India. Down south, China’s rising influence over crisis-hit Sri Lanka is notable and could potentially engender security risks for India. Chart 19Politics Can Trump Economics In Run Up To General Elections
South Asia: A New Geopolitical Theater
South Asia: A New Geopolitical Theater
Growth Slowing, Elections Approaching: We worry that India’s growth engine may throw up a downside surprise over the next 12 months owing to poor jobs growth and poor investment growth. History suggests that politics often trumps economics in the run up to general elections (Chart 19). Hence there is a real risk that policy decisions will be voter-friendly but not market-friendly over 2022. As both India and Pakistan are gearing up for elections in the coming years, major military showdown or saber rattling should not be ruled out. Both countries may engineer a rally around the flag effect to bump up their pandemic-battered approval. Tension with China may escalate as Xi Jinping extends his term in power next year and seeks to enforce red lines in China’s eastern and western borders. Globally what are the key geopolitical factors that could lead to India’s underperformance in the short run? We highlight a checklist here: China Stimulates: The near-term clash between markets and policymakers in China should eventually give way to meaningful fiscal stimulus by Chinese authorities. This buoys China as well as emerging markets that depend on China for their growth. However, even if China flounders, India may not continue to outperform. The correlation between MSCI India and China equities has been positive. Fed Tightens Quickly: A faster-than-expected taper and tightening guidance could cause those emerging markets that are richly priced like India to correct. A Crisis Over Iran’s Nuclear Program: If the US is unable to return to diplomacy, tensions in the Middle East will rise and stoke oil prices. This will affect India adversely, given global price pressures and India’s high dependence on oil imports. Conversely, if these developments fail to materialize then that would lower our conviction regarding India’s underperformance in the short run. In summary, we are bullish India strategically but bearish tactically. As regards the three other investable markets in South Asia: We are bearish on Pakistan and Sri Lanka on a strategic time horizon. Whilst both nations’ rising alignment with China could be an advantage ceteris paribus, ironically their deteriorating finances are driving their proximity to capital-rich China (Chart 20). To boot, Sri Lanka’s ability to pay its way out of its economic crisis on its own steam is worsening. This is evident from its rising debt to GDP ratio (Chart 21). Chart 20Pakistan And Sri Lanka Running Low On Reserves
South Asia: A New Geopolitical Theater
South Asia: A New Geopolitical Theater
Pakistan faces elevated risks of internal social conflict, must deal with a rapidly changing external environment, has a weak democracy and an unusually influential military. Sri Lanka’s social risks are low, but its economic crisis appears likely to persist. The fact that both markets have been characterized by a high degree of volatility in earnings in the recent past implies that even a cyclical “Buy” case for either of these markets is fraught with risks (Table 1). The outlook for Bangladesh is better. Exports account for 15% of GDP and the US and Europe account for around 70% of its exports. Strong fiscal stimulus in these developed markets should augur well for this frontier market. Additionally, Bangladesh is characterized by moderate social risks, reasonably strong democracy scores and low levels of influence from the military. Its healthy public finances (Chart 21) and the fact that it shares no border with China creates the potential to leverage a symbiotic relationship with China. Chart 21Sri Lanka’s Debt Now Exceeds Its GDP
South Asia: A New Geopolitical Theater
South Asia: A New Geopolitical Theater
But there is a catch. Bangladesh as a market has a low market cap and hence offers low levels of liquidity (Table 1). We thus urge investors to avoid making cyclical investment calls on this South Asian market. However, from a long-term perspective we highlight our strategic bullish view on Bangladesh given supportive geopolitical factors. Watch out for an upcoming report from our Emerging Markets Strategy team, that will delve into the macroeconomic aspects of Bangladesh. Ritika Mankar, CFA Editor/Strategist ritika.mankar@bcaresearch.com Footnotes 1 Abhishek Vishnoi and Swetha Gopinath, "India's stock market on track to overtake UK in terms of m-cap: Report" Business Standard, October 2021. 2 Arianna Rossi, Christian Viegelahn, and David Williams, "The post-COVID-19 garment industry in Asia" Research Brief, International Labour Organization, July 2021. Open Trades & Positions
South Asia: A New Geopolitical Theater
South Asia: A New Geopolitical Theater
South Asia: A New Geopolitical Theater
South Asia: A New Geopolitical Theater
BCA Research’s Global Fixed Income Strategy service initiated a new tactical trade to position for more persistent ECB dovishness and a more hawkish Fed. The team continues to see no reason for the ECB to follow the Fed’s path towards imminent tapering and…
Highlights As US inflation proves to be not-so-transitory, US interest rate expectations will rise. Slowing Chinese domestic demand and rising US interest rate expectations will support the US dollar. The net impact from China’s slowdown and higher US interest rate expectations on mainstream EM will be currency depreciation. Rising mainstream EM nominal and real (inflation-adjusted) interest rates do not often lead to domestic currency appreciation A strengthening dollar vis-à-vis EM currencies is bad news for EM fixed-income markets – both local currency bonds and credit markets. Feature This report discusses EM local currency (domestic) bonds and US dollar bonds (credit markets). To begin with, we reiterate our main macro themes since January this year: (1) a slowdown in China and (2) rising US inflationary pressures and higher US bond yields. These macro themes will create tailwinds for the US dollar, at least for the next several months. A strengthening dollar is bad news for EM fixed-income markets. China’s Slowdown China’s slowdown will continue to unfold. China’s credit (TSF1 excluding equity) growth has slowed further in September (Chart 1, top panel). Similarly, household mortgages are also decelerating sharply (Chart 1, bottom panel). Chart 1China's Money And Credit Are Decelerating
China's Money And Credit Are Decelerating
China's Money And Credit Are Decelerating
Chart 2Curtailed Financing For Property Developers = Less Construction Activity
Curtailed Financing For Property Developers = Less Construction Activity
Curtailed Financing For Property Developers = Less Construction Activity
China's ever-important property market and construction activity will contract in the months ahead. Property sales were down by 20% in September from a year ago. Property developers in recent years have been relying on pre-construction sales as a major source of financing. With pre-sales drying up and borrowing restrained by both government regulations and creditors’ unwillingness to lend, property developers will be unable to sustain the current pace of construction and completion (Chart 2). Chart 3Red Flags For EM ex-TMT Stocks
Red Flags For EM ex-TMT Stocks
Red Flags For EM ex-TMT Stocks
For the same reason, property developers have curtailed their purchases of land. Land sales have been a major source of local government revenues – it is estimated to account for 45% of local government revenues including managed (off-balance sheet) funds. The upshot will be that local governments will be unable to ramp up their infrastructure spending to offset shrinking property construction. Altogether, these will have negative implications for the mainland’s industrial economy and raw materials. Notably, global material stocks have rolled over decisively even though CRB Raw Materials price index has yet to peak (Chart 3, top panel). Global industrial stocks in general and machinery stocks in particular have also relapsed. Finally, Chinese non-TMT share prices have dropped by 20% from their February high and EM ex-TMT equity prices have formed a head-and-shoulder pattern, which often precedes a major gap down (Chart 3, bottom panel). These equity market signals are foreshadowing a slowdown in China’s “old economy”. Bottom Line: The shockwaves emanating from the slowdown in China will hinder growth in Asia and commodity-producing economies in the rest of EM. This is positive for the US dollar because among major economic blocks, the US economy is the least exposed to the mainland economy. US Interest Rates Will Be Repriced US bond yields will continue marching higher, supporting the US dollar. The reasons for higher bond yields are as follows: Investors and commentators can differ on their assessment of the US inflation outlook. However, one thing that we should all agree on is that uncertainty over the US inflation outlook is extraordinarily high. Heightened uncertainty requires a higher risk premium in bonds, i.e., a wider bond term premium. Surprisingly, until August, the term premium on US bonds was very subdued (Chart 4). In brief, the US bond term premium will rise to reflect uncertainty around the inflation outlook, which will push bond yields higher. US wages hold the key to the inflation outlook. We believe that wage growth will surprise to the upside as many companies have strong order books but are struggling to hire. As people gradually return to the labor force, employers have a once in a decade chance to attract qualified employees. Hence, companies will likely compete with one another by offering higher wages to attract the most qualified candidates. The job quit rate is the highest it has been since the early 2000s. This rate also points to higher wages (Chart 5). Chart 4High Inflation Uncertainty Heralds Higher Bond Term Premium And Yields
High Inflation Uncertainty Heralds Higher Bond Term Premium And Yields
High Inflation Uncertainty Heralds Higher Bond Term Premium And Yields
Chart 5US Wage Growth Will Accelerate
US Wage Growth Will Accelerate
US Wage Growth Will Accelerate
Three factors that had suppressed US bond yields will likely be reversing: US commercial banks have been major buyers of US Treasurys and agency securities; the US Treasury has depleted its account at the Fed due to the debt ceiling but will now begin issuing more bonds to fill in this account; the Fed has been purchasing $80 billion of US government bonds each month; however, the Fed is preparing to taper and therefore reduce these purchases. Chart 6US Banks Have Been Buying Bonds En Masse
US Banks Have Been Buying Bonds En Masse
US Banks Have Been Buying Bonds En Masse
US commercial banks’ holdings of US government and agency securities has risen to 19% of their total assets – on par with their early 1990s all-time high (Chart 6, top panel). In turn, the share of loans and leases has fallen to an all-time low (Chart 6, middle panel). As US banks begin to expand their lending, they will likely reduce the pace of their buying of US Treasurys. This along with the US Treasury issuing more paper to increase its depleted Treasury General Account at the Fed (Chart 6, bottom panel) and the Fed’s tapering will likely push up US bond yields. Current shortages are the result of excessive demand, rather than producers operating below capacity.2 The fact is that the supply/shipment of goods is booming, at least from Asia/China to the US. This will prove to be inflationary, and therefore lead to higher bond yields. Chinese shipments to the US continue to thrive – in September, export values were up by 30.5% from a year ago (Chart 7, top panel). Given that US import prices from China are rising at an annual rate of 3.8%, China’s export volume to the US has grown to about 26.7% from last September when it was already booming. Consistently, inbound containers unloaded at the Long Beach and LA ports have surged to all-time highs (Chart 7, bottom panel). Hence, US ports are not operating below capacity, it is excessive demand for goods that has created these bottlenecks. Finally, concerning semiconductors, shortages are due to excessive demand not a failure to produce. Global semiconductor production has been growing rapidly over the past two years. A silver lining is that a capitalistic system will eventually expand production and meet demand. Although we broadly agree with this expectation, it will take a couple of years for this to take place. In the interim, we can expect to see higher prices, at least for goods, and rising inflation expectations. Bottom Line: As US inflation proves to be not-so-transitory, US interest rate expectations will rise, which will support the US dollar. The broad-trade weighted US dollar has been correlated with US TIPS yields (Chart 8). Chart 7Shipments From Asia To The US Have Been Booming
Shipments From Asia To The US Have Been Booming
Shipments From Asia To The US Have Been Booming
Chart 8High US Rates Will Support The Dollar
High US Rates Will Support The Dollar
High US Rates Will Support The Dollar
EM Domestic Bonds Chart 9EM Inflation Has Been Spiking
EM Inflation Has Been Spiking
EM Inflation Has Been Spiking
EM domestic bond yields have been rising as inflation in EM ex-China, Korea, Taiwan (herein referred as mainstream EM) has been surging (Chart 9). Even if commodity prices roll over, EM interest rate expectations will likely continue rising for now because of higher US bond yields and EM currency weakness. Many clients have been asking whether rising mainstream EM policy rates and local bond yields will support EM currencies. We do not think so. In high-yielding interest rate markets such as Brazil, Mexico, South Africa, Russia and Turkey, neither short- nor long-term rates have been positively correlated with the value of their currencies (Chart 10 and 11). Chart 10Higher Bond Yields Do Not Lead To Currency Appreciation In Brazil And Mexico
Higher Bond Yields Do Not Lead To Currency Appreciation In Brazil And Mexico
Higher Bond Yields Do Not Lead To Currency Appreciation In Brazil And Mexico
Chart 11Higher Bond Yields Do Not Lead To Currency Appreciation In Russia And South Africa
Higher Bond Yields Do Not Lead To Currency Appreciation In Russia And South Africa
Higher Bond Yields Do Not Lead To Currency Appreciation In Russia And South Africa
Chart 12Higher EM Inflation-Adjusted Bond Yields Do Not Lead To EM Currency Appreciation
Higher EM Inflation-Adjusted Bond Yields Do Not Lead To EM Currency Appreciation
Higher EM Inflation-Adjusted Bond Yields Do Not Lead To EM Currency Appreciation
Further, in these markets real (inflation-adjusted) rates also have not been positively correlated with their currencies (Chart 12). As illustrated in Charts 11, 12 and 13, there has been no positive correlation between both EM nominal and real (inflation-adjusted) interest rates and their currencies. Rather, there has often been a negative correlation. The basis is that exchange rates drive interest rate expectations, not vice versa. Currency depreciation leads to higher inflation expectations and rising interest rates. Conversely, exchange rate appreciation dampens inflation expectations paving the way for declining interest rates. Bottom Line: The net impact China’s slowdown and higher US interest rate expectations on mainstream EM domestic bonds will be currency depreciation with little room for their central banks to cut rates. As a result, local bonds’ risk-reward factor remains an unattractive tradeoff. EM Credit Markets As we laid out in A Primer on EM USD Bonds report on April 29, EM exchange rates and their business cycle are the key drivers of EM sovereign and corporate credit spreads. If EM currencies drop, EM sovereign and corporate credit spreads will widen (Chart 13). The basis is that foreign currency debt servicing will become more expensive as EM currencies depreciate. As EM growth disappoints, EM credit spreads will widen too (Chart 14). Chart 13EM Credit Spreads And EM Currencies
EM Credit Spreads And EM Currencies
EM Credit Spreads And EM Currencies
Chart 14EM Profit Expectations And EM Corporate Spreads
EM Profit Expectations And EM Corporate Spreads
EM Profit Expectations And EM Corporate Spreads
In addition, the continuous carnage in Chinese offshore corporate bonds will heighten odds of a material selloff in this EM credit. Chinese property companies’ USD bonds make up a more than half of China’s offshore USD corporate bond index and a large part of the EM corporate bond index. Poor performance of the EM corporate bond index could trigger outflows from this asset class. Investment Recommendations Slowing Chinese domestic demand and rising US interest rate expectations will support the US dollar. As the interest rate differential between China and the US narrows, the CNY will likely experience a modest setback versus the greenback (Chart 15). Even small RMB weakness could produce a non-trivial depreciation in EM exchange rates. The latter is negative for EM local currency bonds and EM credit markets. Absolute-return investors should stay on the sidelines of EM domestic bonds. For dedicated investors in this asset class, our recommended overweights are Mexico, Russia, Korea, India, China, Korea, Malaysia and Chile. EM credit markets will continue to underperform their US counterparts (Chart 16). Credit investors should continue underweighting EM credit versus their US counterparts, a strategy we have been recommending since March 25, 2021. Chart 15CNY/USD And The Interest Rate Differential
CNY/USD And The Interest Rate Differential
CNY/USD And The Interest Rate Differential
Chart 16EM Credit Markets Are Underperforming Their US Peers
EM Credit Markets Are Underperforming Their US Peers
EM Credit Markets Are Underperforming Their US Peers
Finally, EM ex-TMT share prices correlate with inverted EM USD corporate bond yields (Chart 17). Higher EM corporate bond yields (shown inverted in Chart 17) entail lower EM ex-TMT share prices. Chart 17High EM USD Bond Yields Herald Lower Share Prices
High EM USD Bond Yields Herald Lower Share Prices
High EM USD Bond Yields Herald Lower Share Prices
In turn, China’s TMT stocks remain vulnerable as we have argued in past reports. Arthur Budaghyan Chief Emerging Markets Strategist arthurb@bcaresearch.com Footnotes 1 Total Social Financing. 2 We made a similar case for Chinese electricity shortages in last week’s report. Equities Recommendations Currencies, Credit And Fixed-Income Recommendations
Highlights Cross-Atlantic Policy Divergence: A steadily tightening US labor market means that the Fed remains on track to formally announce tapering next month. Meanwhile, the ECB is signaling that they are in no hurry to do the same given scant evidence that surging energy prices are seeping into broader European inflation. This leads us to make the following changes to our tactical trade portfolio – taking profits on the 10-year French inflation breakeven spread widener; while switching out of the long December 2023 Euribor futures trade into a 10-year US Treasury-German Bund spread widening trade. Surging Antipodean Inflation: Australia and New Zealand are both seeing higher realized inflation, but market-based inflation expectations are falling in the former and rising in the latter. This leads us to make the following changes to our tactical trades: taking profits on the Australia-US 10-year spread widener; entering a new 10-year Australia inflation breakeven spread widener; and closing the underwater 2-year/5-year New Zealand curve flattening trade. Feature This week, we present a review of the shorter-term recommendations currently in our list of Tactical Overlay trades. These are positions that are intended to complement our strategic Model Bond Portfolio, with shorter holding periods – our goal is no longer than six months - and sometimes in smaller markets that are outside our usual core bond market coverage. As can be seen in the table on page 17, we typically organize these ideas by the type of trade (i.e. yield curve flatteners or cross-country spread wideners). Yet for the purposes of this review, we see two interesting themes that better organize the current trades and help guide our decision to keep them or enter new ones. Playing A Hawkish Fed Versus A Dovish ECB Federal Reserve officials have spent the past few months signaling that a tapering of bond purchases was increasingly likely to begin before year-end given the steadily improving US labor market. The September payrolls report released last Friday, even with the headline employment growth number below expectations for the second consecutive month, does not change that trajectory. Chart of the WeekCyclical UST Curve Flattening Pressures
Cyclical UST Curve Flattening Pressures
Cyclical UST Curve Flattening Pressures
The US unemployment rate fell to 4.8% in September, continuing the uninterrupted decline from the April 2020 peak of 14.8% (Chart of the Week). The pace of that decline has accelerated in recent months, although the Delta variant surge in the US has created distortions in both the numerator and denominator of the unemployment rate. Now that the US Delta wave has crested and case numbers are falling, growth in both employment and the labor force should start to accelerate in the next few payrolls reports. This will result in a faster pace of US job growth, albeit with a slower decline in the unemployment rate, likely starting as soon as the October jobs report. The US Treasury curve has already been reshaping in preparation for a less accommodative Fed, with flattening seen beyond the 5-year point (middle panel). We have positioned for a more hawkish Fed, and a flatter Treasury curve, in our Tactical Overlay via a butterfly trade. Specifically, we are short a 5-year Treasury bullet versus a long position in a 2-year/10-year barbell, all using on-the-run cash Treasuries. That trade was initiated on June 22, 2021 and has so far generated a small profit of +0.27%. Our butterfly spread valuation model for that 2/5/10 Treasury butterfly shows that the 5-year bullet has not yet reached an undervalued extreme versus the 2/10 barbell (Chart 2). We are keeping this trade in our Tactical Overlay, as the current 2/5/10 butterfly spread of 23bps is still 6bps below the +1 standard deviation level implied by our model. Chart 2Stay In Our 2/5/10 UST Butterfly Trade
Stay In Our 2/5/10 UST Butterfly Trade
Stay In Our 2/5/10 UST Butterfly Trade
Moving across the Atlantic, our trades have been the mirror image of our Fed recommendations, positioning for a continued dovish, reflationary ECB policy bias. We have expressed that via two trades: long 10-year French inflation breakevens and long December 2021 Euribor futures. We continue to see no reason for the ECB to follow the Fed’s path towards imminent tapering and signaling future rate hikes. Growth momentum has cooled in the euro area, with both the Markit composite PMI and the ZEW growth expectations index having peaked in June (Chart 3). At the same time, inflation expectations have picked up. The 5-year/5-year forward CPI swap rate has risen to 1.8%, still below the ECB’s 2% inflation target but well above the 2020 low of 0.7% (middle panel). Markets are focusing on the higher inflation and not the slowing growth, with the EUR overnight index swap (OIS) curve now pricing in 12bps of rate hikes in 2022 (bottom panel). We see that as a highly improbable outcome. There is little evidence that the latest pickup in euro area realized inflation is broadening out beyond surging energy price inflation and supply-constrained goods inflation (Chart 4). Euro area headline CPI inflation hit a 13-year high of 3.0% in August, with the “flash” estimate for September showing a further acceleration to 3.4%. Yet core inflation only reached 1.6% in August - a month when the trimmed mean euro area CPI inflation rate calculated by our colleagues at BCA Research European Investment Strategy was a scant 0.2%. Chart 3ECB Will Not React To This Cyclical Bout Of Inflation
ECB Will Not React To This Cyclical Bout Of Inflation
ECB Will Not React To This Cyclical Bout Of Inflation
Chart 4Euro Area Inflation Upturn Is Not Broad-Based
Euro Area Inflation Upturn Is Not Broad-Based
Euro Area Inflation Upturn Is Not Broad-Based
While the September flash estimate of core inflation did perk up to 1.9%, the trimmed mean measure shows that the rise in euro area inflation to date has not been broad based. Like the Fed, ECB officials have indicated that they view this pick-up in inflation as “transitory”, fueled by soaring energy costs and base effect comparisons to low inflation in 2020. Signs that higher inflation was feeding into “second round” effects like rising wage growth might change the ECB’s thinking. From that perspective, the recent increase in labor strike activity in Germany is a potentially worrisome sign, but the starting point is one of low wage growth – the latest available data on euro area wage costs showed a -0.1% decline during Q2/2021. Chart 5Close Our Long Dec/23 Euribor Futures Trade
Close Our Long Dec/23 Euribor Futures Trade
Close Our Long Dec/23 Euribor Futures Trade
We have been trying to fade ECB rate hike expectations via our long December 2023 Euribor futures trade. That position, initiated on May 18, 2021 has generated a small loss of -0.11% (Chart 5). We still expect the ECB to keep rates on hold in 2022, and most likely 2023, so there is the potential for that trade to recover that underperformance. However, that position has now reached the six-month holding period “re-evaluation” limit that we have imposed on our Tactical Overlay trades. Thus, we are closing that trade this week. In its place, we are initiating a new tactical trade to position for not only persistent ECB dovishness but a more hawkish Fed – a US Treasury-German Bund spread widening trade using 10-year bond futures. The specific details of the trade (futures contracts, duration-neutral weightings on each leg of the trade) can be found in the table on page 17. This new UST-Bund trade is attractive for three reasons: Our valuation model for the Treasury-Bund spread - which uses relative policy interest rates, relative unemployment, relative inflation and the relative size of the Fed and ECB balance sheets as inputs – shows that the spread is currently undervalued by more than one full standard deviation, and fair value is rising (Chart 6). The technical backdrop for the Treasury-Bund spread has turned more favorable for wideners, with the spread having fallen back to its 200-day moving average and the 26-week change in the spread now down to levels that preceded past turning points in the spread (Chart 7). Chart 6Enter A New 10yr UST-Bund Spread Widening Trade
Enter A New 10yr UST-Bund Spread Widening Trade
Enter A New 10yr UST-Bund Spread Widening Trade
Relative data surprises are pointing to relatively higher US yields and a wider Treasury-Bund spread, with the Citigroup Data Surprise Index for the US now rising and the euro area equivalent measure falling (Chart 8). Chart 7UST-Bund Technical Backdrop Positioned For Widening
UST-Bund Technical Backdrop Positioned For Widening
UST-Bund Technical Backdrop Positioned For Widening
Chart 8Relative Data Surprises Favor Wider UST-Bund Spread
Relative Data Surprises Favor Wider UST-Bund Spread
Relative Data Surprises Favor Wider UST-Bund Spread
While we are entering a new trade to play for a relatively dovish ECB, we are also choosing to take the substantial profit in our tactical trade in French inflation breakevens. Specifically, we are closing our 10-year French inflation breakeven spread widening position – long a 10-year cash OATi bond, short 10-year French bond futures – with a solid gain of +6.3%. Chart 9Take Profits On Our Long 10yr French Breakevens Trade
Take Profits On Our Long 10yr French Breakevens Trade
Take Profits On Our Long 10yr French Breakevens Trade
We have held this trade for nine months, a bit longer than our typical tactical trade holding period. We did so because French 10-year breakevens continued to look cheap on our valuation model. Now, the breakeven spread has risen to fair value (Chart 9), prompting us to take our gains and move on. Diverging Inflation Expectations In Australia & New Zealand Playing Fed/ECB policy divergence was the first main theme of this Tactical Overlay trade review. The second broad theme is also a divergence, between inflation expectations in New Zealand (which are rising) and Australia (which are falling). This trend leads us to close two existing trades and enter a new position. Chart 10An Inflation-Induced Bear Steepening Of Yield Curves
An Inflation-Induced Bear Steepening Of Yield Curves
An Inflation-Induced Bear Steepening Of Yield Curves
In New Zealand, we are closing out our 2-year/5-year government bond yield curve flattener trade, initiated on July 21, for a loss of -0.32%. While we were correct in our expectation of ramped-up hawkishness from the Reserve Bank of New Zealand (RBNZ), we were caught offside by persistently sticky inflation which has become a headache for global central bankers. With supply squeezes and high commodity prices not going away anytime soon, sovereign curves have bear-steepened across developed markets, driven by rising long-dated inflation expectations (Chart 10). This global steepening pressure also hit the New Zealand curve, to the detriment of our domestic RBNZ-focused flattener trade. There was also a technical component to the steepening in the New Zealand 2-year/5-year curve (Chart 11). With the 2-year/5-year curve having dipped far below its 200-day moving average and the 26-week rate of change at stretched levels, the flattener was already “overbought” when we entered the trade. Despite a steady stream of hawkish messaging from the RBNZ, leading to an actual rate hike last week, technicals did win out in the short term as the 2-year/5-year spread steepened back up towards the 200-day moving average. Chart 11The NZ 2s/5s Curve Has Also Steepened Due To Technical Factors
The NZ 2s/5s Curve Has Also Steepened Due To Technical Factors
The NZ 2s/5s Curve Has Also Steepened Due To Technical Factors
On the positive side, our decision to implement this trade as a duration-neutral “butterfly”, selling a 2-year bond, and using the proceeds to buy a weighted combination of a 5-year bond and a 3-month treasury bill with an equivalent duration to the 2-year bond, worked as intended with the butterfly underperforming as the underlying 2-year/5-year curve steepened. Looking forward, technicals are still some distance from turning favorable and will remain a headwind for the flattener trade. Implied forward rates are also not in our favor, with markets already pricing in some flattening, making this a negative carry trade. Over a cyclical horizon – i.e. beyond our normal six-month holding period for tactical trades - we still expect the shorter-end of the New Zealand to flatten. The experience of past hiking cycles shows that the 2-year/5-year curve tends to continue flattening during policy tightening, usually leveling out at 0bps before re-steepening (Chart 12). Considering that we have already been in this trade for three months, however, we do not believe our initial curve flattening bias will play out successfully over the remainder of our six-month tactical horizon. While we are closing out our flattener trade, we will investigate ways to better express our bearish cyclical view on New Zealand sovereign debt in a future report. Turning to Australia, we are closing out our long Australia/short US spread trade, implemented using 10-year bond futures, taking a healthy profit of +2.1%. We have held this trade for longer than our typical six-month holding period (the trade was initiated on January 26, 2021) because our Australia-US 10-year spread valuation model has continued to flash that the spread was too wide to its fair value (Chart 13). The model has been signaling that the spread should be negative, yet Australian yields have been unable to trade below US yields for any sustained length of time in 2021. Furthermore, the model-implied fair value is now starting to bottom out, suggesting a diminishing tailwind from the relative fundamental drivers of the spread embedded in our model. Chart 12The NZ 2s/5s Curve Will Flatten Over A Cyclical Horizon
The NZ 2s/5s Curve Will Flatten Over A Cyclical Horizon
The NZ 2s/5s Curve Will Flatten Over A Cyclical Horizon
Chart 13Take Profits On Our 10-Yr Australia-US Spread Narrowing Trade
Take Profits On Our 10-Yr Australia-US Spread Narrowing Trade
Take Profits On Our 10-Yr Australia-US Spread Narrowing Trade
Chart 14Inputs Into Our Australia-US Spread Model
Inputs Into Our Australia-US Spread Model
Inputs Into Our Australia-US Spread Model
The inputs into our 10-year spread model are relative policy interest rates, core inflation, unemployment and the size of central bank balance sheets (to incorporate QE effects) for Australia and the US. Of these variables, the biggest drivers of the decline in the fair value since the start of the COVID pandemic in 2020 have been relative inflation and the relative size of the Fed and Reserve Bank of Australia (RBA) balance sheets as a percentage of GDP (Chart 14). Both of those trends are related. Persistently underwhelming Australian inflation – despite accelerating inflation in the US and other developed economies over the past year – has forced the RBA into a pace of asset purchases relative to GDP that exceeded even what the Fed has done since the pandemic started (bottom panel). However, Australian inflation finally began catching up to the rising trends seen elsewhere in the spring of this year, with headline CPI inflation jumping from 1.1% to 3.8% on a year-over-year basis during Q2. Australian bond yields have traded more in line with US yields since that mid-year pop in inflation, preventing the Australia-US spread from narrowing below zero and converging to our model-implied fair value. This is despite a severe COVID wave that forced much of Australia into the kind of severe lockdowns that the nation avoided during the worst of the global pandemic in 2020. With Australian inflation now moving higher and converging towards US levels, economic restrictions starting to be lifted thanks to a rapid vaccination campaign, and the RBA having already done some tapering of its asset purchases before the Fed, the fundamental rationale for holding our Australia-US trade is no longer valid, leading us to take profits. The convergence to fair value in our spread model is now more likely to come from fair value rising rather than the actual spread falling. The pickup in Australian inflation also leads us to enter a new trade Down Under. This week, we are initiating a new trade, going long 10-year Australia inflation breakevens, implemented by going long a 10-year cash inflation-linked bond and selling 10-year bond futures. The details of the new trade are shown in the table on page 17. Despite the uptick in realized Australian inflation, breakevens have actually been declining over the past several months, falling from a peak of 247bps on May 13 to the current 208bps. That move has accelerated more recently due to a rise in Australian real yields that has coincided with markets pricing in more future RBA rate hikes. Our 24-month Australia discounter, which measures the total amount of tightening over the next two years discounted in the AUD OIS curve, now shows that 104bps of rate hikes are expected by the fourth quarter of 2023 (Chart 15, bottom panel). This has occurred despite Australian wage growth remaining well below the 3-4% range that the RBA believes is consistent with underlying Australian inflation returning sustainably to the RBA’s 2-3% target band (top two panels). Chart 15Market Expectations For The RBA Are Too Hawkish
Market Expectations For The RBA Are Too Hawkish
Market Expectations For The RBA Are Too Hawkish
Chart 16Go Long 10-Yr Australian Inflation Breakevens
Go Long 10-Yr Australian Inflation Breakevens
Go Long 10-Yr Australian Inflation Breakevens
Australian real bond yields have begun to move higher in response to this more hawkish market policy expectation that seems overdone, helping push breakeven inflation even lower more recently. This has helped unwind some of the overvaluation of 10-year inflation breakevens from earlier in 2021. Our fundamental model for the 10-year Australian breakeven showed that the spread was over two standard deviations above fair value to start 2020 (Chart 16). The decline in the spread since that has largely eliminated that overvaluation, providing a better entry point for a new breakeven spread widening trade. With survey-based measures of inflation expectations rising even as breakevens fall back to fair value (bottom panel), we see a strong case for adding a new Australian inflation trade to our Tactical Overlay. Robert Robis, CFA Chief Fixed Income Strategist rrobis@bcaresearch.com Shakti Sharma Senior Analyst ShaktiS@bcaresearch.com Recommendations The GFIS Recommended Portfolio Vs. The Custom Benchmark Index
A Thematic Update Of Our Tactical Trades
A Thematic Update Of Our Tactical Trades
Duration Regional Allocation Spread Product Tactical Trades Yields & Returns Global Bond Yields Historical Returns
Next week is the BCA Annual Conference, at which I will debate Professor Nouriel Roubini on ‘The Outlook For Cryptocurrencies’. I will make the passioned case for cryptos, and Nouriel will make the passioned case against. I do hope that many of you can join the debate, as well as the other insightful sessions at the conference. As such, there will be no report next week and we will be back on October 28. Highlights The anomaly of the current ‘inflation crisis’ is not that goods and commodity prices have surged. The anomaly is that state intervention protected services prices from a massive (and continuing) negative demand shock. Absent the state intervention, there would not be the current ‘inflation crisis’. On a 6-12-month horizon: Underweight the durables-heavy consumer discretionary sector versus the market. Underweight commodities that have not yet sharply corrected versus those that have sharply corrected. For example, underweight tin versus iron ore. From the current ‘inflation crisis’, the real surprise could be how low inflation ends up 12 months from now. Hence, stay overweight US T-bonds versus US TIPS. Fractal analysis: Natural gas, plus industrial metals versus industrial metal equities. Feature Chart of the WeekServices Prices Suffered In The Post-GFC Services Slump...
Services Prices Suffered In The Post-GFC Services Slump...
Services Prices Suffered In The Post-GFC Services Slump...
Chart of the Week...But Not In The Post-Pandemic Services Slump. Why Not?
...But Not In The Post-Pandemic Services Slump. Why Not?
...But Not In The Post-Pandemic Services Slump. Why Not?
The great writers, artists, and musicians tell us that the most profound messages often come from what is not said, not painted, and not played. What does not happen is sometimes more significant than what does happen. In this vein, we believe that the real story of the current ‘inflation crisis’ is not what has happened to goods and commodity prices, but what has not happened to services prices. The real story is that while goods and commodity prices have reacted exactly as would be expected to a positive demand shock, services prices have not reacted as would be expected to the mirror-image negative demand shock. The Anomaly Is Not Goods Prices, It Is Services Prices The following analysis quantifies the impact of the pandemic on different parts of the economy by examining the deviations of current spending and prices from their pre-pandemic trends. The analysis uses US data simply because of its timeliness and granularity, but the broad patterns and conclusions apply equally to most other developed economies. Looking at the overall economy, we know that, thus far, we have experienced neither a lasting negative demand shock from the pandemic, nor a lasting positive demand shock from the ensuing stimulus. We know this, because current spending is not far short of its pre-pandemic trend. The real story of the current ‘inflation crisis’ is not what has happened to goods and commodity prices, but what has not happened to services prices. Yet when we drill down to the components of spending, we see a different story. The pandemic and its policy response unleashed a massive and unprecedented displacement of spending from services to goods (Chart I-2). Chart I-2The Pandemic Unleashed A Massive Displacement Of Spending From Services To Goods
The Pandemic Unleashed A Massive Displacement Of Spending From Services To Goods
The Pandemic Unleashed A Massive Displacement Of Spending From Services To Goods
By March 2021, while US spending on services was still below its pre-pandemic trend by $700 billion, or 8 percent, the displacement of those dollars of spending had boosted spending on the smaller durable goods component by 26 percent. Suffice to say, a 26 percent excess demand for durable goods cannot be satisfied by a modern manufacturing sector that utilises just-in-time supply chains and negligible spare capacity! As surging demand met relatively fixed supply, the price of durable goods skyrocketed to the current 11 percent above its pre-pandemic trend (Chart I-3). Chart I-3The Inflation In Durables Prices Is Rational, The Absence Of Deflation In Services Prices Is Irrational
The Inflation In Durables Prices Is Rational, The Absence Of Deflation In Services Prices Is Irrational
The Inflation In Durables Prices Is Rational, The Absence Of Deflation In Services Prices Is Irrational
It follows that the inflation in durables prices is the perfectly rational outcome of a classic positive demand shock – meaning, surging demand in the face of limited supply. What is much less rational is that a massive negative demand shock for services has had almost no negative impact on services prices. This is the untold story of the current ‘inflation crisis’ which requires further explanation. Government Intervention Prevented A Collapse In Services Prices If the pandemic had unleashed a classic negative demand shock for services, then services prices would have collapsed. We know this because in the aftermath of the global financial crisis (GFC), services prices fell below their pre-GFC trend exactly in line with the decline in services demand. But in the aftermath of the pandemic’s massive negative shock for services spending, services prices have remained on their pre-pandemic trend (Chart of the Week). The question is, how? The answer is that this was not a classic negative demand shock. The reason that service spending collapsed was that a large swathe of services – such as leisure and hospitality – became unavailable because of mandated shutdowns or lockdowns. In this case, there was no point in reducing prices to reattract demand from durable goods because nobody could buy these services anyway! In effect, while the goods sector remained subject to market forces, a large swathe of the service sector came under state intervention, and was no longer subject to market forces. Meanwhile, statisticians continued to record the seemingly unaffected price of eating out or going to the theatre, even though most restaurants and entertainment venues were shuttered, making their prices meaningless. Absent state intervention in the services sector, we would not be talking about the current ‘inflation crisis’. Absent state intervention, these service providers would have had to reduce their prices to attract wary consumers amid a pandemic. This we know from Sweden, the one major economy that did not have any mandated shutdowns or lockdowns. While leisure and hospitality have remained largely open, Sweden’s services prices have declined markedly from their pre-pandemic trend – in sharp contrast to the unchanged trend in the US (Chart I-4). Chart I-4Services Prices Have Declined In Non-Interventionist Sweden, But Not In The Interventionist US
Services Prices Have Declined In Non-Interventionist Sweden, But Not In The Interventionist US
Services Prices Have Declined In Non-Interventionist Sweden, But Not In The Interventionist US
Hence, while inflation now stands at a sedate 2 percent in Sweden, it stands at a hot 5 percent in the US. If the US (and other country) governments had not intervened in the services sector, then the evidence from the GFC in 2008 and Sweden today strongly suggests that services prices would be below their pre-pandemic trend, offsetting goods prices that are above their pre-pandemic trend. The result would be that the overall price level would be on, or close to, its pre-pandemic trend. Just as overall spending is on its pre-pandemic trend. To repeat the key message of this analysis, the anomaly in most economies is not that goods and commodity prices have surged. The price surge is the perfectly rational response to a positive demand shock. The anomaly is that services prices did not react negatively to a negative demand shock (Chart I-5 and Chart I-6), as they did post-GFC and post-pandemic in non-interventionist Sweden. Chart I-5The Anomaly Is Not That Goods Prices ##br##Rose...
The Anomaly Is Not That Goods Prices Rose...
The Anomaly Is Not That Goods Prices Rose...
Chart I-6...The Anomaly Is That Services Prices Did Not Fall
...The Anomaly Is That Services Prices Did Not Fall
...The Anomaly Is That Services Prices Did Not Fall
The untold story is that, absent state intervention in the services sector, we would not be talking about the current ‘inflation crisis’. What Happens Next? The surging demand for durables is correcting. Since March, it is already down by 15 percent but requires a further 7 percent decline to reach its pre-pandemic trend, which we fully expect to happen. After all, there are only so many smartphones and used cars that you can own! Meanwhile, as manufacturers respond with a lag to recent high prices, expect a tsunami of durables supply to hit in 6-12 months just as demand has fallen off a cliff. The result will be a major threat to any durable good or commodity price that has not already corrected. As a salutary warning of what lies ahead, witness the recent 75 percent crash in lumber prices. The same principle applies to non-durables such as food and energy. Non-durables spending is likely to fall back to its pre-pandemic trend, and non-durables prices are likely to follow. Again, outside a short-lived surge in demand from, say, a very cold winter, there is only so much energy and food that you can consume. For services, there are two opposing forces. The inflationary force is that the recent inflation in goods will transmit into wages and therefore into services prices. Against this, the deflationary force is that structural changes, such as hybrid home/office working, mean that services spending will struggle to make the near 6 percent increase to reach its pre-pandemic trend. Underweight the durables-heavy consumer discretionary sector versus the market. Pulling these effects together, we reiterate three investment recommendations on a 6-12 month horizon: Underweight the durables-heavy consumer discretionary sector versus the market (Chart I-7). Underweight commodities that have not yet sharply corrected versus those that have sharply corrected. For example, underweight tin versus iron ore. From the current ‘inflation crisis’, the real surprise could be how low inflation ends up 12 months from now. Hence, stay overweight US T-bonds versus US TIPS. Chart I-7As Durables Spending Normalises, The Durables-Heavy Consumer Discretionary Sector Underperforms
As Durables Spending Normalises, The Durables-Heavy Consumer Discretionary Sector Underperforms
As Durables Spending Normalises, The Durables-Heavy Consumer Discretionary Sector Underperforms
Natural Gas Prices Are Technically Extreme The surge in natural gas prices in both Europe and the US has reached a point of extreme fragility on its 130-day fractal structure. Hence, if the tight fundamentals show the slightest signs of abating, natural gas prices would be vulnerable to a sharp reversal (Chart I-8). Chart I-8Natural Gas Prices Are Technically Extreme
Natural Gas Prices Are Technically Extreme
Natural Gas Prices Are Technically Extreme
Elsewhere, we see an arbitrage opportunity between industrial metal prices, which are still close to highs, and industrial metal equities, which have plunged by 20 percent since May. The relationship between the underlying metal prices and the metals equities sector is now stretched versus its history, and on its composite 65/130-day fractal structure (Chart I-9). Chart I-9The Relationship Between Metal Prices And Metal Equities Is Stretched
The Relationship Between Metal Prices And Metal Equities Is Stretched
The Relationship Between Metal Prices And Metal Equities Is Stretched
Hence, the recommended trade is to go short the LMEX Index/ long nonferrous metals equities. One way to implement the long side of the pair is through the ETF PICK. Set the profit target and symmetrical stop-loss at 8 percent. Dhaval Joshi Chief Strategist dhaval@bcaresearch.com Fractal Trading System Fractal Trades 6-Month Recommendations Structural And Thematic Recommendations Closed Fractal Trades Indicators To Watch - Bond Yields Chart II-1Indicators To Watch - Bond Yields ##br##- Euro Area
Indicators To Watch - Bond Yields - Euro Area
Indicators To Watch - Bond Yields - Euro Area
Chart II-2Indicators To Watch - Bond Yields ##br##- Europe Ex Euro Area
Indicators To Watch - Bond Yields - Europe Ex Euro Area
Indicators To Watch - Bond Yields - Europe Ex Euro Area
Chart II-3Indicators To Watch - Bond Yields ##br##- Asia
Indicators To Watch - Bond Yields - Asia
Indicators To Watch - Bond Yields - Asia
Chart II-4Indicators To Watch - Bond Yields ##br##- Other Developed
Indicators To Watch - Bond Yields - Other Developed
Indicators To Watch - Bond Yields - Other Developed
Indicators To Watch - Interest Rate Expectations Chart II-5Indicators To Watch - Interest Rate Expectations
Indicators To Watch - Interest Rate Expectations
Indicators To Watch - Interest Rate Expectations
Chart II-6Indicators To Watch - Interest Rate Expectations
Indicators To Watch - Interest Rate Expectations
Indicators To Watch - Interest Rate Expectations
Chart II-7Indicators To Watch - Interest Rate Expectations
Indicators To Watch - Interest Rate Expectations
Indicators To Watch - Interest Rate Expectations
Chart II-8Indicators To Watch - Interest Rate Expectations
Indicators To Watch - Interest Rate Expectations
Indicators To Watch - Interest Rate Expectations