Fixed Income

Highlights The baht will depreciate further, given the state of the economy and external accounts. Domestic demand was already relapsing, even before the latest surge in COVID-19 cases. Now, the recovery will be delayed more. The authorities have little to offer by way of fiscal or monetary support. Credit to the job-intensive SME sector has collapsed. The balance of payment dynamics remains negative for the currency. Investors should stay short the baht. Dedicated EM asset allocators should continue to be neutral on Thailand within respective equity and domestic bond portfolios. Feature Chart 1Thai Stocks Are Facing Several Headwinds
Thailand: Stay Short The Baht
Thailand: Stay Short The Baht
Our negative view on the baht has played out as expected.1 The Thai currency is down 10% versus the dollar since its peak in February of this year. It has also been the worst performer in Asia. The country’s stock market is struggling and going down in both absolute terms and relative to their EM counterparts (Chart 1). Going forward, odds are that the baht will remain weak. A weak currency will continue to stifle both Thai stocks’ and local currency bonds’ relative performance. Investors should stay short the baht and remain neutral Thai equity and local currency bonds within their respective EM portfolios. Relapsing Growth Chart 2Surging New COVID-19 Cases...
Thailand: Stay Short The Baht
Thailand: Stay Short The Baht
The latest spike in new COVID-19 cases has dashed hopes for any early recovery of the Thai economy (Chart 2). Earlier this month, the central bank revised down their GDP forecast for 2021 from 1.8% to 0.7%. We concur with this bearish outlook: Private consumption in real terms was languishing as of June this year at 10% below 2019 levels. Car sales, both personal and commercial, are even more downbeat (Chart 3). After the latest surge in new COVID-19 cases, those numbers must have weakened further. Incidentally, the country’s vaccination rate, at 26% of total population (7.5% fully vaccinated), remains low. It could be, therefore, several months before any meaningful recovery in consumer demand takes place. Faced with low demand, the country’s manufacturing and shipment volumes are also weak. They are both breaking down anew from well below the 2019 levels (Chart 4, top panel). Chart 3...Will Further Delay Domestic Demand Recovery
Thailand: Stay Short The Baht
Thailand: Stay Short The Baht
Chart 4Manufacturers Are Saddled With High Inventory Amid Weak Orders...
Thailand: Stay Short The Baht
Thailand: Stay Short The Baht
Weak demand also means that businesses are stuck with high inventories. Indeed, there is a widening disparity between inventory levels and shipments (Chart 4, middle panel). Furthermore, order books have slipped back to levels not seen since the height of the COVID-19 scare early last year. The combination of high inventories and tumbling orders does not portend a manufacturing recovery anytime soon (Chart 4, bottom panel). Notably, jobs and wages are also weak. Employment in the manufacturing sector is well below pre-pandemic levels (Chart 5). This trend, in turn, is hurting household income and consumer demand, completing a vicious cycle of depressed demand, weak production, falling employment and household income, and further reduced demand. The softness of the economy is accentuating the disinflationary pressure that was already entrenched. Headline and core CPI in Thailand have stayed mostly below 1% over the past five years — the lower band of the central bank’s inflation target. Now, they are flirting with outright deflation. In fact, if the impact of food and oil prices is excluded, the prices are actually deflating (Chart 6). Chart 5...Which Is Hurting Jobs And Wage Growth
Thailand: Stay Short The Baht
Thailand: Stay Short The Baht
Chart 6Thailand Is Flirting With Outright Deflation...
Thailand: Stay Short The Baht
Thailand: Stay Short The Baht
Outright deflation makes it harder for borrowers to service their debts, which then discourages both borrowing and spending — making the recovery much harder. Notably, the banks’ prime lending rates remain high at 5.4%, which means real prime lending rates are quite steep at 5% (deflated by core CPI). This is at a time of very low household income and business revenue growth expectations. This trend is a strong disincentive for borrowing and consuming /capital spending. Little Policy Support What is more concerning for the economy is that policymakers can offer little to boost the economy. Fiscal stimulus has waned: government expenditure, after a surge last year, is now contracting (Chart 7). The budget proposal for the next fiscal year (October 2021 - September 2022) that was passed by the parliament in June 2021 (first reading)2 stipulates a 5.7% cut in nominal spending. Part of the reason is that fiscal deficits have already ballooned to a staggering 8% of GDP — from an average of 2.5% in the past ten years. The IMF estimates that the fiscal thrust will be zero this year, and a negative 2.4% of GDP in 2022 (Chart 7, bottom panel). The monetary policy transmission is also paralyzed. Despite easing by the Bank of Thailand — the policy rate is at an all-time low of 0.5% since May last year — credit growth is dismal. Lenders are wary of rising NPLs and are holding back new credit: The share of impaired loans (NPLs plus Special Mention Loans) of total bank loans has dramatically increased to 10%. In the case of small and medium enterprises (SMEs), that ratio is 20%. By comparison, loss provisions are much lower, at just 5.2% as of June of this year (Chart 8, top panel). Chart 7...Yet, The Government Is Planning To Cut Fiscal Spending
Thailand: Stay Short The Baht
Thailand: Stay Short The Baht
Chart 8Sharp Rise In Banks' Stressed Loans Amid Tanking Profits...
Thailand: Stay Short The Baht
Thailand: Stay Short The Baht
Notably, both operating and net profits of banks had already halved (as a % of assets) by June 2021 — as both interest and non-interest incomes dropped. Profits are slated to contract further, since banks will have to make greater provisions in the future as the recent surge in new cases will produce more loan delinquencies (Chart 8, bottom panel). The specter of rising NPLs has prompted banks to retrench loans. In particular, bank credit to SMEs has plunged by a massive 34% from 2019 levels (Chart 9). Before the pandemic, banks’ SME loans made up a significant 30% of GDP. Now, they are down to 21%. Credit retrenchment of this order to the job-intensive SME sector is going to have a significant negative ripple effect. Employment will shrink further as small businesses go bust. Shrinking jobs will dent household income, and, in turn, consumer demand. Incidentally, loans to other business segments are also not rising much. Bank loans to all non-financial corporates are growing rather minimally, at 1.5% year-over-year. Going into the pandemic, the Thai household sector was already highly leveraged. Over the past two decades, banks and other financial institutions have been lending ever more to households, shunning non-financial corporates. Households’ borrowing from banks have now risen to 40% of GDP; and those from other institutions another 50%. These loans had helped boost consumer demand all those years, but now, at a time when incomes are uncertain, households have very limited appetite to borrow more to spend. This means a consumer debt-fueled demand recovery is not in the cards (Chart 10). Chart 9...Induced Banks To Massively Reduce Credit To The Job-Intensive SME Sector
Thailand: Stay Short The Baht
Thailand: Stay Short The Baht
Chart 10Thai Households Are Too Indebted To Borrow More And Spend
Thailand: Stay Short The Baht
Thailand: Stay Short The Baht
In brief, Thai businesses are in the middle of a toxic combination of contracting sales, absent fiscal support, slashed credit facilities, and rather high borrowing costs in real terms. Chart 11 shows that corporate profit margins of non-financial firms are struggling at a low level. It is no wonder that businesses are reluctant to invest, expand, and hire. The message is similar when we examined all companies included in the MSCI Thailand stock index. On the one hand, their EPS has fallen to 10-year lows. Thai stock prices, on the other hand, have not yet fallen as much as the shrinking EPS would imply (Chart 12, top panel). The consequence is that the valuations are remarkably stretched—near a 20-year high (Chart 12, bottom panel). Chart 11Low Margins Are Discouraging Thai Firms To Borrow, Invest, Or Hire
Thailand: Stay Short The Baht
Thailand: Stay Short The Baht
Chart 12Thai Profits, At A Decade-Low, Are Also A Headwind For Stock Prices
Thailand: Stay Short The Baht
Thailand: Stay Short The Baht
All in all, for Thai share prices to stage a sustainable rally, an economic recovery is essential. The first indications of that usually come from an improving order book. The latter currently shows little glimmer of hope. But investors should keep an eye on this indicator, as Thai stocks’ performance is geared to the ebbs and flows of the business order book (Chart 13). Thailand Needs A Weaker Currency The state of the Thai economy not only warrants exchange rate depreciation, but also needs a much weaker currency to help an economic recovery. The country’s balance of payment is in deficit — for the first time since 2014. A crucial reason is that the baht is still expensive, which continues to weigh on exports. Of all the export-oriented Asian economies, Thai exports recovery has been the weakest (Chart 14). Chart 13Keep An Eye On The Order Book For A Sign In Stock Recovery
Thailand: Stay Short The Baht
Thailand: Stay Short The Baht
Chart 14An Expensive Baht Held Back Thai Exports Recovery
Thailand: Stay Short The Baht
Thailand: Stay Short The Baht
The fact that a quarter of Thai exports go to other ASEAN countries — where demand has been and remains weak due to the lingering pandemic — doesn’t help either. As a result, the Thai trade surplus has narrowed significantly, and the current account has slipped into deficit (Chart 15, top and middle panels). The other main external revenue source of Thailand, tourism, continues to be near absent at 0.6% of GDP — a far cry from a high of 12% before the pandemic (Chart 15, bottom panel). What’s more, there is little hope of any recovery in the near future. The government now expects the number of foreign tourists this year to be as low as 0.3 million versus 40 million in 2019. On the capital account front, Thailand continues to hemorrhage both FDI and portfolio capital — just as it did the past several years. Despite that, the baht had remained strong until early this year, as a result of a substantial repatriation of bank deposits by Thai residents and, to a lesser extent, foreign borrowings. Those inflows prevented the Thai baht from depreciating. But such panic-stricken, one-off savings/deposit repatriations by Thai residents will certainly slow materially going forward (Chart 16). Chart 15The Thai Current Account Balance Will Struggle To Stay In Surplus...
Thailand: Stay Short The Baht
Thailand: Stay Short The Baht
Chart 16...While The Capital Account Balance Will Slip Deeper Into Deficit...
Thailand: Stay Short The Baht
Thailand: Stay Short The Baht
There’s also little hope that FDI and portfolio inflows will pick up the slack. The reason is that the Thai economy is very weak and the return on capital is low. The latter discourages capital inflows. The fact that the baht continues to be an expensive currency in real terms, and therefore not as competitive as some of its neighbors’, doesn’t help either. The multi-nationals who are planning to re-locate out of China might find some other countries — where the currency is more competitive (such as in India, Malaysia, or the Philippines) — more attractive. Overall, the Thai capital account balance will likely slide deeper into deficit, at a time when the current account will also struggle to stay in surplus. The result will be a further deterioration in the country’s balance of payment, hurting the baht (Chart 17). Considered from another angle, if the return on capital on Thai assets is any guide, the baht could drop much more from its current levels (Chart 18). Chart 17...Putting Downward Pressure On The Baht
Thailand: Stay Short The Baht
Thailand: Stay Short The Baht
Chart 18Thai Firms' Low Rates Of Return Point To More Baht Depreciation
Thailand: Stay Short The Baht
Thailand: Stay Short The Baht
The reality is that, given Thailand’s current macro backdrop, a cheaper currency is what the nation needs. That will help boost growth significantly by aiding exports and promoting import substitution. Since foreign trade makes up an impressive 90% of GDP, a boost therein could kickstart the entire economy. Another result of a weaker currency will be higher inflation, something the economy seriously needs. Higher inflation will contribute to lower real interest rates which, in turn, will encourage borrowing and spending. Higher spending and inflation will help achieve higher nominal sales, boost firms’ profits, employment, and eventually, household incomes. All in all, it could allow a productive cycle to unfold. Given all these possible benefits and given that policymakers have few other tools at their disposal at this juncture, chances are the central bank will let the baht depreciate more, albeit in an orderly fashion, in the months to come. What About Bonds? Chart 19Mantain A Neutral Allocation To Thai Domestic Bonds In An EM Basket
Thailand: Stay Short The Baht
Thailand: Stay Short The Baht
Thai local currency bonds’ absolute return in US dollar terms, as expected, is highly dependent on the exchange rate (Chart 19, top panel). Given the weak currency outlook, foreign investors should refrain from holding Thai domestic bonds outright. For foreign asset allocators, however, the matter is more nuanced. Thai domestic bonds’ relative return versus that of overall EM did not depend on the baht movement alone. This is because Thailand has been a defensive market owing to the following: a traditionally strong current account, a manageable public debt (now 47% of GDP), and a relatively low holding of bonds by foreign investors (now 12% of total). A robust current account surplus for years meant that during periods of negative growth shocks, the baht often fell less than many other EM currencies — that is, in periods of distress, the baht helped boost the relative performance of Thai bonds vis-à-vis overall EM bonds in US dollar terms. Those periods of distress also saw Thai bond yields fall as the central bank was able to cut rates due to low inflation. In addition, during those periods, local investors moved from equities to government bonds. Since the holdings of local bond investors far outweighed those of foreign investors, Thai bond yields managed to go down, even when some foreign investors dumped EM and Thai domestic bonds. As a result of these factors, Thai bonds outperformed their EM counterparts during the commodity/EM slowdown in 2014-15, and again at the height of the COVID-19-scare in early 2020 — even though the baht fell versus the US dollar during those periods (Chart 19, middle panel). All that said, the reality in the ground has changed somewhat since early last year. The Thai current account is no longer in surplus, and, given the dismal tourism outlook and slowing trade surplus, it will probably stay that way for the foreseeable future. That will keep the baht relatively weak weighing on Thai bonds’ relative performance versus their EM peers. On the other hand, the grim outlook of the Thai economy and looming deflation risk means that Thai bond yields could fall going forward relative to their EM counterparts. That will be a tailwind for Thai domestic bonds’ relative outperformance versus their EM counterparts. There is, therefore, a good chance that the headwind from a relatively weaker baht could be somewhat compensated for by a drop in Thai local yields versus their EM peers. Indeed, the periods of the baht’s weakness usually coincided with Thai bonds’ relative yield compression (Chart 19, bottom panel). This calls for a neutral outlook for relative bond performance going forward. Investment Conclusions Currency: The baht outlook remains precarious. Investors would do well to remain short the baht versus the US dollar. Domestic Bonds: Thai bond yields will go down. The Bank of Thailand will have no choice but to cut rates further. Local investors should stay long bonds. For international dedicated EM fixed-income portfolios, we downgraded Thai bonds in February of this year, from overweight to neutral in an EM bond portfolio, in view of the impending baht weakness. That turned out to be a good decision. Going forward, investors should continue to have a neutral allocation on Thai bonds, as the headwind from the baht will be mitigated by the tailwind from relative bond yield compression. Foreign absolute-return investors, however, should avoid Thai bonds in view of expected currency depreciation. Chart 20A Vulnerable Baht Will Keep Foreign Equity Investors Away
Thailand: Stay Short The Baht
Thailand: Stay Short The Baht
Stocks: A struggling economy offers little hope for corporate margins or profits recovery soon. A vulnerable currency makes Thai stocks even less appealing to foreign investors. Without their participation, it will be hard for this market to rise sustainably in absolute terms or outperform their EM counterparts (Chart 20). Thai equities are not cheap either: the P/Book ratio is at par with EM. That said, given the Thai market’s already very steep underperformance versus the EM equity benchmark, from a portfolio strategy point of view, we recommend investors stay neutral this market within an EM equity portfolio. Rajeeb Pramanik Senior EM Strategist rajeeb.pramanik@bcaresearch.com Footnotes 1 Please refer to the EMS report “Thailand: Beset By A Vulnerable Baht,” dated February 24, 2021. 2 The budget bill has to pass the second and third readings expected in August before it goes for senate and royal approval.
According to BCA Research’s China Investment Strategy & Global Asset Allocation services, adding a simple 50-50 Chinese stock-bond portfolio may boost the return/risk profile of global multi-asset portfolios. Chinese onshore stocks on their own are not…
Dear Client, This week we are sending you a joint Special Report written by my colleagues Xiaoli Tang, Associate Vice President at BCA Research’s Global Asset Allocation, and Qingyun Xu, Associate Editor at China Investment Strategy. In the Special Report Xiaoli and Qing investigate the impact on global portfolios when adding onshore Chinese assets. Their findings confirm our view that Chinese onshore equities have not been a good long-term, buy-and-hold asset for global equity investors due to extremely high volatility. However, they conclude that to improve both the absolute and risk-adjusted returns of the onshore equity market, investors can apply an equal-weighted, five-factor smart-beta strategy or active sector/industry allocation strategies. More importantly, they find that both hedged and unhedged Chinese onshore bonds are excellent risk diversifiers for DM bond investors, and Chinese onshore bonds are also a good risk-diversifier and complementary to Chinese equity-centric portfolios. I trust you will find it insightful. Next week the China Investment Strategy team will take our second of the two-week summer break. We will resume our publication on Wednesday, September 1st. Best regards, Jing Sima, China Strategist Highlights Global investors have become increasingly interested in Chinese onshore equities and bonds as part of their multi-asset portfolios as Chinese onshore equities and bonds have been included in major global stock and bond indexes. In this report, we investigate the impact on global portfolios when adding onshore Chinese assets. Three assets (stocks, bonds and stock-bond combinations) and six home currencies (the USD, JPY, EUR, GBP, CAD and AUD) are included in our portfolio analysis. Chinese onshore equities have not been a good long-term, buy-and-hold asset for global equity investors due to extremely high volatility. To improve both the absolute and risk-adjusted returns of the onshore equity market, however, investors can apply an equal-weighted, five-factor smart-beta strategy or active sector/industry allocation strategies. Hedged Chinese onshore bonds are excellent risk diversifiers for DM bond investors, but higher absolute and risk-adjusted returns may be derived from unhedged bonds, thanks to the positive carry and negative correlation between the onshore Chinese bond index and CNY crosses. Chinese onshore bonds are also a good risk-diversifier and complementary to Chinese equity-centric portfolios, given the negative correlation between the performance of Chinese bonds and equities. Adding a stand-alone Chinese portfolio with equally weighted onshore bonds and equities to a typical 70-30 domestic equity-bond portfolio would significantly improve a non-USD investor’s risk-adjusted return. Global investors may access China’s onshore equity and bond markets through Stock Connect(s), Bond Connect and CIBM Direct. Risk management tools are also available via both onshore and offshore instruments. Feature In the past three decades, China’s financial markets have become the second largest in the world both in terms of equity capitalization and bonds outstanding. Pro-market financial reforms have made the onshore markets increasingly accessible to foreign investors (Appendix 1). As China’s domestic equities and bonds are gradually added to major global equity and bond indexes, the onshore markets have become too sizeable to be ignored by global investors. Chart 1China A Onshore Shares: Highly Volatile Driven By Policy Swings
China A Onshore Shares: A Poor Long-Term Asset
China A Onshore Shares: A Poor Long-Term Asset
Gyrations in China’s equity market in July in response to regulatory changes imposed on various industries (internet, property, education, healthcare and capital markets), however, should be a reminder that volatility in this market is an ever-present aspect. The instability is driven by China’s profound cyclicality in credit, money and macroeconomic policies (Chart 1). Moreover, the unpredictability is exacerbated by periods of geopolitical tensions and domestic political events. We focus on the portfolio impact of adding onshore equities and bonds to global investors’ domestic portfolios with six different home currencies: the USD, euro (EUR), Japanese yen (JPY), British pound (GBP), Australian dollar (AUD) and Canadian dollar (CAD). We also address how to access the onshore markets and what risk management tools are available. Many global investors already have a significant home bias in their portfolios, therefore this report will look at replacing part of a domestic portfolio with Chinese onshore assets. Part 1. Are Chinese Onshore Equities A Good Alternative For Global Equity Investors? 1.1: Chinese Equities Have A Poor Long-Term Return-Risk Profile Chart I-1How Does China A Compare With Global Equities
Can Global Investors Afford To Ignore China’s Onshore Markets?
Can Global Investors Afford To Ignore China’s Onshore Markets?
The extremely volatile nature of the MSCI China A onshore equity index (referred to as ‘China A’ in this report) is not a recent phenomenon. Although the volatility in China A has moderated since 2015, the stocks in the index remain highly cyclical and closely correlated with China’s credit growth. China A has gone through two full boom-bust cycles since December 2000 and the third up-cycle started in 2019 is being challenged, as shown in Chart I-1 panel 1. On a rolling three-year basis, China A’s volatility has steadily declined since its peak in early 2015 and is currently comparable to other markets. Meanwhile, its correlation with the rest of the world has steadily risen, standing at around 60% with major equity markets (Chart I-1, bottom 3 panels). The change in correlation with global equity markets could be linked to the launch of the Shanghai Stock Connect and Shenzhen Stock Connect as well as a more market-based RMB exchange rate in the past six years. Compared with domestic equities for investors in the US, euro area, Japan, UK, Canada and Australia, however, China’s A-shares’ unhedged return-risk profile did not become more attractive after the launch of the Shanghai Stock Connect. As illustrated in Table 1, China A’s underperformance has spanned the entire upcycle in global equities starting in March 2009. It was only in the early years following China’s entrance into the WTO in 2001 that China A-shares performed better than their peers in Japan and the euro area. Table 1Return-Risk Profiles: China A Onshore Index vs Global Equity Indexes and CNY Crosses
Can Global Investors Afford To Ignore China’s Onshore Markets?
Can Global Investors Afford To Ignore China’s Onshore Markets?
USD/CNY exchange rate volatility has increased since the 2015 de-pegging from the US dollar, but remains at very low level compared with other CNY crosses. The People’s Bank of China (PBoC) primarily manages the RMB against the dollar by targeting a daily USD/CNY fixing rate, while allowing market forces to drive the RMB value against a basket of currencies in the China Foreign Exchange Trade System (CFETS) index. Chart I-2Correlations Between China A And DM Currencies
Can Global Investors Afford To Ignore China’s Onshore Markets?
Can Global Investors Afford To Ignore China’s Onshore Markets?
Interestingly, even though CNY crosses with the euro, GBP, JPY, AUD and CAD have much higher volatility, the volatility in unhedged China A-shares in each of those currencies is similar to or lower than that in USD. For example, from December 2014 to July 2021, AUD/CNY had an annualized volatility of 8.8%, much higher than the 4.5% of the USD/CNY, yet the unhedged China A-share's volatility in AUD was 21%, lower than the 24% in USD. The reason lies in correlation, as shown Chart I-2. While China A-shares in CNY have a positive correlation with USD/CNY and JPY/CNY (i.e. China A-share prices tend to rise when China’s currency appreciates against the US dollar and Japanese yen), they have falling and negative correlations with the other four currencies. For equity investors in the US and Japan, exposure to the CNY would increase potential volatility to their home-currency portfolios, but the opposite would be true for investors in the euro area, the UK, Australia and Canada. In addition, Chinese onshore equity correlations with DM equities and EM-ex China equities were low, but have increased since 2015, making onshore shares less attractive for global equity investors looking to diversify. Bottom Line: Chinese onshore shares are a poor long-term asset for global equity investors. 1.2: Factor Strategies Work Well In The Onshore Market Despite Chinese equities’ poor long-term performance, applying a factor strategy to Chinese onshore stocks can create impressive results. In a GAA Special Report on smart-beta strategies for MSCI DM and EM markets, we concluded that a simple, equally weighted five-factor strategy would smooth out the cyclicality of individual factors and outperform the broad market. These five factors are value, equal weight (i.e. size), quality, momentum and minimum volatility, as defined and calculated by MSCI (see Box 1). When we apply the same methodology to the MSCI China A onshore market, the result is even more impressive as shown in Chart I-3. Box 1MSCI Factor Indices
Can Global Investors Afford To Ignore China’s Onshore Markets?
Can Global Investors Afford To Ignore China’s Onshore Markets?
Chart I-3Factor Performance: China A Vs Global
Can Global Investors Afford To Ignore China’s Onshore Markets?
Can Global Investors Afford To Ignore China’s Onshore Markets?
Since December 2004, the value and small cap factors have outperformed the broad benchmark by about 11% and 47%, respectively, in the China A universe, despite sharp corrections since December 2016 for small cap and Oct 2018 for value. In contrast, in the global universe, value and small cap have underperformed the global benchmark by 24% and 7%, respectively, in the same time frame (Chart I-3, panels 2 and 6.) This confirms anecdotal evidence that the onshore equity market was less efficient than its global peer, although efficiency has improved. Momentum is a consistent factor for global markets. A GAA Special Report on momentum strategy shows that momentum works better in markets with higher individuality where self-attribution and self-confidence are more pervasive, according to Hofstede’s Cultural Dimension theory. This behavioral aspect is confirmed by the performance of momentum in China’s onshore market: in the early years, momentum did not work well, but strengthened after both Shanghai and Shenzhen shares were accessible to foreign investors via the two Stock Connects and mainland institutional investors became more prevalent (Chart I-3, panel 4) Quality is the most consistent factor for global markets because investors reward companies with solid fundamentals. As shown in (Chart I-3, panel 3), this factor has worked even better in the China A market than in the global universe. The fact that good fundamentals have generated superior equity return repels the “myth” that the China A market is a “casino” driven by individual investors, who totally ignore company fundamentals. The minimum volatility factor works in a similar fashion in the onshore Chinese market as in the global markets. Chart I-4Onshore Equity Market Can Be Improved By Smart-Beta Strategies
Can Global Investors Afford To Ignore China’s Onshore Markets?
Can Global Investors Afford To Ignore China’s Onshore Markets?
Factor timing can hardly generate consistent outperformance. BCA’s GAA team advocates equally weighting the five time-tested factors for the MSCI global universe. This approach also applies to China’s onshore market (Chart I-3, panel 1). Since all the factor indexes became available in August 2013, the equally weighted, five-factor portfolio has outperformed the benchmark by about 20% in total with similar volatility. On a rolling one- and three-year basis, this strategy also performs better than the benchmark (Chart I-4). Some investors may prefer a more active and quantitative approach; they should refer to CIS’s Special Report on factor investing in the A-share market. The CIS report recommends that global investors should opt for industry groups with above-median return on equity (ROE) and below-median ex-post beta when investing in the onshore market. ROE is a quality factor in MSCI (see Box 1 above) and below-median beta is a variation of low volatility. Bottom Line: Factor strategies can improve the return and risk profiles of China’s onshore equity market. Part 2. Chinese Onshore Bonds Chinese onshore bonds have attracted global investors because they offer much higher yields than DM government bonds (Chart II-1). At the same time, as shown in Chart II-2, Chinese onshore bond yields have low to negative correlations with major government bond yields. Thus, the onshore bonds offer potential risk diversification for global bond portfolios. Chart II-1Chinese Bonds Offer Higher Yields
Can Global Investors Afford To Ignore China’s Onshore Markets?
Can Global Investors Afford To Ignore China’s Onshore Markets?
Chart II-2Chinese Yields Have Low Correlation With DM Bond Yields
Can Global Investors Afford To Ignore China’s Onshore Markets?
Can Global Investors Afford To Ignore China’s Onshore Markets?
For foreign DM government bonds, the conventional wisdom is to hedge foreign currency exposure because currency fluctuations outweigh bond volatility. A GAA Special Report shows that hedged foreign bonds have favorable return-risk profiles compared with domestic bonds in major DM countries. For EM local currency debt (based on the JP Morgan GBI-EM Global Diversified Local Currency Debt Index), USD investors should hedge their EM FX exposure while non-USD DM investors should not hedge. However, non-USD investors should avoid EM local currency debt if their objective is to maximize risk-adjusted return on the long-term horizon. Do Chinese bonds share the same traits as the EM aggregate? Our analysis suggests that Chinese bonds have historically provided better risk-adjusted returns to USD-based bond investors, hedged and unhedged. Thus, allocating a portion of the US Treasury portfolio to Chinese onshore bonds would improve a US bond portfolio’s return-risk profile. The Bloomberg Barclays (BB) China Treasury and Policy Bank Bond Index is used for the analysis. The index has a history starting in January 2004, even though it was included in BB's three flagship bond indexes only in April 2019. On a hedged basis, Chinese onshore bonds deliver similar returns to global bonds as shown in Chart II-3. This is not surprising because interest-rate parity implies that the expected return on domestic assets equals the exchange-rate adjusted return on foreign currency assets, given foreign exchange market equilibrium. Unhedged returns, however, have outperformed both local and foreign government bonds for bond investors in the US, Japan, UK and the euro area since 2004 (Chart II-4). Carry was negative for USD-, GBP- and euro-based investors before the Global Financial Crisis, but has become positive since that time. The CNY has appreciated in general, albeit with greater movement against the non-USD crosses. Chart II-3Chinese Bond Performance In A Global Context
Can Global Investors Afford To Ignore China’s Onshore Markets?
Can Global Investors Afford To Ignore China’s Onshore Markets?
Chart II-4Carry And Spot CNY Exchange Rate
Can Global Investors Afford To Ignore China’s Onshore Markets?
Can Global Investors Afford To Ignore China’s Onshore Markets?
Unhedged Chinese bonds have much higher absolute returns and also much higher volatility when compared with hedged bonds. How do Chinese onshore bonds fare on a risk-adjusted return basis? Table 2 compares the risk-return profiles of hedged and unhedged Chinese bonds with local and hedged foreign DM bonds in two periods: one from January 2004 and the other from July 2017 when the Bond Connect was launched. Table 2Return-Risk Profiles: Chinese Onshore Bond Index Vs DM Local Bond Indexes
Can Global Investors Afford To Ignore China’s Onshore Markets?
Can Global Investors Afford To Ignore China’s Onshore Markets?
Several observations from Table 2: In local currency terms, Chinese bonds have the best risk-adjusted return and the second lowest volatility – only higher than Japanese government bonds (JGBs) – both from January 2004 and from July 2017. Since the start of Bond Connect, the risk-adjusted return of Chinese bonds in CNY has strengthened significantly with higher return and lower volatility. In contrast, there has been a deterioration in DM local bonds and their corresponding hedged foreign government bonds’ return/risk profiles. In the past four years, Chinese bonds have outperformed all DM local bonds when unhedged, both in terms of absolute return and risk-adjusted return. When compared with a hedged foreign government bond, however, the absolute return advantage has been offset by much higher FX volatility. Still, euro- and JPY-based bond investors enjoy higher risk-adjusted returns from unhedged Chinese bonds than their respective hedged foreign DM government bonds. However, GBP-based investors would be better off with hedged non-UK government bonds. For USD-based bond investors, unhedged Chinese bonds would only be slightly inferior to hedged non-US government bonds. On a hedged basis, Chinese bonds have lower returns and less volatility than local bonds (with the exception of Japan), but they have higher risk-adjusted returns than local bonds in all but the euro area. When compared with hedged foreign bonds, euro- and USD-based investors would do slightly better with the Chinese bonds while JPY- and GBP-based investors would earn slightly more with other DM government bonds. How much should a bond investor replace local bonds with Chinese ones? For illustration, Chart II-5 plots the efficient frontiers for bond investors in the US, euro area, Japan and the UK when hedged Chinese bonds are added to their respective domestic bond portfolios. This addition would reduce portfolio volatility for all domestic bond portfolios, regardless of time frame. This is especially impressive for JGB investors because JGBs already have the lowest volatility among DM bonds. Moreover, returns would be improved for USD- and JPY-based investors when Chinese bonds are gradually included in domestic bond portfolios up to the risk-minimizing point. Chart II-5Adding Hedged Chinese Bonds Reduces Volatility For All DM Domestic Bond Portfolios*
Can Global Investors Afford To Ignore China’s Onshore Markets?
Can Global Investors Afford To Ignore China’s Onshore Markets?
For GBP- and euro-based investors, however, adding hedged Chinese bonds would reduce absolute returns, but significantly improve risk-adjusted returns for GBP-based bond investors. Interestingly, even though euro zone local bonds have had superior risk-adjusted returns to hedged Chinese bonds since 2017, their risk-adjusted returns would still increase by about 18% when 50% of their local-bond portfolio is allocated to Chinese bonds. What is more striking is how unhedged Chinese bonds impact the return/risk profiles of global investors’ domestic bond portfolios. Unlike DM foreign bonds, which have inferior risk-adjusted returns when foreign currency exposure is not hedged, unhedged Chinese onshore bonds actually enhance a domestic bond investor’s absolute and risk-adjusted returns, as shown in Chart II-6. This is because of Chinese bonds’ superior risk-adjusted return measured in CNY (Table 2), negative correlations with CNY crosses (Chart II-7) and low to negative correlations with DM government bonds (Chart II-2). Chart II-6Adding Unhedged Chinese Bonds Enhances Absolute and Risk-Adjusted Returns For All DM Domestic Bond Portfolios*
Can Global Investors Afford To Ignore China’s Onshore Markets?
Can Global Investors Afford To Ignore China’s Onshore Markets?
For US bond investors who seek to maximize risk-adjusted return, the domestic Treasury portfolio would be improved significantly if about 40-50% of their holding were allocated to unhedged Chinese bonds. In comparison, the ratios would be lower for bond investors in the euro area, Japan and the UK. The key message is that global investors do not need to hedge the RMB exposure when investing in the Chinese onshore bond market. Chart II-7Chinese Bond Correlation With DM Currencies
Can Global Investors Afford To Ignore China’s Onshore Markets?
Can Global Investors Afford To Ignore China’s Onshore Markets?
Chart II-8Chinese Yuan Still Has Upside Potential
Can Global Investors Afford To Ignore China’s Onshore Markets?
Can Global Investors Afford To Ignore China’s Onshore Markets?
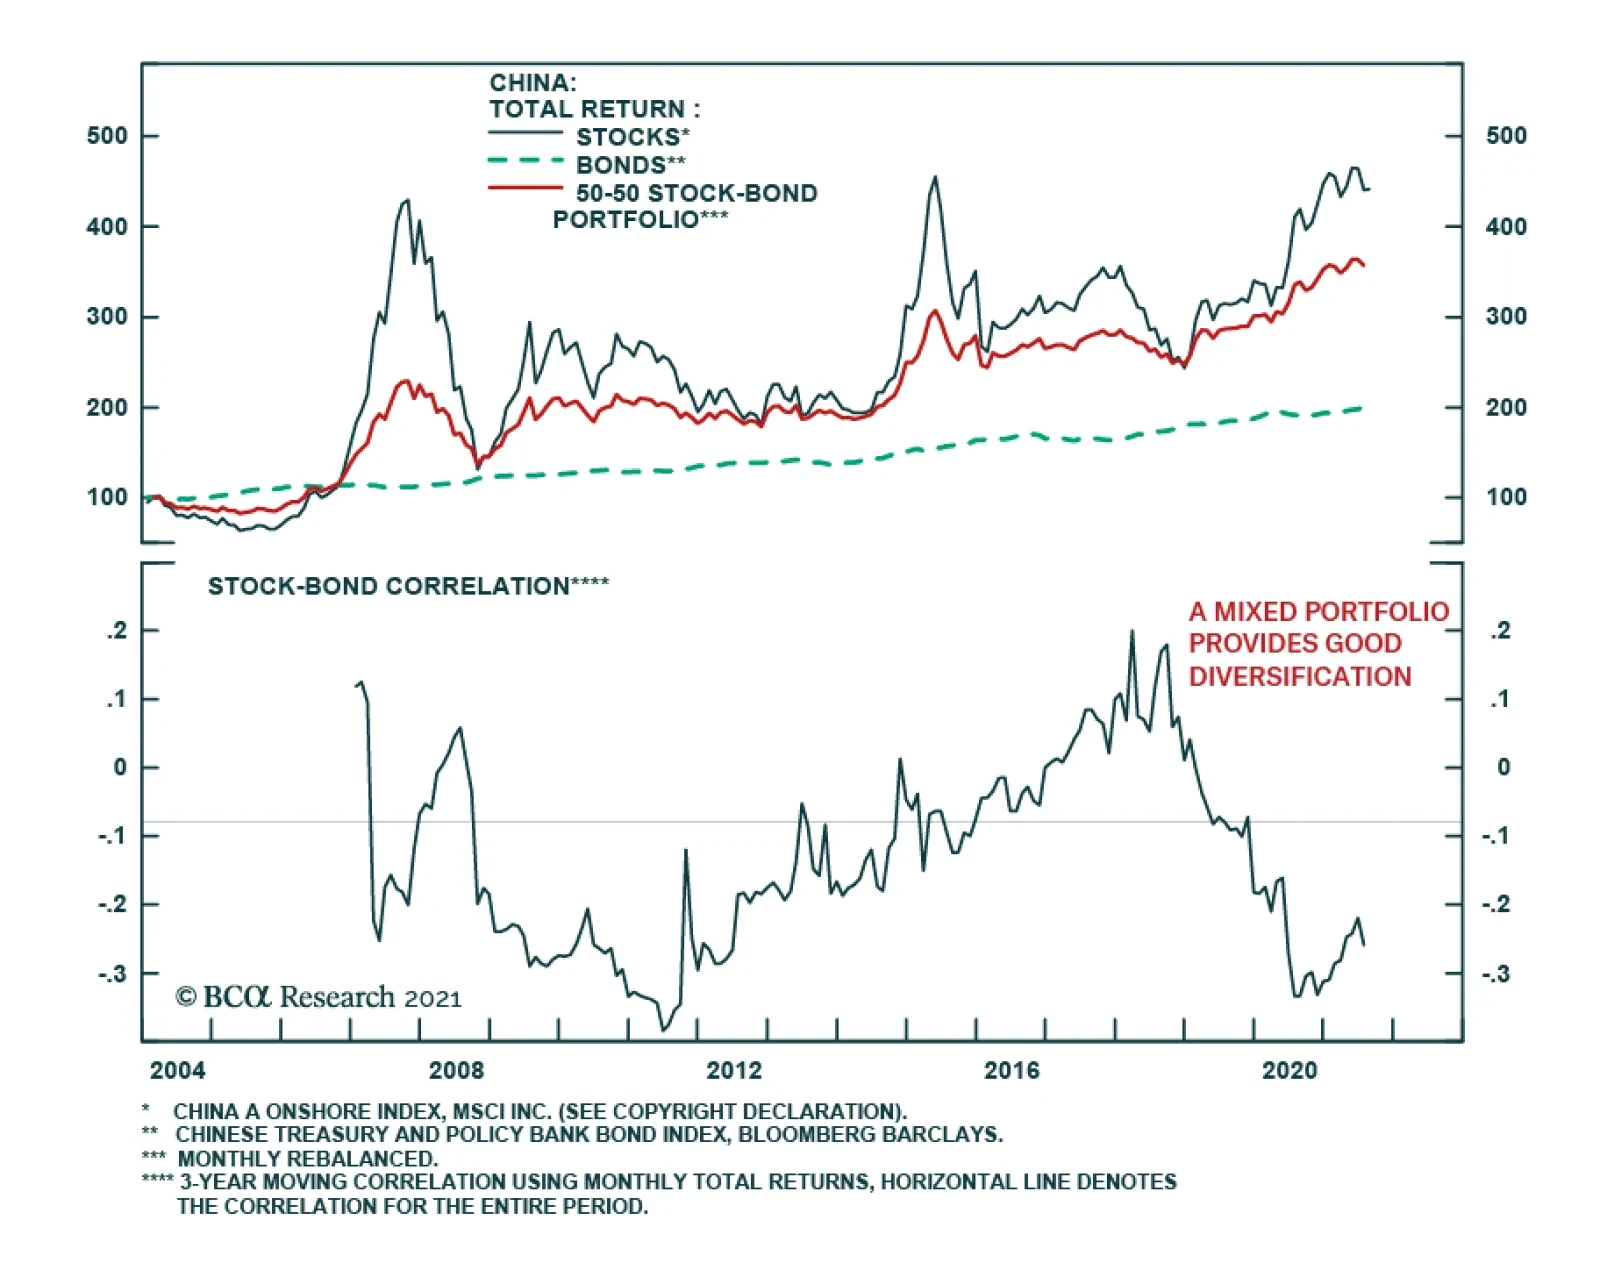
We still have a favorable cyclical outlook for the CNY against the US dollar, supporting the case not to hedge the currency. The CNY is at about one standard deviation below fair value even though the gap has been narrowing since mid-2020 (Chart II-8). We expect the CNY to keep appreciating in the coming years barring major disruptive geopolitical/political events. China’s relatively strong productivity growth should continue to support the currency’s rising fair value. On a cyclical basis, given that the US Fed is firmly staying behind the curve (capping the upside in real bond yields in the US), the differential in real interest rates between China and other major economies should remain favorable for the RMB. Bottom line: In a search-for-yield environment, the return-risk profiles of dedicated DM government bond portfolios may be enhanced by adding some exposure to Chinese onshore bonds on an unhedged basis. Part 3. Chinese Onshore Assets For Global Multi-Asset Portfolios Chinese onshore stocks on their own are not suitable for long-term, buy-and-hold strategic investments due to extremely high volatility, and the positive and rising correlation with global stocks and with CNY crosses. Chinese bonds, on the other hand, have an attractive risk-return profile with very low volatility, low correlation with global bonds, and negative correlation with CNY crosses. The negative correlation between Chinese stocks and bonds means that a mixed portfolio of the two assets would provide good diversification (Chart III-1). Chart III-1Chinese Onshore Assets
Can Global Investors Afford To Ignore China’s Onshore Markets?
Can Global Investors Afford To Ignore China’s Onshore Markets?
Chart III-2Chinese Multi-Asset Portfolio Correlation With Global Multi-Asset Portfolios
Can Global Investors Afford To Ignore China’s Onshore Markets?
Can Global Investors Afford To Ignore China’s Onshore Markets?
Investors may have different stock-bond allocations based on their return-risk objectives and constraints. For illustration, we constructed a stand-alone Chinese multi-asset portfolio by equally weighting onshore stocks and bonds. The correlations of this portfolio with six DM domestic 70-30 stock-bond portfolios have varied over time and by different countries, as shown in Chart III-2. Our Chinese-asset portfolio has a relatively high correlation with US and Japanese assets, but a low correlation with European assets, and almost no correlation with Australian and Canadian assets. Accordingly, the diversification effects are much stronger for GBP-, euro-, AUD- and CAD-based investors than for USD- and JPY-based investors, as shown in Chart III-3. Chart III-3Chinese Multi-Asset Portfolio Should Be Treated As A Standalone Asset By Non-US Asset Allocators
Can Global Investors Afford To Ignore China’s Onshore Markets?
Can Global Investors Afford To Ignore China’s Onshore Markets?
Chart III-3 shows how the risk-return profile of a standard 70-30 stock-bond portfolio in the US, UK, Japan, euro area, Australia and Canada may be improved by adding some exposure to a 50-50 Chinese stock-bond portfolio. Even though this equally weighted Chinese onshore asset portfolio has unimpressive returns, when added to a domestic stock-bond portfolio there is an improvement in the return-risk profile of all non-USD-based portfolios. The optimal allocation to the stand-alone Chinese onshore portfolio varies with different home currencies, objectives and time periods, as shown in Table 3. Table 3Chinese Assets Improve Global Multi-Asset Portolios' Return-Risk Profiles
Can Global Investors Afford To Ignore China’s Onshore Markets?
Can Global Investors Afford To Ignore China’s Onshore Markets?
Bottom Line: Unhedged Chinese onshore stocks and bonds may be treated as a stand-alone asset for global asset allocators, especially non-US ones. Adding a simple 50-50 Chinese stock-bond portfolio may boost the return/risk profile of global multi-asset portfolios. Part 4. Operational Q&A Many foreign investors believe that China’s onshore markets are hard to access. However, regulatory changes in the past 10 years, partially since Stock Connect was launched in 2014, have made it simpler from an operational point-of-view to buy and sell Chinese onshore equities and bonds. Below we answer some questions that international investors may have about market access. Q: Are there any access or quota restrictions for offshore investors to invest in China A-shares via Stock Connect? Historically, access to China’s mainland equity market by offshore investors was restricted through investment quotas and local currency controls. Since 2014, with the launch of Stock Connect, offshore investors no longer have access or repatriation restrictions. Stock Connect allows offshore investors to trade selected A-share stocks listed on the Shanghai (SSE) and Shenzhen (SZSE) Stock Exchanges through offshore brokers. Although not all A-shares listed on the SSE or SZSE can be invested in through Stock Connect, eligible stocks include almost all large- and medium-cap A-shares.1 Note that the Shanghai-Hong Kong (SH-HK) Stock Connect and the Shenzhen-Hong Kong (SZ-HK) Stock Connect complement each other, but they have a dual-channel, independent operation mechanism with two distinct Connect operations. Therefore, their shares cannot be cross-traded. Q: How to purchase China’s A-Shares via Stock Connect? Offshore investors need a Hong Kong or international broker (see MMA <GO> on Bloomberg for a list of Offshore brokers for Stock Connect northbound trading), through whom they buy A-shares. Brokers instruct Hong Kong Exchange’s (HKEX) participants to conduct northbound trades on the SSE or SZSE. Hong Kong Exchange’s subsidiary (a SSE or SZSE participant) also takes instructions to conduct trades on the SSE or SZSE stock exchanges. Clearing and settlement services of A-shares executed through Stock Connect are provided by the Hong Kong Securities Clearing Company (HKSCC), a solely-owned subsidiary of the HKEX, through clearing links established with the China Securities Depository and Clearing Corporation Limited (ChinaClear). The shares of offshore investors are held in an onshore omnibus securities account registered under the HKSCC. Q: Is margin trading or short selling allowed for Stock Connect northbound trading stocks? Yes, most eligible Stock Connect northbound trading A-shares are permitted for margin trading or short selling. Nowadays, more than 80% of the total eligible Stock Connect northbound trading stocks in the SSE and more than 70% of that in the SZSE are permitted for margin trading and short selling. HKEX provides a list of eligible equities for margin trading and short selling in a timely manner.2 Q: Are there other ways to tactically manage exposure to China’s A-shares? There are offshore ETFs that investors can use to hedge their exposure to Chinese equities (Table 4). For example, Direxion Daily CSI 300 China A Share Bear 1X ETF listed on the New York Stock Exchange (NYEX) provides 100% of the inverse exposure of the performance for the CSI 300 index. This ETF may be used to hedge offshore investors’ exposure to domestic China A- shares. Table 4ETFs That Can Be Used To Hedge Investors’ Exposure To Chinese Equities
Can Global Investors Afford To Ignore China’s Onshore Markets?
Can Global Investors Afford To Ignore China’s Onshore Markets?
Q: Describe the main differences between Bond Connect and CIBM Direct. How do overseas investors hedge their currency exposure when investing in China’s onshore bond market? Bond Connect and China Interbank Bond Market (CIBM) Direct are the official channels for offshore investors to invest in China's onshore bond market except for Qualified Foreign Institutional Investors (QFII) and RMB Qualified Foreign Institutional Investors (RQFII). Around 680 foreign institutional investors have entered China’s interbank bond market since Bond Connect’s launch in July 2017.3 Here are some differences between CIBM Direct and Bond Connect: Bond Connect is based offshore, which gives overseas investors easy and quota-free access to China’s onshore interbank bond market through offshore trade platforms. Bond Connect permits investors to open accounts, trade, and settle transactions in the offshore market whereas CIBM Direct stipulates the process must be completed in the onshore market. CIBM Direct offers greater access to opportunities in the onshore market because it has access to a wider range of products and hedge tools, such as repos, interest rate swaps, bond lending and bond forwards. In comparison, the only Bond Connect products are bonds traded in China’s inter-bank bond market, and hedge tools are limited. In terms of currency hedging, both CIBM Direct and Bond Connect allow FX hedge tools such as forwards, swaps and options to help investors hedge their exposure to CNY (Chinese yuan traded in the onshore market). CIBM Direct trades in CNY rather than CNH (CNH is Chinese yuan traded in the offshore market) and allows investors to hold onshore balances in CNY. Bond Connect, however, does not allow investors to hold CNY balances. Under Bond Connect, investors are required to exchange CNY into CNH for any excess cash from trading or coupon payments, which can be a currency risk when funds are repatriated. However, offshore investors can hedge their FX exposure with FX Settlement Banks by engaging in various FX trades and FX hedge tools that match their bond position. FX Settlement Banks are banks in Hong Kong approved by the China Foreign Exchange Trade System (CFETS) to access the FX market of CIBM as RMB participation banks. Offshore FX Settlement Banks may square positions in either offshore or onshore FX markets. Investors should contact their Hong Kong custodians, which will appoint an FX Settlement Bank for FX conversion and hedging. Q: Is there another currency hedge mechanism for investors’ CNY exposure? CNY exposure can be hedged using the usual instruments, such as CNH-forwards or CNY-non deliverable forwards (NDF). However, the CNH-forward has CNH basis risk, which arises from the differences between CNY and CNH spot rates. Investors may consider short CNY currency ETFs listed on the offshore market, such as the WisdomTree Chinese Yuan Strategy Fund (CYB) on the NYEX. CYB offers exposure to the overnight Chinese yuan and uses both short- and long-forward currency contracts for both CNH and CNY to manage its expectations for the currency. It seeks to achieve total returns reflective of money market rates in China available to foreign investors and of changes in the value of the yuan versus the dollar. Xiaoli Tang Associate Vice President, Global Asset Allocation xiaoliT@bcaresearch.com Qingyun Xu, CFA Associate Editor, China Investment Strategy qingyunx@bcaresearch.com Appendix 1: The Evolution of The Chinese Onshore Markets China’s onshore equity and bond markets have grown dramatically in the past two decades. The equity market is the second largest in the world with more than 4,400 listed companies; the combined market capitalization of the Shanghai and Shenzhen stock exchanges has reached USD12.2 trillion (Chart A1). China’s bond market also is ranked second globally, after the US, with amounts outstanding at USD18.6 trillion (Chart A2). Chart A1China’s Stock Market Has Grown Sharply In The Past Two Decades
China's Stock Market Has Grown Sharply In The Past Two Decades
China's Stock Market Has Grown Sharply In The Past Two Decades
Chart A2China’s Onshore Bond Market Is Second Largest In World
Can Global Investors Afford To Ignore China’s Onshore Markets?
Can Global Investors Afford To Ignore China’s Onshore Markets?
Thanks to China’s financial market liberalization since the early 2000s, foreign investors can now access China's onshore stock and bond markets to include China A-shares and onshore bonds in portfolios. Various tools are available, including QFII, RQFII, Stock Connect, CIBM Direct and Bond Connect (Diagram 1). Since the launch of Stock Connect in late 2014, the cumulative net northbound flows to the Shanghai and Shenzhen exchanges have been more than RMB1.2 trillion (Chart A3, top panel). The cumulative net capital inflows through CIBM Direct and Bond Connect have reached more than RMB3.5 trillion since these mechanisms were introduced in 2016 and 2017, respectively (Chart A4, bottom panel). Diagram 1China’s Financial Market Liberalization Roadmap
Can Global Investors Afford To Ignore China’s Onshore Markets?
Can Global Investors Afford To Ignore China’s Onshore Markets?
Chart A3Net Inflows To China’s Onshore Markets Through Stock And Bond Connect
Net Inflows To China's Onshore Markets Through Stock And Bond Connect
Net Inflows To China's Onshore Markets Through Stock And Bond Connect
Chart A4Growing Foreign Holdings Of China’s Onshore Equities And Bonds
Growing Foreign Holdings Of China's Onshore Equities And Bonds
Growing Foreign Holdings Of China's Onshore Equities And Bonds
Although foreign investors’ holding of RMB-denominated assets increased significantly in recent years, their share of the total onshore market is still small, highlighting the potential for more capital inflows to China’s onshore market (Chart A4). Following the inclusion of China A-shares in global equity indexes, bond indexes have followed suit and Chinese government bonds are now offered in the world’s three major bond indices. Bloomberg Barclays Global Aggregate Index (BBGA) was the first to include Chinese government bonds in April 2019, followed by the JP Morgan Government Bond-Emerging Market Index (GBI-EM) in February 2020 and finally FTSE Russell’s World Government Bond Index (WGBI) in October 2021. Footnotes 1The list of eligible A-shares for Shanghai and Shenzhen Connect can be accessed via the HK Exchange 2List of eligible equities for margin trading and short selling 3List of approved investors under Bond Connect Market/Sector Recommendations Cyclical Investment Stance
BCA Research’s US Bond Strategists have been highlighting that employment is the single most important indicator when it comes to bond yields. They expect an acceleration in the labor market recovery to spur the next leg up in bond yields and forecast the…
BCA Research’s European Investment Strategy & Global Fixed Income Strategy services conclude that it is too early to pivot out of European credit. The teams’ new Corporate Health Monitors (CHMs) for investment grade and high-yield issuers in the euro…
Dear Client, This week, the US Bond Strategy service is hosting its Quarterly Webcast (August 17 at 10:00 AM EDT, 15:00 PM BST, 16:00 PM CEST and August 18 at 9:00 HKT, 11:00 AEST). In addition, we are sending this Quarterly Chartpack that provides a recap of our key recommendations and some charts related to those recommendations and other areas of interest for US bond investors. Please tune in to the Webcast and browse the Chartpack at your leisure, and do let us know if you have any questions or other feedback. To view the Quarterly Chartpack PDF please click here. Scheduling Note: There will be no US Bond Strategy report next week. The following week (August 31), clients will receive a report written by our Global Fixed Income Strategist Rob Robis. The regular US Bond Strategy publication schedule will resume on September 8 with the publication of September’s Portfolio Allocation Summary. Best regards, Ryan Swift, US Bond Strategist
Please note: There will be no European Investment Strategy report Monday, August 23. Our next report will be on Monday, August 30. Feature The past year has seen an unprecedented explosion of nonfinancial corporate debt as companies took on extraordinary leverage to weather the pandemic (Chart 1). This is a risk we recently highlighted in BCA Research European Investment Strategy, arguing that while euro area debt loads are not bad enough to make us turn bearish on European credit immediately, they still represent a concern for the future. Rising debt servicing costs are also a risk, with aggregate euro area nonfinancial corporate debt servicing costs, as a percentage of operating cash flows, now pulling ahead of global peers. This increase has been led by France, where debt servicing costs now eat up a whopping 73.2% of cash flows. At the same time, value has steadily disappeared from European credit markets, with investment grade (IG) and high-yield (HY) spreads nearing 2018 lows (Chart 2). Our 12-month breakeven spread metric, which measures the amount of spread widening required over a 12-month period for corporate bond returns to break even with a duration-matched position in government bond securities, confirms this message. Ranked against their own history, IG and HY breakeven spreads are now at only their 16th and 13th percentiles, respectively. Chart 1Euro Area Debt Loads Are Rising
Euro Area Debt Loads Are Rising
Euro Area Debt Loads Are Rising
Chart 2Value Has Disappeared From European Credit
Value Has Disappeared From European Credit
Value Has Disappeared From European Credit
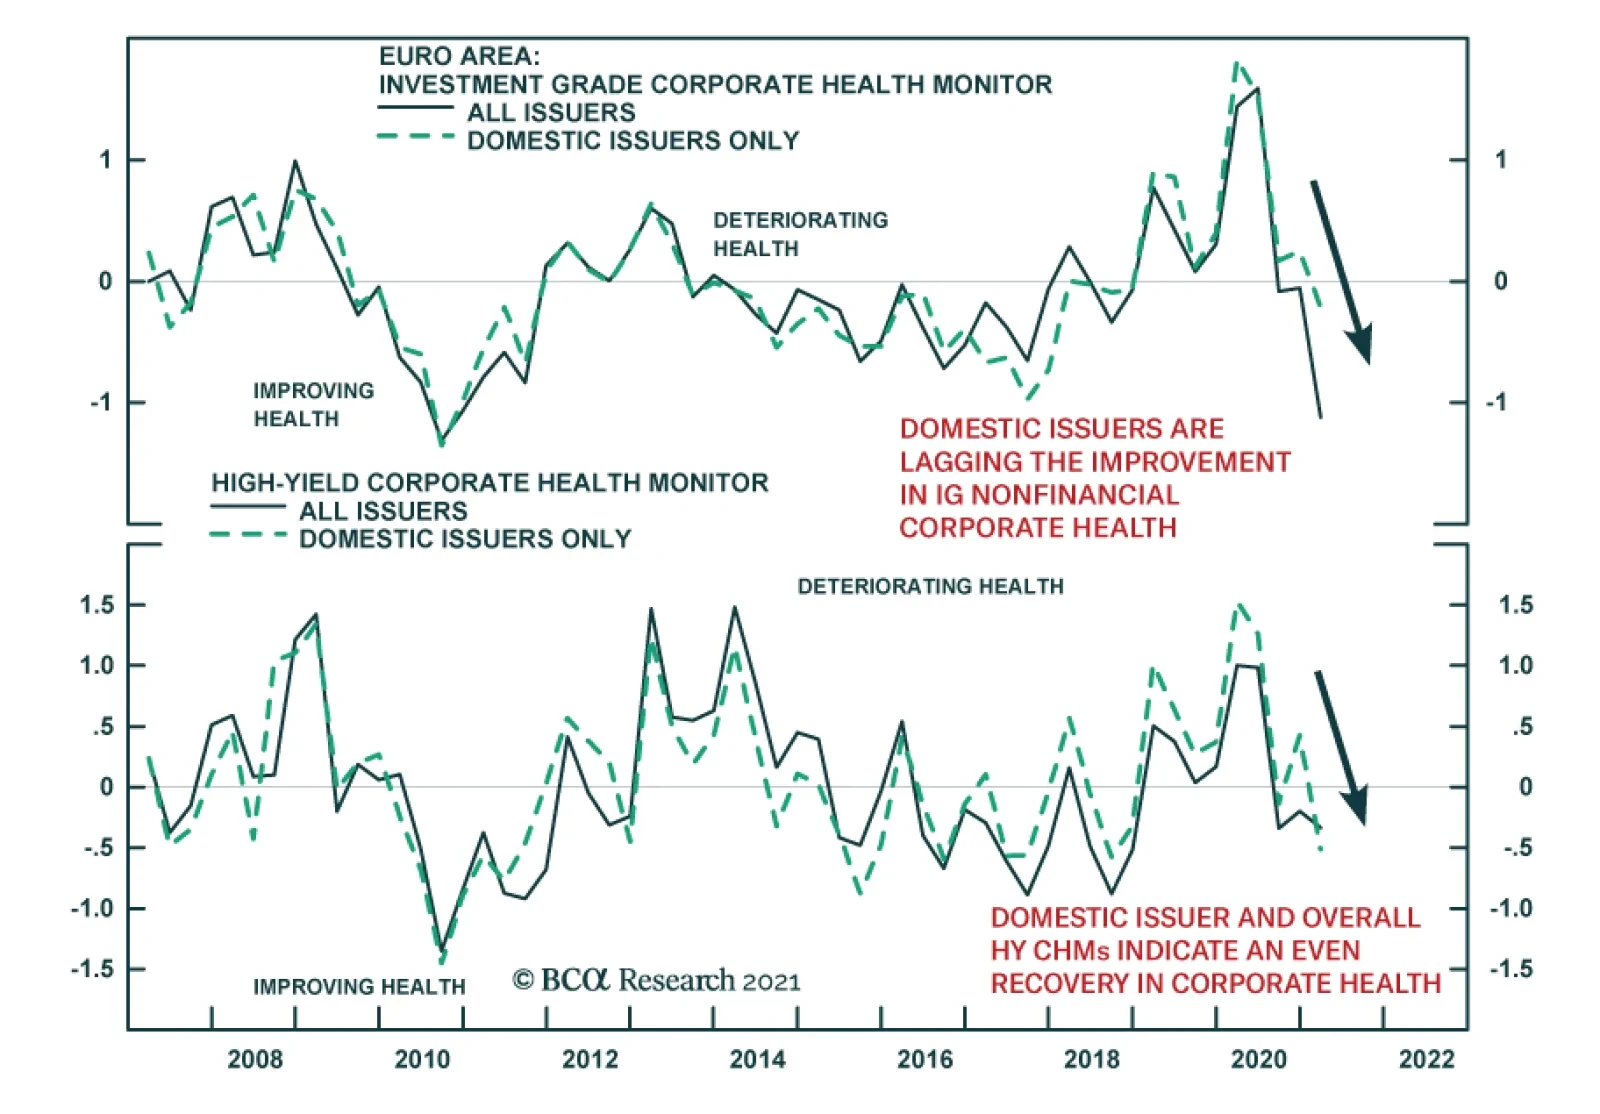
Against this backdrop, it pays to adopt a more cautious approach towards European credit. To that end, we are introducing our new and improved bottom-up Corporate Health Monitors (CHMs) for investment grade and high-yield issuers in the euro area. The CHMs are composite indicators of balance sheet and income statement ratios that are designed to assess the financial well-being of the overall non-financial corporate sectors in major developed economies. Before we jump into the message from our new European CHMs, however, it is important to review the methodology used to construct these indicators. A Quick Note On Methodology We begin by constructing a representative sample of euro area issuers to assess broader nonfinancial corporate health in the euro area. To accomplish this, we use the list of issuers from the Bloomberg Barclays IG and HY Corporate Bond Indices. Financials (mostly banks) are excluded from the calculations as they have very different balance sheet profiles, requiring a different set of metrics to properly assess the health of that sector. As an improvement of the previous euro area CHMs, we now use a dynamic sample of issuers that is updated every year. This allows us to account for the changing compositions of these indices over time, as issuers move up and down in quality, and are added or dropped from the index. This also accounts for the survivorship bias that arises as companies that go out of business are dropped from the sample. Note that our sample is static prior to 2012. Before this date, we do not have the data on index constituents needed to construct a dynamic sample. As of Q1/2021, the sample for the euro area IG CHM consists of roughly 200 issuers, covering 50% of the index, while the sample for HY consists of 50 issuers or so, covering only 25% of the index. As we can only get bottom-up data for publicly-listed companies, we are unable to include private companies that issue corporate debt but do not necessarily tap into the public equity market. We then pull key financial statement ratios for these issuers on a quarterly basis. Specifically, we use the following six ratios: Profit Margins: Operating profits as a percent of corporate sales Return On Capital: After-tax earnings plus interest expense, as a percent of capital stock Debt Coverage: After-tax cash flow less capital expenditures, as a percent of all interest bearing debt Interest Coverage: EBIT divided by value of interest expense Leverage: Total debt as a percent of market value of equity Liquidity: Total current assets excluding total inventories divided by the value of total current liabilities It is important to note that we are using the same financial ratios as the CHMs that we have previously published for other developed markets. This could prove useful later when we search for relative performance relying exclusively on CHMs. To construct the CHM, we pick the medians of the individual ratios for every quarter, which we then de-trend, by subtracting out the 12-quarter moving average, and standardize. Finally, we take an equal-weighted average of all six ratios to calculate the CHM. Using median ratios precludes excessive influence from outliers, while de-trending them introduces more cyclicality into the CHM and allows it to better capture major turning points in corporate well-being. Lastly, we calculate a version of the CHM that includes only domestic issuers, which allows us to look at the health of European nonfinancial firms in isolation. This is important, as foreign issuers make up roughly 60% of both the IG and HY samples. US issuers account for most of the foreign issuers for both samples, meaning that part of the message from our overall indicator is on US corporate health. However, we include our overall indicator for the sake of completeness. Unveiling Our New European Corporate Health Monitors Chart 3 presents the all-issuer and domestic issuer versions of our new European IG corporate health monitor. A negative indicator signals improving nonfinancial corporate health and vice versa. Both indicators have shown steady improvement since Q2/2020, with the domestic indicator peaking out in Q1/2020. However, there has recently been a notable divergence between the two, with domestic issuers recovering at a significantly slower pace. The recovery in the IG CHMs has been broad-based, with all component ratios showing an improving trend (Chart 4). However, domestic firms have clearly lagged behind, with the overall indicator especially outperforming on the return on capital, leverage, and interest coverage metrics. It is important when looking at falling leverage, however, to consider the “denominator effect” of rising share prices on equity market value. Chart 3Euro Area Investment Grade Corporate Health Monitor
Euro Area Investment Grade Corporate Health Monitor
Euro Area Investment Grade Corporate Health Monitor
Chart 4Euro Area IG CHM: Component Ratios
Euro Area IG CHM: Component Ratios
Euro Area IG CHM: Component Ratios
The HY monitor offers a more balanced picture between the domestic and all-issuer CHMs, with both indicators signaling a modest improvement in corporate health (Chart 5). This picture is confirmed by the constituent ratios, which, in the case of HY, tend to track more closely between domestic and all-issuer (Chart 6). Again, decreasing leverage contributed positively to the situation, while rebounding profits provided a strong boost to interest coverage ratios. Chart 5Euro Area High-Yield Corporate Health Monitor
Euro Area High-Yield Corporate Health Monitor
Euro Area High-Yield Corporate Health Monitor
Chart 6Euro Area HY CHM: Component Ratios
Euro Area HY CHM: Component Ratios
Euro Area HY CHM: Component Ratios
Overall, the underperformance of domestic issuers on corporate health can largely be explained by a delayed reopening in Europe and weaker overall European fiscal stimulus response relative to the US. However, we expect this picture to change in coming quarters as vaccination rates continue to climb, European stimulus expands, and pent-up demand is released. For both HY and IG, metrics such as profit margins or leverage have not yet returned to pre-Covid levels. While it may appear difficult to reconcile this with the highly optimistic readings from the CHM, we note again that the ratios are de-trended before they are incorporated into the CHM. That makes the CHM a better indicator of how corporate health is turning on the margin rather than in absolute terms. Chart 7Euro Area: CHMs Vs. Spreads
Euro Area: CHMs Vs. Spreads
Euro Area: CHMs Vs. Spreads
Our new CHMs undoubtedly provide an important signal on corporate health, but we are interested in the implication for corporate credit spreads. Chart 7 shows that the domestic issuer CHMs have been reliable at catching periods of major spread widening/tightening. Generally speaking, the year-over-year change in the CHM is a coincident indicator and can be used to confirm if movements in spreads are in line with underlying corporate fundamentals. Clearly, the recent narrowing in spreads has not kept pace with the drastic improvement in the CHM over the past two quarters. This likely reflects how close spreads are to post-crisis lows, meaning that they have little room left to fall regardless of how much corporate health improves. This asymmetry of returns, where credit has little to benefit from improving nonfinancial corporate health while remaining exposed to a deterioration, is a longer-term concern for investors. While spreads in level terms have been on a slow and steady narrowing trend this year, they are, on a rate of change basis, moving towards a more neutral level. This message will be confirmed by the CHMs in coming quarters as the monitors revert to the mean from their most recent optimistic readings. While Chart 7 displays the coincident properties of the indicators, we can also tune into the forward-looking aspect by looking at how spreads have performed historically over different time horizons given the levels of the CHMs. Table 1 presents the performance of both IG and HY spreads over the subsequent 3-12 month period when their respective CHMs were positive or negative. Table 1CHM Direction And Subsequent Spread Performance Over 3-12 Months
Introducing Our New European Corporate Health Monitors
Introducing Our New European Corporate Health Monitors
For both IG and HY, there are a few key conclusions. Firstly, when the domestic-only CHM is negative, spreads tend to widen in the subsequent 3-12 months. Conversely, they narrow, on average, when it is positive. This reflects the mean-reverting property of our indicators. After the indicator has been positive for a while, indicating deteriorating health, it is naturally going to trend back towards zero. Spreads tighten in the coming quarters as a reaction to this marginal improvement in corporate health. The same relationship holds in the opposite direction. On the whole, however, the domestic-only CHM is more reliable than the overall CHM as an indicator of whether spreads are going to widen/narrow. This discrepancy is most pronounced for HY, where the all-issuer version largely provides a misleading signal, with spreads usually continuing to narrow after the CHM is negative and widening after it is positive. One possible explanation for this is that European spreads are sensitive to European events, and since the overall CHM has a large presence of US corporate issuers, it does not properly reflect how investors should be compensated with regard to nonfinancial corporate health. Beyond just looking at the change in spreads following a positive or a negative reading on the CHMs, we can also see how spreads change when the CHMs fall into different ranges. Table 2 presents spread performance for periods when the CHM was within specific ranges: below -1, between -1 and 0, between 0 and +1, and greater than +1. This analysis makes an even stronger point on the mean reverting property of the indicator. When the CHMs reach extremely stretched positive (negative) readings, spreads tend to narrow (widen) a lot. The impact is also most pronounced over a 12-month horizon, with HY spreads narrowing, on average, a whopping 452bps twelve months after the CHM hits a level greater than +1. Table 2CHM Level And Subsequent Spread Performance Over 3-12 Months
Introducing Our New European Corporate Health Monitors
Introducing Our New European Corporate Health Monitors
Bottom Line: Our new bottom-up European CHMs have been signaling a broad-based and consistent improvement in corporate health since Q2/2020. The CHMs are coincident indicators that can be used to confirm if changes in spreads are in line with fundamentals. On a forward-looking basis, stretched positive (negative) levels of the CHM indicate potential for future spread tightening (widening). Investment Conclusions While our CHMs are currently flashing a positive message on nonfinancial corporate health, there are some reasons to be cautious on European credit. Firstly, debt loads are at historically high levels in the euro area, a message confirmed by the bottom-up data shown in Charts 4 and 6. Spreads, on an absolute and breakeven basis, are also near post-crisis lows, implying meagre prospects for further tightening and are, on the other hand, exposed to any deterioration in corporate health. Lastly, the mean-reverting property of our CHM indicates that the monitors are likely to move back towards “deteriorating” territory on the margin, a historically negative sign for spreads. However, it is hard to recommend staying out of European credit at a time when fiscal and monetary policy are overly accommodative, and growth looks poised to surprise to the upside. The European Central Bank has already marked itself as one of the most dovish developed market central banks and will likely do “whatever it takes” to prevent a blow-up in spreads and the associated tightening in financial conditions. And currently, spreads still offer a decent yield pickup over sovereigns, even if they do not have much room to tighten. Thus, balancing the positives and negatives suggests it still makes sense to hold neutral exposure to credit within a European fixed-income portfolio, but adding to this exposure is now unwarranted. In the euro area, BCA Research Global Fixed Income Strategy is currently neutral on investment grade and overweight on high-yield credit. Within high-yield, we recommend staying up in quality, favoring Ba-rated credit and avoiding lower tiers which will be hit first if corporate health deteriorates and do not offer adequate compensation for credit risk. Likewise, our European Investment Strategy recommends a selective approach, favoring sectors with more defensive risk profiles. Bottom Line: Even though there is some cause for concern on the horizon, it is too early to pivot out of European credit with the macro backdrop still accommodative. Remain neutral on euro area investment grade and overweight high-yield while avoiding riskier sectors and credit tiers within the high-yield allocation. Jeremie Peloso, Associate Editor JeremieP@bcaresearch.com Shakti Sharma, Senior Analyst ShaktiS@bcaresearch.com

Our Global Fixed Income team’s Duration Indicator suggests that slowing growth momentum will continue weighing down on government bond yields. However, major economies are likely to continue growing at an above-trend pace and central banks are starting to…
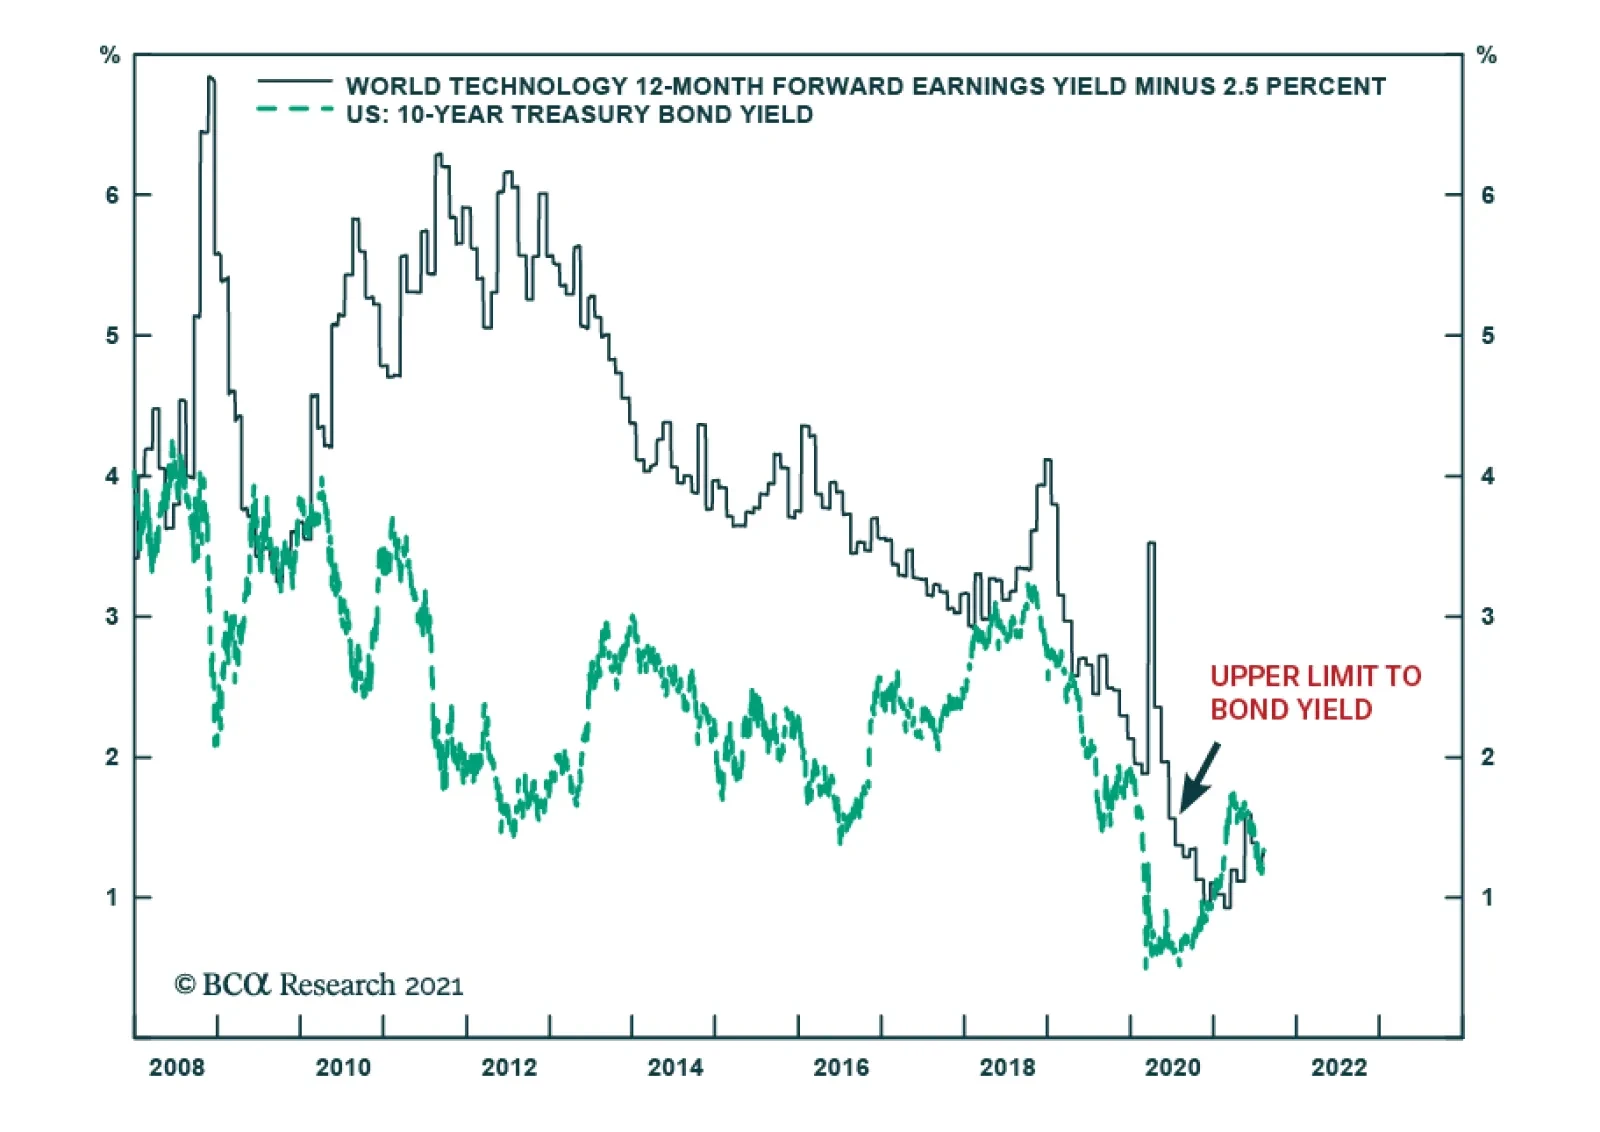
Our colleagues at BCA Research’s Counterpoint Strategy service observe that since 2008, a remarkable financial relationship has held true. The 10-year T-bond yield has struggled to exceed the earnings yield on technology stocks minus a constant of 2.5…
BCA Research’s Emerging Markets Strategy service concludes that overall the outlook for the EM GBI bond index’s total return in USD is bleak. Emerging markets can be separated into four groups: 1. The economies where inflation is rising rapidly but the…