Fixed Income

Feature This week, we present the BCA Central Bank Monitor Chartbook, detailing our set of proprietary indicators measuring the cyclical forces influencing future monetary policy decisions in developed market countries. The surging Monitors are all sending a similar message: tighter global monetary policy is necessary because of above-trend economic growth, intensifying inflation pressures and booming financial markets (Charts 1A & 1B). Chart 1ATightening Pressures …
Tightening Pressures...
Tightening Pressures...
Chart 1B… Everywhere
...Everywhere
...Everywhere
The Monitors are pointing to a continuation of the cyclical rise in global bond yields seen since mid-2020, justifying our recommended below-benchmark stance on overall duration exposure in global bond portfolios. The driver of the next leg upward in yields, however, is shifting from growth and inflation expectations to monetary policy expectations. The Fed is starting to slowly prepare markets for the next US tightening cycle, which is already putting flattening pressure on the US Treasury curve and creating more two-way risk for the US dollar over the next 6-12 months. The timing and pace of rate hikes discounted by markets varies across countries, however, creating interesting opportunities for currency pairs, via changing interest rate differentials, away from the US dollar crosses. An Overview Of The BCA Research Central Bank Monitors The BCA Research Central Bank Monitors are composite indicators that include data which have historically been correlated to changes in monetary policy. The economic data series used to construct the Monitors are not the same for every country, but the list of indicators generally measure similar things (i.e. manufacturing cycles, domestic demand strength, commodity prices, labor market conditions, financial conditions). The data series are standardized and combined to form the Monitors. We have constructed Monitors for ten developed market countries: the US, the euro area, the UK, Japan, Canada, Australia, New Zealand, Sweden, Switzerland and Norway. A rising trend for each Monitor indicates growing pressures for central banks to tighten policy, and vice versa. Within each country, we have aggregated the various data series within the Monitors into sub-groupings covering economic, inflation and financial conditions indicators (equity prices, corporate credit spreads, etc). The latter is critical as policymakers have increasingly realized the importance of financial conditions as a key transmission mechanism of monetary policy to the real economy. The weightings of each bucket vary by country, based on the strength of historical correlations of the Monitors to actual changes in policy interest rates. Disaggregating the Monitors this way offers an additional layer of analysis by helping describe central bank reaction functions (i.e. some central banks respond more strongly to economic growth, others to inflation or financial conditions). Through the nexus between growth, inflation, and market expectations of future interest rate changes, the Monitors do exhibit broad correlations to government bond yields in the major developed markets (Charts 2A & 2B). The Monitors do also exhibit steady correlations to currencies, although not in the same consistent fashion as with bond yields. For example, the Fed Monitor is typically negatively correlated to the US dollar, while the Reserve Bank of Australia (RBA) Monitor is positively correlated to the Australian dollar. We present charts showing the links between the Monitors and bond yields (and foreign exchange rates) in the individual country sections of this Chartbook. Chart 2AThe Surging CB Monitors ….
The Surging CB Monitors...
The Surging CB Monitors...
Chart 2B… Suggest More Upside For Bond Yields
...Suggesting Bond Yields Should Creep Higher
...Suggesting Bond Yields Should Creep Higher
In each edition of the Central Bank Monitor Chartbook, we include a “non-standard” chart that shows an interesting correlation between the Monitors and a financial market variable. In this latest report, we show how the relationship between the Monitors and our 24-Month Discounters, which measure that amount of rate hikes/cuts discounted in overnight index swap (OIS) forward curves over the next two years. We have also added a new Appendix Table that shows the so-called “liftoff dates” (the date when a first full rate hike is discounted in OIS curves), the cumulative amount of rate hikes expected to the end of 2024, and the valuation of each country’s currency on a purchasing power parity (PPP) basis. We’ve ranked the countries in the table by liftoff dates, thus providing a handy reference to see how markets are judging the order with which central banks will begin the next monetary policy tightening cycle. Fed Monitor: A Clear Signal Our Fed Monitor has been climbing steadily, uninterrupted, for 13 consecutive months, driven by the combination of strong US growth, sharply higher inflation and booming financial markets (Chart 3A). The message from the highly elevated level of the indicator is clear – the Fed should begin the process of unwinding the massive monetary policy accomodation put in place because of the COVID-19 pandemic. At this week’s FOMC meeting, the Fed delivered a mildly hawkish surprise by pulling forward the projected timing of “liftoff” (the first fed funds rate hike) from 2024 to 2023. The timing and pace of future Fed tapering of asset purchases and rate hikes will be determined by how rapidly the US economy approaches the Fed’s definition of “maximum employment”. We see that happening by the end of 2022, which is a bit ahead of the Fed’s own projections for the unemployment rate. The US OIS curve now discounts liftoff near the end of 2022 (see Appendix Table 1), which is now more in line with our own view that the Fed will begin tapering next January and begin rate hikes in December 20221. US economic growth momentum has likely peaked in Q2, but will remain solid in the latter half of 2021. Most of the nation has lifted the remaining pandemic restrictions on activity after a succesful vaccination program, and fiscal policy is still providing a boost to growth. The Fed’s updated economic projections call for real GDP growth to reach 7% this year, 3.4% in 2022 and 2.4% in 2023. The Fed’s assumption is trend GDP growth is still only 1.8%, thus the central bank now expects three consecutive years of above-trend growth. Unsurprisingly, the Fed is forecasting headline PCE inflation to stay above the Fed’s 2% target for all three years (Chart 3B). Chart 3AUS: Fed Monitor
US: Fed Monitor
US: Fed Monitor
Chart 3BIs This Really 'Transitory' Inflation?
Is This Really 'Transitory' Inflation?
Is This Really 'Transitory' Inflation?
The recovery in the Fed Monitor has been led primarily by the growth component, although the inflation and financial components have also risen significantly (Chart 3C). The Fed Monitor has typically been negatively correlated to the momentum of the US dollar, which has always been more of a counter-cyclical currency that weakens in good economic times. A more hawkish path for US interest rates could eventually give a sustainable lift to the greenback, but for now, the currency will be caught in a tug of war between shifting Fed expectations and robust global growth over the next 6-12 months. Chart 3CBooming Growth Supporting USD Weakness
Booming Growth Supporting USD Weakness
Booming Growth Supporting USD Weakness
We continue to recommend an underweight strategic allocation to US Treasuries within global government bond portfolios, with markets still pricing in a pace of Fed tightening that appears too conservative (Chart 3D). Chart 3DNot Enough Fed Rate Hikes Priced
Not Enough Fed Rate Hikes Priced
Not Enough Fed Rate Hikes Priced
The Fed’s mildly hawkish surprise this week generated a signficant flattening of the US Treasury curve, with the spread between 5-year and 30-year US yields narrowing by a whopping 20bps. We are closing our two recommeded yield curve trades in the BCA Research Global Fixed Income Strategy tactical trade portfolio, which were positioned more to earn near-term carry in a stable curve environment that has now changed with the Fed injecting volatility back into the bond market. BoE Monitor: More Hawkish Surprises Coming Our Bank of England (BoE) Monitor has spiked higher, fueled by a rapid recovery of UK growth alongside a pickup in inflation pressures (Chart 4A). The BoE has already responded by slowing the pace of its asset purchases in May, and we expect more tapering announcements over the next 6-12 months. The most recent set of BoE economic forecasts calls for headline UK CPI inflation to rise to 2.3% in 2022 before settling down to 2% in 2023 and 1.9% in 2024 (Chart 4B). This would be a mild inflation outcome by recent UK standards during what will certainly be a period of strong post-pandemic growth over the next 12-18 months. Longer-term inflation expectations, both survey-based and extracted from CPI swaps and inflation-linked Gilts, are priced for a bigger inflation upturn above 3%. Chart 4AUK: BoE Monitor
UK: BoE Monitor
UK: BoE Monitor
Chart 4BUpside UK Inflation Surprises Ahead?
Upside UK Inflation Surprises Ahead?
Upside UK Inflation Surprises Ahead?
The recent decision by the UK government to delay “Freedom Day”, when all remaining COVID-19 restrictions would be lifted, into July because of the spread of the Delta virus variant represents a potential near-term setback to UK growth momentum. The bigger picture, however, still points to an economy benefitting far more from the earlier success of the vaccination program. Consumer confidence remains resilient, while business confidence – and investment intentions – has taken a notable turn higher as well. The housing market has also started to heat up, with house price inflation accelerating. The backdrop still remains one of above-potential UK growth over the next 12-24 months. Within the BoE Monitor sub-components, the economic and financial elements stand out as having the biggest moves over the past year (Chart 4C). Momentum in the British pound is positively correlated to our BoE Monitor. As the central bank moves incrementally moves towards more tapering and eventual rate hikes, the currency, which remains moderately undervalued on a PPP basis (see Appendix Table 1), should be well supported. Chart 4CAll BoE Monitor Components Are Rising
All BoE Monitor Components Are Rising
All BoE Monitor Components Are Rising
The UK OIS curve currently discounts BoE liftoff in May 2023, with 57bps of cumulative rate hikes expected by the end of 2024. We see risks of the central bank moving sooner than the market on liftoff, with a rate hike in the 3rd or 4th quarter of 2022 more likely. The Gilt market is vulnerable to any hawkish shift by the BoE with so few rate hikes discounted (Chart 4D). For now, we are maintaining a neutral stance on UK Gilts, given the BoE’s history of talking hawkishly but failing to deliver, but we do have them on “downgrade watch.” Chart 4DBoE Monitor Suggests Continued Downward Pressure On Gilt Yields
BoE Monitor Suggests Continued Downward Pressure On Gilt Yields
BoE Monitor Suggests Continued Downward Pressure On Gilt Yields
ECB Monitor: Growth? Yes. Inflation? No. Our European Central Bank (ECB) Monitor has moved sharply higher as more of the euro area has emerged from pandemic restrictions (Chart 5A). Yet the central bank is not sending any of the kinds of moderately hawkish signals coming from the Fed and other central banks. The ECB is still a long way from such a move. While growth has clearly recovered strongly, the overall euro area unemployment rate remains high at 8% and wage growth remains anemic in most countries. There is the potential for upside growth surprises coming from fiscal policy, with the Next Generation EU (NGEU) funds set to be disributed by the EU later this year. Yet even with this fiscal boost, most of the euro area is likely to remain far enough away from full employment allowing the ECB to stay dovish for longer. While headine euro area inflation reached the ECB’s 2% target in May, core inflaton remained subdued at a mere 0.9% (Chart 5B). Market based measures of inflation expectations are also well below the ECB target, with the 5-year/5-year forward CPI swap rate only at 1.6%. Such “boring” inflation readings – even after a surge in commodity price fueled inflation in many other countries – proves that there remains ample spare capacity in the euro area economy and labor markets. The ECB is under no pressure to turn less dovish anytime soon. Chart 5AEuro Area: ECB Monitor
Euro Area: ECB Monitor
Euro Area: ECB Monitor
Chart 5BStill Lots Of Spare Capacity In Europe
Still Lots Of Spare Capacity In Europe
Still Lots Of Spare Capacity In Europe
The lack of an immediate inflation threat can also be seen in the sub-components of our ECB Monitor, where the inflation elements have clearly lagged the growth upturn (Chart 5C). From a currency perspective, a growth fueled surge in the ECB Monitor is usually enough to provide a boost to the euro. Yet, without an inflation trigger, the likelihood of the ECB dialing back bond purchases, let alone raising interest rates, is low. This suggests any rally in the euro from current levels will be a slow adjustment towards fair value. Chart 5CInflation Components Lagging
Inflation Components Lagging
Inflation Components Lagging
Currently, the European OIS curve is discounting an initial ECB rate hike in October 2023, with only 27bps of rate hikes expected by the end of 2024 - one of the most dovish pricings in the G10 (see Appendix Table 1). Even though our ECB Monitor suggests that European bond markets should be pricing in more rate hikes (Chart 5D), that is unlikely to happen with the ECB messaging a dovish stance and with the central bank set to release a review of its inflation strategy later this year. We continue to recommend an overweight stance on European government bonds within global fixed income portfolios. Chart 5DMarkets Hear The ECB's Dovish Message
Markets Hear The ECB's Dovish Message
Markets Hear The ECB's Dovish Message
BoJ Monitor: Deflation Is Still A Threat Our Bank of Japan (BoJ) Monitor has recovered from deeply depressed pandemic lows to just above the zero line (Chart 6A). This is welcome news for the BoJ, that kept interest rates and asset purchases unchanged at yesterday's meeting, but recognized the need for additional stimulus via "green" loans.The reading from the central bank monitor is also consistent with a Japanese economy that requires more accommodative monetary policy vis-à-vis the rest of the G10. The Japanese economy remains under siege from the pandemic. The number of new COVID-19 cases remains at the highest level per capita in developed Asia. Meanwhile, the manufacturing PMI is the lowest in the developed world and a third wave of infections has also crippled the services sector. This pins the Japanese recovery well behind that of other G10 countries. The IMF expects the output gap in Japan to close sometime in 2023, but it is worth noting that there are few signs of inflationary pressures that would signal such an outcome. Both core and headline Japanese prices are deflating in a world where the risks are tilted towards an inflation overshoot (Chart 6B). The unemployment rate has rolled over, but still remains a ways from pre-pandemic lows. Savings in Japan are also surging, short-circuiting the sort of positive feedback loop that will generate genuine inflation. Chart 6AThe BoJ Monitor
The BoJ Monitor
The BoJ Monitor
Chart 6BDeflation Is Still A Threat In Japan
Deflation Is Still A Threat In Japan
Deflation Is Still A Threat In Japan
The individual elements of the BoJ Monitor suggest that the growth component has seen steady improvement over the last few months, while the financial component has rolled over (Chart 6C). The latter reflects the underperformance of Japanese equities in recent months, after a spectacular rally late last year. However, weakness in the yen has also allowed financial conditions to remain relatively easy. The yen is a safe-haven currency, making the relationship with the central bank monitor less intuitive. When the central bank monitor is improving (both in Japan and globally), traders tend to use the yen to fund carry trades elsewhere, which weakens the currency. When risk aversion sets in, these trades are unwound, and the yen rallies. This year, the yen has weakened in sympathy with improving global growth, suggesting this playbook remains very much relevant. Chart 6CModest Improvement In The Growth And Inflation Components
Modest Improvement In The Growth And Inflation Components
Modest Improvement In The Growth And Inflation Components
The strength of our BoJ Monitor indicates that Japanese Government Bond (JGB) yields should rise towards the upper bound of the -25bps to +25bps band. However, the BoJ will stand firm in maintaining easy monetary policy, as expected by market participants (Chart 6D). This policy-induced stability makes JGBs a defensive bond market when US Treasury yields are rising, a key reason for our overweight stance on JGBs. Chart 6DNo Change In Policy Expected
No Change In Policy Expected
No Change In Policy Expected
BoC Monitor: Strong Growth = Early Tightening Our Bank of Canada (BoC) Monitor has shown an impressive rebound and currently displays the highest figure among our Central Bank Monitors (Chart 7A). With a growing number of central banks contemplating a less dovish turn, Canada will be in the group of developed countries that hikes policy rates first. The Canadian economy started the year gaining significant positive momentum, with Q1 GDP growing by +5.6% (annualized quarter-on-quarter rate of change). The Q2 picture is a bit more mixed because of another wave of COVID-19 lockdowns. However, thanks to the rapid improvement in the pace of vaccinations after a botched initial rollout, Canadian household consumption and confidence have notably accelerated. Business confidence and investment intentions have also picked up solidly according the BoC’s most recent Business Outlook Survey. The job market also gained significant momentum, and as the lockdown measures gradually ease, workers who have been laid off during the pandemic will return to work. Therefore, the improvement in labor market will continue. A rapidly closing output gap means that the current surge in inflation may endure after the base effect comparisons to 2020 fade (Chart 7B). Chart 7ACanada: BoC Monitor
Canada: BoC Monitor
Canada: BoC Monitor
Chart 7BCanadian Inflation Pressures Intensifying
Canadian Inflation Pressures Intensifying
Canadian Inflation Pressures Intensifying
Looking at the components of our BoC Monitor, all three factors have clearly rebounded but the growth factor has shown the most impressive move (Chart 7C). Amid the broad economic factors that have improved, booming house prices – a primary cause for the BoC’s decision to taper its asset purchases back in April - have caused the growth factor to rebound quickly. Chart 7CA Positive Story For The CAD
A Positive Story For The CAD
A Positive Story For The CAD
The Canadian OIS curve is pricing in BoC liftoff in August 2022 (Appendix Table 1), with a sooner liftoff only expected in Norway and New Zealand. We see risks that the BoC moves much sooner than that next year. A quicker liftoff which will put additional upward pressure on the Canadian dollar, both against the US dollar and on a trade-weighted basis, particularly if Canadian export demand remains solid and oil prices continue to climb, as our commodity strategists expect. Our PPP model suggests that the Loonie is close to fair value, so valuation is not yet an impediment to additional strength in the Canadian dollar. Looking at the longer-term horizon, the OIS curve is discounting four BoC rate hikes within the next 24 months, and it is not clear that will be enough to cool off the red-hot Canadian housing market – currently the biggest threat to inflation stability in Canada (Chart 7D). Given that relatively hawkish view, the more optimistic growth outlook, and the high-beta status of Canadian government bonds, we continue to recommend an underweight position on Canadian government bonds within a global fixed income portfolio. Chart 7DCanadian Rate Expectations Look Fairly Priced
Canadian Rate Expectations Look Fairly Priced
Canadian Rate Expectations Look Fairly Priced
RBA Monitor: Waiting For Inflation Our Reserve Bank of Australia (RBA) Monitor has continued its strong rebound since the trough in 2020 and is now at all-time highs, suggesting heightened pressure on the RBA to tighten policy (Chart 8A). This rebound comes amid dovish messaging from an RBA that is waiting on signs of an inflation turnaround. The RBA’s patience makes sense when you consider measures of slack in the economy, such as output and unemployment gaps (Chart 8B). While the IMF does expect the output gap to tighten up significantly in 2021, it does not expect it to be closed even by 2022. Looking to capacity in the labor market, the unemployment rate has just returned to pre-COVID levels. However, the labor market will need to run “hot” for a sustained period of time to push up wage inflation, which remains deep in the doldrums according to the RBA’s wage price index. Chart 8AAustralia: RBA Monitor
Australia: RBA Monitor
Australia: RBA Monitor
Chart 8BMuted Inflationary Pressures Down Under
BCA Central Bank Monitor Chartbook: The Long Kiss Goodnight
BCA Central Bank Monitor Chartbook: The Long Kiss Goodnight
A look at the components of our RBA Monitor explains the RBA’s dovishness in the face of the tightening pressure indicated by the “headline” figure (Chart 8C). The rebound in the Monitor can be attributed almost entirely to the growth and financial components, which are driven in turn by improving confidence and an expanding RBA balance sheet. However, the inflation component, which has barely budged off its 2020 low, best captures the metrics that the RBA is watching. Importantly, the RBA will need to see sustainable domestically-generated inflation before it can begin to tolerate a stronger AUD which would otherwise imperil tradable goods inflation. With the AUD only slightly expensive on our PPP models, the RBA does not have much of a “valuation cushion” to play with in terms of delivering a hawkish surprise (Appendix Table 1). Chart 8CGrowth Factors Are Driving the RBA Monitor
Growth Factors Are Driving the RBA Monitor
Growth Factors Are Driving the RBA Monitor
Chart 8D shows that market pricing for hikes over the next two years has remained mostly flat in 2021 in the face of persistently dovish messaging from the RBA. Our view, as expressed in a recent update of our “RBA checklist”2, is that fundamental factors will force the RBA to remain dovish, making Australian government debt an attractive overweight within global government bond portfolios. Chart 8DMarkets Are (Rightly) Looking Through Tightening Pressures In Australia
Markets Are (Rightly) Looking Through Tightening Pressures In Australia
Markets Are (Rightly) Looking Through Tightening Pressures In Australia
RBNZ Monitor: Heating Up Our Reserve Bank of New Zealand (RBNZ) Monitor has rebounded to levels last seen in 2017, largely on the back of improving growth (Chart 9A). Success at containing the virus has allowed the New Zealand economy to beat growth expectations for Q1/2021, effectively pulling forward future policy tightening. Measures of capacity utilization in New Zealand will likely respond accordingly to improved growth prospects, with the output gap likely to close even faster than projected by the IMF (Chart 9B). Measures of core and headline inflation remain within the RBNZ’s 1-3% target range, with the Bank expecting headline inflation to shoot up to 2.6% in Q2/2021 before settling around the midpoint of the range. Chart 9ANew Zealand: RBNZ Monitor
New Zealand: RBNZ Monitor
New Zealand: RBNZ Monitor
Chart 9BThe New Zealand Economy Is Quickly Working Off Slack
The New Zealand Economy Is Quickly Working Off Slack
The New Zealand Economy Is Quickly Working Off Slack
Looking at the individual components of our RBNZ Monitor, the rebound in the overall indicator is clearly a growth story (Chart 9C). This component of our Monitor also captures the effect of accelerating house prices, which have become a direct concern for RBNZ policy. According to the bank’s own projections, house prices will post a whopping 29% growth rate in the second quarter. With issues of housing affordability at the forefront, and political pressure mounting, the RBNZ will likely be forced to turn less dovish soon, even if it comes with unwanted strength in the NZD. However, the currency is among the most expensive on our PPP models (Appendix Table 1), which means that a reversion to fair value could counteract upward pressure from a hawkish RBNZ. Chart 9CThe RBNZ Will Do Whatever It Takes To Stabilize House Prices
The RBNZ Will Do Whatever It Takes To Stabilize House Prices
The RBNZ Will Do Whatever It Takes To Stabilize House Prices
Historically, our RBNZ Monitor has correlated well with market pricing embedded in the OIS curve (Chart 9D). In 2021, however, market expectations have far outstripped the signal from our central bank monitor, meaning that markets believe the RBNZ is more focused on growth factors rather than the overall picture, a view that we largely agree with. Chart 9DMarkets Expect A Hawkish RBNZ
Markets Expect A Hawkish RBNZ
Markets Expect A Hawkish RBNZ
Even after the Fed’s hawkish surprise at this week’s meeting, we still believe that the RBNZ will be among the first to taper its balance sheet and move towards normalizing policy. Stay underweight New Zealand sovereign debt. Riksbank Monitor: Watch For An Upside Surprise Our Riksbank Monitor has posted a strong rebound, reaching all-time highs (Chart 10A). This rebound has come on the back of a robust economic recovery. Meanwhile, monetary policy has been accommodative with the Riksbank holding the repo rate at 0% while expanding the size of its balance sheet. Capacity utilization, which in Sweden did not fall nearly as much as in other developed economies, is looking set to recover in the coming years (Chart 10B). Although headline CPI shot past the 2% target, driven by fuel and food prices, underlying core inflation remains stable. The Riksbank expects inflation to fall due to less favorable year-over-year base effects, and only sustainably climb to the 2% level by mid-2024. Chart 10ASweden: Riksbank Monitor
Sweden: Riksbank Monitor
Sweden: Riksbank Monitor
Chart 10BThe Rise In Swedish Inflation Is 'Transitory'...
The Rise In Swedish Inflation Is 'Transitory'...
The Rise In Swedish Inflation Is 'Transitory'...
Breaking down the rise in the Riksbank Monitor, we can see that it is driven overwhelmingly by the growth component (Chart 10C). This, in turn, has been driven by surging PMIs and soaring business and consumer confidence. Our colleagues at BCA Research European Investment Strategy have pointed out that the small export-sensitive economy will be poised to benefit from an upturn in the global industrial cycle3. While Sweden did arguably botch its COVID-19 response last year, it is catching up, with 42% of Swedes having already received their first dose of the vaccine. The case for the SEK is strong, given that the currency is a high-beta play on global growth and is also quite undervalued according to our PPP models (Appendix Table 1). Market expectations are that the Riksbank will lag others in normalizing policy, putting off a hike until September 2023. The Riksbank baseline is a flat repo rate out to Q2/2024 but an earlier rate hike is well within the “uncertainty bands” of the Riksbank’s forecast. Such a scenario may manifest if growth and inflation surprise to the upside. Chart 10C...But The Riksbank Cannot Ignore Explosive Growth
...But The Riksbank Cannot Ignore Explosive Growth
...But The Riksbank Cannot Ignore Explosive Growth
Given the positive economic backdrop and the financial stability risks posed by rising house prices and household indebtedness, we believe market pricing is too dovish relative to the actual pressure on the Riksbank to tighten policy (Chart 10D). This makes Swedish sovereign debt an attractive underweight candidate in global government bond portfolios. Chart 10DThe OIS Curve Is Pricing In Too Much Dovishness From The Riksbank
The OIS Curve Is Pricing In Too Much Dovishness From The Riksbank
The OIS Curve Is Pricing In Too Much Dovishness From The Riksbank
Norges Bank Monitor: The First To Hike Our Norges Bank Monitor has risen sharply from the pandemic lows and now signals that emergency monetary settings are no longer appropriate for the Norwegian economy (Chart 11A). Consistent with this message, Norges Bank governor, Øystein Olsen, suggested this week that a rate hike will occur in September, with possibly another hike by December of this year. Norway has handled the pandemic successfully. Since the onset of the COVID-19 crisis, it has registered the lowest rate of infections per capita, in part aided by its early decision to close its borders. Fiscal stimulus was also prompt and finely tailored to the sectors most in need of emergency funds. Moreover, monetary policy was highly accommodative, with the Norges Bank cutting interest rates to zero for the first time since its founding in 1816. Fiscal stimulus will remain relatively accommodative, as Norway will register one of the smallest fiscal drags in the G10 for the remainder of 2021 and 2022. Rapid improvement in the labor market also continues. After peaking at 9.5% in March 2020, the headline unemployment rate has fallen to 3.3%. On the energy front, the new Johan Sverdrup oil and gas discovery marks a major turnaround in capital spending for Norway. According to the Norges Bank, real petroleum investment will increase from approximately NOK 175bn in 2021 to NOK 198bn by 2024. These developments have set the Norwegian economy on a sustainable recovery path. This positive economic outlook suggests that Norwegian inflation will remain above the central bank’s target of 2%. Already, headline CPI stands at 3% (Chart 11B). Meanwhile, while core inflation at 2% is decelerating, the slowdown should be temporary. According to a Norges Bank survey, both long-term and near-term inflation expectations among economists, business leaders, and households are rising, which indicates that a deflationary mindset has not taken root in Norway. Chart 11AThe Norges Bank Monitor
The Norges Bank Monitor
The Norges Bank Monitor
Chart 11BInflation Is Well Anchored In Norway
Inflation Is Well Anchored In Norway
Inflation Is Well Anchored In Norway
The biggest improvement in our Norges Bank Monitor comes from its growth and inflation components, the former surging to its highest level in two decades. This improvement surpasses those that followed the global financial crisis and the bursting of the dot-com bubble (Chart 11C). In essence, the growth component of the Monitor signals that the Norwegian economy has achieved escape velocity. The Monitor shows a very tight correlation with the trade-weighted currency, suggesting the exchange rate is an important valve for adjusting financial conditions. As an oil-producing economy, the drop in the NOK cushioned the crash in oil prices last year. This year, a recovery has benefitted the krone. The Norwegian krone also remains undervalued according to our PPP models. Chart 11CThe Norges Bank Should Hike Rates
The Norges Bank Should Hike Rates
The Norges Bank Should Hike Rates
A positive correlation also exists between the Monitor and expected rate hikes by the Norges bank (Chart 11D). This suggest yields in Norway should either coincide or lead the improvement in global bond yields. From a portfolio perspective, our default stance is neutral, as the market is thinly traded. Chart 11DThe Norges Bank Should Hike Rates
The Norges Bank Should Hike Rates
The Norges Bank Should Hike Rates
SNB Monitor: Green Shoots Our Swiss National Bank (SNB) Monitor has recovered smartly, and is at the highest level in over a decade (Chart 12A). This is a marked turnaround for a country that has had negative interest rates since 2015. It also raises the prospect that Switzerland may be finally able to escape its liquidity trap, allowing the SNB to modestly adjust monetary policy upward. The Swiss economy has recovered swiftly. As of May, the manufacturing PMI was at 69.9, the highest reading since the start of the series. If past manufacturing sentiment is prologue, the Swiss economy is about to experience its biggest rebound in decades. This will quell any deflationary fears about domestic conditions in Switzerland and begin to re-anchor inflation expectations upwards. This will also be a very welcome development for the SNB. Inflation dynamics in Switzerland will be particularly beholden to improvements in private sector demand. The unemployment rate in Switzerland has rolled over, which should begin to provide an anchor to wage growth. Both core and headline inflation are also recovering, albeit at a slow pace (Chart 12B). Import prices in Switzerland will also rise, driven by the relative weakness of the currency. This is important because for a small, open economy like Switzerland, the exchange rate often dictates the trend in domestic inflation. Chart 12AThe SNB Monitor
The SNB Monitor
The SNB Monitor
Chart 12BSwiss Inflation Not Out Of The Woods
Swiss Inflation Not Out Of The Woods
Swiss Inflation Not Out Of The Woods
Looking at the components of our SNB Monitor, the growth component has been in the driver’s seat (Chart 12C). But encouragingly, both the inflation and financial component have also been grinding higher. This improvement suggests that the weakness in the franc, especially amidst global dollar weakness, has been a welcome jolt to the economy. Like the yen, the CHF is a safe-haven currency, making the relationship with the central bank monitor less intuitive. Most of the time, the relationship with the monitor is inverse, corresponding to investors using the Swiss franc for carry trades when global conditions improve. Similar to the yen this year, the CHF has also weakened in sympathy with improving global growth. Should global growth see a setback in the near term, the franc will benefit. Chart 12CGrowth Indicators Are Surging In Switzerland
Growth Indicators Are Surging In Switzerland
Growth Indicators Are Surging In Switzerland
The SNB Monitor is more accurate at capturing expected policy changes by the SNB. This means that yields in Switzerland could see more meaningful upside (Chart 12D). That said, our default stance on Swiss bonds is neutral in a global portfolio, given low liquidity. Chart 12DCould The SNB Finally Lift Rates?
Could The SNB Finally Lift Rates?
Could The SNB Finally Lift Rates?
Appendix Table 1 Table 1Appendix Table 1
BCA Central Bank Monitor Chartbook: The Long Kiss Goodnight
BCA Central Bank Monitor Chartbook: The Long Kiss Goodnight
Footnotes 1 See BCA Research US Bond Strategy/Global Fixed Income Strategy Special Report, “A Central Bank Timeline For The Next Two Years”, dated June 1, 2021, available at gfis.bcaresearch.com 2 Please see BCA Research Global Fixed Income Strategy Report, "A Summer Nap For Global Bond Yields", dated June 9, 2021, available at gfis.bcaresearch.com. 3 Please see BCA Research European Investment Strategy Report, "Take A Chance On Sweden", dated May 3, 2021, available at eis.bcaresearch.com. Trades & Forecasts Forecast Summary Core Portfolio Tactical Trades Limit Orders Closed Trades
Feature This week, we present the BCA Central Bank Monitor Chartbook, detailing our set of proprietary indicators measuring the cyclical forces influencing future monetary policy decisions in developed market countries. The surging Monitors are all sending a similar message: tighter global monetary policy is necessary because of above-trend economic growth, intensifying inflation pressures and booming financial markets (Charts 1A & 1B). Chart 1ATightening Pressures …
Tightening Pressures...
Tightening Pressures...
Chart 1B… Everywhere
...Everywhere
...Everywhere
The Monitors are pointing to a continuation of the cyclical rise in global bond yields seen since mid-2020, justifying our recommended below-benchmark stance on overall duration exposure in global bond portfolios. The driver of the next leg upward in yields, however, is shifting from growth and inflation expectations to monetary policy expectations. The Fed is starting to slowly prepare markets for the next US tightening cycle, which is already putting flattening pressure on the US Treasury curve and creating more two-way risk for the US dollar over the next 6-12 months. The timing and pace of rate hikes discounted by markets varies across countries, however, creating interesting opportunities for currency pairs, via changing interest rate differentials, away from the US dollar crosses. An Overview Of The BCA Research Central Bank Monitors The BCA Research Central Bank Monitors are composite indicators that include data which have historically been correlated to changes in monetary policy. The economic data series used to construct the Monitors are not the same for every country, but the list of indicators generally measure similar things (i.e. manufacturing cycles, domestic demand strength, commodity prices, labor market conditions, financial conditions). The data series are standardized and combined to form the Monitors. We have constructed Monitors for ten developed market countries: the US, the euro area, the UK, Japan, Canada, Australia, New Zealand, Sweden, Switzerland and Norway. A rising trend for each Monitor indicates growing pressures for central banks to tighten policy, and vice versa. Within each country, we have aggregated the various data series within the Monitors into sub-groupings covering economic, inflation and financial conditions indicators (equity prices, corporate credit spreads, etc). The latter is critical as policymakers have increasingly realized the importance of financial conditions as a key transmission mechanism of monetary policy to the real economy. The weightings of each bucket vary by country, based on the strength of historical correlations of the Monitors to actual changes in policy interest rates. Disaggregating the Monitors this way offers an additional layer of analysis by helping describe central bank reaction functions (i.e. some central banks respond more strongly to economic growth, others to inflation or financial conditions). Through the nexus between growth, inflation, and market expectations of future interest rate changes, the Monitors do exhibit broad correlations to government bond yields in the major developed markets (Charts 2A & 2B). The Monitors do also exhibit steady correlations to currencies, although not in the same consistent fashion as with bond yields. For example, the Fed Monitor is typically negatively correlated to the US dollar, while the Reserve Bank of Australia (RBA) Monitor is positively correlated to the Australian dollar. We present charts showing the links between the Monitors and bond yields (and foreign exchange rates) in the individual country sections of this Chartbook. Chart 2AThe Surging CB Monitors ….
The Surging CB Monitors...
The Surging CB Monitors...
Chart 2B… Suggest More Upside For Bond Yields
...Suggesting Bond Yields Should Creep Higher
...Suggesting Bond Yields Should Creep Higher
In each edition of the Central Bank Monitor Chartbook, we include a “non-standard” chart that shows an interesting correlation between the Monitors and a financial market variable. In this latest report, we show how the relationship between the Monitors and our 24-Month Discounters, which measure that amount of rate hikes/cuts discounted in overnight index swap (OIS) forward curves over the next two years. We have also added a new Appendix Table that shows the so-called “liftoff dates” (the date when a first full rate hike is discounted in OIS curves), the cumulative amount of rate hikes expected to the end of 2024, and the valuation of each country’s currency on a purchasing power parity (PPP) basis. We’ve ranked the countries in the table by liftoff dates, thus providing a handy reference to see how markets are judging the order with which central banks will begin the next monetary policy tightening cycle. Fed Monitor: A Clear Signal Our Fed Monitor has been climbing steadily, uninterrupted, for 13 consecutive months, driven by the combination of strong US growth, sharply higher inflation and booming financial markets (Chart 3A). The message from the highly elevated level of the indicator is clear – the Fed should begin the process of unwinding the massive monetary policy accomodation put in place because of the COVID-19 pandemic. At this week’s FOMC meeting, the Fed delivered a mildly hawkish surprise by pulling forward the projected timing of “liftoff” (the first fed funds rate hike) from 2024 to 2023. The timing and pace of future Fed tapering of asset purchases and rate hikes will be determined by how rapidly the US economy approaches the Fed’s definition of “maximum employment”. We see that happening by the end of 2022, which is a bit ahead of the Fed’s own projections for the unemployment rate. The US OIS curve now discounts liftoff near the end of 2022 (see Appendix Table 1), which is now more in line with our own view that the Fed will begin tapering next January and begin rate hikes in December 20221. US economic growth momentum has likely peaked in Q2, but will remain solid in the latter half of 2021. Most of the nation has lifted the remaining pandemic restrictions on activity after a succesful vaccination program, and fiscal policy is still providing a boost to growth. The Fed’s updated economic projections call for real GDP growth to reach 7% this year, 3.4% in 2022 and 2.4% in 2023. The Fed’s assumption is trend GDP growth is still only 1.8%, thus the central bank now expects three consecutive years of above-trend growth. Unsurprisingly, the Fed is forecasting headline PCE inflation to stay above the Fed’s 2% target for all three years (Chart 3B). Chart 3AUS: Fed Monitor
US: Fed Monitor
US: Fed Monitor
Chart 3BIs This Really 'Transitory' Inflation?
Is This Really 'Transitory' Inflation?
Is This Really 'Transitory' Inflation?
The recovery in the Fed Monitor has been led primarily by the growth component, although the inflation and financial components have also risen significantly (Chart 3C). The Fed Monitor has typically been negatively correlated to the momentum of the US dollar, which has always been more of a counter-cyclical currency that weakens in good economic times. A more hawkish path for US interest rates could eventually give a sustainable lift to the greenback, but for now, the currency will be caught in a tug of war between shifting Fed expectations and robust global growth over the next 6-12 months. Chart 3CBooming Growth Supporting USD Weakness
Booming Growth Supporting USD Weakness
Booming Growth Supporting USD Weakness
We continue to recommend an underweight strategic allocation to US Treasuries within global government bond portfolios, with markets still pricing in a pace of Fed tightening that appears too conservative (Chart 3D). Chart 3DNot Enough Fed Rate Hikes Priced
Not Enough Fed Rate Hikes Priced
Not Enough Fed Rate Hikes Priced
The Fed’s mildly hawkish surprise this week generated a signficant flattening of the US Treasury curve, with the spread between 5-year and 30-year US yields narrowing by a whopping 20bps. We are closing our two recommeded yield curve trades in the BCA Research Global Fixed Income Strategy tactical trade portfolio, which were positioned more to earn near-term carry in a stable curve environment that has now changed with the Fed injecting volatility back into the bond market. BoE Monitor: More Hawkish Surprises Coming Our Bank of England (BoE) Monitor has spiked higher, fueled by a rapid recovery of UK growth alongside a pickup in inflation pressures (Chart 4A). The BoE has already responded by slowing the pace of its asset purchases in May, and we expect more tapering announcements over the next 6-12 months. The most recent set of BoE economic forecasts calls for headline UK CPI inflation to rise to 2.3% in 2022 before settling down to 2% in 2023 and 1.9% in 2024 (Chart 4B). This would be a mild inflation outcome by recent UK standards during what will certainly be a period of strong post-pandemic growth over the next 12-18 months. Longer-term inflation expectations, both survey-based and extracted from CPI swaps and inflation-linked Gilts, are priced for a bigger inflation upturn above 3%. Chart 4AUK: BoE Monitor
UK: BoE Monitor
UK: BoE Monitor
Chart 4BUpside UK Inflation Surprises Ahead?
Upside UK Inflation Surprises Ahead?
Upside UK Inflation Surprises Ahead?
The recent decision by the UK government to delay “Freedom Day”, when all remaining COVID-19 restrictions would be lifted, into July because of the spread of the Delta virus variant represents a potential near-term setback to UK growth momentum. The bigger picture, however, still points to an economy benefitting far more from the earlier success of the vaccination program. Consumer confidence remains resilient, while business confidence – and investment intentions – has taken a notable turn higher as well. The housing market has also started to heat up, with house price inflation accelerating. The backdrop still remains one of above-potential UK growth over the next 12-24 months. Within the BoE Monitor sub-components, the economic and financial elements stand out as having the biggest moves over the past year (Chart 4C). Momentum in the British pound is positively correlated to our BoE Monitor. As the central bank moves incrementally moves towards more tapering and eventual rate hikes, the currency, which remains moderately undervalued on a PPP basis (see Appendix Table 1), should be well supported. Chart 4CAll BoE Monitor Components Are Rising
All BoE Monitor Components Are Rising
All BoE Monitor Components Are Rising
The UK OIS curve currently discounts BoE liftoff in May 2023, with 57bps of cumulative rate hikes expected by the end of 2024. We see risks of the central bank moving sooner than the market on liftoff, with a rate hike in the 3rd or 4th quarter of 2022 more likely. The Gilt market is vulnerable to any hawkish shift by the BoE with so few rate hikes discounted (Chart 4D). For now, we are maintaining a neutral stance on UK Gilts, given the BoE’s history of talking hawkishly but failing to deliver, but we do have them on “downgrade watch.” Chart 4DBoE Monitor Suggests Continued Downward Pressure On Gilt Yields
BoE Monitor Suggests Continued Downward Pressure On Gilt Yields
BoE Monitor Suggests Continued Downward Pressure On Gilt Yields
ECB Monitor: Growth? Yes. Inflation? No. Our European Central Bank (ECB) Monitor has moved sharply higher as more of the euro area has emerged from pandemic restrictions (Chart 5A). Yet the central bank is not sending any of the kinds of moderately hawkish signals coming from the Fed and other central banks. The ECB is still a long way from such a move. While growth has clearly recovered strongly, the overall euro area unemployment rate remains high at 8% and wage growth remains anemic in most countries. There is the potential for upside growth surprises coming from fiscal policy, with the Next Generation EU (NGEU) funds set to be disributed by the EU later this year. Yet even with this fiscal boost, most of the euro area is likely to remain far enough away from full employment allowing the ECB to stay dovish for longer. While headine euro area inflation reached the ECB’s 2% target in May, core inflaton remained subdued at a mere 0.9% (Chart 5B). Market based measures of inflation expectations are also well below the ECB target, with the 5-year/5-year forward CPI swap rate only at 1.6%. Such “boring” inflation readings – even after a surge in commodity price fueled inflation in many other countries – proves that there remains ample spare capacity in the euro area economy and labor markets. The ECB is under no pressure to turn less dovish anytime soon. Chart 5AEuro Area: ECB Monitor
Euro Area: ECB Monitor
Euro Area: ECB Monitor
Chart 5BStill Lots Of Spare Capacity In Europe
Still Lots Of Spare Capacity In Europe
Still Lots Of Spare Capacity In Europe
The lack of an immediate inflation threat can also be seen in the sub-components of our ECB Monitor, where the inflation elements have clearly lagged the growth upturn (Chart 5C). From a currency perspective, a growth fueled surge in the ECB Monitor is usually enough to provide a boost to the euro. Yet, without an inflation trigger, the likelihood of the ECB dialing back bond purchases, let alone raising interest rates, is low. This suggests any rally in the euro from current levels will be a slow adjustment towards fair value. Chart 5CInflation Components Lagging
Inflation Components Lagging
Inflation Components Lagging
Currently, the European OIS curve is discounting an initial ECB rate hike in October 2023, with only 27bps of rate hikes expected by the end of 2024 - one of the most dovish pricings in the G10 (see Appendix Table 1). Even though our ECB Monitor suggests that European bond markets should be pricing in more rate hikes (Chart 5D), that is unlikely to happen with the ECB messaging a dovish stance and with the central bank set to release a review of its inflation strategy later this year. We continue to recommend an overweight stance on European government bonds within global fixed income portfolios. Chart 5DMarkets Hear The ECB's Dovish Message
Markets Hear The ECB's Dovish Message
Markets Hear The ECB's Dovish Message
BoJ Monitor: Deflation Is Still A Threat Our Bank of Japan (BoJ) Monitor has recovered from deeply depressed pandemic lows to just above the zero line (Chart 6A). This is welcome news for the BoJ, that kept interest rates and asset purchases unchanged at yesterday's meeting, but recognized the need for additional stimulus via "green" loans.The reading from the central bank monitor is also consistent with a Japanese economy that requires more accommodative monetary policy vis-à-vis the rest of the G10. The Japanese economy remains under siege from the pandemic. The number of new COVID-19 cases remains at the highest level per capita in developed Asia. Meanwhile, the manufacturing PMI is the lowest in the developed world and a third wave of infections has also crippled the services sector. This pins the Japanese recovery well behind that of other G10 countries. The IMF expects the output gap in Japan to close sometime in 2023, but it is worth noting that there are few signs of inflationary pressures that would signal such an outcome. Both core and headline Japanese prices are deflating in a world where the risks are tilted towards an inflation overshoot (Chart 6B). The unemployment rate has rolled over, but still remains a ways from pre-pandemic lows. Savings in Japan are also surging, short-circuiting the sort of positive feedback loop that will generate genuine inflation. Chart 6AThe BoJ Monitor
The BoJ Monitor
The BoJ Monitor
Chart 6BDeflation Is Still A Threat In Japan
Deflation Is Still A Threat In Japan
Deflation Is Still A Threat In Japan
The individual elements of the BoJ Monitor suggest that the growth component has seen steady improvement over the last few months, while the financial component has rolled over (Chart 6C). The latter reflects the underperformance of Japanese equities in recent months, after a spectacular rally late last year. However, weakness in the yen has also allowed financial conditions to remain relatively easy. The yen is a safe-haven currency, making the relationship with the central bank monitor less intuitive. When the central bank monitor is improving (both in Japan and globally), traders tend to use the yen to fund carry trades elsewhere, which weakens the currency. When risk aversion sets in, these trades are unwound, and the yen rallies. This year, the yen has weakened in sympathy with improving global growth, suggesting this playbook remains very much relevant. Chart 6CModest Improvement In The Growth And Inflation Components
Modest Improvement In The Growth And Inflation Components
Modest Improvement In The Growth And Inflation Components
The strength of our BoJ Monitor indicates that Japanese Government Bond (JGB) yields should rise towards the upper bound of the -25bps to +25bps band. However, the BoJ will stand firm in maintaining easy monetary policy, as expected by market participants (Chart 6D). This policy-induced stability makes JGBs a defensive bond market when US Treasury yields are rising, a key reason for our overweight stance on JGBs. Chart 6DNo Change In Policy Expected
No Change In Policy Expected
No Change In Policy Expected
BoC Monitor: Strong Growth = Early Tightening Our Bank of Canada (BoC) Monitor has shown an impressive rebound and currently displays the highest figure among our Central Bank Monitors (Chart 7A). With a growing number of central banks contemplating a less dovish turn, Canada will be in the group of developed countries that hikes policy rates first. The Canadian economy started the year gaining significant positive momentum, with Q1 GDP growing by +5.6% (annualized quarter-on-quarter rate of change). The Q2 picture is a bit more mixed because of another wave of COVID-19 lockdowns. However, thanks to the rapid improvement in the pace of vaccinations after a botched initial rollout, Canadian household consumption and confidence have notably accelerated. Business confidence and investment intentions have also picked up solidly according the BoC’s most recent Business Outlook Survey. The job market also gained significant momentum, and as the lockdown measures gradually ease, workers who have been laid off during the pandemic will return to work. Therefore, the improvement in labor market will continue. A rapidly closing output gap means that the current surge in inflation may endure after the base effect comparisons to 2020 fade (Chart 7B). Chart 7ACanada: BoC Monitor
Canada: BoC Monitor
Canada: BoC Monitor
Chart 7BCanadian Inflation Pressures Intensifying
Canadian Inflation Pressures Intensifying
Canadian Inflation Pressures Intensifying
Looking at the components of our BoC Monitor, all three factors have clearly rebounded but the growth factor has shown the most impressive move (Chart 7C). Amid the broad economic factors that have improved, booming house prices – a primary cause for the BoC’s decision to taper its asset purchases back in April - have caused the growth factor to rebound quickly. Chart 7CA Positive Story For The CAD
A Positive Story For The CAD
A Positive Story For The CAD
The Canadian OIS curve is pricing in BoC liftoff in August 2022 (Appendix Table 1), with a sooner liftoff only expected in Norway and New Zealand. We see risks that the BoC moves much sooner than that next year. A quicker liftoff which will put additional upward pressure on the Canadian dollar, both against the US dollar and on a trade-weighted basis, particularly if Canadian export demand remains solid and oil prices continue to climb, as our commodity strategists expect. Our PPP model suggests that the Loonie is close to fair value, so valuation is not yet an impediment to additional strength in the Canadian dollar. Looking at the longer-term horizon, the OIS curve is discounting four BoC rate hikes within the next 24 months, and it is not clear that will be enough to cool off the red-hot Canadian housing market – currently the biggest threat to inflation stability in Canada (Chart 7D). Given that relatively hawkish view, the more optimistic growth outlook, and the high-beta status of Canadian government bonds, we continue to recommend an underweight position on Canadian government bonds within a global fixed income portfolio. Chart 7DCanadian Rate Expectations Look Fairly Priced
Canadian Rate Expectations Look Fairly Priced
Canadian Rate Expectations Look Fairly Priced
RBA Monitor: Waiting For Inflation Our Reserve Bank of Australia (RBA) Monitor has continued its strong rebound since the trough in 2020 and is now at all-time highs, suggesting heightened pressure on the RBA to tighten policy (Chart 8A). This rebound comes amid dovish messaging from an RBA that is waiting on signs of an inflation turnaround. The RBA’s patience makes sense when you consider measures of slack in the economy, such as output and unemployment gaps (Chart 8B). While the IMF does expect the output gap to tighten up significantly in 2021, it does not expect it to be closed even by 2022. Looking to capacity in the labor market, the unemployment rate has just returned to pre-COVID levels. However, the labor market will need to run “hot” for a sustained period of time to push up wage inflation, which remains deep in the doldrums according to the RBA’s wage price index. Chart 8AAustralia: RBA Monitor
Australia: RBA Monitor
Australia: RBA Monitor
Chart 8BMuted Inflationary Pressures Down Under
BCA Central Bank Monitor Chartbook: The Long Kiss Goodnight
BCA Central Bank Monitor Chartbook: The Long Kiss Goodnight
A look at the components of our RBA Monitor explains the RBA’s dovishness in the face of the tightening pressure indicated by the “headline” figure (Chart 8C). The rebound in the Monitor can be attributed almost entirely to the growth and financial components, which are driven in turn by improving confidence and an expanding RBA balance sheet. However, the inflation component, which has barely budged off its 2020 low, best captures the metrics that the RBA is watching. Importantly, the RBA will need to see sustainable domestically-generated inflation before it can begin to tolerate a stronger AUD which would otherwise imperil tradable goods inflation. With the AUD only slightly expensive on our PPP models, the RBA does not have much of a “valuation cushion” to play with in terms of delivering a hawkish surprise (Appendix Table 1). Chart 8CGrowth Factors Are Driving the RBA Monitor
Growth Factors Are Driving the RBA Monitor
Growth Factors Are Driving the RBA Monitor
Chart 8D shows that market pricing for hikes over the next two years has remained mostly flat in 2021 in the face of persistently dovish messaging from the RBA. Our view, as expressed in a recent update of our “RBA checklist”2, is that fundamental factors will force the RBA to remain dovish, making Australian government debt an attractive overweight within global government bond portfolios. Chart 8DMarkets Are (Rightly) Looking Through Tightening Pressures In Australia
Markets Are (Rightly) Looking Through Tightening Pressures In Australia
Markets Are (Rightly) Looking Through Tightening Pressures In Australia
RBNZ Monitor: Heating Up Our Reserve Bank of New Zealand (RBNZ) Monitor has rebounded to levels last seen in 2017, largely on the back of improving growth (Chart 9A). Success at containing the virus has allowed the New Zealand economy to beat growth expectations for Q1/2021, effectively pulling forward future policy tightening. Measures of capacity utilization in New Zealand will likely respond accordingly to improved growth prospects, with the output gap likely to close even faster than projected by the IMF (Chart 9B). Measures of core and headline inflation remain within the RBNZ’s 1-3% target range, with the Bank expecting headline inflation to shoot up to 2.6% in Q2/2021 before settling around the midpoint of the range. Chart 9ANew Zealand: RBNZ Monitor
New Zealand: RBNZ Monitor
New Zealand: RBNZ Monitor
Chart 9BThe New Zealand Economy Is Quickly Working Off Slack
The New Zealand Economy Is Quickly Working Off Slack
The New Zealand Economy Is Quickly Working Off Slack
Looking at the individual components of our RBNZ Monitor, the rebound in the overall indicator is clearly a growth story (Chart 9C). This component of our Monitor also captures the effect of accelerating house prices, which have become a direct concern for RBNZ policy. According to the bank’s own projections, house prices will post a whopping 29% growth rate in the second quarter. With issues of housing affordability at the forefront, and political pressure mounting, the RBNZ will likely be forced to turn less dovish soon, even if it comes with unwanted strength in the NZD. However, the currency is among the most expensive on our PPP models (Appendix Table 1), which means that a reversion to fair value could counteract upward pressure from a hawkish RBNZ. Chart 9CThe RBNZ Will Do Whatever It Takes To Stabilize House Prices
The RBNZ Will Do Whatever It Takes To Stabilize House Prices
The RBNZ Will Do Whatever It Takes To Stabilize House Prices
Historically, our RBNZ Monitor has correlated well with market pricing embedded in the OIS curve (Chart 9D). In 2021, however, market expectations have far outstripped the signal from our central bank monitor, meaning that markets believe the RBNZ is more focused on growth factors rather than the overall picture, a view that we largely agree with. Chart 9DMarkets Expect A Hawkish RBNZ
Markets Expect A Hawkish RBNZ
Markets Expect A Hawkish RBNZ
Even after the Fed’s hawkish surprise at this week’s meeting, we still believe that the RBNZ will be among the first to taper its balance sheet and move towards normalizing policy. Stay underweight New Zealand sovereign debt. Riksbank Monitor: Watch For An Upside Surprise Our Riksbank Monitor has posted a strong rebound, reaching all-time highs (Chart 10A). This rebound has come on the back of a robust economic recovery. Meanwhile, monetary policy has been accommodative with the Riksbank holding the repo rate at 0% while expanding the size of its balance sheet. Capacity utilization, which in Sweden did not fall nearly as much as in other developed economies, is looking set to recover in the coming years (Chart 10B). Although headline CPI shot past the 2% target, driven by fuel and food prices, underlying core inflation remains stable. The Riksbank expects inflation to fall due to less favorable year-over-year base effects, and only sustainably climb to the 2% level by mid-2024. Chart 10ASweden: Riksbank Monitor
Sweden: Riksbank Monitor
Sweden: Riksbank Monitor
Chart 10BThe Rise In Swedish Inflation Is 'Transitory'...
The Rise In Swedish Inflation Is 'Transitory'...
The Rise In Swedish Inflation Is 'Transitory'...
Breaking down the rise in the Riksbank Monitor, we can see that it is driven overwhelmingly by the growth component (Chart 10C). This, in turn, has been driven by surging PMIs and soaring business and consumer confidence. Our colleagues at BCA Research European Investment Strategy have pointed out that the small export-sensitive economy will be poised to benefit from an upturn in the global industrial cycle3. While Sweden did arguably botch its COVID-19 response last year, it is catching up, with 42% of Swedes having already received their first dose of the vaccine. The case for the SEK is strong, given that the currency is a high-beta play on global growth and is also quite undervalued according to our PPP models (Appendix Table 1). Market expectations are that the Riksbank will lag others in normalizing policy, putting off a hike until September 2023. The Riksbank baseline is a flat repo rate out to Q2/2024 but an earlier rate hike is well within the “uncertainty bands” of the Riksbank’s forecast. Such a scenario may manifest if growth and inflation surprise to the upside. Chart 10C...But The Riksbank Cannot Ignore Explosive Growth
...But The Riksbank Cannot Ignore Explosive Growth
...But The Riksbank Cannot Ignore Explosive Growth
Given the positive economic backdrop and the financial stability risks posed by rising house prices and household indebtedness, we believe market pricing is too dovish relative to the actual pressure on the Riksbank to tighten policy (Chart 10D). This makes Swedish sovereign debt an attractive underweight candidate in global government bond portfolios. Chart 10DThe OIS Curve Is Pricing In Too Much Dovishness From The Riksbank
The OIS Curve Is Pricing In Too Much Dovishness From The Riksbank
The OIS Curve Is Pricing In Too Much Dovishness From The Riksbank
Norges Bank Monitor: The First To Hike Our Norges Bank Monitor has risen sharply from the pandemic lows and now signals that emergency monetary settings are no longer appropriate for the Norwegian economy (Chart 11A). Consistent with this message, Norges Bank governor, Øystein Olsen, suggested this week that a rate hike will occur in September, with possibly another hike by December of this year. Norway has handled the pandemic successfully. Since the onset of the COVID-19 crisis, it has registered the lowest rate of infections per capita, in part aided by its early decision to close its borders. Fiscal stimulus was also prompt and finely tailored to the sectors most in need of emergency funds. Moreover, monetary policy was highly accommodative, with the Norges Bank cutting interest rates to zero for the first time since its founding in 1816. Fiscal stimulus will remain relatively accommodative, as Norway will register one of the smallest fiscal drags in the G10 for the remainder of 2021 and 2022. Rapid improvement in the labor market also continues. After peaking at 9.5% in March 2020, the headline unemployment rate has fallen to 3.3%. On the energy front, the new Johan Sverdrup oil and gas discovery marks a major turnaround in capital spending for Norway. According to the Norges Bank, real petroleum investment will increase from approximately NOK 175bn in 2021 to NOK 198bn by 2024. These developments have set the Norwegian economy on a sustainable recovery path. This positive economic outlook suggests that Norwegian inflation will remain above the central bank’s target of 2%. Already, headline CPI stands at 3% (Chart 11B). Meanwhile, while core inflation at 2% is decelerating, the slowdown should be temporary. According to a Norges Bank survey, both long-term and near-term inflation expectations among economists, business leaders, and households are rising, which indicates that a deflationary mindset has not taken root in Norway. Chart 11AThe Norges Bank Monitor
The Norges Bank Monitor
The Norges Bank Monitor
Chart 11BInflation Is Well Anchored In Norway
Inflation Is Well Anchored In Norway
Inflation Is Well Anchored In Norway
The biggest improvement in our Norges Bank Monitor comes from its growth and inflation components, the former surging to its highest level in two decades. This improvement surpasses those that followed the global financial crisis and the bursting of the dot-com bubble (Chart 11C). In essence, the growth component of the Monitor signals that the Norwegian economy has achieved escape velocity. The Monitor shows a very tight correlation with the trade-weighted currency, suggesting the exchange rate is an important valve for adjusting financial conditions. As an oil-producing economy, the drop in the NOK cushioned the crash in oil prices last year. This year, a recovery has benefitted the krone. The Norwegian krone also remains undervalued according to our PPP models. Chart 11CThe Norges Bank Should Hike Rates
The Norges Bank Should Hike Rates
The Norges Bank Should Hike Rates
A positive correlation also exists between the Monitor and expected rate hikes by the Norges bank (Chart 11D). This suggest yields in Norway should either coincide or lead the improvement in global bond yields. From a portfolio perspective, our default stance is neutral, as the market is thinly traded. Chart 11DThe Norges Bank Should Hike Rates
The Norges Bank Should Hike Rates
The Norges Bank Should Hike Rates
SNB Monitor: Green Shoots Our Swiss National Bank (SNB) Monitor has recovered smartly, and is at the highest level in over a decade (Chart 12A). This is a marked turnaround for a country that has had negative interest rates since 2015. It also raises the prospect that Switzerland may be finally able to escape its liquidity trap, allowing the SNB to modestly adjust monetary policy upward. The Swiss economy has recovered swiftly. As of May, the manufacturing PMI was at 69.9, the highest reading since the start of the series. If past manufacturing sentiment is prologue, the Swiss economy is about to experience its biggest rebound in decades. This will quell any deflationary fears about domestic conditions in Switzerland and begin to re-anchor inflation expectations upwards. This will also be a very welcome development for the SNB. Inflation dynamics in Switzerland will be particularly beholden to improvements in private sector demand. The unemployment rate in Switzerland has rolled over, which should begin to provide an anchor to wage growth. Both core and headline inflation are also recovering, albeit at a slow pace (Chart 12B). Import prices in Switzerland will also rise, driven by the relative weakness of the currency. This is important because for a small, open economy like Switzerland, the exchange rate often dictates the trend in domestic inflation. Chart 12AThe SNB Monitor
The SNB Monitor
The SNB Monitor
Chart 12BSwiss Inflation Not Out Of The Woods
Swiss Inflation Not Out Of The Woods
Swiss Inflation Not Out Of The Woods
Looking at the components of our SNB Monitor, the growth component has been in the driver’s seat (Chart 12C). But encouragingly, both the inflation and financial component have also been grinding higher. This improvement suggests that the weakness in the franc, especially amidst global dollar weakness, has been a welcome jolt to the economy. Like the yen, the CHF is a safe-haven currency, making the relationship with the central bank monitor less intuitive. Most of the time, the relationship with the monitor is inverse, corresponding to investors using the Swiss franc for carry trades when global conditions improve. Similar to the yen this year, the CHF has also weakened in sympathy with improving global growth. Should global growth see a setback in the near term, the franc will benefit. Chart 12CGrowth Indicators Are Surging In Switzerland
Growth Indicators Are Surging In Switzerland
Growth Indicators Are Surging In Switzerland
The SNB Monitor is more accurate at capturing expected policy changes by the SNB. This means that yields in Switzerland could see more meaningful upside (Chart 12D). That said, our default stance on Swiss bonds is neutral in a global portfolio, given low liquidity. Chart 12DCould The SNB Finally Lift Rates?
Could The SNB Finally Lift Rates?
Could The SNB Finally Lift Rates?
Appendix Table 1 Table 1Appendix Table 1
BCA Central Bank Monitor Chartbook: The Long Kiss Goodnight
BCA Central Bank Monitor Chartbook: The Long Kiss Goodnight
Footnotes 1 See BCA Research US Bond Strategy/Global Fixed Income Strategy Special Report, “A Central Bank Timeline For The Next Two Years”, dated June 1, 2021, available at gfis.bcaresearch.com 2 Please see BCA Research Global Fixed Income Strategy Report, "A Summer Nap For Global Bond Yields", dated June 9, 2021, available at gfis.bcaresearch.com. 3 Please see BCA Research European Investment Strategy Report, "Take A Chance On Sweden", dated May 3, 2021, available at eis.bcaresearch.com.
Highlights China’s Communist Party has overcome a range of challenges over the past 100 years, performed especially well over the past 42 years, but the macro and geopolitical outlook is darkening. The “East Asian miracle” phase of Chinese growth has ended. Potential GDP growth is slowing and it will be harder for Beijing to maintain financial and sociopolitical stability. The Communist Party has shifted the basis of its legitimacy from rapid growth to quality of life and nationalist foreign policy. The latter, however, will undermine the former by stirring up foreign protectionism. In the near term, global investors should favor developed market equities over China/EM equities. But they should favor China and Hong Kong stocks over Taiwanese stocks given significant geopolitical risk over the Taiwan Strait. Structurally, favor the US dollar and euro over the renminbi. Feature Ten years ago, in the lead up to the Communist Party’s 90th anniversary, I wrote a report called “China and the End of the Deng Dynasty,” referring to Deng Xiaoping, the Chinese Communist Party’s great pro-market reformer.1 The argument rested on three points: the end of the export-manufacturing economic model, an increasingly assertive foreign policy, and the revival of Maoist nationalism. After ten years the report holds up reasonably well but it did not venture to forecast what precisely would come next. In reality it is the rule of the Communist Party, and not the leader of any one man, that fits into China’s history of dynastic cycles. As the party celebrates a hundred years since its founding on July 23, 1921, it is necessary to pause and reflect on what the party has achieved over the past century and what the current Xi Jinping era implies for the country’s next 100 years. Single-Party Rule Can Bring Economic Success. Communism Cannot. Regime type does not preclude wealth. Countries can prosper regardless of whether they are ruled by one person, one party, or many parties. The richest countries in the world grew rich over centuries in which their governments evolved from monarchy to democracy and sometimes back again. Even today several of the world’s wealthy democracies are better described as republics or oligarchies. Chart 1China Outperformed Communism But Not Liberal Democracy
China’s Communist Party Turns 100: So What?
China’s Communist Party Turns 100: So What?
The rule of one person, or autocracy, is not necessarily bad for economic growth. For every Kim Il Sung of North Korea there is a Lee Kuan Yew of Singapore. But authority based on a single person often expires with that person and rarely survives his grandchild. In China, Chairman Mao Zedong’s death occasioned a power struggle. Deng Xiaoping’s attempts to step down led to popular unrest that threatened the Communist Party’s rule on two separate occasions in the 1980s. The rule of a single party is thought to be more sustainable. Japan and Singapore are effectively single-party states and the wealthiest countries in Asia. They are democracies with leadership rotation and a popular voice in national affairs. And yet South Korea’s boom times occurred under single-party military rule. The same goes for the renegade province of Taiwan. Only around the time these two reached about $11,000-$14,000 GDP per capita did they evolve into multi-party democracies – though their wealth grew rapidly in the wake of that transition. China and soon Vietnam will test whether non-democratic, single-party rule can persist beyond the middle-income economic status that brought about democratic transition in Taiwan (Chart 1). Vietnam and Taiwan are the closest communist and non-communist governing systems, respectively, to mainland China. Insofar as China and Vietnam succeed at catching up with Taiwan it will be for reasons other than Marxist-Leninist ideology. Most communist systems have failed. At the height of international communism in the twentieth century there were 44 states ruled by communist parties; today there are five. China and Vietnam are the rare examples of communist states that not only survived the Soviet Union’s fall but also unleashed market forces and prospered (Chart 2). North Korea survived in squalor; Cuba’s experience is mixed. States that close off their economies do not have a good record of generating wealth. Closed economies lack competition and investment, struggle with stagflation, and often succumb to corruption and political strife. Openness seems to be a more diagnostic variable than government type or ideology, given the prosperity of democratic Japan and non-democratic China. Has the CPC performed better than other communist regimes? Arguably. It performs better than Vietnam but worse than Cuba on critical measures like infant mortality rates and life expectancy. Has it performed better than comparable non-communist regimes? Not really, though it is fast approaching Taiwan in all of these measures (Chart 3). Chart 2Communist States Get Rich By Compromising Their Communism
China’s Communist Party Turns 100: So What?
China’s Communist Party Turns 100: So What?
Chart 3China Catching Up To Cuba On Basic Wellbeing
China’s Communist Party Turns 100: So What?
China’s Communist Party Turns 100: So What?
What can be said for certain is that, since China’s 1979 reform and opening up, the CPC has avoided many errors and catastrophes. It survived the 1980s, 1990s, and 2000s without succumbing to international isolation, internal divisions, or economic crisis. It has drastically increased its share of global power (Table 1). Contrast this global ascent with the litany of mistakes and crises in the US since the year 2000. The CPC also managed the past decade relatively well despite the Chinese financial turmoil of 2015-16, the US trade war of 2018-19, and the COVID-19 pandemic. However, these events hint at greater challenges to come. China’s transition to a consumer-oriented economy has hardly begun. The struggle to manage systemic financial risk is intensifying today at risk to growth and stability (Chart 4). The trade war is simmering despite the Phase One trade deal and the change of party in the White House. And it is too soon to draw conclusions about the impact of the global pandemic, though China suppressed the virus more rapidly than other countries and led the world into recovery. Table 1China’s Global Rise After ‘Reform And Opening Up’
China’s Communist Party Turns 100: So What?
China’s Communist Party Turns 100: So What?
Chart 4China To Keep Struggling With Financial Instability
China To Keep Struggling With Financial Instability
China To Keep Struggling With Financial Instability
Judging by the points above, there are two significant risks on the horizon. First, the CPC’s revival of neo-Maoist ideology, particularly the new economic mantra of self-reliance and “dual circulation” (import substitution), poses the risk of closing the economy and undermining productivity.2 Second, China’s sliding back into the rule of a single person – after the “consensus rule” that prevailed after Deng Xiaoping – increases the risk of unpredictable decision-making and a succession crisis whenever General Secretary Xi Jinping steps down. The party’s internal logic holds that China’s economic and geopolitical challenges are so enormous as to require a strongman leader at the helm of a single-party and centralized state. But because of the traditional problems with one-man rule, there is no guarantee that the country will remain as stable as it has been over the past 42 years. Slowing Growth Drives Clash With Foreign Powers Every major East Asian economy has enjoyed a “miracle” phase of growth – and every one of them has seen this phase come to an end. Now it is China’s turn. The country’s potential GDP growth is slowing as the population peaks, the labor force shrinks, wages rise, and companies outsource production to cheaper neighbors (Charts 5A & 5B). The Communist Party is attempting to reverse the collapse in the fertility rate by shifting from its historic “one Child policy,” which sharply reduced births. It shifted to a two-child policy in 2016 and a three-child policy in 2021 but the results have not been encouraging over the past five years. Chart 5AChina’s Demographic Decline Accelerating
China’s Communist Party Turns 100: So What?
China’s Communist Party Turns 100: So What?
Chart 5BChina’s Demographic Decline Accelerating
China’s Communist Party Turns 100: So What?
China’s Communist Party Turns 100: So What?
In the best case China’s growth will follow the trajectory of Taiwan and South Korea, which implies at most a 6% yearly growth rate over the next decade (Chart 6). This is not too slow but it will induce financial instability as well as hardship for overly indebted households, firms, and local governments. Chart 6China's Growth Rates Will Converge With Taiwan, South Korea
China's Growth Rates Will Converge With Taiwan, South Korea
China's Growth Rates Will Converge With Taiwan, South Korea
The Communist Party’s legitimacy was not originally based on rapid economic growth but it came to be seen that way over the roaring decades of the 1980s through the 2000s. Thus when the Great Recession struck the party had to shift the party’s base of legitimacy. The new focus became quality of life, as marked by the Xi administration’s ongoing initiatives to cut back on corruption, pollution, poverty, credit excesses, and industrial overcapacity while increasing spending on health, education, and society (Chart 7). Chart 7China’s Fiscal Burdens Will Rise On Social Welfare Needs
China’s Communist Party Turns 100: So What?
China’s Communist Party Turns 100: So What?
The party’s efforts to improve standards of living and consumer safety also coincided with an increase in propaganda, censorship, and repression to foreclose political dissent. The country falls far short in global governance indicators (Chart 8). Chart 8China Lags In Governance, Rule Of Law
China’s Communist Party Turns 100: So What?
China’s Communist Party Turns 100: So What?
A second major new source of party legitimacy is nationalist foreign policy. China adopted a “more assertive” foreign and trade policy in the mid-2000s as its import dependencies ballooned. It helped that the US was distracted with wars of choice and financial crises. After the Great Recession the CPC’s foreign policy nationalism became a tool of generating domestic popular support amid slower economic growth. This was apparent in the clashes with Japan and other countries in the East and South China Seas in the early 2010s, in territorial disputes with India throughout the past decade, in political spats with Norway and most recently Australia, and in military showdowns over the Korean peninsula (2015-16) and today the Taiwan Strait (Chart 9). Chart 9Proxy Wars A Real Risk In China’s Periphery
China’s Communist Party Turns 100: So What?
China’s Communist Party Turns 100: So What?
If China were primarily focused on foreign policy and global strategy then it would not provoke multiple neighbors on opposite sides of its territory at the same time. This is a good way to motivate the formation of a global balance-of-power coalition that can constrain China in the coming years. But China’s outward assertiveness is not driven primarily by foreign policy considerations. It is driven by the secular economic slowdown at home and the need to use nationalism to drum up domestic support. This is why China seems indifferent to offending multiple countries at once (like India and Australia) as well as more distant trade partners whom it “should be” courting rather than offending (like Europe). Such assertive foreign policy threatens to undermine quality of life, namely by provoking international protectionism and sanctions on trade and investment. The US is galvanizing a coalition of democracies to put pressure on China over its trade practices and human rights. The Asian allies are mostly in step with the US because they fear China’s growing clout. The European states do not have as much to fear from China’s military but they do fear China’s state-backed industry and technological rise. Europe’s elites also worry about anti-establishment political movements just like American elites and therefore are trying to win back the hearts and minds of the working class through a more proactive use of fiscal and industrial policy. This entails a more assertive trade policy. China has so far not adapted to the potential for a unified front among the democracies, other than through rhetoric. Thus the international horizon is darkening even as China’s growth rates shift downward. China’s Geopolitical Outlook Is Dimming China’s government has overcome a range of challenges and crises. The country takes an ever larger role in global trade despite its falling share of global population because of its productivity and competitiveness. The drop in China’s outward direct investment is tied to the global pandemic and may not mark a top, given that the country will still run substantial current account surpluses for the foreseeable future and will need to recycle these into natural resources and foreign production (Chart 10). However, the limited adoption of the renminbi as a reserve currency in the face of this formidable commercial power reveals the world’s reservations about Beijing’s ability to maintain macroeconomic stability, good governance, and peaceful foreign relations. Chart 10China's Rise Continues
China's Rise Continues
China's Rise Continues
Chart 11China's Policy Uncertainty: A Structural Uptrend
China's Policy Uncertainty: A Structural Uptrend
China's Policy Uncertainty: A Structural Uptrend
China is not in a position to alter the course of national policy dramatically prior to the Communist Party’s twentieth national congress in 2022. The Xi administration is focused on normalizing monetary and fiscal policy and heading off any sociopolitical disturbances prior to that critical event, in which General Secretary Xi Jinping, who was originally slated to step down at this time according to the old rules, may be anointed the overarching “chairman” position that Mao Zedong once held. The seventh generation of Chinese leaders will be promoted at this five-year rotation of the Central Committee and will further consolidate the Xi administration’s grip. It will also cement the party’s rotation back to leaders who have ideological educations, as opposed to the norm in the 1990s and early 2000s of promoting leaders with technocratic skills and scientific educations.3 This does not mean that President Xi will refuse to hold a summit with US President Biden in the coming months nor does it mean that US-China strategic and economic dialogue will remain defunct. But it does mean that Beijing is unlikely to make any major course correction until after the 2022 reshuffle – and even then a course correction is unlikely. China has taken its current path because the Communist Party fears the sociopolitical consequences of relinquishing economic control just as potential growth slows. The new ruling philosophy holds that the Soviet Union fell because of Mikhail Gorbachev’s glasnost and perestroika, not because openness and restructuring came too late. Moreover it is far from clear that the US, Europe, and other democratic allies will apply such significant and sustained pressure as to force China to change its overall strategy. America is still internally divided and its foreign policy incoherent; the EU remains reactive and risk-averse. China has a well-established set of strategic goals for 2035 and 2049, the 100th anniversary of the People’s Republic, and the broad outlines will not be abandoned. The implication is that tensions with the US and China’s Asian neighbors will persist. Rising policy uncertainty is a secular trend that will pick back up sooner rather than later (Chart 11), to the detriment of a stable and predictable investment environment. Chart 12Chinese Government’s Net Worth High But Hidden Liabilities Pose Risks
China’s Communist Party Turns 100: So What?
China’s Communist Party Turns 100: So What?
Monetary and fiscal dovishness and a continued debt buildup are the obvious and necessary solutions to China’s combination of falling growth potential, rising social liabilities, the need to maintain the rapid military buildup in the face of geopolitical challenges. Sovereign countries can amass vast debts if they own their own debt and keep nominal growth above average bond yields. China’s government has a very favorable balance sheet when national assets are taken into consideration as well as liabilities, according to the IMF (Chart 12). On the other hand, China’s government is having to assume a lot of hidden liabilities from inefficient state-owned companies and local governments. In the short run there are major systemic financial risks even though in the long run Beijing will be able to increase its borrowing and bail out failing entities in order to maintain stability, just like Japan, the US, and Europe have had to do. The question for China is whether the social and political system will be able to handle major crises as well as the US and Europe have done, which is not that well. Investment Takeaways The rule of a single party is not a bar to economic success – but the rule of a single person is a liability due to the problem of succession. Marxism-Leninism is terrible for productivity unless it is compromised to allow for markets to operate, as in China and Vietnam. States that close their economies to the outside world usually atrophy. There is no compelling evidence that China’s Communist Party has performed better than a non-communist alternative would have done, given the province of Taiwan’s superior performance on most economic indicators. Since 1979, the Communist Party has avoided catastrophic errors. It has capitalized on domestic economic potential and a favorable international environment. Now, in the 2020s, both of these factors are changing for the worse. China’s “miracle” phase of growth has expired, as it did for other East Asian states before it. The maturation of the economy and slowdown of potential GDP have forced the Communist Party to shift the base of its political legitimacy to something other than rapid income growth: namely, quality of life and nationalist foreign policy. An aggressive foreign policy works against quality of life by provoking protectionism from foreign powers, particularly the United States, which is capable of leading a coalition of states to pressure China. The Communist Party’s policy trajectory is unlikely to change much through the twentieth national party congress in 2022. After that, a major course correction to improve relations with the West is conceivable, though we would not bet on it. Between 2021 and China’s 2035 and 2049 milestones, the Communist Party must navigate between rising socioeconomic pressures at home and rising geopolitical pressures abroad. An economic or political breakdown at home, or a total breakdown in relations with the US, could lead to proxy wars in China’s periphery, including but not limited to the Taiwan Strait. For now, global investors should favor the euro and US dollar over the renminbi (Chart 13). Chart 13Prefer The Dollar And Euro To The Renminbi
Prefer The Dollar And Euro To The Renminbi
Prefer The Dollar And Euro To The Renminbi
Mainland investors should favor government bonds relative to stocks. Chinese stocks hit a major peak earlier this year and the government’s seizure of control over the tech sector is taking a toll. Investors should prefer developed market equities relative to Chinese equities until China’s current phase of policy tightening ends and there is at least a temporary improvement in relations with the United States. But investors should also prefer Chinese and Hong Kong stocks relative to Taiwanese due to the high risk of a diplomatic crisis and the tail risk of a war. Matt Gertken Vice President Geopolitical Strategy mattg@bcaresearch.com Footnotes 1 The report concluded, “the emerging trends suggest a likely break from Deng's position toward heavier state intervention in the economy, more contentious relationships with neighbors, and a Party that rules primarily through ideology and social control.” Co-written with Jennifer Richmond, "China and the End of the Deng Dynasty," Stratfor, April 19, 2011, worldview.stratfor.com. 2 The Xi administration’s new concept of “dual circulation” entails that state policy will encourage the domestic economy whereas the international economy will play a secondary role. This is a reversal of the outward and trade-oriented economic model under Deng Xiaoping. See “Xi: China’s economy has potential to maintain long-term stable development,” November 4, 2020, news.cgtn.com. 3 See Willy Wo-Lap Lam, "China’s Seventh-Generation Leadership Emerges onto the Stage," Jamestown Foundation, China Brief 19:7, April 9, 2019, Jamestown.org.
Highlights New variants of SARS-Cov-2 will create new waves of infection, the inflation bubble is bursting, and massive slack in the US labour market will keep US inflation structurally subdued. The coming years will be defined by a trifecta of surging productivity, massive slack in the labour market, and ultra-low inflation. Overweight US T-bonds both tactically and structurally. Equity investors should overweight growth versus value… …overweight defensives versus cyclicals… …overweight the US versus the euro area… …and overweight DM versus EM, both tactically and structurally. Tactically underweight US REITS. Tactically overweight Nike versus L’Oréal. Feature Chart of the WeekThe Global Pandemic Is Still In Flow
Viral Variants Strike Down The Reflation Trade
Viral Variants Strike Down The Reflation Trade
The UK will have to wait for its ‘freedom day.’ Lifting the remaining pandemic-related restrictions has been postponed because a new and more vaccine-resistant ‘delta’ variant of the virus is threatening to unleash a third wave of UK infections. The UK experience is important because it was the first major developed economy to roll out its mass vaccination program. Thereby, the UK experience could be the harbinger of things to come in other major economies like the US and the euro area. Vaccines Against RNA Viruses Are Not Highly Effective The general public and financial markets have high expectations that mass vaccination programs can banish Covid forever. Such expectations are unrealistic, just as it is unrealistic to expect vaccinations to banish the flu forever. It is unrealistic to expect vaccinations to banish Covid forever. Covid, the flu, and measles are all diseases caused by ‘RNA viruses.’ The defining characteristic of RNA viruses is their poor proofreading ability during replication, resulting in high rates of mutation. The resulting variant strains make RNA viruses highly effective at evading vaccinations. As the Journal of Immunology Research puts it:1 “No vaccine or specific treatment is available for many of these RNA viruses and some of the available vaccines and treatments are not highly effective.” Measles is an exception because its virus is ‘antigenically monotypic.’ The spike proteins (antigens) that the measles virus uses to infect a cell cannot mutate even slightly without breaking. However, the SARS-CoV-2 spike proteins can mutate and still infect. This we know because the virus has already evolved several infectious variants – including the latest delta variant – with increasing abilities to evade the current spike-based vaccines (Figure I-1). Figure I-1How Variants Of SARS-CoV-2 Evade Spike-Based Vaccines
Viral Variants Strike Down The Reflation Trade
Viral Variants Strike Down The Reflation Trade
SARS-Cov-2 doesn’t care who it infects or in which country they live. Sadly, the pandemic has claimed more fatalities in the first half of 2021 than in the whole of 2020 (Chart of the Week). And the virus will continue to mutate liberally given that its reproduction rate is still close to 1 (Chart I-2). Chart I-2The Reproduction Rate Is Still Close To 1
Viral Variants Strike Down The Reflation Trade
Viral Variants Strike Down The Reflation Trade
Crucially, the mutations of the virus that evade vaccinations are the ones that are more likely to spread and become the new dominant strains. After the delta variant will come the epsilon variant, the zeta variant, the eta variant… and so on until we run out of Greek alphabet. In which case, should we just adopt the same strategy for Covid as we use for the seasonal flu – remove all pandemic-related restrictions, while offering booster vaccinations to the most medically vulnerable once or twice a year? There are two problems with this strategy: First, it could still overwhelm our healthcare systems during surges in demand. This we know because a bad flu season, by itself, was already pushing some healthcare systems to the limit. There is very little spare capacity to cope with additional demand. Second, unlike the flu, Covid appears to have long-term sequelae, colloquially called ‘long Covid’ with unknown chronic damage to health. As the Lancet points out: “Long-term sequelae of Covid-19 are unknown… we owe good answers on the long-term consequences of the disease to our patients and healthcare providers” Without these answers, policymakers cannot adopt the same strategy for Covid as for the flu. So yes, we can certainly offer vaccinations to the most medically vulnerable once or twice a year. But managing infections will also require non-pharmaceutical interventions, dialled up and down based on the severity of future waves of infection. A Productivity Super-Boom Is Coming Periodic non-pharmaceutical interventions which include restrictions to national and international movement will be around for much longer than the general public and financial markets expect. This will solidify a more remote way of working, shopping, interacting, and doing business. The good news is that this will create the mother of all productivity booms. Productivity tends to surge after every recession. This is because the period immediately after a recession is when the economy experiences the most intensive clearing out of dead wood, restructuring of capital and labour, and absorption of new technologies and ways of working. The pandemic has forced nearly every company and every worker to adopt new technologies and ways of working and living. But whereas most recessions upend one or two sectors of the economy, the pandemic has upended all sectors – forcing nearly every company and every worker to adopt new technologies and ways of working and living. This will make the pandemic productivity boom a super-boom unlike anything experienced in recent history (Chart I-3). Chart I-3The Pandemic Productivity Boom Will Be A Super-Boom
Viral Variants Strike Down The Reflation Trade
Viral Variants Strike Down The Reflation Trade
The unfortunate corollary of this productivity super-boom is that the pace of absorption of the excess unemployed and inactive will be slower, meaning that it will take a long time to reach the goal of ‘full employment’ (Chart I-4). Chart I-4It Will Take A Long Time To Reach 'Full Employment'
Viral Variants Strike Down The Reflation Trade
Viral Variants Strike Down The Reflation Trade
In the US, the Federal Reserve is acutely aware of this. As Jay Powell has pointed out: “It’s going to be a different economy. We’ve been hearing a lot from companies looking at deploying better technology and perhaps fewer people, including in some of the services industries that have been employing a lot of people. It seems quite likely that a number of the people who had those service sector jobs will struggle to find the same job, and may need time to find work” Without full employment, it will be difficult to maintain US inflation at or above the Fed’s 2 percent target. The transmission mechanism is that the (permanent) unemployment rate establishes the ability to pay rent. Thereby, it is the main driver of ‘rent of shelter’, which comprises almost half of the core consumer price index. Empirically, unless rent of shelter inflation gets to 3 percent and remains there, it will be very difficult for core inflation to remain at over 2 percent (Chart I-5 and Chart I-6). For reference, rent of shelter inflation is now running well short of 3 percent, at 2.2 percent. Chart I-5Full Employment Is Needed To Lift Rent Inflation To 3 Percent...
Viral Variants Strike Down The Reflation Trade
Viral Variants Strike Down The Reflation Trade
Chart I-6...And Rent Inflation At 3 Percent Is Needed To Keep Core Inflation At 2 Percent
Viral Variants Strike Down The Reflation Trade
Viral Variants Strike Down The Reflation Trade
In a nutshell, the coming years will be defined by a trifecta of surging productivity, massive slack in the labour market, and ultra-low inflation. Overweight Growth, And Overweight The US Given that new variants of the virus will create new waves of infection, that The Inflation Bubble Will Burst, and that the massive slack in the labour market will keep inflation structurally subdued, investors should own US T-bonds both tactically and structurally. There is massive slack in the US labour market. Furthermore, The Pareto Principle Of Investment tells us that if you get the direction of the bond yield right, you will get your whole investment strategy right. Declining bond yields boost growth stocks. This is because the ‘net present value’ of cashflows that are weighted deep into the future are highly leveraged to a falling discount rate. In addition, the productivity super-boom will be facilitated by technology and new economy sectors. As such, equity investors should avoid value, and steer towards growth, both tactically and structurally (Chart I-7). This extends to overweighting defensives versus cyclicals, overweighting the growth-heavy US versus the value-heavy euro area, and so on. In effect, all these positions are just one massive correlated trade (Charts I-8-Chart I-11). Chart I-7Structurally Overweight Growth Versus Value
Viral Variants Strike Down The Reflation Trade
Viral Variants Strike Down The Reflation Trade
Chart I-8Correlated Trades: Bond Price, Growth Versus Value...
Viral Variants Strike Down The Reflation Trade
Viral Variants Strike Down The Reflation Trade
Chart I-9...Tech Versus ##br##Market...
Viral Variants Strike Down The Reflation Trade
Viral Variants Strike Down The Reflation Trade
Chart I-10...Defensive Versus Cyclical...
Viral Variants Strike Down The Reflation Trade
Viral Variants Strike Down The Reflation Trade
Chart I-11...And US Versus Euro Area
Viral Variants Strike Down The Reflation Trade
Viral Variants Strike Down The Reflation Trade
These sector preferences also imply an overweight to developed markets (DM) versus emerging markets (EM). Tactically Underweight US REITS, And Tactically Overweight Nike Versus L’Oréal Finally, and corroborating the preceding sections, the rally in ‘reopening plays’ has become fractally fragile. One way to play this tactically is to underweight US REITS (Chart I-12). Chart I-12'Reopening Plays' Are Fractally Fragile: US REITS
Viral Variants Strike Down The Reflation Trade
Viral Variants Strike Down The Reflation Trade
But our preferred tactical expression is to overweight Nike versus L’Oréal (Chart I-13), setting the profit target and symmetrical stop-loss at 9 percent. Chart I-13'Reopening Plays' Are Fractally Fragile: L'Oreal Versus Nike
Viral Variants Strike Down The Reflation Trade
Viral Variants Strike Down The Reflation Trade
Dhaval Joshi Chief Strategist dhaval@bcaresearch.com Footnotes 1 Journal of Immunology Research, Volume 218: Immune Responses to RNA Viruses, by Elias A. Said Fractal Trading System Fractal Trades 6-Month Recommendations Structural Recommendations Closed Fractal Trades Closed Trades Asset Performance Equity Market Performance Indicators To Watch - Bond Yields Chart II-1Indicators To Watch - Bond Yields - Euro Area
Viral Variants Strike Down The Reflation Trade
Viral Variants Strike Down The Reflation Trade
Chart II-2Indicators To Watch - Bond Yields - Europe Ex Euro Area
Viral Variants Strike Down The Reflation Trade
Viral Variants Strike Down The Reflation Trade
Chart II-3Indicators To Watch - Bond Yields - Asia
Viral Variants Strike Down The Reflation Trade
Viral Variants Strike Down The Reflation Trade
Chart II-4Indicators To Watch - Bond Yields - Other Developed
Viral Variants Strike Down The Reflation Trade
Viral Variants Strike Down The Reflation Trade
Indicators To Watch - Interest Rate Expectations Chart II-5Indicators To Watch - Interest Rate Expectations
Viral Variants Strike Down The Reflation Trade
Viral Variants Strike Down The Reflation Trade
Chart II-6Indicators To Watch - Interest Rate Expectations
Viral Variants Strike Down The Reflation Trade
Viral Variants Strike Down The Reflation Trade
Chart II-7Indicators To Watch - Interest Rate Expectations
Viral Variants Strike Down The Reflation Trade
Viral Variants Strike Down The Reflation Trade
Chart II-8Indicators To Watch - Interest Rate Expectations
Viral Variants Strike Down The Reflation Trade
Viral Variants Strike Down The Reflation Trade
Dear Client, Next week, in lieu of our regular weekly report, I will be hosting two webcasts where I will discuss the outlook for China’s economy and financial markets, a year into policy normalization. The webcasts will be held on Tuesday, June 22 at 10:00 am EDT (English), and Thursday, June 24 at 9:00 am HKT (Mandarin). We will return to our regular publishing schedule on Wednesday, June 30. Best regards, Jing Sima, China Strategist Feature China’s onshore stocks rebounded in the past two months on the back of a rapidly appreciating RMB versus the US dollar and accelerating foreign capital inflows (Chart 1). However, in our view, China’s domestic policy backdrop and economic fundamentals do not support a sustained rally in Chinese stocks in the next six months. The RMB’s rise vis-à-vis the US dollar will likely falter in the second half of the year as China’s growth weakens. A narrowing in real yields later this year between China’s government bonds and US Treasuries will also discourage foreign flows into Chinese assets. Performance of Chinese cyclical stocks versus defensives failed to decisively breakout in both the onshore and offshore equity markets. An underperformance in cyclical stocks relative to defensives has historically pointed to waning market sentiment towards the Chinese economy (Chart 2). Chart 1Rapid Appreciation In The RMB Buoyed A Recent Rebound In A-Shares
Rapid Appreciation In The RMB Buoyed A Recent Rebound In A-Shares
Rapid Appreciation In The RMB Buoyed A Recent Rebound In A-Shares
Chart 2Cyclical Stocks Continued To Underperform Defensives
Cyclical Stocks Continued To Underperform Defensives
Cyclical Stocks Continued To Underperform Defensives
The number of onshore stocks with prices rising versus falling remains low, even though there has been a slight improvement this year from Q4 2020. The narrow breath in the equity market implies that recent rebound in A-share stocks has been largely driven by a handful of companies (Chart 3). Such narrow breadth suggests that the rebound in Chinese stock prices will not sustain (Chart 4). Chart 3A Narrow-Based Market Rally in A-Shares
A Narrow-Based Market Rally in A-Shares
A Narrow-Based Market Rally in A-Shares
Chart 4Narrowing Market Breadth Has Historically Led To Price Pullbacks
Narrowing Market Breadth Has Historically Led To Price Pullbacks
Narrowing Market Breadth Has Historically Led To Price Pullbacks
A tightened monetary and credit environment has created obstacles for Chinese equities since early this year. Credit numbers released last week show that credit growth deceleration has gathered speed in May, raising the risk of policy overtightening, i.e. credit growth undershooting the government’s 2021 targets. We could see some moderation in the credit growth deceleration into 2H21. A delay in the rollout of local government (LG) bonds and LG special purpose bonds (SPBs) in the first five months of the year means the pace of LG bond issuance between June and October will escalate, which will help to stabilize credit growth. However, weak corporate bond net financing and contracting shadow banking will cap the upside in credit expansion. Chart 5The Economy Could Surprise The Market To The Downside In Q3
The Economy Could Surprise The Market To The Downside In Q3
The Economy Could Surprise The Market To The Downside In Q3
Additionally, if more LG bonds come onto the market in Q3, then we could see tighter interbank liquidity conditions and higher bond yields. This, in turn, would partially offset the positive effects on the economy and equity market from a slower pace in credit growth deceleration. For the next six months, we continue to hold an underweight position in Chinese onshore and investable stocks, in both absolute terms and within a global equity portfolio. Policy tightening has not reversed course and there is an escalating risk that economic data will surprise the market to the downside in Q3 (Chart 5). Qingyun Xu, CFA Associate Editor qingyunx@bcaresearch.com Macro Policy Conditions Are Still Unfavorable For Risk Assets A further deterioration in the credit impulse in May reflects Chinese authorities’ efforts to reduce local government leverage and shadow banking activities. Net corporate bond financing contracted for the first time since early 2018, driven by shrinking local government financing vehicle (LGFV) bonds (Chart 6). Meanwhile, the pace of contraction in shadow-bank loans climbed. At this rate of deceleration, credit growth will undershoot the government’s 2021 target, which is expected to be in line with this year’s nominal GDP growth. The pace in credit expansion on a year-over-year basis has dropped to its previous cycle’s trough (Chart 7). Moreover, the speed of the deceleration in credit growth has outpaced the 2017/18 tightening cycle. It has been seven months since Chinese credit growth peaked (October 2020), which is significantly less than the 13 months it took for credit to decline from top to bottom in 2017/18. Chart 6Contraction In Net Corporate Bond Financing And Shadow Banking Dragged Down Credit Growth In May
Contraction In Net Corporate Bond Financing And Shadow Banking Dragged Down Credit Growth In May
Contraction In Net Corporate Bond Financing And Shadow Banking Dragged Down Credit Growth In May
Chart 7Credit Growth Has Decelerated To Its Trough Reached In 2017/18 Tightening Cycle
Credit Growth Has Decelerated To Its Trough Reached In 2017/18 Tightening Cycle
Credit Growth Has Decelerated To Its Trough Reached In 2017/18 Tightening Cycle
Chart 8Most Of LG Bonds Issued In The First Five Months Are Refinancing Bonds
The Stars Are Not Yet Aligned For Chinese Stocks
The Stars Are Not Yet Aligned For Chinese Stocks
So far this year, LG bond issuance is also behind schedule. About 63% of LG bonds issued in the first five months are refinancing bonds (Chart 8). The new LG bonds and LG SPBs issued to date account for only 21% and 16.5%, respectively, of their 2021 quotas. A delay in LG bond issuance in the first five months means that much more bonds will be on the market between June and October, which may help to stabilize credit growth in Q3. However, weak corporate bond financing and an acceleration in contracting shadow banking activities will cap the upside on broad credit. We do not expect a reversal in policy tightening. Instead, credit growth will likely hover near current levels for the rest of the year. In the past, Chinese policymakers eased when the global manufacturing backdrop faltered. Given that global growth is robust, Chinese policymakers will not feel any urgency to reverse policy setting and will likely use the strong external environment as an opportunity for domestic deleveraging. Chinese Exports Will Face Challenges In The Second Half Of The Year Chart 9A Broad-Based Moderation In China's Exports to DMs
A Broad-Based Moderation In China's Exports to DMs
A Broad-Based Moderation In China's Exports to DMs
Export growth slowed in May with a broad-based moderation in the country’s exports to developed markets (DMs), albeit from a very elevated level (Chart 9). The easing in exports reflects an ongoing demand shift in the DMs away from goods to services as economic activity normalizes (Chart 10). China’s robust exports, which have been driven by strong and partly pandemic-induced global demand for goods, will likely gradually lose strength in the second half of the year. China’s weakening new export orders component in the May manufacturing PMI reflects this trend (Chart 11). Chart 10Global Consumption Recovery In Services Will Likely Outpace Goods
Global Consumption Recovery In Services Will Likely Outpace Goods
Global Consumption Recovery In Services Will Likely Outpace Goods
Chart 11China's Softening New Export Orders Signal Further Export-Sector Weakness
China's Softening New Export Orders Signal Further Export-Sector Weakness
China's Softening New Export Orders Signal Further Export-Sector Weakness
An appreciating RMB versus the US dollar is also a headwind for Chinese exports. The USD/CNY historically has led Chinese new export orders by around six months, with the exception of the pandemic-hit outlier in 2020 (Chart 12). The recent sharp RMB appreciation is starting to weight on Chinese exports. Moreover, BCA’s Geopolitical strategists do not expect that China will principally benefit from US President Biden’s $2.4 trillion infrastructure and green energy plan . US explicitly aims to diminish China’s role as a supplier of US goods and materials. The widening divergence between US’s trade deficit with China and the rest of world already shows evidence (Chart 13). Chart 12The RMB's Rapid Rise Creates Headwinds For Chinese Exports
The RMB's Rapid Rise Creates Headwinds For Chinese Exports
The RMB's Rapid Rise Creates Headwinds For Chinese Exports
Chart 13China's Exports May Not Benefit From Biden's Infrastructure Plan
China's Exports May Not Benefit From Biden's Infrastructure Plan
China's Exports May Not Benefit From Biden's Infrastructure Plan
Still No Inflation Pass-Through Chart 14Chinese Producers Are Unable To Pass Rising Input Costs On To Consumers
Chinese Producers Are Unable To Pass Rising Input Costs On To Consumers
Chinese Producers Are Unable To Pass Rising Input Costs On To Consumers
Chinese surging producer prices overstate domestic inflationary pressures. Inflation in the Producer Price Index (PPI) surged by 9.0% year-over-year in May, jumping to its highest level since 2009. High PPI inflation reflects rising commodity prices and a low base effect. Meanwhile, inflationary pressures are much more muted for consumer goods and services. The gap between producer and consumer prices widened to the highest level since 1990, highlighting the absence of price inflation pass-through from producers to consumers (Chart 14). We expect soaring PPI inflation to be transitory; it will ease when low-base factors from last year and global supply constraints are removed later this year. CPI inflation will remain tame through the year. As such, Chinese authorities are unlikely to tighten monetary policy in response to high PPI readings. Instead, Beijing will continue to use regulatory measures to curb speculation in the commodity market and window-guide industries to readjust material inventories to help ease the pace of rising commodity prices. Historically, PPI inflation’s impact on consumer prices has been weak when prices on producer goods were pushed up by supply shocks rather than mounting domestic demand. The sharp uptick in the PPI during the 2017/18 cycle was mostly due to China’s supply-side reforms and a rapid consolidation in the upstream industries. Global supply constraints linked to the pandemic have also resulted in a sharp upturn in the Chinese PPI since mid-2020. Moreover, Chart 15 shows that the pass-through from PPI inflation to consumers is closely correlated to household income growth. The pass-through has weakened significantly since 2011 when household income growth subdued along with a declining Chinese working population (Chart 16). Chart 15Subdued Household Income Growth Since 2011 Has Suppressed CPI Inflation
Subdued Household Income Growth Since 2011 Has Suppressed CPI Inflation
Subdued Household Income Growth Since 2011 Has Suppressed CPI Inflation
Chart 16Income Growth Decelerated After China's Working Population Peaked
Income Growth Decelerated After China's Working Population Peaked
Income Growth Decelerated After China's Working Population Peaked
Chart 17Profits Diverged Between Upstream And Mid & Downstream Industries
The Stars Are Not Yet Aligned For Chinese Stocks
The Stars Are Not Yet Aligned For Chinese Stocks
Lacking inflation pass-through from producers to consumers has led to a bifurcated profit recovery between upstream and mid & downstream industries. Since late last year, the share of upstream industries in total profits increased sharply at the expense of mid and downstream businesses (Chart 17). A deterioration in the profits of mid and downstream industries will weigh on the outlook for their capex, which in turn, will reduce the demand for upstream goods. Domestic Demand Remains China’s Weakest Link Investments and household demand remain the weakest links in China’s economy. Sluggish household consumption reflects a fragile post-pandemic recovery in manufacturing and services employment, and a rising propensity for precautionary savings (Chart 18). A PBoC survey shows that households’ preference for more saving deposits soared in 2020 (Chart 19). Although it has slightly diminished since late 2020, the reading is still much higher than its pre-pandemic level and will likely persist to year-end on the back of a subdued outlook for employment and income. Chart 18Weak Employment In Both Manufacturing And Service Industries
Weak Employment In Both Manufacturing And Service Industries
Weak Employment In Both Manufacturing And Service Industries
Chart 19Propensity For Precautionary Savings Is Still Elevated
Propensity For Precautionary Savings Is Still Elevated
Propensity For Precautionary Savings Is Still Elevated
Manufacturing investment continued its rebound in April, but the growth has not rallied to its pre-pandemic state and the recovery was more than offset by falling old-economy infrastructure and real estate investment growth (Chart 20). Although a pickup in LG SPB issuance in Q3 will provide some support to infrastructure expenditures, the effect on aggregate infrastructure investment probably will be muted. China’s Ministry of Finance has raised the requirements for approvals of new investment projects, which have decreased notably since early this year (Chart 21). Hence, growth in infrastructure investment may not significantly improve in 2H21 without a harmonized policy impetus for more bank loans and loosened regulations on local government spending. Chart 20Recovery In Manufacturing Investment Was More Than Offset By Falling Infrastructure And Real Estate Investment Growth
Recovery In Manufacturing Investment Was More Than Offset By Falling Infrastructure And Real Estate Investment Growth
Recovery In Manufacturing Investment Was More Than Offset By Falling Infrastructure And Real Estate Investment Growth
Chart 21Falling New Projects Approval
Falling New Projects Approval
Falling New Projects Approval
Real Estate Sector: Mounting Deleverage Pressure Property developers face challenges from heightened government scrutiny on bank loans and limits on the sector’s leverage ratio, along with curtailed off-balance sheet funding due to Asset Management Regulation (AMR) . Bank loans to real estate developers and household mortgages have tumbled to historical lows and will likely slow further in the next few months (Chart 22, top panel). The tightened financing policies have started to cool demand in the real estate market (Chart 22, bottom panel). Softer housing demand will start to drag down property developers’ capital spending and real estate construction activities (Chart 23). Chart 22Deteriorating Financing Starting To Cool The Property Market
Deteriorating Financing Starting To Cool The Property Market
Deteriorating Financing Starting To Cool The Property Market
Chart 23Real Estate Investments And Construction Activities May Slow Further
Real Estate Investments And Construction Activities May Slow Further
Real Estate Investments And Construction Activities May Slow Further
Table 1China Macro Data Summary
The Stars Are Not Yet Aligned For Chinese Stocks
The Stars Are Not Yet Aligned For Chinese Stocks
Table 2China Financial Market Performance Summary
The Stars Are Not Yet Aligned For Chinese Stocks
The Stars Are Not Yet Aligned For Chinese Stocks
Footnotes Cyclical Investment Stance Equity Sector Recommendations
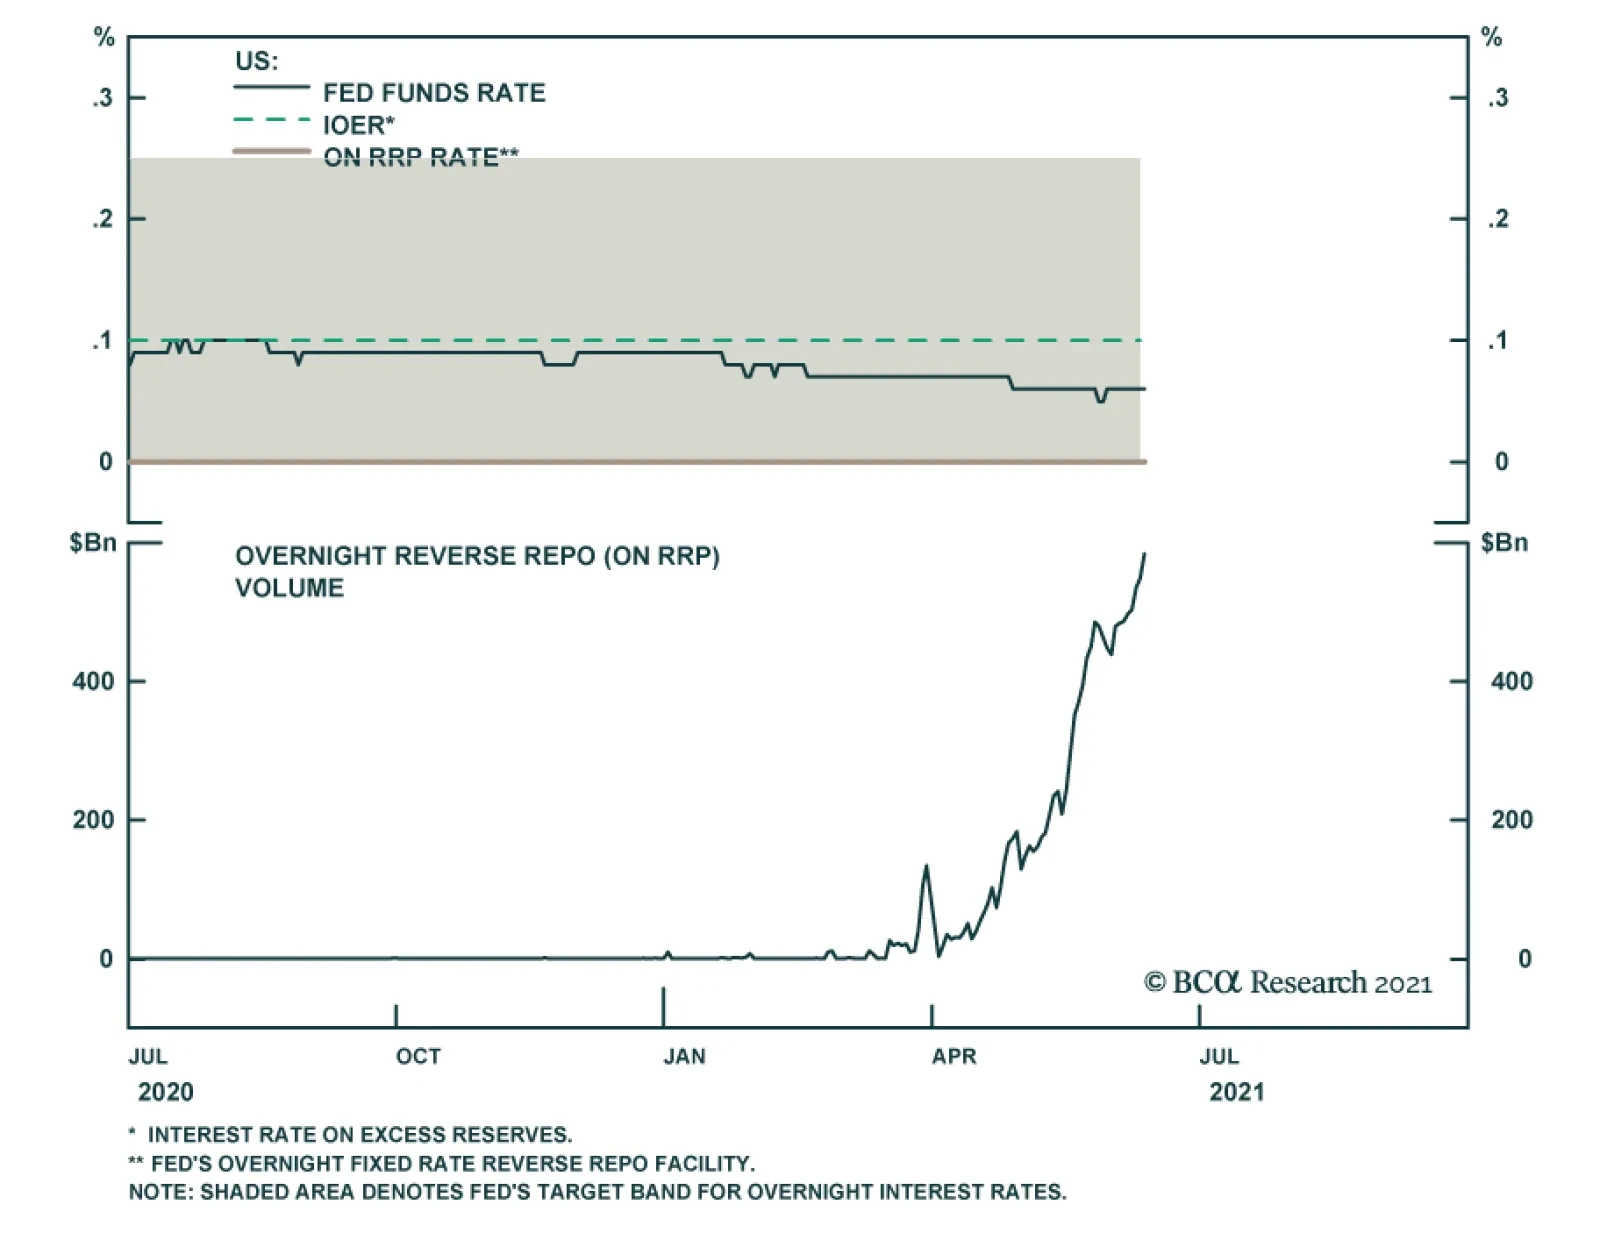
BCA Research’s US Bond Strategy service sees no implications for the Fed’s balance sheet or interest rate policies stemming from the recent uptick in ON RRP usage. The increased take-up of the ON RRP is a sign that the Fed’s operational strategy is working…
Highlights Economy – We think the current hiring logjam will prove to be temporary: Once schools fully re-open for in-person learning in August and September and enhanced unemployment benefits expire, restraints on labor supply should ease. Markets – We expect that employment will rebound quickly enough to support an initial rate hike in 2022, ahead of the bond market’s current expectations: Liftoff expectations will have to be pulled forward if nonfarm payrolls return to their pre-pandemic peak before the end of 2022. Strategy – Remain underweight duration to stay ahead of a repricing of Fed tightening: Rates may continue to consolidate or edge lower in the near term, but we still see them rising over the next twelve months. Feature The state of the labor market is the key uncertainty for US macro observers. Although the headline unemployment rate has come down nine percentage points from its 14.8% peak, retracing nearly 80% of its sudden increase, it overstates the healing that has occurred. 22 million people, or nearly 15% of employees, lost work in March and April 2020. Two-thirds of those jobs have been recovered, but 5% fewer Americans are employed now than at last February’s employment peak. Even if today’s much-reduced shortfall had marked the trough, it would represent a postwar drawdown surpassed only by the Great Recession (Chart 1). Chart 1An Especially Severe Bloodletting
Sizing Up The Labor Market
Sizing Up The Labor Market
The economic implications of a plunge in employment follow from what we like to call the fundamental theorem of macroeconomics: my spending is your income and your spending is my income. The US economy has dodged those implications, thanks to a massive infusion of fiscal stimulus that featured three waves of direct assistance to households, but it will not be able to stand on its own until nonfarm payrolls close in on their previous peak. Financial markets will take some notice of payrolls’ impact on economic fundamentals, but they are mostly concerned about their effect on monetary policy settings. With the Fed’s inflation-related criteria for hiking rates largely met, its full-employment goal is set to take center stage. It is easy to envision a scenario in which bond yields and equity multiples begin taking their cue from payrolls’ ongoing progress. We center our examination of that progress on labor force participation, which is likely to inform the pace of payroll expansion and wage gains. The Incredible Shrinking Work Force Only 61.6% of civilians 16 and over are participating in the labor force, recovering less than half of the pandemic decline from 63.4% to 60.2%. The participation rate has been subject to a structural headwind since 2001 when the baby boomers, born between 1946 and 1964, began exiting their prime working years1 (Chart 2, top panel). Except for a modest decline in the wake of the global financial crisis, however, the labor force kept expanding, even during recessions (Chart 2, bottom panel), thanks to an expanding working-age population. The pandemic decline was large enough to overcome population growth, with the participation rate now at a (pre-pandemic) level it last hit in January 1977, when female prime-age participation was 17-1/2 percentage points lower than it is today. Chart 2Participation Took A Big Hit From The Pandemic
Participation Took A Big Hit From The Pandemic
Participation Took A Big Hit From The Pandemic
Table 1Labor Force Growth Has Been Slowing For A While
Sizing Up The Labor Market
Sizing Up The Labor Market
Labor force growth has been decelerating since the ‘70s (Table 1), when it was souped up by the first half of the baby boomers’ entry into their prime working years and the explosion in female participation. It tapered in the ‘80s as the growth in female participation moderated even as the rest of the boomers turned 25. After a middling decade of labor force expansion in the ‘90s, growth slowed sharply over the last two decades as one cohort of baby boomers exited their prime working years every year from 2001 through 2019. The demographic headwind from aging boomers never produced outright contraction like today’s, though, with the labor force plunging by 5% at last April’s trough, and still languishing 2.2% below its pre-pandemic peak today. Where Did All Those Workers Go? There is no smoking gun among demographic breakouts of those who have left the labor force, but the loss of external caregiving resources appears to have been a formidable obstacle to participation. Child care burdens tend to fall more heavily on women, married or unmarried, and the recovery in the participation rate of women with young children has consistently lagged the recovery for women without young children and men with or without young children (Chart 3). It currently sits nearly a percentage point below the other three gender/children categories. Participation rate data by age group suggests that increased adult caregiving burdens may also be playing a role in suppressing participation, based on the mean and median ages of 49.4 and 51, respectively, of adult caregivers.2 Among all workers, the 45-to-54 and 55-and-above cohorts accounted for an outsized share of labor force departures while the 35-to-44 cohort, which is less likely to have adult-care burdens, has experienced labor-force losses at one-fifth of its proportion of the labor force (Table 2). Though adult caregivers skew female (61%), there is not an observable difference in the change in male and female participation at the ages of 45 and above. Chart 3Remote Learning Is Weighing On Participation
Sizing Up The Labor Market
Sizing Up The Labor Market
Table 2Pandemic Labor Force Changes By Age And Gender Cohorts
Sizing Up The Labor Market
Sizing Up The Labor Market
As part of the Household Pulse Survey it began conducting in late April 2020 to track the effects of the pandemic on American households, the Census Bureau has asked the jobless why they are not working. Childcare has steadily gained share and together with eldercare accounted for 9% of responses in May (Chart 4). The largest factor last April and May – the coronavirus’ impact on businesses, covering business drop-offs, temporary and permanent closures and furloughs and layoffs – rapidly fell away and is down to just 11%. Retirements have taken up 11 percentage points of the slack, with 42% of May survey respondents saying they are retired (Chart 5). Chart 4Childcare, Eldercare And ...
Sizing Up The Labor Market
Sizing Up The Labor Market
Chart 5"Retirement" Have Shrunk The Work Force
Sizing Up The Labor Market
Sizing Up The Labor Market
The huge pickup in retirees matches the plunge in 55-and-over participation, but it flies in the face of longer-term trends. 55-plus participation surged during the nineties’ expansion and during all of the aughts, including the dot-com and the GFC recessions, both of which dealt a blow to retirement nest eggs (Chart 6). The 55-and-over participation rate had held remarkably steady around 40% over the last ten years and we are skeptical that so many older workers are exiting at a time when their share of the population is increasing along with life spans. We expect that many of these respondents’ stated retirements may prove to be as "final" as their favorite bands’ retirement tours. Chart 6Previous Equity Selloffs Forced Older Workers To Stay On The Job
Previous Equity Selloffs Forced Older Workers To Stay On The Job
Previous Equity Selloffs Forced Older Workers To Stay On The Job
The Demand Picture Is Different This Time “Jobless recoveries” have become a fixture of the post-recession landscape of the last three decades, which have seen the time it takes to recover the previous cycle’s employment peak become increasingly protracted (Chart 7). We do not believe that we are in the throes of a jobless recovery now, however. The sluggish pace of hiring that followed the last three recessions has mainly been a function of weak demand. This time around,3 the issue appears to be a dearth of labor supply, as increasingly desperate employers report that they are unable to find capable workers to fill open positions. Chart 7It Takes A Long Time To Regain Peak Employment In A Jobless Recovery, ...
It Takes A Long Time To Regain Peak Employment In A Jobless Recovery, ...
It Takes A Long Time To Regain Peak Employment In A Jobless Recovery, ...
Chart 8... But It Doesn't Look Like We're In One Now
... But It Doesn't Look Like We're In One Now
... But It Doesn't Look Like We're In One Now
Chart 9Help Wanted
Help Wanted
Help Wanted
Per the job openings component of the Job Openings and Labor Turnover Survey (JOLTS), there is very nearly one job for every unemployed worker. Although the JOLTS has only existed since 2000, the current level of demand is remarkably robust compared to each of the last two cycles (Chart 8). May’s NFIB survey of small businesses shows the percentage of firms with at least one job opening extended its all-time high (Chart 9, top panel) and hiring intentions over the next three months matched the high set late last cycle (Chart 9, bottom panel). Surging demand for workers is also evident in the record-high rate at which they’re quitting their jobs, presumably to hop to better ones (Chart 8, bottom panel). The Bond Market’s Take The Fed is at pains to avoid market disruptions from its inevitable future moves to tighten monetary policy from the pandemic’s emergency levels. It has explicitly laid out three criteria for hiking rates: year-over-year PCE inflation above 2%, PCE inflation on track to moderately exceed 2% for some time and labor market conditions consistent with its assessment of maximum employment. With both inflation criteria seemingly accomplished, attaining maximum employment shapes up as the swing factor. Maximum employment is a squishy concept that affords the Fed ample discretion in setting its liftoff date. Fed officials keep referring to the previous employment peak in their public comments, and we view it as a simple proxy for meeting its labor market condition. At the end of May, 7.6 million fewer people were working than at the cyclical employment peak in February 2020. At a monthly rate of 500,000 net payrolls gains, it would take fifteen months to get back to the pre-pandemic peak; at a 400,000 clip, it would take nineteen months. Sustaining monthly payrolls additions at the required 4.2% and 3.3% annualized rates for fifteen and nineteen months, respectively, may seem improbable, but it has been done before (Chart 10). The economy’s trend rate of growth was much faster in those past instances, but the employment decline was much larger now, like the fiscal aid meant to counter it. We expect that nonfarm payroll employment will recover its pre-pandemic peak level before the end of 2022. Chart 10It's Not Easy, But It Has Been Done Before
It's Not Easy, But It Has Been Done Before
It's Not Easy, But It Has Been Done Before
Investment Strategy The 10-year Treasury bond yield spent much of April and May consolidating its August-to-March surge from 0.5% to 1.75% and has retraced about a quarter-point of it after its recent slide. It may well stay put or even ease a little more over the next month or so if the Fed sticks to its transitory inflation messaging and the hiring logjam stretches into the summer. We expect that it will eventually be broken, however, as school re-openings and the return of adult-care providers allow sidelined workers to come back to work and the end of enhanced employment benefits forces some lower-wage earners to clock in again. As the pace of hiring picks up in line with our expectations and increasingly points to a return to pre-pandemic employment sometime in the latter half of 2022, we expect that the fixed income markets will pull their liftoff date estimates forward. As market expectations get closer to our first-hike-in-2022 view, bond yields will rise and longer-maturity Treasuries will bear the brunt of the ensuing selloff. Over our cyclical 3-to-12-month timeframe, we therefore continue to recommend that investors underweight fixed income in multi-asset portfolios while maintaining large Treasury underweights and below-benchmark duration. There may well be a tactical opportunity to overweight duration in fixed income or equity portfolios, and our sister US Equity Strategy publication recommends overweighting growth sectors over value sectors to position for it. We do not disagree with our equity colleagues’ call but are keeping our asset allocation eyes fixed on the 12-month horizon. Doug Peta, CFA Chief US Investment Strategist dougp@bcaresearch.com Footnotes 1 An individual is deemed to be in his/her prime-age employment years between the ages of 25 and 54. The baby boomers entered their prime working years from 1971 to 1989, and exited them from 2001 to 2019. 2Caregiving in the US 2020, AARP and The National Alliance for Caregiving. 3 The NBER’s business cycle dating committee declared that the last expansion ended in February 2020, but it has not yet made a judgment as to when the new one began. We assume it likely began in last year’s fourth quarter or this year’s first quarter.
Highlights Duration: The Fed will ignore inflation for the time being and focus on its “maximum employment” target to decide when to lift rates off the zero bound. As a result, bond investors should also ignore inflation and focus on the employment data. We anticipate that significant positive nonfarm payroll surprises will start in late-summer/early-fall and that they will catalyze a move higher in bond yields. Keep portfolio duration below benchmark. Fed Operations: We see no implications for the Fed’s balance sheet or interest rate policies stemming from the recent uptick in ON RRP usage. It is possible that the Fed will decide to slightly increase the IOER or ON RRP rates at this month’s FOMC meeting in an effort to move the funds rate closer to the middle of its target range, but we don’t view this as a pressing need. Inflation: Inflation will moderate in the coming months, but 12-month core inflation will remain close to or above the Fed’s target at least through the end of 2022. Baffling Bond Market Strength We’ve received more questions than usual in recent days, mostly from readers seeking to understand why long-dated bond yields fell during a week that saw one of the strongest CPI prints of the past 40 years and the Treasury dump $38 billion of new 10-year supply on the market. We believe we can explain the conundrum. First, consensus expectations are finally starting to catch up with the pace of economic recovery. Economic surprise indexes measure the strength of economic data relative to consensus expectations and they have fallen a lot compared to the elevated levels seen last year (Chart 1). In fact, if it weren’t for incredibly strong inflation data these indexes would be much closer to “negative surprise” territory. The Industrial Sector and Labor Market components of the Bloomberg Economic Surprise Index have already dipped well below the zero line (Chart 1, bottom panel). Encouragingly, the fall in surprise indexes has more to do with investor expectations ratcheting higher than it does with a slowdown in the pace of economic growth, or at least that is the message you get from the CRB/Gold ratio, an excellent coincident indicator for bond yields (Chart 2). The CRB Raw Industrials commodity price index serves as a proxy for global economic growth and it remains in a solid uptrend. What has changed in the past few weeks is that gold is also staging a rally (Chart 2, bottom panel). This tells us that bond yields are not falling because of a slowdown in economic growth. Rather, they are falling because investors see the Federal Reserve turning increasingly dovish. Chart 1Surprise Indexes
Surprise Indexes
Surprise Indexes
Chart 2CRB/Gold Ratio
CRB/Gold Ratio
CRB/Gold Ratio
Why might investors have this impression of Fed Policy? During the past few months the Fed has successfully convinced markets that it will not lift rates until its “maximum employment” target is achieved, irrespective of what happens with inflation or inflation expectations (more on this in the section titled “A Checklist For Liftoff” below). This explains why bond investors are ignoring positive inflation surprises and focusing instead on the employment data, which have been disappointing. Nonfarm payroll growth came in significantly below consensus expectations in both May and April (Table 1). In light of those disappointing numbers, investors have pushed out expectations for the timing of Fed liftoff and bond yields have fallen as a result. Table 1Monthly Nonfarm Payroll Results Versus Consensus
Watch Employment, Not Inflation
Watch Employment, Not Inflation
In For A Jolt Chart 3Labor Demand Is Not The Problem
Labor Demand Is Not The Problem
Labor Demand Is Not The Problem
We view the recent drop in yields as a bond market over-reaction to weak employment data. Investors are focusing on the weaker-than-expected nonfarm payroll numbers but ignoring skyrocketing indicators of labor demand such as the JOLTS Job Openings Rate, the NFIB Jobs Hard To Fill survey and the Consumer Confidence Jobs Plentiful less Hard To Get survey (Chart 3). As we have noted in past reports, the demand for labor has already fully recovered from the pandemic and it is the lack of labor supply that is holding back the employment recovery.1 That is, people are not making themselves available to work. When we think about possible reasons why people are not making themselves available for job opportunities, the most obvious candidates relate to the pandemic and the fiscal response to the pandemic. Table 2 shows the net number of jobs lost since February 2020 broken down by major industry group. It shows that the Leisure & Hospitality sector (mostly restaurants and bars) accounts for about one third of the net job loss. Together, the Education & Health Services and Government sectors account for another third. A lot of these missing jobs are close-proximity service industry jobs that pay a relatively low average hourly wage. It therefore shouldn’t be too surprising that people are reluctant to take these jobs due to fears of contracting COVID and the fact that they have received large income supplements from the federal government in the form of stimulus checks and expanded unemployment benefits. Table 2Employment By Industry
Watch Employment, Not Inflation
Watch Employment, Not Inflation
It seems unlikely that these constraints to labor supply will persist beyond the next few months. Virus fears will ebb over time, as long as the case count remains low, and government income support will also go away. There will be no more stimulus checks and expanded unemployment benefits are scheduled to expire in September. Chart 4S&L Government Hiring Will Increase
S&L Government Hiring Will Increase
S&L Government Hiring Will Increase
With this in mind, we expect that labor supply constraints will ease by end-summer/early-fall and the result will be significant upside surprises to nonfarm payroll growth. Bond yields will likely stay rangebound in the near-term, but the next significant move will be an increase in yields driven by strong employment data. As a final point on the labor market, we noted above that the Government sector accounts for about 15% of the net job loss since February 2020. In fact, all those missing government jobs are from state & local governments.2 State & local governments cut expenditures drastically last year, but thanks to a faster-than-expected recovery in tax revenues and generous transfers from the federal government, they actually saw overall revenues exceed expenditures in 2020 and again in the first quarter of 2021 (Chart 4). The upshot is that state & local governments are now in a position to ramp up spending, and their pace of hiring should accelerate in the coming months. Bottom Line: The Fed will ignore inflation for the time being and focus on its “maximum employment” target to decide when to lift rates off the zero bound. As a result, bond investors should also ignore inflation and focus on the employment data. We anticipate that significant positive nonfarm payroll surprises will start in late-summer/early-fall and that they will catalyze a move higher in bond yields. Keep portfolio duration below benchmark. A Note On Reverse Repos And Fed Operations Chart 5An Over-Supply Of Reserves
An Over-Supply Of Reserves
An Over-Supply Of Reserves
Many investors have noticed that usage of the Fed’s Overnight Reverse Repo Facility (ON RRP) has surged during the past few weeks, and many are also wondering if this will force the Fed to alter its interest rate or balance sheet policies. The short answer is no. In fact, the increased take-up of the ON RRP is a sign that the Fed’s operational strategy is working as intended. Let’s explain. The Fed’s main task is to set a target range for the federal funds rate and then ensure that the funds rate stays within that range. Today, that target range is between 0% and 0.25%. The fed funds market is where banks trade reserves amongst each other. If the Fed has over-supplied the market with reserves, then they will be very cheap to acquire and the fed funds rate will fall. Conversely, if the Fed has under-supplied the market with reserves, they will be more expensive to acquire and the fed funds rate will rise. At present, the market is awash with reserves. This is the result of the Fed’s asset purchases and the Treasury department’s ongoing policy of reducing its cash holdings.3 This over-supply of reserves is forcing the fed funds rate down, toward the lower-end of the Fed’s target band (Chart 5). This is where the ON RRP comes to the rescue. Through the ON RRP, the Fed pledges to borrow reserves from any eligible counterparty at a rate of 0% using a security off its balance sheet as collateral. This effectively gives any eligible counterparty the option of depositing excess reserves at the Fed in return for a rate of 0%. The result is that the ON RRP establishes a firm floor of 0% under the fed funds rate. Chart 6An Under-Supply Of Reserves
An Under-Supply Of Reserves
An Under-Supply Of Reserves
This is why we say that the ON RRP is working as intended. The market is currently over-supplied with bank reserves and the ON RRP is absorbing that excess while keeping the funds rate anchored within the Fed’s target range. We should note that, in addition to the ON RRP rate, the Fed also pays a rate of interest on excess reserves (IOER). This IOER rate is currently 0.10%. Much like the ON RRP, the IOER should function as a floor on interest rates since it promises banks a rate of 0.10% for excess reserves deposited at the Fed. The problem is that the IOER is only available to primary dealer banks that have accounts at the Federal Reserve. There are other major players in overnight money markets, such as the GSEs and large money market funds, and these institutions do not have access to the IOER, only to the ON RRP. It is this broader counterparty access that makes the ON RRP the true floor on interest rates. It’s also interesting to look back at a time when the Fed was grappling with the opposite issue. In September 2019 the Fed was supplying the market with too few reserves and the fed funds rate was rising as a result (Chart 6). During this period, the fed funds rate actually did briefly break above the top-end of the Fed’s target range. This is because the Fed does not have a standing facility to put a ceiling above rates the way that the ON RRP provides a floor. In September 2019, the Fed had to conduct ad-hoc repo operations – lending reserves in exchange for securities – in order to bring the funds rate back down. Fortunately, the Fed has plans to rectify this problem. The minutes from the last FOMC meeting reveal that a “substantial majority of participants” supported the establishment of a standing repo facility to serve as a ceiling on interest rates in the same way that the ON RRP serves as a floor. The establishment of such a facility will make it easier for the Fed to shrink the size of its balance sheet when the time comes. All in all, we see no implications for the Fed’s balance sheet or interest rate policies stemming from the recent uptick in ON RRP usage. It is possible that the Fed will decide to slightly increase the IOER or ON RRP rates at this month’s FOMC meeting in an effort to move the funds rate closer to the middle of its target band (the fed funds rate is currently 0.06%), but we don’t view this as a pressing need. It is more likely that the Fed will stay the course, knowing that the over-supply of reserves will abate once the Treasury’s cash balance re-normalizes and that the ON RRP will keep the funds rate well-anchored in the meantime. A Checklist For Liftoff Table 3The Fed’s Liftoff Checklist
Watch Employment, Not Inflation
Watch Employment, Not Inflation
At the beginning of this report we claimed that, in determining when to lift rates off the zero bound, the Fed will ignore inflation and inflation expectations and will be guided only by the labor market. This claim stems from the three criteria that the Fed has said will determine the timing of liftoff (Table 3). Yes, above-target inflation is one of the items on the checklist. However, the checklist places no upper limit on inflation that would cause the Fed to ignore the checklist’s “maximum employment” criteria. Further, it’s highly likely that inflation will remain close to or above the Fed’s target at least through the end of 2022. In essence, this means that the inflation portion of the Fed’s liftoff checklist has been achieved and it is only employment that will determine the timing of liftoff. Inflation To see why inflation is likely to remain close to or above target levels we look at 12-month core CPI (Chart 7A) and 12-month core PCE (Chart 7B) and run some scenarios based on future monthly growth rates of 0.1%, 0.2%, 0.3% and 0.4%. For context, core CPI grew 0.9% in April and 0.7% in May. Core PCE grew 0.7% in April and May data have not yet been released. Chart 7A12-Month Core CPI Scenarios
12-Month Core CPI Scenarios
12-Month Core CPI Scenarios
Chart 7B12-Month Core PCE Scenarios
12-Month Core PCE Scenarios
12-Month Core PCE Scenarios
Charts 7A and 7B show that an average monthly growth rate of 0.2%, a significant drop from current rates, will cause 12-month core CPI and core PCE to level-off either at or above target levels and this leveling-off won’t even occur until the middle of next year. Given that we are likely to see at least a few more elevated monthly inflation prints, it is highly likely that inflation will be at or above the Fed’s target by the end of 2022. Employment As for the Fed’s “maximum employment” criteria, we have updated our scenarios for the average monthly pace of nonfarm payroll growth required to reach “maximum employment” by specific dates in the future. As a reminder, we define “maximum employment” as an unemployment rate between 3.5% and 4.5% and a labor force participation rate of 63.3%, equal to its February 2020 level. Our results are presented in Tables 4A-4C. We calculate that average monthly nonfarm payroll growth of between +378k and +462k is required to reach “maximum employment” by the end of 2022. As noted above, we expect that nonfarm payroll growth will come in far above this range starting in late-summer/early-fall. Table 4AAverage Monthly Nonfarm Payroll Growth Required For The Unemployment To Reach 4.5% By The Given Date
Watch Employment, Not Inflation
Watch Employment, Not Inflation
Table 4BAverage Monthly Nonfarm Payroll Growth Required For The Unemployment To Reach 4% By The Given Date
Watch Employment, Not Inflation
Watch Employment, Not Inflation
Table 4CAverage Monthly Nonfarm Payroll Growth Required For The Unemployment To Reach 3.5% By The Given Date
Watch Employment, Not Inflation
Watch Employment, Not Inflation
All in all, we think that the Fed’s maximum employment and inflation criteria will both be met in time for a rate hike in 2022. Ryan Swift US Bond Strategist rswift@bcaresearch.com Footnotes 1 For more details on the lack of labor supply please see US Bond Strategy Weekly Report, “Making Money In Municipal Bonds”, dated April 27, 2021. 2 The federal government has added a net 24 thousand jobs since Feb. 2020. State & local governments have lost a net 1.2 million. 3 For more details on how the Treasury department’s cash management policy is influencing the supply of bank reserves please see US Bond Strategy Weekly Report, “No Panic From Powell”, dated March 9, 2021. Fixed Income Sector Performance Recommended Portfolio Specification
Highlights The ECB did not tighten policy, despite its upgrade to the Euro Area growth outlook. The rise in the Eurozone inflation will be transitory. The Euro Area continues to suffer from excessive slack, and current price pressures are narrow. The ECB rightfully worries about tightening financial conditions by prematurely removing monetary accommodation. The ECB does not want to move ahead of the release of its Strategy Review. Global growth is likely to experience a temporary hiccup this summer. The ECB will only taper its PEPP program in Q1 2022 with no firm announcement until Q4 2021. Stay overweight European peripheral bonds. Despite a favorable 18-month outlook, European cyclical equities face pronounced risks this summer. Investors should raise cash levels for now to keep dry powder for this fall. Feature At its policy meeting last week, the ECB refrained from adjusting policy. While the euro and bund yields barely budged on the news, Italian and Greek spreads narrowed a few basis point, welcoming the dissipating risk of decreased bond purchases. The ECB’s decision is in line with the analysis we published two weeks ago, which argued against the Governing Council hinting at a tapering of asset purchases at its June meeting. Growing signs that the expected pick-up in the Eurozone inflation will be transitory and that China’s credit slowdown will negatively impact Europe increase our confidence that the ECB will not announce any adjustment to its asset purchases until the fourth quarter of 2021. This setup supports European peripheral bonds. However, it also points to a correction in European cyclical stocks. The ECB Announcement ECB President Christine Lagarde highlighted the need for a steady hand, with no policy change. The risks to growth are now “broadly balanced,” but enough uncertainty remains that removing accommodation too early still creates a much poorer risk/reward trade-off than maintaining the current policy. The ECB boosted its growth forecast in 2021 and 2022. As Table 1A illustrates, 2021 GDP growth was raised to 4.6% from 4% in March, and 2022 GDP growth was raised to 4.7% from 4.1%. Activity was left unchanged at 2.1% in 2023. The ECB and this publication are on the same page; Euro Area domestic activity will enjoy a welcomed fillip as a result of the re-opening of the economy, a response to the improving pace of vaccination across the continent. Moreover, the NGEU program will start disbursing funds this summer and will add another boost to growth. Despite this significant upgrade to anticipated growth, the ECB kept its accelerated pace of asset purchases in place, at least through the summer, because the inflation outlook remains below its target of “close but below 2%” durably. As Table 1B shows, the ECB expects HICP to hit 1.9% in 2021, but it will subsequently slow to 1.5% in 2022 and 1.4% in 2021. Table 1AUpgraded Growth Forecast
Slow Ride
Slow Ride
Table 1BBelow Target Inflation
Slow Ride
Slow Ride
Bottom Line: The ECB did not taper its PEPP purchases, because of uncertainty and below-target inflation. Too Many Deflationary Risks The policy stance of the ECB is appropriate on three levels. First, the case for Eurozone inflation to be transitory is even stronger than it is in the US. Second, financial conditions could easily deteriorate if the ECB were to tighten policy too early. Finally, the Strategy Review due this fall further paralyzes the ECB for now. Transitory Inflation Headline and core CPI in the Eurozone will increase significantly in the coming months but will slow next year. The ECB’s core CPI measure, which excludes food and energy, is set to rise above the levels of the past 15 years. As the US re-opened, core CPI spiked on both yearly and monthly bases. The presence of bottlenecks across domestic and global supply chains indicates that the Euro Area will experience a similar outcome. Assuming that monthly inflation rates will settle between 0.2% and 0.25% for the remainder of 2021, by year’s end, annual inflation will stand between 2% and 2.5% (Chart 1). The European PMI indices confirm the upside for the Euro Area’s core inflation. Service inflation has been more stable than in the US, but goods inflation is rising in line with the higher manufacturing PMI (Chart 2). Services inflation will accelerate according to the services PMI. Chart 1Higher Inflation For 2021
Higher Inflation For 2021
Higher Inflation For 2021
Chart 12Accelerating Goods And Services Inflation
Accelerating Goods And Services Inflation
Accelerating Goods And Services Inflation
Surveys confirm that this summer’s re-opening will jumpstart inflation. The employment components of both the European Commission’s Retail and Services Surveys are consistent with a rapid pickup in employment (Chart 3). This will support household income and consumption. Additionally, the EC’s Consumer Survey indicates that European households are ready to increase their purchase of homes and cars compared to last year (Chart 3, bottom panel). When stronger demand meets supply bottlenecks, higher prices ensue. Already, the EC’s Retail Survey points to this outcome (Chart 4). Despite these inflationary developments, most economic forces indicate that the Eurozone’s core and headline CPI will not stay elevated for long. Chart 3Stronger Employment In Pandemic-Hit Sectors
Stronger Employment In Pandemic-Hit Sectors
Stronger Employment In Pandemic-Hit Sectors
Chart 4Re-Opening Pricing Pressures
Re-Opening Pricing Pressures
Re-Opening Pricing Pressures
Our Trimmed Mean Inflation measure for the Euro Area (which mimics the construction of the Cleveland Fed Trimmed-Mean CPI in the US) has weakened to 0.1% (Chart 5). Hence, underlying inflation trends are still muted and the recent uptick in core CPI reflects outliers, as has been the case in the US. The outlook for the components of CPI confirms that any uptick in Euro Area inflation will be temporary. Shelter inflation, which accounts for 24% of the ECB core CPI, will rise as the unemployment rate declines. However, the strength in the euro is limiting import prices, which will cap non-energy industrial goods inflation (Chart 6). Moreover, the peak in oil price annual increases points toward a rollover in transportation inflation. Together, these two categories represent almost 60% of the core CPI components. Chart 5Inflation Is Not Broad-Based
Inflation Is Not Broad-Based
Inflation Is Not Broad-Based
Chart 6Key CPI Components Will Slow
Key CPI Components Will Slow
Key CPI Components Will Slow
Labor market dynamics are also consistent with a temporary inflation spurt. Total hours worked remain 6.5% below their pre-COVID-19 summit and underneath the level congruent with full employment based on the size of the Eurozone’s working-age population (Chart 7). This model understates the slack in the labor market, because the reforms implemented in peripheral economies in the wake of last decade’s Euro Area crisis have brought down structural unemployment. Moreover, the chart shows that, after total hours worked return to their equilibrium, it still takes a few years before negotiated wages firm up. Even if labor shortages materialized earlier than we anticipate, it does not guarantee a pickup in core CPI. From 2016 to 2019, a large proportion of Euro Area businesses cited labor shortages as a key factor limiting production. Yet, despite both this perceived tightness and a trendless euro, core CPI remained flat, averaging 1% per annum (Chart 8). Chart 7Still Too Much Slack
Still Too Much Slack
Still Too Much Slack
Chart 8Labor Shortages Do Not Guarantee Inflation
Labor Shortages Do Not Guarantee Inflation
Labor Shortages Do Not Guarantee Inflation
Outside of the labor market, the amount of stimulus injections also argues against a permanent increase in European inflation. BCA’s US Bond Strategy, Global Investment Strategy, and Bank Credit Analyst services believe that the current spurt of US Inflation is temporary, despite vast monetary and fiscal stimuli. In relation to 2019 GDP, the ECB’s liquidity injections have been larger than those of the Fed; however, the US fiscal activism greatly outdid that of the Eurozone (Chart 9). Consequently, the combined monetary and fiscal impulse in the US is larger, and its greater weight toward fiscal policy makes it more inflationary. Thus, if the US is unlikely to see durable inflation, the Eurozone is even less at risk. Chart 9More Timid European Stimulus
Slow Ride
Slow Ride
Chart 10Lower European Inflation Expectations
Lower European Inflation Expectations
Lower European Inflation Expectations
Euro Area inflation expectations are also muted compared to that of the US (Chart 10). This development confirms that Eurozone policy is less inflationary than that of the US. It also creates an anchor for realized inflation, which will constrain the acceleration in the Euro Area CPI. Financial Conditions The ECB is deeply concerned about the impact of the hurried removal of monetary accommodation on the Eurozone’s financial conditions. Chart 11The Euro Is Deflationary
The Euro Is Deflationary
The Euro Is Deflationary
The ECB does not want to see a much more rapid pace of appreciation in the euro. If it begins to slow its QE program when the Fed remains reluctant to talk about tapering, EUR/USD will surge. This will feed into weaker core inflation in the region. The ECB’s broad trade-weighted euro, based on 41 currencies, has already rallied to a record high. Thus, an even more rapid euro rally would spell deeper deflationary pressures in the region (Chart 11). Peripheral spreads remain fragile. The ECB will not want to cause a rapid widening of Italian, Spanish, or Greek government bond spreads by decreasing its asset purchases prematurely. Otherwise, the health of the banking sector in the periphery will once again deteriorate, which will both harm the recovery and ignite deflationary tendencies. Strategy Review The ECB’s Strategy Review also prevents the Governing Council from adjusting policy. The ECB will release its Strategy Review in September or October. This exercise could result in a change to the inflation target. In line with the new Fed Average Inflation Target, the ECB objective may become more symmetric. Inflation has not hit the ECB’s target of nearly 2% since 2012, and the level of HICP stands 8% below what the target implies. Therefore, if the ECB adjusts its target this fall, it will become harder to justify the removal of accommodation. Bottom Line: The ECB wants to avoid a repeat of its 2011 policy mistake, when it tightened policy prematurely and catalyzed a period of profound weakness in the European economy. Eurozone inflation will increase this year; however, this bump is transitory and inflation will once again decline in 2022. Moreover, the ECB rightfully worries about tightening financial conditions, because the euro is exerting profound deflationary forces on the continent and peripheral spreads remain fragile. Finally, the ongoing Strategy Review limits what the ECB can do until its results are known. Look Out For Q4 2021 The ECB will keep the PEPP program in place until March 2022, as was originally announced. Therefore, the ECB will only telegraph its intention after the summer and will most likely announce in December its firm commitment to begin tapering. The program size does not constrain the ECB. The total envelope of the PEPP stands at EUR1850 billion, and the ECB has already purchased EUR1100 billion (Chart 12). Based on the current accelerated pace of purchases, the ECB will run out of room in February 2022. Thus, the ECB continues to enjoy great flexibility without adjusting the PEPP program meaningfully. Chart 12Plentiful PEPP Room
Plentiful PEPP Room
Plentiful PEPP Room
Chart 13China Will Act As A Drag
China Will Act As A Drag
China Will Act As A Drag
Chart 14The Global Growth Tax Is Biding
The Global Growth Tax Is Biding
The Global Growth Tax Is Biding
The expanding threat of a global growth scare will likely limit the ability of the ECB to tighten policy ahead of Q4. China’s credit impulse is decelerating, which portends an imminent peak in our BCA Global Industrial Activity Nowcast (Chart 13). Moreover, the rise in global yields since August 2020 and the rapid rally in oil prices since April 2020 are consistent with a meaningful deceleration in global manufacturing activity. The collapse in our Global Leading Economic Indicator Diffusion Index also hints at a coming global soft patch (Chart 14). Hence, the heightened sensitivity of the Euro Area economy to the global manufacturing sector points toward softer-than-anticipated growth this summer. Historically, a deceleration of the Chinese PMI New Orders components warns of a decline in the 1-year forward EONIA (Chart 15). While the ECB is unlikely to flag a rate reduction in response to the upcoming global deterioration, it could respond by delaying its tapering decision. Ultimately, the accumulation of constraints and risks suggests that, even after the PEPP taper starts in 2022, the ECB will roll it into the older PSPP program. The ECB will want to keep a lid on peripheral spreads and guarantee that the euro does not melt up. Germany is unlikely to block this initiative, because its large Target 2 surplus means that problems in the periphery will percolate to the German banking system (Chart 16). Moreover, Germany’s export sector will benefit from a euro whose appreciation is contained. Chart 15Chinese New Orders Are Inconsistent With A Tighter ECB
Chinese New Orders Are Inconsistent With A Tighter ECB
Chinese New Orders Are Inconsistent With A Tighter ECB
Chart 16Germany Does Not Want Italian Troubles
Germany Does Not Want Italian Troubles
Germany Does Not Want Italian Troubles
Bottom Line: The ECB will not formally announce its tapering until December 2021. The ECB still has considerable room to continue using the PEPP program, and the global economy is likely to generate a negative growth surprise this summer. Instead, once the PEPP taper begins in 2022, the program will be rolled into the PSPP rather than being completely discarded. European policy, therefore, will remain accommodative. Investment Implications A dovish ECB is consistent with a continued overweight in European peripheral bonds. Chart 17European Peripheral Bonds Remain Attractive
Slow Ride
Slow Ride
Portuguese, Greek, Spanish, and Italian bonds offer much more attractive valuations than the global or the European averages (Chart 17). The robust pace of ECB bond purchases, along with the increased fiscal risk-sharing created by the NGEU programs, will allow this value to continue to generate excess returns for investors. The growth scare, however, threatens our positive stance on European equities and cyclical stocks. We expect a correction to take place this summer or early fall. Thus, investors should raise cash now to buy cyclicals stocks once they correct. First, a deceleration in global growth catalyzed by a Chinese credit slowdown is consistent with an underperformance of cyclical stocks and European stocks in general. Second, the ECB Central Bank Monitor currently sports an elevated 2.1 reading, which is negative for cyclicals. A high reading for the monitor materializes when the Eurozone economy is experiencing strong momentum. However, markets are forward looking, and they rapidly internalize a brightened outlook. Once the price of cyclical stocks embed enough good news, they will start to generate poorer returns. Consequently, positive readings of the monitor are followed by negative relative excess returns for cyclical stocks, such as Industrials, Financials, Tech, and Consumer discretionary on both 6- and 12-month horizons (Table 2A). Table 2AThe Higher The ECB Monitor Rises, The More Poorly Cyclicals Perform
Slow Ride
Slow Ride
The higher the ECB Monitor reaches, the worse the cyclical sectors’ excess returns become, even if the ECB does not tighten policy. Moreover, outliers do not distort the results of the study. The batting averages confirm that, the higher the ECB Monitor, the lower the probability of a subsequent outperformance of cyclicals. The reverse is true for defensive sectors. The higher the ECB Monitor climbs, the greater the subsequent 6- and 12-month relative excess returns for Telecommunication, Consumer Staples, Utilities, and Healthcare turn out. Their probability of outperformance also increases (Table 2B). Table 2BThe Higher The ECB Monitor Rises, The More Poorly Cyclicals Perform
Slow Ride
Slow Ride
Investors should therefore curtail their exposure to risk over the coming months, tactically tilt toward some attractive defensive names and buy some hedges or raise some cash in order to participate more fully in the rest of the rally later this year. Bottom Line: An easy ECB policy favors an overweight stance in European peripheral bonds. However, if global growth slows, the current reading of our ECB Monitor is consistent with a period of underperformance for cyclical equities. Such underperformance should correlate with a corrective episode for the broad market as well as an underperformance of European stocks relative to the US. Investors, therefore, should raise cash levels and tactically move into attractive defensive names in order to buy back cyclicals later this year. Mathieu Savary, Chief European Investment Strategist Mathieu@bcaresearch.com Currency Performance
Slow Ride
Slow Ride
Fixed Income Performance Government Bonds
Slow Ride
Slow Ride
Corporate Bonds
Slow Ride
Slow Ride
Equity Performance Major Stock Indices
Slow Ride
Slow Ride
Geographic Performance
Slow Ride
Slow Ride
Sector Performance
Slow Ride
Slow Ride
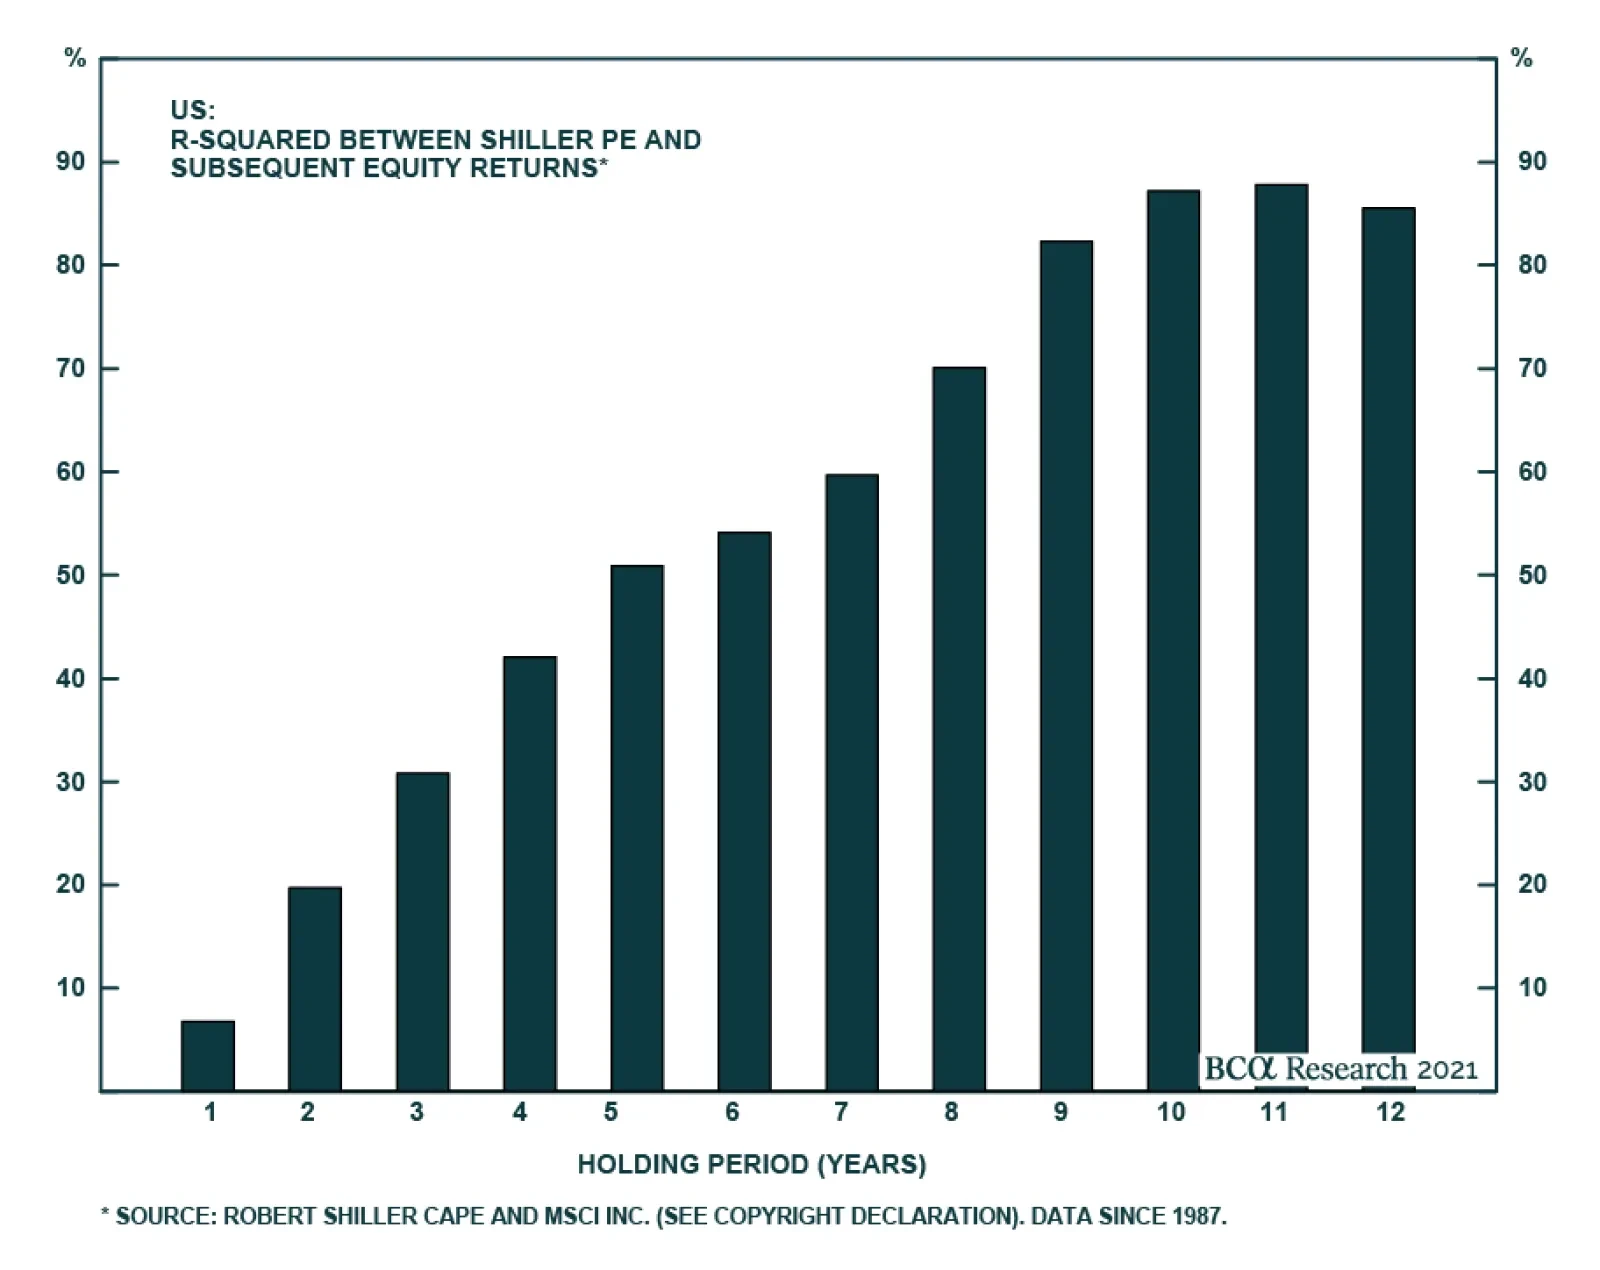
Where should you invest your money for the long term? This is a question that many investors struggle to answer in today’s environment. Low interest rates have made valuations unattractive in almost all traditional asset classes and, while valuations hold low…