Fixed Income

The BCA Research Global Asset Allocation (GAA) Forum will take place online on May 18th. We have put together a great lineup of speakers to discuss issues of importance to CIOs and asset allocators. These include the latest thinking on portfolio construction, factor investing, alternatives, and ESG. Our keynote speaker will be Keith Ambachtsheer, founder of KPA Advisory and author of many books on investment management including "The Future of Pension Management: Integrating Design, Governance and Investing" (2016). His presentation will be followed by a panel discussion of top CIOs including Maxime Aucoin of CDPQ, James Davis of OPTrust, and Catherine Ulozas of the Drexel University Endowment. The event is complimentary for all GAA subscribers, who can see a full agenda and register here. Others can sign up here. We hope you can join us on May 18th for what should be a stimulating and informative day of ideas and discussion. Highlights Investors’ hunt for yield over the past few years led them to view leveraged loans as an attractive investment. Characterized by low volatility and attractive risk-adjusted returns, leveraged loans can add value to a portfolio. Leveraged loans tend to outperform their fixed-rate counterparts (for example, high-yield bonds) in an environment of rising rates and an attractive valuation starting point. Only the former criterion is true currently. Risks do exist, however. The increasing share of covenant-lite issues, and rising leverage in the corporate sector are of particular concern. Over the next 6-to-12 months, we do not expect rates to rise substantially, making the asset class somewhat unappealing in the short term. The longer-term outlook is attractive nevertheless, since rates are likely to rise as inflation picks up over the coming years. Feature In today’s environment of ultra-accommodative monetary policy, including low interest rates, and unattractive valuations for fixed-income risk assets, investors have no option but to look beyond conventional fixed-income instruments and dial up their risk appetite. In this Special Report, we run through the mechanics of the leveraged loan market. We analyze historical risk-return characteristics and compare leveraged loans to other assets. We also assess their performance during periods of financial-market stress as well as periods of rising rates and inflation. Finally, we discuss the risks associated with owning leveraged loans. What Are Leveraged Loans? Leveraged loans are a type of syndicated loan made to sub-investment-grade companies. Generally, these firms are highly indebted, with low credit ratings. A syndicated loan is structured, arranged, and administered by one or several commercial or investment banks.1 The majority of these loans are senior secured loans and are based on a floating rate, mostly LIBOR plus a premium (more than 150-200 bps) to account for their riskiness as well as to attract non-bank institutional investors. The interest rates on these loans adjust at regular intervals to reflect changes in short-term interest rates; this constitutes a benefit for investors worried about rising rates. Definitions vary when it comes to categorizing leveraged loans. Some group them based on the borrower’s riskiness and their credit rating. Others consider leverage metrics such as debt-to-capital and debt-to-EBITDA. Other classifications look at the spread at issuance or the purpose of the fund raising, which can include funding mergers and acquisitions (M&A), leveraged buyouts (LBOs), refinancing existing debt, or general funding. Over the past five years, approximately 50% of US leveraged loans issued were for refinancing purposes (Chart 1, panel 1). Within the three categories, LBO financing is deemed the riskiest, and this is reflected in its higher spread (Chart 1, panel 2). The leveraged-loan market became particularly popular in the mid-1980s as M&A activity was soaring (Chart 2). Chart 1Uses Of Leveraged Loans
Is It The Right Time For Leveraged Loans?
Is It The Right Time For Leveraged Loans?
Chart 2The Boom In Corporate Activity In The 1980s Fueled Leveraged Loan Growth
The Boom In Corporate Activity In The 1980s Fueled Leveraged Loan Growth
The Boom In Corporate Activity In The 1980s Fueled Leveraged Loan Growth
There are two common types of financing facilities:2 Term loans: An agreement to borrow a sum of money that is paid back over a certain payment schedule. These loans are mainly provided by non-bank entities. Revolving facilities: A type of loan that can be repeatedly drawn upon and repaid. These loans are mostly originated and held by banks. Estimates for the size of the leveraged-loan market vary depending on which criteria and definitions are used. The size of the leveraged-loan market, following rapid growth since the beginning of the past decade, is estimated to be over $1.2 trillion as of Q2 2020.3 While this represents only a small portion of overall corporate debt (it is only 15% the size of the corporate bond market), the interconnections between key market participants and the role of banks in the market has caught the attention of several regulators such as US Treasury Secretary Janet Yellen, debt investors such as Howard Marks, and international institutions such as the Bank For International Settlements (BIS). The focus of their concerns has been on the declining credit standards for leveraged loans – particularly, the increase in issuance of “covenant-lite” (cov-lite) loans, inconsistent definitions of EBITDA in loan agreements, the growth in use of “EBITDA add backs”,4 and the accuracy of leveraged-loan ratings.5 We discuss some of those concerns in the Risks section. Table 1Risky Loans Are Mainly Held By Non-Bank Entities…
Is It The Right Time For Leveraged Loans?
Is It The Right Time For Leveraged Loans?
Over the past several decades, the role of banks in providing capital to the leveraged loan market has shrunk and has been replaced by non-bank lenders such as mutual funds, hedge funds, insurance companies, and asset managers.6 Data by the Shared National Credit (SNC) program7 shows that non-bank entities in the US now hold close to 83% of all non-investment-grade term loans (Table 1). Moreover, estimates by the Bank of England8 (BoE) show that a quarter of the global stock of leveraged loans (which it estimates at close to $3.4 trillion) is held through collateralized loan obligations (CLOs)9 and approximately half is owned by non-bank institutions. In turn, those non-bank institutions hold a significant portion of CLOs – particularly the riskier tranches. This is not to say that banks are not exposed to leveraged loans. But banks predominantly invest in the highest, AAA, tranche of CLOs, and investment-grade loans.10 Riskier-rated loans are held by CLOs, mutual funds, and other lenders such as hedge funds (Chart 3).11 Chart 3…Particularly Those Rated Below BB
Is It The Right Time For Leveraged Loans?
Is It The Right Time For Leveraged Loans?
Historical Risk And Return Chart 4Leveraged Loans' Relative Performance Moves With Interest Rates
Leveraged Loans' Relative Performance Moves With Interest Rates
Leveraged Loans' Relative Performance Moves With Interest Rates
Since 1997, leveraged loans12 have returned an annualized 4.9%, 25 basis points higher than US Treasurys and approximately 100 and 200 basis points less than US investment-grade and high-yield bonds, respectively. They have underperformed US equities by an annualized 400 basis points over the same period. Declining rates over the past two decades are the most likely reason leveraged loans have underperformed their fixed-rate counterparts. The relative performance of leveraged loans to investment-grade bonds has closely tracked the trajectory of Treasury yields (Chart 4). While the case is not as clear for relative performance against high-yield bonds, the trend is similar. However, on a risk-adjusted return basis, due to reduced volatility, leveraged loans did outperform both equities and high-yield corporate bonds (Table 2). We nevertheless think that volatility is likely understated given the elevated kurtosis. The larger negative skew and excess kurtosis could indicate higher probabilities of large negative returns (Chart 5). Table 2Historical Risk-Return Characteristics
Is It The Right Time For Leveraged Loans?
Is It The Right Time For Leveraged Loans?
Chart 5Leveraged Loans' Returns Exhibit High Kurtosis And Negative Skewness
Leveraged Loans' Returns Exhibit High Kurtosis And Negative Skewness
Leveraged Loans' Returns Exhibit High Kurtosis And Negative Skewness
Why Should Investors Consider Leveraged Loans? Chart 6Rising Rates Support Higher Return From Leveraged Loans...
Rising Rates Support Higher Return From Leveraged Loans...
Rising Rates Support Higher Return From Leveraged Loans...
Our US bond strategists have showed that the odds of leveraged loans outperforming fixed-rate high-yield bonds increase when certain criteria are in place – particularly when valuations are tilted in loans’ favor, and Treasury yields are rising.13 Only the latter criterion is true currently. Year-to-date, leveraged loans have returned 2.2%, higher than the -3.2%, -3.4%, 1.6%, and -3.4% from US Treasurys, investment-grade bonds, high-yield bonds, and emerging markets sovereign debt, respectively (Chart 6). During the same period, Treasury yields rose by 65 basis points. We find that periods of rising Treasury yields are associated with increased flows into the asset class (Chart 7). More interestingly, leveraged loans outperform junk bonds when Treasury yields rise faster than what is discounted in the forwards curve over the following 12 months (Chart 8). Chart 7...As Well As Increased Fund Flows
...As Well As Increased Fund Flows
...As Well As Increased Fund Flows
Chart 8Leveraged Loans Will Benefit If Interest Rates Rise By More Than What Is Discounted In The Forward Curve
Leveraged Loans Will Benefit If Interest Rates Rise By More Than What Is Discounted In The Forward Curve
Leveraged Loans Will Benefit If Interest Rates Rise By More Than What Is Discounted In The Forward Curve
This does not seem to be the case today, however, with the 5-year, 1-year forward about 40 basis points higher than the current 5-year Treasury yield. This is in line with our view that rates are unlikely to rise substantially over the next 6-to-12 months. Inflation, beyond a temporary spike over the next few months, should remain subdued, at least until employment is back to a level which would put upward pressure on wages. This is unlikely before 2023. It is also important to consider the potential trajectory of monetary policy as well as changes in long-term yields. The Fed, through its dot plot, is signaling no increase in the Fed Funds Rate before 2024, but the market is becoming worried about inflationary pressures and pricing in an earlier Fed hike. We believe it unlikely that the Fed will raise rates ahead of what the market expects, unless the labor market returns to “maximum employment” over the next 12 months. The yield on leveraged loans has been lower than on high-yield bonds for most of the period we have data for, except early 2020. Given leveraged loans’ senior position in a firm’s capital structure, it makes sense that their yields are lower. Additionally, the sector composition of the two markets plays a role: Leveraged loans are more exposed to the Technology and Communications sectors and have a limited allocation (averaging 1% over the past seven years) to the Energy sector, unlike high-yield, fixed-rate bonds (where the weight of Energy has averaged 13%) (Chart 9). This was mostly evident when the yield differential collapsed to below -3% during the 2014/2015 oil crash (Chart 10). Chart 9Leveraged Loans’ Sector Weightings
Is It The Right Time For Leveraged Loans?
Is It The Right Time For Leveraged Loans?
Chart 10Loan Spreads Are Not Looking Attractive
Loan Spreads Are Not Looking Attractive
Loan Spreads Are Not Looking Attractive
Chart 11Recent Investor Demand Pushed Up Leveraged Loan Prices
Recent Investor Demand Pushed Up Leveraged Loan Prices
Recent Investor Demand Pushed Up Leveraged Loan Prices
The yield differential has, however, been trending upwards since then, and at current prices, upside may be limited. The recent surge in investor demand has pushed down yields on newly issued leveraged loans, moving the average bid price of leveraged loans above its pre-pandemic high (Chart 11). In the next section, we analyze how leveraged loans have behaved during recessions and other periods of financial market stress. Financial Market Stress Performance In Crises Given the index’s short history, we are able to cover only the past three recessions (the dot-com bubble bust, the Global Financial Crisis (GFC), and the COVID-19 recession). We also look at the 2013 Taper Tantrum and the 2014/2015 oil price shock. In all cases, leveraged loans fell and subsequently recovered along with other fixed-income asset classes. The Taper Tantrum was the most favorable for leveraged loans: 10-year Treasury yields rose by 100 basis points over four months (Chart 12). Table 3 shows that periods of rising rates are a better environment for leveraged loans than those of declining rates. We also looked at a period of Fed tightening and easing cycles – although the timing of easing cycles overlaps with, recessions, dragging down the performance of leveraged loans. We also assess the impact of inflation on leveraged loans using the framework from our Special Report on inflation hedging,14 which decomposed inflation into four quartiles/regimes: Inflation levels below 2.3%, between 2.3% and 3.3%, between 3.3% and 4.9%, and above 4.9%. We add periods of decreasing inflation to our analysis. We note, however, that there was only one period where inflation was over the 4.9% threshold. Chart 12Leveraged Loans Fared Well In Periods Of Credit- And Sector-Specific Distress
Leveraged Loans Fared Well In Periods Of Credit- And Sector-Specific Distress
Leveraged Loans Fared Well In Periods Of Credit- And Sector-Specific Distress
Table 3Leveraged Loans’ Performance During Different Rate Cycles…
Is It The Right Time For Leveraged Loans?
Is It The Right Time For Leveraged Loans?
Table 4…And Inflation Regimes
Is It The Right Time For Leveraged Loans?
Is It The Right Time For Leveraged Loans?
During periods in the first and second inflation quartiles, leveraged loans, in absolute terms, had the highest average annualized returns, 8.1% and 10% respectively. This makes sense since in those regimes, policy rates are low and bond yields begin to rise given robust growth. Leveraged loans, however, underperformed fixed-rate bonds during those periods. Inflation above 3.3% represents an environment in which the economy begins to overheat and growth to falter. This regime saw leveraged loans outperform high-yield bonds by an annualized 1.5%. Periods of declining inflation also showed moderately positive annualized returns for leveraged loans (Table 4). Risks Chart 13Corporate Health Has Worsened...
Corporate Health Has Worsened...
Corporate Health Has Worsened...
The growth of the leveraged loans market reflects multiple trends but, most importantly, a broad increase in corporate leverage, driven by a decline in interest rates and increasing availability of cheap financing. The debt-to-asset ratio of nonfinancial businesses, a gauge of corporate leverage, is at a 20-year high (Chart 13, panel 1). This raises concerns about the overall health of the corporate sector – particularly firms’ ability to service their debt – since the median interest coverage ratio is near a level last seen during the GFC. This measure is even negative for companies within the 25th percentile, meaning companies in that bucket lack funds to maintain their interest payments (Chart 13, panel 2). Trends in the leveraged loan market paint a similar picture. The share of newly issued loans by the most highly levered firms – those with a debt-to-EBITDA ratio of 6x or higher – has reached new highs, hitting 37% of new loans in Q3 2020 (Chart 14). Chart 14…Even For Leveraged Lending
Is It The Right Time For Leveraged Loans?
Is It The Right Time For Leveraged Loans?
Chart 15Cov-Lite Issuances Make Up Almost 80% Of New Issuances
Is It The Right Time For Leveraged Loans?
Is It The Right Time For Leveraged Loans?
The providers of capital are partly to blame. Even with credit standards deteriorating, firms looking for capital were mostly able to find it. The share of cov-lite structures – loans that lack the protective covenants found in traditional loans – continues to grow and now comprises almost 80% of new issuance (Chart 15). Cov-lite loans typically do not have any maintenance covenants, requirements to maintain certain ratios such as leverage or interest-coverage ratios.15 Instead, they feature incurrence covenants which have to be met only if the issuer wants to take particular actions, such as taking on more debt.16 This loosening of credit terms is mostly a function of increased demand, particularly by CLO buyers and other non-bank institutional investors, in an environment of low yields. Some have even warned that vulnerabilities in the leveraged-loan market could cause disturbance to the overall financial system. Particularly, memories of the GFC and worries about the “originate-to-distribute” model – whereby banks originate loans but retain only a fraction on their balance sheets – have led some observers to suggest this could all lead to a risky expansion of credit, and trigger a new financial crisis. Chart 16Leveraged Loans Have Higher Average Credit Ratings…
Is It The Right Time For Leveraged Loans?
Is It The Right Time For Leveraged Loans?
We do not share this skepticism. Banks’ exposure to leveraged loans is mainly via the highest tranches of CLOs. Banks’ liquidity requirements have increased since the GFC, and therefore contagion should be minimal in the event of problems in the loan market. A recent report by the US Government Accountability Office (GAO) did not find evidence that leveraged lending presented a significant threat to financial stability.17 Additionally, almost all leveraged loans are first lien, they have a senior secured position in the capital structure, higher average credit ratings than high-yield bonds (Chart 16), and lower default rates (Chart 17). Moreover, their five-year average recovery rate of 63% tops the 40% of senior unsecured bonds (Chart 18). Chart 17...Lower Default Rates...
...Lower Default Rates,...
...Lower Default Rates,...
Chart 18...And Higher Recovery Rates Than High-Yield Bonds
...And Higher Recovery Rates Than High-Yield Bonds
...And Higher Recovery Rates Than High-Yield Bonds
Conclusion In a period of ultra-low interest rates and stretched valuations for risk assets, leveraged loans have emerged as an interesting asset class for investors. Due to lower volatility, leveraged loans have historically produced higher risk-adjusted returns than fixed-rate high-yield bonds. However, volatility is likely understated given elevated levels of kurtosis. Historically, rising Treasury yields and an attractive valuation starting-point provided a signal for leveraged loans’ outperformance. Only one of those two criteria are currently in place. In the next 6-to-12 months, we do not believe rates will rise substantially, making this asset class somewhat unattractive in the short term. The longer-run outlook for leveraged loans, however, is attractive. As inflation, and therefore rates, rise over the next two-to-three years, a moderate allocation to leveraged loans might be a useful hedge for investors. Amr Hanafy Senior Analyst amrh@bcaresearch.com Footnotes 1 Please see “LCD Loan Primer – Syndicated Loans: The Market and the Mechanics,” S&P Global Market Intelligence. 2 Please see “Leverage Lending FAQ & Fact Sheet,” SIFMA, February 2019. 3 Please see “Federal Reserve Financial Stability Report,” November 2020. 4 “EBITDA add backs” add back expenses and cost savings to earnings and could inflate the projected capacity of the borrowers to repay their loans. 5 Please see Todd Vermilyea, “Perspectives On Leveraged Lending,” The Loan Syndications and Trading Association 23rd Annual Conference, New York, October 24, 2018. 6 Please see “Global Financial Stability Report: Vulnerabilities in a Maturing Credit Cycle, Chapter 1,” IMF, April 2019. 7 The SNC Program is an interagency program designed to review and assess risk in the largest and most complex credits shared by multiple financial institutions. The SNC Program is governed by an interagency agreement among the three federal bank regulatory agencies - the Board of Governors of the Federal Reserve System (FRB), the Federal Deposit Insurance Corporation (FDIC), and the Office Of the Comptroller Of The Currency (OCC). 8 Please see “Financial Stability Report,” Bank of England, August 2020. 9 CLOs are asset-backed securities issued by a special purpose vehicle which acquire a portfolio of leveraged loans. 10 Please see “Turns Out Leveraged Loans Aren’t a Systemic Risk After All,” Bank Policy Institute, February 8, 2020. 11 Please see Seung Jung Lee, Dan Li, Ralf R. Meisenzahl, and Martin J. Sicilian, “The U.S. Syndicated Term Loan Market: Who holds what and when?”, November 25, 2019. 12 For the purpose of this report, we use the S&P/LSTA Leveraged Loan Index, which tracks the market-weighted performance of US dollar-denominated institutional leveraged loan portfolios. 13 Please see US Bond Strategy Report, “The Price Of Safety,” dated January 27, 2015. 14 Please see Global Asset Allocation Special Report, “Investors’ Guide To Inflation Hedging: How To Invest When Inflation Rises,” dated May 22, 2019. 15 Please see Eric Goodison And Margot Wagner, Paul, Weiss, Rifkind, Wharton & Garrison Llp, “Covenant-Lite Loans: Overview,” August 2019. 16 Please see Scott Essexx, Alexander Ott, Partners Group, “The Current State Of The Leveraged Loan Market: Are There Echoes Of The 2008 Subprime Market?”, March 2019. 17 Please see “Financial Stability: Agencies Have Not Found Leveraged Lending To Significantly Threaten Stability But Remain Cautious Amid Pandemic,” United States Government Accountability Office, December 2020.
BCA Research’s US Bond Strategy service recommends investors remain underweight MBS within a US bond portfolio, but favor 4% and 4.5% coupons over 2%, 2.5% and 3% coupons within the Agency MBS coupon stack. Agency MBS have not performed well since bond…
Ultra-easy monetary policy combined with extremely stimulative fiscal policy have created a fertile environment for stocks to outperform bonds over a 12-month horizon. However, random deflationary shocks along the way are bound to occur, which will cause…
BCA Research’s Global Fixed Income Strategy service concludes that the cyclical rise in yields is not over yet. The overall flow of US economic data has been disappointing versus elevated expectations, as evidenced by the almost uninterrupted decline in…
Highlights Duration: The pace of rate hikes currently priced into the market is reasonable. However, we see strong odds that market expectations will move higher in the coming months, the result of continued strong economic data and the Fed starting to talk about tapering its asset purchases. Investors should maintain below-benchmark portfolio duration. MBS: MBS remain unattractive compared to other US spread products. But within an underweight allocation to MBS, an up-in-coupon bias makes sense. Inflation: Year-over-year CPI inflation was pushed higher by base effects in March, but the report also showed evidence of mounting inflationary pressures beyond simple base effects. Feature After a sizeable drop last Thursday, Treasury yields are now significantly off their recent highs. The 10-year Treasury yield peaked at 1.74% on March 31st but ended last week at only 1.59%. What makes the drop puzzling is that yields are down despite a string of very strong US economic data (Chart 1). This recent development bears a resemblance to the famous 2004/05 bond conundrum when Fed Chairman Alan Greenspan struggled to understand why long-maturity Treasury yields were falling even as the Fed lifted short rates.1 Today, investors are also struggling to understand why long-maturity Treasury yields are falling, only this time the “conundrum” is that they are falling in the face of strong economic data. From our perch, both conundrums have the same answer: The market has already discounted a lot of the news. On June 29th, 2004 – the day before the first rate hike of that cycle – the overnight index swap (OIS) curve was priced for 243 bps of Fed rate hikes for the following 12 months. The Fed went on to deliver 200 bps of rate hikes during that timeframe, slightly less than the market expected. In that environment it is entirely consistent that bond yields should fall (Chart 2). Chart 1Yields Down On Strong Data
Yields Down On Strong Data
Yields Down On Strong Data
Chart 2The 2004/05 Bond Conundrum
The 2004/05 Bond Conundrum
The 2004/05 Bond Conundrum
Today, the OIS curve is priced for the Fed to lift rates off the zero bound in December 2022 and for a total of 86 bps of rate hikes by the end of 2023 (Chart 3). Given the Fed’s new Average Inflation Targeting regime, this sort of rate hike cycle will only be achieved if there is a very strong US economic recovery. The incoming US data are so far confirming that narrative but haven’t been strong enough to move rate expectations even higher. Chart 3Market Priced For December 2022 Liftoff
Market Priced For December 2022 Liftoff
Market Priced For December 2022 Liftoff
As we wrote in last week’s report, we think that the market’s current rate hike expectations look reasonable.2 However, we see a meaningful risk that they could move higher in the coming months as the rapid US economic recovery continues and the Fed starts to back away from its extremely dovish messaging. Chart 4US Will Hit 75% Vaccination Well Before September
US Will Hit 75% Vaccination Well Before September
US Will Hit 75% Vaccination Well Before September
For example, Fed Chair Jay Powell has said repeatedly that it is too soon to talk about tapering the Fed’s asset purchases. We worry, however, that this tone might be giving investors a false sense of security. If the economic recovery continues at its current pace, we fully expect the Fed to start talking about tapering this year and to begin the process either by the end of 2021 or in early 2022. Last week, St. Louis Fed President Jim Bullard said he would be comfortable starting discussions about tapering when 75%-80% of the US population has been vaccinated. We estimate that if vaccinations continue at a linear pace, we will hit 75% vaccination by September (Chart 4). Given the exponential trend in vaccinations so far, we are likely to reach 75% well before September. The bottom line is that we see the pace of rate hikes currently priced into the market as reasonable. However, we also see strong odds that market expectations will move higher in the coming months, the result of continued strong economic data and the Fed starting to talk about tapering its asset purchases. Investors should maintain below-benchmark portfolio duration. MBS: Stay Up In Coupon Unsurprisingly, the reflation trade has been beneficial for risk assets. Within US fixed income, spread products have generally outperformed Treasuries since bond yields bottomed last August. However, certain spread sectors have fared better than others. Agency Mortgage-Backed Securities, for example, have not done that well. Conventional 30-year Agency MBS have only outperformed a duration-matched position in Treasury securities by 73 bps since bond yields bottomed on August 4th, 2020 (Chart 5). This compares to 446 bps of outperformance for Aaa-rated corporates, 342 bps of outperformance for Aa-rated corporates (Chart 5, panel 2) and 232 bps of outperformance for Agency CMBS (Chart 5, panel 3). Only notoriously low-risk Aaa-rated consumer ABS have delivered less outperformance than Agency MBS (Chart 5, bottom panel). While Agency MBS have not performed well overall, certain segments of the coupon stack have delivered decent excess returns. Specifically, higher coupon MBS have performed much better than low coupon MBS during the recent back-up in yields. Since last August, 4% coupon MBS have outperformed duration-matched Treasuries by 176 bps and 4.5% coupons have outperformed by 257 bps. Meanwhile, 2.5% coupons have underperformed by 10 bps and 3% coupons have underperformed by 15 bps (Chart 6). Chart 5Spread Product Performance Since Trough In Bond Yields
Spread Product Performance Since Trough In Bond Yields
Spread Product Performance Since Trough In Bond Yields
Chart 6Favor Premium Coupons In Rising Rate Environment
Favor Premium Coupons In Rising Rate Environment
Favor Premium Coupons In Rising Rate Environment
The divergent performance between high and low coupons is easily explained by the risk characteristics of those bonds. Looking at the difference between the 2.5% and 4% coupons, for example, we see that the 2.5% coupons have significantly higher duration and significantly lower convexity (Chart 6, bottom 2 panels). The higher duration means that rising yields hurt 2.5% coupons more and the lower convexity means that rising yields will cause the gap between 2.5% coupon duration and 4% coupon duration to widen further. In short, a rising yield environment is terrible for low-coupon MBS. Conversely, high duration and low convexity are desirable attributes in a falling yield environment. If bond yields fall meaningfully going forward, then low-coupon MBS will outperform the high coupons. Chart 7A shows how option-adjusted spread (OAS) varies with duration across the conventional 30-year Agency MBS coupon stack. We see that the lowest coupons have the highest durations and the lowest OAS. Premium coupons have low durations and high OAS. Chart 7AAgency MBS 30-Year Conventional Coupon Stack: OAS vs. Duration
A New Conundrum
A New Conundrum
Chart 7B shows how OAS varies with convexity across the coupon stack. Here we see that the 2%, 2.5% and 3% coupons have the most negative convexities. This makes sense as those coupons are closest to the current mortgage rate of 3.04%. A further increase in the mortgage rate would make those coupons less likely to refinance, causing durations to extend meaningfully. Conversely, a drop in the mortgage rate would lead to greater refinancings for those coupons, causing durations to shorten. Notice that 1.5% coupon MBS have relatively high convexity. This is because refinancing is already unattractive for those bonds, and the duration of the 1.5% index has already extended. Chart 7BAgency MBS 30-Year Conventional Coupon Stack: OAS vs. Convexity
A New Conundrum
A New Conundrum
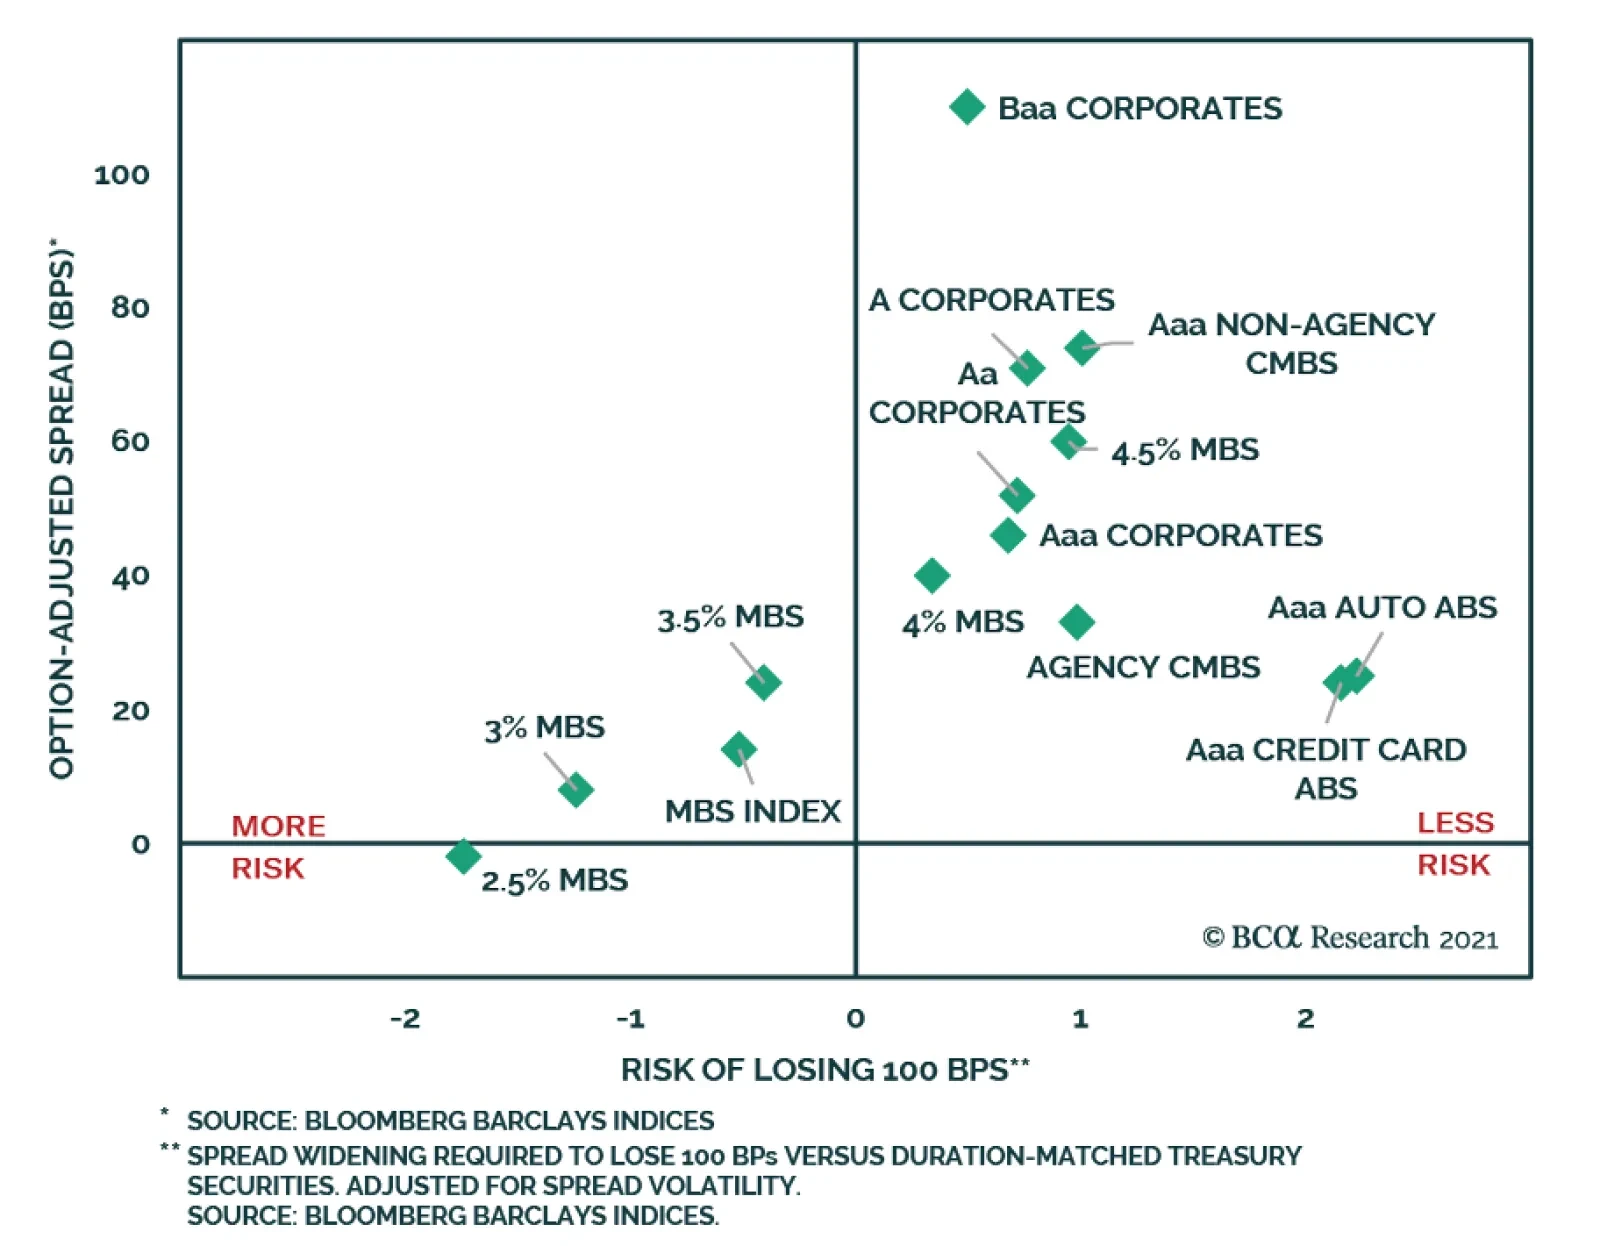
Given our view that US Treasury yields will be flat-to-higher for the next 6-12 months, we recommend an up-in-coupon bias within Agency MBS. Specifically, the 2%, 2.5% and 3% coupons have the most scope for duration extension in a rising yield environment and should be avoided. The 4% and 4.5% coupons, on the other hand, are less negatively convex and are better able to weather the storm of rising bond yields. In a flat bond yield environment, the best performing coupons are likely to be those with the widest OAS. This makes the 4% and 4.5% coupons look much more attractive than the 1.5% coupons, even though they have similar convexities. Overall, we recommend owning the 4% and 4.5% coupons within the conventional 30-year Agency MBS coupon stack and avoiding the 2%, 2.5% and 3% coupons. One final point worth making is that we also continue to recommend an underweight allocation to MBS within a US bond portfolio. That is, though higher coupon MBS look better than the low coupons, the entire sector looks unattractive compared to alternatives like consumer ABS, Agency CMBS and even investment grade corporate bonds. Chart 8 shows a version of our Excess Return Bond Map, a visual guide that is useful for quickly assessing the risk/reward trade-off between different US spread products.3 The Map shows OAS as a measure of expected return on the Y-axis, and a proprietary risk measure called the “Risk Of Losing 100 Bps” on the X-axis. A higher number on the X-axis indicates less risk of losing 100 bps and vice-versa. Chart 8Excess Return Bond Map
A New Conundrum
A New Conundrum
Our Bond Map makes it clear that only 4% and 4.5% coupon MBS come close to offering a risk/reward balance that is comparable to other spread sectors. MBS coupons below 4% offer far too little expected return given the amount of risk. Bottom Line: Remain underweight MBS within a US bond portfolio, but favor 4% and 4.5% coupons over 2%, 2.5% and 3% coupons within the Agency MBS coupon stack. March CPI More Than A Base Effect It was well known heading into last week’s March CPI release that the year-over-year inflation number was going to be very strong. This is due to base effects that will persist through to the end of May. That is, 12-month inflation is bound to rise as the negative monthly inflation prints from March, April and May 2020 fall out of the 12-month rolling sample. Year-over-year inflation numbers did indeed rise sharply in March (Chart 9). 12-month headline CPI jumped from 1.68% to 2.64% and 12-month core CPI increased from 1.28% to 1.65%. Base effects exert less influence over the trimmed mean CPI, and that index rose only from 2.04% to 2.12%. The gap between 12-month core CPI and 12-month trimmed mean CPI remains wide, but it should close by May when the impact from last year’s base effects is exhausted (Chart 9, bottom panel). Chart 9Annual Inflation
Annual Inflation
Annual Inflation
Chart 10Monthly Inflation
Monthly Inflation
Monthly Inflation
But base effects were only part of the story last week. Month-over-month inflation also came in very strong for the headline, core and trimmed mean measures. Headline CPI rose 0.62% in March, core CPI rose 0.34% and the trimmed mean rose 0.24% (Chart 10). To put those numbers in context, if those monthly prints are repeated in April and May, 12-month headline CPI will rise to 4.75% by May and 12-month core CPI will rise to 2.79%. Even if we assume more typical 0.15% inflation rates for April and May, we would still expect 12-month headline CPI to reach 3.77% by May and 12-month core CPI to reach 2.41%. Overall, the message from March’s CPI report is that the economy is showing signs of mounting inflationary pressures beyond simple base effects. We have previously written about the ample evidence of bottlenecks in both the goods and service sectors, and we now appear to be seeing those bottlenecks show up in the price data.4 There’s little doubt that 12-month inflation will fall somewhat between May and the end of the year. However, we anticipate that inflation will still be close to the Fed’s target by the end of 2021. This will certainly be the case if the monthly inflation figures remain consistent with March’s print. The main investment implication from this view is that low inflation will not prevent the Fed from tapering its asset purchases either late this year or early next year, and it also won’t prevent the Fed from lifting rates in 2022. Footnotes 1 Greenspan’s remarks: https://www.federalreserve.gov/boarddocs/hh/2005/february/testimony.htm 2 Please see US Bond Strategy Weekly Report, “Overshoot Territory”, dated April 13, 2021, available at usbs.bcaresearch.com 3 For more details on the Bond Map please see page 16 of US Bond Strategy Portfolio Allocation Summary, “It’s A Boom!”, dated April 6, 2021, available at usbs.bcaresearch.com 4 Please see US Bond Strategy Weekly Report, “Limit Rate Risk, Load Up On Credit”, dated March 16, 2021, available at usbs.bcaresearch.com Ryan Swift US Bond Strategist rswift@bcaresearch.com Fixed Income Sector Performance Recommended Portfolio Specification
Highlights Chart of the WeekThe Bond Bear Mantle Being Passed To Canada?
The Bond Bear Mantle Being Passed To Canada?
The Bond Bear Mantle Being Passed To Canada?
US Treasuries: The steady climb of US bond yields has left longer-maturity Treasuries in an oversold position. However, underlying growth and inflation momentum remains bond bearish and the Fed is likely to begin preparing the market later this year for a tapering of asset purchases in 2022. Maintain a medium-term defensive posture towards US Treasuries (below-benchmark duration and an underweight country allocation). Canada: The Canadian economy is gaining significant positive momentum, with an increased pace of vaccinations boosting optimism despite a third wave of COVID-19. We now see a growing risk of the Bank of Canada shifting to a less dovish policy stance sometime in the next few months, led by a tapering of its bond buying – perhaps even before the Fed does the same (Chart of the Week). Downgrade Canadian government bonds to underweight in global fixed income portfolios. US Treasuries: The Pause That Refreshes Chart 2UST Yield Uptrend Has Paused
UST Yield Uptrend Has Paused
UST Yield Uptrend Has Paused
After leading the global government bond market selloff over the past several months, US Treasury yields have calmed down of late. The 10-year Treasury yield is down 14bps from the most recent peak of 1.74% reached March 31, while the 30-year Treasury yield is down 16bps from the peak of 2.45% reached on March 18. These moves have been concentrated in the real yield component, with inflation breakevens stable, as the 10yr and 30yr TIPS yields are down -15bps and -20bps, respectively, since the dates of those peaks in nominal yields (Chart 2). The drift lower in US yields has occurred in the face of an explosive surge in US economic data. Retail sales rose +9.8% in March compared to February and a staggering +27.7% on a year-over-year basis. The Fed’s regional manufacturing surveys showed very robust results for April, with the New York Empire State index hitting the highest level since October 2017 and the Philadelphia Fed headline index surging to a level last seen in 1973. This follows the very strong payrolls and ISM data for March that came out in early April. Yet the US economic data is not unanimously positive. The latest readings from the University of Michigan consumer confidence and NFIB small business optimism surveys both remained well below pre-pandemic peaks (Chart 3). Annual core CPI inflation only inched up 0.2 percentage points in March to 1.6%, a tepid move compared to the base effect driven surge that took year-over-year headline CPI inflation from 1.7% in February to 2.6%. Chart 3Some Mixed Messages From Recent US Data
Some Mixed Messages From Recent US Data
Some Mixed Messages From Recent US Data
Chart 4Fewer Positive US Data Surprises
Fewer Positive US Data Surprises
Fewer Positive US Data Surprises
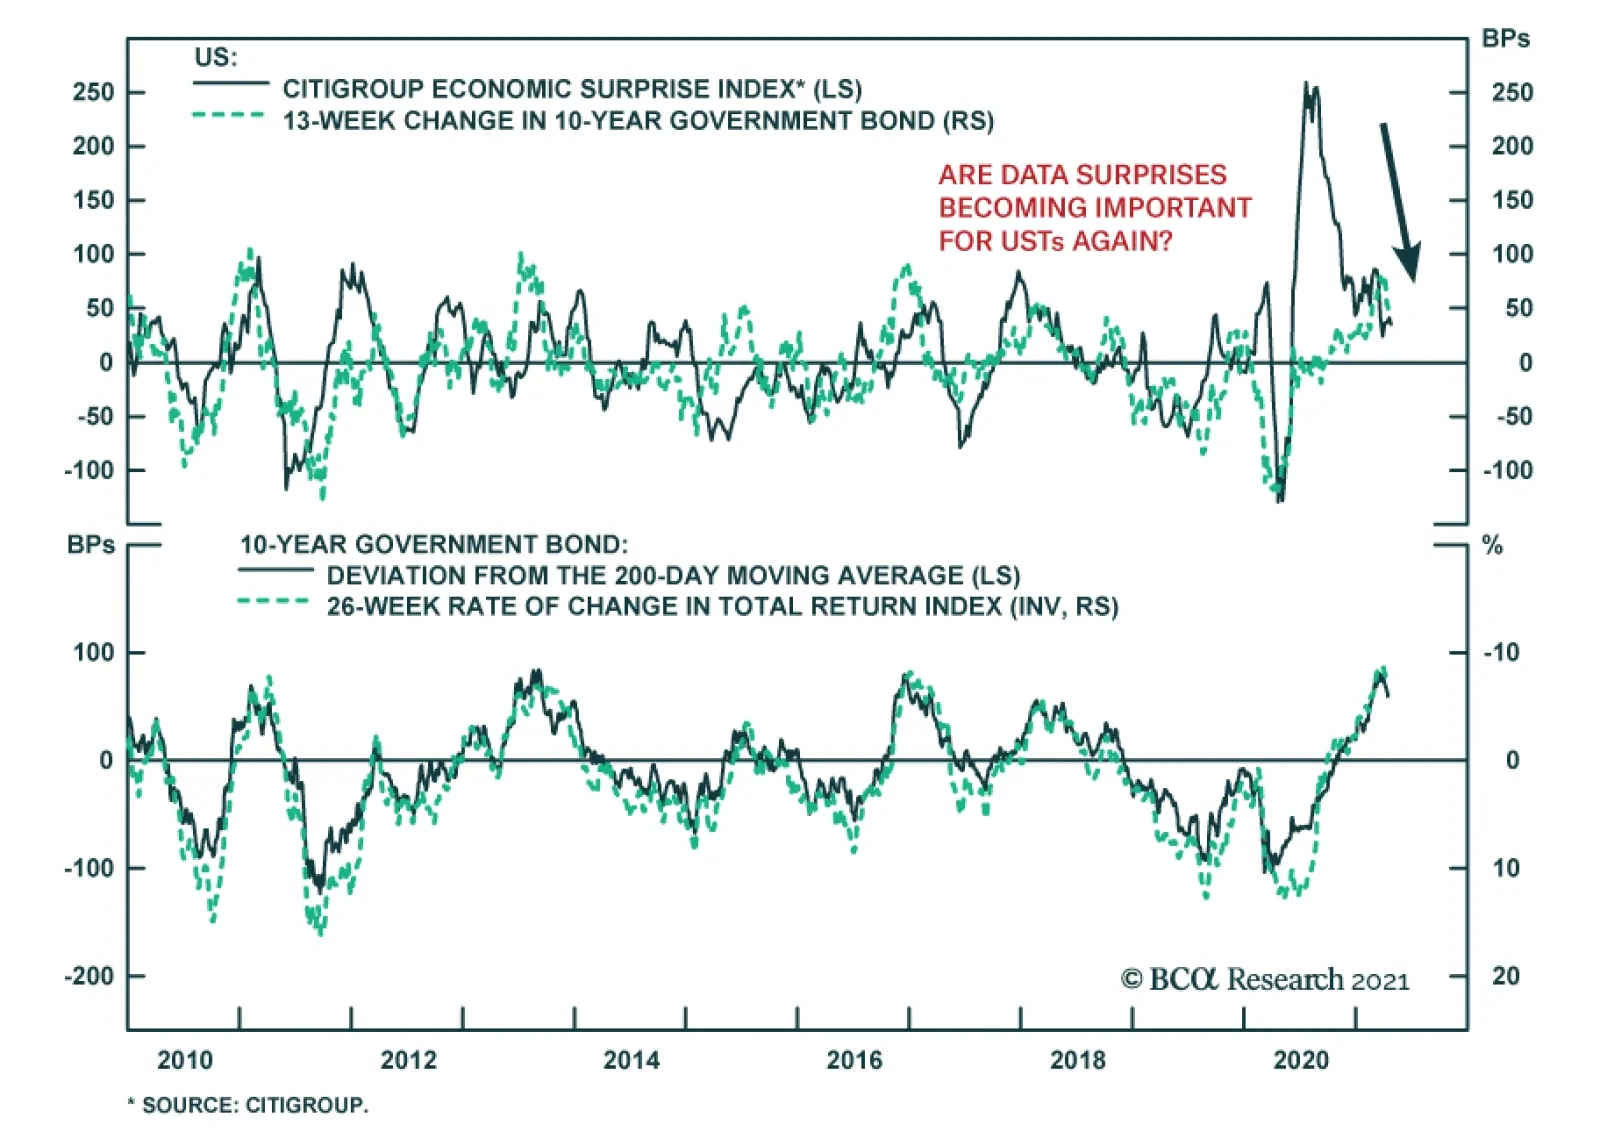
The overall flow of US economic data has been disappointing versus elevated expectations, as evidenced by the almost uninterrupted decline in the Citigroup US data surprise index since peaking in July of 2020 (Chart 4). This indicator reliably correlated to the momentum of US Treasury yields prior to the COVID-19 outbreak and now, given the bullish growth combination of vaccine optimism and fiscal stimulus, the bond market’s focus is returning to how US data evolves versus expectations - and what that means for the Fed’s future moves on monetary policy. The most senior leadership at the Fed continues to send a consistent message on policy, with no rate hikes expected before 2024 and no hints at when the tapering of quantitative easing (QE) could begin. Yet some Fed officials have started to be a bit more vocal about their comfort level with the current accommodative policy stance and the associated risks to financial stability and inflation. Last week, Dallas Fed President Robert Kaplan noted that he would like to see the Fed begin to withdraw its support for the economy “at the earliest opportunity”. St. Louis Fed President James Bullard was even more specific, noting that once the share of vaccinated Americans reaches “herd immunity” levels of 75-80%, it will be time for the Fed to debate tapering QE. At the moment, however, there is no need for the Fed to move preemptively. Our Fed Monitor - comprised of economic, inflation and financial market data that would signal pressure for the Fed to ease or tighten policy – is at a neutral level (Chart 5). Our 12-month Fed discounter, which measures the change in interest rates over the next year that is priced into the US overnight index swap (OIS) curve, is at 7bps, consistent with a stand-pat Fed. The latest read this month from the New York Fed’s Survey of Primary Dealers (and Survey of Market Participants) showed no change in the median longer-run expectation for the fed funds rate of 2.25% that has prevailed over the past year (middle panel) – despite a sharp recovery in US growth expectations. Chart 5UST Valuations A Bit Stretched
UST Valuations A Bit Stretched
UST Valuations A Bit Stretched
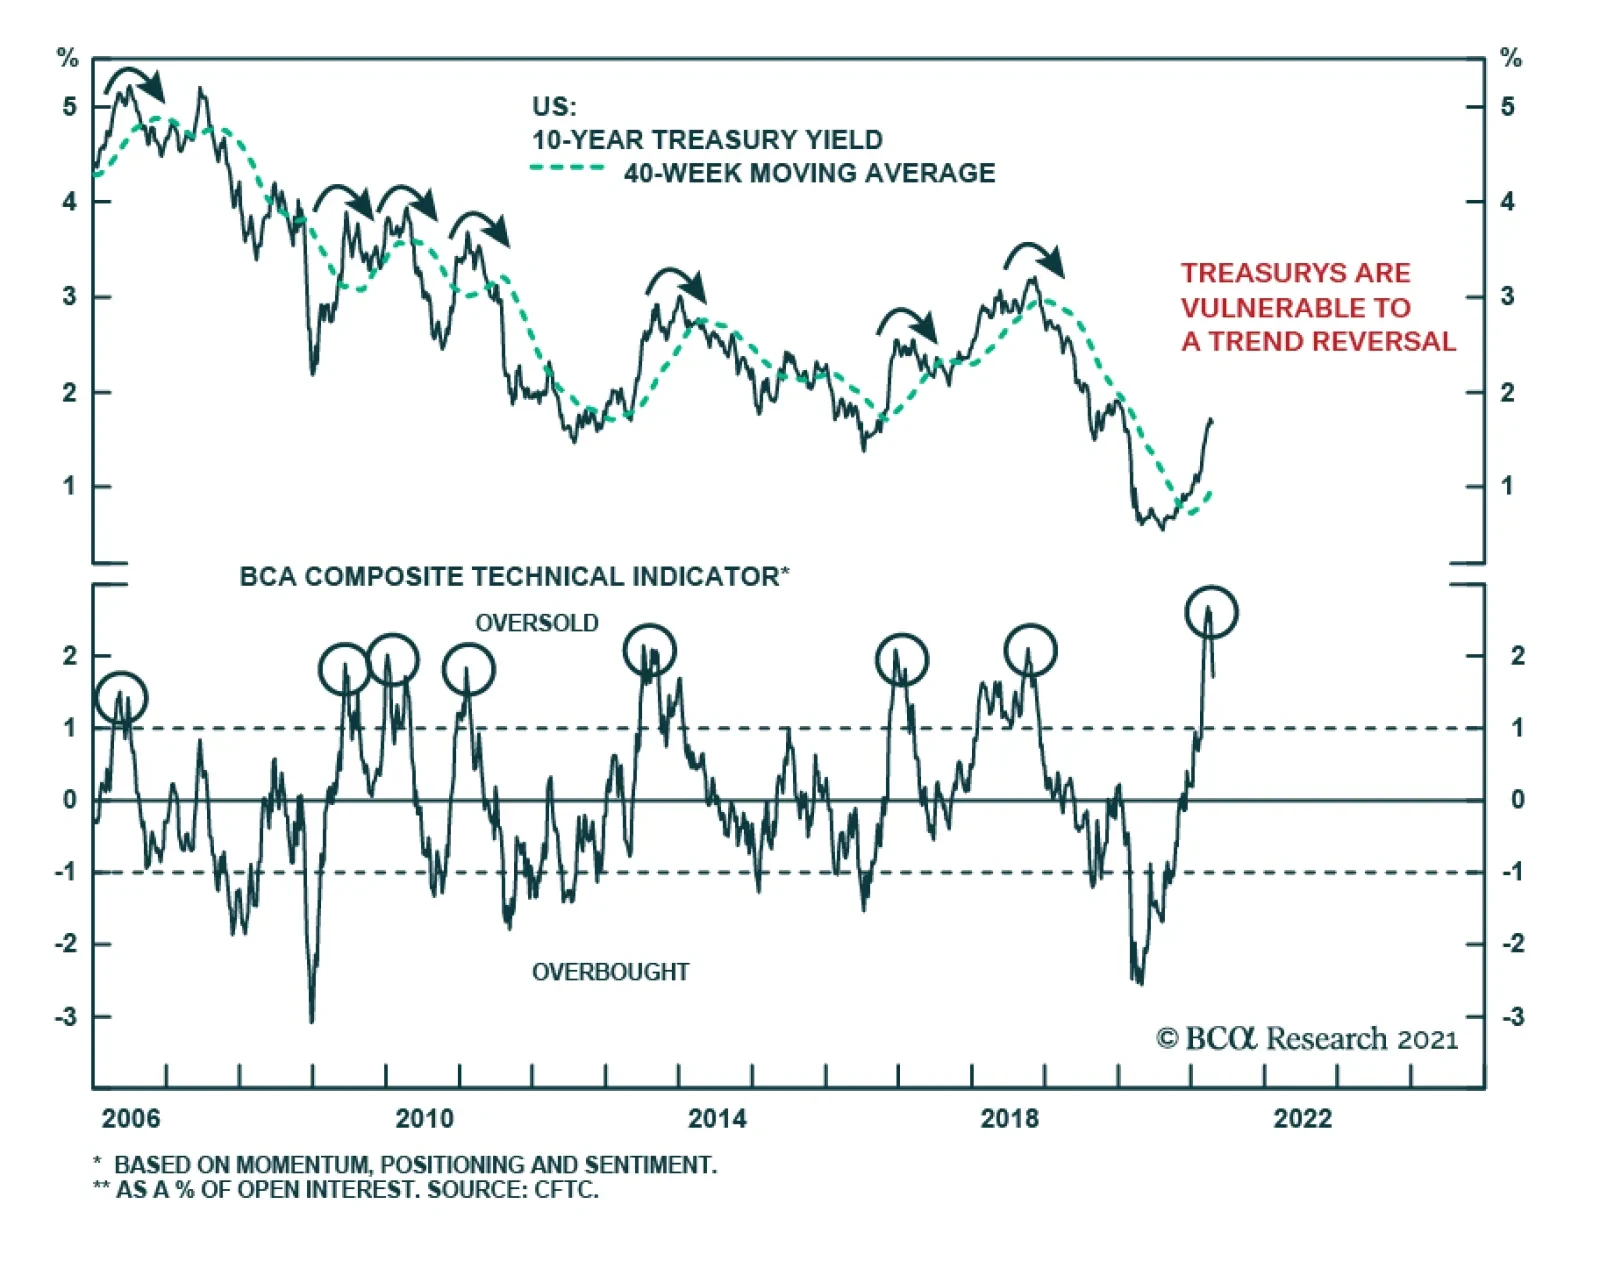
The market pricing of the Fed’s next move is still relatively benign, with liftoff not expected until February 2023. This suggests that a pause in the trend of rising Treasury yields was essentially the market getting a bit ahead of itself in pricing in higher longer-term yields. This can be seen by looking at various valuation measures. For example, the 5-year/5-year forward Treasury yield now sits at 2.4%, which is at the high end of the range of longer-run fed funds rate expectations from the Primary Dealer survey. Also, various measures of the term premium on 10-year Treasury yields have returned to the above-zero levels last seen during the Fed’s 2016-2018 rate hiking cycle – even with the Fed not signaling any need to tighten policy in response to rising inflation expectations. Despite these signs of stretched near-term UST valuation, there is still no sign of major global bond investors being comfortable with increasing exposure to Treasuries. For example, despite yields on 10-year Treasuries (hedged into euros and yen) looking historically attractive compared to the near-zero yields on JGBs and sub-zero yields on German Bunds, the US Treasury’s capital flow data shows that foreign investors remain net sellers of Treasuries (Chart 6). It is possible that those foreign buyers need more evidence of a sustained decrease in US bond volatility before moving money into US Treasuries, where duration losses from higher US yields could wipe out the yield pickup from moving into US bonds. While valuations are a bit stretched for Treasuries, technicals appear very oversold. Both the deviation of the 10-year Treasury yield from its 200-day moving average, and the 6-month rate of change of the Bloomberg Barclays US Treasury total return index, are at levels seen only four previous times since 2010 (Chart 7). The JP Morgan client duration positioning surveys and the Market Vane Treasury sentiment index are also approaching post-2010 bearish extremes. It should be noted that both of those measures reached even more bearish extremes during the latter half of the Fed’s 2026-2018 tightening cycle, so there is potential for Treasury sentiment to become even more bearish once the Fed starts to tighten monetary policy – a scenario looking increasingly likely over the next 6-12 months. Chart 6No Foreign Bid For USTs (Yet)
No Foreign Bid For USTs (Yet)
No Foreign Bid For USTs (Yet)
Chart 7USTs Are Technically Oversold
USTs Are Technically Oversold
USTs Are Technically Oversold
We continue to expect a robust US economy and rising inflation to force the Fed to begin preparing the market in the latter half of 2021 for QE tapering in 2022, with the first rate hike of the next tightening cycle coming in late 2022. As that outcome appears largely consistent with current market pricing, amid oversold technicals, it is likely that Treasury yields will continue to move sideways over at least the next few weeks. Yet there is little to suggest that yields have peaked and are about to enter a new downtrend, given the accelerating pace of US vaccinations that is boosting optimism on an eventual end to the US leg of the pandemic. Stay defensive on US Treasury exposure, as the cyclical rise in yields is not over yet. Bottom Line: The steady climb of US bond yields has left longer-maturity Treasuries in an oversold position. However, underlying growth and inflation momentum remain bond bearish and the Fed is likely to begin preparing the market later this year for tapering of asset purchases in 2022. Maintain a medium-term defensive posture towards US Treasuries (below-benchmark duration and an underweight country allocation). Canada: Downgrade To Underweight In a Special Report published back in February along with our colleagues at BCA Foreign Exchange Strategy, we outlined the case for placing Canadian government debt on “downgrade watch” in global fixed income portfolios.1 We expected Canadian bond yields to continue rising along with the rise in global bond yields and, hence, we maintained our below-benchmark recommended duration exposure within Canada. Chart 8Canada: A High Beta Bond Market Once Again
Canada: A High Beta Bond Market Once Again
Canada: A High Beta Bond Market Once Again
However, we concluded that it was too soon to shift to a full-blown underweight stance on Canadian government bonds with COVID-19 cases still raging through the country, the vaccination program off to a very slow start, and the Bank of Canada (BoC)’s QE program preventing Canadian bonds from returning to their usual “high-beta” status within developed economy bond markets. It now appears that we were too cautious on that front. Canadian government bonds have been one of the worst performing markets year-to-date within the Bloomberg Barclays Global Government bond index, delivering a local currency return of –4.1% - worse than the -3.5% return earned on US Treasuries so far in 2021.2 It is clear that the Canadian government bonds are once again a market more sensitive to global interest rate moves (Chart 8). In that February Special Report, we laid out three factors that could prompt the BoC to move to a less dovish, and more bond bearish, monetary policy stance faster than we expected. Much of that list has already started to come to fruition. 1) Good News On The Vaccine Rollout Sadly, Canada is suffering a third wave of COVID-19 cases that has resulted in the nation’s most populous province, Ontario, implementing the harshest lockdown yet seen during the pandemic. Yet the pace of vaccinations has also been rising with the share of Canadians receiving at least one jab is now 21% (Chart 9) - higher than that of the overall European Union (EU). Canada is now administering more daily vaccinations than both the UK and EU. The quickening pace of vaccinations is already providing a major lift to Canadian economic confidence. The Bloomberg Nanos consumer confidence index is at an all-time high (Chart 10), while the BoC’s Business Outlook Survey for the spring of 2021 was incredibly solid. Two-thirds of firms in that survey expect sales to exceed pre-pandemic levels, even with the latest upturn in COVID-19 cases. Chart 9Canadian Vaccine Rollout Improving
Some Bond Bearish Tales From Both Sides Of The 49th Parallel
Some Bond Bearish Tales From Both Sides Of The 49th Parallel
Chart 10Booming Optimism
Booming Optimism
Booming Optimism
The BoC’s Q1/2021 Consumer Survey showed similar levels of optimism. 74% of Canadians surveyed aged 25-54 are planning to engage in levels of social and economic activities equal to, or greater than, those seen prior to the pandemic once the majority is vaccinated (Chart 11). A net majority (18%) of those surveyed plan to spend more on the types of “high-touch” service spending unavailable during the pandemic, like travel, movies and dining in restaurants, once a majority is vaccinated (Chart 12). Chart 11Canadians Are Ready To Have Fun Once Again
Some Bond Bearish Tales From Both Sides Of The 49th Parallel
Some Bond Bearish Tales From Both Sides Of The 49th Parallel
All of the Canadian survey data is sending a clear message: a faster vaccine rollout will leader to much faster spending by consumers and businesses. 2) Signs Of Financial Stability Risks Highly-indebted Canadians' love affair with real estate has always concerned the BoC. While a combination of cutting policy interest rates to zero and ramping up QE helped stabilize Canadian financial markets during the 2020 pandemic shock, it has also set off a new surge of housing speculation. According to the Bloomberg Nanos consumer survey, 67% of Canadians now expect house prices to appreciate. The demand for homes has given a lift to the Canadian economy through a surge in new housing starts (residential investment is 8% of Canadian real GDP), while pushing national house price inflation back above 10% (Chart 13). Chart 12A Surge In "High-Touch" Spending Awaits Canadian Herd Immunity
Some Bond Bearish Tales From Both Sides Of The 49th Parallel
Some Bond Bearish Tales From Both Sides Of The 49th Parallel
As already indebted Canadian households pile on more debt to partake in another national home-buying party, the BoC must now concern itself with the potential financial stability risks from a too-rapid rise in housing values. Chart 13Yet Another Canadian Housing Boom
Yet Another Canadian Housing Boom
Yet Another Canadian Housing Boom
In a recent speech, BoC Deputy Governor Toni Gravelle noted that the BoC had to introduce QE in 2020 to help fight COVID-related dysfunction across a variety of Canadian financial markets, including government bonds where liquidity dried up.3 Gravelle also noted that the BoC would begin to dial back QE once it was clear that financial markets no longer needed the support from QE. With Canadian equities booming and Canadian corporate bond spreads near the lowest levels of the past decade (Chart 14), it seems clear that the BoC can begin dialing back its government bond purchase program if it is no longer necessary and likely fueling another housing bubble. 3) Additional Large Fiscal Stimulus The governing Canadian Liberal government of Prime Minister Justin Trudeau delivered a massive amount of fiscal stimulus to the pandemic-stricken Canadian economy in 2020. In the 2021/22 federal budget announced yesterday, another huge burst of spending was introduced, equal to C$101bn or 4.2% of Canadian GDP over the next three years. The spending was described as another COVID relief package, but included many long-term programs like national child care, raising the minimum wage and boosting green investments. According to the projections from the latest IMF World Fiscal Monitor, the “fiscal thrust” for Canada – the change in the cyclically-adjusted primary budget balance as a share of GDP - was projected to turn from a stimulus of +9% in 2020 to a drag of -2% in 2021 (Chart 15). The spending announced in the latest budget will effectively eliminate that drag for the next three years. This will provide a major lift to an economy already likely to see booming post-pandemic growth. Chart 14BoC QE No Longer Necessary
BoC QE No Longer Necessary
BoC QE No Longer Necessary
Chart 15No Fiscal Drag Now Expected In 2021
Some Bond Bearish Tales From Both Sides Of The 49th Parallel
Some Bond Bearish Tales From Both Sides Of The 49th Parallel
Chart 16Canadian Real Yields Are Too Low
Canadian Real Yields Are Too Low
Canadian Real Yields Are Too Low
Given the combination of expanding vaccinations, surging confidence, a renewed housing boom and soaring financial markets, it will be difficult for the BoC to maintain its current policy settings for much longer. This is a central bank that engaged in QE reluctantly last year and numerous BoC officials have stated – even in the worst days of the global pandemic - that they would begin to remove accommodation once it was no longer needed. Interest rate markets have already moved to price in a full-blown BoC tightening cycle. The Canadian OIS curve now discounts “liftoff” (a full 25bp rate hike) in October 2022, with 163bps of rate hikes priced in to the end of 2024 (Chart 16). The projected path of rates is below the BoC’s inflation forecasts to 2023. Thus, the implied Canadian real policy rate is expected to remain negative over the next two years – even though the BoC estimates that the neutral policy rate range is 1.75% to 2.75%, or -0.25% to +0.75% in real terms after subtracting the midpoint of the BoC’s 1-3% inflation target band. In other words, Canadian interest rate markets are vulnerable to any BoC shift in a less dovish direction, as seems increasingly likely sometime in the next few months. Our BoC Monitor is rapidly moving out of the “easier policy required” zone (Chart 17), and the rapid improvement in the Canadian employment situation suggests the BoC will be under more pressure to begin signaling a path towards withdrawing policy accommodation. This will start with an announced tapering of QE purchases, perhaps even ahead of any signals from the Fed that it is doing the same (Chart 18). This justifies a more cautious stance on Canadian fixed income exposure. Chart 17Downgrade Canadian Government Bonds To Underweight
Downgrade Canadian Government Bonds To Underweight
Downgrade Canadian Government Bonds To Underweight
Chart 18Could The BoC Start Tapering Before The Fed?
Could The BoC Start Tapering Before The Fed?
Could The BoC Start Tapering Before The Fed?
While a BoC tapering announcement before the Fed would likely put upward pressure on the Canadian dollar versus the US dollar, that would be something the BoC could live with if the economy was rapidly gaining strength – especially as our currency strategists believe the “loonie” to be undervalued. Thus, we are formally downgrading our strategic recommended allocation to Canadian government bonds to underweight (2 out of 5, see table on page 16). We are also maintaining our recommended below-benchmark duration exposure within dedicated Canadian bond portfolios. We are also cutting the allocation to Canada to underweight in our model bond portfolio and placing the proceeds in both, the US and core Europe (see pages 14-15). Bottom Line: The Canadian economy is gaining significant positive momentum, with an increased pace of vaccinations boosting optimism despite a third wave of COVID-19. We now see a growing risk that the Bank of Canada shifts to a less dovish policy stance sometime in the next few months, led by a tapering of its bond buying. Downgrade Canadian government bonds to underweight in global fixed income portfolios. Robert Robis, CFA Chief Fixed Income Strategist rrobis@bcaresearch.com Footnotes 1 Please see BCA Research Foreign Exchange Strategy/Global Fixed Income Strategy Special Report, "Will The Canadian Recovery Lead Or Lag The Global Cycle?", dated February 12, 2021, available at fes.bcaresearch.com and gfis.bcaresearch.com. 2 That Canadian return is virtually the same after hedging into US dollars, hence that local currency return can be compared to the US dollar denominated Treasury market return. 3https://www.bankofcanada.ca/2021/03/market-stress-relief-role-bank-canadas-balance-sheet Recommendations The GFIS Recommended Portfolio Vs. The Custom Benchmark Index
Some Bond Bearish Tales From Both Sides Of The 49th Parallel
Some Bond Bearish Tales From Both Sides Of The 49th Parallel
Duration Regional Allocation Spread Product Tactical Trades Yields & Returns Global Bond Yields Historical Returns
The US Treasury market’s dynamics are perplexing. The S&P 500 continues to forge new all-time highs, buoyed by positive economic data showing a firming recovery (most recently: blockbuster retail sales, strong regional Fed surveys, low jobless claims, and…
Highlights On a timeframe of a few years, a net deflationary shock is a near-certainty even if we do not know its precise nature or its precise timing. Hence, investors must build such a deflationary shock or shocks into their long-term investment strategy. Specifically: The 10-year T-bond yield will ultimately reach zero, and the 30-year T-bond yield will ultimately reach 0.5 percent. For patient investors, this presents a mouth-watering 100 percent return on the long-duration T-bond. The structural bull market in equities will continue until T-bond yields reach their ultimate low. Patient equity investors should steer towards ‘growth’ sectors that will surge on the ultimate low in T-bond yields. Fractal trade shortlist: Taiwan versus China, Netherlands versus China, and Sweden versus Finland. Feature Chart I-1For Long-Term Investors, A Shock Is A Near-Certainty
How To Predict Shocks
How To Predict Shocks
Predicting shocks is easy. The precise nature and timing of shocks is not predictable, but the statistical distribution of shocks is highly predictable. This means that the longer our investment timeframe, the more certain we are of encountering at least one shock – even if we cannot predict its precise nature or timing. Many economists and strategists blame their forecasting errors on shocks, such as the pandemic, which they point out are ‘unforecastable.’ Absent the shocks, they argue, their predictions of the economy and the markets would have turned out right. This is a valid excuse for short-term forecasting errors, but it is not a valid excuse for long-term forecasting errors. On a long-term horizon, encountering a major shock, or several major shocks, is a near-certainty. Hence, economists and strategists who are not incorporating the well-defined statistical distribution of shocks into their long-term investment forecasts and strategies are making a mistake. Individual Shocks Are Not Predictable In the 21 years of this century so far, there have been five shocks whose economic/financial consequences have been felt worldwide: the dot com bust (2000); the global financial crisis (2007/8); the euro debt crisis (2011/12); the emerging markets recession (2014/15); and the global pandemic (2020). To these we can add two wide-reaching political shocks: the Brexit vote (2016); and Donald Trump’s shock victory in the US presidential election (2016). In total, this constitutes seven shocks, four economic/financial, two political, and one natural (Chart I-2). Chart I-2The Seven Global Shocks Of The Century (So Far)
The Seven Global Shocks Of The Century (So Far)
The Seven Global Shocks Of The Century (So Far)
Some people argue that economic/financial shocks are predictable, because they arise from vulnerabilities in the economy or financial markets, which should be easy to spot. Unfortunately, though such vulnerabilities are obvious in hindsight, the greatest economic minds cannot see them in real time. The greatest economic minds cannot see economic vulnerabilities. Infamously, on the eve of the global financial crisis, Ben Bernanke was insisting that “there’s not much indication that subprime mortgage issues have spread into the broader mortgage market.” Equally infamously, on the eve of the euro debt crisis, Mario Draghi was asking “what makes you think that the ECB must become lender of last resort to governments to keep the eurozone together?” (Chart I-3 and Chart I-4) Chart I-3Bernanke Couldn't See The GFC
Bernanke Couldn't See The GFC
Bernanke Couldn't See The GFC
Chart I-4Draghi Couldn't See The Euro Debt Crisis
Draghi Couldn't See The Euro Debt Crisis
Draghi Couldn't See The Euro Debt Crisis
Which begs the question, what is the current vulnerability that today’s great economic minds cannot see? As we have documented many times, most recently in The Rational Bubble Is Turning Irrational, the current vulnerability is the exponential relationship between rising bond yields and the risk premiums on equities and other risk-assets (Chart I-5 and Chart I-6). Meaning that $500 trillion of risk-assets are vulnerable to any substantial further rise in bond yields. Chart I-5A 1.5 Percent Decline In The Bond Yield Had A Smaller Impact On The Earnings Yield When The Bond Yield Started At 4 Percent...
A 1.5 Percent Decline In The Bond Yield Had A Smaller Impact On The Earnings Yield When The Bond Yield Started At 4 Percent...
A 1.5 Percent Decline In The Bond Yield Had A Smaller Impact On The Earnings Yield When The Bond Yield Started At 4 Percent...
Chart I-6...Than When The Bond Yield Started ##br##At 3 Percent
...Than When The Bond Yield Started At 3 Percent
...Than When The Bond Yield Started At 3 Percent
The second type of shock – political shocks – should be predictable as they mostly arise from well-defined events such as elections and referenda, which an army of political experts analyses ad nauseam. Yet the greatest political minds could not see Brexit or President Trump coming. Indeed, even ‘Team Brexit’ didn’t see Brexit coming, because it had no plan on how to implement Brexit once the vote was won. The third type of shocks – natural shocks – are clearly unpredictable as individual events. Nobody knows when the next major pandemic, earthquake, volcano eruption, tsunami, solar flare, or asteroid strike is going happen. Yet, to repeat, while the precise nature and timing of shocks is not predictable, the statistical distribution of shocks is highly predictable. The Statistical Distribution Of Shocks Is Highly Predictable The good news is that shocks follow well-defined statistical ‘power laws’ which allow us to accurately forecast how many shocks to expect in any long timeframe. The 7 shocks experienced through the past 21 years equates to a shock every three years on average, or 3.33 shocks in any 10-year period. The expected wait to the next shock is three years. The next few paragraphs delve into some necessary mathematics, but don’t worry, you don’t need to understand the maths to appreciate the key takeaways. If the past 21 years is representative, we propose that the number of shocks in any 10-year period follows a so-called Poisson distribution with parameter 3.33. From this distribution, it follows that the probability of going through a 5-year period without a shock is just 19 percent, and the probability of going through a 10-year period without a shock is a negligible 4 percent (Chart of the Week). The result is that if you are a long-term investor, then encountering a shock is a near-certainty and should be built into your investment strategy. How can we test our assumption that the number of shocks follows a Poisson distribution? The maths tells us that if the number of shocks follows a Poisson distribution with parameter 3.33, then the ‘waiting time’ between shocks follows a so-called Exponential distribution also with parameter 3.33. On this basis, 63 percent of the waits between shocks should be up to three years, 23 percent should be four to six years, and 14 percent should be over six years. Now we can compare this expected distribution with the actual distribution of waits between the 7 shocks encountered so far in this century. We find that the theory lines up closely with the practice, validating our assumption of a Poisson distribution (Chart I-7 and Chart I-8). Chart I-7The Theoretical Waiting Time Between Shocks…
How To Predict Shocks
How To Predict Shocks
Chart II-8…Is Close To The Actual Waiting Time Between Shocks
How To Predict Shocks
How To Predict Shocks
To repeat the key takeaways, on a long-term timeframe, encountering at least one shock is a near-certainty, and the expected wait to the next shock is three years. A Shock Is A Near-Certainty, And It Will End Up Deflationary Nevertheless, there remains a pressing question: Will the next shock(s) be deflationary or reflationary? It turns out that all shocks end up with both deflationary and reflationary components: either a deflationary impulse followed by a reflationary backlash or, as we highlighted in The Road To Inflation Ends At Deflation, a reflationary impulse followed by a deflationary backlash. But the crucial point is that the deflationary component will swamp the reflationary component. In the seven shocks of this century so far, six have been deflationary impulses with a weaker reflationary backlash; and one – the reflation trade of 2017-18 – was a reflationary impulse with a stronger deflationary backlash. It is our high conviction view that in the next shock(s), the deflationary component will continue to hold the upper hand (Chart I-9). Chart I-9Each Shock Has A Deflationary And Reflationary Component... But The Deflationary Component Tends To Dominate
Each Shock Has A Deflationary And Reflationary Component... But The Deflationary Component Tends To Dominate
Each Shock Has A Deflationary And Reflationary Component... But The Deflationary Component Tends To Dominate
The simple reason is that as financial asset prices, real estate prices, and debt servicing costs get addicted to ever lower bond yields, the economy and financial markets cannot tolerate bond yields reaching previous tightening highs and, just like all addicts, need a new extreme loosening to feel any stimulus. This means that when the next shock comes – as it surely will – it will require lower lows and lower highs in the bond yield cycle. Let’s sum up. On a timeframe of a few years, a shock is a near-certainty even if we do not know its precise nature – economic/financial, political, or natural – or its precise timing. Furthermore, the shock will be net deflationary. Hence, investors must build such a deflationary shock or shocks into their long-term investment strategy. Specifically: The 10-year T-bond yield will eventually reach zero, and the 30-year T-bond yield will ultimately reach 0.5 percent. For patient investors, this constitutes a mouth-watering 100 percent return on the long-duration T-bond. The 10-year T-bond yield will eventually reach zero. The structural bull market in equities will continue until T-bond yields reach their ultimate low. Patient equity investors should tilt towards ‘growth’ sectors that will surge on the ultimate low in T-bond yields. Candidates For Countertrend Reversals This week we have noticed an unusual decoupling among the tech-heavy markets of Taiwan, Netherlands, and China (Chart I-10). Chart I-10An Unusual Decoupling Between Tech-Heavy Netherlands And China
An Unusual Decoupling Between Tech-Heavy Netherlands And China
An Unusual Decoupling Between Tech-Heavy Netherlands And China
Among these three markets, the strong short-term outperformance of both Taiwan and Netherlands are due to supply bottlenecks in the semiconductor sector that have boosted Taiwan Semiconductor Manufacturing and ASML, but we expect these bottlenecks ultimately to resolve. On this basis and combined with extremely fragile 130-day fractal structures, Taiwan versus China and Netherlands versus China are vulnerable to reversals (Chart I-11 and Chart I-12). Chart I-11Underweight Taiwan Versus China
Underweight Taiwan Versus China
Underweight Taiwan Versus China
Chart I-12Underweight Netherlands Versus China
Underweight Netherlands Versus China
Underweight Netherlands Versus China
Our first recommended trade is to underweight Netherlands versus China, setting a profit target and symmetrical stop-loss at 5 percent. Another outperformance that looks fragile on its 130-day fractal structure is Sweden versus Finland, driven by industrials and financials versus energy and materials (Chart I-13). Chart I-13Underweight Sweden Versus Finland
Underweight Sweden Versus Finland
Underweight Sweden Versus Finland
Our second recommended trade is to underweight Sweden versus Finland, setting a profit target and symmetrical stop-loss at 4.7 percent. Dhaval Joshi Chief Strategist dhaval@bcaresearch.com Fractal Trading System Fractal Trades 6-Month Recommendations Structural Recommendations Closed Fractal Trades Asset Performance Equity Market Performance Indicators To Watch - Bond Yields Chart II-1Indicators To Watch - Bond Yields - ##br##Euro Area
Indicators To Watch - Bond Yields - Euro Area
Indicators To Watch - Bond Yields - Euro Area
Chart II-2Indicators To Watch - Bond Yields - ##br##Europe Ex Euro Area
Indicators To Watch - Bond Yields - Europe Ex Euro Area
Indicators To Watch - Bond Yields - Europe Ex Euro Area
Chart II-3Indicators To Watch - Bond Yields - ##br##Asia
Indicators To Watch - Bond Yields - Asia
Indicators To Watch - Bond Yields - Asia
Chart II-4Indicators To Watch - Bond Yields - ##br##Other Developed
Indicators To Watch - Bond Yields - Other Developed
Indicators To Watch - Bond Yields - Other Developed
Indicators To Watch - Interest Rate Expectations Chart II-5Indicators To Watch - Interest Rate Expectations
Indicators To Watch - Interest Rate Expectations
Indicators To Watch - Interest Rate Expectations
Chart II-6Indicators To Watch - Interest Rate Expectations
Indicators To Watch - Interest Rate Expectations
Indicators To Watch - Interest Rate Expectations
Chart II-7Indicators To Watch - Interest Rate Expectations
Indicators To Watch - Interest Rate Expectations
Indicators To Watch - Interest Rate Expectations
Chart II-8Indicators To Watch - Interest Rate Expectations
Indicators To Watch - Interest Rate Expectations
Indicators To Watch - Interest Rate Expectations
Highlights Global Inflation: The case for maintaining a strategic overall allocation to inflation-linked bonds (ILBs) versus nominal government debt in dedicated global fixed income portfolios remains intact. Global growth expectations are accelerating as vaccinations increase, spare capacity is increasingly being absorbed across the developed world and central banks (led by the Federal Reserve) continue to show no inclination to tighten policy anytime soon. Inflation-Linked Bond Allocations: ILB valuations, however, are no longer uniformly cheap across all countries. Real yields are now moving in a less coordinated fashion as markets try to sort out the timing and pace of eventual future central bank tightening. We recommend shifting inflation-linked bond exposure from Canada to Germany, as both markets have similar valuations but the Bank of Canada is likely to turn less dovish well ahead of the ECB. Feature Chart of the WeekMarkets Remain Unconcerned About An Inflation Overshoot
Markets Remain Unconcerned About An Inflation Overshoot
Markets Remain Unconcerned About An Inflation Overshoot
The global reflation trade over the past year has been highly rewarding to investors. Equity and credit markets worldwide have delivered outstanding returns on the back of highly stimulative monetary and fiscal policies implemented to deal with the negative economic effects of COVID-19. The global INflation trade has also paid off for investors in inflation-linked bonds (ILBs), which have outperformed nominal government debt across the developed economies dating back to last spring. The rising trend for global inflation breakevens remains intact, but is approaching some potential resistance points. A GDP-weighted average of 10-year breakeven inflation rates among the major developed economies is just shy of the 2% level that has represented a firm ceiling over the past decade (Chart of the Week). At the same time, the Bloomberg consensus forecast for headline CPI inflation for that same group of countries calls for an increase to only 1.8% by year-end before slowing to 1.7% in 2022. The latest forecasts from the IMF are similar, calling for headline inflation in the advanced economies to reach 1.6% in 2021 and 1.7% in 2022. If those modest forecasts for realized inflation come to fruition, then there is likely not much more upside in inflation breakevens, in aggregate. Country selection within the ILB universe will become more important over the next 6-12 months, as divergences in growth, realized inflation and central bank reactions will lead to a more heterogeneous path for global inflation breakevens. Underlying Inflation Backdrop Still Supports Rising Breakevens On a total return basis, ILBs enjoyed an extended run of success prior to this year. The cumulative total return of the asset class (in local currency terms) between 2012 and 2020 was a whopping 61% in the UK, 25% in Canada, 22% in the US and 21% in the euro area (aggregating the individual countries in the region with inflation-linked bonds). However, the absolute performance of ILBs has been more disperse on a country-by-country basis so far in 2021. ILBs are down year-to-date in Canada (-6.2%), the UK (-5.0%) and the US (-1.4%). On the other hand, euro area ILBs have delivered a positive total return of +0.5% so far in 2021. Real bond yields have climbed off the lows in the US, UK and, most notably, Canada where the overall index yield on the Bloomberg Barclays inflation-linked bond index is now in positive territory for the first time since before the pandemic started (Chart 2). At the same time, real bond yields have been drifting lower in the euro area. These real yield moves are related to shifting perceptions of central bank responses to the global growth upturn. For example, pricing in overnight index swap (OIS) curves have pulled forward the timing and pace of future interest rate increases in the US and Canada – i.e. real policy rates will become less negative - while there has been comparatively little change in euro zone rate expectations. While the absolute returns for ILBs have become less correlated, the relative trade between nominal and inflation-linked government bonds in all countries remains intact. 10-year breakeven inflation rates have been steadily climbing in the US and UK, while depressed Japanese breakevens have crept modestly higher (Chart 3). Even Europe, where inflation has remained subdued for years, has seen a significant shift higher in inflation breakevens. (Chart 4). The turn in breakevens has occurred alongside a major change in investor perceptions of future inflation, with surveys like the ZEW showing an overwhelming majority of financial professionals expecting higher inflation in the US, Europe and the UK. Chart 2A Fading Bull Market In Inflation-Linked Bonds
A Fading Bull Market In Inflation-Linked Bonds
A Fading Bull Market In Inflation-Linked Bonds
Chart 3A Solid Recovery In Inflation Expectations
A Solid Recovery In Inflation Expectations
A Solid Recovery In Inflation Expectations
Chart 4European Inflation Expectations Starting To Normalize
European Inflation Expectations Starting To Normalize
European Inflation Expectations Starting To Normalize
Inflation forecasts have shifted in response to faster global growth expectations on the back of vaccine optimism and aggressive US fiscal stimulus. Yet inflation forecasts remain modest compared to the huge growth figures expected for 2021 and 2022. In its latest World Economic Outlook published last week, the IMF upgraded its global real GDP forecast to 6.0% for 2021 and 4.4% for 2022. This represented an increase of 0.5 and 0.4 percentage points, respectively, from the last set of forecasts published back in January. While growth upgrades occurred across all major developed and emerging economies, the biggest upgrades came in the US and Canada, for both 2021 and 2022. As a result, the IMF projects the output gap in both countries to turn positive over 2022 and 2023, and be nearly closed in core Europe, Australia and Japan (Chart 5). The IMF is not projecting a major inflation surge on the back of those upbeat growth forecasts, though. While headline inflation in the US is expected to climb to 2.3% in 2021 and 2.4% in 2022, the same measure in Canada is only projected to rise to 1.7% and 2.0% over the same two years. European inflation is expected to remain subdued, reaching only 1.4% this year and drifting back to 1.2% in 2022 despite real GDP growth averaging 4.1% over the two-year period. The IMF attributes the benign inflation outcomes, even in the face of booming growth rates and the rapid elimination of output gaps, to the structural disinflationary backdrop for so-called “non-cyclical” inflation (Chart 6). The IMF defines this as the components of inflation indices that are less sensitive to changes in aggregate demand. The IMF estimates show that the contribution from non-cyclical components to overall inflation in the advanced economies had fallen to essentially zero at the end of 2020. Chart 5A Big Expected Narrowing Of Output Gaps
How Much More Juice Is Left In The Global Inflation Breakeven Trade?
How Much More Juice Is Left In The Global Inflation Breakeven Trade?
Chart 6Non-Cyclical Components Still Weighing On Global Inflation
Non-Cyclical Components Still Weighing On Global Inflation
Non-Cyclical Components Still Weighing On Global Inflation
There is considerable upside risk for the more cyclical components of inflation that could result in inflation overshooting the IMF projections (Chart 7). Chart 7Cyclical Backdrop Is Inflationary
Cyclical Backdrop Is Inflationary
Cyclical Backdrop Is Inflationary
For example, in the US, the Prices Paid component of the ISM Manufacturing index remains elevated at post-2008 highs, while the year-over-year change in the Producer Price Index soared to 6% in March. Across the Atlantic, the European Commission business and consumer surveys have shown a big surge in the net balance of respondents expecting higher inflation in manufacturing and retail trade. Previous weakness in the US dollar and surging commodity prices are playing a major role in this rapid pick-up in price pressures seen in many countries. Given the current backdrop of strong global growth expectations, with actual activity accelerating as vaccinations increase and more parts of the global economy reopen, inflation pressures are unlikely to fade in the near term. With realized inflation rates set to spike due to base effect comparisons to the pandemic-fueled collapse one year ago, the upward pressure on global ILB inflation breakevens will persist in the coming months – especially with breakevens still below levels that would prompt central banks to turn less dovish sooner than expected. Bottom Line: The case for maintaining a strategic overall allocation to inflation-linked bonds (ILBs) versus nominal government debt in dedicated global fixed income portfolios remains intact. Global growth expectations are accelerating as vaccinations increase, spare capacity is increasingly being absorbed across the developed world and central banks (led by the Federal Reserve) continue to show no inclination to tighten policy anytime soon. Assessing Value In Developed Market Inflation-Linked Bonds Chart 8USD Outlook Now More Mixed
USD Outlook Now More Mixed
USD Outlook Now More Mixed
Although the current backdrop remains conducive to a continuation of the rising trend in global ILB breakevens, there are factors that could begin to slow the upward momentum. The future path of the US dollar is now a bit less certain (Chart 8). While the DXY index is still down 7.4% compared to a year ago, it is up 2.4% so far in 2021. Shorter-term real interest rate differentials between the US and the other major developed markets remain dollar-bearish. At the same time, longer-term real yield differentials have risen in favor of the US (middle panel). Furthermore, US growth is outperforming other developed economies, typically a dollar-bullish factor (bottom panel). Given the usual negative correlation between the US dollar and commodity prices, a loss of downside dollar momentum could also slow the pace of commodity price appreciation. This represents a risk to additional global ILB outperformance versus government bonds. Our GDP-weighted aggregate of 10-year ILB breakevens for the major developed economies is currently just under 2% - levels more consistent with oil prices over $80/bbl than the current price closer to $60/bbl (Chart 9). Chart 9Breakevens Consistent With Much Higher Oil Prices
Breakevens Consistent With Much Higher Oil Prices
Breakevens Consistent With Much Higher Oil Prices
Given some of these uncertainties over the strength of any future inflationary push from a weaker US dollar and rising commodity prices, a broad overweight allocation to ILBs across the entire developed market universe may no longer generate the same strong returns versus nominal government bonds seen over the past year. With the “easy money” already having been made in the global breakeven widening trade, country allocation within the ILB universe has now become a more important dimension for bond investors to consider. To assess the relative attractiveness of individual ILB markets, we turn to a few valuation tools. Our regression-based valuation models for 10-year ILB breakevens in the US, UK, France, Italy, Germany, Japan, Canada and Australia are all presented in the Appendix on pages 14-17. The two inputs into the model are the annual rate of change of the Brent oil price in local currency terms (as a measure of shorter-term inflation pressure) and a five-year moving average of realized headline CPI inflation (as a longer-term trend that provides a structural “anchor” for breakevens based off actual inflation outcomes). We first presented these models in April 2020, but we have now made a change in response to some of the unprecedented developments witnessed over the past year.1 Despite the strong visual correlation between the level of oil prices and inflation breakevens in most countries, we chose to use the annual growth of oil prices, rather than the level, in our breakeven models. This is because we found it more logical to compare a rate of change concept like inflation (and breakevens) to the rate of change of oil. However, the oil input into our breakeven models could produce nonsensical results during periods of extreme oil volatility that did not generate equivalent swings in breakeven inflation rates. A good example of that occurred in 2016, when the annual rate of change of the Brent oil price briefly surged toward 100%, yet 10-year US TIPS breakevens did not rise above 2% (Chart 10). An even bigger swing in oil prices has occurred over the past year, with oil prices up over +200% compared to the collapse in prices that occurred one year ago. Putting such an extreme move into our US model would have pushed the “fair value” level of the 10-year TIPS breakeven to 4% - an implausible outcome given that the 10-year breakeven has never risen to even as high as 3% in the entire 24-year history of the TIPS market. Chart 10Pass-Through Of Extreme Oil Moves Has Limits
Pass-Through Of Extreme Oil Moves Has Limits
Pass-Through Of Extreme Oil Moves Has Limits
To deal with this problem, we have truncated the rate of change of oil prices in all our breakeven models at levels consistent with past peaks of breakevens. Going back to the US example, we have “capped” the rate of change of the Brent oil price at +40%, as past periods when oil price momentum was greater than 40% did not translate into any additional increase in TIPS breakevens. We then re-estimated the model using this truncated oil price series to generate fair value breakeven levels. Chart 11A Mixed Impact Of USD Moves On Non-US Breakevens
A Mixed Impact Of USD Moves On Non-US Breakevens
A Mixed Impact Of USD Moves On Non-US Breakevens
We did this for all eight of our individual country breakeven models and in all cases, truncating extreme oil moves improved the accuracy of the model. Interestingly, we did not truncate the downside momentum of oil prices, as there was no obvious “cut-off” point where periods of collapsing oil prices did not generate equivalent declines in breakevens. Oil prices remain the most critical short-term variable to determine ILB breakeven valuation. While it is intuitive to think that currency movements should also have a meaningful impact on inflation (both realized and expected), the effect is not consistent across countries. For example, euro area breakevens appear to be positively correlated to the euro, while Japanese breakevens rarely rise without yen weakness (Chart 11). One other factor to consider when evaluating the value of breakevens is the possible existence of an inflation risk premium component during periods of higher uncertainty over future inflation. Such uncertainty could result in increased demand for ILBs from investors driving up the price of ILBs (thus lowering the real yield) relative to nominal yielding bonds, leading to wider breakevens that do not necessarily reflect a true rise in expected inflation. A simple way to measure such an inflation risk premium is to compare market-based breakevens to survey-based measures of inflation forecasts taken from sources like the Philadelphia Fed's Survey of Professional Forecasters and the Bank of Canada’s Survey Of Consumer Expectations. The assumption here is that the survey-based measures represent a more accurate (or, at least, less biased) depiction of underlying inflation expectations in an economy. We present these simple measures of inflation risk premia, comparing 10-year breakevens to survey-based measures of inflation expectations, in Chart 12 and Chart 13. Breakevens had been trading well below survey-based measures of inflation expectations after the negative pandemic growth shock in 2020 in all countries shown. After the steady climb in global breakevens seen over the past year, those gaps have largely disappeared, with breakevens now trading slightly above survey based inflation expectations in the US, UK and Australia. Chart 12No Major Inflation Risk Premia In These Markets
No Major Inflation Risk Premia In These Markets
No Major Inflation Risk Premia In These Markets
Chart 13Canadian & Australian Breakevens In Line With Inflation Surveys
Canadian & Australian Breakevens In Line With Inflation Surveys
Canadian & Australian Breakevens In Line With Inflation Surveys
Chart 14Assessing The Value Of Breakevens
Assessing The Value Of Breakevens
Assessing The Value Of Breakevens
In Chart 14, we show the valuation residuals from our 10-year ILB breakeven models, along with two other measures of potential breakeven valuation: a) the distance between current breakeven levels and their most recent pre-pandemic peaks; and b) the difference between breakevens and the survey-based measures of inflation expectations. The model results show that breakevens are furthest below fair value in France, Japan and Germany, and the most above fair value in the UK and Australia. The message of undervaluation from our models is confirmed in the other two metrics for France, Japan, Germany, Canada and Italy. The overvaluation message for Australia is consistent across all three valuation metrics, while the signals are mixed for US and UK breakevens. In Japan, while the combined signals of all three valuation metrics indicate that breakevens are far too low, the very robust positive correlation between Japanese breakevens and the USD/JPY exchange rate implies that a bet on wider breakevens requires a much weaker yen. In Canada, while the 10-year breakeven does appear cheap, the real yield has also climbed faster than any of the other countries over the past several months as markets have rapidly repriced a more hawkish path for the Bank of Canada. Recent comments from Bank of Canada officials have leaned a bit hawkish, hinting at a possible taper of its bond-buying program, as the central bank appears unhappy with the renewed boom in Canadian housing values. An early tightening of monetary conditions would likely cap any additional upside in Canadian inflation breakevens. In Europe, the undervaluation of breakevens is more compelling. The ECB is likely to maintain its dovish policy settings into at least 2023, even if growth recovers later this year as increased vaccinations lead to the end of lockdowns. As shown earlier, European breakevens can continue to rise even if the euro is also appreciating versus the US dollar, especially if growth is recovering and oil prices are rising. Euro area breakevens are likely to continue drifting higher over at least the rest of 2021. Currently in our model bond portfolio, we have allocations to ILBs out of nominal government bonds in the US, France, Canada and Italy, with no allocations in Germany, Japan, Australia or the UK. After assessing our valuation measures, we are comfortable with the ILB exposure in France and Italy and lack of positions in the UK and Australia. We still see the upside case for US breakevens, with the economy reopening rapidly fueled further by fiscal policy, and the Fed likely to maintain its current highly dovish forward guidance until much later in 2021. We are reluctant to add exposure to Japanese ILBs, despite attractive valuations, as we are not convinced that USD/JPY has enough upside potential to help realize that undervaluation of Japanese breakevens. Thus, as a new change to our model portfolio this week that reflects our assessment of ILB breakeven valuations and risks, we are closing out the exposure to Canadian ILBs and adding a new position in German ILBs of equivalent size (see the model bond portfolio tables on pages 18-19). Bottom Line: ILB valuations are no longer uniformly cheap across all countries. Real yields are now moving in a less coordinated fashion as markets try to sort out the timing and pace of eventual future central bank tightening. We recommend shifting inflation-linked bond exposure from Canada to Germany, as both markets have similar valuations but the Bank of Canada is likely to turn less dovish well ahead of the ECB. Robert Robis, CFA Chief Fixed Income Strategist rrobis@bcaresearch.com Footnotes 1 Please see BCA Research Global Fixed Income Strategy Report, "Global Inflation Expectations Are Now Too Low", dated April 28, 2020, available at gfis.bcaresearch.com. Appendix Chart A1Our US 10-Year Inflation Breakeven Model
How Much More Juice Is Left In The Global Inflation Breakeven Trade?
How Much More Juice Is Left In The Global Inflation Breakeven Trade?
Chart A2Our UK 10-Year Inflation Breakeven Model
How Much More Juice Is Left In The Global Inflation Breakeven Trade?
How Much More Juice Is Left In The Global Inflation Breakeven Trade?
Chart A3Our France 10-Year Inflation Breakeven Model
How Much More Juice Is Left In The Global Inflation Breakeven Trade?
How Much More Juice Is Left In The Global Inflation Breakeven Trade?
Chart A4Our Italy 10-Year Inflation Breakeven Model
How Much More Juice Is Left In The Global Inflation Breakeven Trade?
How Much More Juice Is Left In The Global Inflation Breakeven Trade?
Chart A5Our Japan 10-Year Inflation Breakeven Model
How Much More Juice Is Left In The Global Inflation Breakeven Trade?
How Much More Juice Is Left In The Global Inflation Breakeven Trade?
Chart A6Our Germany 10-Year Inflation Breakeven Model
How Much More Juice Is Left In The Global Inflation Breakeven Trade?
How Much More Juice Is Left In The Global Inflation Breakeven Trade?
Chart A7Our Canada 10-Year Inflation Breakeven Model
How Much More Juice Is Left In The Global Inflation Breakeven Trade?
How Much More Juice Is Left In The Global Inflation Breakeven Trade?
Chart A8Our Australia 10-Year Inflation Breakeven Model
How Much More Juice Is Left In The Global Inflation Breakeven Trade?
How Much More Juice Is Left In The Global Inflation Breakeven Trade?
Recommendations
How Much More Juice Is Left In The Global Inflation Breakeven Trade?
How Much More Juice Is Left In The Global Inflation Breakeven Trade?
The GFIS Recommended Portfolio Vs. The Custom Benchmark Index Duration Regional Allocation Spread Product Tactical Trades Yields & Returns Global Bond Yields Historical Returns
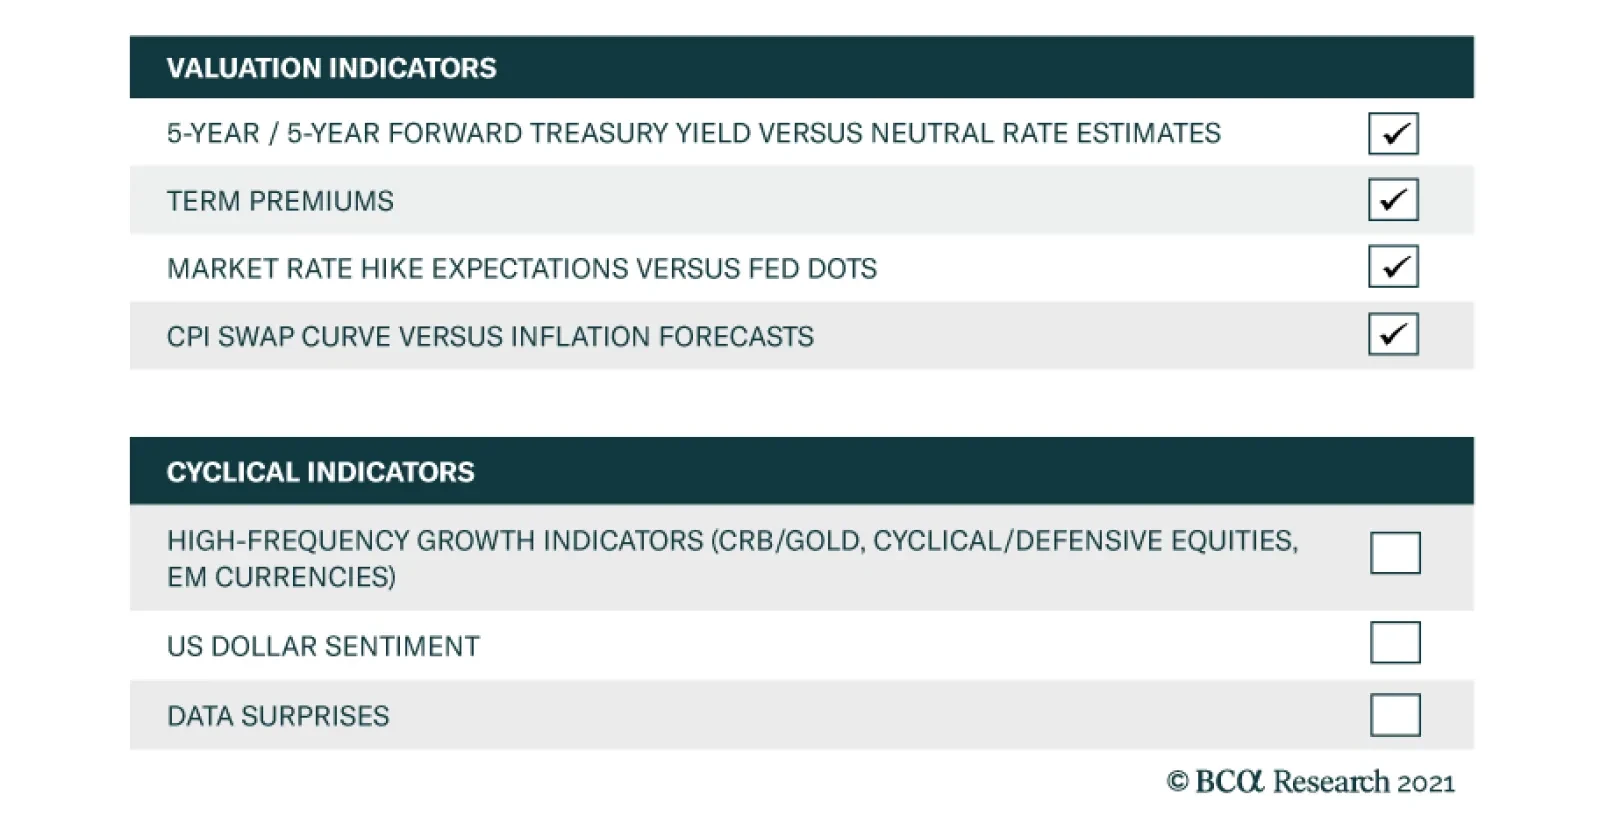
According to BCA Research’s US Bond Strategy service, bond yields could overshoot their fair value in the near term. Maintain below-benchmark portfolio duration. All in all, the message from the valuation indicators in the team’s Checklist is that a robust…