Fixed Income

Highlights Duration & The Fed: Unlike the bond market, the Fed is being intentionally cautious about how quickly it revises its interest rate expectations higher, focusing more on hard economic data than on surveys. We expect the Fed dots to move up later this year as the hard economic data improve, validating current pricing in the bond market. Maintain below-benchmark portfolio duration. Yield Curve: The Treasury yield curve continues to trade directionally with the level of yields, except for the 10/30 slope which has now begun to bear-flatten. Investors should continue to position for curve steepening out to the 10-year maturity point. We recommend going long the 5-year note and short a duration-matched barbell consisting of the 2-year and 10-year notes. Economy: The US economy is at an inflection point where survey data indicate a great deal of optimism about the economic recovery, but where those optimistic growth prospects are not yet evident in the hard economic data. This is typical of post-recession environments where survey data move first and then the hard economic data play catch up. Feature The pain in the bond market continues. The 10-year Treasury yield rose again last week, closing at 1.74% on Friday, and the Bloomberg Barclays Treasury Index has now returned -6.1% since it peaked last August. If we use the peak-to-trough drawdown in the Treasury Index as our gauge, we are now in the midst of one of the five worst bond selloffs of the past 50 years. During that 50-year period, the current bearish bond move is only surpassed by the 2009, 2003, 1994 and 1980 episodes (Chart 1). Chart 1A Historic Bond Rout
A Historic Bond Rout
A Historic Bond Rout
That said, the current bond selloff might still have a lot of runway. In level terms, the 30-year Treasury yield has only just recaptured its 2020 peak and the 10-year yield hasn’t even done that (Chart 2). Then, there’s another 101 bps of upside in the 30-year yield and 150 bps of upside in the 10-year yield just to get back to their 2018 peaks, yield levels that aren’t exactly distant memories. Yields do look stretched if we look at long-dated forwards. The 5-year/5-year forward Treasury yield, for example, is already well above its 2020 peak. The large increase in the 5-year/5-year forward yield is the result of Fed policy keeping the short-end of the yield curve capped (Chart 2, bottom 2 panels) forcing the bulk of Treasury weakness to be felt at the long-end. The 5-year/5-year forward Treasury yield is important because it reflects the market’s expectation of where the fed funds rate will settle in the long-run. In fact, you can use survey estimates of the long-run neutral fed funds rate to get a useful fair value range for the 5-year/5-year forward. At present, the 5-year/5-year forward yield has pushed well above this survey-derived fair value range (Chart 3), though it’s important to note that it is still 75 bps below its 2018 peak. Survey estimates of the long-run neutral fed funds rate were revised down as growth disappointed in 2019, it stands to reason that they could be revised higher as growth improves this year, thus moving the fair value range up as well. Chart 2Yields Can Rise Further
Yields Can Rise Further
Yields Can Rise Further
Chart 35-Year/5-Year Is Elevated
5-Year/5-Year Is Elevated
5-Year/5-Year Is Elevated
In fact, whether that process of upward revisions to survey estimates of the long-run neutral fed funds rate begins is an important near-term question for the bond market. Upward revisions would signal further upside in long-dated yields and more curve steepening ahead. Static long-run neutral rate estimates would signal that the upside in long-maturity yields is limited. In that latter case, the cyclical bond bear market would transition to a less severe bear-flattening phase where short-maturity yields eventually catch up to the long-end as the Fed tightens policy. It’s currently unclear how those survey estimates will evolve – we will get March updates for both surveys shown in Chart 3 on April 8th – but for now it’s too soon to say that the 5-year/5-year forward yield has peaked. We continue to recommend maintaining below-benchmark portfolio duration as we keep tabs on our Checklist To Increase Portfolio Duration.1 Currently, our Checklist is not screaming out for us to make a change. Explaining The Disagreement Between The Fed And The Market We expected that Fed policymakers would revise up their interest rate forecasts at last week’s FOMC meeting, but we also expected that the forecasts wouldn’t rise far enough to match the rate hike path that is currently priced in the market.2 This is in fact what happened, though the Fed was slightly more dovish than we anticipated. Only 7 out of 18 FOMC participants expect any rate hikes at all before the end of 2023, while the overnight index swap curve is discounting more than four 25 basis point hikes by then (Chart 4). Chart 4Market More Hawkish Than Fed
Market More Hawkish Than Fed
Market More Hawkish Than Fed
What explains this divergence between the market and the Fed? Perhaps bond investors are simply ignoring the Fed’s dovish message. In that case, we should expect yields to fall as it becomes clear that the Fed intends to keep rates pinned at zero for much longer than is currently priced in the curve. Or perhaps Fed policymakers just don’t appreciate the surge in economic activity that is about to unfold. In that case, their interest rate forecasts (the “dots”) will rise sharply in the coming months as the economic data improve. Chair Powell gave a hint about how we should think about the divergence between the market and the “dots” in his post-meeting press conference. He said that the Fed wants to see “actual progress” towards its economic objectives not “forecast[ed] progress”, and he noted that this increased focus on “actual progress” is “a difference from our past approach.”3 In other words, the Fed is making a concerted effort to take a more backward-looking approach to policymaking under its new Average Inflation Targeting regime. It doesn’t want to tighten policy in response to a forecast of stronger growth in the future only to get whipsawed if that forecast doesn’t pan out. It would rather err on the side of tightening too late and then possibly have to move more quickly if it falls behind the curve. The market, by contrast, is a purely forward-looking discounting mechanism. Market prices move quickly to incorporate new information but are often caught offside. We are reminded of Paul Samuelson’s famous quip that the stock market has predicted nine of the past five recessions. This explains exactly what is happening right now. The market is looking ahead, taking its cues from survey data (or “soft data”) such as the ISM indexes that are pointing toward a sharp rise in economic activity and inflation. The Fed, by contrast, is endeavoring to focus more on the actual hard economic data such as the unemployment rate, industrial production and consumer price indexes. These hard economic data simply haven’t improved that much yet. The last section of this report (titled “Economy: Hard Vs Soft Data”) gives some examples of how the hard and soft economic data have diverged. Chart 5The Path Back To Maximum Employment
The Path Back To Maximum Employment
The Path Back To Maximum Employment
Ultimately, the disagreement between the market’s funds rate expectations and the Fed’s dots will be resolved as the hard economic data are released during the next few months. Those data will either validate the current message from economic surveys, causing the Fed to revise up its rate forecasts, or disappoint market expectations, causing market forecasts and bond yields to fall. In this regard, the hard economic data on the labor market will be particularly important. The Fed has said that it will not lift rates until “maximum employment” is achieved. In practice, “maximum employment” means that the unemployment rate will fall into a range of 3.5% - 4.5%, consistent with the Fed’s estimates of the natural rate, and the labor force participation rate will recover to pre-COVID levels (Chart 5). The top row of Table 1 shows that average monthly employment growth of 419k is required to achieve that target by the end of 2022. We have made the case in prior reports that, though that number seems high, it is achievable.4 Table 1Average Monthly Nonfarm Payroll Growth Required For The Unemployment Rate To Reach 4.5% By The Given Date
The Fed Looks Backward While Markets Look Forward
The Fed Looks Backward While Markets Look Forward
It’s also worth noting that the Fed’s median unemployment rate forecast was revised significantly lower last week. The Fed is now looking for an unemployment rate of 4.5% by the end of this year and 3.9% by the end of 2022 (Chart 5, top panel). The fact that the Fed doesn’t project any rate hikes during this timeframe can only mean that policymakers aren’t forecasting a similar recovery in the labor force participation rate. The bottom line is that, unlike the market, the Fed is being intentionally cautious about how quickly it revises its funds rate expectations higher, focusing more on hard economic data than surveys. Eventually, the disagreement between the hard and soft economic data will be resolved and either the Fed dots will move toward the market, or the market will move toward the Fed. Our sense is that the Fed is probably being overly cautious and that their forecasts will eventually move toward the market, validating current bond yields. Too Early To Expect Curve Flattening We have been recommending nominal Treasury curve steepeners for some time, on the view that the yield curve will trade directionally with yields. This means that rising yields will coincide with curve steepening.5 This correlation has held up extremely well, but we know that it won’t last forever. Eventually, we will be close enough to Fed rate hikes that the yield curve will start to flatten as yields rise. This process will begin at the long-end of the curve and gradually shift toward the short-end as Fed liftoff approaches. Chart 6 shows how the correlation between the level of Treasury yields and different yield curve slopes has held up during the recent surge in bond yields. For the most part, the tight correlation between rising yields and steeper curves remains intact, with the 10/30 slope being the exception (Chart 6, bottom panel). It looks like during the past month the 10/30 slope has transitioned from a bear-steepening/bull-flattening regime into a bear-flattening/bull-steepening regime. The investment implication is that the short position of a curve steepener trade should be applied to the 10-year note not the 30-year bond, particularly for duration-neutral steepeners. It’s difficult to know exactly when the other segments of the yield curve will transition from their bear-steepening/bull-flattening regimes into bear-flattening/bull-steepening regimes, but we suspect that the current correlations have quite a bit more running room. If we look at what occurred prior to the last time that the Fed lifted rates off the zero bound, in December 2015, we see that most curve segments didn’t start to bear-flatten until a few months before liftoff (Chart 7) Chart 6Bear-Steepening/Bull-Flattening Regime Continues
Bear-Steepening/Bull-Flattening Regime Continues
Bear-Steepening/Bull-Flattening Regime Continues
Chart 7Bear-Flattening Started Just Months Before 2015 Liftoff
Bear-Flattening Started Just Months Before 2015 Liftoff
Bear-Flattening Started Just Months Before 2015 Liftoff
In terms of how to implement a yield curve steepener, we have been recommending a position long the 5-year note and short a duration-matched barbell consisting of the 2-year and 10-year notes. We are sticking with that position for now, as it has performed well even as the 2/5/10 butterfly spread has widened in recent weeks (Chart 8). We expect it will continue to perform well as long as both the 2/5 and 5/10 yield curve slopes continue to steepen. Once we suspect that the 5/10 slope is transitioning into a bear-flattening/bull-steepening regime, we will have to either shift into a curve flattener or a curve steepener that is focused more at the short-end of the curve. Chart 85/10 Slope Still Steepening
5/10 Slope Still Steepening
5/10 Slope Still Steepening
Bottom Line: The Treasury yield curve continues to trade directionally with the level of yields, except for the 10/30 slope which has now begun to bear-flatten. Investors should continue to position for curve steepening out to the 10-year maturity point. We recommend going long the 5-year note and short a duration-matched barbell consisting of the 2-year and 10-year notes. Economy: Hard Vs. Soft Data Chart 9IP Lags The PMI
IP Lags The PMI
IP Lags The PMI
Chart 10Surveys Suggest Higher Inflation Ahead
Surveys Suggest Higher Inflation Ahead
Surveys Suggest Higher Inflation Ahead
As noted above, the US economy is at an interesting inflection point where, owing to large-scale fiscal stimulus and an effective COVID vaccination rollout, there is a lot of optimism about the future. This optimism is showing up in how people respond to surveys about their economic and business expectations, but it has not yet translated into better actual economic outcomes. The ISM Manufacturing PMI survey is a case in point. It surged to 60.8 in February, its highest level since 2018, but actual measured industrial production continues to contract in year-over-year terms (Chart 9). In all likelihood, this is simply a result of surveys (“soft data”) leading the hard data. A simple linear regression fit between industrial production and the PMI shows that wide negative divergences have a habit of showing up during recessions, only for the gaps to close very quickly in the early stages of the recovery. We see the same dynamic at play in the inflation data. Actual core CPI inflation has not moved up significantly, but surveys indicate that price pressures are rising fast (Chart 10). Bottom Line: The US economy is at an inflection point where survey data indicate a great deal of optimism about the economic recovery, but where those optimistic growth prospects are not yet evident in the hard economic data. This is typical of post-recession environments where survey data move first and then the hard economic data play catch up. Ryan Swift US Bond Strategist rswift@bcaresearch.com Footnotes 1 For more details on our Checklist please see US Bond Strategy Weekly Report, “No Panic From Powell”, dated March 9, 2021, available at usbs.bcaresearch.com 2 Please see US Bond Strategy Weekly Report, “Limit Rate Risk, Load Up On Credit”, dated March 16, 2021, available at usbs.bcaresearch.com 3 https://www.federalreserve.gov/mediacenter/files/FOMCpresconf20210317.pdf 4 Please see US Bond Strategy Weekly Report, “No Panic From Powell”, dated March 9, 2021, available at usbs.bcaresearch.com 5 Please see US Bond Strategy Weekly Report, “Life At The Zero Bound”, dated March 24, 2020, available at usbs.bcaresearch.com Fixed Income Sector Performance Recommended Portfolio Specification
Dear client, Next week, in lieu of our weekly report, I will be hosting a webcast on Thursday, March 25 at 10:00 am EDT and Friday March 26 at 9:00 am HKT. I look forward to your comments and questions during the webcast. Best regards, Chester Highlights During bear markets, counter-trend rallies in the dollar are capped around 4%. This time should be no different. Meanwhile, unless the Fed tightens policy to stem the increase in aggregate demand, inflation will rise and real short rates will drop. The relative equity performance of the US is critical for the dollar. Reserve diversification out of dollars has also started to place a natural ceiling against other developed market currencies. An attractive opportunity is emerging to short the AUD/CAD cross. Feature The 1.7% rise in the US dollar this year is reinvigorating the bull case. When presenting our key views last year, we highlighted that the DXY index was at risk of a 2-4% bounce.1 We reaffirmed this view in our January report: Sizing A Potential Dollar Bounce. At the time, the DXY index was at the 90 level, suggesting the rally should fizzle around 94. Therefore, the key question is whether the nascent rise in the DXY will punch through this level, or fade as we originally expected. The short-term case for the dollar remains bullish. The currency is much oversold. Meanwhile, real interest rates are moving in favor of the US, vis-à-vis a few countries. Third and interrelated, economic momentum in the US is quite strong, compared to other G10 countries. With the rising specter of a market correction, the dollar could also benefit from safe haven flows towards the US. The Federal Reserve’s meeting yesterday certainly reaffirmed that short-term rates will remain anchored near zero, at least until 2023. The Fed does not see inflation much above 2% a couple of years out. Nevertheless, a lot can change in the coming months. Cycles, Positioning And Interest Rates The dollar tends to move in long cycles, with the latest bull and bear markets lasting about a decade or so. In other words, the dollar is a momentum currency. As such, determining which regime you are in is critical to assessing the magnitude of any rally. This is certainly the case when sentiment remains overly dollar bearish, as now. During bear markets, counter-trend rallies in the dollar are capped around 4-6%. This was what happened in the early 2000s. In bull markets, such as after the financial crisis, the dollar achieves escape velocity, with more durable rallies well into the teens (Chart I-1). So far, the current rise still fits within the narrative of a healthy reset in a longer-term bear market. Chart I-1The Dollar Rally Is Still Benign
The Dollar Rally Is Still Benign
The Dollar Rally Is Still Benign
Long interest rates have also been moving in favor of the dollar, especially relative to the euro area, Japan, and even Sweden. Currencies are driven by real interest rate differentials, and higher US yields are bullish. With the Fed giving no indication it will prevent the curve from steepening further, US interest rates could keep gaping higher. However, currencies are about relative rate differentials, and the rise in US interest rates has not been in isolation. Rates in the UK, Australia and New Zealand, countries that have managed the COVID-19 crisis pretty well, are beginning to rise faster than in the US (Chart I-2). Chart I-2A Synchronized Rise In Global Yields
A Synchronized Rise In Global Yields
A Synchronized Rise In Global Yields
US Versus World Growth The rise in US interest rates has been justified by better economic performance. Whether looking at purchasing managers’ indices, economic surprise indices, or even GDP growth expectations, the US has had the upper hand (Chart I-3). The Fed expects US growth to hit 6.5% this year. This is well above what other central banks expect for their domestic economies. The ECB expects 4%, the BoJ expects 3.9%, and the BoC expects 4.6% (Table I-1). Chart I-3AThe US Leads In Growth This Year
The US Leads In Growth This Year
The US Leads In Growth This Year
Chart I-3BThe US Leads In Growth This Year
The US Leads In Growth This Year
The US Leads In Growth This Year
Table I-1The US Leads In Growth And Inflation This Year
Arbitrating Between Dollar Bulls And Bears
Arbitrating Between Dollar Bulls And Bears
However, economic dominance can be transient, especially in a world of flexible exchange rates. For one, a higher dollar will sap US growth via the export channel. This is especially the case since the starting point is an expensive currency. On a real effective exchange rate basis, the dollar is above its long-term mean (Chart I-4). Meanwhile, we expect the rest of the world to perform better as economies reopen. The services PMI in the US is already close to a cyclical high, similar to Sweden (Chart I-5). These are among the countries with the least stringent COVID-19 measures in the western hemisphere. This suggests that other economies, even manufacturing-centric ones, could see a coiled-spring rebound in growth as we put this pandemic behind us. Chart I-4The Dollar Is Expensive
The Dollar Is Expensive
The Dollar Is Expensive
Chart I-5The US Service PMI Is At A Cyclical High
The US Service PMI Is At A Cyclical High
The US Service PMI Is At A Cyclical High
The sweet spot for most economies is when growth is rising but inflation is low, allowing the resident central bank to keep policy dovish. However, it is an open question if the US can continue to boost spending, without a commensurate rise in inflation. The OECD estimates that the US output gap will close by 2022, with the $1.9-trillion fiscal package. This will put the US well ahead of any G10 country (Chart I-6). Unless the Fed tightens policy to stem the increase in aggregate demand, inflation will rise and real rates will drop (Chart I-7). Rising nominal rates and falling real yields will be anathema to the dollar. Chart I-6The US Output Gap Will Soon Close
The US Output Gap Will Soon Close
The US Output Gap Will Soon Close
Chart I-7Wages And Inflation Should Inch Higher
Wages And Inflation Should Inch Higher
Wages And Inflation Should Inch Higher
Equity Rotation And The Dollar A currency manager once noted that the most important variable to pay attention to when making FX allocations is relative equity performance. This might seem bizarre at first blush, but stands at the center of what an exchange rate is – a mechanism that equalizes rates of return across countries. As such while bond flows are important for exchange rates, equity flows matter as well. The relative equity performance of the US is critical for two reasons. First, the US equity market tends to do relatively better during bear markets. This was the case last year and during the 2008 crisis. Second, the outperformance of the US over the last decade has dovetailed with a dollar bull market (Chart I-8). It is rare to find a currency that has performed well both during equity bull and bear markets. If past is prologue, the near-term risks for the dollar are to the upside, especially if the market rally encounters turbulence as yields rise. The put/call ratio in the US is at a 5-year nadir. A move towards parity could violently pull up the DXY index (Chart I-9). However, a garden-variety 5-10% correction in the SPX should correspond to a shallow bounce in the DXY. This will also fit the pattern of bear market USD rallies, as we already highlighted in Chart I-1. Chart I-8US Equity Relative Performance And The Dollar
US Equity Relative Performance And The Dollar
US Equity Relative Performance And The Dollar
Chart I-9The Dollar Could Rise In ##br##A Market Reset
The Dollar Could Rise In A Market Reset
The Dollar Could Rise In A Market Reset
At the same time, any correction could usher in a violent rotation from cyclicals to defensives, especially if underpinned by higher interest rates. The performance of energy and financials are a leap ahead of other sectors in the S&P 500 this year. Importantly, they also massively outperformed during the February drawdown. Meanwhile, valuations are heavily elevated in the US compared to the rest of the world. This is true for growth sectors compared to value, and cyclicals compared to defensives. Throughout history, both exchange rates and valuations have tended to mean revert. Long-Term Dollar Outlook The 2020 pandemic was a one-in-a-hundred-year event. Coordinated fiscal and monetary stimuli have ushered in a new economic cycle. As a counter-cyclical currency, the dollar tends to do poorly (Chart I-10). This is because monetary stimulus provides more torque to economies levered to the global cycle. Once growth achieves escape velocity, the currencies of these more pro-cyclical economies benefit. The IMF projects that non-US growth should outpace US growth after 2021. Meanwhile, it is an open question that any rally in the dollar will be durable. The key driver behind the dollar increase in 2020 was a global shortage. Not only has the Fed extended its liquidity provisions to foreign central banks until September this year, the share of offshore US dollar debt issuance has fallen by a full 9 percentage points (Chart I-11). Simply put, the Fed is flooding the system with dollar liquidity at the same time that foreign entities are weaning themselves off it Chart I-10The IMF Expects Faster Growth Outside The US After 2021
The IMF Expects Faster Growth Outside The US After 2021
The IMF Expects Faster Growth Outside The US After 2021
Chart I-11Share Of US Dollar Debt ##br##Rolling Over
Arbitrating Between Dollar Bulls And Bears
Arbitrating Between Dollar Bulls And Bears
The reason behind this is balance-of-payment dynamics. The market has realized that ballooning twin deficits in the US come at a cost. For foreign issuers, it is the prospect of rolling over US-denominated debt at a much higher coupon rate. For bond investors, it is currency depreciation, especially if fiscal largesse becomes too “sticky,” and stokes inflation. As such, bond investors continue to avoid the US, despite rising rates (Chart I-12). Finally, reserve diversification out of dollars has started to place a natural ceiling on the US dollar, especially against other developed market currencies. Ever since the trend began to accelerate in 2015, the DXY has been unable to sustainably punch through the 100 level (Chart I-13). This will place a durable floor under developed market currencies in general and gold in particular. The Chinese RMB has also been gaining traction in global FX reserves. Chart I-12Little Appetite For US ##br##Treasurys
Little Appetite For US Treasurys
Little Appetite For US Treasurys
Chart I-13Reserve Diversification Has Been A Headwind For The Dollar
Reserve Diversification Has Been A Headwind For The Dollar
Reserve Diversification Has Been A Headwind For The Dollar
More specifically, the role of the USD/CNY exchange rate as a key anchor for emerging market currencies will rise, especially if the RMB remains structurally strong.2 The People’s Bank of China has massive foreign exchange reserves, worth about US$3.2 trillion. This means it can provide swap agreements that will almost cover the totality of EM foreign dollar debt. Swap agreements entail no exchange of currency, but are about confidence. The PBoC can instill this confidence in countries that have low and/or falling foreign exchange reserves. The dollar will remain the global reserve currency for years to come. However, a slow pivot towards reserve diversification will act as a structural headwind for the dollar. Housekeeping Chart I-14AUD/CAD Is Correlated To The VIX
Arbitrating Between Dollar Bulls And Bears
Arbitrating Between Dollar Bulls And Bears
We were stopped out of our CAD/NOK trade for a profit of 3.1%. The resilience of the US economy is benefiting the CAD more than the NOK for now. However, the Norges Bank confirmed it might be one of the first central banks to lift rates, as early as this year. We are both short USD/NOK and EUR/NOK and recommend sticking with these positions. Second, the growing spat between the EU and the UK could lead to more volatility in our short EUR/GBP position. Our target remains 0.8, but we are tightening stops to 0.865 to protect profits. The BoE left interest rates unchanged, but struck a constructive tone. This will bode well for cable, beyond near-term volatility. Third, our short USD/JPY position was stopped out amid the dollar rally. We are standing aside for now, but will reopen this trade later. Finally, a rise in volatility will boost the dollar, but also benefit short AUD/CAD positions. We are already short the AUD/MXN, but short AUD/CAD could be more profitable should market turmoil persist (Chart I-14). Chester Ntonifor Foreign Exchange Strategist chestern@bcaresearch.com Footnotes 1 Please see the Foreign Exchange Strategy Special Report, titled “2021 Key Views: Tradeable Themes,” dated December 4, 2020. 2 Please see Foreign Exchange Strategy Currency In-Depth Report, titled “Will The RMB Continue To Appreciate?,” dated February 26, 2021. Currencies U.S. Dollar Chart II-1USD Technicals 1
USD Technicals 1
USD Technicals 1
Chart II-2USD Technicals 2
USD Technicals 2
USD Technicals 2
Most data out of the US has been robust: Both PPI, import and export prices were in line with expectations for February. The PPI ex food and energy came in at 2.5% year-on-year. Empire manufacturing was robust at 17.4 in March, versus 12.1 last month. Housing starts and building permits came in a nudge below expectations in February, at 1421K and 1682K. The one disappointment was retail sales, which fell 3.3% year-on-year in February. The DXY index rose slightly this week. The FOMC remained dovish, without any revision to its median path of interest rate hikes. The markets disliked its reticence on rising long-bond yields. As such, equities are rolling over as yields continue to creep higher. Report Links: The Dollar Bull Case Will Soon Fade - March 5, 2021 Are Rising Bond Yields Bullish For The Dollar? - February 19, 2021 Portfolio And Model Review - February 5, 2021 The Euro Chart II-3EUR Technicals 1
EUR Technicals 1
EUR Technicals 1
Chart II-4EUR Technicals 2
EUR Technicals 2
EUR Technicals 2
Recent data from the euro area are mending: The ZEW expectations survey rose to 74 in March, from 69.6. For Germany, the improvement was better at 76.6 from 71.2. The trade balance remained at a healthy €24.2bn euro surplus in January. The euro fell by 0.6% amidst broad dollar strength. With the ECB committed to cap the rise in yields and rise in peripheral spreads, relative interest rates will move against the euro. Sentiment remains elevated, and so a healthy reset is necessary to wash out stale longs. Report Links: Portfolio And Model Review - February 5, 2021 On Japanese Inflation And The Yen - January 29, 2021 The Dollar Conundrum And Protection - November 6, 2020 The Japanese Yen Chart II-5JPY Technicals 1
JPY Technicals 1
JPY Technicals 1
Chart II-6JPY Technicals 2
JPY Technicals 2
JPY Technicals 2
Recent data from Japan has been mixed: Core machinery orders grew 1.5% year-on-year in January. Exports fell by 4.5% in January, while imports rose by 11.8%. This has shifted the adjusted trade balance to a deficit of ¥38.7bn yen. The Japanese yen fell by 0.4% against the US dollar this week, and remains the weakest G10 currency this year. Rising yields have seen Japanese investors stampede into overseas markets such as the UK, while pushing down the yen. We remain yen bulls, but will stand aside for now since it could still go lower in the short term. Report Links: The Dollar Bull Case Will Soon Fade - March 5, 2021 On Japanese Inflation And The Yen - January 29, 2021 The Dollar Conundrum And Protection - November 6, 2020 British Pound Chart II-7GBP Technicals 1
GBP Technicals 1
GBP Technicals 1
Chart II-8GBP Technicals 2
GBP Technicals 2
GBP Technicals 2
Recent data out of the UK have been weak: Industrial production and construction output fell by 4.9% and 3% year-on-year in January. Monthly GDP growth fell by 2.9% in January. Rightmove house prices rose 2.7% year-on-year in March. The pound fell by 0.4% against the dollar this week. It however remains the best performing currency this year. The BoE kept monetary policy on hold, but struck a hawkish tone as vaccination progresses, giving way to higher mobility in the summer. We remain long sterling via the euro. Report Links: Portfolio And Model Review - February 5, 2021 The Dollar Conundrum And Protection - November 6, 2020 Revisiting Our High-Conviction Trades - September 11, 2020 Australian Dollar Chart II-9AUD Technicals 1
AUD Technicals 1
AUD Technicals 1
Chart II-10AUD Technicals 2
AUD Technicals 2
AUD Technicals 2
Recent data in Australia was robust: Home prices rose by 3.6% in the fourth quarter. Modest home appreciation is welcome news by the RBA, given high-flying prices in its antipodean neighbor. The employment report was solid. There were 88.7K new jobs in February, all full-time. This pushed down the unemployment rate to 5.8% from 6.4%. The Aussie fell by 0.4% this week. The Australian recovery is fast approaching escape velocity, forcing the RBA to contain a more pronounced rise in long-bond yields. We remain long AUD/NZD. In the very near term, a market shakeout could pull the Aussie lower, favoring short AUD/CAD positions. Report Links: The Dollar Bull Case Will Soon Fade - March 5, 2021 Portfolio And Model Review - February 5, 2021 Australia: Regime Change For Bond Yields & The Currency? - January 20, 2021 New Zealand Dollar Chart II-11NZD Technicals 1
NZD Technicals 1
NZD Technicals 1
Chart II-12NZD Technicals 2
NZD Technicals 2
NZD Technicals 2
Recent data out of New Zealand was weak: Credit card spending fell by 10.6% year-on-year in January. Q4 GDP contracted by 1% both year-on-year and quarter-on-quarter. The current account remains in deficit at NZ$-2.7bn for Q4. The New Zealand dollar fell by 0.9% against the US dollar this week. The new rule to include house prices in setting monetary policy will be a logistical nightmare for the RBNZ. In trying to achieve financial stability, the RBNZ will have to forego some economic stability, especially if the country still requires accommodative settings. Confused messaging could also introduce currency volatility. Report Links: Portfolio And Model Review - February 5, 2021 Currencies And The Value-Versus-Growth Debate - July 10, 2020 Updating Our Balance Of Payments Monitor - November 29, 2019 Canadian Dollar Chart II-13CAD Technicals 1
CAD Technicals 1
CAD Technicals 1
Chart II-14CAD Technicals 2
CAD Technicals 2
CAD Technicals 2
There was a data dump in Canada this week: The economy added 259.2K jobs in February. This pushed down the unemployment rate from 9.4% to 8.2%. Wages also increased by 4.3% in February. The Nanos confidence index rose from 60.5 to 62.7 in the week of March 12. Housing starts rose by 246K in February, as expected. The BoC’s preferred measures of CPI came in close to the 2% target. Headline CPI was weaker at 1.1% in February. The Canadian dollar rose by 0.3% against the US dollar this week. The correction in oil prices could set the tone for the near-term performance of the loonie, despite robust domestic conditions. However, at the crosses, CAD should have upside. We took profits on our short CAD/NOK position this week. Report Links: Will The Canadian Recovery Lead Or Lag The Global Cycle? - February 12, 2021 Currencies And The Value-Versus-Growth Debate - July 10, 2020 More On Competitive Devaluations, The CAD And The SEK - May 1, 2020 Swiss Franc Chart II-15CHF Technicals 1
CHF Technicals 1
CHF Technicals 1
Chart II-16CHF Technicals 2
CHF Technicals 2
CHF Technicals 2
There was scant data out of Switzerland this week: Producer and import prices fell by 1.1% year-on-year in February. February CPI releases also suggest the economy remains in deflation. The Swiss franc fell by 0.4% against the US dollar this week. Safe-haven currencies continue to be sold as yields rise, making the Swiss franc the worst performing currency this year after the yen. This is welcome news for the SNB. We have been long EUR/CHF on this expectation, and recommend investors to stick with this trade. Report Links: Portfolio And Model Review - February 5, 2021 The Dollar Conundrum And Protection - November 6, 2020 On The DXY Breakout, Euro, And Swiss Franc - February 21, 2020 Norwegian Krone Chart II-17NOK Technicals 1
NOK Technicals 1
NOK Technicals 1
Chart II-18NOK Technicals 2
NOK Technicals 2
NOK Technicals 2
There was scant data out of Norway this week: The trade balance remained in surplus of NOK 25.1bn in February. The Norges bank kept interest rates on hold at 0%. The NOK fell by 1.2% against the dollar this week. The trigger was the selloff in oil prices. However, with the Norges bank signaling a rate hike later this year, placing it ahead of its G10 peers, there is little scope for the NOK to fall durably. Inflation in Norway is above target, and higher mobility later this year will benefit oil-rich Norway. We are long the Norwegian krone as a high-conviction bet against both the dollar and the euro. Report Links: Portfolio And Model Review - February 5, 2021 Revisiting Our High-Conviction Trades - September 11, 2020 A New Paradigm For Petrocurrencies - April 10, 2020 Swedish Krona Chart II-19SEK Technicals 1
SEK Technicals 1
SEK Technicals 1
Chart II-20SEK Technicals 2
SEK Technicals 2
SEK Technicals 2
Swedish data releases were a slight miss: Headline CPI came in at 1.4% in February. Core CPI came in at 1.2%. The unemployment rate remained at 8.9% in February. The Swedish krona fell by 0.8% against US dollar this week. Sweden is struggling to contain another wave of the pandemic and this has weighed on the currency this year. The saving grace for the economy has been a global manufacturing cycle that continues humming. Until Sweden is able to get past the pandemic, the currency will continue trading in a stop-and-go pattern. We remain long the SEK on cheap valuations and as a play on the global industrial cycle. Report Links: Revisiting Our High-Conviction Trades - September 11, 2020 Updating Our Balance Of Payments Monitor - November 29, 2019 Where To Next For The US Dollar? - June 7, 2019 Trades & Forecasts Forecast Summary Core Portfolio Tactical Trades Limit Orders Closed Trades
Highlights The Federal Reserve’s ultra-dovish stance is not the only reason for markets to cheer. The US is booming, China is unlikely to overtighten monetary and fiscal policy, and Europe remains a source of positive political surprises. Still, the cornerstone of this cycle’s wall of worry has been laid: Biden faces a series of foreign policy challenges, the US is raising taxes, China is tightening policy, and Europe’s stimulus is not large enough to qualify as a game changer for potential GDP growth. Stay the course by maintaining strategic pro-cyclical trades yet building up tactical hedges and safe-haven plays. Feature Chart 1US Stimulus, Chinese Tightening, German Vaccine Hiccups
US Stimulus, Chinese Tightening, German Vaccine Hiccups
US Stimulus, Chinese Tightening, German Vaccine Hiccups
The US is turning to tax hikes, China is returning to structural reforms, and Europe is bungling its vaccine rollout. Yet synchronized global debt monetization is nothing to underrate. Especially not in the context of a Great Power struggle that features a green energy race as well as a high-tech race. Governments are generating a cyclical growth boom and it is conceivably that their simultaneous pump-priming combined with a new capex cycle and private innovation could generate a productivity breakthrough. This upside risk is keeping global equity markets bullish even as it becomes apparent that construction has begun on this cycle’s wall of worry. The US dollar bounce should be watched closely in this context (Chart 1). After passing the $1.9 trillion American Rescue Plan Act, which consists largely but not entirely of short-term cash handouts (Chart 2), President Joe Biden’s policy agenda will now turn to tax hikes. Thus far the tax hike proposals are in line with Biden’s campaign literature (Table 1). It remains to be seen whether the market will “sell the news” that Biden is pivoting to tax hikes. After all, Biden was the most moderate of the Democratic candidates and his tax proposals only partially reverse President Trump’s tax cuts. Chart 2American Rescue Plan Act
Building Back … The Wall Of Worry
Building Back … The Wall Of Worry
Table 1Biden’s Tax Hike Proposals On The Campaign Trail
Building Back … The Wall Of Worry
Building Back … The Wall Of Worry
Nevertheless higher taxes symbolize a regime change in the US – it is very unlikely tax rates will go down anytime soon but they could go easily higher than expected in the coming decade – and the drafting process will bring negative surprises, as Treasury Secretary Janet Yellen highlighted by courting Europe to cooperate on a 12% minimum corporate tax and halt the global race to the bottom in taxes on multinational corporations. At the same time Biden’s foreign policy challenges are rising across the board: China is demanding a rollback of Trump’s policies: If Biden says yes, he will sacrifice hard-won American leverage on matters of national interest. If he says no, the Phase One trade deal will be null and void, as will sanctions on Iran and North Korea, and the new economic sanctions on Taiwan will expand beyond mere pineapples.1 Russia is recalling its US ambassador: Biden vowed to make Russia pay for alleged interference in the 2020 US election and sanctions are forthcoming.2 The real way to make Russia pay is to halt the construction of the Nordstream II natural gas pipeline, which reduces the leverage of eastern European democracies while increasing Germany’s energy dependence on Russia. But Germany is dead-set on that pipeline. If Biden levies sanctions the centerpiece of his diplomatic outreach to Europe will be further encouraged to chart an independent course from Washington (though the rest of Europe might cheer). North Korea is threatening to restart missile tests: North Korea is pouring scorn on the Biden administration for trying to restart negotiations.3 The North wants sanctions relief and it knows that Biden is willing to offer it but it may need to create an atmosphere of crisis first. China would be happy were that to happen as it could offer the US its good services on North Korea instead of concrete trade concessions. Iran is refusing to rejoin negotiations over the 2015 nuclear deal: Biden has about five months to arrange for the US and Iran to rejoin the 2015 nuclear deal. Beyond that he will enter into another long negotiation with the master negotiators, the Persians. But unlike President Obama from 2009-15, he will not have support from Russia and China … unless he sacrifices his doctrine of “extreme competition” from the get-go. It is not clear which of these challenges will be relevant to financial markets, or when. However, with US and global equities skyrocketing, it must be said that the geopolitical backdrop is not nearly as reassuring as the Federal Reserve, which announced on Saint Patrick’s Day that it will not hike interest rates until 2024 even in the face of a 6.5% growth rate and the prospect of an additional, yet-to-be passed $2 trillion in US deficit spending. Herein lies Biden’s first victory. He has stressed that boosting the American economy and middle class is critical to his foreign policy. He envisions the US regaining its global standing by defeating the virus, super-charging the economy, and then orchestrating a grand alliance of European and Asian democracies to write new global rules that will put pressure on China to reform its economy. “I say it to foreign leaders and domestic alike. It's never, ever a good bet to bet against the American people. America is coming back. The development, manufacturing, and distribution of vaccines in record time is a true miracle of science.”4 The pandemic and economic part of this agenda are effectively done and now comes the hard part: creating a grand alliance while China and Russia demonstrate to their neighbors the hard consequences of joining any new US crusade. The contradiction of Biden’s foreign policy is his desire to act multilaterally and yet also get a great deal done. The Europeans are averse to conflict with China and Russia. The Russians and Chinese are not inclined to do any great favors on Iran or North Korea. Nobody is opening up their economy – Biden himself is coopting Trump’s protectionism, if less brashly. Cooperation with Presidents Xi Jinping and Vladimir Putin on nuclear proliferation is possible – as long as Biden aborts his democracy agenda and his trade agenda. We continue with our pro-cyclical investment stance but have started building up hedges as we are convinced that geopolitical risk will deliver a rude awakening. This awakening will be a buying opportunity given the ultra-stimulating backdrop … unless it portends war in continental Europe or the Taiwan Strait. In the remainder of this report we highlight the takeaways from China’s National People’s Congress as well as recent developments in Germany. Our key views remain the same: China will not overtighten monetary/fiscal policy; Biden will be hawkish on China; Germany’s election may see an upset but that would be market-positive. China: No Overtightening So Far China concluded its National People’s Congress – the “Two Sessions” of legislation every year – and issued its 2021 Government Work Report. It also officially released the fourteenth five-year plan covering economic development for 2021-25. Table 2 shows the new plan’s targets as compared to the just expired thirteenth five-year plan that covered 2016-20. Table 2China’s Fourteenth Five Year Plan (2021-25)
Building Back … The Wall Of Worry
Building Back … The Wall Of Worry
For a full run-down of the National People’s Congress we recommend clients peruse BCA’s latest China Investment Strategy report. From a geopolitical point of view we would highlight the following takeaways: The Tech Race: China added a new target for strategic emerging industry value added as percent of GDP – it wants this number to reach 17% by 2025 but there is nothing solid to benchmark this against. The point is that by including such a target China is putting more emphasis on emerging industries, including: information technology, robotics, green energy, electric vehicles, 5G networks, new materials, power equipment, aerospace and aviation equipment, and others. China’s technological “Great Leap Forward” continues, with a focus on domestic production and upgrading the manufacturing sector that is bound to stiffen the competition with the United States. China’s removal of a target for service industry growth suggests that Beijing does not want de-industrialization to occur any faster – another reason for global trade tensions to stay high. Research and Development: For R&D spending, previous five-year plans set targets for the desired level. For example, over the last five years China vowed to increase annual R&D spending to 2.5% of GDP. A reasonable expectation for the coming five years would have been a 3% target of GDP. However, this time the government set a target of an annual growth rate of no less than 7% during 2021-2025. The point is that China is continuing to ascend the ranks in R&D spending relative to the US and West in coordination with the overarching goal of forging an innovative and high-tech economy. Unemployment: China has restored an unemployment rate target. In its twelfth five-year plan Beijing aimed to keep the urban surveyed unemployment rate below 5% but over the past five years this target vanished. Now China restored the target and bumped it up slightly to 5.5%. This target should not be hard to meet given the reported sharp decline in urban unemployment to 5.2% already. However, China’s unemployment statistics are notoriously unreliable. The real takeaway is that unemployment will be higher as trend growth slows, while social stability remains the Communist Party’s ultimate prize – and any reform or deleveraging process will occur within that context. The Green Energy Race: China re-emphasized its pledge to tackle climate change, aiming for peak carbon emissions by 2030 and carbon neutrality by 2060. However, no detailed action plans were mentioned. Presumably China will not loosen its enforcement of existing environmental targets. Most of these were kept the same as over the past five years, except for pollution (PM2.5 concentration). Previously the government sought to reduce PM2.5 concentration by 18%. Now the target is set at 10% aggregate reduction, which is lower, though further reduction will be difficult after a 43% drop since 2014. Overall, China has not loosened up its environmental targets – if anything, enforcement will strengthen, resulting in an ongoing regulatory headwind to “Old China” industries. Military Power: Last week we noted that the government’s goals for the military have changed in a way that reinforces themes of persistently high geopolitical tensions. The info-tech upgrades to the People’s Liberation Army were supposed to be met by 2020, with full “modernization” achieved by 2035. However, last October the government created a new deadline, the one-hundredth anniversary of the PLA in 2027 (“military centenary goal”). No specific measures or targets are given but the point is that there is a new deadline of serious importance – an importance that matches the party’s much-ballyhooed centennial on July 1 of 2021 and the People’s Republic’s centennial in 2049. The fact that this deadline is only six years away suggests that a rapid program of military reform and upgrade is beginning. The official defense spending growth target of 6.8% is only slightly bigger than last year’s 6.6% but these targets mask the significance of the announcement. The takeaway is that the Chinese military is preparing for an earlier-than-expected contingency with the United States and its allies. What about China’s all-important monetary, fiscal, and quasi-fiscal credit targets? There is no doubt that China is tightening policy, as we highlight in our updated China Policy Tightening Checklist (Table 3). But will China overtighten? Probably not, at least not judging by the Two Sessions, but the risk is not negligible. Table 3A Checklist For Chinese Policy Tightening
Building Back … The Wall Of Worry
Building Back … The Wall Of Worry
The government reiterated that money and credit growth should remain in a reasonable range in 2021, with “reasonable range” referring to nominal economic growth. Chinese economists estimate that the nominal growth rate will be around 8%-9% in 2021. The IMF projection is 8.1%, while latest OECD forecast is at 7.8%.5 Because China’s total private credit (total social financing) growth is inherently higher than M2 growth, we would use pre-pandemic levels as our benchmark for whether the government will tighten policy excessively: If total social financing growth plunges below 12%, then our view is disproved and Beijing is over-tightening (Chart 3). If M2 growth plunges below 8%, we can call it over-tightening. Anything above these benchmarks should be seen as reasonable and expected tightening, anything below as excessive. However, the Chinese and global financial markets could grow jittery at any time over the perennial risk of a policy mistake whenever governments try to prevent excessive leverage and bubbles. As for fiscal policy, the new quotas for local government net new bond issuance point to expected rather than excessive tightening. New bonds can be used to finance capital investment projects. The quota for total new bond issuance is 4.47 trillion CNY, down by 5.5% from last year. Though local governments may not use up all of the quota, the reduction is small. In fact, total local government bond issuance will be a whisker higher in 2021 than in 2020. The quota for net new bonds is only slightly below the 2020 level and much higher than the 2019 level. Therefore the chance of fiscal overtightening is small – and smaller than monetary overtightening. Chart 3China Policy Overtightening Benchmark
China Policy Overtightening Benchmark
China Policy Overtightening Benchmark
Chart 4China’s Real Budget Deficit Is Huge
Building Back … The Wall Of Worry
Building Back … The Wall Of Worry
China’s official budget balance is a fiction so we look at the IMF’s augmented net lending and borrowing, which reached a whopping -18.2 % of GDP in 2020. It is expected to decrease gradually to -13.8% by 2025. That level will be slightly higher than the pre-pandemic level from 2017-2019 (Chart 4).6 By contrast, China’s total augmented debt is expected to keep rising in the coming years and reach double the 2015 level by 2025. Efforts to constrain debt could lead to a larger debt-to-GDP ratio if growth suffers as a consequence, as our Global Investment Strategy points out. So China will tighten cautiously – especially given falling productivity, higher unemployment, and the threat of sustained pressure from the US and its allies. US-China: Biden As Trump-Lite Chinese and US officials will convene in Alaska on March 18-19. This is the first major US-China meeting under the Biden administration and global investors will watch closely to see whether tensions will drop. So far tensions have not fallen, highlighting a persistent and once again underrated risk to the global equity rally. Biden’s foreign policy team has not completed its review of China policy and Presidents Biden and Xi Jinping are trying to schedule a bilateral summit in April – so nothing concrete will be decided before then. Chart 5US-China: Beijing's Standing Offer
US-China: Beijing's Standing Offer
US-China: Beijing's Standing Offer
The Biden administration is setting up a pragmatic policy, offering areas to engage with China while warning that it will not compromise on democratic values or national interests. China would welcome the opportunity to work with the Americans on nuclear non-proliferation, namely North Korea and Iran, as this would expend US leverage on an area of shared interest while leaving China a free hand over its economic and technological policies. China at least partially enforced sanctions on these countries in response to President Trump’s demands during the trade war and official statistics suggest it continues to do so. Oil imports from Iran remain extremely low while Chinese business with North Korea is, on paper, nil (Chart 5). If this data is accurate then North Korea’s economy has not benefited from China’s stimulus and snapback. If true, then Pyongyang will offer partial concessions on its nuclear program in exchange for sanctions relief. At the moment, instead of staging any major provocations to object to US-Korean military drills, the North is using fiery language and threatening to restart missile tests. This suggests a diplomatic opening. But investors should be prepared for Pyongyang to stage much bigger provocations than missile tests. In March 2010, while the world focused on the financial crisis, the North Koreans torpedoed a South Korean corvette, the Chonan, and shelled some islands, at the risk of a war. The problem under the Trump administration was that Trump wanted a verifiable and durable deal of economic opening for denuclearization whereas the North Koreans wanted to play for time, reduce sanctions, study the data from their flurry of missile tests during the Obama and early Trump years, and see if Trump would get reelected before offering any concrete concessions. Trump’s stance was not really different from Bill Clinton’s but he tried to accelerate the timeline and go for a big win. By Trump’s losing the election North Korea bought four more years on the clock. Chart 6US-China: Biden Lukewarm On China
Building Back … The Wall Of Worry
Building Back … The Wall Of Worry
The Biden administration is willing to play for time if it gets concrete results in phases. This would keep North Korea at bay and retain a line of pragmatic engagement with Beijing. But if North Korea stages a giant provocation Biden will not hesitate to use threats of destruction like Clinton and Trump did. The American public is not much concerned about North Korea (or Iran) but is increasingly concerned about China, with a recent Gallup opinion poll showing that nearly 50% view China as America’s greatest enemy and Americans consistently overrate China’s economic power (Chart 6). Biden will not let grassroots nationalism run his policy. But it is true that he has little to gain politically from appearing to appease China. With progress at hand on the pandemic and economic recovery, Biden will devote more attention to courting the allies and attempting to construct his alliance of democracies to meet global challenges and to “stand up” to China and Russia. The allies, however, are risk-averse when it comes to confronting China. This is as true for the Europeans as it is for China’s Asian neighbors, who stand directly in its firing line. In fact, Europe’s total trade with China is equivalent to that of the US (Chart 7). The Europeans have said that they will pursue tougher trade enforcement through the World Trade Organization, which would tie the Biden administration’s hands. Biden and his cabinet officials insist that they will use the “full array” of tools at their disposal (e.g. tariffs and sanctions) to punish China for mercantilist trade policies. Chinese negotiators are said to be asking explicitly for Biden to roll back Trump’s policies. Some of these policies relate to trade and tech acquisition, others to strategic disputes. We doubt that Biden will compromise on the trade issues to get cooperation on North Korea and Iran. But he will have to offer major concessions if he wants durable denuclearization agreements on these rogue states. Otherwise it will be clear that his administration is mostly focused on competition with China itself and willing to sideline the minor nuclear aspirants. Our expectation is that Americans care about the China threat and the smaller threats will be used as pretexts with which to increase pressure and sanctions on China. Asian equities have corrected after going vertical, as expected. But contrary to our expectations geopolitics was not the cause (Chart 8). This selloff could eventually create a buying opportunity if the Biden administration is revealed to take a more dovish line on China, trade, and tech in exchange for progress on strategic disputes like North Korea. Any discount due to North Korean provocations in particular would be a buy. On Taiwan, however, China’s new 2027 military target underscores our oft-recited red flag. Chart 7EU Risk Averse On China
EU Risk Averse On China
EU Risk Averse On China
Chart 8Asian Equity Correction And GeoRisk Indicators
Asian Equity Correction And GeoRisk Indicators
Asian Equity Correction And GeoRisk Indicators
Bottom Line: Investors should stay focused on the US-China relationship. What matters is Biden’s first actions on tariffs and high-tech exports. So far Biden is hawkish as we anticipated. Investors should fade rumors of big new US-China cooperation prior to the first Biden-Xi summit. Any major North Korean aggression will create a buy-on-the-dips opportunity. Unless it triggers a war, that is – and the threshold for war is high given the Chonan incident in 2010. Germany: Markets Wake Up To Election Risk – And Smile This week’s election in the Netherlands delivered a fully expected victory to Prime Minister Mark Rutte’s liberal coalition. The German leadership ranks next to the Dutch in terms of governments that received an increase in popular support as a result of the COVID-19 crisis (Chart 9). However, in Germany’s case the election outcome is not a foregone conclusion. Chart 9German Leadership Saw Popularity Bounce
Building Back … The Wall Of Worry
Building Back … The Wall Of Worry
As we highlighted in our annual forecast, an upset in which a left-wing bloc forms the government for the first time since 2005 is likelier than the market expects. This scenario presents an upside risk for equities and bund yields since Germany would become even more pro-Europe, pro-integration, and proactive in its fiscal spending. In the current context that would be greeted warmly by financial markets as it would reinforce the cyclical rotation into the euro, industrials, and European peripheral debt. Incidentally, it would also reduce tensions with Russia and China – even as the Biden administration is courting Germany. Recent state elections confirm that the electorate is moving to the left rather than the right. In Baden-Wurttemberg, the third largest state by population and economic output, and a southern state, the Christian Democrats slipped from the last election (-2.9%), the Social Democrats slipped by less (-1.7%), the Free Democrats gained (2.2%), the Greens gained (2.3%), and the far-right Alternative for Germany saw a big drop (-5.4%). In the smaller state of Rhineland-Palatinate the results were largely the same although the Greens did even better (Tables 4A & 4B).7 In both cases the Christian Democrats saw the worst result since prior to the financial crisis while the Greens tripled their support in Baden and doubled their support in the Palatinate over the same time frame. Table 4AGerman State Elections Show Voters’ Leftward Drift Continues
Building Back … The Wall Of Worry
Building Back … The Wall Of Worry
Table 4BGerman State Elections Show Voters’ Leftward Drift Continues
Building Back … The Wall Of Worry
Building Back … The Wall Of Worry
To put this into perspective: Outgoing Chancellor Angela Merkel and her coalition have seen a net 6% increase in popular support since COVID-19. The coalition, led by the Christian Democratic Union and its Bavarian sister party, the Christian Social Union, still leads national opinion polling. What we are highlighting are chinks in the armor. The gap with the combined left-leaning bloc is less than 10% points (Chart 10). Chart 10German Party Polling
German Party Polling
German Party Polling
Merkel is a lame duck whose party has been in power for 17 years. She is struggling to find an adequate successor. Her current frontrunner for chancellor-candidate, Armin Laschet, is suffering in public opinion, especially after the state election defeats, while her previous successor was ousted last year. Other chancellor-candidates, like Friedrich Merz, Markus Söder, and Norbert Röttgen may find themselves to the right of the median voter, which has been shifting to the left. Merkel’s party’s handling of COVID-19 first received praise and now, in the year of the vote, is falling under pressure due to difficulties rolling out the vaccine. Even as conditions improve over the course of the year her party may struggle to recover from the damage, since the underlying reality is that Germany has suffered a recession and is beset by global challenges. While the Christian Democrats performed relatively well in the 2009 election, in the teeth of the global financial crisis, times have changed. Today the Social Democrats are no longer in free fall – ever since their Finance Minister Olaf Scholz led the charge for fiscal stimulus in 2019 – while third parties like the Free Democrats, Greens, and Die Linke all gained in 2009 and look to gain this year (Table 5). In today’s context it is even more likely that other parties will rise at the ruling party’s expense. Still, the Christian Democrats have stout support in polls and do not have to split votes with the far-right, which is in collapse. Table 5German Federal Election Results Show 2021 Could Throw Curveball For Ruling Party
Building Back … The Wall Of Worry
Building Back … The Wall Of Worry
Therein lies the real market takeaway: right-wing populism has flopped in Germany. The risk to the consensus view that Merkel will hand off the baton seamlessly to a successor and secure her party another term in leadership is that the establishment left will take power (the Greens in Germany are essentially an establishment party). Chart 11German Bunds Respond To Macro Shifts, State Elections
German Bunds Respond To Macro Shifts, State Elections
German Bunds Respond To Macro Shifts, State Elections
Near-term pandemic and economic problems have caused bund yields to fall and the yield curve to flatten so far this year (Chart 11). But that trend is unlikely to continue given the global and national outlook. Election uncertainty should work against this trend since the only possible uncertainty gives more upside to the fiscal outlook and bond yields. If the consensus view indeed comes to pass and the Christian Democrats remain in power, the election holds out policy continuity – at least on economic policy. Fiscal tightening would happen sooner under the Christian Democrats but it would not be aggressive or premature, at least not in the 2021-22 period. It is the current coalition that first loosened Germany’s belt – and it did so in 2019, prior to COVID-19. Germany’s and the EU’s proactive fiscal turn will have a major positive impact on growth prospects, at least cyclically, though it is probably too small thus far to create a structural improvement in potential growth. Fiscal thrust is negative over next two years even with the EU’s Next Generation Recovery Fund being distributed. A structural increase in growth is possible given that all of the major countries are simultaneously pursuing monetary and fiscal stimulus as well as big investments in technology and renewable energy that will help engender a new private capex cycle. But productivity has been on a long, multi-decade decline so it remains to be seen if this can be reversed. Geopolitically speaking, Germany’s and the EU’s policy shift arrived in the nick of time to deepen European integration before divisions revive. Integration is broadly driven by European states’ need to compete on a grand scale with the US, Russia, and China. But Putin, Brexit, and Mario Draghi demonstrate the more tactical pressures: Brexit discourages states from exiting, especially with ongoing trade disputes and the risk of a new Scottish independence referendum; Putin’s aggressive foreign policy drives eastern Europeans into the arms of the West; and the formation of a unity government in Italy encourages European solidarity and improves Italian growth prospects. The outlook for structural reforms is not hopeless. Prime Minister Draghi’s government has a good chance of succeeding at some structural reforms where his predecessors have failed. Meanwhile French President Emmanuel Macron is still favored to win the French election in 2022, which is good for French structural reform. The fact that the EU tied its recovery fund to reform is positive. Most importantly the green energy agenda is replacing budget cutting for the time being, which, again, is positive for capex and could create positive long-term productivity surprises. Of course, structural reform intensity slowed just prior to COVID, in Spain, France, and Italy. Once the recovery funds are spent the desire to persist with reform will wane. This is clear in Spain, which has rolled back some reforms and has a weak government that could dissolve any time, and Italy, where the Draghi coalition may not last long after funds are spent. If the global upswing persists and Chinese/EM growth improves, then Europe will benefit from a macro backdrop that enables it to persist with some structural reforms and crawl out of its liquidity trap. But if China/EM growth relapses then Europe will fall back into a slump. Thus it is a very good thing for Europe, the euro, and European equities that the US is engaged in an epic fiscal blowout and that China’s Two Sessions dampened the risk of overtightening. Incidentally, if the German government does shift, relations with Russia would improve on the margin. While US-Russia tensions will remain hot, German mediation could reduce Russia’s insecurity and lower geopolitical risks for both Russia and emerging Europe, which are very cheaply valued at present in part because they face a persistent geopolitical risk premium. Bottom Line: German politics will drive further EU integration whether the Christian Democrats stay in power or whether the left-wing parties manage a surprise victory. Europe will have to provide more fiscal stimulus but otherwise the global context is favorable for Europe. Investors should not be too pessimistic about short-term hiccups with the vaccine rollout. Investment Takeaways The US is stimulating, China is not overtightening, and German’s election risk is actually an upside risk for European and global risk assets. These points reaffirm a bullish cyclical outlook on global stocks and commodities and a bearish outlook on government bonds. It is especially positive for global beneficiaries of US stimulus excluding China, such as Canada and Mexico. It is also beneficial for industrial metals and emerging markets exposed to China over the medium term, after frenzied buying suffers a healthy correction. Any premium in European equities should be snapped up. However, the cornerstone has been laid for the wall of worry in this global economic cycle: the US is raising taxes, China is tightening policy, and Europe’s fiscal stimulus will probably fall short. Moreover a consensus outcome from the German election would be a harbinger of earlier-than-expected fiscal normalization. There is not yet a clear green light in US-China relations – on the contrary, our view that Biden would be hawkish is coming to pass. Biden faces foreign policy tests across the board and now is a good time to hedge against the inevitable return of downside risks given the remorseless increase in tensions between the Great Powers. Housekeeping A number of clients have written to ask follow-up questions about our contrarian report last week taking a positive view on cybersecurity stocks despite the tech selloff and a positive view on global defense stocks, especially in relation to cybersecurity. The main request is, Which companies offer the best value? So we teamed up with BCA’s new Equity Analyzer to highlight the companies that receive the best BCA scores utilizing a range of factors including value, safety, payout, quality, technicals, sentiment, and macro context – all relative to a universe of global stocks with a minimum market cap of $1 billion. The results are shown in the Appendix, which we hope will come in handy. Separately our tactical hedge, long US health care equipment versus the broad market, has stopped out at -5%. This makes sense in light of the pro-cyclical rotation. Health care equipment is still likely to outperform the rest of the US health care sector amid a policy onslaught of higher taxes, government-provided insurance, and pharmaceutical price caps. Matt Gertken Vice President Geopolitical Strategy mattg@bcaresearch.com Yushu Ma Research Associate yushu.ma@bcaresearch.com Appendix Appendix Table ABCA Research Equity Analyzer Casts Light On Best Defense And Cybersecurity Stocks
Building Back … The Wall Of Worry
Building Back … The Wall Of Worry
Appendix Table BBCA Research Equity Analyzer Casts Light On Best Defense And Cybersecurity Stocks
Building Back … The Wall Of Worry
Building Back … The Wall Of Worry
Appendix Table CBCA Research Equity Analyzer Casts Light On Best Defense And Cybersecurity Stocks
Building Back … The Wall Of Worry
Building Back … The Wall Of Worry
Footnotes 1 China is asking for export controls that have hamstrung Huawei and SMIC to be removed as well as for sanctions and travel bans on Communist Party members and students to be lifted. See Lingling Wei and Bob Davis, "China Plans To Ask U.S. To Roll Back Trump Policies In Alaska Meeting," Wall Street Journal, March 17, 2021, wsj.com; Helen Davidson, "Taiwanese urged to eat ‘freedom pineapples’ after China import ban," The Guardian, March 2, 2021, theguardian.com. 2 "Putin on Biden: Russian President Reacts To US Leader’s Criticism," BBC, March 18, 2021, bbc.com. 3 Pyongyang is likely to test a new, longer range intercontinental ballistic missile for the first time since its self-imposed missile test moratorium began in 2018 after President Trump’s summit with leader Kim Jong Un. See Lara Seligman and Natasha Bertrand, "U.S. ‘On Watch’ For New North Korean Missile Tests," Politico, March 16, 2021, politico.com. 4 See ABC News, "Transcript: Joe Biden delivers remarks on 1-year anniversary of pandemic", ABC News, Mar. 11, 2021, abcnews.com. 5 Please see IMF Staff, "World Economic Outlook Reports", IMF, Jan. 2021, imf.org and OECD Staff, "OECD Economic Outlook, Interim Report March 2021", OECD, March 9, 2021, oecd.org. 6 Please see IMF Asia and Pacific Dept, "People’s Republic of China : 2020 Article IV Consultation-Press Release; Staff Report; and Statement by the Executive Director for the People's Republic of China", IMF, Jan. 8, 2021, imf.org. 7 The other state elections coming up this year will coincide with the federal election on September 26, with one minor exception (Saxony-Anhalt). Opinion polls show the Christian Democrats slipping below the Greens in Berlin and the Social Democrats in Mecklenburg-Vorpommern. The Alternative for Germany is falling in all regions.
Highlights Stimulus checks will not be inflationary. Most households will regard them as additional wealth, and the propensity to spend additional wealth is very low. The bond market’s model for predicting inflation is the precise opposite of what happens in the real world. The bond market’s expectations for inflation are positively correlated with commodity prices, whereas actual prospective inflation is negatively correlated with commodity prices. When, as now, the crude oil price is above $50, long-term investors should overweight T-bonds versus Treasury Inflation Protected Securities (TIPS). The real bond yield is much higher than the bond market is pricing, which means that equities and other risk-assets are more expensive than they appear. Fractal trades shortlist: stocks versus bonds, 30-year T-bond, NOK/PLN. Feature Chart of the WeekCrude Oil Above $50 Results In Prospective Deflation
Crude Oil Above $50 Results In Prospective Deflation
Crude Oil Above $50 Results In Prospective Deflation
Major anomalies should not exist in the financial markets, and least of all in the government bond market which is supposed to be the most efficient market of all. But a major anomaly does exist. The anomaly is in the way that the bond market prices inflation. More about that in a moment, but let’s first discuss whether the current surge in inflation expectations is warranted. The Inflationary Impact Of Stimulus Checks Is Exaggerated Inflation expectations have risen. And they have risen especially in the US, for two reasons. First, compared with Europe, the US vaccination roll-out appears to be going relatively smoothly. Second, the US government has been more pro-active in stimulating the economy, especially in the form of issuing stimulus checks to households, as well as other so-called ‘personal current transfer payments.’ Given that this has boosted incomes while spending has been constrained, the US household sector has amassed a war chest of savings. The argument goes that as social restrictions and voluntary social distancing are eased, this war chest will get spent, unleashing a tsunami of pent-up demand which will drive up inflation. But is this argument correct? Even if social restrictions do fully ease – a big if – is it correct to assume that unspent income will get spent? A recent study by the Bank of England points out that whether unspent income gets spent depends on whether households regard it as additional income or additional wealth.1 Whether unspent income gets spent depends on whether households regard it as additional income or additional wealth. The propensity to consume out of additional income is relatively high, with estimates ranging up to 50 percent. But the propensity to consume out of additional wealth is tiny, with international estimates centred around just 5 percent. This begs the question: will households regard the stimulus checks as additional income or additional wealth? The answer depends on whether the household has a low income or a high income. Lower income households, that have borne the brunt of job losses and furloughs, have suffered big drops in their income relative to consumption. Hence, they will regard the stimulus checks as additional income. But to the extent that the additional income is just (partly) replacing lost income, it will not boost their consumption versus what it would have been absent the lost income. On the other hand, higher income households and retirees have largely maintained their incomes while their consumption has fallen. This is where the surge in savings is concentrated. But not being ‘income or liquidity constrained’, these higher income households are more likely to deposit the stimulus checks into their savings accounts (or the stock market), regarding it as additional wealth. Hence, any boost to consumption will be modest and short-lived. In fact, this was precisely what happened after previous issues of stimulus checks, such as in 2008 and 2009. Stimulus checks had no meaningful impact on consumption or inflation trends (Chart I-2). Chart I-2Stimulus Checks Had No Meaningful Impact On Consumption Or Inflation Trends
Stimulus Checks Had No Meaningful Impact On Consumption Or Inflation Trends
Stimulus Checks Had No Meaningful Impact On Consumption Or Inflation Trends
A Major Anomaly In The Bond Market The recent surge in inflation expectations has moved in perfect lockstep with higher prices for commodities, especially crude oil. At first glance, this relationship seems intuitive. After all, we associate higher commodity prices with higher inflation. But on further thought, the tight positive correlation between inflation expectations and commodity price levels is counterintuitive. The first issue is basic maths. Inflation is a change in a price, so it should not move in lockstep with the level of any price. But there is a much bigger issue. Whether the commodity price is driving inflation expectations or whether inflation expectations are driving the commodity price, a higher price today will feed back into lower prospective inflation. In fact, a crude oil price above $50 has consistently predicted prospective deflation in the oil price, leading to CPI inflation underperforming its 2 percent target (Chart of the Week). The bond market’s model for predicting inflation is the precise opposite of what happens in the real world. The important takeaway is that the bond market’s model for predicting inflation is the precise opposite of what happens in the real world. The bond market’s expectations for inflation are positively correlated with commodity prices, but actual prospective inflation is negatively correlated with commodity prices (Chart I-3 and Chart I-4). Chart I-3The Bond Market's Expectations For Inflation Are Positively Correlated With Commodity Prices...
The Bond Market's Expectations For Inflation Are Positively Correlated With Commodity Prices...
The Bond Market's Expectations For Inflation Are Positively Correlated With Commodity Prices...
Chart I-4...But Actual Prospective Inflation Is Negatively Correlated With Commodity Prices
...But Actual Prospective Inflation Is Negatively Correlated With Commodity Prices
...But Actual Prospective Inflation Is Negatively Correlated With Commodity Prices
This major anomaly in the bond market creates a great opportunity for long-term bond investors. When the (Brent) crude oil price is above $50, long-term investors should overweight T-bonds versus Treasury Inflation Protected Securities (TIPS). And vice-versa when crude falls below $50. With Brent now at $68, the appropriate long-term stance is to overweight T-bonds versus TIPS (Chart I-5). Chart I-5When The (Brent) Oil Price Is Above , Long-Term Investors Should Overweight T-bonds Versus TIPS
When The (Brent) Oil Price Is Above $50, Long-Term Investors Should Overweight T-bonds Versus TIPS
When The (Brent) Oil Price Is Above $50, Long-Term Investors Should Overweight T-bonds Versus TIPS
There are also implications for other investors. Given that the bond market is useless at predicting inflation, it is also useless at assessing real interest rates. Specifically, when crude is above $50, the ex-post (realised) real bond yield will be higher than the ex-ante (assumed) real bond yield (Chart I-6). The important takeaway right now is that in any comparison with the real bond yield, equities and other risk-assets are even more expensive than they appear. Chart I-6When The (Brent) Oil Price Is Above , The Realised Real Bond Yield Will Be Higher Than Assumed
When The (Brent) Oil Price Is Above $50, The Realised Real Bond Yield Will Be Higher Than Assumed
When The (Brent) Oil Price Is Above $50, The Realised Real Bond Yield Will Be Higher Than Assumed
Embrace The Fractal Market Hypothesis The Fractal Market Hypothesis (FMH) is a breakthrough in the understanding of financial markets, replacing the defunct Efficient Market Hypothesis (EMH). The breakthrough insight from the Fractal Market Hypothesis is that the market is not always efficient. The market is efficient only when a wide spectrum of investment time horizons is setting the price, signified by the market having a rich fractal structure. The Fractal Market Hypothesis (FMH) is a breakthrough in the understanding of financial markets. The corollary is that when the fractal structure becomes extremely fragile, it tells us that the information and interpretation of long-term investors is missing from the recent price setting, and is likely to reappear. At which point, the most recent price trend, fuelled by short-term groupthink, will break down. As most investors are unaware of the Fractal Market Hypothesis, it gives a competitive advantage to the few investors that do embrace it. Through the past five years, our proprietary Fractal Trading System has identified countertrend trading opportunities with truly excellent results. After 207 trades, the ‘win ratio’ stands at 61 percent. Yet as we understand more about this breakthrough theory of finance, we believe we can do even better. Today, we are very pleased to upgrade the trading system with innovations to the calculations of fractal structure, the countertrend profit opportunity, and the optimal holding period, all detailed in Box I-1. Box 1: Fractal Trading System Principles Countertrend opportunities in an investment will be identified by a fragile composite fractal structure, based on 65-day, 130-day, and 260-day fractal dimensions approaching their lower bounds. The countertrend profit target will be based on a Fibonacci retracement. There will be a symmetrical stop-loss. The maximum holding period will be trade-specific and vary from 33 to 130 business days (broadly 6 weeks to 6 months). From today, we will also identify a larger number of fragile fractal structures and especially highlight those that are evident in mainstream investments. From this shortlist of candidates, we will choose the most compelling to add into our portfolio. In many cases, the alignment of a fundamental argument with a fragile fractal structure will reinforce the investment case. Among our most recent recommendations, underweight China versus New Zealand achieved its 9 percent target, short Korean won versus US dollar achieved its 2.5 percent target, and long Russian rouble versus South African rand expired at 1.5 percent profit. This week, we highlight that the composite fractal structures of stocks versus bonds and the 30-year T-bond are becoming extremely fragile (Chart I-7 and Chart I-8). To be clear, this does not guarantee a countertrend move, but it does indicate an elevated susceptibility to a countertrend move. Hence, for the time being, we remain tactically neutral stocks versus bonds. Chart I-7The Fractal Structure Of Stocks Versus Bonds Is Becoming Fragile
The Fractal Structure Of Stocks Versus Bonds Is Becoming Fragile
The Fractal Structure Of Stocks Versus Bonds Is Becoming Fragile
Chart I-8The Fractal Structure Of The 30-Year T-Bond Is Becoming Fragile
The Fractal Structure Of The 30-Year T-Bond Is Becoming Fragile
The Fractal Structure Of The 30-Year T-Bond Is Becoming Fragile
In the foreign exchange markets, we note that the strong advance in the Norwegian krone, fuelled by the rally in crude oil, is vulnerable to a pullback (Chart I-9). Accordingly, this week’s recommended trade is short NOK/PLN, setting a profit target and symmetrical stop at 2.6 percent. Chart I-9Short NOK/PLN
NOK/PLN
NOK/PLN
Dhaval Joshi Chief Strategist dhaval@bcaresearch.com Footnotes 1 Bank of England, An update on the economic outlook by Gertjan Vlieghe, 22 February 2021 Fractal Trading System
A Major Anomaly In The Bond Market
A Major Anomaly In The Bond Market
Fiscal Stimulus Is Hurting
Fiscal Stimulus Is Hurting
Structural Recommendations
Fiscal Stimulus Is Hurting
Fiscal Stimulus Is Hurting
Closed Fractal Trades
A Major Anomaly In The Bond Market
A Major Anomaly In The Bond Market
A Major Anomaly In The Bond Market
A Major Anomaly In The Bond Market
A Major Anomaly In The Bond Market
A Major Anomaly In The Bond Market
Asset Performance
A Major Anomaly In The Bond Market
A Major Anomaly In The Bond Market
Equity Market Performance
A Major Anomaly In The Bond Market
A Major Anomaly In The Bond Market
Indicators Bond Yields Chart II-1Euro Area
Indicators To Watch - Bond Yields - Euro Area
Indicators To Watch - Bond Yields - Euro Area
Chart II-2Europe Ex Euro Area
Indicators To Watch - Bond Yields - Europe Ex Euro Area
Indicators To Watch - Bond Yields - Europe Ex Euro Area
Chart II-3Asia
Indicators To Watch - Bond Yields - Asia
Indicators To Watch - Bond Yields - Asia
Chart II-4Other Developed
Indicators To Watch - Bond Yields - Other Developed
Indicators To Watch - Bond Yields - Other Developed
Interest Rate Chart II-5Expectations
Indicators To Watch - Interest Rate Expectations
Indicators To Watch - Interest Rate Expectations
Chart II-6Expectations
Indicators To Watch - Interest Rate Expectations
Indicators To Watch - Interest Rate Expectations
Chart II-7Expectations
Indicators To Watch - Interest Rate Expectations
Indicators To Watch - Interest Rate Expectations
Chart II-8Expectations
Indicators To Watch - Interest Rate Expectations
Indicators To Watch - Interest Rate Expectations
Highlights The report from last week’s National People’s Congress (NPC) indicates a gradual pullback in policy support this year. Fiscal thrust will be neutral in 2021, whereas the rate of credit expansion will be slightly lower compared with last year. China’s economy should run on its own momentum in the first half, before slowing to a benign and managed rate. Nonetheless, the risk of policy overtightening is nontrivial and could threaten the cyclical outlook on China’s economy and corporate profits. The recent price correction in Chinese stocks has not yet run its course. Moreover, equity prices in both onshore and offshore markets are breaching their technical resistance. We are downgrading our tactical (0 to 3 months) and cyclical (6 to 12 months) positions on Chinese stocks to underweight relative to global benchmarks. Feature China’s budget and key economic initiatives unveiled at last week’s NPC indicate that policy tightening will be gradual this year. Overall, maintaining stability, both socially and economically, remains the focal point of Premier Li Keqiang’s work plan presented at the NPC’s annual plenary session in Beijing. However, investors have centered on the government’s plan to have a smaller policy push on growth in its budget compared with last year, fearing that economic and corporate profit rebound will disappoint. The Shanghai Composite Index dropped by 6% during the week when the NPC took place. In our view, the risks of a policy over-tightening in the next six months are high. As such, with this report we are downgrading our cyclical call on Chinese stocks to underweight within a global equity portfolio. Reading Policy Tea Leaves China's growth trajectory since the middle of 2020 has given the government comfort in staying the course on policy normalization. The question is how much Chinese policymakers are willing to pull back support for the economy this year. Overall, the central government plans a smaller policy push in this year's budget and intends to let the economy run on its own steam. Further policy reflation is not in the cards unless a relapse in the economy threatens job creation. The NPC outlined a growth target “above 6%” for 2021 and did not set a numerical goal for the 14th Five-Year Plan from 2021 to 2025. However, de-emphasizing growth does not mean China has abandoned its GDP targets (Table 1). Indeed, in most years in the past two decades, China’s expansion in GDP has overshot objectives set at the NPC (Chart 1). Our baseline estimate is that real GDP will increase by 8% in 2021. Table 12021 Economic And Policy Targets
National People’s Congress Sets Tone For 2021 Growth
National People’s Congress Sets Tone For 2021 Growth
Chart 1Actual Econ Growth Rates Have Overshot Targets In Most Years
Actual Econ Growth Rates Have Overshot Targets In Most Years
Actual Econ Growth Rates Have Overshot Targets In Most Years
We also maintain our view that the rate of credit expansion will be reduced by 2 to 3 percentage points this year to about 11% annually, which is in line with nominal GDP growth (Chart 2). On the fiscal front, the target for a budget deficit was cut by less than half percentage point compared with last year. When taking into account both the government’s budgetary and fund expenditures, the broad-measure fiscal deficit will probably be around 8% of GDP (about the same as last year), which implies there will not be any fresh fiscal thrust in 2021 (Chart 3) Chart 2Credit Growth Will Decelerate From Last Year
Credit Growth Will Decelerate From Last Year
Credit Growth Will Decelerate From Last Year
Chart 3Neutral Fiscal Thrust
Neutral Fiscal Thrust
Neutral Fiscal Thrust
The pullback in fiscal impulse is larger than in 2010, 2014, and 2017, following the previous three fiscal expansionary cycles. However, the government's eased budget deficit target this year does not mean government expenditure growth will slow. Government revenues climbed sharply by the end of 2020 and will continue to improve this year (Chart 4). Higher revenues will allow more government spending while keeping the fiscal deficit within its objectives. Chart 4Gov Revenue Is On The mend But Spending Has Yet To Pick Up
Gov Revenue Is On The mend But Spending Has Yet To Pick Up
Gov Revenue Is On The mend But Spending Has Yet To Pick Up
Chart 5A Small Reduction In ##br##LG Bond Quota
National People’s Congress Sets Tone For 2021 Growth
National People’s Congress Sets Tone For 2021 Growth
Furthermore, the quota for local government special purpose bonds was reduced by only 2% from last year. It should help to support a steady growth in China’s infrastructure investment (Chart 5). The data from January and February total social financing shows a noticeable improvement in corporate demand for bank loans, as well as the composition of bank loans. Corporate demand for medium- and long-term loans remains on a strong uptrend, which reflects an ongoing recovery in corporate profits and supports an optimistic view on capital investment in the months ahead (Chart 6). Chart 6More Demand For Longer-Term Loans Reflects Better Investment Propensity
More Demand For Longer-Term Loans Reflects Better Investment Propensity
More Demand For Longer-Term Loans Reflects Better Investment Propensity
Bottom Line: The growth and budget targets set at this year’s NPC suggest only a modest pullback in policy support. Downside Risks To The Economy Chart 7Econ Growth Usually Peaks Six To Nine Months After Credit Expansion Rate Slows
Econ Growth Usually Peaks Six To Nine Months After Credit Expansion Rate Slows
Econ Growth Usually Peaks Six To Nine Months After Credit Expansion Rate Slows
Despite a relatively dovish tone from the NPC, investors should not be complacent about the risk of a policy-tightening overshoot, which could lead to disappointing economic and profit growth this year. In most of the previous policy tightening cycles, China’s economic activities remained resilient in the first 6 to 9 months (Chart 7). One exception was 2014, when nominal GDP growth dropped sharply as soon as credit growth slowed. The reason is that Chinese authorities kept a very disciplined fiscal stance and aggressively tightened monetary policy, while allowing the RMB to soft peg to a rising USD. In other words, macroeconomic policies were too restrictive during the 2013/14 cycle. Although messages from the NPC do not suggest that Chinese authorities are on such an aggressive tightening path this year, investors should watch the following signs that could threaten China's cyclical economic health: Policymakers may keep monetary conditions too tight, by allowing the RMB to rise too fast while lifting bank lending and policy rates. Currently rates are maintained at historically low levels, much lower than in previous policy tightening cycles (Chart 8). However, the trade-weighted RMB has appreciated by 6% since its trough in July last year and has returned to its pre US-China trade war level (Chart 9). The Chairman of China’s Banking and Insurance Regulatory Commission recently signaled that bank lending rates would climb. Although we do not expect the rate to return to its 2014 or 2017 level, China is much more indebted than in previous cycles. Even a small bump in interest rates will place a burden on corporates and local governments’ debt servicing cost, dampening their propensity to invest (Chart 10). Chart 8Aggressive Rate Hikes Are ##br##Unlikely This Year
Aggressive Rate Hikes Are Unlikely This Year
Aggressive Rate Hikes Are Unlikely This Year
Chart 9Rising RMB Should Refrain Chinese Policymakers From Further Tightening Monetary Stance
Rising RMB Should Refrain Chinese Policymakers From Further Tightening Monetary Stance
Rising RMB Should Refrain Chinese Policymakers From Further Tightening Monetary Stance
Chart 10Chinese Private Sector Has Become Much More Sensitive To Rising Interest Rates
Chinese Private Sector Has Become Much More Sensitive To Rising Interest Rates
Chinese Private Sector Has Become Much More Sensitive To Rising Interest Rates
Chart 11Bank Lending To Property Sector Has Become Increasingly Restrictive
Bank Lending To Property Sector Has Become Increasingly Restrictive
Bank Lending To Property Sector Has Become Increasingly Restrictive
Policies could become too restrictive in key old-economy industries. Chinese authorities have reiterated their determination to contain price bubbles in the property sector. For the first time since 2017, bank lending to real estate developers grew at a pace far below overall bank loans and continued to trend downward in February this year (Chart 11). Moreover, household mortgage loans have reached their slowest expansion rate since 2013. At 22% of China’s total bank lending, a sharp setback in the property sector’s loan growth will be a significant drag on total credit and the economy. A worsened imbalance in supply and demand could lead to too much buildup in industrial inventory. Manufacturing inventories recovered sharply following last year’s massive stimulus and many sectors have surpassed their pre-pandemic levels (Chart 12). Strong external demand helped to boost China’s production and propensity to restock on raw materials. However, both China’s core CPI and producer prices for consumer goods remain in the doldrums, which indicates that domestic final demand has yet to fully recover (Chart 13). As discussed in last week’s report, reopening the world economy in 2H21 should benefit the service sector more than tradeable goods. China’s inventory buildup, particularly in the upstream industries, could turn excessive when export growth slows and domestic demand fails to pick up the slack. Chart 12How Far Can Chinas Inventory Restocking Cycle Go?
How Far Can Chinas Inventory Restocking Cycle Go?
How Far Can Chinas Inventory Restocking Cycle Go?
Chart 13Final Demand Remains ##br##Weak
Final Demand Remains Weak
Final Demand Remains Weak
The service sector could take longer than expected to recuperate, even though China’s domestic COVID-19 situation is under control. China’s services sector has flourished in recent years and accounted for 54% of the nation’s pre-pandemic economic output. However, about half of the service sector output is tied to real estate and financial services. Increasing pressures from tighter policy regulations targeting both the property and online financial service sectors could dampen their support to the economy more than policymakers anticipated. At the same time, wage and household income growth could remain tame by China’s standards (Chart 14). The NPC’s targeted 7% annual increase in spending for national research and development – far below the 12% annual average reached during the past five years – will not be enough to offset the slowdowns in real estate and financial services (Chart 15). Chart 14Household Income Growth Has Yet To Recover
Household Income Growth Has Yet To Recover
Household Income Growth Has Yet To Recover
Chart 15Chinas Pace Of R&D Investment Has Slowed Along With Econ Growth
Chinas Pace Of R&D Investment Has Slowed Along With Econ Growth
Chinas Pace Of R&D Investment Has Slowed Along With Econ Growth
Bottom Line: The downside risks to China’s cyclical growth trajectory are nontrivial. A tug-of-war between policy tightening and growth support will likely persist throughout this year. Investment Implications We recommend investors to underweight Chinese stocks within a global equity portfolio, in the next 0 to 9 months (Chart 16A and 16B). Chart 16AChinese Stocks Are At Their Technical Resistance
Chinese Stocks Are At Their Technical Resistance
Chinese Stocks Are At Their Technical Resistance
Chart 16BChinese Stocks Are At Their Technical Resistance
Chinese Stocks Are At Their Technical Resistance
Chinese Stocks Are At Their Technical Resistance
On January 13, we tactically downgraded Chinese stocks from overweight to neutral, anticipating that China’s equity markets are sensitive to rising expectations of policy tightening, due to higher corporate debt-servicing costs and lofty valuations. Chinese stock prices peaked in mid-February, but in our view the correction has not yet run its course. In terms of the economy, we maintain our baseline view that China's overall policy environment this year will be more accommodative than in 2017/18. The growth momentum carried over from last year's stimulus should prevent China's economy and corporate profits from slumping by too much this year. However, as policy supports are scaled back, investors will increasingly focus on the intensity of China’s domestic policy tightening and the uncertainties surrounding it. Downside risks are nontrivial and will continue to weigh on investors' sentiment. For investors that are mainly exposed to the Chinese domestic equity market, the near-term setbacks in the A-share market are taking some air out of Chinese equities' frothy valuations, and may pave the way for a more optimistic cyclical outlook beyond the next 9 to 12 months. We recommend domestic investors to stay on the sidelines for now, but will start recommending sector rotations in the next few months when opportunities arise. Jing Sima China Strategist jings@bcaresearch.com Cyclical Investment Stance Equity Sector Recommendations
Highlights Duration: The Fed will revise up its interest rate forecasts at this week’s meeting, but the new forecasts will remain dovish compared to current market pricing. This could pressure bond yields down in the near-term. However, any downside in yields could prove temporary given that economic growth continues to beat expectations. Corporates: The macro environment of strong economic growth and accommodative monetary policy will persist for some time yet. In this environment, bond portfolio managers should minimize exposure to interest rate risk and maximize exposure to credit risk. In particular, a strategy of favoring high-yield corporate bonds over investment grade corporate bonds makes a lot of sense. Inflation & TIPS: Core inflation will be relatively strong during the remainder of 2021, with 12-month core PCE likely ending the year close to the Fed’s 2% target. Investors should remain overweight TIPS versus nominal Treasuries and continue to hold inflation curve flatteners and real yield curve steepeners. Expect Some Pushback From The Fed The continuing bond market selloff will be the top item on the agenda at this week’s FOMC meeting. Meeting participants will debate whether the sharp rise in long-maturity bond yields represents a threat to the economic recovery and Chair Powell will no doubt be peppered with questions on the topic at his post-meeting press conference, as he was when he sat down with a Wall Street Journal reporter two weeks ago.1 But for our part, we’ll be focused more on the front-end of the yield curve this week. Specifically, we’ll be looking to see whether the Fed revises up its funds rate forecasts by enough to justify current market pricing or whether it uses its forecasts to push back against the bond bears. The market’s fed funds rate expectations have moved a lot since the Fed last published its own forecasts in December (Chart 1on page 1). In December, the market was priced for fed funds liftoff in December 2023 and then only one more 25 basis point rate hike through the end of 2024. Now, the market is looking for liftoff in January 2023, followed by two more rate hikes before the end of that year. Chart 1Market Priced For 3 Rate Hikes Before The End Of 2023
Market Priced For 3 Rate Hikes Before The End Of 2023
Market Priced For 3 Rate Hikes Before The End Of 2023
As for the Fed, at last December’s meeting only 5 out of 17 FOMC participants anticipated raising rates before the end of 2023. It’s logical to expect the Fed to increase its rate expectations this week as the economic outlook is much brighter than it was at the time of the December FOMC meeting. Back in December, we still didn’t know whether the Democrats would win control of the Senate, enabling passage of President Biden’s $1.9 trillion stimulus bill. Doubts also remained about how quickly COVID vaccination would occur. Chart 2The Data Can't Disappoint
The Data Can't Disappoint
The Data Can't Disappoint
The Fed will probably respond to these pro-growth developments by revising up its interest rate expectations, but we doubt that these revisions will bridge all of the gap with the market. Employment and inflation both remain far from where the Fed would like them to be, and the Fed will want to send the message that its policy stance remains highly accommodative. We could see the Fed’s median fed funds rate forecast shifting to call for one rate hike by the end of 2023, but not the three currently priced into the yield curve. In this scenario, the Fed’s pushback could prompt some near-term downside in bond yields. The question is how long the Fed’s messaging will impact the market in the current environment of surging economic growth. The Economic Surprise Index shows that the economic data can’t even manage to disappoint expectations, a development that usually coincides with rising yields (Chart 2). Bottom Line: The Fed will revise up its interest rate forecasts at this week’s meeting, but the new forecasts will remain dovish compared to current market pricing. This could pressure bond yields down in the near-term. However, any downside in yields could prove temporary given that economic growth continues to surpass expectations. We maintain below-benchmark portfolio duration and we will continue to use our Checklist (see last week’s report)2 to determine an appropriate time to increase duration. The Spread Buffer In Corporate Credit Treasury yields troughed last August, and since then returns have been hard to come by in the US bond market. This is not too surprising. Fixed income is hardly the ideal asset class for a reflationary economic environment. However, there are steps a bond portfolio manager can take to maximize profits in an economic environment that is characterized by (i) rapid economic growth, (ii) rising inflation expectations and (iii) monetary policy that remains accommodative. Specifically, bond investors should minimize their exposure to interest rate risk (i.e. duration) and maximize exposure to credit risk. That is, shy away from long duration assets with little-to-no credit spread and favor shorter duration assets where the credit spread makes up a large proportion of the yield. This sort of strategy has worked well since the August trough in Treasury yields. The Investment Grade Corporate Bond Index – an index with relatively long duration and a small credit spread – is down 4.08% since August 4th (Chart 3). Notably the worst returns have come from the highest rated credit tiers where the credit spread makes up a smaller proportion of the yield. Notice that Aaa-rated Corporates have lost 9% while Baa-rated bonds are only down 2.52% (Table 1). In contrast, total returns from the High-Yield Index – an index with lower duration where the credit spread makes up a much larger proportion of the yield – have held up nicely. The overall index has returned 6.65% since August 4th with the lowest credit tiers once again performing best. Chart 3Move Down In ##br##Quality
Move Down In Quality
Move Down In Quality
Table 1Corporate Bond Returns Since The Aug. 4 2020 Trough In Treasury Yields
Limit Rate Risk, Load Up On Credit
Limit Rate Risk, Load Up On Credit
Performance for both the Investment Grade and High-Yield indexes improves if we look at excess returns relative to a duration-matched position in Treasury securities. That is, if we hedge out the interest rate risk and focus purely on spread movements. Though even here, we find that the lowest rated credits with the widest spreads deliver the best returns. If we assume that this reflationary economic environment persists for the next 12 months, can we expect the same low rate risk/high credit risk strategy to succeed? One way to investigate this question is to look at the 12-month breakeven yields and spreads for different segments of the corporate bond market (Table 2). The 12-month breakeven yield is the yield increase that the index can tolerate over the next 12 months before it delivers negative total returns. Similarly, the 12-month breakeven spread is the spread widening that an index can tolerate over the next 12 months before it delivers negative excess returns (where excess returns are measured versus a duration-matched position in Treasury securities). Table 2Corporate Bond 12-Month Breakeven Yields And Spreads
Limit Rate Risk, Load Up On Credit
Limit Rate Risk, Load Up On Credit
The overall Investment Grade Corporate Index, for example, has an average maturity of 12 years and a 12-month breakeven yield of 27 bps. This means that, if we assume that the investment grade corporate bond spread holds steady, then the odds of the index delivering negative total returns over the next 12 months are the same as the odds of a 12-year Treasury yield rising by more than 27 bps. An assumption of flat investment grade corporate bond spreads seems reasonable given that spreads are already historically tight (Chart 4). Moving down in quality within investment grade helps a bit, the Baa credit tier has a 12-month breakeven yield of 30 bps compared to a 12-month breakeven yield of 21 bps for the Aa credit tier. A similar benefit is observed if we look at the 12-month breakeven spread: 14 bps for Baa and only 6 bps for Aa. However, the real improvement comes when we move out of investment grade entirely and into high-yield. To calculate fair breakeven yields and spreads for high-yield bonds we need to incorporate default loss expectations. The current macro environment of strong growth and accommodative monetary policy should lead to relatively low default losses. That being the case, we assume a base case of a 2.5% default rate and 40% recovery rate for the next 12 months. Using this assumption, we calculate a 12-month breakeven yield of 75 bps for the High-Yield Index and a 12-month breakeven spread of 46 bps. This represents a significant extra buffer compared to what is offered by even the lowest investment grade credit tier. Not only that, but the 75 bps 12-month breakeven yield from the High-Yield Index looks even better when we consider that high-yield spreads are not as overvalued relative to history as investment grade spreads, and have more room to tighten as the economic recovery progresses (Chart 5). Chart 4Investment Grade Valuation
Investment Grade Valuation
Investment Grade Valuation
Chart 5High-Yield Valuation
High-Yield Valuation
High-Yield Valuation
Table 2 also presents two other default loss scenarios, and it shows that we need fairly pessimistic default loss expectations to make high-yield breakeven yields and spreads comparable to what is offered by investment grade bonds. Even if we assume a 4.5% default rate and 30% recovery rate for the next 12 months, we still get a 32 bps breakeven yield from the High-Yield Index, comparable to what we get from the Baa credit tier. Bottom Line: The macro environment of strong economic growth and accommodative monetary policy will persist for some time yet. In this environment, bond portfolio managers should minimize exposure to interest rate risk and maximize exposure to credit risk. In particular, a strategy of favoring high-yield corporate bonds over investment grade corporate bonds makes a lot of sense. Inflation & The Inverted TIPS Curve Chart 6Inflation Will Peak In April
Inflation Will Peak In April
Inflation Will Peak In April
February’s Consumer Price Index was released last week, and it showed that core CPI managed only a 0.1% increase on the month. This caught some off guard given that “rising inflation” has become a popular market narrative during the past few months. Our view is that core inflation will rise significantly between now and the end of the year, and that 12-month core PCE inflation will end the year close to the Fed’s 2% target. We arrive at this view for three reasons. First, base effects will lead to a large jump in 12-month inflation measures in March and April. Chart 6 illustrates the paths for both 12-month core PCE and core CPI assuming modest 0.15% monthly gains between now and the end of the year. Because the severely negative inflation prints from last March and April are about to fall out of the rolling 12-month sample, 12-month core inflation is on the cusp of rising to levels considerably above the Fed’s target. This means that after 12-month inflation peaks in April, the question will be how much it declines during the remainder of the year. One reason why we think it might not fall that dramatically is that bottlenecks are already emerging in both the goods and services sectors, and prices will come under upward pressure as the economy re-opens and consumers are encouraged to deploy some of the excess savings they’ve built up during the pandemic. Producer prices are currently surging, as are survey responses about price pressures from the NFIB Small Business Survey and the ISM Manufacturing and Non-Manufacturing Surveys (Chart 7). Finally, shelter is the largest component of core inflation (accounting for almost 40% of core CPI). It would be difficult for overall core inflation to rise significantly without at least some participation from shelter. With that in mind, we now see evidence that shelter inflation will soon put in a trough (Chart 8). Chart 7Price Pressures Are Building
Price Pressures Are Building
Price Pressures Are Building
Chart 8Shelter Inflation About To Bottom
Shelter Inflation About To Bottom
Shelter Inflation About To Bottom
The permanent unemployment rate and Apartment Market Tightness Index are both tightly correlated with shelter inflation. The permanent unemployment rate has stopped climbing and will move lower during the next few months as increased vaccination rates allow for more of the economy to re-open (Chart 8, panel 2). The Apartment Market Tightness Index is also well off its lows, and it will soon jump above the 50 line, joining the Sales Volume Index (Chart 8, panel 3). Consumers are also increasingly seeing signs of rental inflation. A question from the New York Fed’s Survey of Consumer Expectations showed a very sharp increase in expected rents in February (Chart 8, bottom panel). Chart 9Stay Long TIPS
Stay Long TIPS
Stay Long TIPS
As for TIPS strategy, we are hesitant to back away from our overweight TIPS/underweight nominal Treasuries position with inflation on the cusp of a such a significant move higher, especially with the 5-year/5-year forward TIPS breakeven inflation rate still below where the Fed would like it to be (Chart 9). We are also not yet willing to exit the inflation curve flattening and real yield curve steepening positions that we have been recommending since last April, even though the 5/10 TIPS breakeven inflation slope has become inverted (Chart 9, bottom panel).3 With the Fed targeting an overshoot of its 2% inflation target, an inverted inflation curve is more natural than a positively sloped one. This is because the Fed will be trying to hit its inflation target from above, rather than from below. Further, the short-end of the inflation curve is more sensitive to the actual inflation data than the long-end. This means that the curve could flatten even more as inflation rises in the coming months. Bottom Line: Core inflation will be relatively strong during the remainder of 2021, with 12-month core PCE likely ending the year close to the Fed’s 2% target. Investors should remain overweight TIPS versus nominal Treasuries and continue to hold inflation curve flatteners and real yield curve steepeners. Ryan Swift US Bond Strategist rswift@bcaresearch.com Footnotes 1 For more details on the implications of what Powell said in this interview please see US Bond Strategy Weekly Report, “No Panic From Powell”, dated March 9, 2021, available at usbs.bcaresearch.com 2 Please see US Bond Strategy Weekly Report, “No Panic From Powell”, dated March 9, 2021, available at usbs.bcaresearch.com 3 Please see US Bond Strategy Weekly Report, “Negative Oil, The Zero Lower Bound And The Fisher Equation”, dated April 28, 2020, available at usbs.bcaresearch.com Fixed Income Sector Performance Recommended Portfolio Specification
Highlights Global Duration: Markets are correctly interpreting the $1.9 trillion US fiscal stimulus package as a factor justifying higher global growth expectations and bond yields. Maintain a below-benchmark stance on overall global duration. Yield Betas & Country Allocation: Within government bond portfolios, overweighting the “lower-beta” countries that have bond yields less sensitive to changes in US yields (Germany, France, Japan) versus the higher-beta markets (Canada, Australia, UK) remains the appropriate strategy during the current bond bear market. Underweights should remain concentrated in the US, though, as it is highly unlikely that any central bank will begin to tighten policy before the Fed. UK Follow-Up: The conclusions from our UK Special Report published last week do not change after adjusting for the difference in the inflation indices used to calculate UK inflation-linked bond yields compared to those of other countries. UK real interest rates are the lowest in the developed economies, while inflation breakevens are the highest. NOTE: There will be no Global Fixed Income Strategy report published next week. Instead, BCA Chief Global Fixed Income Strategist Rob Robis will do a webcast discussing his latest thoughts on global bond markets. Yields Rising Around The World Chart of the WeekPolicy Mix Is Bond-Bearish
Policy Mix Is Bond-Bearish
Policy Mix Is Bond-Bearish
The path of least resistance for global bond yields remains biased upward. Optimism on future economic growth remains ebullient with consumer and business confidence indices surging in much of the developed world. The epicenter of the global bond bear market remains the US, where pandemic related economic restrictions are being unwound with 21.4% of the US population now having received at least one dose of a vaccine. Fiscal policy in the US is also supporting the positive vibes on future growth after the $1.9 trillion stimulus package was signed into law by President Biden last week. The 10-year US Treasury yield climbed back to the 2021 high of 1.63% on the back of that announcement. The US stimulus package changes the trajectory of the 2021 US fiscal impulse from a $0.8 trillion contraction to a $0.3 trillion expansion, according to estimates from the US Committee for a Responsible Federal Budget (Chart of the Week). This, combined with ongoing quantitative easing from global central banks eager to keep bond yields as low as possible until inflation expectations sustainably return to policymaker targets, is providing a bond-bearish lift to both inflation expectations and real yields – most notably in the US. Central bankers can try to fight back against the speed of the increase in bond yields by maintaining their commitment to current policy settings, as the European Central Bank (ECB) and Bank of Canada (BoC) did last week. The Fed, Bank of England (BoE) and Bank of Japan (BoJ) will all get the chance to do the same this at this week’s policy meetings. The likely message from all will be one of staying the course and not reflexively responding to higher bond yields, which have not triggered a broad-based selloff in global risk assets that would pre-emptively tighten financial conditions. The S&P 500 index hit an all-time high last week, while equity markets in Europe and Japan have returned to pre-pandemic levels (Chart 2). Global corporate credit spreads have remained calm, consistent with a positive growth backdrop that diminishes the potential for credit downgrades and defaults. The US dollar has gotten a lift from improving US growth expectations and relatively higher US Treasury yields, which has had some negative spillover effect into emerging market equities and currencies. The dollar rebound has been relatively modest to date, however, with the DXY index up only 3% from the early 2021 lows. A major reason why global equity and credit markets have absorbed higher bond yields so well is because the sheer scope of the new US fiscal stimulus will have a major impact on growth momentum both in the US and outside the US. This comes on top of the boost to optimism from the speed of the US and UK vaccine rollouts. In an update to its December 2020 economic outlook published last week, the OECD estimated that the $1.9 trillion US stimulus will boost US real GDP growth by 3.8 percentage points versus its original forecast over the next year (Chart 3). Other countries will also benefit from the implied surge in US demand spilling over from that stimulus package, with the OECD projecting a 1.1 percentage point increase to world real GDP growth. Chart 2Risk Assets Ignoring Rising Global Bond Yields
Risk Assets Ignoring Rising Global Bond Yields
Risk Assets Ignoring Rising Global Bond Yields
Chart 3Big Growth Spillovers From US Fiscal Stimulus
Harder, Better, Faster, Stronger
Harder, Better, Faster, Stronger
Countries that have the greater exposure to US demand, like Canada and Mexico, are expected to benefit a bit more than the rest of the world, but the expected boost to growth is consistent (around one half of a percentage point) from China to Europe to Japan to major emerging market countries like Brazil. That US-fueled pickup in global economic activity will help absorb some of the spare capacity that opened up during the COVID-19 pandemic. In Chart 4 and Chart 5, we show the estimates taken from the December 2020 OECD Economic Outlook for the output gaps in the US, euro area, UK, Japan, Canada and Australia for 2021 and 2022. We adjust those projections by the OECD’s estimate of the impact of the US fiscal stimulus in 2021, as well as by the additional upward revisions to the OECD growth projections in 2021 and 2022 that were published last week. Chart 4The $1.9 Trillion Stimulus Will Close The US Output Gap …
Harder, Better, Faster, Stronger
Harder, Better, Faster, Stronger
Chart 5… And Help Narrow Output Gaps Elsewhere
Harder, Better, Faster, Stronger
Harder, Better, Faster, Stronger
Chart 6Maintain Below-Benchmark Duration
Maintain Below-Benchmark Duration
Maintain Below-Benchmark Duration
The conclusion is that the US output gap will be eliminated in 2022, while output gaps will still be negative, but diminished, in the other countries after factoring in the impact of the latest US fiscal package. This suggests that the maximum upward pressure on global bond yields should still be centered in the US, where inflation pressures will be more evident and the Fed will likely begin signaling a shift to a less dovish stance sooner than other central banks (although not likely until much later in 2021). Our Global Duration Indicator continues to flag pressure for higher bond yields ahead for the major developed economies (Chart 6). The improving growth momentum means that rising real yields should increasingly become the more important driver of higher nominal bond yields. Persistent central bank dovishness in the face of that growth surge, however, means that it is still too soon to position for narrowing global inflation expectations or any bearish flattening of government bond yield curves - even in the US. Bottom Line: Markets are correctly interpreting the $1.9 trillion US fiscal stimulus package as a factor justifying higher global growth expectations and bond yields. Maintain a below-benchmark stance on overall global duration. Using Yield Betas For Bond Country Allocation, One More Time Over the past two months, we have published Special Reports that delved into the outlook for bond yields and currencies in Australia, Canada and the UK. We selected those three countries as they represented the most likely downgrade candidates within our recommended government bond country allocation given their status as “higher beta” bond markets that are more correlated to US Treasury yields. We estimate US Treasury yield betas from a rolling regression (over a three-year window) of changes in 10-year non-US government bond yields to changes in 10-year US Treasury yields (Chart 7). This allows us to assess which markets are more or less sensitive to the ups and downs of US bond yields. We have used this framework to help guide our country allocation strategy during the pandemic and, for the most part, it has been successful. Chart 7Government Bond Yield Sensitivities To USTs Are Shifting Fast
Government Bond Yield Sensitivities To USTs Are Shifting Fast
Government Bond Yield Sensitivities To USTs Are Shifting Fast
So far in 2021, the markets with higher US Treasury yield betas (Canada, Australia and New Zealand) have underperformed the lower beta markets (Germany, France and Japan). We show that in the top panel of Chart 8, which plots the yield betas at the start of the year versus the year-to-date relative return of each country’s government bond market to that of the overall Bloomberg Barclays Global Treasury index. The returns are adjusted to reflect any differences in the durations of each country versus that of the overall index, and are shown in USD-hedged terms to allow for a common currency comparison. The bottom panel of Chart 8 shows the same relationship for the all of 2020. This is a mirror image of what has occurred so far in 2021, with the countries with higher yield betas outperforming the lower beta markets. The obvious difference between the two years is the direction of Treasury yields, which fell in 2020 and have been rising this year. So far in 2020, the differences between the returns of the higher beta markets have been quite similar. New Zealand has had the biggest negative performance (-2.8% versus the global benchmark), but this has only been moderately worse than Australia (-2.6%) and Canada (-2.4%). These are all just slightly worse than the return of US Treasuries relative to the Global Treasury index (-2.3%). Our estimated yield betas have changed rapidly over the past few months. For example, the rolling three-year yield beta of Australia has shot up from 0.61 at the beginning of the year to 0.78, while Canada has seen a similar move (0.81 to 0.88). This reflects the rapid repricing of interest rate expectations in both countries as current growth momentum and growth expectations improve. While not a perfect relationship, yield betas do show some correlation to our Central Bank Monitors – designed to measure the pressure on central banks to tighten of ease monetary policy (Chart 9). The latest increases in the yield betas of Australia, New Zealand and Canada have occurred alongside a rising trend in our Central Bank Monitors for each nation. The implication is that the relative underperformance of government bonds in those countries is related to the cyclical pressure for the RBA, RBNZ and BoC to tighten monetary policy. Chart 8An Intuitive Link Between Yield Betas & Bond Market Performance
Harder, Better, Faster, Stronger
Harder, Better, Faster, Stronger
Chart 9Cyclical Pressures & Yield Betas Are Linked
Cyclical Pressures & Yield Betas Are Linked
Cyclical Pressures & Yield Betas Are Linked
At the same time, the yield betas of government bonds in Germany and the UK have remained low despite the cyclical upturn in our ECB and BoE Monitors. The lingering impact of COVID-19 lockdowns on economic growth and inflation in the euro area and UK is likely weighing on bond yields in both regions. This limits any challenge to the dovish forward guidance of the ECB and BoE, in contrast to the repricing of interest rate expectations seen in other countries. The market-implied path of policy interest rates extracted from OIS forward curves does show a much more aggressive expected path of policy rates in the higher beta markets versus the lower beta markets (Chart 10). Chart 10More Rate Hikes Expected In The Higher Yield Beta Countries
Harder, Better, Faster, Stronger
Harder, Better, Faster, Stronger
The “liftoff” date for each central bank shown, representing when the first full interest rate hike is priced into the OIS forwards, is shown in Table 1. We rank the countries in the table by the amount of time until the discounted liftoff date, from shortest to longest. The first rate hike is expected in New Zealand in June 2022, with the BoC expected to lift rates in Canada two months later. The market is not pricing a full rate hike by the Fed until January 2023, while liftoff in the UK and Australia are expected during the summer of 2023. Table 1The "Pecking Order" Of Global Liftoff
Harder, Better, Faster, Stronger
Harder, Better, Faster, Stronger
We treat the countries with perpetually low interest rates, the euro area and Japan, differently in Table 1, as both the ECB and BoJ would most likely move slowly if and when they ever decided to raise rates again. Thus, we define liftoff as only a 10bp increase in policy interest rates for those two regions, while for all the other central banks we assume the size of the first rate hike will be 25bps. On that reduced basis, the market is priced for “liftoff” by the ECB and BoJ in September 2023 and February 2025, respectively. In terms of that “order of liftoff” shown in Table 1, we generally agree with current market pricing except for New Zealand and Canada. We fully expect the Fed to be the first central bank to begin signaling the path towards monetary policy normalization, largely due to the impact of the fiscal stimulus, starting with a move to begin tapering the Fed’s asset purchases at the start of 2022. The Fed will also be the first to begin rate hikes after tapering. We do not anticipate the BoC or Reserve Bank of New Zealand (RBNZ) to make any hawkish moves (reduced asset purchases or rate hikes) before the Fed does the same, as this would put unwanted appreciation pressures on the New Zealand and Canadian dollars. We expect the BoC and RBNZ to move soon after the Fed begins to shift, followed by the BoE and RBA a bit later after that in line with the current liftoff ordering. The pace of rate hikes after liftoff also appears to be a bit too aggressively priced in the countries with higher yield betas. The cumulative amount of interest rate increases to the end of 2024 currently priced in OIS curves is larger in Canada (175bps) and Australia (156bps) than the US (139bps) and New Zealand (140bps). The relative differences are not huge, however, but we think the odds favor the Fed delivering the greater amount of rate hikes over the next three years. More generally, when looking at what is more important for each central bank in determining the timing of liftoff, we can boil it down to a couple of the most important measures for the higher beta countries (Chart 11): US: The Fed will continue to focus on both inflation expectations and broad measures of labor market utilization before signaling any policy shift. On that basis, there is still some way to go before TIPS breakevens return to the 2.3-2.5% level we believe to be consistent with the Fed sustainably hitting its 2% inflation goal on the PCE deflator. Also, there is still a lot of ground to cover before the US labor market fully returns to pre-pandemic health, as the employment/population ratio is four percentage points below the pre-COVID peak. New Zealand: The RBNZ is now under a lot more pressure to tighten policy after the New Zealand government changed the central bank’s remit to include stabilizing house prices, which have soured to unaffordable levels that have exacerbated income inequality. With house prices now rising at a 19% annual rate, the highest since 2004, the RBNZ will be under pressure to hike sooner, although any associated rise in the New Zealand dollar will likely be of equal concern. Canada: The BoC has been very candid that its current policy mix of aggressive asset purchases and 0% policy rates will be altered if the Canadian economy improves. We believe that the current trends of booming house price inflation, recovering business investment prospects and a rapidly recovering labor market will all make the BoC more willing to signal tighter monetary policy fairly soon after the Fed does the same. Australia: The RBA is likely to continue surprising bond markets with its dovishness in the face of a rapidly recovering economy, given underwhelming inflation. In a recent speech, RBA Governor Philip Lowe noted that Australian inflation will not return to the RBA’s 2-3% target band without wage growth rising from the current 1.4% pace up to 3%. The RBA does not expect the labor market to tighten enough to generate that kind of wage growth until at least 2024, suggesting no eagerness to begin normalizing monetary policy. Among the lower-beta markets, the most important things that will dictate future policy moves are the following (Chart 12): Chart 11What To Watch In The Higher Yield Beta Countries
What To Watch In The Higher Yield Beta Countries
What To Watch In The Higher Yield Beta Countries
Chart 12What To Watch In The Lower Yield Beta Countries
What To Watch In The Lower Yield Beta Countries
What To Watch In The Lower Yield Beta Countries
UK: The BoE’s current focus is on how fast the UK economy recovers from the pandemic shock, with inflation expectations remaining elevated (see the next section of this report). The degree of strength in business investment and consumer spending will thus dictate the timing of any BoE shift to a less accommodative policy stance. Euro Area: The latest set of ECB projections call for inflation to only reach 1.4% by 2023. As long as inflation (both realized and expected) stays well below the 2% ECB target, the central bank will focus more on supporting easy financial conditions (lower corporate bond yields, tighter Italy-Germany yield spreads and resisting euro currency strength). Japan: Inflation continues to underwhelm in Japan, and the BoJ is a long way from contemplating any tightening measures. Summing it all up, we still see value in using yield betas to dictate our recommended fixed income country allocations. Although these should be complemented with assessments of the relative likelihood of central banks moving before others to further refine country allocations. Bottom Line: Within government bond portfolios, overweighting the “lower-beta” countries that have bond yields less sensitive to changes in US yields (Germany, France, Japan) versus the higher-beta markets (Canada, Australia, UK) remains the appropriate strategy during the current bond bear market. Underweights should remain concentrated in the US, though, as it is highly unlikely that any central bank will begin to tighten policy before the Fed. A Brief Follow-Up To Our UK Special Report In our Special Report on the UK published last week, we noted that the UK had the lowest real bond yields and highest inflation expectations among the developed market countries with inflation-linked bonds.1 Some astute clients pointed out that we neglected to discuss how the UK inflation-linked bonds are priced off the UK Retail Price Index (RPI) which typically runs with a faster inflation rate than the UK Consumer Price Index (CPI). This creates a downward bias to UK real yields in comparison to other countries that use domestic CPI indices in inflation-linked bond pricing. We did not ignore the RPI-CPI differential in our report, we just did not think it to be relevant to the conclusions of our report. The UK still has the lowest real rates and highest inflation expectations even after adjusting both by the RPI-CPI gap (Chart 13). Furthermore, survey-based measures of UK inflation expectations are broadly in line with the RPI-based inflation breakevens, confirming the message from the RPI-based real yields and inflation expectations. Chart 13UK Real Yields Are Too Low, Using RPI Or CPI
UK Real Yields Are Too Low, Using RPI Or CPI
UK Real Yields Are Too Low, Using RPI Or CPI
Looking ahead, the RPI-CPI gap is likely to stay in a much narrower range compared to its longer run history. Chart 14A Less Active BoE Has Narrowed The RPI-CPI Gap
A Less Active BoE Has Narrowed The RPI-CPI Gap
A Less Active BoE Has Narrowed The RPI-CPI Gap
For example, between 2000 and 2007, the RPI-CPI gap averaged a full percentage point but with very large fluctuations (Chart 14). This is because mortgage interest costs are included in the RPI but are not part of the CPI. Thus, RPI inflation tends to be more volatile when the BoE is more active in adjusting interest rates. After the 2008 financial crisis, the BoE has kept policy rates at very low levels with very few changes. The RPI-CPI gap has narrowed as a result, averaging only one-half of a percentage point between 2009 to today. Thus, our conclusion on UK bond yields remains the same – Gilt yields are too low and are likely to rise further over the next 6-12 months. Robert Robis, CFA Chief Fixed Income Strategist rrobis@bcaresearch.com Footnotes 1 Please see BCA Research Global Fixed Income Strategy/Foreign Exchange Strategy Special Report, "Why Are UK Interest Rates Still So Low?",dated March 10, 2021, available at gfis.bcaresearch.com and fes.bcaresearch.com. Recommendations The GFIS Recommended Portfolio Vs. The Custom Benchmark Index
Harder, Better, Faster, Stronger
Harder, Better, Faster, Stronger
Duration Regional Allocation Spread Product Tactical Trades Yields & Returns Global Bond Yields Historical Returns
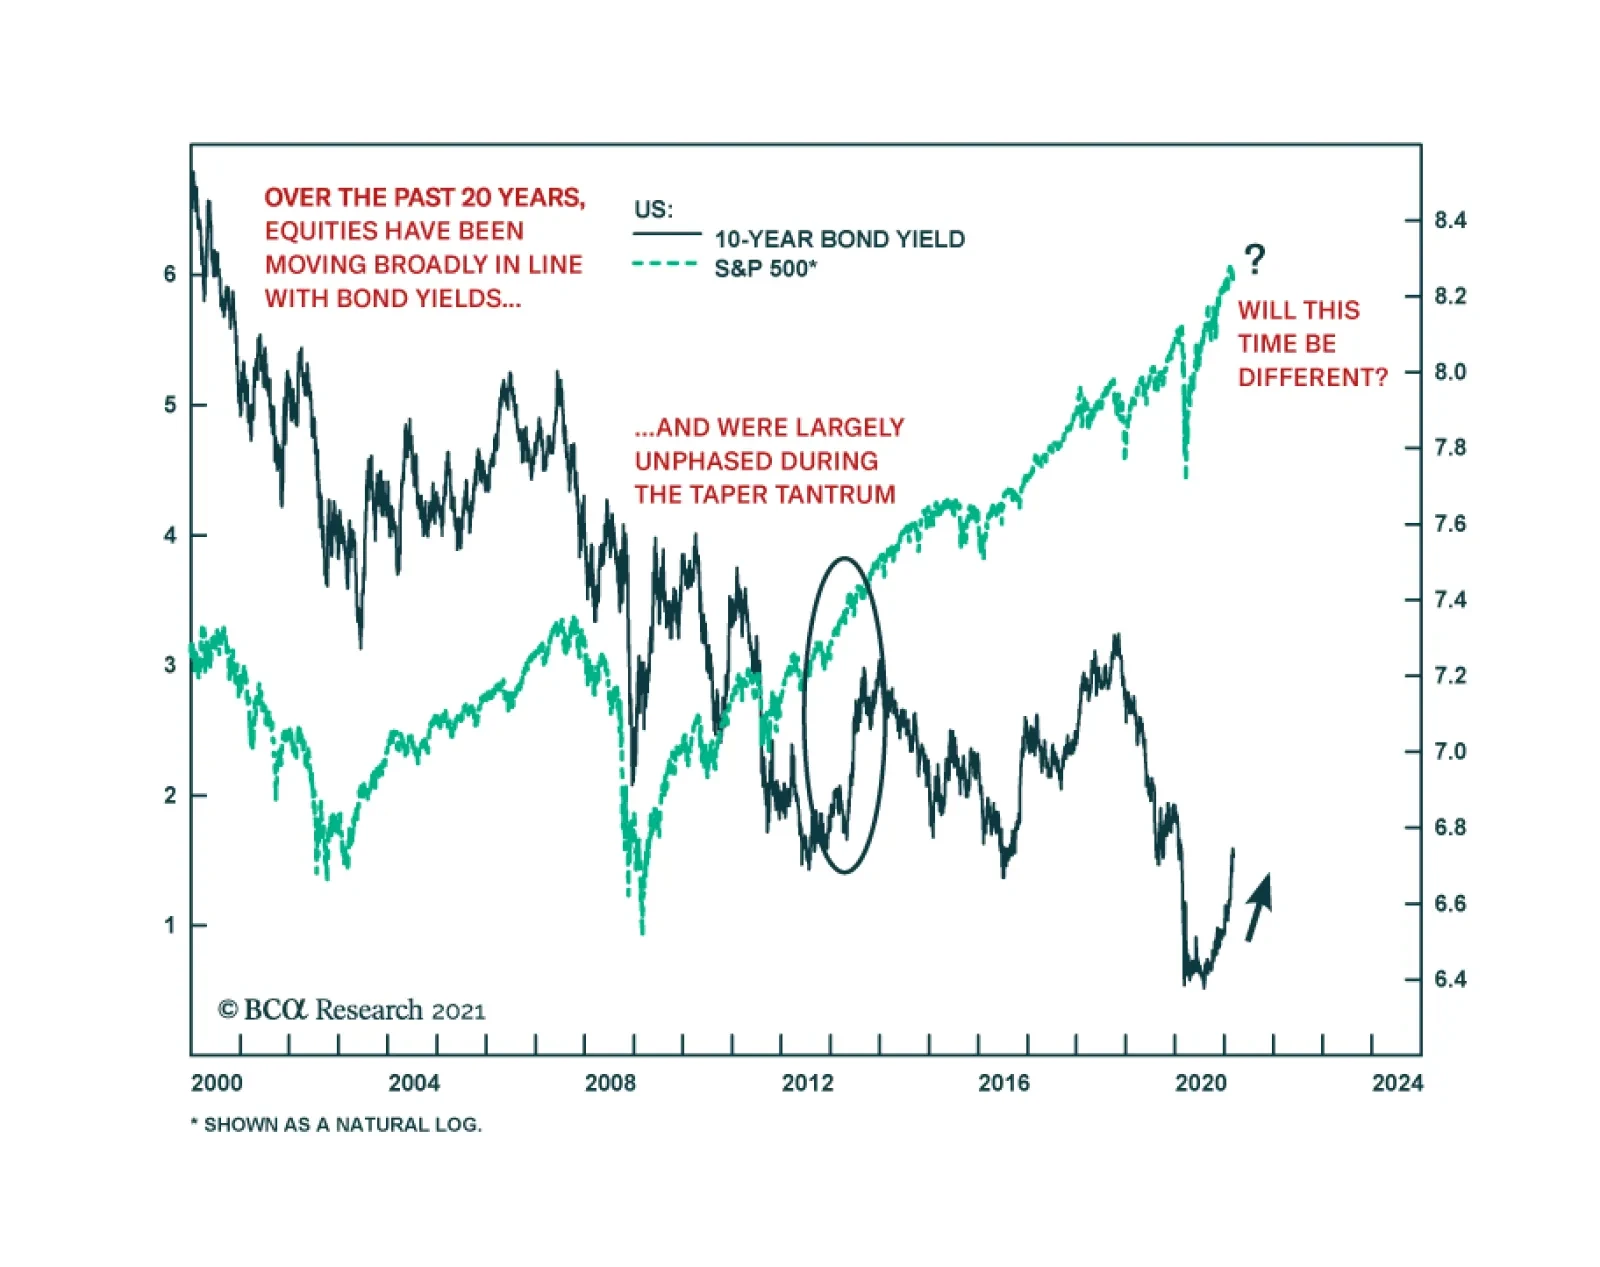
Global bond yields were up (again) on Friday, weighing down on growth stocks (again). Once more, the proximate cause of the bond selloff was good news. This time it was President Biden’s optimistic vaccine outlook. Much ink has been spilled on the impact…
Highlights With the vaccination campaign in full gear and plenty of fiscal support in the pipeline, investors have swung from worrying that the US economy will grow too slowly to worrying that it will grow too fast. Thanks to the latest stimulus bill, US households will have $2 trillion in excess savings at their disposal by April. This money will seep into the economy as lockdown measures end. There is still scope for US interest rate expectations to rise beyond 2023. However, the Fed is unlikely to raise rates in the next two years even if the economy does begin to overheat. This should keep rate expectations at the short end of the curve well anchored near zero, allowing the curve to further steepen. Investors should continue to overweight equities on a 12-month horizon. Historically, stocks have been able to shrug off rising bond yields, provided borrowing costs did not rise so high as to tip the economy into recession. A faster start to the vaccination campaign in the US and accommodative fiscal policy should support the dollar over the next few months. Nevertheless, the greenback will still decline modestly over a 12-month horizon. Too Hot For Comfort? With the vaccination campaign in full gear and plenty of fiscal support in the pipeline, investors have swung from worrying that the US economy will grow too slowly to worrying that it will grow too fast. Chart 1 illustrates these concerns in a nutshell. Point A on the aggregate demand schedule corresponds to a situation where the economy is operating below capacity and interest rates are stuck at zero. An outward shift in the demand curve from AD1 to AD2 would eliminate the output gap without necessitating higher interest rates (Point B). Such an outcome would be good news for equity investors because it would lead to more output and increased corporate profits without any tightening in monetary policy. Chart 1Where Will Fiscal And Monetary Policy Take Us?
When Good News Becomes Bad News In One Chart
When Good News Becomes Bad News In One Chart
If the demand curve were to shift further out to AD3, however, the Fed might be forced to take away the punch bowl. The result would be higher interest rates rather than higher output (Point C). This would be bad news for equity investors. Two Questions Analyzing the current debate about where bond yields are going through the lens of this simple chart, two questions arise: How likely is the US economy to run out of excess capacity over the next few quarters? How would the Fed respond to evidence that the US economy is overheating? On the first question, the honest answer is that no one knows. According to the Congressional Budget Office, the output gap stood at 3% of GDP in the fourth quarter of 2020. The true number is probably closer to 5% of GDP since the CBO implausibly assumes that GDP was 1% above potential prior to the pandemic. As of February, payroll employment was down 5.3% from its pre-pandemic level, suggesting that there is still a fair amount of slack in the economy. Employment had fallen even more among low-income workers, women, and certain ethnic minority groups – an important consideration given the Fed’s heightened focus on “inclusive growth” (Chart 2). Chart 2Some Have Suffered More Job Losses Than Others
When Good News Becomes Bad News In One Chart
When Good News Becomes Bad News In One Chart
Slack Will Shrink Chart 3Lower Spending And Higher Income Led To Mounting Excess Savings
Lower Spending And Higher Income Led To Mounting Excess Savings
Lower Spending And Higher Income Led To Mounting Excess Savings
US households were sitting on around $1.7 trillion in excess savings as of the end of January. Households generated about two-thirds of those excess savings by cutting back on spending during the pandemic, with the remaining one-third stemming from increased transfer payments (Chart 3). We estimate that the stimulus bill that President Biden signed into law earlier today will boost household savings by an additional $300 billion, bringing the stock of excess savings to $2 trillion by April. As lockdown measures ease, it is reasonable to assume that households will spend a portion of this cash cushion. Unlike President Trump’s Tax Cuts and Jobs Act, Biden’s American Rescue Plan Act will raise the incomes of the poor much more than the rich (Chart 4). Since the poor tend to spend a greater share of each dollar of disposable income than the rich, aggregate demand could rise meaningfully. Chart 4Biden’s Package Will Boost The Income Of The Poor
When Good News Becomes Bad News In One Chart
When Good News Becomes Bad News In One Chart
Meanwhile, the supply side of the economy could face a temporary setback. Under the legislation, about 40% of jobless workers will receive more income from extended unemployment benefits than they did from working. While these additional benefits will expire in early September, they could temporarily curtail labor supply at a time when firms are trying to step up the pace of hiring. Putting it all together, there is a high probability that the US economy will heat up this summer, stoking fears of higher inflation. Door C, D, Or E? For investors, how the Fed reacts to any potential overheating will be critical. If the market prices in an earlier liftoff date for the fed funds rate, the economy will move towards Point C. However, there is another possibility: Rather than fretting about an overheated economy, the Fed could welcome it, stressing its commitment to maintain very easy monetary policy. In that case, the economy would find itself closer to Point D. In fact, Point D could turn out to be a waystation to Point E. An overheated economy could lift inflation. In the absence of any rate hikes, real interest rates would fall. Lower real rates would further stoke spending, causing the aggregate demand curve to shift to AD4. What point will the US end up reaching? As we discuss below, our guess is “eventually Point C,” but with a temporary detour towards Points D/E. The Long-Term Case For C Chart 5Real Yields Have Recovered But Are Still Low
Real Yields Have Recovered But Are Still Low
Real Yields Have Recovered But Are Still Low
The 5-year/5-year forward US TIPS yield currently stands at 0.18%. This is well above the trough of -0.84% reached last August, but still below the average of 0.7% that prevailed in 2017-19 (Chart 5). One can make a case that real bond yields will eventually rise above where they were before the pandemic. Even though the US budget deficit will decline next year due to the expiration of most stimulus measures, fiscal policy will remain looser than it was for most of the post-GFC period. Notably, BCA’s geopolitical strategists expect Congress to pass a $4 trillion 10-year infrastructure bill by this fall, only half of which will be financed through tax hikes. They also anticipate increased spending on health care and other social programs. Chronically easier fiscal policy will lift the neutral rate of interest. Recall that the neutral rate – also known as the “equilibrium rate” – is simply the interest rate that equalizes aggregate demand with aggregate supply. To the extent that looser fiscal policy raises aggregate demand, a higher interest rate will be necessary to bring aggregate demand back down so that it matches aggregate supply. Temporary Detour Towards D/E That journey to higher real bond yields is likely to be prolonged, however. As noted above, the Fed has no desire to validate market expectations of tighter monetary policy anytime soon. Chart 6 shows that yields rarely rise significantly when the Fed is on hold. Chart 6Treasurys Tend To Underperform When The Fed Delivers Hawkish Surprises
When Good News Becomes Bad News In One Chart
When Good News Becomes Bad News In One Chart
Currently, investors expect the Fed to start hiking rates in November 2022, with a second rate hike delivered in May 2023, and a third in November 2023 (Chart 7). This is considerably more hawkish than the Fed’s own forecast from December, which called for no rate hikes until at least 2024. Chart 7The Market Expects Liftoff In Late 2022
The Market Expects Liftoff in Late 2022
The Market Expects Liftoff in Late 2022
While the Fed is likely to bring forward its dots during this month’s FOMC meeting, our US bond strategists still expect the revised dots to signal a later liftoff than what the market is pricing in. On balance, we expect the 10-year Treasury yield to finish the year at about 1.7% – broadly in line with market expectations – but to rise more than expected over a longer-term horizon of 2-to-5 years. Is Inflation A Short-Term Or Long-Term Risk? A sizeable gap has opened up between US 5-year and 10-year inflation breakevens (Chart 8). Investors believe that inflation will accelerate over the next few years but then settle down to a lower level by the middle of the decade. We think the opposite is more likely to transpire. Economies can often operate above potential for a while before inflation expectations become unmoored. For example, in the 1960s, the unemployment rate spent over two years below NAIRU before inflation finally burst onto the scene. However, as the sixties also revealed, when inflation does rise, it can rise quickly. Core CPI inflation doubled within the span of nine months in 1966. Inflation continued rising all the way to 6% in 1969 (Chart 9). Chart 8Breakeven Curve Inversion
Breakeven Curve Inversion
Breakeven Curve Inversion
Chart 9Inflation Started Accelerating Quickly Only When Unemployment Reached Very Low Levels In The 1960s
When Good News Becomes Bad News In One Chart
When Good News Becomes Bad News In One Chart
As we discussed in February, there are numerous similarities between the present environment and the mid-1960s. This suggests that inflation could surprise significantly to the upside in the middle of the decade, even if it is slow to get off the ground over the next few years. Remain Overweight Stocks Over A 12-Month Horizon Stocks usually rise when growth is strong and monetary policy is accommodative (Chart 10). While bond yields in the US and most other economies will trend higher, they will remain below their equilibrium level for at least the next two years. Chart 10Stocks Do Well When The Economy Does Well
Stocks Do Well When The Economy Does Well
Stocks Do Well When The Economy Does Well
In fact, fiscal largesse may have boosted the US neutral rate of interest by more than bond yields have risen, implying that monetary policy has become more, not less, stimulative over the past few months. Historically, stocks have been able to shrug off rising bond yields, provided borrowing costs did not rise so high as to tip the economy into recession (Chart 11 and Table 1). Chart 11What Happens To Equities When Treasury Yields Rise?
What Happens To Equities When Treasury Yields Rise?
What Happens To Equities When Treasury Yields Rise?
Table 1As Long As Bond Yields Don't Rise Into Restrictive Territory, Stocks Will Recover
When Good News Becomes Bad News In One Chart
When Good News Becomes Bad News In One Chart
Mixed Picture For The US Dollar The OECD estimates that GDP in the rest of the world will receive a modest lift from US fiscal stimulus (Chart 12). Nevertheless, the US economy will be the primary beneficiary. This has important implications for the direction of the dollar. Chart 12The Benefits Of US Fiscal Stimulus Will Spill Over To Other Countries
When Good News Becomes Bad News In One Chart
When Good News Becomes Bad News In One Chart
The dollar is normally a countercyclical currency, meaning that it tends to move in the opposite direction of the global business cycle. One key reason for this is that the US economy, with its relatively small manufacturing base and large service sector, is less cyclical than most other economies. Thus, when global growth rises, the US often lags behind. The pattern has been different this year, however. Chart 13 shows that growth expectations have risen more in the US than abroad. This is partly because US fiscal policy has been more stimulative than elsewhere. In addition, the US has been faster out of the gate in vaccinating its population (Chart 14). Chart 13US Growth Outperformance Could Be A Near-Term Tailwind For The Dollar
US Growth Outperformance Could Be A Near-Term Tailwind For The Dollar
US Growth Outperformance Could Be A Near-Term Tailwind For The Dollar
US growth outperformance should support the greenback over the next few months. Nevertheless, we are not ready to abandon our bearish 12-month dollar view. For one thing, growth revisions should shift back in favor of other developed economies later this year as they catch up to the US in their vaccination campaigns. The prospect of negative fiscal thrust in 2022 due to the expiration of various stimulus measures will also weigh on the US growth outlook. Lastly, the Fed’s reticence to signal a tighter monetary stance will prevent US 2-year real yields – which are already quite low compared to other developed markets – from rising very much (Chart 15). We have found that shorter-dated yields help explain currency movements better than longer-dated yields. Chart 14US Is Among The Vaccination Leaders
US Is Among The Vaccination Leaders
US Is Among The Vaccination Leaders
Chart 15Real Rate Differentials Are A Headwind For The Dollar
Real Rate Differentials Are A Headwind For The Dollar
Real Rate Differentials Are A Headwind For The Dollar
A modestly softer dollar should, in turn, support cyclical equity sectors and value stocks over the next 12 months. Peter Berezin Chief Global Strategist pberezin@bcaresearch.com Global Investment Strategy View Matrix
When Good News Becomes Bad News In One Chart
When Good News Becomes Bad News In One Chart
Special Trade Recommendations
When Good News Becomes Bad News In One Chart
When Good News Becomes Bad News In One Chart
Current MacroQuant Model Scores
When Good News Becomes Bad News In One Chart
When Good News Becomes Bad News In One Chart
Please note that we will be presenting a webcast on Thursday March 11 at 10:00 AM EST for the Americas and EMEA regions and on March 12 at 9:00 HKT/12:00 AEDT for APAC clients. We will be discussing macro themes and investment strategies. Highlights EMs (ex-China, Korea and Taiwan) are better positioned to handle higher US bond yields today than they were in 2013. Yet better does not mean they will be unscathed. The combination of rising US bond yields and a firming US currency will suffocate EM risk assets in the near-term. A neutral allocation is warranted in EM stocks and credit markets within global equity and credit portfolios, respectively. Feature Ever since the US elections concluded in January with a Blue Sweep, we have been warning that rising US bond yields could trigger a setback in global markets in general, and in EM markets in particular. EM equities, currencies and fixed-income markets have recently experienced a correction (Chart 1). The question now is: Is the market rout over? Or is there more to come? We are inclined to believe that the correction is not over. Rising US Treasury yields have been the culprit of the shakeout in global growth stocks, EM equities, as well as EM currencies. Therefore, taking a stance on US bond yields and on the US dollar is critical for assessing the outlook for EM financial markets. Odds are that the selloff in US long-term bonds and the rebound in the US dollar are not yet over because: Positioning and sentiment on US long-dated Treasuries is neutral, as illustrated in Chart 2. Chart 1Rising US Real Yields Have Caused A Shakeout In EM
Rising US Real Yields Have Caused A Shakeout In EM
Rising US Real Yields Have Caused A Shakeout In EM
Chart 2Investor Sentiment And Positioning In US Treasurys Are Neutral
Investor Sentiment And Positioning In US Treasurys Are Neutral
Investor Sentiment And Positioning In US Treasurys Are Neutral
Typically, US bond yields do not reverse their ascent until investor sentiment becomes downbeat and bond portfolios are of materially short duration. These conditions for a top in bond yields are not yet present. US government bond yields would have been much higher if it were not for the Federal Reserve and US commercial banks’ massive bond-buying spree. The Fed has bought $2.8 trillion and US commercial banks have purchased about $300 billion of Treasurys in the past 12 months (Chart 3). One of the main motives for commercial banks to buy US Treasurys has been the SLR relief initiative which commenced on April 1, 2020.1 This SLR relief is due to terminate on March 31, 2021. Unless it is extended, commercial banks will drastically curtail their net government bond purchases. This will exert upward pressure on Treasury yields. Regarding the greenback, investor sentiment remains quite bearish (Chart 4). From a contrarian perspective, this heralds further strength in the US dollar. Chart 3Surging Purchases Of US Treasurys By The Fed And Commercial Banks
Surging Purchases Of US Treasurys By The Fed And Commercial Banks
Surging Purchases Of US Treasurys By The Fed And Commercial Banks
Chart 4Investors Are Still Bearish On The US Dollar
Investors Are Still Bearish On The US Dollar
Investors Are Still Bearish On The US Dollar
From a cyclical perspective, US growth will be stronger relative to its potential, and vis-à-vis other DMs, EMs and China. Growth differentials moving in favor of the US foreshadows near-term strengthening of the dollar. Structurally, the bearish case for the US currency hinges on both the Federal Reserve falling behind the inflation curve and ballooning US twin deficits. In our view, this will ultimately be the case. Hence, the long-term outlook for the US dollar remains troublesome. That said, twin deficits alone are insufficient to produce a continuous currency depreciation. The twin deficits must also be accompanied with low/falling real interest rates – in order to generate sufficient conditions for currency depreciation. As long as US real rates continue rising, the dollar’s rebound will be extended. The USD/EUR exchange rate has been correlated with the 10-year real yield differential and this relationship will persist (Chart 5). Bottom Line: US government bonds will continue selling off. Rising bond yields (including rising real yields) will support the dollar in the near-term. The combination of rising US bond yields and a firming US currency will cause global macro volatility to rise (Chart 6). This will suffocate EM risk assets and EM currencies. Chart 5US Real Yields (TIPS) Will Continue Driving The US Dollar
US Real Yields (TIPS) Will Continue Driving The US Dollar
US Real Yields (TIPS) Will Continue Driving The US Dollar
Chart 6Aggregate Financial Market Volatility: Higher Lows
Aggregate Financial Market Volatility: Higher Lows
Aggregate Financial Market Volatility: Higher Lows
Impact On EM: 2013 Versus Now Are we entering another Taper Tantrum episode as in the spring of 2013 when many EMs were devastated? There are both similarities and differences between the current period of rising US bond yields and the 2013 episode. Similarities: Today, as in early 2013, investor sentiment on EM is very bullish and investors are long EM (Chart 7). Chart 7Investor Sentiment On EM Stocks Was At A Record High In January
Investor Sentiment On EM Stocks Was At A Record High In January
Investor Sentiment On EM Stocks Was At A Record High In January
In early 2013, as is the case today, EM local currency bond yields were very low and EM credit spreads were too tight. When US Treasury yields spiked in the spring of 2013, EM assets tanked. Many commentators blamed it on the Fed. We disagree with that interpretation. Remarkably, the rise in US TIPS yields in 2013 had little impact on equity indices such as the S&P 500 and Nasdaq, or on US corporate spreads (Chart 8). The correction in the US equity market lasted about a week. Yet, EM equities, fixed income markets and currencies experienced a prolonged slump, and in many cases, a bear market. There is no basis to believe that the Fed’s policy and US bond yields are more important to EM than they are to US credit and equity markets. The core rationale for the EM bear market in 2013 was poor domestic fundamentals. The Fed’s tapering was the trigger, not the cause. Differences: The key difference between the current episode and the 2013 Taper Tantrum is EM macro fundamentals. Specifically: EM economies (ex-China, Korea and Taiwan) entered 2013 with booming bank loans and strong domestic demand as well as high inflation (Chart 9). Chart 8US Markets Were Not Hit By The Taper Tantrum In 2013
US Markets Were Not Hit By The Taper Tantrum In 2013
US Markets Were Not Hit By The Taper Tantrum In 2013
Chart 9EM (ex-China, Korea And Taiwan): 2013 Vs Now
EM (ex-China, Korea and Taiwan): 2013 Vs Now
EM (ex-China, Korea and Taiwan): 2013 Vs Now
Chart 10EM (ex-China, Korea And Taiwan): 2013 Vs Now
EM (ex-China, Korea and Taiwan): 2013 Vs Now
EM (ex-China, Korea and Taiwan): 2013 Vs Now
Presently, EM bank credit is subdued, domestic demand is dismal, and inflation is tame. Besides, EMs (ex-China, Korea and Taiwan) had a very large trade deficits in 2013 and were financing them via foreign borrowing, which was roaring prior to 2013 (Chart 10). Presently, their trade balances are in surplus and foreign indebtedness has not increased in recent years. Bottom Line: In 2013, EM economies (ex-China, Korea and Taiwan) were overheating and were addicted to foreign funding. These were the reasons why EM currencies and fixed income markets teetered when US bond yields spiked in 2013. Presently, the majority of EM economies (ex-China, Korea and Taiwan) have different types of malaises: domestic bank loan origination is too timid, consumer spending and capital expenditures are moribund, inflation is low and fiscal policy is tight. Consequently, EMs (ex-China, Korea and Taiwan) are better positioned to handle higher US bond yields today than they were back in 2013. Yet better does not mean they will be unscathed. Investment Strategy Equities: The key variable to watch to assess the vulnerability of both US and EM equity markets is their respective corporate bond yields. Historically, rising corporate bond yields (shown inverted in both panels of Chart 11) heralds lower share prices. Chart 11Rising Corporate Bond Yields Are Bad For Share Prices
Rising Corporate Bond Yields Are Bad For Share Prices
Rising Corporate Bond Yields Are Bad For Share Prices
Given that both EM and US corporate credit spreads are too tight, they are unlikely to narrow further to offset rising US Treasury yields. Instead, EM and US corporate bond yields are likely to rise with US Treasury yields. This will trigger more weakness in share prices. Besides, rising EM local currency government bond yields also point towards more downside in EM equities (yields are shown inverted on the chart) (Chart 12). Chart 12Rising EM Local Currency Bond Yields Heralds Weaker Equity Prices
Rising EM Local Currency Bond Yields Heralds Weaker Equity Prices
Rising EM Local Currency Bond Yields Heralds Weaker Equity Prices
Concerning equity style, global growth stocks have peaked versus global value stocks. In the EM equity space, we have less conviction on growth versus value. As to regional allocation in a global equity portfolio, we continue recommending a neutral allocation to EM, underweighting US and overweighting Europe and Japan. Commodities: Investors’ net long positions in commodities are very elevated (Chart 13). As US bond yields rise and the US dollar continues rebounding, there will be a de-risking in the commodities space resulting in a pullback in commodities prices. Currencies: We continue shorting a basket of EM currencies – including BRL, CLP, ZAR, TRY and KRW versus the euro, CHF and JPY. Several EM currencies have failed to break above their technical resistance levels, suggesting that a pullback could be non-trivial (Chart 14). Chart 13Investors Are Record Long Commodities
Investors Are Record Long Commodities
Investors Are Record Long Commodities
Chart 14Asian Currencies Hit Technical Resistances
Asian Currencies Hit Technical Resistances
Asian Currencies Hit Technical Resistances
In central Europe, we are closing the long CZK/short USD trade with a 3.8% gain. Continue holding the long CZK/short PLN and HUF position. Local fixed income markets: EM local bond yields have risen in response to rising US treasury real yields and the setback in EM currencies. This might persist in the near-term, but we continue to recommend receiving 10-year swap rates in selected countries where inflation risks are low and monetary and fiscal policies are tight. These countries include Mexico, Colombia, Russia, China, India and Malaysia. A further rise in their swap rates would represent an overshoot and hence, should not be chased. EM currencies are more vulnerable to a selloff than local rates are. We continue to wait for a better entry point in currencies to recommend buying cash domestic bonds instead of receiving swap rates. EM Credit: A neutral allocation to EM sovereign and corporate bonds is warranted in a global credit portfolio. Our sovereign credit overweights are Mexico, Russia, Malaysia, Peru, Colombia, the Philippines and Indonesia, while our sovereign credit underweights are Brazil, South Africa and Turkey. Arthur Budaghyan Chief Emerging Markets Strategist arthurb@bcaresearch.com Footnotes 1 The Supplementary Leverage Ratio (SLR) is equivalent to Basel III Tier-1 leverage ratio and varies from 3-5% for US banks. Under the relief program last April, the Fed allowed US banks to exclude holdings of US Treasury Bonds and cash kept in reserves at the Fed from their assets when calculating this ratio. The SLR relief is planned to end March 31, 2021. Equities Recommendations Currencies, Credit And Fixed-Income Recommendations