Fixed Income

Highlights Rising Global Yields: The increased turbulence in global bond markets is part of the adjustment process to a more positive outlook for global economic growth. Rising real yields are now the main driver of nominal yield movements, with stable inflation expectations indicating that investors are not overly concerned about a sustained inflation overshoot. Duration: Central bankers will eventually be forced to shift to less dovish interest rate guidance to reflect the new reality of faster growth and increased inflation pressures, but this is likely to not occur until much later in 2021, starting with the Fed. Maintain a below-benchmark cyclical duration stance in global bond portfolios. UST Yields & Spreads: The selloff in US Treasuries has pushed US yields to levels that are starting to look a bit stretched relative to yields from other major developed economies like Germany and Japan. This is especially true on a volatility-adjusted basis. As a result, we are closing our tactical US-Germany spread widening trade in bond futures at a profit of 1.8%. Feature Chart of the WeekBond Yields Are Rising Because Of Growth
Bond Yields Are Rising Because Of Growth
Bond Yields Are Rising Because Of Growth
The rapid surge in global bond yields seen so far in 2021 has led some commentators to declare that the dreaded “bond vigilantes” have returned to dole out punishment for overly stimulative fiscal and monetary policies (most notably in the US). The rapid pace of the bond selloff, with the 10-year US Treasury yield reaching 1.6% on an intraday basis last week, has raised fears that spiking yields could damage a fragile global economic recovery. This logic is backwards – it is surging growth expectations that are driving bond yields sustainably higher from deeply depressed levels. Global growth is projected to accelerate at a very rapid pace over the rest of this year and 2022. The combination of the Bloomberg consensus real GDP growth and inflation forecasts for the major developed economies suggest that nominal year-over-year GDP growth is expected to climb to 7.2% in the US, 8.4% in the UK and 6.4% in the euro area by year-end (Chart of the Week). Nominal growth in 2022 is expected to grow by another 5-7% across the same regions, suggesting a return to a slightly faster pace than prevailed during the pre-pandemic years of 2017-19 - even after a boom in 2021. Nominal longer-term global government bond yields, which had been priced for a pandemic-stricken economic backdrop, are now playing catch-up to the new reality of a post-pandemic, vaccinated world. Bond investors understand that the need for extreme monetary accommodation is ebbing, especially in the US where there will be an enormous fiscal impulse to growth in 2021 (and beyond). As a result, interest rate expectations are moving higher, fueling a repricing towards higher bond yields around the world. This process has more room to run. A Global Move Higher In Yields, For The Right Reasons Chart 2Reflationary Bear-Steepening Of Global Yield Curves
Reflationary Bear-Steepening Of Global Yield Curves
Reflationary Bear-Steepening Of Global Yield Curves
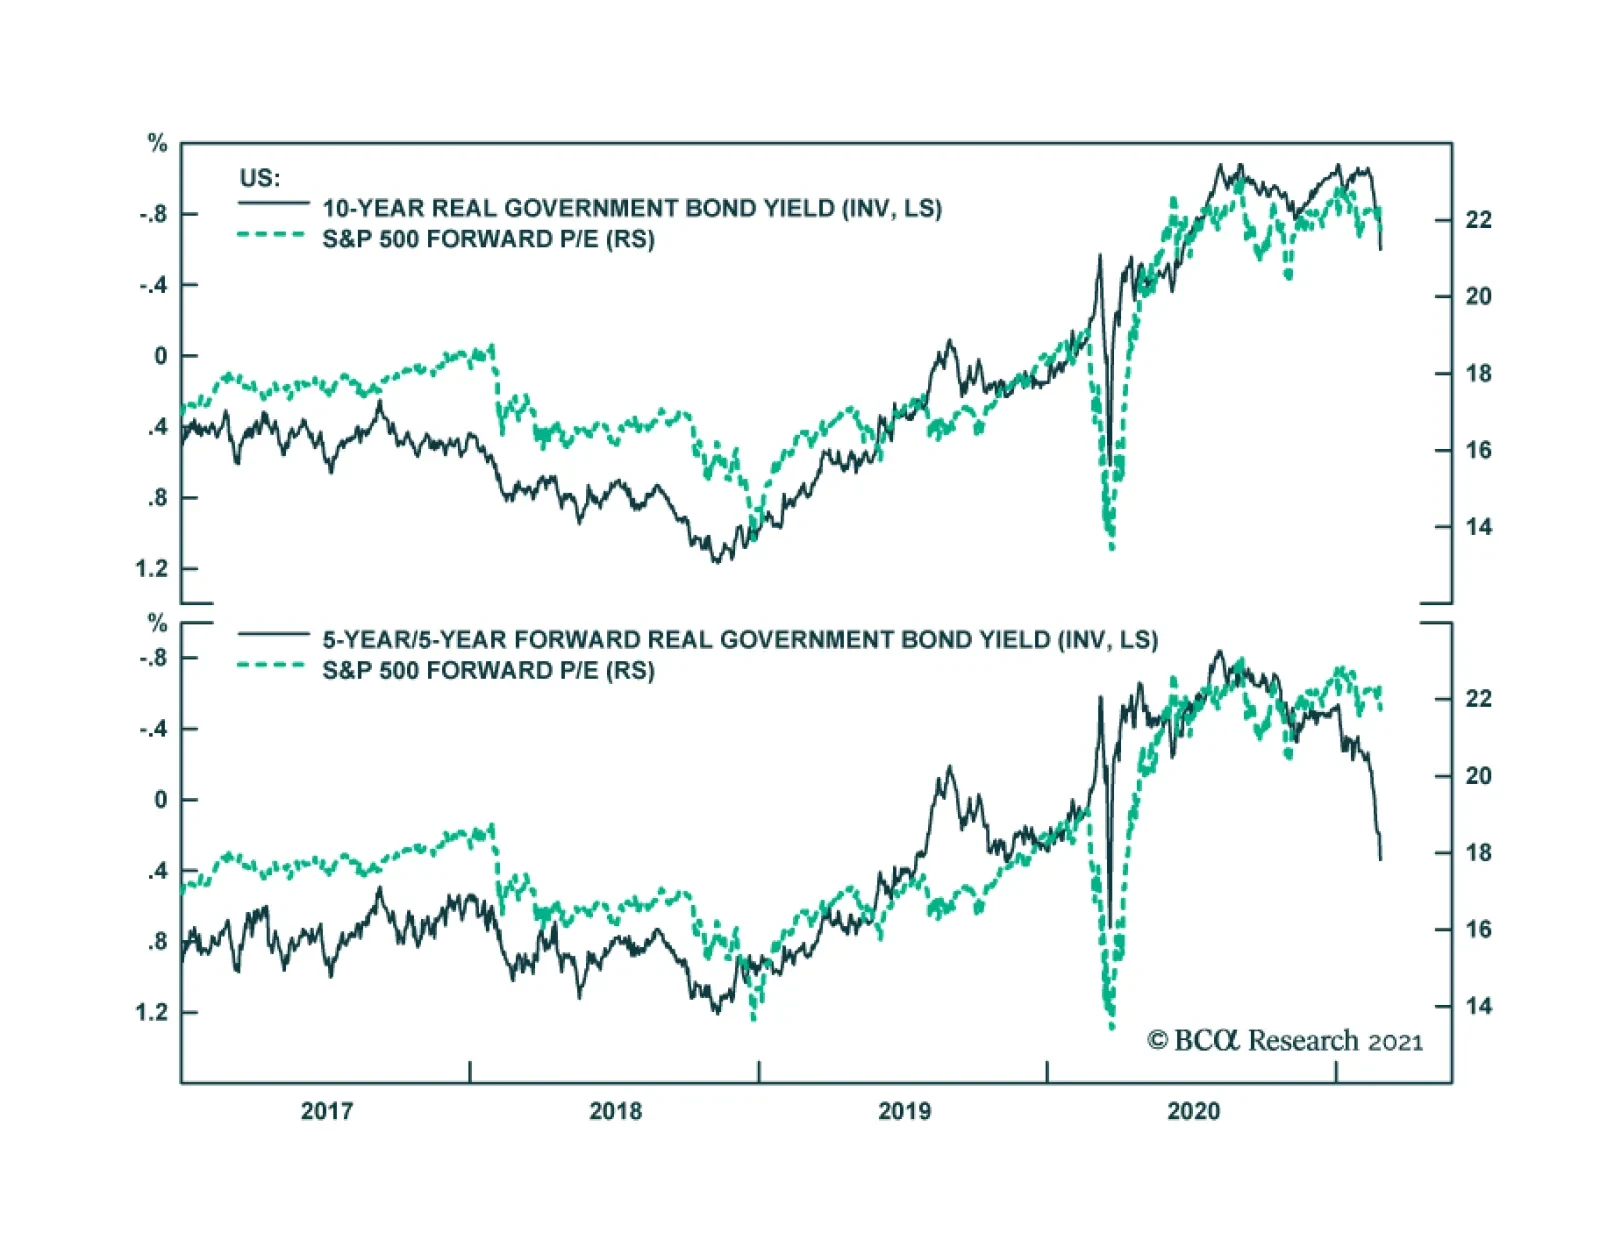
The cyclical rise in developed market bond yields that began last summer was initially focused on longer-maturity yields boosted by rising inflation expectations (Chart 2). The very front-ends of bond yield curves – which are more sensitive to expectations of changes in central bank policy rates – have remained subdued. The upward pressure on global bond yields is starting to infect some shorter maturities, however. 5-year government bonds yields in the UK, Canada and Australia rose 44bps, 42bps and 35bps, respectively, during the month of February. The latter two represented a near doubling of the level of the 5-year yield. In the case of the UK, the surge in 5-year Gilt yields came from a starting point of negative yields at the end of January. Last week, the 5-year US Treasury yield jumped a massive 22bps on a single day due to a poorly received US Treasury auction. Year-to-date, longer-term global bond yields have been rising more through the real yield component than higher inflation expectations (Charts 3A & 3B). This is a change in the dynamics from the latter half of 2020 when inflation expectations were the dominant force pushing global yields higher. Chart 3AReal Yields Are Driving The Recent Bond Selloff …
Real Yields Are Driving The Recent Bond Selloff...
Real Yields Are Driving The Recent Bond Selloff...
Chart 3B… Even In The Lower-Yielding Markets
...Even In The Lower-Yielding Markets
...Even In The Lower-Yielding Markets
This shift in “leadership” of the global bond market selloff has been broad-based. 10-year real yields from inflation-linked bonds have surged higher in the US (+35bps year-to-date), UK (+40bps), Australia (+44bps) and Canada (+25bps). Real 10-year yields have even inched up in France (+9bps), despite euro area growth suffering because of COVID-19 lockdowns. This coordinated rise in real bond yields comes on the heels of a sharp improvement in overall global economic momentum and improving expectations for future growth. Manufacturing PMIs, a reliable leading indicator of real yields in the developed markets, began a cyclical improvement in the middle of last year and, right on cue, global bond yields bottomed out toward the end of 2020 (Chart 4). The link between that strong growth momentum and real bond yields comes from expected changes in central bank policies. Our Central Bank Monitors for the US, euro area, UK, Japan, Canada and Australia – designed to measure cyclical pressures on monetary policy - have all moved significantly higher since mid-2020 (Chart 5). This suggests a diminished need for additional monetary stimulus because of rebounding economic growth and intensifying inflation pressures. The Monitors have climbed to above pre-pandemic levels in the US and Australia. Chart 4Real Yields Starting To Catch Up To Solid Growth
Real Yields Starting To Catch Up To Solid Growth
Real Yields Starting To Catch Up To Solid Growth
Chart 5Markets Starting To Discount Rate Hikes In 2023
Markets Starting To Discount Rate Hikes In 2023
Markets Starting To Discount Rate Hikes In 2023
Interest rate markets are responding to this cyclical pressure to tighten monetary policies by repricing the expected timing and pace of the next rate hiking cycle. Our 24-month discounters, which derive the amount of interest rate changes priced into overnight index swap (OIS) curves up to two years in the future, are now pricing in higher policy rates in the US (+40bps), the UK (+32bps), Australia (+36bps) and Canada (a whopping +82bps) by the first quarter of 2023. This repricing of interest rate expectations does conflict with current central bank forward guidance, to varying degrees. For example, the Fed continues to signal that there will not be any rate hikes until at least the end of 2023. Policymakers will not be overly concerned about higher government bond yields and shifting interest rate expectations, however, if there is limited spillover into broader financial market performance. In the US, the latest increase in real Treasury yields to date has had minimal impact on US equity market valuations or corporate bond yields (Chart 6A), suggesting no tightening of financial conditions that could impact future US economic growth. A similar situation is playing out in Europe, where higher longer-term real yields have had little impact on equity market valuations or the borrowing rates that the ECB is most concerned about, like Italian BTP yields (Chart 6B). Chart 6ANo Tightening Of Financial Conditions In The US...
No Tightening Of Financial Conditions In The US...
No Tightening Of Financial Conditions In The US...
Chart 6B...Or Europe
...Or Europe
...Or Europe
Currency valuations are a more important indicator of financial conditions for other central banks. For example, the Reserve Bank of Australia (RBA) has been explicit that its current policies – near-zero policy rates, yield curve control to anchor the level of 3-year bond yields and quantitative easing (QE) to moderate the level of longer-term yields – are intended to not only keep borrowing costs low but also dampen the value of the Australian dollar. At the moment, the US dollar is being pulled in different directions by the typical fundamental drivers. Real rate differentials between the US and other major developed economies remain unattractive for the greenback, even with the latest rise in US real yields (Chart 7). At the same time, growth differentials between the US and the other major economies are turning more USD-positive. For now, rate differentials are the more dominant factor for the US dollar and will remain so until the Fed begins to shift to a less dovish policy stance – an outcome that we do not expect until much later this year when the Fed will begin to prepare the market for a tapering of asset purchases in 2022. A sustainable bottoming of the US dollar, fueled by a shift to a less accommodative Fed, will also likely mark the end of the rising trend for global inflation expectations, given the links between the dollar, commodity prices and inflation breakevens (bottom panel). Central banks outside the US will continue to resist any unwelcome appreciation of their own currencies versus the US dollar. That means doing more QE when bond yields rise too quickly, as the RBA did this week and the ECB has threatened to do in recent comments from senior policymakers (Chart 8). Increasing the size of asset purchases is unlikely to sustainably drive non-US bond yields lower, however, in an environment of improving global growth that is causing investors to reassess the future path of interest rates. All more QE can hope to do at this point in the global business cycle is limit how fast bond yields can increase. Chart 7The USD Remains The Critical Reflationary Variable
The USD Remains The Critical Reflationary Variable
The USD Remains The Critical Reflationary Variable
Chart 8More QE Is Less Effective At Capping Bond Yields
More QE Is Less Effective At Capping Bond Yields
More QE Is Less Effective At Capping Bond Yields
Chart 9Markets With A Lower Yield Beta To USTs Are Outperforming
Markets With A Lower Yield Beta To USTs Are Outperforming
Markets With A Lower Yield Beta To USTs Are Outperforming
From an investment strategy perspective, the current growth-fueled move higher in global real bond yields does not change any of our suggested tilts. We continue to recommend a below-benchmark overall duration stance within global bond portfolios. Within our recommended country allocation among developed market government bonds, we continue to prefer a large underweight to US Treasuries and overweights to markets that are less susceptible to changes in US Treasury yields like Germany, France, Japan and the UK (Chart 9). We also continue to recommend only neutral allocations to Canadian and Australian government bonds (with below-benchmark duration exposure within those allocations), although we are on “downgrade alert” for both given their status as higher-beta bond markets with central banks more likely follow the Fed down a less dovish path later this year. Bottom Line: Rising real yields are now the main driver of nominal yield movements, with stable inflation expectations indicating that investors are not overly concerned about a sustained inflation overshoot. Central bankers will eventually be forced to shift to less dovish interest rate guidance to reflect the new reality of faster growth and increased inflation pressures, but this is likely to not occur until much later in 2021, starting with the Fed. Maintain a below-benchmark cyclical duration stance in global bond portfolios, with a large underweight allocation to US Treasuries. The UST-Bund Spread Widening Looks Stretched Chart 10Yield Chasing Has Been A Losing Strategy In 2021
Yield Chasing Has Been A Losing Strategy In 2021
Yield Chasing Has Been A Losing Strategy In 2021
Last August, we published a report discussing how “yield chasing” – a strategy of consistently favoring the highest yielding government bond markets – had become the default strategy for bond investors during the early months of the pandemic.1 We concluded that yield chasing would be a successful strategy for only as long as central banks stuck to their promises to maintain very loose monetary policy for the next few years. Investors would be forced to chase scarce yields in that environment, while worrying less about cyclical economic and inflation factors that could push up bond yields. Yield chasing has performed quite poorly so far in 2021. A basket of higher-yielding markets like the US, Canada and Australia has underperformed a basket of low-yielders like Germany, France and Japan by -1.4 percentage points (Chart 10). Obviously, such a carry-driven strategy would be expected to perform poorly during an environment of rising bond volatility as is currently the case. Markets that have been offering relatively enticing yields, like the US or Australia (Table 1), are actually generating the largest total return losses. Those higher-yielders have suffered more aggressive repricing of interest rate expectations, as discussed in the previous section of this report, leading to losses from duration that are dwarfing the higher yields. This is especially true in the US, where there remains the greater scope for an upward repricing of interest rate and inflation expectations. Table 1Government Bond Yields: Unhedged & Hedged Into USD
Are Central Banks Losing Control Of Bond Yields? No.
Are Central Banks Losing Control Of Bond Yields? No.
This suggests that investors must be cautious on determining when to consider increasing exposure to higher yielders like the US, even after Treasury yields have increased substantially. One way to evaluate that is to look at the spreads between US Treasuries and low yielders like Germany and Japan, relative to US bond volatility. In Chart 11, we show the spread of 10-year US Treasuries to 10-year German Bunds. To facilitate a fair comparison between the two, we hedge the Treasury yield into euros while adjusting the spread for duration difference between the two bonds. The currency-hedged and duration-matched Treasury-Bund spread is shown in the middle panel of the chart. In the bottom panel, we adjust that spread for US interest rate volatility by dividing the spread by the level of the MOVE index of US Treasury option volatility. On an unadjusted basis, the 10-year yield gap now sits at 175bps, +70bps higher than the lows seen in August 2020. That spread is narrower on a currency hedged basis, with the 10-year US Treasury yield hedged into euros +73ps higher than the 10-year German bund yield. Two conclusions stand out from the chart: The currency-hedged and duration-matched spread is still well below the prior peaks dating back to 2000; The volatility-adjusted spread is already one standard deviation above the mean value since 2000. In other words, there is scope for US Treasuries yields to continue rising relative to German Bund yields based on levels reached in past cycles. Yet at the same time, the spread provides a reasonable level of compensation compared to the riskiness (volatility) of Treasuries, also based on past cycles. We show the same chart for the spread between 10-year US Treasuries and 10-year Japanese government bonds (JGBs) in Chart 12. In this case, there is also scope for additional spread widening although the volatility-adjusted spread is still not as attractive as at previous peaks since 2000. Chart 11UST-Bund Spread Looking Stretched Vs UST Vol
UST-Bund Spread Looking Stretched Vs UST Vol
UST-Bund Spread Looking Stretched Vs UST Vol
Chart 12UST-JGB Spread Getting Stretched Vs UST Vol
UST-JGB Spread Getting Stretched Vs UST Vol
UST-JGB Spread Getting Stretched Vs UST Vol
The message from the volatility-adjusted Treasury-Bund spread lines up with that of the momentum measures of the unadjusted spread. The latter is historically stretched relative to its 200-day moving average, while the change in the spread over the past six months has been as rapid as any of the moves seen since the 2008 financial crisis (Chart 13). Adding it all up, positioning for additional widening of the Treasury-Bund spread is a much poorer bet from a risk versus reward perspective than it was even a few months ago. On a fundamental medium-term basis, however, there is still room for the Treasury-Bund spread to widen further. Relative inflation and unemployment (spare capacity) trends both argue for relatively higher US bond yields (Chart 14). In addition, the Fed is almost certainly going to start tightening monetary policy well before the ECB, thus policy rate differentials will underpin a wider bond spread – although that is already largely discounted in the spread on a forward basis (top panel). Chart 13UST-Bund Spread Momentum Looks Stretched
UST-Bund Spread Momentum Looks Stretched
UST-Bund Spread Momentum Looks Stretched
Chart 14Fundamentals Still Support A Wider UST-Bund Spread
Fundamentals Still Support A Wider UST-Bund Spread
Fundamentals Still Support A Wider UST-Bund Spread
Chart 15Stay Underweight US Vs. Germany On A Strategic Basis
Stay Underweight US Vs. Germany On A Strategic Basis
Stay Underweight US Vs. Germany On A Strategic Basis
Our fundamental fair value model of the 10-year Treasury-Bund spread shows that the spread is still cheap relative to fair value, which is rising (Chart 15). This suggests more medium-term upside in the spread, perhaps even by more than currently priced into the forwards over the next year. Based on this analysis, we see a case for maintaining a core strategic (6-12 month holding period) underweight position for the US versus Germany in our recommended country allocation within our model bond portfolio. At the same time, with the spread looking a bit stretched on some of the momentum and volatility-adjusted measures, we are taking profits on our tactical (0-6 month holding period) 10-year Treasury-Bund spread widening trade using bond futures, realizing a 1.8% return (see the Tactical Overlay table on page 18). Bottom Line: The selloff in US Treasuries has pushed US yields to levels that are starting to look a bit stretched relative to yields from other major developed economies like Germany and Japan. This is especially true on a volatility-adjusted basis. As a result, we are taking profits on our tactical US-Germany spread widening trade. However, we are maintaining our strategic overweight for Germany versus the US in our model bond portfolio, as fundamentals argue for a wider Treasury-Bund spread on a cyclical and strategic basis. Robert Robis, CFA Chief Fixed Income Strategist rrobis@bcaresearch.com Footnotes 1 Please see BCA Research Global Fixed Income Strategy Report, "We’re All Yield Chasers Now", dated August 11, 2020, available at gfis.bcaresearch.com. Recommendations The GFIS Recommended Portfolio Vs. The Custom Benchmark Index
Are Central Banks Losing Control Of Bond Yields? No.
Are Central Banks Losing Control Of Bond Yields? No.
Duration Regional Allocation Spread Product Tactical Trades Yields & Returns Global Bond Yields Historical Returns
Highlights Chart 1Back To Fair Value
Back To Fair Value
Back To Fair Value
February was a terrible month for the bond market. In fact, the Bloomberg Barclays Treasury Master Index returned -1.8%, its worst month since November 2016. The 5-year/5-year forward Treasury yield rose 37 bps. At 2.19%, it is now fairly valued for the first time since 2019, at least according to survey estimates of the long-run neutral fed funds rates (Chart 1). We outlined a checklist for increasing portfolio duration in our Webcast two weeks ago. So far, only two of the five items on our list have been checked. In particular, dollar sentiment and cyclical economic indicators continue to point toward higher yields, even though the market is now priced for a rate hike cycle that is slightly more hawkish than the Fed’s median forecast from December. We anxiously await this month’s revisions to the Fed’s interest rate forecasts. If the Fed’s forecasts remain unchanged from December, then we may get an opportunity to add some duration back into our recommended portfolio. Stay tuned. Feature Investment Grade: Neutral Chart 2Investment Grade Market Overview
Investment Grade Market Overview
Investment Grade Market Overview
Investment grade corporate bonds outperformed the duration-equivalent Treasury index by 65 basis points in February, bringing year-to-date excess returns up to +68 bps. The combination of above-trend economic growth and accommodative monetary policy supports positive excess returns for spread product versus Treasuries. Though Treasury yields have risen in recent weeks, this does not yet pose a risk for credit spreads. The 5-year/ 5-year forward TIPS breakeven inflation rate remains below 2%. We won’t be concerned about restrictive monetary policy pushing credit spreads wider until it reaches a range of 2.3% to 2.5%. Despite the positive macro backdrop, investment grade corporate valuations are extremely tight. The investment grade corporate index’s 12-month breakeven spread is down to its 2nd percentile (Chart 2). This means that the breakeven spread has only been tighter 2% of the time since 1995. The same measure shows that Baa-rated bonds have only been more expensive 3% of the time (panel 3). We don’t anticipate material underperformance versus Treasuries, but we see better value outside of the investment grade corporate space.1 Specifically, we advise investors to favor tax-exempt municipal bonds over investment grade corporates with the same credit rating and duration. We also prefer USD-denominated Emerging Market Sovereign bonds over investment grade corporates with the same credit rating and duration. Finally, the supportive macro environment means we are comfortable adding credit risk to a portfolio. With that in mind, we encourage investors to pick up the additional spread offered by high-yield corporates. Table 3ACorporate Sector Relative Valuation And Recommended Allocation*
Stay Bearish On Bonds
Stay Bearish On Bonds
Table 3BCorporate Sector Risk Vs. Reward*
Stay Bearish On Bonds
Stay Bearish On Bonds
High-Yield: Overweight Chart 3High-Yield Market Overview
High-Yield Market Overview
High-Yield Market Overview
High-Yield outperformed the duration-equivalent Treasury index by 115 basis points in February, bringing year-to-date excess returns up to +178 bps. Ba-rated credits outperformed duration-matched Treasuries by 111 bps on the month, besting B-rated bonds which outperformed by only 104 bps. The Caa-rated credit tier delivered 138 bps of outperformance versus duration-matched Treasuries. We view Ba-rated junk bonds as the sweet spot within the corporate credit space. The sector is relatively insulated from default risk and yet still offers a sizeable spread pick-up over investment grade corporates (Chart 3). We noted in our 2021 Key Views Special Report that the additional spread earned from moving down in quality below Ba is merely in line with historical averages.2 Assuming a 25% recovery rate on defaulted debt and a minimum required risk premium of 150 bps, we calculate that the junk index is priced for a default rate of 2.3% for the next 12 months (panel 3). This represents a steep drop from the 8.3% default rate observed during the most recent 12-month period. However, only 2 defaults occurred in January, down from a peak of 22 in July. Job cut announcements, an excellent indicator of the default rate, have also fallen dramatically (bottom panel). Overall, we see room for spread compression across all junk credit tiers in 2021 but believe that Ba-rated bonds offer the best opportunity in risk-adjusted terms. MBS: Underweight Chart 4MBS Market Overview
MBS Market Overview
MBS Market Overview
Mortgage-Backed Securities underperformed the duration-equivalent Treasury index by 26 basis points in February, dragging year-to-date excess returns down to -2 bps. The nominal spread between conventional 30-year MBS and equivalent-duration Treasuries widened 6 bps in February, but it remains low relative to the recent pace of mortgage refinancings (Chart 4). The MBS option-adjusted spread (OAS) tightened 1 bp on the month to 24 bps. This is considerably below the 57 bps offered by Aa-rated corporate bonds and the 42 bps offered by Agency CMBS. It is only slightly above the 22 bps offered by Aaa-rated consumer ABS. The plummeting primary mortgage spread was a key reason for the elevated refi activity seen during the past year. However, the spread has now recovered back to more typical levels (bottom panel). The implication is that further increases in Treasury yields will likely be matched by higher mortgage rates. This means that mortgage refinancings are likely close to a peak. A drop in refi activity would be a positive development for MBS returns, but we aren’t yet ready to turn bullish on the sector. First, relative OAS valuation favors Aa-rated corporates and Agency CMBS over MBS. Second, the gap between the nominal MBS spread and the MBA Refinance Index remains wide (panel 2) meaning that we could still see spreads adjust higher. Last year’s spike in the mortgage delinquency rate is alarming (panel 4), but it will have little impact on MBS returns. The increase was driven by household take-up of forbearance granted by the federal government. Our US Investment Strategy service has shown that a considerable majority of households will remain current on their loans once the forbearance period ends, causing the delinquency rate to fall back down.3 Government-Related: Neutral Chart 5Government-Related Market Overview
Government-Related Market Overview
Government-Related Market Overview
The Government-Related index underperformed the duration-equivalent Treasury index by 3 basis points in February, dragging year-to-date excess returns down to +21 bps (Chart 5). Sovereign debt underperformed duration-equivalent Treasuries by 95 bps in February, dragging year-to-date excess returns down to -116 bps. Foreign Agencies outperformed the Treasury benchmark by 31 bps on the month, bringing year-to-date excess returns up to +25 bps. Local Authority bonds outperformed by 63 bps in February, bringing year-to-date excess returns up to +203 bps. Domestic Agency bonds outperformed by 1 bp, bringing year-to-date excess returns up to +16 bps. Supranationals underperformed by 2 bps, dragging year-to-date excess returns down to +5 bps. We recently took a detailed look at valuation for USD-denominated Emerging Market (EM) Sovereigns.4 We found that, on an equivalent-duration basis, EM Sovereigns offer a spread advantage versus US corporates for all credit tiers except Ba. We recommend that investors take advantage of this spread pick-up by favoring investment grade EM Sovereigns over investment grade US corporates. Attractive countries include: Qatar, UAE, Saudi Arabia, Mexico, Russia and Colombia. We prefer US corporates over EM Sovereigns in the high-yield space. Ba-rated high-yield US corporates offer a spread advantage over EM Sovereigns and the extra spread available in B-rated and lower EMs comes from distressed credits in Turkey and Argentina. Municipal Bonds: Overweight Chart 6Municipal Market Overview
Municipal Market Overview
Municipal Market Overview
Municipal bonds underperformed the duration-equivalent Treasury index by 6 basis points in February, dragging year-to-date excess returns down to +102 bps (before adjusting for the tax advantage). Municipal bond spreads have tightened dramatically during the past few months and Aaa-rated Munis now look expensive compared to Treasuries, with the exception of the short-end of the curve (Chart 6). That said, if we match the duration and credit rating between the Bloomberg Barclays Municipal bond indexes and the US Credit index, we find that both General Obligation (GO) and Revenue Munis appear attractive compared to US investment grade Credit. Both GO and Revenue Munis offer a before-tax spread pick-up relative to US Credit for maturities above 12 years (bottom panel), the same goes for Revenue bonds in the 8-12 year maturity bucket (panel 3). Revenue bonds in the 6-8 year maturity bucket offer an after-tax yield pick-up versus Credit for investors with an effective tax rate above 0.3%. GO bonds in the 8-12 year and 6-8 year maturity buckets offer breakeven effective tax rates of 1% and 10%, respectively. All in all, municipal bond value has deteriorated markedly in recent months and we downgraded our recommended allocation from “maximum overweight” to “overweight” in January. However, investors should still prefer municipal bonds over investment grade corporate bonds with the same credit rating and duration. Treasury Curve: Buy 5-Year Bullet Versus 2/10 Barbell Chart 7Treasury Yield Curve Overview
Treasury Yield Curve Overview
Treasury Yield Curve Overview
Treasury yields moved up dramatically in February, with the curve steepening out to the 7-year maturity point and flattening thereafter. The 2/10 Treasury slope steepened 30 bps on the month to reach 130 bps. The 5/30 slope, meanwhile, held steady at 142 bps. Slopes across the entire yield curve traded directionally with yields for the bulk of February. That is, until last Thursday when a surge in bond yields occurred alongside flattening beyond the 5-year maturity point. As a result, the 2/5/10 butterfly spread spiked (Chart 7), moving into positive territory for the first time in a while (panel 4). This curve behavior raises an interesting question. Was last week’s sharp underperformance in the belly a one-off move driven by convexity selling and other technical factors, as many have suggested?5 Or, are we now close enough to a potential Fed liftoff date that we should expect some segments of the yield curve to flatten on days when yields rise? We will be watching the correlations between different yield curve segments and the overall level of yields closely during the next few weeks, but as of today, we think it’s premature to declare that the 5/10 slope has transitioned into a regime where it flattens on days when yields move higher. That being the case, we expect further increases in bond yields to coincide with a falling 2/5/10 butterfly spread, and we retain our recommended position long the 5-year bullet and short a duration-matched 2/10 barbell. TIPS: Overweight Chart 8TIPS Market Overview
TIPS Market Overview
TIPS Market Overview
TIPS outperformed the duration-equivalent nominal Treasury index by 39 basis points in February, bringing year-to-date excess returns up to +183 bps. The 10-year TIPS breakeven inflation rate rose 2 bps on the month to hit 2.17%. The 5-year/5-year forward TIPS breakeven inflation rate fell 15 bps in February to reach 1.91%. February’s TIPS outperformance was concentrated at the front-end of the curve, as investors started to price-in the possibility of higher inflation during the next year or two that eventually subsides. It’s interesting to note that, despite last month’s surge in bond yields, the 5-year/5-year forward TIPS breakeven inflation rate fell, moving further away from the Fed’s 2.3% to 2.5% target range in the process (Chart 8). The Fed will continue to strive for an accommodative policy stance at least until this target is met. Last month’s price action caused our recommended positions in inflation curve flatteners and real yield curve steepeners to perform very well, but we think further gains are possible in the coming months. The 2/10 CPI swap slope has only just dipped into negative territory (panel 4). With the Fed officially targeting a temporary overshoot of its 2% inflation target, this slope should remain inverted for some time yet. With the Fed also continuing to exert more control over short-dated nominal yields than over long-term ones, short-maturity real yields will continue to come under downward pressure relative to the long end (bottom panel). ABS: Overweight Chart 9ABS Market Overview
ABS Market Overview
ABS Market Overview
Asset-Backed Securities outperformed the duration-equivalent Treasury index by 3 basis points in February, bringing year-to-date excess returns up to +20 bps. Aaa-rated ABS outperformed by 2 bps on the month, bringing year-to-date excess returns up to +13 bps. Non-Aaa ABS outperformed by 9 bps on the month, bringing year-to-date excess returns up to +58 bps. The stimulus from last year’s CARES act led to a significant increase in household savings when individual checks were mailed last April. This excess savings has still not been spent, and now another round of checks is pushing the savings rate higher again (Chart 9). The large stock of household savings means that the collateral quality of consumer ABS is very high, with many households using their windfall to pay down debt (bottom panel). Investors should remain overweight consumer ABS and take advantage of strong collateral performance by moving down in credit quality. The Treasury department’s decision to let the Term Asset-Backed Loan Facility (TALF) expire at the end of 2020 does not alter our recommendation. Spreads are already well below the borrowing cost that was offered by TALF, and these tight spread levels are justified by strong household balance sheets. Non-Agency CMBS: Neutral Chart 10CMBS Market Overview
CMBS Market Overview
CMBS Market Overview
Non-Agency Commercial Mortgage-Backed Securities outperformed the duration-equivalent Treasury index by 12 basis points in February, bringing year-to-date excess returns up to +87 bps. Aaa Non-Agency CMBS underperformed Treasuries by 5 bps in February, dragging year-to-date excess returns down to +37 bps. Meanwhile, non-Aaa CMBS outperformed by 75 bps, bringing year-to-date excess returns up to +262 bps (Chart 10). We continue to recommend an overweight allocation to Aaa-rated Non-Agency CMBS and an underweight allocation to non-Aaa CMBS. Even with the expiry of TALF, Aaa CMBS spreads are already well below the cost of borrowing through TALF and thus won’t be negatively impacted. Meanwhile, the structurally challenging environment for commercial real estate could lead to problems for lower-rated CMBS (panels 3 & 4). Agency CMBS: Overweight Agency CMBS outperformed the duration-equivalent Treasury index by 11 basis points in February, bringing year-to-date excess returns up to +39 bps. The average index option-adjusted spread tightened 3 bps on the month to reach 42 bps (bottom panel). Though Agency CMBS spreads have completely recovered back to their pre-COVID lows, they still look attractive compared to other similarly risky spread products. This is especially true when you consider the Fed’s continued pledge to purchase as much Agency CMBS as “needed to sustain smooth market functioning”. Appendix A: Butterfly Strategy Valuations The following tables present the current read-outs from our butterfly spread models. We use these models to identify opportunities to take duration-neutral positions across the Treasury curve. The following two Special Reports explain the models in more detail: US Bond Strategy Special Report, “Bullets, Barbells And Butterflies”, dated July 25, 2017, available at usbs.bcaresearch.com US Bond Strategy Special Report, “More Bullets, Barbells And Butterflies”, dated May 15, 2018, available at usbs.bcaresearch.com Table 4 shows the raw residuals from each model. A positive value indicates that the bullet is cheap relative to the duration-matched barbell. A negative value indicates that the barbell is cheap relative to the bullet. Table 4Butterfly Strategy Valuation: Raw Residuals In Basis Points (As Of February 26TH, 2021)
Stay Bearish On Bonds
Stay Bearish On Bonds
Table 5 scales the raw residuals in Table 4 by their historical means and standard deviations. This facilitates comparison between the different butterfly spreads. Table 5Butterfly Strategy Valuation: Standardized Residuals (As Of February 26TH, 2021)
Stay Bearish On Bonds
Stay Bearish On Bonds
Table 6 flips the models on their heads. It shows the change in the slope between the two barbell maturities that must be realized during the next six months to make returns between the bullet and barbell equal. For example, a reading of 39 bps in the 5 over 2/10 cell means that we would only expect the 5-year to outperform the 2/10 if the 2/10 slope steepens by more than 39 bps during the next six months. Otherwise, we would expect the 2/10 barbell to outperform the 5-year bullet. Table 6Discounted Slope Change During Next 6 Months (BPs)
Stay Bearish On Bonds
Stay Bearish On Bonds
Appendix B: Excess Return Bond Map The Excess Return Bond Map is used to assess the relative risk/reward trade-off between different sectors of the US bond market. It is a purely computational exercise and does not impose any macroeconomic view. The Map’s vertical axis shows 12-month expected excess returns. These are proxied by each sector’s option-adjusted spread. Sectors plotting further toward the top of the Map have higher expected returns and vice-versa. Our novel risk measure called the “Risk Of Losing 100 bps” is shown on the Map’s horizontal axis. To calculate it, we first compute the spread widening required on a 12-month horizon for each sector to lose 100 bps or more relative to a duration-matched position in Treasury securities. Then, we divide that amount of spread widening by each sector’s historical spread volatility. The end result is the number of standard deviations of 12-month spread widening required for each sector to lose 100 bps or more versus a position in Treasuries. Lower risk sectors plot further to the right of the Map, and higher risk sectors plot further to the left. Chart 11Excess Return Bond Map (As Of February 26th, 2021)
Stay Bearish On Bonds
Stay Bearish On Bonds
Ryan Swift US Bond Strategist rswift@bcaresearch.com Footnotes 1 For a look at alternatives to investment grade corporates please see US Bond Strategy Weekly Report, “Searching For Value In Spread Product”, dated January 26, 2021, available at usbs.bcaresearch.com 2 Please see US Bond Strategy Special Report, “2021 Key Views: US Fixed Income”, dated December 15, 2020, available at usbs.bcaresearch.com 3 Please see US Investment Strategy Weekly Report, “The Big Bank Beige Book, January 2021”, dated January 25, 2021, available at usis.bcaresearch.com 4 Please see US Bond Strategy Weekly Report, “Searching For Value In Spread Product”, dated January 26, 2021, available at usbs.bcaresearch.com 5 https://www.bloomberg.com/news/articles/2021-02-25/convexity-hedging-haunts-markets-already-reeling-from-bond-rout?sref=Ij5V3tFi Fixed Income Sector Performance Recommended Portfolio Specification Corporate Sector Relative Valuation And Recommended Allocation
BCA Research’s Global Investment Strategy service concludes that the recent increase in real yields could put further downward pressure on equity prices in the near term. Bond yields have jumped in recent weeks. After bottoming at 0.52% in August, the US…
Dear Client, In addition to this week’s abbreviated report, we are sending you a Special Report on Bitcoin. I don’t recommend you buy it. Best regards, Peter Berezin Highlights Real government bond yields have increased in recent weeks, which could put further downward pressure on equity prices in the near term. Nevertheless, we continue to advocate overweighting equities over a 12-month horizon. Historically, rising real yields have been most toxic for stocks when yields have increased in response to hawkish central bank rhetoric. This is manifestly not the case today. The Fed’s accommodative stance should limit any near-term upward pressure on the US dollar. Investors should favor cyclical and value-oriented stocks over defensive and growth-geared plays. Higher Real Yields: A Near-Term Risk For Stocks Chart 1Government Bond Yields Have Increased Since Bottoming Last Year
Government Bond Yields Have Increased Since Bottoming Last Year
Government Bond Yields Have Increased Since Bottoming Last Year
Bond yields have jumped in recent weeks. After bottoming at 0.52% in August, the US 10-year Treasury yield has climbed to 1.54%, up from 0.93% at the beginning of the year. Government bond yields in the other major economies have also risen (Chart 1). While inflation expectations have bounced, the most recent increase in yields has been concentrated in the real component of bond yields (Chart 2). Optimism about a vaccine-led global growth recovery, reinforced by continued fiscal stimulus – especially in the US – has prompted investors to move forward their expectations of how soon and how high policy rates will rise (Chart 3). Chart 2AThe Real Component Has Fueled The Most Recent Rise In Bond Yields (I)
The Real Component Has Fueled The Most Recent Rise In Bond Yields (I)
The Real Component Has Fueled The Most Recent Rise In Bond Yields (I)
Chart 2BThe Real Component Has Fueled The Most Recent Rise In Bond Yields (II)
The Real Component Has Fueled The Most Recent Rise In Bond Yields (II)
The Real Component Has Fueled The Most Recent Rise In Bond Yields (II)
How menacing is the increase in bond yields to stock market investors? Chart 4 shows that there has been a close correlation between real yields and the forward P/E ratio at which the S&P 500 trades. The 5-year/5-year forward real yield, in particular, has moved up sharply, which could put further downward pressure on stocks in the near term. Chart 3Path Of Expected Policy Rates Being Revised Upwards
Path Of Expected Policy Rates Being Revised Upwards
Path Of Expected Policy Rates Being Revised Upwards
Chart 4Rise In Real Rates Is A Headwind For Equity Valuations
Rise In Real Rates Is A Headwind For Equity Valuations
Rise In Real Rates Is A Headwind For Equity Valuations
Nevertheless, we continue to advocate overweighting equities over a 12-month horizon. As we pointed out two weeks ago, rising real yields have historically been most toxic for stocks when yields have increased in response to hawkish central bank rhetoric. This is manifestly not the case today. In his testimony to Congress this week, Jay Powell downplayed inflation risks, stressing that the US economy was “a long way” from the Fed’s goals. He pledged to tread “carefully and patiently” and give “a lot of advance warning” before beginning the process of normalizing monetary policy. We expect the 10-year Treasury yield to stabilize in the 1.6%-to-1.7% range, still well below the level that would threaten the health of the economy. Favor Cyclical And Value-Oriented Stocks In A Weaker Dollar Environment The Fed’s accommodative stance should limit any near-term upward pressure on the US dollar. Whereas stocks are most sensitive to absolute changes in long-term real bond yields, the dollar is more sensitive to changes in short-term real rate differentials with US trading partners (Chart 5). Since the Fed is unlikely to tighten monetary policy anytime soon, US short-term real rates could fall further as inflation rises. Chart 5The Dollar Is Sensitive To Changes In Short-Term Real Rate Differentials
The Dollar Is Sensitive To Changes In Short-Term Real Rate Differentials
The Dollar Is Sensitive To Changes In Short-Term Real Rate Differentials
Chart 6Cyclical Stocks Tend To Benefit The Most From Stronger Global Growth And A Weaker Dollar
Cyclical Stocks Tend To Benefit The Most From Stronger Global Growth And A Weaker Dollar
Cyclical Stocks Tend To Benefit The Most From Stronger Global Growth And A Weaker Dollar
Cyclical stocks, which are overrepresented outside the US, tend to benefit the most from strengthening global growth and a weakening dollar (Chart 6). Value stocks also generally do well in a weak dollar-strong growth environment (Chart 7). Moreover, bank shares – which are concentrated in value indices – typically outperform when long-term bond yields are rising (Chart 8). Chart 7AA Weaker US Dollar And Stronger Global Growth Should Help Value Stocks (I)
A Weaker US Dollar And Stronger Global Growth Should Help Value Stocks (I)
A Weaker US Dollar And Stronger Global Growth Should Help Value Stocks (I)
Chart 7BA Weaker US Dollar And Stronger Global Growth Should Help Value Stocks (II)
A Weaker US Dollar And Stronger Global Growth Should Help Value Stocks (II)
A Weaker US Dollar And Stronger Global Growth Should Help Value Stocks (II)
Chart 8Bank Shares Typically Excel When Long-Term Bond Yields Are Rising
Bank Shares Typically Excel When Long-Term Bond Yields Are Rising
Bank Shares Typically Excel When Long-Term Bond Yields Are Rising
In contrast, as relatively long-duration assets, growth stocks often struggle when bond yields go up. The same is true for more speculative plays such as cryptocurrencies. In this week’s Special Report, we discuss the fate of Bitcoin, arguing that investors should resist buying it. Peter Berezin Chief Global Strategist pberezin@bcaresearch.com Global Investment Strategy View Matrix
When Good News Is Bad News
When Good News Is Bad News
Special Trade Recommendations
When Good News Is Bad News
When Good News Is Bad News
Current MacroQuant Model Scores
When Good News Is Bad News
When Good News Is Bad News
Highlights Higher yields in China should continue to encourage inflows into the RMB. However, the gap between Chinese and US/global interest rates will narrow. This will temper the pace of RMB appreciation. The RMB remains modestly undervalued. Higher productivity gains in China will raise the fair value of the currency. The US dollar could have entered a structural bear market. This will also buffet the CNY-USD exchange rate. A big driver for the RMB in the coming years will also be widespread diversification away from USD assets. This will dovetail nicely with the ascension of the RMB in global FX reserves. Feature Chart 1The RMB Often Moves With Relative Rates
The RMB Often Moves With Relative Rates
The RMB Often Moves With Relative Rates
The appreciation in the Chinese yuan has been a boon for global bond, equity and currency investors. With extremely low volatility, the yuan has appreciated by approximately 10% since its May 2020 lows. This places the rise in the RMB on par with what we saw in the 2017/2018 period. It also makes the yuan one of the best performing emerging market currencies this year. One of the key drivers of the yuan’s stellar performance has been the interest rate gap between China and the US (Chart 1). The Chinese economy was one of the first to emerge from the pandemic-driven lockdown. As economic activity recovered, so did local bond yields. With global bond yields now on the rise, this raises the specter that Sino-global bond yield spreads will narrow. The implications for the path of the Chinese yuan are worth monitoring. On the other hand, structural factors also argue that the path of least resistance for the US dollar over the next few years is down. This is positive for the Chinese yuan. Which force will dominate the path of the RMB going forward? In this Special Report, we discuss the intersection between the People’s Bank of China (PBoC) monetary policy and the global environment, and what that means for the Chinese yuan on a 12-month horizon. China And The Global Cycle The evolution of the global economic cycle has important implications for the yuan exchange rate in particular, because the RMB is a pro-cyclical currency. The USD/CNY has been moving tick for tick with emerging market equities, Asian currencies and commodity prices (Chart 2). Meanwhile, China has also been a major engine for global growth. Ever since the global financial crisis, the money and credit cycle in China has led the global recovery (Chart 3). With the authorities set to modestly decelerate the pace of credit creation, it will be important to gauge if this is a risk to global growth and, by extension, the path of the RMB. Chart 2The RMB Has Traded Like A Pro-cyclical Currency
The RMB Has Traded Like A Pro-cyclical Currency
The RMB Has Traded Like A Pro-cyclical Currency
Chart 3The Chinese Impulse Leads ##br##The Global Cycle
The Chinese Impulse Leads The Global Cycle
The Chinese Impulse Leads The Global Cycle
In our view, while the credit impulse in China will roll over, the impact will be to slow the pace of RMB appreciation rather than reverse it, because: The interest rate gap between China and the rest of the world will remain very wide. The current level of 10-year yields in China is 3.3% versus 1.4% in the US. In a world of very low nominal interest rates, a differential of almost 200 basis points makes all the difference. Our base case is that the Chinese credit impulse could slow to 30% of GDP. If past is prologue, this could compress the yield spread to 1.5% but will still provide a meaningful yield pickup for foreign investors (Chart 4). Meanwhile, the real rate differential between China and the US might not narrow much if China continues to reign in credit growth, while the US pursues inflationary policies. Already, inflation in China is collapsing relative to the US, which supports relative real rates in China. The credit impulse tends to lead the economy by six to nine months, thus, for much of 2021, Chinese growth will remain robust. Overall industrial production is picking up meaningfully, with the production of electricity and steel, and all inputs into the overall manufacturing value chain inflecting higher. This will continue to support bond yields in China (Chart 5). In recent weeks, both steel and iron ore prices have been soaring. While supply bottlenecks are playing a role, it is evident from both the manufacturing data and the trend in prices that demand is also a key driver (Chart 6). Chart 4The China-US Spread Will Stay Positive
The China-US Spread Will Stay Positive
The China-US Spread Will Stay Positive
Chart 5Underlying Economic Activity Is Resilient
Underlying Economic Activity Is Resilient
Underlying Economic Activity Is Resilient
Chart 6Strong Chinese Demand For Commodities
Strong Chinese Demand For Commodities
Strong Chinese Demand For Commodities
China has had a structurally higher productivity growth rate compared to the US or Europe for many years, which will continue. It is also the reason why the fair value of the currency has been rising over the last two decades (Chart 7). Higher productivity growth suggests the neutral rate of interest in China will remain high for many years and will attract further fixed income inflows. China is running a basic balance surplus, which indicates that the RMB does not need to cheapen to entice capital inflows (Chart 8). Chart 7The RMB Is Not Overvalued
The RMB Is Not Overvalued
The RMB Is Not Overvalued
Chart 8A Basic Balance Surplus
A Basic Balance Surplus
A Basic Balance Surplus
Chinese bonds are gaining wider investor appeal. Following their inclusion in the Bloomberg Barclays Global Aggregate Index (BBGA) since April 2019, and in the JP Morgan Government Bond - Emerging Market Index (GBI-EM) since February 2020, FTSE Russell announced the inclusion of Chinese government bonds in the FTSE World Government Bond Index (WGBI) as of October 2021. The inclusion of Chinese government bonds in all of the world’s three major bond indices is a seminal milestone in the process of liberalizing the Chinese fixed-income market. Based on both the US$2-4 trillion in AUM, tracking the WGBI index and a 5-6% weight of Chinese bonds, an additional US$150 billion in foreign investments will flow into China’s bond market following the WGBI inclusion. Moreover, the JPMorgan Global Index team predicts that the inclusion of Chinese bonds in the world’s three major bond indices will bring RMB inflows of up to US$250-300 billion. This will be particularly true if Chinese bonds are perceived as a better hedge against equity volatility (Chart 9). Finally, currencies respond to relative rates of return, which include equity returns in addition to fixed income ones. The relative performance of the Chinese equity market in common currency terms has also moved neck and neck with the performance of the RMB (Chart 10). Chart 9Chinese Bonds Could Become The Perfect Hedge
Chinese Bonds Could Become The Perfect Hedge
Chinese Bonds Could Become The Perfect Hedge
Chart 10The RMB Follows Domestic Equity Relative Performance
The RMB Follows Domestic Equity Relative Performance
The RMB Follows Domestic Equity Relative Performance
Bottom Line: Even though the Chinese credit impulse will continue to roll over, bond investors will still benefit from enticing real interest rates in China as its neutral rate of interest is higher. Equity investors will also benefit from a cheaper market, as well as exposure to sectors that are primed to benefit as the global economy reopens. This combination will sustain the pace of foreign capital inflows (Chart 11). Chart 11Inflows Into China Remain Strong
Inflows Into China Remain Strong
Inflows Into China Remain Strong
The Dollar Versus The RMB The path of the RMB in the short-term will follow relative growth dynamics between China and the rest of the world, but structural factors such as the dollar’s reserve status will also dictate its longer-term trend. What China (and other countries for that matter) decide to do with their war chest of US Treasuries is of critical importance. In recent years, foreign investors have been fleeing the US Treasury market at an exceptional pace. On a rolling 12-month total basis, the US saw an exodus of about US$500 billion in bond flows from foreigners, the largest on record (Chart 12). Vis-à-vis official flows, China has become the number one contributor to the US trade deficit. Concurrently, Beijing has been destocking its holdings of Treasuries, if only as retaliation against past US policies, or perhaps to make room for the internationalization of the RMB (Chart 13). Chart 12An Exodus From US Treasurys
An Exodus From US Treasurys
An Exodus From US Treasurys
Chart 13China Destocking Of Treasurys
China Destocking Of Treasurys
China Destocking Of Treasurys
Data from the International Monetary Fund (IMF) shows that the allocation of global foreign exchange reserves towards the US dollar peaked at about 72% in the early 2000s and has been in a downtrend since. Meanwhile, allocation to other currencies, including the RMB, is surging. Moreover, foreign central banks have been amassing tremendous gold reserves, notably Russia and China, almost to the tune of the total annual output of the yellow metal. A diversification away from dollars and into other currencies such as the RMB and gold will be a key factor in dictating currency trends in the next few years (Chart 14). Chart 14The RMB Rises In Global Currency Reserves
The RMB Rises In Global Currency Reserves
The RMB Rises In Global Currency Reserves
The US dollar will remain the reserve currency of the world for years to come, but that exorbitant privilege is clearly fraying at the edges. This is especially the case as balance-of-payments dynamics are deteriorating. Rising US twin deficits have usually been synonymous with a cheapening dollar. Bottom line: For one reason or another, foreign central banks are diversifying out of dollars. This could be a long-term trend, which will dictate the path of the dollar (and by extension the RMB) in the years to come. Other Considerations Chart 15A Forward Discount On The RMB
A Forward Discount On The RMB
A Forward Discount On The RMB
The RMB has historically suffered from capital outflows, especially illicit flows. This is less risky today than in 2015-2016.1 Nonetheless, investors must monitor this possibility. Typically, offshore markets have anticipated the yuan’s depreciation. Back in 2014, offshore markets started pricing in a rising USD/CNY rate, and maintained that view all the way through to 2018, when the yuan eventually bottomed. Right now, 12-month non-deliverable forwards expect a modest depreciation in the yuan (Chart 15). Offshore markets in Hong Kong and elsewhere can be prescient because more often than not, they are the destination for illicit flows out of China. However, this time might be different. First, higher relative interest rates in China have lowered the forward RMB rate investors will receive to hedge currency exposure. Second, junkets (key operators in Macau casinos) have been one of the often-rumored vehicles used for Chinese money to leave the country.2 These junkets bankroll their Chinese clients in Macau while collecting any debts in China, allowing for illicit capital outflows. This was particularly rampant before the Chinese 2015-2016 corruption clampdown, when Macau casino equities were surging while equity prices in China were subdued. This time around, with tourism taking a backseat, the Chinese MSCI index is heavily outpacing the performance of Macau casino stocks, suggesting little evidence of hot money outflows (Chart 16). Chart 16China Versus Macau Stocks: Little Hot Money Outflows Like In 2013/2014
China Versus Macau Stocks: Little Hot Money Outflows Like In 2013/2014
China Versus Macau Stocks: Little Hot Money Outflows Like In 2013/2014
Sino-US trade relations will also affect the exchange rate. China remains the biggest contributor to the US trade deficit, even though the gap has narrowed (Chart 17). There is little evidence that the Biden administration will engage in an all-out trade war with China, but the case for subtle skirmishes exists. Chart 17The US Trade Deficit With China Remains Wide
The US Trade Deficit With China Remains Wide
The US Trade Deficit With China Remains Wide
In a broader sense, the pandemic might have supercharged the de-globalization trend witnessed since 2011. The stability and self-sufficiency in the production capacity of any country's core supply chain have become paramount. From the perspective of the US, this means introducing more policies that attract investment into domestic manufacturing, such as clean energy. US multinational companies may also continue to diversify production risk away from China to other emerging countries, among them Vietnam, Myanmar, and India. This will curtail FDI flows into China at the margin (previously mentioned Chart 8). Concluding Thoughts Chart 18The RMB And The Trade-Weighted Dollar
The RMB And The Trade-Weighted Dollar
The RMB And The Trade-Weighted Dollar
While USD/CNY could bounce in the near term, it is likely to reach 6.2 in the next 12 months. Interest rate spreads at the long end already overtook their 2017 highs and are near cyclically elevated levels. The bond market tends to lead the currency market by a few months, since China does not yet have a fully flexible and open capital account. Meanwhile, the path of the US dollar will also be critical for the USD/CNY exchange rate. We expect the USD to keep depreciating, which will boost the RMB (Chart 18).3 A slower pace of RMB appreciation will fend off interventionist policies by the PBoC. While the exchange rate has appreciated sharply since mid-2020, the CFETS rate has not deviated much from the onshore USD/CNY rate. This will remain the case if the pace of RMB appreciation moderates. Chester Ntonifor Foreign Exchange Strategist chestern@bcaresearch.com Footnotes 1 Please see Chinese Investment Special Report, titled “Monitoring Chinese Capital Outflows,” dated March 20, 2019, available at fes.bcaresearch.com. 2 Please see Reuters article “Factbox: How Macau’s casino junket system works,” available at reuters.com. 3 Please see Foreign Exchange Strategy Special Report, titled “2021 Key Views: Tradeable Themes,” dated December 4, 2020, available at bcaresearch.com. Trades & Forecasts Forecast Summary Core Portfolio Tactical Trades Limit Orders Closed Trades
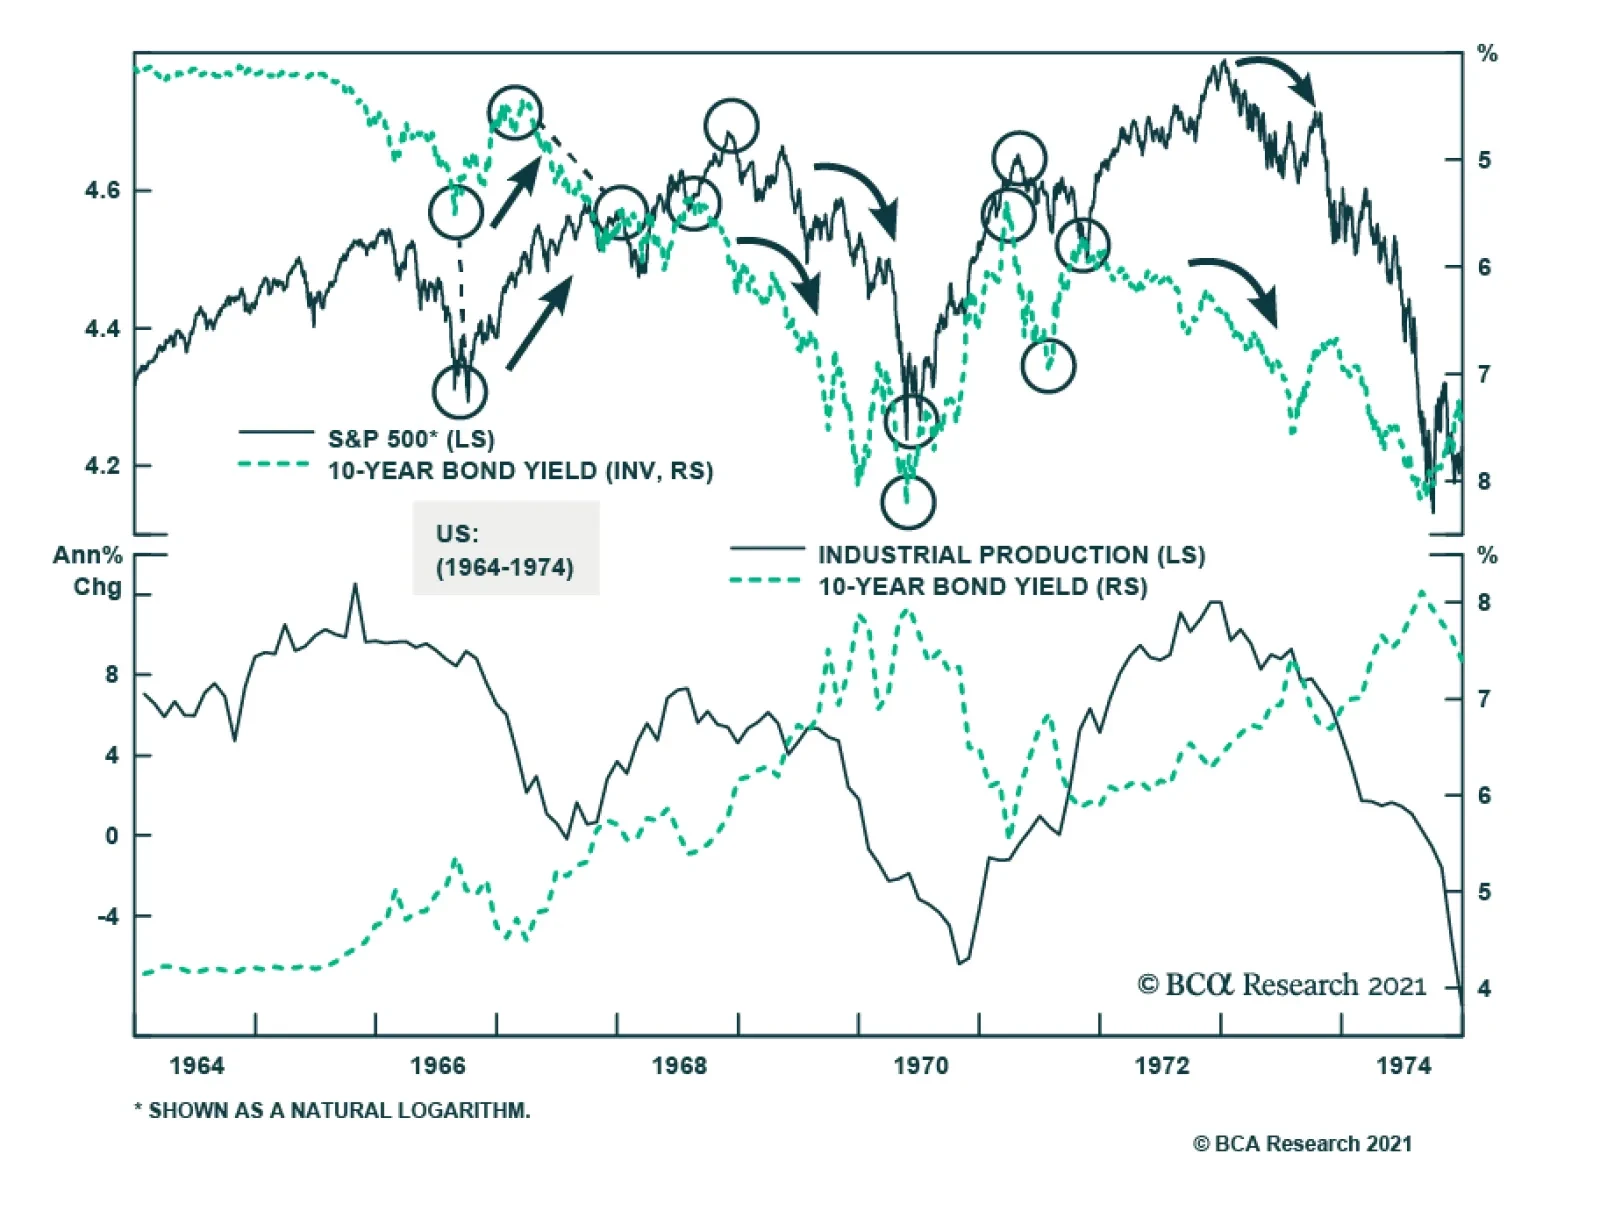
BCA Research’s Emerging Markets Strategy service concludes that there are many similarities between the current US macro picture and the late 1960s. In the late 1960s, US inflation was subdued, and interest rates were very low in the preceding two-three…
For this month’s Special Report, we are sending you a collaboration between our US Investment Strategy and US Political Strategy teams. US Political Strategy is our newest strategy service and it extends the proprietary framework of our Geopolitical Strategy service to provide analysis of political developments that is relevant for US-focused investors. Please contact your relationship manager if you would like more information or to begin trialing the service. Highlights Ronald Reagan cast a long shadow over the elected officials who followed him … :The influence of the economic policies associated with Ronald Reagan held such persistent sway that even the Clinton and Obama administrations had to follow their broad outlines. … just as Paul Volcker did over central bankers at home and abroad … : The Volcker Fed’s uncompromising resistance to the 1970s’ runaway inflation established the Fed’s credibility and enshrined a new global central banking orthodoxy. … but it appears their enduring influence may have finally run its course … : The pandemic overrode everything else in real time, but investors may ultimately view 2020 as the year in which Democrats broke away from post-Reagan orthodoxy and the Fed decided Volcker’s vigilance was no longer relevant. … to investors’ potential chagrin: If inflation, big government and organized labor come back from the dead, globalization loses ground, regulation expands, anti-trust enforcement regains some bite and tax rates rise and become more progressive, then the four-decade investment golden age that Reagan and Volcker helped launch may be on its last legs. Feature The pandemic dominated everything in real time in 2020, as investors scrambled to keep up with its disruptions and the countermeasures policymakers deployed to shelter the economy from them. With some distance, however, investors may come to view it as a year of two critical policy inflection points: the end of the Reagan fiscal era and the end of the Volcker monetary era. The shifts could mark a watershed because Reagan’s and Volcker’s enduring influence helped power an investment golden age that has lasted for nearly 40 years. What comes next may not be so supportive for financial markets. Political history often unfolds in cycles even if their starting and ending dates are never as clear cut in real life as they are in dissertations. Broadly, the FDR administration kicked off the New Deal era, a 48-year period of increased government involvement in daily life via the introduction and steady expansion of the social safety net, broadened regulatory powers and sweeping worker protections. It was followed by the 40-year Reagan era, with a continuous soundtrack of limited government rhetoric made manifest in policies that sought to curtail the spread of social welfare programs, deregulate commercial activity, devolve power to state and local government units and the private sector and push back against unions. The Obama and Trump administrations challenged different aspects of Reaganism, but the 2020 election cycle finally toppled it. Ordinarily, that might only matter to historians and political scientists, but the Reagan era coincided with a fantastic run in financial markets. So, too, did the inflation vigilance that lasted long after Paul Volcker’s 1979-1987 tenure at the helm of the Federal Reserve, which drove an extended period of disinflation, falling interest rates and rising central bank credibility. Our focus here is on fiscal policy, and we touch on monetary policy only to note that last summer’s revision of the Fed’s statement of long-run monetary policy goals shut the door on the Volcker era. The end of both eras could mark an inflection point in the trajectory of asset returns. The Happy Warrior The nine most terrifying words in the English language are, “I’m from the government, and I’m here to help.”1 Chart II-1After The Recession, Reagan Was A Hit
After The Recession, Reagan Was A Hit
After The Recession, Reagan Was A Hit
Ronald Reagan held his conservative views with the zeal of the convert that he was.2 Those views were probably to the right of much of the electorate, but his personal appeal was strong enough to make them palatable to a sizable majority (Chart II-1). Substitute “left” for “right” and the sentiment just as easily sums up FDR’s ability to get the New Deal off the ground. Personal magnetism played a big role in each era’s rise, with both men radiating relatability and optimism that imbued their sagging fellow citizens with a sense of comfort and security that made them willing to try something very different. 1980 was hardly 1932 on the distress scale, but America was in a funk after the upheaval of the sixties, the humiliating end to Vietnam, Watergate, stagflation and a term and a half of uninspiring and ineffectual presidential leadership. Enter the Great Communicator, whose initial weekly radio address evoked the FDR of the Fireside Chats – jovial, resolute and confident, with palpable can-do energy – buffed to a shine by a professional actor and broadcaster whose vocal inflections hit every mark.3 The Gipper,4 with his avuncular bearing, physical robustness and ever-present twinkle in his eye, was just what the country needed to feel better about itself. Reaganomics 101 Government does not tax to get the money it needs; government always finds a need for the money it gets.5 President Reagan’s economic plan had three simple goals: cut taxes, tame government spending and reduce regulation. From the start of his entry into politics in the mid-sixties, Reagan cast himself as a defender of hard-working Americans’ right to keep more of the fruits of their labor from a grasping federal government seeking funding for wasteful, poorly designed programs. He harbored an intense animus for LBJ’s Great Society, which extended the reach of the federal government in ways that he characterized as a drag on initiative, accomplishment and freedom, no matter how well intentioned it may have been. That message hung a historic loss on Barry Goldwater in 1964 when inflation was somnolent but it proved to be far more persuasive after the runaway inflation of the seventies exposed the perils of excessive government (Chart II-2). Chart II-2Inflation Rises When The Labor Market Heats Up
Inflation Rises When The Labor Market Heats Up
Inflation Rises When The Labor Market Heats Up
As the Reagan Foundation website describes the impact of his presidency’s economic policies, “Millions … were able to keep more of the money for which they worked so hard. Families could reliably plan a budget and pay their bills. The seemingly insatiable Federal government was on a much-needed diet. And businesses and individual entrepreneurs were no longer hassled by their government, or paralyzed by burdensome and unnecessary regulations every time they wanted to expand.” “In a phrase, the American dream had been restored.” The Enduring Reach Of Reaganomics I’m not in favor of abolishing the government. I just want to shrink it down to the size where we can drown it in the bathtub. – Grover Norquist Though President-Elect Clinton bridled at limited government’s inherent restrictions, bursting out during a transition briefing, “You mean to tell me that the success of the economic program and my re-election hinges on the Federal Reserve and a bunch of f***ing bond traders?” his administration largely observed them. This was especially true after the drubbing Democrats endured in the 1994 midterms, when the Republicans captured their first House majority in four decades behind the Contract with America, a skillfully packaged legislative agenda explicitly founded on Reagan principles. Humbled in the face of Republican majorities in both houses of Congress, and hemmed in by roving bands of bond vigilantes, Clinton was forced to tack to the center. James Carville, a leading architect of Clinton’s 1992 victory, captured the moment, saying, “I used to think that if there was reincarnation, I wanted to come back as the president or the pope or … a .400 … hitter. But now I would like to come back as the bond market. You can intimidate everybody.” Reagan’s legacy informed the Bush administration’s sweeping tax cuts (and its push to privatize social security), and forced the Obama administration to tread carefully with the stimulus package it devised to combat the Great Recession. Although the administration’s economic advisors considered the $787 billion (5%-of-peak-GDP) bill insufficient, political staffers carried the day and the price tag was kept below $800 billion to appease the three Republican senators whose votes were required to pass it. Even with the economy in its worst state since the Depression, the Obama administration had to acquiesce to Reaganite budget pieties if it wanted any stimulus bill at all. Its leash got shorter after it agreed with House Republicans to “sequester” excess spending under the Budget Control Act of 2011. On the Republican side of the aisle, Grover Norquist, who claims to have founded Americans for Tax Reform (ATR) at Reagan’s request, enforced legislative fealty to the no-new-tax mantra. ATR, which opposes all tax increases as a matter of principle, corrals legislators with the Taxpayer Protection Pledge, “commit[ting] them to oppose any effort to increase income taxes on individuals and businesses.” ATR’s influence has waned since its 2012 peak, when 95% of Republicans in Congress had signed the pledge, and Norquist no longer strikes fear in the hearts of Republicans inclined to waver on taxes. His declining influence is testament to Reaganism’s success on the one hand (the tax burden has already been reduced) and the fading appeal of its signature fiscal restraint on the other. Did Government Really Shrink? When the legend becomes fact, print the legend. – The Man Who Shot Liberty Valance For all of its denunciations of government spending, the Reagan administration ran up the largest expansionary budget deficits (as a share of GDP) of any postwar administration until the global financial crisis (Chart II-3). Although it aggressively slashed non-defense discretionary spending, it couldn’t cut enough to offset the Pentagon’s voracious appetite. The Reagan deficits were not all bad: increased defense spending hastened the end of the Cold War, so they were in a sense an investment that paid off in the form of the ‘90s peace dividend and the budget surpluses it engendered. Chart II-3Cutting The Federal Deficit Is Harder Than It Seems
Cutting The Federal Deficit Is Harder Than It Seems
Cutting The Federal Deficit Is Harder Than It Seems
Nonetheless, the Reagan experience reveals the uncomfortable truth that there is little scope for any administration or Congressional session to cut federal spending. Mandatory entitlement spending on social security, Medicare and Medicaid constitutes the bulk of federal expenditures (Chart II-4) and they are very popular with the electorate, as the Trump campaign shrewdly recognized in the 2016 Republican primaries (Table II-1). Discretionary spending, especially ex-defense, is a drop in the bucket, thanks largely to a Reagan administration that already cut it to the bone (Chart II-5). Chart II-4The Relentless Rise In Mandatory Spending ...
The Relentless Rise In Mandatory Spending ...
The Relentless Rise In Mandatory Spending ...
Chart II-5Overwhlems Any Plausible Discretionary Cuts
Overwhlems Any Plausible Discretionary Cuts
Overwhlems Any Plausible Discretionary Cuts
Table II-1How Trump Broke Republican Orthodoxy On Entitlement Spending
March 2021
March 2021
The Reagan tax cuts therefore accomplished the easy part of the “starve the beast” strategy but his administration failed to make commensurate cuts in outlays (Chart II-6). If overall spending wasn’t cut amidst oppressive inflation, while the Great Communicator was in the Oval Office to make the case for it to a considerably more fiscally conservative electorate, there is no chance that it will be cut this decade. As our Geopolitical Strategy service has flagged for several years, the median US voter has moved to the left on economic policy. Reagan-era fiscal conservatism has gone the way of iconic eighties features like synthesizers, leg warmers and big hair, even if it had one last gasp in the form of the post-crisis “Tea Party” and Obama’s compromise on budget controls. Chart II-6Grover Norquist Is Going To Need A Bigger Bathtub
Grover Norquist Is Going To Need A Bigger Bathtub
Grover Norquist Is Going To Need A Bigger Bathtub
Do Republicans Still Want The Reagan Mantle? Chart II-7“Limited Government” Falling Out Of Fashion
March 2021
March 2021
Reaganism is dead, killed by a decided shift in broad American public opinion, and within the Republican and Democratic parties themselves. Americans are just as divided today as they were in Reagan’s era about the size of the government but the trend since the late 1990s is plainly in favor of bigger government (Chart II-7). Recent developments, including the 2020 election, reinforce our conviction that trend will not reverse any time soon. The Republicans are the natural heirs of Reagan’s legacy. Much of President Trump’s appeal to conservatives lay in his successful self-branding as the new Reagan. Though he lacked the Gipper’s charisma and affability, his unapologetic assertion of American exceptionalism rekindled some of the glow of Morning-in-America confidence. Following the outsider trail blazed by Reagan, he lambasted the Washington establishment and promised to slash bureaucracy, deregulate the economy and shake things up. Trump’s signature legislative accomplishment was the largest tax reform since Reagan’s in 1986. He oversaw defense spending increases to take on China, which he all but named the new “evil empire.”6 Like Reagan, he was willing to weather criticism for face-to-face meetings with rival nations’ dictators. Even his trade protectionism had more in common with the Reagan administration than is widely recognized.7 Chart II-8Reagan’s Amnesty On Immigration
March 2021
March 2021
But major differences in the two presidents’ policy portfolios underline the erosion of the Reagan legacy’s hold. President Trump outflanked his Republican competitors for the 2016 nomination by running against cutting government spending – he was the only candidate who opposed entitlement reform. His signature proposal was to stem immigration by means of a Mexican border wall. While Reagan had sought to crack down on illegal immigration, he pursued a compromise approach and granted amnesty to 2.9 million illegal immigrants living in America to pass the Immigration Reform and Control Act of 1986, sparing businesses from having to scramble to replace them (Chart II-8). While Reagan curtailed non-defense spending, Trump signed budget-busting bills with relish, even before the COVID pandemic necessitated emergency deficit spending. Trump tried to use the power of government to intervene in the economy and alienated the business community, which revered Reagan, with his scattershot trade war. Trump’s greater hawkishness on immigration and trade and his permissiveness on fiscal spending differentiated him from Reagan orthodoxy and signaled a more populist Republican Party. Chart II-9Trump Could Start Third Party, Give Democrats A Decade-Plus Ascendancy
March 2021
March 2021
More fundamentally, Trump represents a new strain of Republican that is at odds with the party’s traditional support for big business and disdain for big government. If he leads that strain to take on the party establishment by challenging moderate Republicans in primary elections and insisting on running as the party’s next presidential candidate, the GOP will be swimming upstream in the 2022 and 2024 elections. It is too soon to make predictions about either of these elections other than to say that Trump is capable of splitting the party in a way not seen since Ross Perot in the 1990s or Theodore Roosevelt in the early 1900s (Chart II-9).8 If he does so, the Democrats will remain firmly in charge and lingering Reaganist policies will be actively dismantled. Even if the party manages to preserve its fragile Trumpist/traditionalist coalition, it is hard to imagine it will recover its appetite for shrinking entitlements, siding against labor or following a laissez-faire approach to corporate conduct and combinations. Republicans will pay lip service to fiscal restraint but Trump’s demonstration that austerity does not win votes will lead them to downplay spending cuts and entitlement reform as policy priorities – at least until inflation again becomes a popular grievance (Chart II-10). Republicans will also fail to gain traction with voters if they campaign merely on restoring the Trump tax cuts after Biden’s likely partial repeal of them. Support for the Tax Cut and Jobs Act hardly reached 40% for the general public and 30% for independents and it is well known that the tax reform did little to help Republicans in the 2018 midterm elections, when Democrats took the House (Chart II-11). Chart II-10Republicans Have Many Priorities Above Budget Deficits
March 2021
March 2021
Chart II-11Trump Tax Cuts Were Never Very Popular
March 2021
March 2021
On immigration the Republican Party will follow Trump and refuse amnesty. Immigration levels are elevated and Biden’s lax approach to the border, combined with a looming growth disparity with Latin America, will generate new waves of incomers and provoke a Republican backlash. On trade and foreign policy, Republicans will follow a synthesis of Reagan and Trump in pursuing a cold war with China. The Chinese economy is set to surpass the American economy by the year 2028 and is already bigger in purchasing power parity terms (Chart II-12). The Chinese administration is becoming more oppressive at home, more closed to liberal and western ideas, more focused on import substitution, and more technologically ambitious. The Chinese threat will escalate in the coming decade and the Republican Party will present itself as the anti-communist party by proposing a major military-industrial build-up. Yet it is far from assured that the Democrats will be soft on China, which is to say that they will not be able to cut defense spending substantially. Chart II-12China Is the New "Evil Empire" For GOP
China Is the New "Evil Empire" For GOP
China Is the New "Evil Empire" For GOP
Will Biden Take Up The Cause? One might ask if the Biden administration might seek to adopt some elements of the Reagan program. President Biden is among the last of the pro-market Democrats who emerged in the wake of the Reagan revolution. Those “third-way” Democrats thrived in the 1990s by accommodating themselves to Reagan’s free-market message while maintaining there was a place for a larger federal role in certain aspects of the economy and society. The 2020 election demonstrated that the Democrats’ political base is larger than the Republicans’ and third-way policies could be a way to make further inroads with affluent suburbanites who helped deliver Georgia and Virginia. Alas, the answer appears to be no. The Democrats’ base increasingly abhors Reagan-era economic and social policies, and the country’s future demographic changes reinforce the party’s current, progressive trajectory. That means fiery younger Democrats don’t have to compromise their principles with third-way policies when they can just wait for Texas to turn blue. Chart II-13Democrats Look To New Deal, Eschew ‘Third Way’
March 2021
March 2021
Biden has only been in office for one month but a rule of thumb is that his party will pull him further to the left the longer Republicans remain divided and ineffective. His cabinet appointments have been center-left, not far-left, though his executive orders have catered to the far-left, particularly on immigration. In order to pass his two major legislative proposals through an evenly split Senate he must appeal to Democratic moderates, as every vote in the party will be needed to get the FY2021 and FY2022 budget reconciliation bills across the line, with Vice President Kamala Harris acting as the Senate tie breaker. Nevertheless his agenda still highlights that the twenty-first century Democrats are taking a page out of the FDR playbook and unabashedly promoting big government solutions (Chart II-13). Biden’s $1.9 trillion American Rescue Plan is not only directed at emergency pandemic relief but also aims to shore up state and local finances, education, subsidized housing, and child care. His health care proposals include a government-provided insurance option (originally struck from the Affordable Care Act to secure its passage in 2010) and a role for Medicare in negotiating drug prices. And his infrastructure plan is likely to provide cover for a more ambitious set of green energy projects that will initiate the Democratic Party’s next big policy pursuit after health care: environmentalism. The takeaway is not that Biden’s administration is necessarily radical – he eschews government-administered health care and is only proposing a partial reversal of Trump’s tax cuts – but rather that his party has taken a decisive turn away from the “third-way” pragmatism that defined his generation of Democrats in favor of a return to the “Old-Left” and pro-labor policies of the New Deal era (Chart II-14). The party has veered to the left in reaction to the Iraq War, the financial crisis, and Trumpism. Vice President Harris, Biden’s presumptive heir, had the second-most progressive voting record during her time in the Senate and would undoubtedly install a more progressive cabinet. Table II-2 shows her voting record alongside other senators who ran against Biden in the Democratic primary election. All of them except perhaps Senator Amy Klobuchar stood to his left on the policy spectrum. Chart II-14Democrats Eschew Budget Constraints
March 2021
March 2021
Fundamentally the American electorate is becoming more open to a larger role for the government in the economy and society. While voters almost always prioritize the economy and jobs, policy preferences have changed. The morass of excessive inflation, deficits, taxation, regulation, strikes and business inefficiencies that gave rise to the Reagan movement is not remembered as ancient history – it is not even remembered. The problems of slow growth, inadequate health and education, racial injustice, creaky public services, and stagnant wages are by far the more prevalent concerns – and they require more, not less, spending and government involvement (Chart II-15). Insofar as voters worry about foreign threats they focus on the China challenge, where Biden will be forced to adopt some of Trump’s approach. Table II-2Harris Stood To The Left Of Democratic Senators
March 2021
March 2021
Chart II-15Public Concern For Economy Means Greater Government Help
March 2021
March 2021
When inflation picks up in the coming years, voters will not reflexively ask for government to be pared back so that the economy becomes more efficient, as they did once they had a taste of Reagan’s medicine in the early 1980s. Rather, they will ask the government to step in to provide higher wages, indexation schemes, price caps, and assistance for labor, as is increasingly the case. The ruling party will be offering these options and the opposition Republicans will render themselves obsolete if they focus single-mindedly on austerity measures. Americans will have to experience a recession caused by inflation – i.e. stagflation – before they call for anything resembling Reagan again. The Post-Reagan Market Landscape Many investors and conservative economists were shocked9 that the Bernanke Fed’s mix of zero interest rates and massive securities purchases did not foster runaway inflation and destroy the dollar. They failed to anticipate that widespread private-sector deleveraging would put a lid on money creation (and that other major central banks would follow in the Fed’s ZIRP and QE footsteps). But a longer view of four decades of disinflation suggests another conclusion: Taking away the monetary punch bowl when the labor party gets going and pursuing limited-government fiscal policy can keep inflation pressures from gaining traction. Globalization, technology-enabled elimination of many lower-skilled white-collar functions and the hollowing out of the organized labor movement all helped as well, though they helped foment a revolt among a meaningful segment of the Republican rank-and-file against Reagan-style policies. The Volcker Fed set the tone for pre-emptive monetary tightening and subsequent FOMCs have reliably intervened to cool off the economy when the labor market begins heating up. The Phillips Curve may be out of favor with investors, but wage inflation only gathers steam when the unemployment rate falls below its natural level (Chart II-16), and the Fed did not allow negative unemployment gaps to persist for very long in the Volcker era. Without wage inflation putting more money in the hands of a broad cross-section of households with a fairly high marginal propensity to consume, it’s hard to get inflation in consumer prices. Chart II-16Taking The Punch Bowl Away From The Union Hall
Taking The Punch Bowl Away From The Union Hall
Taking The Punch Bowl Away From The Union Hall
The Fed took the cyclical wind from the labor market’s sails but the Reagan administration introduced a stiff secular headwind when it crushed PATCO, the air traffic controllers’ union, in 1981, marking an inflection point in the relationship between management and labor. That watershed event opened the door for employers to deploy much rougher tactics against unions than they had since before the New Deal.10 Reagan’s championing of free markets helped establish globalization as an economic policy that the third-way Clinton administration eagerly embraced with NAFTA and a campaign to admit China to the WTO. The latter coincided with a sharp decline in labor’s share of income (Chart II-17). Chart II-17Outsourcing Has Not Been Good For US Labor
Outsourcing Has Not Been Good For US Labor
Outsourcing Has Not Been Good For US Labor
The core Reagan tenets – limited government, favoring management over labor, globalization, sleepy anti-trust enforcement, reduced regulation and less progressive tax systems with lower rates – are all at risk of Biden administration rollbacks. While the easy monetary/tight fiscal combination promoted a rise in asset prices rather than consumer prices ever since the end of the global financial crisis, today’s easy monetary/easy fiscal could promote consumer price inflation and asset price deflation. We do not think inflation will be an issue in 2021 but we expect it will in the later years of Biden’s term. Ultimately, we expect massive fiscal accommodation will stoke inflation pressures and those pressures, abetted by a Fed which has pledged not to pre-emptively remove accommodation when the labor market tightens, will eventually bring about the end of the bull market in risk assets and the expansion. Investment Implications Business revered the Reagan administration and investors rightfully associate it with the four-decade bull market that began early in its first term. Biden is no wild-eyed liberal, but rolling back core Reagan-era tenets has the potential to roll back juicy Reagan-era returns. Only equities have the lengthy data series to allow a full comparison of Reagan-era returns with postwar New Deal-era returns (Table II-3), but the path of Treasury bond yields in the three-decade bear market that preceded the current four-decade bull market suggests that bonds generated little, if any, real returns in the pre-Reagan postwar period (Chart II-18). Stagnant precious metal returns point to tame Reagan-era inflation and downward pressure on input costs. Table II-3Annualized Real Market Returns Before And After Reagan
March 2021
March 2021
Chart II-18Bond Investors Loved Volcker And The Gipper
Bond Investors Loved Volcker And The Gipper
Bond Investors Loved Volcker And The Gipper
Owning the market is not likely to be as rewarding going forward as it was in the Reagan era. Active management may again have its day in the sun as the end of the Reagan tailwinds open up disparities between sectors, sub-industries and individual companies. Even short-sellers may experience a renaissance. We recommend that multi-asset investors underweight bonds, especially Treasuries. We expect the clamor for bigger government will contribute to a secular bear market that could rival the one that persisted from the fifties to the eighties. Within Treasury portfolios, we would maintain below-benchmark duration and favor TIPS over nominal bonds at least until the Fed signals that its campaign to re-anchor inflation expectations higher has achieved its goal. Gold and/or other precious metals merit a place in portfolios as a hedge against rising inflation and other real assets, from land to buildings to other resources, are worthy of consideration as well. BCA has been cautioning of a downward inflection in long-run financial asset returns for a few years, based on demanding valuations and a steadily shrinking scope for ongoing declines in inflation and interest rates. Mean reversion has been part of the thesis as well; trees simply don’t grow to the sky. Now that the curtain has fallen on the Volcker and Reagan eras, the inevitable downward inflection has received a catalyst. We remain constructive on risk assets over the next twelve months, but we expect that intermediate- and long-term returns will fall well short of their post-1982 pace going forward. Doug Peta, CFA Chief US Investment Strategist dougp@bcaresearch.com Matt Gertken Vice President Geopolitical Strategy mattg@bcaresearch.com Footnotes 1 August 12, 1986 Press Conference News Conference | The Ronald Reagan Presidential Foundation & Institute (reaganfoundation.org), accessed February 4, 2021. Reagan makes the quip in his prepared opening remarks. 2 Reagan was a Democrat until he entered politics in his fifties. He claimed to have voted for FDR four times. 3 April 3, 1982 Radio Address President Reagan's Radio Address to the Nation on the Program for Economic Recovery - 4/3/82 - YouTube, accessed February 4, 2021. 4 As an actor, Reagan was perhaps best known for his portrayal of Notre Dame football legend George Gipp, who is immortalized in popular culture as the subject of the “win one for the Gipper” halftime speech. 5 July 22, 1981 White House Remarks to Visiting Editors and Broadcasters reaganfoundation.org, accessed February 8, 2021. 6 Reagan famously urged his followers, in reference to the USSR, “I urge you to beware the temptation of pride—the temptation of blithely declaring yourselves above it all and label both sides equally at fault, to ignore the facts of history and the aggressive impulses of an evil empire.” See his “Address to the National Association of Evangelicals,” March 8, 1983, voicesofdemocracy.umd.edu. 7 Robert Lighthizer, the Trump administration trade representative who directed its tariff battles, was a veteran of Reagan’s trade wars against Japan in the 1980s. 8 “Exclusive: The Trump Party? He still holds the loyalty of GOP voters,” USA Today, February 21, 2021, usatoday.com. 9 Open Letter to Ben Bernanke,” November 15, 2010. Open Letter to Ben Bernanke | Hoover Institution Accessed February 23, 2021. 10 Please see the following US Investment Strategy Special Reports, “Labor Strikes Back, Parts 1, 2 and 3,” dated January 13, January 20 and February 3, 2020, available at usis.bcaresearch.com.
Highlights Ronald Reagan cast a long shadow over the elected officials who followed him … : The influence of the economic policies associated with Ronald Reagan held such persistent sway that even the Clinton and Obama administrations had to follow their broad outlines. … just as Paul Volcker did over central bankers at home and abroad … : The Volcker Fed’s uncompromising resistance to the 1970s’ runaway inflation established the Fed’s credibility and enshrined a new global central banking orthodoxy. … but it appears their enduring influence may have finally run its course … : The pandemic overrode everything else in real time, but investors may ultimately view 2020 as the year in which Democrats broke away from post-Reagan orthodoxy and the Fed decided Volcker’s vigilance was no longer relevant. … to investors’ potential chagrin: If inflation, big government and organized labor come back from the dead, globalization loses ground, regulation expands, anti-trust enforcement regains some bite and tax rates rise and become more progressive, then the four-decade investment golden age that Reagan and Volcker helped launch may be on its last legs. Feature The pandemic dominated everything in real time in 2020, as investors scrambled to keep up with its disruptions and the countermeasures policymakers deployed to shelter the economy from them. With some distance, however, investors may come to view it as a year of two critical policy inflection points: the end of the Reagan fiscal era and the end of the Volcker monetary era. The shifts could mark a watershed because Reagan’s and Volcker’s enduring influence helped power an investment golden age that has lasted for nearly 40 years. What comes next may not be so supportive for financial markets. Political history often unfolds in cycles even if their starting and ending dates are never as clear cut in real life as they are in dissertations. Broadly, the FDR administration kicked off the New Deal era, a 48-year period of increased government involvement in daily life via the introduction and steady expansion of the social safety net, broadened regulatory powers and sweeping worker protections. It was followed by the 40-year Reagan era, with a continuous soundtrack of limited government rhetoric made manifest in policies that sought to curtail the spread of social welfare programs, deregulate commercial activity, devolve power to state and local government units and the private sector and push back against unions. The Obama and Trump administrations challenged different aspects of Reaganism, but the 2020 election cycle finally toppled it. Ordinarily, that might only matter to historians and political scientists, but the Reagan era coincided with a fantastic run in financial markets. So, too, did the inflation vigilance that lasted long after Paul Volcker’s 1979-1987 tenure at the helm of the Federal Reserve, which drove an extended period of disinflation, falling interest rates and rising central bank credibility. Our focus here is on fiscal policy, and we touch on monetary policy only to note that last summer’s revision of the Fed’s statement of long-run monetary policy goals shut the door on the Volcker era. The end of both eras could mark an inflection point in the trajectory of asset returns. The Happy Warrior The nine most terrifying words in the English language are, “I’m from the government, and I’m here to help.”1 Ronald Reagan held his conservative views with the zeal of the convert that he was.2 Those views were probably to the right of much of the electorate, but his personal appeal was strong enough to make them palatable to a sizable majority (Chart 1). Substitute “left” for “right” and the sentiment just as easily sums up FDR’s ability to get the New Deal off the ground. Personal magnetism played a big role in each era’s rise, with both men radiating relatability and optimism that imbued their sagging fellow citizens with a sense of comfort and security that made them willing to try something very different. Chart 1After The Recession, Reagan Was A Hit
After The Recession, Reagan Was A Hit
After The Recession, Reagan Was A Hit
1980 was hardly 1932 on the distress scale, but America was in a funk after the upheaval of the sixties, the humiliating end to Vietnam, Watergate, stagflation and a term and a half of uninspiring and ineffectual presidential leadership. Enter the Great Communicator, whose initial weekly radio address evoked the FDR of the Fireside Chats – jovial, resolute and confident, with palpable can-do energy – buffed to a shine by a professional actor and broadcaster whose vocal inflections hit every mark.3 The Gipper,4 with his avuncular bearing, physical robustness and ever-present twinkle in his eye, was just what the country needed to feel better about itself. Reaganomics 101 Government does not tax to get the money it needs; government always finds a need for the money it gets.5 President Reagan’s economic plan had three simple goals: cut taxes, tame government spending and reduce regulation. From the start of his entry into politics in the mid-sixties, Reagan cast himself as a defender of hard-working Americans’ right to keep more of the fruits of their labor from a grasping federal government seeking funding for wasteful, poorly designed programs. He harbored an intense animus for LBJ’s Great Society, which extended the reach of the federal government in ways that he characterized as a drag on initiative, accomplishment and freedom, no matter how well intentioned it may have been. That message hung a historic loss on Barry Goldwater in 1964 when inflation was somnolent but it proved to be far more persuasive after the runaway inflation of the seventies exposed the perils of excessive government (Chart 2). Chart 2Inflation Rises When The Labor Market Heats Up
Inflation Rises When The Labor Market Heats Up
Inflation Rises When The Labor Market Heats Up
As the Reagan Foundation website describes the impact of his presidency’s economic policies, “Millions … were able to keep more of the money for which they worked so hard. Families could reliably plan a budget and pay their bills. The seemingly insatiable Federal government was on a much-needed diet. And businesses and individual entrepreneurs were no longer hassled by their government, or paralyzed by burdensome and unnecessary regulations every time they wanted to expand.” “In a phrase, the American dream had been restored.” The Enduring Reach Of Reaganomics I’m not in favor of abolishing the government. I just want to shrink it down to the size where we can drown it in the bathtub. – Grover Norquist Though President-Elect Clinton bridled at limited government’s inherent restrictions, bursting out during a transition briefing, “You mean to tell me that the success of the economic program and my re-election hinges on the Federal Reserve and a bunch of f***ing bond traders?” his administration largely observed them. This was especially true after the drubbing Democrats endured in the 1994 midterms, when the Republicans captured their first House majority in four decades behind the Contract with America, a skillfully packaged legislative agenda explicitly founded on Reagan principles. Humbled in the face of Republican majorities in both houses of Congress, and hemmed in by roving bands of bond vigilantes, Clinton was forced to tack to the center. James Carville, a leading architect of Clinton’s 1992 victory, captured the moment, saying, “I used to think that if there was reincarnation, I wanted to come back as the president or the pope or … a .400 … hitter. But now I would like to come back as the bond market. You can intimidate everybody.” Reagan’s legacy informed the Bush administration’s sweeping tax cuts (and its push to privatize social security), and forced the Obama administration to tread carefully with the stimulus package it devised to combat the Great Recession. Although the administration’s economic advisors considered the $787 billion (5%-of-peak-GDP) bill insufficient, political staffers carried the day and the price tag was kept below $800 billion to appease the three Republican senators whose votes were required to pass it. Even with the economy in its worst state since the Depression, the Obama administration had to acquiesce to Reaganite budget pieties if it wanted any stimulus bill at all. Its leash got shorter after it agreed with House Republicans to “sequester” excess spending under the Budget Control Act of 2011. On the Republican side of the aisle, Grover Norquist, who claims to have founded Americans for Tax Reform (ATR) at Reagan’s request, enforced legislative fealty to the no-new-tax mantra. ATR, which opposes all tax increases as a matter of principle, corrals legislators with the Taxpayer Protection Pledge, “commit[ting] them to oppose any effort to increase income taxes on individuals and businesses.” ATR’s influence has waned since its 2012 peak, when 95% of Republicans in Congress had signed the pledge, and Norquist no longer strikes fear in the hearts of Republicans inclined to waver on taxes. His declining influence is testament to Reaganism’s success on the one hand (the tax burden has already been reduced) and the fading appeal of its signature fiscal restraint on the other. Did Government Really Shrink? When the legend becomes fact, print the legend. – The Man Who Shot Liberty Valance For all of its denunciations of government spending, the Reagan administration ran up the largest expansionary budget deficits (as a share of GDP) of any postwar administration until the global financial crisis (Chart 3). Although it aggressively slashed non-defense discretionary spending, it couldn’t cut enough to offset the Pentagon’s voracious appetite. The Reagan deficits were not all bad: increased defense spending hastened the end of the Cold War, so they were in a sense an investment that paid off in the form of the ‘90s peace dividend and the budget surpluses it engendered. Chart 3Cutting The Federal Deficit Is Harder Than It Seems
Cutting The Federal Deficit Is Harder Than It Seems
Cutting The Federal Deficit Is Harder Than It Seems
Nonetheless, the Reagan experience reveals the uncomfortable truth that there is little scope for any administration or Congressional session to cut federal spending. Mandatory entitlement spending on social security, Medicare and Medicaid constitutes the bulk of federal expenditures (Chart 4) and they are very popular with the electorate, as the Trump campaign shrewdly recognized in the 2016 Republican primaries (Table 1). Discretionary spending, especially ex-defense, is a drop in the bucket, thanks largely to a Reagan administration that already cut it to the bone (Chart 5). Chart 4The Relentless Rise In Mandatory Spending ...
The Relentless Rise In Mandatory Spending ...
The Relentless Rise In Mandatory Spending ...
Chart 5Overwhlems Any Plausible Discretionary Cuts
Overwhlems Any Plausible Discretionary Cuts
Overwhlems Any Plausible Discretionary Cuts
Table 1How Trump Broke Republican Orthodoxy On Entitlement Spending
Requiem For Volcker And The Gipper
Requiem For Volcker And The Gipper
The Reagan tax cuts therefore accomplished the easy part of the “starve the beast” strategy but his administration failed to make commensurate cuts in outlays (Chart 6). If overall spending wasn’t cut amidst oppressive inflation, while the Great Communicator was in the Oval Office to make the case for it to a considerably more fiscally conservative electorate, there is no chance that it will be cut this decade. As our Geopolitical Strategy service has flagged for several years, the median US voter has moved to the left on economic policy. Reagan-era fiscal conservatism has gone the way of iconic eighties features like synthesizers, leg warmers and big hair, even if it had one last gasp in the form of the post-crisis “Tea Party” and Obama’s compromise on budget controls. Chart 6Grover Norquist Is Going To Need A Bigger Bathtub
Grover Norquist Is Going To Need A Bigger Bathtub
Grover Norquist Is Going To Need A Bigger Bathtub
Do Republicans Still Want The Reagan Mantle? Reaganism is dead, killed by a decided shift in broad American public opinion, and within the Republican and Democratic parties themselves. Americans are just as divided today as they were in Reagan’s era about the size of the government but the trend since the late 1990s is plainly in favor of bigger government (Chart 7). Recent developments, including the 2020 election, reinforce our conviction that that trend will not reverse any time soon. The Republicans are the natural heirs of Reagan’s legacy. Much of President Trump’s appeal to conservatives lay in his successful self-branding as the new Reagan. Though he lacked the Gipper’s charisma and affability, his unapologetic assertion of American exceptionalism rekindled some of the glow of Morning-in-America confidence. Following the outsider trail blazed by Reagan, he lambasted the Washington establishment and promised to slash bureaucracy, deregulate the economy and shake things up. Chart 7"Limited Government" Falling Out Of Fashion
Requiem For Volcker And The Gipper
Requiem For Volcker And The Gipper
Trump’s signature legislative accomplishment was the largest tax reform since Reagan’s in 1986. He oversaw defense spending increases to take on China, which he all but named the new “evil empire.”6 Like Reagan, he was willing to weather criticism for face-to-face meetings with rival nations’ dictators. Even his trade protectionism had more in common with the Reagan administration than is widely recognized.7 But major differences in the two presidents’ policy portfolios underline the erosion of the Reagan legacy’s hold. President Trump outflanked his Republican competitors for the 2016 nomination by running against cutting government spending – he was the only candidate who opposed entitlement reform. His signature proposal was to stem immigration by means of a Mexican border wall. While Reagan had sought to crack down on illegal immigration, he pursued a compromise approach and granted amnesty to 2.9 million illegal immigrants living in America to pass the Immigration Reform and Control Act of 1986, sparing businesses from having to scramble to replace them (Chart 8). While Reagan curtailed non-defense spending, Trump signed budget-busting bills with relish, even before the COVID pandemic necessitated emergency deficit spending. Trump tried to use the power of government to intervene in the economy and alienated the business community, which revered Reagan, with his scattershot trade war. Trump’s greater hawkishness on immigration and trade and his permissiveness on fiscal spending differentiated him from Reagan orthodoxy and signaled a more populist Republican Party. More fundamentally, Trump represents a new strain of Republican that is at odds with the party’s traditional support for big business and disdain for big government. If he leads that strain to take on the party establishment by challenging moderate Republicans in primary elections and insisting on running as the party’s next presidential candidate, the GOP will be swimming upstream in the 2022 and 2024 elections. It is too soon to make predictions about either of these elections other than to say that Trump is capable of splitting the party in a way not seen since Ross Perot in the 1990s or Theodore Roosevelt in the early 1900s (Chart 9).8 If he does so, the Democrats will remain firmly in charge and lingering Reaganist policies will be actively dismantled. Chart 8Reagan’s Amnesty On Immigration
Requiem For Volcker And The Gipper
Requiem For Volcker And The Gipper
Chart 9Trump Could Start Third Party, Give Democrats A Decade-Plus Ascendancy
Requiem For Volcker And The Gipper
Requiem For Volcker And The Gipper
Even if the party manages to preserve its fragile Trumpist/traditionalist coalition, it is hard to imagine it will recover its appetite for shrinking entitlements, siding against labor or following a laissez-faire approach to corporate conduct and combinations. Republicans will pay lip service to fiscal restraint but Trump’s demonstration that austerity does not win votes will lead them to downplay spending cuts and entitlement reform as policy priorities – at least until inflation again becomes a popular grievance (Chart 10). Republicans will also fail to gain traction with voters if they campaign merely on restoring the Trump tax cuts after Biden’s likely partial repeal of them. Support for the Tax Cut and Jobs Act hardly reached 40% for the general public and 30% for independents and it is well known that the tax reform did little to help Republicans in the 2018 midterm elections, when Democrats took the House (Chart 11). Chart 10Republicans Have Many Priorities Above Budget Deficits
Requiem For Volcker And The Gipper
Requiem For Volcker And The Gipper
On immigration the Republican Party will follow Trump and refuse amnesty. Immigration levels are elevated and Biden’s lax approach to the border, combined with a looming growth disparity with Latin America, will generate new waves of incomers and provoke a Republican backlash. Chart 11Trump Tax Cuts Were Never Very Popular
Requiem For Volcker And The Gipper
Requiem For Volcker And The Gipper
On trade and foreign policy, Republicans will follow a synthesis of Reagan and Trump in pursuing a cold war with China. The Chinese economy is set to surpass the American economy by the year 2028 and is already bigger in purchasing power parity terms (Chart 12). The Chinese administration is becoming more oppressive at home, more closed to liberal and western ideas, more focused on import substitution, and more technologically ambitious. The Chinese threat will escalate in the coming decade and the Republican Party will present itself as the anti-communist party by proposing a major military-industrial build-up. Yet it is far from assured that the Democrats will be soft on China, which is to say that they will not be able to cut defense spending substantially. Chart 12China Is the New "Evil Empire" For GOP
China Is the New "Evil Empire" For GOP
China Is the New "Evil Empire" For GOP
Will Biden Take Up The Cause? One might ask if the Biden administration might seek to adopt some elements of the Reagan program. President Biden is among the last of the pro-market Democrats who emerged in the wake of the Reagan revolution. Those “third-way” Democrats thrived in the 1990s by accommodating themselves to Reagan’s free-market message while maintaining there was a place for a larger federal role in certain aspects of the economy and society. The 2020 election demonstrated that the Democrats’ political base is larger than the Republicans’ and third-way policies could be a way to make further inroads with affluent suburbanites who helped deliver Georgia and Virginia. Alas, the answer appears to be no. The Democrats’ base increasingly abhors Reagan-era economic and social policies, and the country’s future demographic changes reinforce the party’s current, progressive trajectory. That means fiery younger Democrats don’t have to compromise their principles with third-way policies when they can just wait for Texas to turn blue. Biden has only been in office for one month but a rule of thumb is that his party will pull him further to the left the longer Republicans remain divided and ineffective. His cabinet appointments have been center-left, not far-left, though his executive orders have catered to the far-left, particularly on immigration. In order to pass his two major legislative proposals through an evenly split Senate he must appeal to Democratic moderates, as every vote in the party will be needed to get the FY2021 and FY2022 budget reconciliation bills across the line, with Vice President Kamala Harris acting as the Senate tie breaker. Nevertheless his agenda still highlights that the twenty-first century Democrats are taking a page out of the FDR playbook and unabashedly promoting big government solutions (Chart 13). Chart 13Democrats Look To New Deal, Eschew 'Third Way'
Requiem For Volcker And The Gipper
Requiem For Volcker And The Gipper
Biden’s $1.9 trillion American Rescue Plan is not only directed at emergency pandemic relief but also aims to shore up state and local finances, education, subsidized housing, and child care. His health care proposals include a government-provided insurance option (originally struck from the Affordable Care Act to secure its passage in 2010) and a role for Medicare in negotiating drug prices. And his infrastructure plan is likely to provide cover for a more ambitious set of green energy projects that will initiate the Democratic Party’s next big policy pursuit after health care: environmentalism. The takeaway is not that Biden’s administration is necessarily radical – he eschews government-administered health care and is only proposing a partial reversal of Trump’s tax cuts – but rather that his party has taken a decisive turn away from the “third-way” pragmatism that defined his generation of Democrats in favor of a return to the “Old-Left” and pro-labor policies of the New Deal era (Chart 14). The party has veered to the left in reaction to the Iraq War, the financial crisis, and Trumpism. Vice President Harris, Biden’s presumptive heir, had the second-most progressive voting record during her time in the Senate and would undoubtedly install a more progressive cabinet. Table 2 shows her voting record alongside other senators who ran against Biden in the Democratic primary election. All of them except perhaps Senator Amy Klobuchar stood to his left on the policy spectrum. Chart 14Democrats Eschew Budget Constraints
Requiem For Volcker And The Gipper
Requiem For Volcker And The Gipper
Fundamentally the American electorate is becoming more open to a larger role for the government in the economy and society. While voters almost always prioritize the economy and jobs, policy preferences have changed. The morass of excessive inflation, deficits, taxation, regulation, strikes and business inefficiencies that gave rise to the Reagan movement is not remembered as ancient history – it is not even remembered. The problems of slow growth, inadequate health and education, racial injustice, creaky public services, and stagnant wages are by far the more prevalent concerns – and they require more, not less, spending and government involvement (Chart 15). Insofar as voters worry about foreign threats they focus on the China challenge, where Biden will be forced to adopt some of Trump’s approach. Table 2Harris Stood To The Left Of Democratic Senators
Requiem For Volcker And The Gipper
Requiem For Volcker And The Gipper
Chart 15Public Concern For Economy Means Greater Government Help
Requiem For Volcker And The Gipper
Requiem For Volcker And The Gipper
When inflation picks up in the coming years, voters will not reflexively ask for government to be pared back so that the economy becomes more efficient, as they did once they had a taste of Reagan’s medicine in the early 1980s. Rather, they will ask the government to step in to provide higher wages, indexation schemes, price caps, and assistance for labor, as is increasingly the case. The ruling party will be offering these options and the opposition Republicans will render themselves obsolete if they focus single-mindedly on austerity measures. Americans will have to experience a recession caused by inflation – i.e. stagflation – before they call for anything resembling Reagan again. The Post-Reagan Market Landscape Many investors and conservative economists were shocked9 that the Bernanke Fed’s mix of zero interest rates and massive securities purchases did not foster runaway inflation and destroy the dollar. They failed to anticipate that widespread private-sector deleveraging would put a lid on money creation (and that other major central banks would follow in the Fed’s ZIRP and QE footsteps). But a longer view of four decades of disinflation suggests another conclusion: Taking away the monetary punch bowl when the labor party gets going and pursuing limited-government fiscal policy can keep inflation pressures from gaining traction. Globalization, technology-enabled elimination of many lower-skilled white-collar functions and the hollowing out of the organized labor movement all helped as well, though they helped foment a revolt among a meaningful segment of the Republican rank-and-file against Reagan-style policies. The Volcker Fed set the tone for pre-emptive monetary tightening and subsequent FOMCs have reliably intervened to cool off the economy when the labor market begins heating up. The Phillips Curve may be out of favor with investors, but wage inflation only gathers steam when the unemployment rate falls below its natural level (Chart 16), and the Fed did not allow negative unemployment gaps to persist for very long in the Volcker era. Without wage inflation putting more money in the hands of a broad cross-section of households with a fairly high marginal propensity to consume, it’s hard to get inflation in consumer prices. Chart 16Taking The Punch Bowl Away From The Union Hall
Taking The Punch Bowl Away From The Union Hall
Taking The Punch Bowl Away From The Union Hall
The Fed took the cyclical wind from the labor market’s sails but the Reagan administration introduced a stiff secular headwind when it crushed PATCO, the air traffic controllers’ union, in 1981, marking an inflection point in the relationship between management and labor. That watershed event opened the door for employers to deploy much rougher tactics against unions than they had since before the New Deal.10 Reagan’s championing of free markets helped establish globalization as an economic policy that the third-way Clinton administration eagerly embraced with NAFTA and a campaign to admit China to the WTO. The latter coincided with a sharp decline in labor’s share of income (Chart 17). Chart 17Outsourcing Has Not Been Good For US Labor
Outsourcing Has Not Been Good For US Labor
Outsourcing Has Not Been Good For US Labor
The core Reagan tenets – limited government, favoring management over labor, globalization, sleepy anti-trust enforcement, reduced regulation and less progressive tax systems with lower rates – are all at risk of Biden administration rollbacks. While the easy monetary/tight fiscal combination promoted a rise in asset prices rather than consumer prices ever since the end of the global financial crisis, today’s easy monetary/easy fiscal could promote consumer price inflation and asset price deflation. We do not think inflation will be an issue in 2021 but we expect it will in the later years of Biden’s term. Ultimately, we expect massive fiscal accommodation will stoke inflation pressures and those pressures, abetted by a Fed which has pledged not to pre-emptively remove accommodation when the labor market tightens, will eventually bring about the end of the bull market in risk assets and the expansion. Investment Implications Business revered the Reagan administration and investors rightfully associate it with the four-decade bull market that began early in its first term. Biden is no wild-eyed liberal, but rolling back core Reagan-era tenets has the potential to roll back juicy Reagan-era returns. Only equities have the lengthy data series to allow a full comparison of Reagan-era returns with postwar New Deal-era returns (Table 3), but the path of Treasury bond yields in the three-decade bear market that preceded the current four-decade bull market suggests that bonds generated little, if any, real returns in the pre-Reagan postwar period (Chart 18). Stagnant precious metal returns point to tame Reagan-era inflation and downward pressure on input costs. Chart 18Bond Investors Loved Volcker And The Gipper
Bond Investors Loved Volcker And The Gipper
Bond Investors Loved Volcker And The Gipper
Table 3Annualized Real Market Returns Before And After Reagan
Requiem For Volcker And The Gipper
Requiem For Volcker And The Gipper
Owning the market is not likely to be as rewarding going forward as it was in the Reagan era. Active management may again have its day in the sun as the end of the Reagan tailwinds open up disparities between sectors, sub-industries and individual companies. Even short-sellers may experience a renaissance. We recommend that multi-asset investors underweight bonds, especially Treasuries. We expect the clamor for bigger government will contribute to a secular bear market that could rival the one that persisted from the fifties to the eighties. Within Treasury portfolios, we would maintain below-benchmark duration and favor TIPS over nominal bonds at least until the Fed signals that its campaign to re-anchor inflation expectations higher has achieved its goal. Gold and/or other precious metals merit a place in portfolios as a hedge against rising inflation and other real assets, from land to buildings to other resources, are worthy of consideration as well. BCA has been cautioning of a downward inflection in long-run financial asset returns for a few years, based on demanding valuations and a steadily shrinking scope for ongoing declines in inflation and interest rates. Mean reversion has been part of the thesis as well; trees simply don’t grow to the sky. Now that the curtain has fallen on the Volcker and Reagan eras, the inevitable downward inflection has received a catalyst. We remain constructive on risk assets over the next twelve months, but we expect that intermediate- and long-term returns will fall well short of their post-1982 pace going forward. Doug Peta, CFA Chief US Investment Strategist dougp@bcaresearch.com Matt Gertken Vice President Geopolitical Strategy mattg@bcaresearch.com Appendix Table A1APolitical Capital: White House And Congress
Requiem For Volcker And The Gipper
Requiem For Volcker And The Gipper
Table A1BPolitical Capital: Household And Business Sentiment
Requiem For Volcker And The Gipper
Requiem For Volcker And The Gipper
Table A1CPolitical Capital: The Economy And Markets
Requiem For Volcker And The Gipper
Requiem For Volcker And The Gipper
Table A2Political Risk Matrix
Requiem For Volcker And The Gipper
Requiem For Volcker And The Gipper
Table A3Political Capital Index
Requiem For Volcker And The Gipper
Requiem For Volcker And The Gipper
Table A4Biden’s Cabinet Position Appointments
Requiem For Volcker And The Gipper
Requiem For Volcker And The Gipper
Footnotes 1 August 12, 1986 Press Conference News Conference | The Ronald Reagan Presidential Foundation & Institute (reaganfoundation.org), accessed February 4, 2021. Reagan makes the quip in his prepared opening remarks. 2 Reagan was a Democrat until he entered politics in his fifties. He claimed to have voted for FDR four times. 3 April 3, 1982 Radio Address President Reagan's Radio Address to the Nation on the Program for Economic Recovery - 4/3/82 - YouTube, accessed February 4, 2021. 4 As an actor, Reagan was perhaps best known for his portrayal of Notre Dame football legend George Gipp, who is immortalized in popular culture as the subject of the “win one for the Gipper” halftime speech. 5 July 22, 1981 White House Remarks to Visiting Editors and Broadcasters reaganfoundation.org, accessed February 8, 2021. 6 Reagan famously urged his followers, in reference to the USSR, “I urge you to beware the temptation of pride—the temptation of blithely declaring yourselves above it all and label both sides equally at fault, to ignore the facts of history and the aggressive impulses of an evil empire.” See his “Address to the National Association of Evangelicals,” March 8, 1983, voicesofdemocracy.umd.edu. 7 Robert Lighthizer, the Trump administration trade representative who directed its tariff battles, was a veteran of Reagan’s trade wars against Japan in the 1980s. 8 “Exclusive: The Trump Party? He still holds the loyalty of GOP voters,” USA Today, February 21, 2021, usatoday.com. 9 Open Letter to Ben Bernanke,” November 15, 2010. Open Letter to Ben Bernanke | Hoover Institution Accessed February 23, 2021. 10 Please see the following US Investment Strategy Special Reports, “Labor Strikes Back, Parts 1, 2 and 3,” dated January 13, January 20 and February 3, 2020, available at usis.bcaresearch.com.
Highlights US Treasuries: The uptrend in US Treasury yields has more room to run. However, the primary driver is starting to shift from increased inflation expectations to higher real yields amid greater confidence on the cyclical US economic outlook. Fed Outlook: It is still too soon to expect the Fed to begin signaling a move to turn less accommodative. However, rising realized US inflation amid dwindling spare economic capacity will make the Fed more nervous about its ultra-dovish policy stance in the second half of 2021. This will trigger a repricing of the future path of US interest rates embedded in the Treasury curve, but a Taper Tantrum repeat will be avoided. US Duration: Maintain below-benchmark US duration exposure, with the 10-year Treasury yield likely to soon test the 1.5% level. Feature Chart 1A Cyclical Rise In Global Bond Yields
A Cyclical Rise In Global Bond Yields
A Cyclical Rise In Global Bond Yields
The selloff in global government bond markets that began in the final few months of 2020 has gained momentum over the past few weeks. The benchmark 10-year US Treasury yield now sits at 1.37%, up 45bps so far in 2021, while the 30-year Treasury yield is at a six-year high of 2.22%. Yields are on the move in other countries, as well, with longer-maturity yields moving higher in the UK, Canada, Australia, New Zealand – even Germany, where the 30yr is now back in positive yield territory at 0.20%, a 34bp increase over the past month alone. The main reason for this move higher in yields can be summed up in one word: “optimism”. Economic growth expectations are improving according to investor surveys like the global ZEW, which is a reliable leading indicator of global bond yields (Chart 1). Falling global COVID-19 case numbers with rising vaccination rates, combined with very large US fiscal stimulus measures proposed by the Biden administration, have given investors hope that a return to some form of pre-pandemic economic normalcy can be achieved later this year. That means faster global growth and a risk of higher inflation, both of which must be reflected in higher bond yields. With the 10-year US Treasury yield now already in the middle of our 2021 year-end target range of 1.25-1.5%, and the macro backdrop remaining bond-bearish, we think it is timely to discuss the possibility that our yield target is too conservative Good Cyclical News Is Bad News For Treasuries The more recent move higher in US Treasury yields is notable because it has not been all about higher inflation breakevens, as has been the case since yields bottomed in mid-2020; real yields are finally starting to inch higher. The 30-year TIPS yield now sits in positive territory at +0.09%, ending a period of negative real yields dating back to the pandemic-induced market shock of last spring (Chart 2). Real yields across the rest of the TIPS curve are also starting to stir, even at the 2-year point, yet remain negative. Thus, the price action has supported one of US Bond Strategy’s Key Views for 2021 that the real yield curve will steepen.1 This uptick in US real yields has occurred alongside a string of positive developments on the US economy, suggesting that improved growth prospects – and what that means for future US inflation and Fed policy - are the key driver. Improving US domestic demand US economic data is not only showing resilience but gaining positive momentum. The preliminary US Markit composite PMI (combining both manufacturing and services industries) for February rose to the highest level in six years (Chart 3). Retail sales in January rose by an eye-popping 5.3% versus the month prior, due in no small part to the impact of government stimulus checks issued in the December pandemic relief package. The Conference Board measure of consumer confidence also picked up in January. The improving trend in US data so far in 2021 is pointing to some potentially big GDP numbers – the New York Fed’s “Nowcast” is calling for Q1 real GDP growth of 8.3%. Chart 2US Real Yields Starting Are Stirring
US Real Yields Starting Are Stirring
US Real Yields Starting Are Stirring
Chart 3US Growing Faster Than Lockdown-Stricken Europe
US Growing Faster Than Lockdown-Stricken Europe
US Growing Faster Than Lockdown-Stricken Europe
Vaccine rollout success After a sloppy start to the COVID-19 vaccination program in the US, the numbers are starting to improve with 19% of the US population having received at least one dose (Chart 4). Numbers of new cases and hospitalizations due to the virus have been collapsing as well, a sign that new lockdowns can be avoided, particularly in the larger US coastal cities. The vaccination numbers are even higher in the UK, where Prime Minister Boris Johnson this week revealed an ambitious plan to fully reopen the UK economy by June. While the pace of inoculation has been far slower within the euro area and other developed countries like Canada, developments in the US and UK are a hopeful sign that the vaccines can help free the world economy from the shackles of COVID-19. Chart 4The US & UK Leading The Way On The Vaccine Rollout
Optimism Reigns Supreme
Optimism Reigns Supreme
Even more fiscal stimulus Our US political strategists expect the Biden Administration’s $1.9 trillion pandemic relief package (the “American Rescue Plan”) to be passed by the US Senate in mid-March via a simple majority through a reconciliation bill.2 A second bill is likely to be passed this autumn or next spring with a much larger number, potentially up to $8 trillion worth of spending on infrastructure, health care, child care and green projects over the next ten years (Chart 5). These are big numbers for a $21 trillion US economy that will increasingly need less stimulus as lockdowns ease. Chart 5Biden’s Agenda AFTER The American Rescue Plan
Optimism Reigns Supreme
Optimism Reigns Supreme
Chart 6Welcome Back, Inflation?
Welcome Back, Inflation?
Welcome Back, Inflation?
Chart 7Price Pressures From US Manufacturing Bottlenecks
Price Pressures From US Manufacturing Bottlenecks
Price Pressures From US Manufacturing Bottlenecks
The combined impact of fiscal stimulus, accommodative monetary policy, easy financial conditions and fewer pandemic related economic restrictions has the potential to boost US economic growth quite sharply this year. If US GDP growth follows the Bloomberg consensus forecasts, the US output gap will be fully closed by Q1/2022 (Chart 6).That would be a much faster elimination of the spare capacity created by the 2020 recession compared to the post-2009 experience, raising the risk of upside inflation surprises later this year and in 2022. Signs of growing inflation pressures will make many FOMC members increasingly uncomfortable, even under the Fed’s new Average Inflation Targeting strategy where inflation overshoots will be more tolerated. Already, there are signs of sharply increased price pressures in the US economy stemming from factory bottlenecks (Chart 7). US manufacturers have had to deal with pandemic-induced disruptions to supply chains, in addition to the unexpectedly fast recovery of US consumer demand from last year’s recession that left companies short of inventory.3 The ISM Manufacturing Prices Paid index hit a 10-year high in January, fueled by surging commodity prices, which is already showing up in some inflation data. The US Producer Price Index for finished goods jumped 1.3% in January – the largest monthly surge since 2009 – boosting the annual inflation rate to 1.7% from 0.8% the prior month. Chart 8A Boost To US Inflation Coming Soon From Base Effects
A Boost To US Inflation Coming Soon From Base Effects
A Boost To US Inflation Coming Soon From Base Effects
Chart 9Additional Upside US Inflation Risks
Additional Upside US Inflation Risks
Additional Upside US Inflation Risks
Chart 10US Shelter Inflation Set To Bottom Out
US Shelter Inflation Set To Bottom Out
US Shelter Inflation Set To Bottom Out
A pickup in US annual inflation rates over the next few months was already essentially a done deal because of base effect comparisons versus the collapse in inflation during the 2020 COVID-19 recession (Chart 8). Additional inflation pressures stemming from factory bottlenecks could provide an additional lift to realized inflation rates. When looking at the main components of the US inflation data, there is scope for a broad-based pickup that goes beyond simple base effect moves. Core Goods CPI inflation is now rising at a 1.7% year-over-year rate, the highest since 2012, with more to come based on the acceleration of growth in US non-oil import prices (Chart 9). Core Services CPI inflation has plunged during the pandemic and is now growing at a 0.5% annual rate. As the US economy reopens from pandemic restrictions, services inflation should begin to recover and add to the rising trend of goods inflation. This will especially be true if the Shelter component of US inflation also begins to recover in response to a tightening demand/supply balance for US housing (Chart 10). Bottom Line: US Treasury yields are rising in response to positive upward momentum in US economic growth, the likelihood of some pickup in inflation over the next 6-12 months and, most importantly, shifting expectations that the Fed will turn less dovish later this year. Evaluating The Fed’s Next Moves Fed officials have continued to signal that they are not yet ready to consider any change to monetary policy settings or forward guidance on future rate moves. In his semi-annual testimony before US Congress this week, Fed Chair Jerome Powell reiterated that the pace of the Fed’s asset purchases would only begin to slow once “substantial progress” has been made towards the Fed’s inflation and unemployment objectives. Powell also stuck to his previous messaging that the Fed would “continue to clearly communicate our assessment of progress toward our goals well in advance of any change in the pace of purchases”.4 According to the New York Fed’s Primary Dealer and Market Participant surveys for January, however, the Fed is not expected to stay silent on the topic of tapering for much longer. According to the surveys, the Fed is expected to begin tapering its purchases of Treasuries and Agency MBS in the first quarter of 2022 (Chart 11). A full tapering to zero (net of rollovers of maturing debt) is expected by the first quarter of 2023. Clearly, bond traders and asset managers believe that US growth and inflation dynamics will both improve over the course of this year such that the Fed will have little choice but to begin the signaling of tapering sometime before the end of 2021. Chart 11Fed Surveys Expect A Full QE Tapering In 2022
Optimism Reigns Supreme
Optimism Reigns Supreme
The Fed has been a bit more transparent on the conditions that must be in place before rate hikes would begin. Labor market conditions must be consistent with full employment, while headline PCE inflation must reach at least 2% and be “on track” to moderately exceed that target for some time. On that front, markets believe these conditions will all be met by early 2023, based on pricing in the US overnight index swap (OIS) curve. The first 25bp rate hike is now priced to occur in February 2023 (Chart 12). This is a big shift from the start of the year, when Fed “liftoff” was expected to occur in October 2023. Thus, in a span of just six weeks, interest rate markets have pulled forward the timing of the first Fed rate hike by eight months. Liftoff would occur almost immediately after the Fed was done fully tapering asset purchases, based on the timetable laid out in the New York Fed surveys, although Fed officials have noted that rate hikes could begin before tapering is complete. Chart 12Pulling Forward The Timing Of Future Fed Rate Hikes
Pulling Forward The Timing Of Future Fed Rate Hikes
Pulling Forward The Timing Of Future Fed Rate Hikes
In our view, the timetable laid out in the New York Fed surveys and in the US OIS curve is not only plausible but probable. If the US economy does indeed print the 4-5% real GDP consensus growth forecasts during the second half of this year, with realized inflation approaching 2% as outlined above, then it will be very difficult for the Fed to justify the need to maintain the current pace of asset purchases. The Fed will want to avoid another 2013 Taper Tantrum by signaling less QE well in advance, to avoid triggering a spike in Treasury yields that could upset equity and credit markets or cause an unwelcome appreciation of the US dollar. However, the New York Fed surveys indicate that the bond market is well prepared for a 2022 taper, so the Fed only has to meet those expectations to prevent an unruly move in the Treasury market. That means the Fed will likely signal tapering toward the end of this year. Chart 13Markets Expect A Negative Real Fed Funds Rate
Optimism Reigns Supreme
Optimism Reigns Supreme
The Fed can maintain caution on signaling the timing of the first rate hike once tapering begins, based on how rapidly the US unemployment rate falls towards the Fed’s estimate of full employment. The median projection from the FOMC’s latest Summary of Economic Projections is for the US unemployment rate to fall to 4.2% in 2022 and 3.7% in 2023, compared to the median longer-run estimate of 4.1%. Thus, if the Fed sticks to current guidance on the employment conditions that must be in place before rate hikes can begin, then liftoff would occur sometime in late 2022 or early 2023 – not far off current market pricing – as long as US inflation is at or above the Fed’s 2% target at the same time. Once the Fed begins rate hikes, the pace of the hikes relative to inflation will determine how high real bond yields can rise. The 10-year TIPS yield has become highly correlated over the past few years to the level of the real fed funds rate (Chart 13). The current forward pricing in US OIS and CPI swap curves indicates that the markets are priced for a negative real fed funds rate until at least 2030. That is highly dovish pricing that will be revised higher once the Fed begins tapering and the market begins to debate the timing and pace of the Fed’s next rate hike cycle. Thus, it is highly unlikely that real Treasury yields will stay as low as implied by the forward curves over the next few years. Bottom Line: It is still too soon to expect the Fed to begin signaling a move to turn less accommodative. However, rising realized US inflation amid dwindling spare economic capacity will make the Fed more nervous about its ultra-dovish policy stance in the second half of 2021. This will trigger a repricing of the future path of US interest rates embedded in the Treasury curve, but a Taper Tantrum repeat will be avoided. How High Can Treasury Yields Go In The Current Move? Our preferred financial market-based cyclical bond indicators are still trending in a direction pointing to higher Treasury yields (Chart 14). The ratio of the industrial commodity prices (copper, most notably) to the price of gold, the relative equity market performance of US cyclicals (excluding technology) to defensives, and the total return of a basket of emerging market currencies are all consistent with a 10-year US Treasury yield above 1.5%. With regards to other valuation measures, the 5-year/5-year Treasury forward rate is already at or close to the top of the range of the longer-run fed funds rate projection from the New York Fed surveys (Chart 15). We have used that range to provide guidance as to how high Treasury yields can go during the current bond bear market. On this basis, longer maturity yields do not have much more upside unless survey respondents start to revise up their fed fund rate expectations, something that could easily happen if inflation surprises to the upside in the back-half of the year. Chart 14Cyclical Indicators Support Rising UST Yields
Cyclical Indicators Support Rising UST Yields
Cyclical Indicators Support Rising UST Yields
Chart 15A Rapid Move Higher In UST Forward Rates
A Rapid Move Higher In UST Forward Rates
A Rapid Move Higher In UST Forward Rates
Chart 16This UST Selloff Not Yet Stretched
This UST Selloff Not Yet Stretched
This UST Selloff Not Yet Stretched
Finally, the rising uptrend in longer-maturity Treasury yields is not overly stretched from a technical perspective (Chart 16). The 10-year yield is currently 55bps above its 200-day moving average, but yields got as high as 80-90bps above the moving average during the previous cyclical troughs in 2013 and 2016. The survey of fixed income client duration positioning from JP Morgan shows that bond investors are running duration exposure below benchmarks, but not yet at the bearish extremes seen in 2011, 2014 and 2017. A similar message can be seen in the Market Vane Treasury Sentiment indicator, which has been falling but remains well above recent cyclical lows. Summing it all up, it appears that the 1.5% ceiling of our 2021 10-year Treasury yield target range may prove to be too low. A move 20-30bps above that is quite possible, although those levels would only be sustainable if the Fed alters the forward guidance to pull forward the timing of rate hikes. We view that as a risk for 2022, not 2021. Bottom Line: Maintain below-benchmark US duration exposure, with the 10-year Treasury yield likely to soon test the 1.5% level. Robert Robis, CFA Chief Fixed Income Strategist rrobis@bcaresearch.com Footnotes 1 Please see BCA Research US Bond Strategy Special Report, "2011 Key Views: US Fixed Income", dated December 15, 2020, available at usbs.bcaresearch.com. 2 Please see BCA Research US Political Strategy Weekly Report, "Don’t Forget Biden’s Health Care Policy", dated February 17, 2021, available at usps.bcaresearch.com. 3https://www.wsj.com/articles/consumer-demand-snaps-back-factories-cant-keep-up-11614019305?page=1 4https://www.federalreserve.gov/newsevents/testimony/powell20210223a.htm Recommendations The GFIS Recommended Portfolio Vs. The Custom Benchmark Index
Optimism Reigns Supreme
Optimism Reigns Supreme
Duration Regional Allocation Spread Product Tactical Trades Yields & Returns Global Bond Yields Historical Returns
Global equity valuations are at a level where they are very sensitive to changes in the discount rate. Chart 1 shows that the cyclically-adjusted earnings yield on the S&P 500 is slightly below its 2000 low. Equity investors have thus far taken comfort from the fact that US bond yields have been depressed, and taking into consideration low bond yields the US equity market is not as bubbly as it was in the 2000s. Chart 1Rising US Bond Yields Threatens US Equity Valuations
Rising US Bond Yields Threatens US Equity Valuations
Rising US Bond Yields Threatens US Equity Valuations
However, the fact that the US equity market’s valuations after accounting for the level of interest rates are not as expensive as they were in 2000 does not mean share prices cannot experience a meaningful shakeout. Notably, there is a lot of speculation and euphoria among investors, reminiscent of the late 1990s (please refer to Charts 24-26 below). Critically, when equity multiples are very elevated and bond yields are extremely low, the sensitivity of multiples to interest rates is most pronounced. Hence, rising US Treasury yields could result in a setback in share prices. All in all, our themes for now are as follows: Chart 2A Full-Fledged Mania In Asian TMT Stocks
A Full-Fledged Mania In Asian TMT Stocks
A Full-Fledged Mania In Asian TMT Stocks
Enormous US fiscal and monetary stimulus, strong economic growth and supply bottlenecks will push up the US core inflation rate. As a result, the ongoing sell-off in long-term US bond yields will continue. EM and DM credit spreads are currently very tight and credit spreads might not be able to compress further to offset the rise in US Treasury yields. Hence, rising US Treasury yields will trigger higher corporate and EM sovereign bond yields. In brief, rising EM bond yields is the key risk to EM share prices. Charts 5 and 6 below illustrate these points. Given that the US trade-weighted dollar is extremely oversold, rising US Treasury yields will likely trigger a countertrend rally in the greenback. This will cause a shakeout in EM currencies, fixed-income markets and commodities prices. Historically, the greenback has not had a stable relationship with US Treasury yields – they were both positively and negatively correlated in different periods. In such an environment, DM growth stocks will underperform DM value stocks. We have less conviction in growth/value performance in the EM space. The reason lies in the speculative frenzy taking place in Chinese new economy stocks trading in Hong Kong as well as tech share prices in Korea and Taiwan. As Chart 2 reveals, the Hang Seng Tech index and EM TMT stocks have been rising exponentially. Visibility is very low. The timing of a reversal of this equity euphoria is impossible to predict. Outside these TMT stocks, the relative performance of EM equities has been rather underwhelming, as is illustrated in Charts 71-73. Notably, the economic recovery in EM ex-China, Korea and Taiwan has been much weaker than those in DM and North Asian economies (please refer to Charts 63 and 66). This will continue as many of these nations are lagging in vaccine rollouts and their fiscal and monetary support has been much smaller. In addition, peak stimulus in China means that the mainland’s construction and infrastructure investment will slow meaningfully in H2 2021. This is another risk to EM economies supplying to China. Weighing pros and cons, we continue to recommend a neutral allocation to EM in a global equity portfolio. The same is true for EM credit (sovereign and corporate) within a global credit portfolio. For local bonds, inflation in EM – including China – is still very low and will likely stay depressed. As a result, we continue recommending receiving 10-year swap rates in Mexico, Colombia, Russia, Malaysia, India and China. Investors should use a rebound in the US dollar to transition from receiving rates to being long on cash bonds. Arthur Budaghyan Chief Emerging Markets Strategist arthurb@bcaresearch.com Yellow Flags For Share Prices Rising US corporate bond yields pose a risk to the equity rally. Interestingly, New Zealand’s stock market has begun correcting. Often but not always, this development heralds a pullback in EM share prices (albeit for unknown reasons). Chart 3Yellow Flags For Share Prices
Yellow Flags For Share Prices
Yellow Flags For Share Prices
Chart 4Yellow Flags For Share Prices
Yellow Flags For Share Prices
Yellow Flags For Share Prices
Beware Of Potential Rise In EM Sovereign And Corporate USD Bond Yields Historically, rising EM corporate USD bond yields led to a selloff in EM share prices. If rising US Treasury yields begin pushing up EM sovereign and corporate bonds yields, which is quite likely, the EM equity rally will be jeopardized. Chart 5Beware Of Potential Rise In EM Sovereign And Corporate USD Bond Yields
Beware Of Potential Rise In EM Sovereign And Corporate USD Bond Yields
Beware Of Potential Rise In EM Sovereign And Corporate USD Bond Yields
Chart 6Beware Of Potential Rise In EM Sovereign And Corporate USD Bond Yields
Beware Of Potential Rise In EM Sovereign And Corporate USD Bond Yields
Beware Of Potential Rise In EM Sovereign And Corporate USD Bond Yields
EM Equities Are Ignoring Many Warning Signs Due To Profit Recovery So far, the EM equity index has snubbed the rollover in China’s credit impulse and plummeting gold prices in non-US dollar currencies. The ongoing EM corporate earnings recovery has justified the rally in of share prices. However, much of the good news has already been priced in. Chart 7EM Equities Are Ignoring Many Warning Signs Due To Profit Recovery
EM Equities Are Ignoring Many Warning Signs Due To Profit Recovery
EM Equities Are Ignoring Many Warning Signs Due To Profit Recovery
Chart 8EM Equities Are Ignoring Many Warning Signs Due To Profit Recovery
EM Equities Are Ignoring Many Warning Signs Due To Profit Recovery
EM Equities Are Ignoring Many Warning Signs Due To Profit Recovery
Chart 9EM Equities Are Ignoring Many Warning Signs Due To Profit Recovery
EM Equities Are Ignoring Many Warning Signs Due To Profit Recovery
EM Equities Are Ignoring Many Warning Signs Due To Profit Recovery
Investors Are Super Bullish European investors are very bullish on EM equities and European growth. From a contrarian perspective, this does not always herald a bear market but suggests that odds of a meaningful shakeout are non-trivial. Chart 10Investors Are Super Bullish
Investors Are Super Bullish
Investors Are Super Bullish
Chart 11Investors Are Super Bullish
Investors Are Super Bullish
Investors Are Super Bullish
Investor Growth Expectations Are Super High Our proxy for global growth expectations as well as EM net EPS revisions are elevated. Similarly, analysts’ EM 12-month forward EPS growth differential vs. US are the widest since 2001. Chart 12Investor Growth Expectations Are Super High
Investor Growth Expectations Are Super High
Investor Growth Expectations Are Super High
Chart 13Investor Growth Expectations Are Super High
Investor Growth Expectations Are Super High
Investor Growth Expectations Are Super High
US Inflation And Rates US core goods inflation has been rising due to strong US household demand and supply bottlenecks. When the economy fully reopens, US core service inflation will rise as pent-up demand for services is unleashed. This will push up US bond yields regardless of the Fed’s rhetoric. Chart 14US Inflation And Rates
US Inflation And Rates
US Inflation And Rates
Chart 15US Inflation And Rates
US Inflation And Rates
US Inflation And Rates
Chart 16US Inflation And Rates
US Inflation And Rates
US Inflation And Rates
Look Out For Cracks In EM High-Yield Bond Space A rise in US TIPS and nominal yields will likely send shockwaves through EM risk assets and commodities that have greatly benefited from the plunge in TIPS yields. Watch out for cracks in the EM high-yield bond space. Chart 17Look Out For Cracks In EM High-Yield Bond Space
Look Out For Cracks In EM High-Yield Bond Space
Look Out For Cracks In EM High-Yield Bond Space
Chart 18Look Out For Cracks In EM High-Yield Bond Space
Look Out For Cracks In EM High-Yield Bond Space
Look Out For Cracks In EM High-Yield Bond Space
Chart 19Look Out For Cracks In EM High-Yield Bond Space
Look Out For Cracks In EM High-Yield Bond Space
Look Out For Cracks In EM High-Yield Bond Space
Chart 20Look Out For Cracks In EM High-Yield Bond Space
Look Out For Cracks In EM High-Yield Bond Space
Look Out For Cracks In EM High-Yield Bond Space
EM Currencies Are Not Yet Expensive But Are Overbought Although cyclically and for some countries structurally speaking EM currencies have more upside and their appreciation path will not be without major setbacks. In fact, several key currencies like MXN and ZAR are facing an important technical resistance. Investors should not chase them higher but accumulate them on a relapse. Chart 21EM Currencies Are Not Yet Expensive But Are Overbought
EM Currencies Are Not Yet Expensive But Are Overbought
EM Currencies Are Not Yet Expensive But Are Overbought
Chart 23EM Currencies Are Not Yet Expensive But Are Overbought
EM Currencies Are Not Yet Expensive But Are Overbought
EM Currencies Are Not Yet Expensive But Are Overbought
Chart 22EM Currencies Are Not Yet Expensive But Are Overbought
EM Currencies Are Not Yet Expensive But Are Overbought
EM Currencies Are Not Yet Expensive But Are Overbought
Equity Market Euphoria Is Running Wild Certain measures of stock market activity – like the call-put ratio, trading volumes and margin loans – reveal engulfing speculative behavior not only in the US but also in other markets like Korea. Chart 24Equity Market Euphoria Is Running Wild
Equity Market Euphoria Is Running Wild
Equity Market Euphoria Is Running Wild
Chart 25Equity Market Euphoria Is Running Wild
Equity Market Euphoria Is Running Wild
Equity Market Euphoria Is Running Wild
Chart 26Equity Market Euphoria Is Running Wild
Equity Market Euphoria Is Running Wild
Equity Market Euphoria Is Running Wild
A Mania Can Run Further And Longer Than Rational Analysis Can Envision The IPO boom is not as expansive as it was at its 2000 and 2007 peaks and there is some US dollar cash left to be put to work. Visibility is very low. Chart 27A Mania Can Run Further And Longer Than Rational Analysis Can Envision
A Mania Can Run Further And Longer Than Rational Analysis Can Envision
A Mania Can Run Further And Longer Than Rational Analysis Can Envision
Chart 28A Mania Can Run Further And Longer Than Rational Analysis Can Envision
A Mania Can Run Further And Longer Than Rational Analysis Can Envision
A Mania Can Run Further And Longer Than Rational Analysis Can Envision
Chart 29A Mania Can Run Further And Longer Than Rational Analysis Can Envision
A Mania Can Run Further And Longer Than Rational Analysis Can Envision
A Mania Can Run Further And Longer Than Rational Analysis Can Envision
Steep Equity Volatility Curves A steep equity volatility curve heralds a correction. Chart 30Steep Equity Volatility Curves
Steep Equity Volatility Curves
Steep Equity Volatility Curves
Chart 31Steep Equity Volatility Curves
Steep Equity Volatility Curves
Steep Equity Volatility Curves
Chart 32Steep Equity Volatility Curves
Steep Equity Volatility Curves
Steep Equity Volatility Curves
Chart 33Steep Equity Volatility Curves
Steep Equity Volatility Curves
Steep Equity Volatility Curves
Volatilities Across FX, Bonds And Commodities Oil volatility has been and remains in a bull market – making higher lows. Currency volatility remains elevated while US bond volatility is still very low and is bound to rise. Chart 34Volatilities Across FX, Bonds and Commodities
Volatilities Across FX, Bonds and Commodities
Volatilities Across FX, Bonds and Commodities
Chart 35Volatilities Across FX, Bonds and Commodities
Volatilities Across FX, Bonds and Commodities
Volatilities Across FX, Bonds and Commodities
Chart 36Volatilities Across FX, Bonds and Commodities
Volatilities Across FX, Bonds and Commodities
Volatilities Across FX, Bonds and Commodities
Chart 37Volatilities Across FX, Bonds and Commodities
Volatilities Across FX, Bonds and Commodities
Volatilities Across FX, Bonds and Commodities
Chart 38Volatilities Across FX, Bonds and Commodities
Volatilities Across FX, Bonds and Commodities
Volatilities Across FX, Bonds and Commodities
Chart 39Volatilities Across FX, Bonds and Commodities
Volatilities Across FX, Bonds and Commodities
Volatilities Across FX, Bonds and Commodities
Cyclicals Vs. Defensives And Growth Vs. Value Performance Global cyclical stocks’ relative performance versus defensive stocks might be due for a pause. Growth will underperform value in DM due to rising bond yields. We are less convinced about the growth/value performance in the EM equity space due to the mania occurring in EM TMT stocks. Chart 40Cyclicals Vs. Defensives And Growth Vs. Value Performance
Cyclicals Vs. Defensives And Growth Vs. Value Performance
Cyclicals Vs. Defensives And Growth Vs. Value Performance
Chart 41Cyclicals Vs. Defensives And Growth Vs. Value Performance
Cyclicals Vs. Defensives And Growth Vs. Value Performance
Cyclicals Vs. Defensives And Growth Vs. Value Performance
Chart 42Cyclicals Vs. Defensives And Growth Vs. Value Performance
Cyclicals Vs. Defensives And Growth Vs. Value Performance
Cyclicals Vs. Defensives And Growth Vs. Value Performance
Chart 43Cyclicals Vs. Defensives And Growth Vs. Value Performance
Cyclicals Vs. Defensives And Growth Vs. Value Performance
Cyclicals Vs. Defensives And Growth Vs. Value Performance
Profiles Of Various Global Equity Indexes Many global equity indexes excluding US or TMT have either not broken out or have done so only marginally. Chart 44Profiles Of Various Global Equity Indexes
Profiles Of Various Global Equity Indexes
Profiles Of Various Global Equity Indexes
Chart 45Profiles Of Various Global Equity Indexes
Profiles Of Various Global Equity Indexes
Profiles Of Various Global Equity Indexes
Chart 46Profiles Of Various Global Equity Indexes
Profiles Of Various Global Equity Indexes
Profiles Of Various Global Equity Indexes
Chart 47Profiles Of Various Global Equity Indexes
Profiles Of Various Global Equity Indexes
Profiles Of Various Global Equity Indexes
EM ex-TMT Equity Performance Has Been Unimpressive Excluding TMT stocks, EM equity indexes have not broken above their previous highs. It has been a mania in TMT stocks that has boosted the EM overall equity index. Chart 48EM ex-TMT Equity Performance Has Been Unimpressive
EM ex-TMT Equity Performance Has Been Unimpressive
EM ex-TMT Equity Performance Has Been Unimpressive
Chart 49EM ex-TMT Equity Performance Has Been Unimpressive
EM ex-TMT Equity Performance Has Been Unimpressive
EM ex-TMT Equity Performance Has Been Unimpressive
Chart 50EM ex-TMT Equity Performance Has Been Unimpressive
EM ex-TMT Equity Performance Has Been Unimpressive
EM ex-TMT Equity Performance Has Been Unimpressive
Chart 51EM ex-TMT Equity Performance Has Been Unimpressive
EM ex-TMT Equity Performance Has Been Unimpressive
EM ex-TMT Equity Performance Has Been Unimpressive
A Mania In Chinese Stocks, Especially In TMT Stocks Chinese offshore stocks ex-TMT and onshore equal-weighted and small caps have done rather poorly. The latest euphoria in Hong Kong-listed Chinese stocks has been due to an increased quota for mainland investors to buy offshore stocks. This has led to massive southbound outflows and has propelled Chinese stock trading in Hong Kong. Chart 52A Mania In Chinese Stocks, Especially In TMT Stocks
A Mania In Chinese Stocks, Especially In TMT Stocks
A Mania In Chinese Stocks, Especially In TMT Stocks
Chart 53A Mania In Chinese Stocks, Especially In TMT Stocks
A Mania In Chinese Stocks, Especially In TMT Stocks
A Mania In Chinese Stocks, Especially In TMT Stocks
Chart 54A Mania In Chinese Stocks, Especially In TMT Stocks
A Mania In Chinese Stocks, Especially In TMT Stocks
A Mania In Chinese Stocks, Especially In TMT Stocks
The Chinese Economy: Peak Stimulus = Weak Growth In H2 2021 Rollover in credit and fiscal stimulus in Q4 2020 entails weak growth in H2 2021 in segments leveraged to stimulus. Chart 55The Chinese Economy: Peak Stimulus = Weak Growth In H2 2021
The Chinese Economy: Peak Stimulus = Weak Growth In H2 2021
The Chinese Economy: Peak Stimulus = Weak Growth In H2 2021
Chart 56The Chinese Economy: Peak Stimulus = Weak Growth In H2 2021
The Chinese Economy: Peak Stimulus = Weak Growth In H2 2021
The Chinese Economy: Peak Stimulus = Weak Growth In H2 2021
Chart 57The Chinese Economy: Peak Stimulus = Weak Growth In H2 2021
The Chinese Economy: Peak Stimulus = Weak Growth In H2 2021
The Chinese Economy: Peak Stimulus = Weak Growth In H2 2021
Chart 58The Chinese Economy: Peak Stimulus = Weak Growth In H2 2021
The Chinese Economy: Peak Stimulus = Weak Growth In H2 2021
The Chinese Economy: Peak Stimulus = Weak Growth In H2 2021
Commodity Prices The end of commodities restocking in China, weaker demand from mainland construction in H2 and elevated investor net long positions in commodities constitute the basis for a setback in commodities prices this year. Nevertheless, such a pullback will occur only if the USD rebounds and global equity prices sell off. Chart 59Commodity Prices
Commodity Prices
Commodity Prices
Chart 60Commodity Prices
Commodity Prices
Commodity Prices
Chart 61Commodity Prices
Commodity Prices
Commodity Prices
Chart 62Commodity Prices
Commodity Prices
Commodity Prices
The Recovery In EM ex-North Asia Has Been Very Subdued The economic recovery in EM ex-China, Korea and Taiwan has been much weaker than those in DM and North Asian economies. Chart 63The Recovery In EM ex-North Asia Has Been Very Subdued
The Recovery In EM ex-North Asia Has Been Very Subdued
The Recovery In EM ex-North Asia Has Been Very Subdued
Chart 64The Recovery In EM ex-North Asia Has Been Very Subdued
The Recovery In EM ex-North Asia Has Been Very Subdued
The Recovery In EM ex-North Asia Has Been Very Subdued
Chart 65The Recovery In EM ex-North Asia Has Been Very Subdued
The Recovery In EM ex-North Asia Has Been Very Subdued
The Recovery In EM ex-North Asia Has Been Very Subdued
Chart 66The Recovery In EM ex-North Asia Has Been Very Subdued
The Recovery In EM ex-North Asia Has Been Very Subdued
The Recovery In EM ex-North Asia Has Been Very Subdued
The Recovery In EM ex-North Asia Will Continue To Lag EM ex-North Asia’s economic underperformance will continue as many of these nations are lagging in vaccine rollouts and their fiscal and monetary support has been much smaller. Besides, their banks are reluctant to lend due to high NPLs. Chart 67The Recovery In EM ex-North Asia Will Continue To Lag
The Recovery In EM ex-North Asia Will Continue To Lag
The Recovery In EM ex-North Asia Will Continue To Lag
Chart 68The Recovery In EM ex-North Asia Will Continue To Lag
The Recovery In EM ex-North Asia Will Continue To Lag
The Recovery In EM ex-North Asia Will Continue To Lag
Chart 69The Recovery In EM ex-North Asia Will Continue To Lag
The Recovery In EM ex-North Asia Will Continue To Lag
The Recovery In EM ex-North Asia Will Continue To Lag
Chart 70The Recovery In EM ex-North Asia Will Continue To Lag
The Recovery In EM ex-North Asia Will Continue To Lag
The Recovery In EM ex-North Asia Will Continue To Lag
EM ex-TMT Equity Performance Has Been Underwhelming A slow recovery in EM ex-TMT industries explains why EM equity performance outside TMT stocks has been underwhelming. Chart 71EM ex-TMT Equity Performance Has Been Underwhelming
EM ex-TMT Equity Performance Has Been Underwhelming
EM ex-TMT Equity Performance Has Been Underwhelming
Chart 72EM ex-TMT Equity Performance Has Been Underwhelming
EM ex-TMT Equity Performance Has Been Underwhelming
EM ex-TMT Equity Performance Has Been Underwhelming
Chart 73EM ex-TMT Equity Performance Has Been Underwhelming
EM ex-TMT Equity Performance Has Been Underwhelming
EM ex-TMT Equity Performance Has Been Underwhelming
Footnotes