Fixed Income

Highlights The post-2008 boom in stocks, corporate bonds, and real estate is a ‘rational bubble’, because the relationship between risk-asset valuations and falling bond yields is exponential. But the ‘rational bubble’ is turning into an ‘irrational bubble’. Stay tactically neutral to stocks for the next few weeks to see whether valuation can revert to rationality. This means keep existing investments in the market, but hold fire on new deployments of cash. If valuation reverts to rationality, then investors can safely deploy new cash into the market. But if valuation moves into irrationality, then it will require a completely different investment mindset, in which fractal analysis will become crucial in identifying the bursting of the bubble, just as it did in 2000. Fractal trade: the Chinese stock market is vulnerable to correction. Feature Chart of the WeekA 'Rational Bubble' And An 'Irrational Bubble'
A 'Rational Bubble' And An 'Irrational Bubble'
A 'Rational Bubble' And An 'Irrational Bubble'
Regular readers will know that we have characterised the post-2008 boom in stocks, corporate bonds, and real estate as a ‘rational bubble’. Rational, because the nosebleed valuations are justified by a fundamental driver. And not just any fundamental driver, but the most fundamental driver of all – the bond yield. However, the ‘rational bubble’ is turning into an ‘irrational bubble’, akin to the dot com mania in which valuations became totally disconnected from fundamentals (Chart of the Week). What should investors do? The Relationship Between Bond Yields And Risk-Asset Valuation Is Exponential Everyone realises that a lower bond yield justifies a lower prospective return from competing investments, such as stocks, corporate bonds, and real estate. As valuation is just the inverse of prospective return, a lower bond yield justifies a higher valuation for all risk-assets. (Chart I-2). Chart I-2House Prices have Decoupled From Rents Again (And It Didn't End Happily Last Time)
House Prices have Decoupled From Rents Again (And It Didn't End Happily Last Time)
House Prices have Decoupled From Rents Again (And It Didn't End Happily Last Time)
But few people realise that a lower bond yield justifies an exponentially higher valuation for risk-assets. To visualise this exponential relationship, look again at the Chart of the Week. The bond yield is plotted on a logarithmic (and inverted) left scale, while the stock market forward price-to-earnings is plotted on a linear right scale. The inverted log versus linear scales demonstrate that, in the ‘rational bubble’, the lower the bond yield, the greater the impact of a given decline in the bond yield on stock market valuation. Few people realise that a lower bond yield justifies an exponentially higher valuation for risk-assets. Chart I-3 and Chart I-4 also demonstrate the exponential relationship using the earnings yield as a proxy for the prospective return on stocks. A 1.5 percent decline in the bond yield had a smaller impact on the earnings yield when the bond yield started at 4 percent in 2014 than when the bond yield started at 3 percent in 2019. At the higher bond yield, the prospective return on stocks fell by 1 percent, but at the lower bond yield, the prospective return on stocks plunged by 2.5 percent. Chart I-3A 1.5 Percent Decline In The Bond Yield Had A Smaller Impact On The Earnings Yield When The Bond Yield Started At 4 Percent...
A 1.5 Percent Decline In The Bond Yield Had A Smaller Impact On The Earnings Yield When The Bond Yield Started At 4 percent...
A 1.5 Percent Decline In The Bond Yield Had A Smaller Impact On The Earnings Yield When The Bond Yield Started At 4 percent...
Chart I-4…Than When The Bond Yield Started ##br##At 3 Percent
...Than When The Bond Yield Started At 3 Percent
...Than When The Bond Yield Started At 3 Percent
To repeat, the lower the bond yield, the greater the impact of a given move in the bond yield on the prospective return from stocks. The intriguing question is, why? To answer this question, we must venture into a branch of behavioural psychology developed by Nobel Laureate Daniel Kahneman and Amos Tversky, called Prospect Theory. Prospect Theory Explains The ‘Rational Bubble’ Prospect Theory’s key finding is that we consistently overvalue the prospect of a tail-event, both positive and negative. For example, if there is a one in a million chance of winning a million pounds, then the expected value of this prospect is one pound. Yet we will consistently pay more than one pound for this positive tail-event. This willingness to overpay for a positive tail-event is the foundation of the multi-billion pound gambling and lottery industry. Now consider an ‘inverse lottery’, in which there is a one in a million chance of losing a million pounds. In theory, we should take on the risky prospect for one pound. Yet in practice, we will consistently demand more than one pound to take on this negative tail-event. In other words, we will demand a substantial ‘risk premium’. Prospect Theory explains that we overvalue tail-events because we are bad at comprehending small probabilities. Hence, the prospect of winning a million pounds, while in practice a negligible possibility, generates excessive optimism which results in overpayment for the bet. Likewise, the possibility of losing a million pounds, while in practice a negligible possibility, generates excessive pessimism, for which we demand payment of a ‘risk premium’. In the financial markets, stock markets tend to ‘gap down’ much more than they ‘gap up’. Hence, the risk of owning stocks is like the discomfort of the inverse lottery. This explains why investors normally demand a risk premium – an excess prospective return – to own stocks versus bonds. However, the risk relationship between stocks and bonds changes when bond yields approach their lower bound. Now, as bond yields have less scope to move down versus up, bond prices can gap down much more than they can gap up. The upshot is that the risk of owning bonds becomes no different to the risk of owning stocks, and the risk premium to own stocks versus bonds disappears. At ultra-low bond yields, the bond yield and the equity risk premium move up and down in tandem. Given that the prospective return on stocks equals the bond yield plus the risk premium, we can now answer our intriguing question. At ultra-low bond yields, the prospective return on stocks moves by more than the move in the bond yield, because the bond yield and the risk premium are moving up and down in tandem. The result is an exponential relationship between the bond yield and risk-asset valuations. And this explains how the post-2008 collapse in bond yields to unprecedented lows has generated a ‘rational bubble’ in stocks, corporate bonds, and real estate (Chart I-5 and Chart I-6). Chart I-5A Rational Bubble In Risk-Assets...
A Rational Bubble In Risk-Assets...
A Rational Bubble In Risk-Assets...
Chart I-6...Everywhere
...Everywhere
...Everywhere
The Rational Bubble Is Turning Irrational The post-2008 boom in risk-asset valuations is rational given the exponential relationship with a collapsed bond yield. But the rational valuation is turning irrational. Over the past few months, the stock market’s forward price-to-earnings multiple has continued to increase despite a backup in the bond yield. Note that this multiple is calculated on the next 12 months of earnings, so it already incorporates a strong post-pandemic earnings rebound (Chart I-7). Chart I-7The Rational Bubble Is Turning Irrational
The Rational Bubble Is Turning Irrational
The Rational Bubble Is Turning Irrational
Furthermore, since 2009, the bond yield (plus a fixed constant) has defined a reliable lower limit for the technology sector earnings yield, meaning a well-defined upper limit for the technology sector’s valuation. Since 2009, this valuation limit has effectively defined the limit of the rational bubble and hasn’t been breached. That is, until now. The recent breach of the post-2008 valuation limit means that the rational bubble is turning irrational (Chart I-8). Chart I-8The Post-2008 Rational Valuation Limit Has Been Breached
The Post-2008 Rational Valuation Limit Has Been Breached
The Post-2008 Rational Valuation Limit Has Been Breached
There are three ways that an irrational valuation can revert to rationality: Stock prices decline. Bond yields decline. Stock prices and bond yields drift sideways while (forward) earnings gradually rise to improve stock valuations. The Investment Decision The decision to be invested in the stock market is probably the most important decision for all investors, including those in Europe. Furthermore, the direction of the stock market is a global rather than a local phenomenon. Our current recommendation is to stay tactically neutral for the next few weeks to see whether risk-asset valuations can revert to rationality. This means keep existing investments in the market, but hold fire on new deployments of cash. Hold fire on new deployments of cash. If valuation reverts to rationality in any of the three ways listed above, then investors can safely deploy new cash into the market. But if valuation turns into irrationality, then it will require a completely different investment mindset. After all, you cannot analyse an irrational market using rational tools! In this case, technical analysis becomes much more important, and front and centre of these techniques is fractal analysis. Specifically, as investors with longer and longer time horizons join the irrational bubble, there will be well-defined moments of heightened fragility, at which correction risk increases. This is what burst the irrational bubble in 2000 (Chart I-9), and will burst any new irrational bubble. Stay tuned. Chart I-9The Dotcom Bubble Burst When All Investment Time Horizons Had Joined It
The Dotcom Bubble Burst When All Investment Time Horizons Had Joined It
The Dotcom Bubble Burst When All Investment Time Horizons Had Joined It
Fractal Trading System* The recent strong rally and outperformance of the Chinese stock market is fragile on all three fractal structures: 65-day, 130-day, and 260-day. A good trade is to underweight China versus New Zealand (MSCI indexes), setting a profit target and symmetrical stop-loss at 9 percent. In other trades, the continued momentum of reflation plays has weighed on some recent positions as well as stopping out short MSCI World versus the 30-year T-bond. Nevertheless, the rolling 12-month win ratio stands at 54 percent. Chart I-10MSCI: China Vs. New Zealand
MSCI: China Vs. New Zealand
MSCI: China Vs. New Zealand
When the fractal dimension approaches the lower limit after an investment has been in an established trend it is a potential trigger for a liquidity-triggered trend reversal. Therefore, open a countertrend position. The profit target is a one-third reversal of the preceding 13-week move. Apply a symmetrical stop-loss. Close the position at the profit target or stop-loss. Otherwise close the position after 13 weeks. * For more details please see the European Investment Strategy Special Report “Fractals, Liquidity & A Trading Model,” dated December 11, 2014, available at eis.bcaresearch.com. Dhaval Joshi Chief European Investment Strategist dhaval@bcaresearch.com Fractal Trading System Cyclical Recommendations Structural Recommendations Closed Fractal Trades Trades Closed Trades Asset Performance Currency & Bond Equity Sector Country Equity Indicators Bond Yields Chart II-1Indicators To Watch - Bond Yields
Indicators To Watch - Bond Yields
Indicators To Watch - Bond Yields
Chart II-2Indicators To Watch - Bond Yields
Indicators To Watch - Bond Yields
Indicators To Watch - Bond Yields
Chart II-3Indicators To Watch - Bond Yields
Indicators To Watch - Bond Yields
Indicators To Watch - Bond Yields
Chart II-4Indicators To Watch - Bond Yields
Indicators To Watch - Bond Yields
Indicators To Watch - Bond Yields
Interest Rate Chart II-5Indicators To Watch - Interest Rate Expectations
Indicators To Watch - Interest Rate Expectations
Indicators To Watch - Interest Rate Expectations
Chart II-6Indicators To Watch - Interest Rate Expectations
Indicators To Watch - Interest Rate Expectations
Indicators To Watch - Interest Rate Expectations
Chart II-7Indicators To Watch - Interest Rate Expectations
Indicators To Watch - Interest Rate Expectations
Indicators To Watch - Interest Rate Expectations
Chart II-8Indicators To Watch - Interest Rate Expectations
Indicators To Watch - Interest Rate Expectations
Indicators To Watch - Interest Rate Expectations
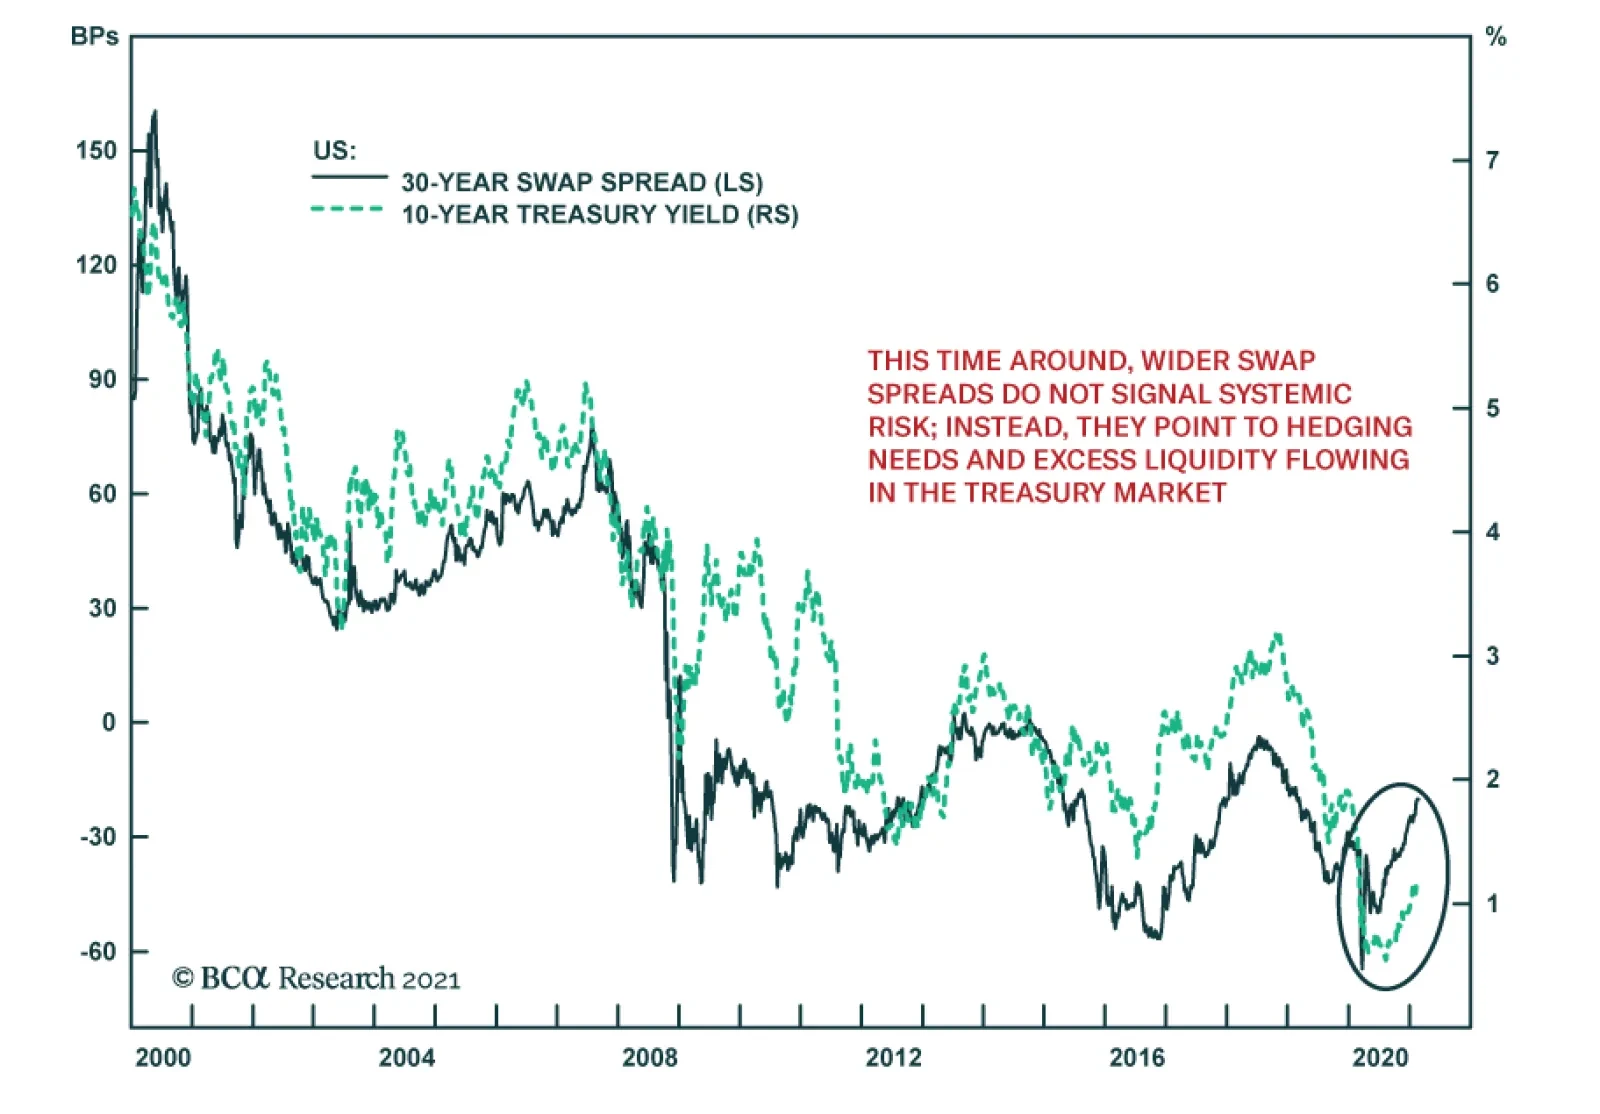
The widening in US swap spreads has garnered attention among many market commentators. The fear is that like in 2008 or in March 2020, wider swap spreads foretell major market troubles in the near future. While a correction remains likely in an…
Dear Client, This week, the US Bond Strategy service is hosting its Quarterly Webcast (today at 10:00 AM EST, 3:00 PM GMT, 4:00 PM CET, 11:00 PM HKT). In addition, we are sending this Quarterly Chartpack that provides a recap of our key recommendations and some charts related to those recommendations and other areas of interest for US bond investors. Please tune in to the Webcast and browse the Chartpack at your leisure, and do let us know if you have any questions or other feedback. To view the Quarterly Chartpack PDF please click here. Best regards, Ryan Swift, US Bond Strategist
Highlights This week, we present the second edition of the BCA Research Global Fixed Income Strategy (GFIS) Global Credit Conditions Chartbook—a review of central bank surveys of bank lending standards and loan demand. Feature The data on lending standards during the last quarter of 2020 are decidedly mixed. Credit standards for business loans continued to tighten in most countries (Chart 1). On the positive side, the pace of that tightening slowed, or is expected to slow, going into 2021. Importantly, the survey data for consumer loan demand in many countries paints a more optimistic picture for household spending than consumer confidence indices. In sum, the lending surveys indicate that the panoply of global fiscal and monetary stimulus measures introduced over the past year to help offset the financial shock of the pandemic have passed through, to some degree, into easier credit standards. This should help sustain the current trends of rising global bond yields and narrowing corporate credit spreads. Chart 1Mixed Data On Lending Standards
Mixed Data On Lending Standards
Mixed Data On Lending Standards
An Overview Of Global Credit Condition Surveys Chart 2Credit Standards And Spreads Are Correlated
Credit Standards And Spreads Are Correlated
Credit Standards And Spreads Are Correlated
After every quarter, major central banks compile surveys to assess prevailing credit conditions. The purpose is to obtain from banks an assessment of how their lending standards and demand for loans, for both firms and consumers, changed over the previous quarter. Most surveys also ask questions about the key factors driving these changes and expectations for the next quarter.1 For fixed income investors, these surveys are valuable for a few reasons. Firstly, data on consumer lending is a window into consumer health while business loan demand sheds light on the investment picture. These help derive a view on the path of future economic growth and interest rates and thus, the appropriate duration stance of a bond portfolio. Also, credit standards can tell us about the pass-through from fiscal and monetary policy measures to realized financial conditions (i.e. corporate borrowing rates). Most importantly, credit standards exhibit a direct correlation with corporate bond spreads (Chart 2). As they have access to detailed, non-public information on a large number of borrowers, loan officers are uniquely positioned to evaluate corporate health. When banks are tightening standards, they see an issue with the credit quality of either current or future loans, which impacts borrowing costs in the corporate bond market. Tightening standards indicate a worsening borrowing backdrop and weaker growth, which then pushes up corporate spreads. Vice versa, easing standards imply a favorable backdrop and plentiful liquidity—both bullish signs for spread product. US In the US, the net percent of domestic respondents to the Fed’s Senior Loan Officer survey that tightened standards for commercial and industrial (C&I) loans (measured as an average of small, middle-market, and large firms) fell significantly in Q4/2020 (Chart 3). The key issue, both for lenders that tightened and eased standards, was the economic outlook, with those that eased taking a more sanguine view and vice-versa. Chart 3US Credit Conditions
US Credit Conditions
US Credit Conditions
Chart 4Corporate Borrowing Costs Are Driving Easy Financial Conditions
Corporate Borrowing Costs Are Driving Easy Financial Conditions
Corporate Borrowing Costs Are Driving Easy Financial Conditions
The ad-hoc questions, asked in every instalment of the survey, discussed the outlook for 2021. On this front, US lenders expect easier lending standards over the course of the year, driven by an increase in risk tolerance and expected improvement in the credit quality of their loan portfolios. There was a marked improvement in demand for C&I loans in Q4/2020 although, on net, a small number of lenders still reported weaker demand over Q4/2020. Those that reported stronger loan demand cited financing for mergers and acquisitions as the biggest driver. Meanwhile, lenders reporting weaker demand primarily cited decreased fixed asset investment. However, the reasons for weaker demand were not all bad—many cited a reduced need for precautionary cash and liquidity. Over 2021, the outlook is quite bullish, with demand expected to hit all-time highs in net balance terms. The picture on the consumer side was buoyant in Q4 and that trend is expected to continue in 2021. A net +7% of banks increased credit limits on credit cards, while a moderately smaller share charged a narrower spread over cost of funds. However, in a trend we will continue to note for other regions in this report, there is a seeming divergence between consumer lending behavior and the sentiment numbers. This indicates a pent-up ability to spend that will likely be realized in full as pandemic restrictions begin to lift. After the economic outlook, increased competition from other banks and non-bank lenders was another leading factor behind easing standards. This is in line with our view that plummeting corporate borrowing costs are the primary driver of easy financial conditions in the US (Chart 4). We have shown that credit standards lead the US high-yield default rate by a one-year period; easier credit standards will further improve the default outlook, creating a virtuous cycle for as long as the Fed maintains monetary support. Euro Area In the euro area, lending standards continued to tighten at a faster pace in Q4/2020 even though that number had been expected to fall (Chart 5). The key reason was a worsening in risk perceptions due to continued uncertainty about the recovery. Persistently low risk tolerance also contributed to the tightening of standards. The tightening was somewhat worse for small and medium-sized enterprises than for large enterprises, and was also more pronounced in longer-term loans. This pessimistic outlook on credit standards is in line with an elevated high-yield default rate that has not shown signs of rolling over as it has in the US. Going into Q1/2021, standards are expected to continue tightening, albeit at a slightly slower rate. Chart 5Euro Area Credit Conditions
Euro Area Credit Conditions
Euro Area Credit Conditions
Chart 6Credit Standards For Major Euro Area Economies
Credit Standards For Major Euro Area Economies
Credit Standards For Major Euro Area Economies
Business credit demand was grim as well, weakening at a faster pace in Q4. This was driven by falling demand for fixed investments. Chart 7ECB Support Will Bring Down The Italy-Germany Spread
ECB Support Will Bring Down The Italy-Germany Spread
ECB Support Will Bring Down The Italy-Germany Spread
Inventory and working capital financing needs, which spiked dramatically in Q2/2020 due to acute liquidity needs, continued to contribute positively to loan demand - albeit to a much lesser extent than previous quarters as firms had already built up significant liquidity buffers. The decline in credit demand was also significantly larger for longer-term financing. Taken together with fixed investment demand, which has been in significant and persistent decline since Q1/2020, this is an extremely troubling trend for the euro area economy, confirming the ECB’s fears that the capital stock destruction wreaked by Covid-19 has permanently lowered potential long-term growth. After staging a tentative recovery in Q3/2020, consumer credit demand once again weakened in Q4/2020, attributable to declining consumer confidence and spending on durable goods as renewed pandemic lockdowns swept through Europe. However, low interest rates did contribute slightly to lifting credit demand on the margin. The divergence between consumer credit and confidence is not as dramatic in the euro area as in other regions. With demand expected to pick up in Q1, any narrowing in this gap is largely dependent on whether the EU can recover from what is already being called a botched vaccine rollout. Looking individually at the four major euro area economies, standards continued to tighten at a slow pace in Germany while remaining flat in Italy (Chart 6). Standards tightened more slowly in Spain due to an improvement in risk perceptions but tightened at a faster pace in France for the very same reason. Elevated risk perceptions in France could reflect concern about high debt levels among French firms. Going forward, firms expect the pace of tightening to slow in France and Spain, while picking up in Germany. Meanwhile, standards are expected to tighten outright in Italy in Q1/2021. Bank lending, however, continues to grow at the strongest pace since the 2008 financial crisis, reflecting the extent of the extraordinary pandemic-related measures (Chart 7). The ECB’s cheap bank funding through LTROs is helping support loan growth in the more fragile economies of Italy and Spain. In the face of this, investors should fade concern about an expected tightening in credit conditions in Italy that could drive up the risk premia on Italian government bonds. UK Chart 8UK Credit Conditions
UK Credit Conditions
UK Credit Conditions
In the UK, overall corporate credit standards remained mostly unchanged, with corporate credit availability deteriorating very slightly (Chart 8). The increased reticence to lend to small businesses is justified by small business default rates, which saw the worst developments since Q2/2020. The demand side, meanwhile, has been volatile. The massive demand spike in Q2/2020 to meet liquidity needs was followed by a commensurate decline in the following quarter. The picture now appears to be stabilizing, with demand recovering to a stable level and expected to grow moderately in Q1/2021. Household credit demand strengthened, while credit standards for secured and unsecured loans to consumers eased in last quarter of 2020. While the recovery in consumer confidence has been muted, expect the divergence between credit demand and sentiment to fade as the UK moves towards lifting restrictions and households look to satisfy pent-up demand. The two predominant narratives of Q4/2020 in the UK were positive developments on the vaccine and the Brexit deal, both contributing to a massive reduction in uncertainty. This is reflected in the survey data, with lenders reporting that the economic outlook and improving risk appetites will contribute to easier credit standards in Q1/2021. The UK is currently leading developed market peers in terms of cumulative vaccinations per capita. In addition, Prime Minister Johnson will be unveiling next week a roadmap out of lockdown, another positive sign for the heavily services-weighted economy. Japan Chart 9Japan Credit Conditions
Japan Credit Conditions
Japan Credit Conditions
After decades of perma-QE and ultra-low rates, the Japanese credit market behaves in a contrary way to most other markets. In Q2/2020 at the height of the pandemic, while other lenders were tightening standards, Japanese lenders were actually easing standards (Chart 9). Since then, there has been a significant drop in the number of firms reporting easier standards. More importantly, none of the firms in the Q4/2020 survey reported tightening, meaning that borrowing conditions have not changed significantly since the massive liquidity injection in response to the pandemic. So, it appears that demand is the primary driver of the Japanese credit market. On balance, firms reported weaker demand for loans in Q4, citing decreased fixed investment, an increase in internally generated funds, and availability of funding from other sources. As we discussed in our last Credit Conditions chartbook,2 business lending demand in Japan is typically countercyclical, meaning that firms usually seek funds for precautionary or restructuring reasons. Going into Q1, survey respondents expect an increase in loan demand, which is in line with the recent deterioration in business sentiment. On the consumer side, loan demand rebounded strongly in Q4. Leading factors were an increase in housing investment and consumption. As in the UK, there has been a divergence between consumer credit demand and sentiment which will likely resolve as the recent resurgence in Covid-19 cases is brought under control. Canada & New Zealand In Canada, business lending standards eased slightly in Q4/2020, coinciding with a rebound in business confidence (Chart 10). As in other developed markets, the recovery was driven by vaccine optimism and hopes of reopening in 2021. The more important story for the Bank of Canada (BoC), however, is the overheating housing market. As we discussed last week in a Special Report published jointly with our colleagues at BCA Research Foreign Exchange Strategy,3 ultra-low rates have helped fuel another upturn in the Canadian housing market, with housing the most affordable it has been in five years, according to the BoC’s indicator. The strength in the housing market was supported by easing standards on mortgage lending, indicating that monetary and regulatory measures to bolster the market have seen quick and efficient pass-through. Although we expect the BoC to remain relatively dovish, a frothy housing market, and the resulting financial stability issues, are a key risk to that view. In New Zealand, fewer lenders reported a tightening in business loan standards, while standards for residential mortgages continued to tighten at an unchanged pace from the previous survey (Chart 11). Decreased risk tolerance and worsening risk perceptions were the key factors behind reduced credit availability; these were partly offset by changes in regulation and a falling cost of funds. Standards are expected to ease, and business loan demand is expected to pick up remarkably, by the end of Q1/2021. Chart 10Canada Credit Conditions
Canada Credit Conditions
Canada Credit Conditions
Chart 11New Zealand Credit Conditions
New Zealand Credit Conditions
New Zealand Credit Conditions
On the consumer side, while standards for residential mortgages continued to tighten at an unchanged pace during the survey period, they are expected to ease going forward. As in Canada, house prices are at the forefront of the monetary policy discussion in New Zealand, which means that the expected easing in standards might actually pose a problem for the Reserve Bank of New Zealand. Meanwhile, although consumer loan demand did weaken over the survey period, it is expected to stage a recovery this quarter. This view is bolstered by a strong recovery in consumer confidence, which is working its way up to pre-pandemic levels. Shakti Sharma Research Associate ShaktiS@bcaresearch.com Appendix: Where To Find The Bank Lending Surveys A number of central banks publish regular surveys of bank lending conditions in their domestic economies. The surveys, and the details on how they are conducted, can be found on the websites of the central banks: US Federal Reserve: https://www.federalreserve.gov/data/sloos.htm European Central Bank: https://www.ecb.europa.eu/stats/ecb_surveys/bank_lending_survey/html/index.en.html Bank of England: https://www.bankofengland.co.uk/credit-conditions-survey/2020/2020-q4 Bank of Japan: https://www.boj.or.jp/en/statistics/dl/loan/loos/index.htm/ Bank of Canada: https://www.bankofcanada.ca/publications/slos/ Reserve Bank of New Zealand: https://www.rbnz.govt.nz/statistics/c60-credit-conditions-survey Footnotes 1 The weblinks to each individual survey for the US, euro area, UK, Japan, Canada and New Zealand can be found in the Appendix on page 12. 2 Please see BCA Research Global Fixed Income Strategy Report, "Introducing The GFIS Global Credit Conditions Chartbook", dated September 8, 2020, available at gfis.bcaresearch.com. 3 Please see BCA Research Foreign Exchange Strategy Special Report, "Will The Canadian Recovery Lead Or Lag The Global Cycle?", dated February 12, 2021, available at fes.bcaresearch.com. Recommendations The GFIS Recommended Portfolio Vs. The Custom Benchmark Index
GFIS Global Credit Conditions Chartbook Q1/2021: A Tentative Recovery
GFIS Global Credit Conditions Chartbook Q1/2021: A Tentative Recovery
Duration Regional Allocation Spread Product Tactical Trades Yields & Returns Global Bond Yields Historical Returns
Last week, we observed that evidence from the past decade suggests that higher yields are not always a risk to stock prices, as long as the yield increase reflects favorable economic conditions, which also push up the dividend growth rate. Evidence from a…
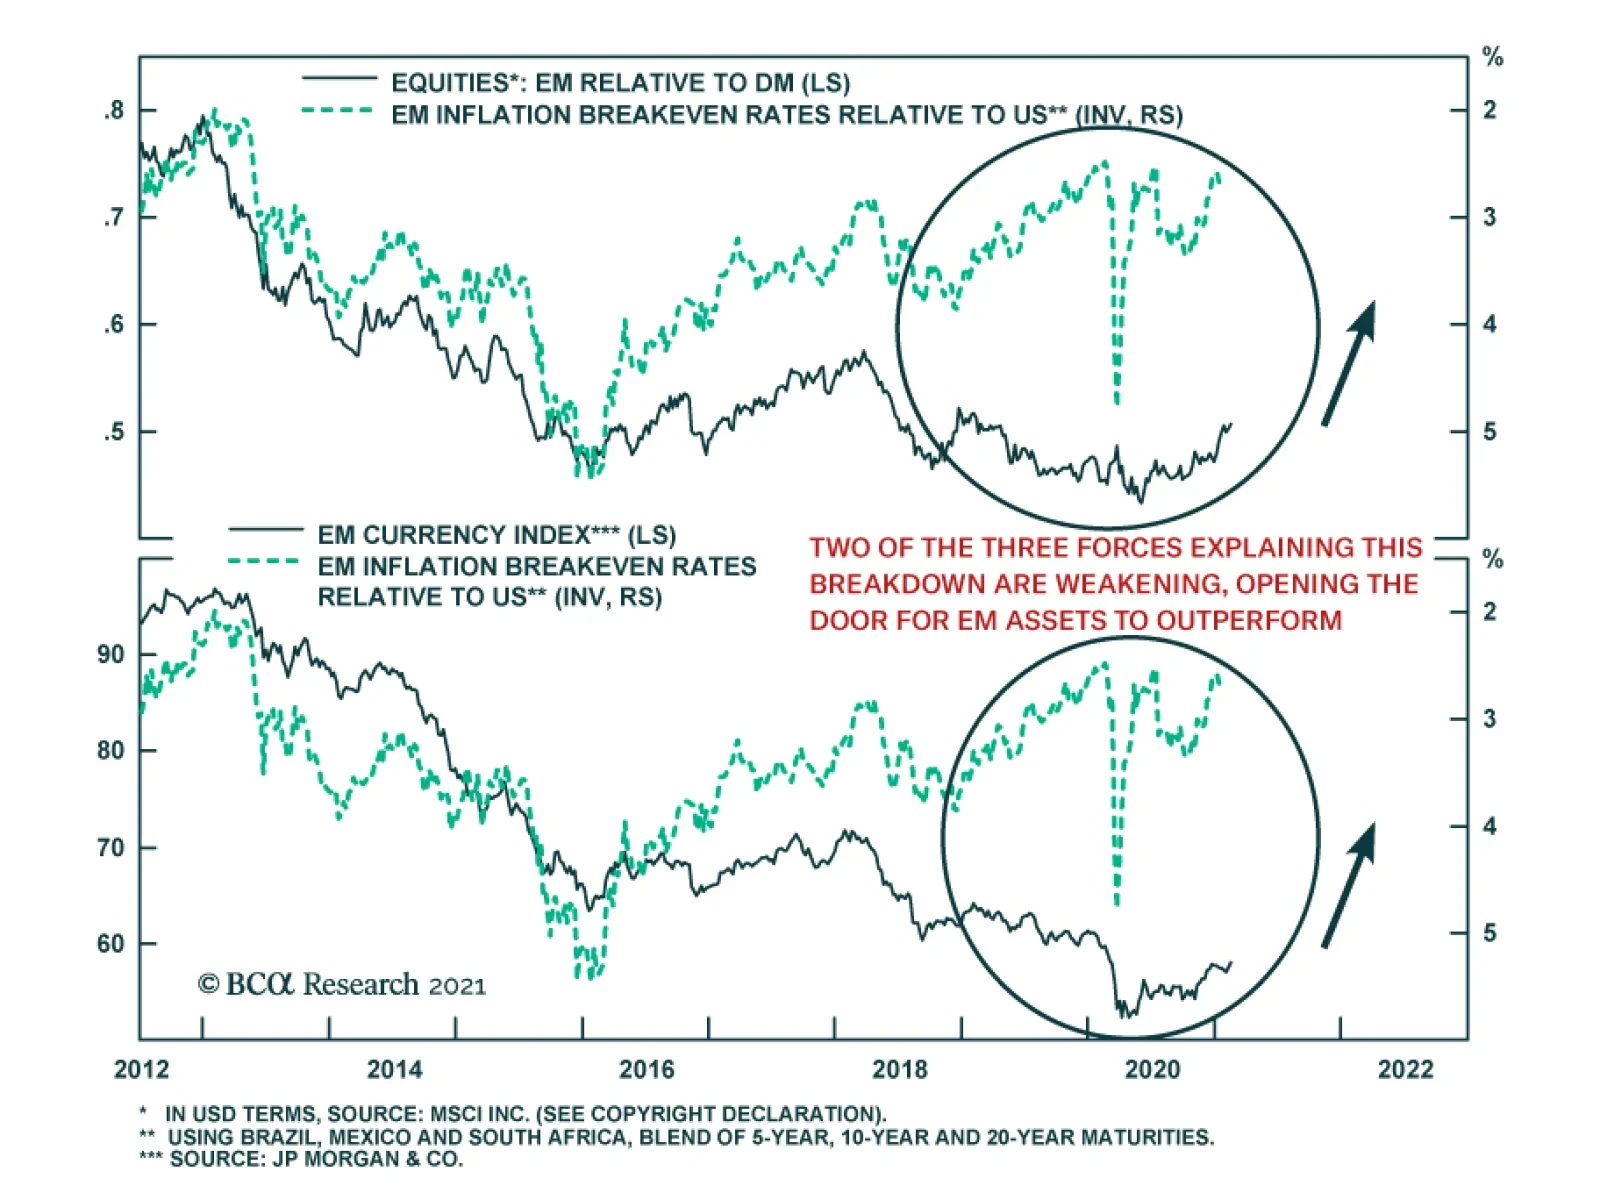
EM breakeven inflation rates have been steadily declining relative to the US. This is a very important dynamic. Flows into EM are very sensitive to the inflation outlook, and the perception of declining inflation risk invites foreign investors to pour…
Highlights The amount of fiscal stimulus in the pipeline is more than enough to close the US output gap. Inflation is likely to surprise on the upside this year. The Fed will brush off any evidence of economic overheating during the coming months, stressing the “transitory” nature of the problem. Still, long-term bond yields, over which the Fed has less control, will rise. As long as bond yields move higher in conjunction with improving growth expectations, stocks will remain in an uptrend. The bull market in equities will only end when the Fed starts to sound more hawkish. That is not in the cards for the next 12 months at least. Stimulus Smackdown During the past month, a debate has erupted over how much additional fiscal stimulus the US economy needs. The side arguing that the sea of red ink has gotten too deep includes an unlikely cast of characters like Larry Summers, who has famously contended that sustained large budget deficits are necessary to stave off secular stagnation. It also includes Olivier Blanchard, who previously served as the IMF’s chief economist and pushed the multilateral lender to abandon its historic adherence to fiscal austerity. Chart 1Generous Government Transfers Boosted Household Savings
Generous Government Transfers Boosted Household Savings
Generous Government Transfers Boosted Household Savings
Rather than citing debt sustainability concerns, these newfound stimulus skeptics worry that large-scale fiscal easing at the present juncture risks overheating the economy. They point out that President Biden’s proposed $1.9 trillion package, coming on the heels of the $900 billion stimulus bill Congress passed in late December, would inject another 13% of GDP into the economy, on the back of the lagged boost from the first stimulus package. We estimate that US households had accumulated $1.5 trillion in excess savings (7% of GDP) as of the end of 2020, thanks to the fiscal transfers they received under the CARES Act (Chart 1). US real GDP in the fourth quarter of 2020 was 2.5% below its level in the fourth quarter of 2019. Assuming trend growth of 2%, this implies that the output gap – the difference between what the economy is capable of producing and what it actually is producing – has widened by about 4.5% of GDP since the onset of the pandemic. The Congressional Budget Office (CBO) believes the US economy was operating 1% above potential in Q4 of 2019, suggesting that the output gap is around 3.5% of GDP. As it has in the past, the CBO is probably understating the amount of slack in the economy. Our guess is that the US was close to full employment in the months leading up to the pandemic, which implies that the output gap is currently somewhere between 4% and 5% of GDP. While fairly large in absolute terms, it is still smaller than the amount of stimulus currently in the pipeline. Gentle Jay Not So Worried About Overheating Stimulus advocates argue that households will continue to use stimulus checks to fortify their balance sheets, rather than rush out to spend the windfall. They also note that unemployment payments will come down if the labor market recovers more quickly than projected. And even if the economy does temporarily overheat, “so what” they say. The Fed has been trying to engineer an inflation overshoot for years. Now is its chance. Jay Powell seems to sympathize with this thesis. Speaking at a virtual conference organized by The Economic Club of New York this week, Powell repeated his call for fiscal easing and told attendees that the Fed is unlikely to “even think about withdrawing policy support” anytime soon. His words echo remarks made at the press conference following January’s FOMC meeting, where he said “I’m much more worried about falling short of a complete recovery and losing people’s careers,” before adding: “Frankly, we welcome slightly higher inflation.” Most other FOMC members have struck a similar tone. Earlier this year, Fed Governor Lael Brainard noted that “The damage from COVID-19 is concentrated among already challenged groups. Federal Reserve staff analysis indicates that unemployment is likely above 20 percent for workers in the bottom wage quartile, while it has fallen below 5 percent for the top wage quartile.” How Big Is The Fiscal Multiplier From Stimulus Checks? Chart 2Service Inflation Fell During The Pandemic, While Goods Inflation Rose
Service Inflation Fell During The Pandemic, While Goods Inflation Rose
Service Inflation Fell During The Pandemic, While Goods Inflation Rose
One of the reasons that households saved much of last year’s stimulus checks was because there was not much to spend them on. Officially measured service inflation was well contained last year, but many services were simply not available for purchase. In contrast, goods prices, which usually fall over time, rose (Chart 2). As the economy opens up, total spending will recover. Rising household spending will have a multiplier effect. The simplest version of the Keynesian multiplier for fiscal transfer payments is equal to MPC/(1-MPC), where MPC is the marginal propensity to consume. Assuming that households initially spend 50 cents of every dollar they receive, the multiplier would be 0.5/(1-0.5)=1. In other words, every dollar of direct stimulus payments will eventually generate one additional dollar of aggregate demand. One could argue that this multiplier estimate overstates the impact on demand because it ignores the fact that households will regard stimulus checks as one-time payments rather than a continuous flow of income. One could also point out that taxes and imports will cut into the multiplier effect on domestic spending. There is truth to all these arguments, but they are not as compelling as they seem. According to a recent US Census study, only 37% of Americans reported no difficulty in paying for usual household expenses during the pandemic. A mere 16% of workers with incomes below $35,000 reported no difficulty, compared with more than two-thirds of workers with incomes above $100,000 (Chart 3). In the euphemistic parlance of economics, most US households are “liquidity constrained,” meaning that they are likely to spend a large chunk of any income they receive, even if it is a one-off grant.1 Chart 3The Pandemic Has Put A Spotlight On The Liquidity Constraints Of US Households
Higher Bond Yields: Where Is The Breaking Point?
Higher Bond Yields: Where Is The Breaking Point?
As for taxes, while the income from subsequent spending will be taxed, the stimulus checks that households receive will remain untaxed. Granted, some of the demand generated by stimulus checks will leak abroad in the form of higher imports. However, keep in mind that the US is a fairly closed economy – imports account for only 15% of GDP. Moreover, the full impact on imports depends on what happens to the value of the dollar. If the Fed keeps rates unchanged but inflation rises, the accompanying decline in short-term real rates could weaken the dollar, curbing imports and boosting exports in the process. This could lead to a higher multiplier rather than a lower one. Lastly, higher consumption is likely to boost corporate capex, as companies scramble to raise capacity in anticipation of strong demand (Chart 4). Economists call this the “accelerator effect.” Investment spending is 2.5-times as volatile as consumption. Hence, even modest increases in consumption can trigger large increases in investment. Chart 4Stronger Consumption Tends To Boost Capex
Stronger Consumption Tends To Boost Capex
Stronger Consumption Tends To Boost Capex
Unemployment Benefits: Adding To Aggregate Demand But Subtracting From Supply? As Chart 5 shows, stimulus payments to households account for 17% of the December stimulus bill and 26% of Biden’s proposed package for a combined total of around $650 billion (3% of GDP, or around two-thirds of the current output gap). The balance consists of expanded unemployment benefits, health and education funding, support for small businesses, and aid to state and local governments. Chart 5Stimulus Package Breakdowns
Higher Bond Yields: Where Is The Breaking Point?
Higher Bond Yields: Where Is The Breaking Point?
Unemployment benefits are likely to be spent fairly quickly since, in most cases, they replace lost income that had previously been used to finance consumption. More generous unemployment benefits could temporarily reduce aggregate supply. Higher federal unemployment benefits would more than offset the lost income of close to half of jobless workers, potentially creating a disincentive to seek employment. Inflation Expectations Will Continue To Rise Aggregate demand is likely to outstrip the economy’s supply-side potential over the coming months. Hence, inflation will probably surprise on the upside this year, although not by enough to force the Fed to abandon its easy money stance. Inflation expectations have recovered since the depths of the pandemic. However, the 5-year/5-year forward TIPS breakeven rate is still below the level that BCA’s bond strategists believe the Fed regards as consistent with its long-term inflation objective, and even farther below the level that would cause the Fed to panic (Chart 6). This suggests that the Fed will brush off any evidence of overheating during the coming months, stressing the “transitory” nature of the problem. Still, rising inflation expectations will push up long-dated bond yields. At present, the 5-year/5-year forward Treasury yield stands at 1.89%. This is below the median estimate of the long-run equilibrium fed funds rate from the New York Fed’s Survey of Primary Dealers (Chart 7). With policy rates on hold, higher long-term bond yields will translate into steeper yield curves. We expect the 10-year Treasury yield to rise to 1.5% by the end of the year from the current level of 1.16%, with risks to yields tilted to the upside. Chart 6Inflation Expectations Have Recovered But Are Still Below Levels That Would Cause Concern For The Fed
Inflation Expectations Have Recovered But Are Still Below Levels That Would Cause Concern For The Fed
Inflation Expectations Have Recovered But Are Still Below Levels That Would Cause Concern For The Fed
Chart 7Forward Treasury Yields Are Below Primary Dealers' Projections
Forward Treasury Yields Are Below Primary Dealers' Projections
Forward Treasury Yields Are Below Primary Dealers' Projections
Can Stocks Stand The Heat? To what extent will higher bond yields hurt stocks? To get a sense of the answer, it is useful to consider a dividend discount model. The simplest model, the Gordon Growth Model, says that the price of a stock, P, should equal the dividend that it pays, D, divided by the difference between the long-term discount rate, r, and the expected dividend growth rate, g:
Higher Bond Yields: Where Is The Breaking Point?
Higher Bond Yields: Where Is The Breaking Point?
We can write the discount rate as the combination of the long-term risk-free rate and the equity risk premium such that r = rf + ERP and then solve for the dividend yield:
Higher Bond Yields: Where Is The Breaking Point?
Higher Bond Yields: Where Is The Breaking Point?
Note that the value of the stock market becomes increasingly sensitive to changes in the risk-free rate when the dividend yield is low to begin with. For example, if the dividend yield is 2%, a 10-basis-point rise in the long-term risk-free rate will push down stock prices by 5%. In contrast, if the dividend yield is 1%, a 10-basis-point rise in the long-term risk-free rate will push down stock prices by 10%. Today, dividend and earnings yields for most global equity sectors are quite low, although not as low as they were in 2000 (Chart 8). Watch The Correlation Between r And g The fact that dividend and earnings yields are below their long-term average does make stocks vulnerable to a rise in bond yields. This is especially the case for relatively expensive equity sectors such as tech and consumer discretionary. Nevertheless, there is an important mitigating factor at work: Increases in the risk-free rate have generally been accompanied by stronger growth expectations. Chart 9 shows that S&P 500 forward earnings estimates have moved in lockstep with the 10-year Treasury yield, a proxy for the long-term risk-free rate. Chart 8Global Dividend And Earnings Yields Are Quite Low, Although Not As Low As In 2000
Global Dividend And Earnings Yields Are Quite Low, Although Not As Low As In 2000
Global Dividend And Earnings Yields Are Quite Low, Although Not As Low As In 2000
Chart 9Earnings Estimates Move In Lockstep With Bond Yields
Earnings Estimates Move In Lockstep With Bond Yields
Earnings Estimates Move In Lockstep With Bond Yields
This suggests that the main danger to equity investors is not higher bond yields per se, but a rise in bond yields in excess of upward revisions to growth expectations, or worse, against a backdrop of faltering growth. Such a predicament could eventually manifest itself. However, it is only likely to happen when the Fed turns hawkish. This is not in the cards for the next 12 months at least. Peter Berezin Chief Global Strategist pberezin@bcaresearch.com Footnotes 1 The difficulty that many households have had in making ends meet predates the pandemic. For example, in May 2019, the Consumer Finance Protection Bureau found that about 40% of US consumers claimed that they had difficulty paying bills and expenses. Among those with annual household incomes of $20,000 or less, difficulties were experienced by 6 out of 10 people. Moreover, about half of consumers reported that they would be able to cover expenses for no more than two months if they lost their main source of income by relying on all available sources of funds, including borrowing, savings, selling assets, or even seeking help from family and friends. Global Investment Strategy View Matrix
Higher Bond Yields: Where Is The Breaking Point?
Higher Bond Yields: Where Is The Breaking Point?
Special Trade Recommendations
Higher Bond Yields: Where Is The Breaking Point?
Higher Bond Yields: Where Is The Breaking Point?
Current MacroQuant Model Scores
Higher Bond Yields: Where Is The Breaking Point?
Higher Bond Yields: Where Is The Breaking Point?
Highlights The Biden administration’s budget reconciliation bill will close the output gap, so markets will have to start thinking about upcoming tax hikes, rising wages, and eventual Fed interest rate hikes. Biden’s lax immigration policies will not have a major negative impact on wage growth. A doubling of the minimum wage, which could still make it into one of two budget reconciliation bills, would include a measure to index the post-2026 minimum wage to the average rate of wage rises. Biden’s industrial policy and support of labor unions would also increase wages. Stay long Treasury inflation-protected securities versus duration-matched Treasuries and long value stocks over growth stocks. Feature The Senate and House of Representatives passed a concurrent resolution on the budget for FY2021, the first step in the budget reconciliation process that will enable Democratic leadership to pass President Joe Biden’s $1.9 trillion American Rescue Plan with only a simple majority in the Senate. The budget resolution is a fantasy that the ruling party uses to bypass the Senate filibuster, as was the case under George W. Bush, Barack Obama, and Donald Trump. The latest such resolution claims that the budget deficit will be smaller, not larger, after the Biden rescue plan than what is currently projected by the Congressional Budget Office (Chart 1). It envisions the entire $1.9 trillion being spent in 2021 and then a huge drop in expenditures in 2022. A fiscal cliff ahead of the 2022 midterm election will not occur. Instead the second budget reconciliation maneuver, for FY2022, will increase spending levels once again with infrastructure and green projects, as per Biden’s campaign platform. Chart 1Democrats Pass Budget Resolution
Biden Opens The Border
Biden Opens The Border
The FY2021 budget resolution does not contain any tax increases, “revenue offsets,” to keep the budget in line because the COVID relief is emergency spending that is one-off, not recurring. The FY2022, however, will aim partially to repeal President Trump’s tax cuts. As such financial markets will continue to “buy the rumor” of additional fiscal spending for now but they will also sell the news given that the next reconciliation bill will push up inflation expectations even further, hasten the Federal Reserve’s policy normalization, and include tax hikes. And the current buy-the-rumor phase could be interrupted anyway by Biden’s immediate foreign policy challenges. Larry Summers And The Output Gap Democrats will err on the larger side of the $1.9 trillion stimulus because they regret erring on the smaller side back in 2009. But it is still possible for the price tag to be knocked down to around $1.5 trillion given that the economy is recovering and several moderate Democrats will balk at the enormous size. After all, $900 billion passed at the end of the year is not yet spent. Biden has already compromised by raising the eligibility requirements for households to receive $1,400 stimulus checks. Larry Summers, a frequent guest at the annual BCA conference and a veteran of the Clinton and Obama White Houses, has stirred up a firestorm over the past month by warning that too much federal money spent on short-term cash handouts today would crowd out the administration’s political capital and the amount of deficit spending that is available for long-term, productivity-enhancing investments. Summers warned that the current proposed stimulus is three times larger than required to fill the output gap. Chart 2 shows the output gap from 2009-12 and projected from 2021-24 alongside the size of the relevant stimulus packages to illustrate his point. Treasury Secretary Janet Yellen defended the $1.9 trillion price tag – like Summers, she is not normally one to worry about overheating the economy, but unlike Summers, she is now an administration official. She predicted that this size of package would bring the economy back to full employment by next year. The Congressional Budget Office, based on earlier congressional actions, had predicted employment would not return to its pre-COVID level until around 2024. The administration will look to Yellen now and in future to make the call on when enough stimulus is enough. With inflation expectations recovering rapidly, the Fed could be forced to hike rates as early as late 2022, though we think 2023 is more likely given our methodological bias as political analysts. This means the scope for overheating is quite large – a point reinforced by the comparison with the economic recovery back in 2009 (Chart 3). Summers’s criticism is not remiss and could come back to haunt the administration.1 When inflation picks up, the Fed will have to allow an overshoot according to its new policy of targeting average inflation. But once it is assured, it will have to start hiking rates. And once it starts hiking rates it could trigger a recession. Plus, even if we set recession risks aside, Summers’s critical point is that too much stimulus today will reduce the political and budgetary scope for Biden’s long-term agenda, which includes what will likely be his second major bill focused on infrastructure and renewables. The reconciliation process makes it highly likely that Democrats will drive through this initiative through the Senate but not if moderate Senate Democrats balk in the face of rising budget deficits and inflation. Chart 2How Much Is Too Much Stimulus?
Biden Opens The Border
Biden Opens The Border
Our base case still holds that Democrats will pass both reconciliation bills over the next roughly 12 months but investors should keep Summers’s warning in mind. Chart 3Recovery Is Ahead Of The Previous Cycle
Recovery Is Ahead Of The Previous Cycle
Recovery Is Ahead Of The Previous Cycle
There are tailwinds for Biden’s agenda. First, his political capital is moderate-to-strong and likely to strengthen over the coming year. It will get bumped up by improving economic conditions, including most recently a marked decline in bankruptcy filings from Q3 to Q4. Our updated Political Capital Index is shown in the Appendix. Second, concern about budget deficits has eroded, as Republican fiscal largesse showed under Trump – the pandemic and atmosphere of crisis greatly reinforce this point. Third, divisions in the Republican Party have produced as many as five moderates who could assist Biden in winning close legislative votes – even beyond the relatively easy passage of the American Rescue Plan in his honeymoon period. This Republican Party split is the only significance of President Trump’s second impeachment. Trump’s legal woes will continue after he is acquitted in the Senate. The deeper Republicans are divided over Trump’s legacy the harder time they will have recovering in the 2022 midterms, where opposition parties are normally favored. But the Biden administration’s leftward agenda will bring Republicans together, especially once the country moves out of the crisis. One of the biggest battles looms over the southern border. Bottom Line: The $1.9 trillion American Rescue Plan will more than close the output gap and yet it is only one of two budget reconciliation bills that the Biden administration will seek to pass over the next 12 months. There are still domestic and international factors that could impede the recovery, not least China’s policy tightening, but the risk of excessively short-term stimulus at the expense of long-term public investment is clear. Republicans Will Regroup Over Immigration To Summers’s warning about Biden’s legislative window of opportunity, recall that President Trump never achieved his signature 2016 policy promise – to build a wall on the border with Mexico – because congressional Republicans led him to prioritize repealing and replacing the Affordable Care Act (which failed) and passing the Tax Cut and Jobs Act (which succeeded). There was no political capital left for a major legislative push on the border and immigration. Immigration is one of the areas where Biden has a major incentive to push his policies aggressively. Immigrants tend to skew Democratic in their party affiliations. Americans increasingly believe immigration should be increased, a trend that accelerated after Trump’s election on an avowedly anti-immigration platform (Chart 4, top panel). Today 34% believe it should be increased in addition to 36% who are comfortable with the current level. Meanwhile the number who believe it should be decreased has fallen to 28%, down from 34%-38% around the time of Trump’s election. An anti-immigration candidate may be able to win within the Republican Party (especially under the specific circumstances of 2015-16) but he or she will have trouble winning general elections. Trump himself discarded the topic in the 2020 race. For Democrats, immigration is also probably the single most effective way to drive a wedge between the populist and establishment factions of the Republican Party. For example, establishment Republican presidents oversaw huge infusions of foreigners into US society, the 1986 Immigration and Reform Control Act, which granted amnesty to three million illegal immigrants, and the 1990 Immigration Act, which increased the quota of legal immigrants. By contrast Trump rose to power by attacking the bipartisan consensus on “open borders.” As long as a substantial cohort of Republicans defends immigration on free market principles, and upholds the corporate interest in having plentiful availability of lower wage seasonal and specialized workers, the party will be divided. The above points explain why the Biden administration will pursue immigration reform more intently than public opinion would leave one to believe. Polls show that voters want to focus on the economic recovery, the pandemic response, and social and civil rights policies more than immigration. There is no question that Biden is prioritizing the pandemic, the economy, and health care (Chart 4, bottom panel). But the Democratic Party has a strategic interest in expanding immigration so Biden will continue to plow forward with executive orders and comprehensive immigration reform in Congress. The US does need immigration reform – to ensure the flow is orderly. President Trump’s “wall” proposal did not come out of nowhere. Like the “Know Nothing Party” that emerged in the 1840s and rose to prominence in the 1850s, the Trump movement arose amid a historic increase in the foreign-born share of the population (Chart 5). But Trump’s policies hardly made a dent in the flow of legal immigrants into the US. Now Biden will reverse them and encourage more incomers. Therefore immigration will persist as a bone of contention in the 2020s. Granted, immigration has amply attested positive effects on the economy – including most clearly by lifting the US’s fertility rate so that it does not suffer from as rapid of an aging process as other developed countries. Indeed, voters are primarily concerned about illegal, not legal, immigration. Still, Republicans will struggle to walk the line between tighter immigration policies and appealing to an audience beyond “old white folks.” This suggests the Biden administration has room to run. Chart 4Public Not Too Concerned About Immigration
Public Not Too Concerned About Immigration
Public Not Too Concerned About Immigration
Chart 5Historically Large Foreign-Born Population
Biden Opens The Border
Biden Opens The Border
It helps Biden that the post-World War II and post-Cold War booms in legal immigration are relatively measured when compared to the overall population. The inflow of migrants was around 0.3% in 2019, very far from its post-war peak of 0.7% per year (Chart 6). Thus the Biden administration will not be overly concerned about being too progressive on this issue. Chart 6Boom In Legal Immigration Less Impressive Relative To Population
Biden Opens The Border
Biden Opens The Border
Chart 7Detainees On The Mexican Border
Biden Opens The Border
Biden Opens The Border
Illegal immigration is the biggest factor motivating periodic public backlashes such as in 2016. Southwestern border apprehensions – the only credible way to measure the unauthorized flow of people over the Mexican border – spiked under President Obama as well as President Trump, though US agents detained nowhere near the numbers witnessed in the 1980s and 1990s (Chart 7). The stock of illegal immigrants in the US ranges from 10-11 million and has remained flat, or fallen slightly, since the financial crisis of 2008. The weakening of the US economy, in the context of tighter border security, reduced incentives to make the difficult journey (Chart 8). The fact that President Obama and Trump increased detentions suggests that the demand to get into the country recovered over the course of the last business cycle. Based on President Biden’s voting record in the Senate and statements during the 2020 campaign, he is not an ultra-dove on the border – but his party has moved to the left on the issue. This is clear from his rivals’ positions in the Democratic primary election. Even his Vice President Kamala Harris, who was not the most radical on stage, supported decriminalizing illegal border crossings and downgrading Immigration and Customs Enforcement. Still, until Democrats repeal the filibuster in the Senate, they will not have a chance of passing comprehensive immigration reform with Republicans unless they accept stronger enforcement provisions. Biden voted for the 2006 Secure Fence Act but more recently has emphasized high-tech upgrades to better monitor crossovers. Harris also accepted high-tech security funding that did not involve building a wall. Even with these compromises, it will still be a stretch to find 10 Republicans willing to cross the aisle on this issue while Trump and his faction remain active to punish them in primary elections. Chart 8Estimate Of Total Illegal Immigrants
Biden Opens The Border
Biden Opens The Border
The demand to enter the US will revive once the pandemic is over. The big surge in illegal border crossings in the 1980s-90s coincided with a period in which US economic growth and wellbeing far outpaced that of Mexico and Central America (Chart 9). The gap in GDP per capita is the crudest possible measure and does not reflect the dramatic differences in quality of life that drive people to relocate. Nevertheless, the gap remains drastic, especially with Mexico. Chart 9The Grass Is Greener On The Other Side
Biden Opens The Border
Biden Opens The Border
The gap in current economic activity, such as manufacturing PMIs, between the US and Mexico is as wide as ever. Even as manufacturing contracts in Mexico, the demand for workers in US service industries is soaring (Chart 10). Moreover the US economic revival will be super-charged by the gargantuan fiscal stimulus of 2020-21 whereas Mexican government support for the economy is comparatively austere (Chart 11) Chart 10Super-Charged US Recovery Opens Big Gap With Mexico
Super-Charged US Recovery Opens Big Gap With Mexico
Super-Charged US Recovery Opens Big Gap With Mexico
Chart 11Less Government Support In Mexico Than US
Less Government Support In Mexico Than US
Less Government Support In Mexico Than US
Bottom Line: Biden is opening up the borders at a time of economic disparity between the US and Latin America that will lead to an influx of immigration. This is positive for US labor force growth and productivity but it will be hard to pass a long-term solution through Congress. The Republican Party is deeply divided on the issue today but it is likely to become a rallying cry as numbers of newcomers increase and as Trump-style populism remains an active force within the party. Immigration, Wages, And The Minimum Wage The macroeconomic and market impact of easier border and immigration controls boils down to the impact on wages. There is a vast literature on this subject and we will not pretend to be comprehensive. We will merely make a few observations. The foreign-to-native-born wage differential has narrowed substantially over the past twenty years. The discount to hire immigrants has shrunk from 24% to 15% (Chart 12). This is a reflection of the high demand for immigrant labor and especially the increase in high-skilled workers alongside the booming tech, legal, financial, personal care, and health care industries in the United States – the fastest growing sectors for foreign-born workers since 2003. Earnings growth for foreign workers is more cyclical than for native workers and has been rising faster in recent decades (Chart 13). Chart 12Immigrants Command A Higher Price Than They Used To
Biden Opens The Border
Biden Opens The Border
Chart 13Immigrant Wages Grow In Boom Times
Biden Opens The Border
Biden Opens The Border
Immigrants work the lowest-wage jobs and hence there is some correlation between the share of foreign-born workers in any given industry and the hourly wage, just as there was at the turn of the century (Chart 14). But it does not follow that an increase in immigration suppresses wages as a whole. Chart 15 shows that, over the last business cycle at least, a change in the foreign worker share of a given industry does not correlate with a change in wage growth. Of course, it stands to reason that increasing the supply of labor decreases the price. But not if demand is growing sufficiently to raise the price for all workers. As we have seen, since migrants are willing to undertake long and dangerous journeys for work, they are likely to go where the demand is strong and the price is right – and the flow drops when the jobs dry up. Chart 14Immigrants Work The Lowest Wage Jobs
Biden Opens The Border
Biden Opens The Border
Chart 15More Immigration Not Necessarily A Pay Cut
Biden Opens The Border
Biden Opens The Border
Academics debate the impact on wages. There could be a negative impact, especially for low-skilled native workers, but the aggregate effect is small. One study showed that wages for native workers fell by three percent cumulatively over the 20-year period from 1980-2000 due to immigration.2 This is not dramatic. We can test the connection between immigration and wage growth informally by plotting the growth of southwest border detentions and legal permanent residence admissions alongside that of real wages. There is no clear relationship either way (Chart 16). The same is true if we test it with real median wages – the surge in border apprehensions under President Trump coincided with a boom in wages across the spectrum. Chart 16Border Influx Does Not Suppress Wages
Border Influx Does Not Suppress Wages
Border Influx Does Not Suppress Wages
Thus we cannot rule out the possibility that the Biden administration’s relaxation of border controls will have a dampening effect on wages over the long run but we cannot endorse it either. Chances are that the rollout of COVID-19 vaccines and government spending will continue to power a recovery that tightens the labor market and lifts wages for most workers. What about the administration’s simultaneous policy of doubling the federal minimum wage to $15 per hour by the year 2026 – and indexing wage growth after that date to the median hourly wage? The minimum wage hike might yet make it into the budget reconciliation bill under negotiation – but Biden has already signaled it can be delayed. There is a growing fear about the negative impact on small businesses struggling during the pandemic. The Congressional Budget Office estimates that anywhere from 1 million to 2.7 million jobs could be lost in 2025 if the wage hike were implemented now and businesses would pay $333 billion.3 But the proposal will return when the second budget reconciliation bill is up for consideration unless the Senate parliamentarian rules it out, in which case its passage becomes much less likely. Only about 2% of workers are paid at or below the current minimum wage of $7.25 per hour so a minimum wage hike but the CBO estimates that 10 percent of workers would be below the proposed wage level by 2025 (Chart 17). The states with higher proportions of minimum wage workers will be the ones most affected and are mostly in the south, including South Carolina, Mississippi, Kentucky, and Texas, though there are a few in the north such as New Hampshire and Pennsylvania (Chart 18). Chart 17Most Workers Earn More Than Minimum Wage
Biden Opens The Border
Biden Opens The Border
Chart 18Minimum Wage Workers By State
Biden Opens The Border
Biden Opens The Border
Previous minimum wage hikes did not prevent the economy from reaching full employment – nor did they lead to a lasting pickup in overall wage growth. But indexation to overall wage growth would mark a big change in favor of an eventual wage-price spiral. It cannot be ruled out given that the reconciliation option might be available to Democrats, though it would not take effect till 2026. Bottom Line: There is no firm link between immigration growth and wage growth. Increased immigration flows often coincide with higher incomes and wages as growth and productivity improve. Meanwhile a change in the minimum wage will have a limited impact from a macro point of view alone but a bigger impact if it is indexed to wage growth after 2026, which is possible. In the coming years the much greater impact of Biden’s policies will stem from the massive infusion of fiscal spending he is likely to pass through Congress, which will close the output gap quickly and put upward pressure on wages. Investment Takeaways Easier immigration and a higher minimum wage are not the only Biden policies that will affect wages. One of the biggest developments since Biden took office is his confirmation that he will maintain a tougher trade policy than his predecessors, excluding Trump. Biden won the election among Midwestern blue collar voters at least partly by stealing Trump’s thunder on trade and globalization. Since taking office he has issued a “Buy American” executive order and declared that he will maintain “extreme” competition with China. His cabinet appointees – notably Antony Blinken at the State Department and Janet Yellen at the Treasury – have given words of warning to China over trade as well. Geopolitical risk is one reason we are cutting back on our participation in the market’s exuberance at the moment, given that critical foreign policy stances are likely to be tested early in Biden’s term. But there is also a long-term implication of the Democrats’ marginal increase in protectionism. It was the overall policy context of hyper-globalization that led to sluggish wage growth in the United States over the previous forty years. A major factor was the decline of manufacturing and unionization as a result of a lack of competitiveness in the US as global production came online. The erosion in manufacturing jobs only stopped in recent years (Chart 19). Popular support for unions has risen to levels last seen in the late 1970s and 1990s since the Great Recession – under Trump even Republicans talked up unions. Chart 19Blame Fall In Manufacturing, Not Foreign Workers, For Flat Wages
Blame Fall In Manufacturing, Not Foreign Workers, For Flat Wages
Blame Fall In Manufacturing, Not Foreign Workers, For Flat Wages
Biden’s policies outlined above are reminiscent of the “third way” Democrats in the 1990s – particularly Bill Clinton, who oversaw an increase in the minimum wage and a surge in both legal and illegal immigration. But on trade Biden is shaping up to be more like Trump than Clinton, albeit directing his protectionism more at China than other trade partners. His spending bills will also use fiscal spending to promote industrial policy. Meanwhile labor protections will go up and unionization will at least stem its multi-decade decline. For the stock market the risk of higher wages looms mostly due to the super-charging of the economy with stimulus. But shoring up domestic manufacturing, unions, labor perks and protections, and possibly indexing the minimum wage will contribute to faster wage growth and – to corporations – higher employment costs (Chart 20). This is a headwind to the corporate earnings outlook. But like the Biden administration’s tax hikes it is not yet affecting the market’s overall bullishness – and may not until the first reconciliation bill passes and the narrative shifts from stimulus to structural reform. Investors may soon find out that they will be dealing with higher wages, higher taxes, higher inflation, and a higher cost of capital. Chart 20Higher Wages, Lower Corporate Profits
Higher Wages, Lower Corporate Profits
Higher Wages, Lower Corporate Profits
Matt Gertken Vice President Geopolitical Strategy mattg@bcaresearch.com Jesse Anak Kuri Associate Editor jesse.Kuri@bcaresearch.com Appendix Table A1APolitical Capital: White House And Congress
Biden Opens The Border
Biden Opens The Border
Table A1BPolitical Capital: Household And Business Sentiment
Biden Opens The Border
Biden Opens The Border
Table A1CPolitical Capital: The Economy And Markets
Biden Opens The Border
Biden Opens The Border
Table A2Political Risk Matrix
Biden Opens The Border
Biden Opens The Border
Table A3Biden’s Cabinet Position Appointments
Biden Opens The Border
Biden Opens The Border
Footnotes 1 See BCA Global Investment Strategy, “Fiscal Stimulus: How Much Is Too Much?” January 8, 2021, bcaresearch.com. 2 George J. Borjas and Stephen J. Trejo, “The Evolution of the Mexican-Born Workforce in the United States,” in Borjas, ed, Mexican Immigration to the United States (Chicago: Chicago University Press, 2005), pp.13-55. 3 See “The Budgetary Effects of the Raise the Wage Act of 2021,” Congressional Budget Office, February 2021, cbo.gov.
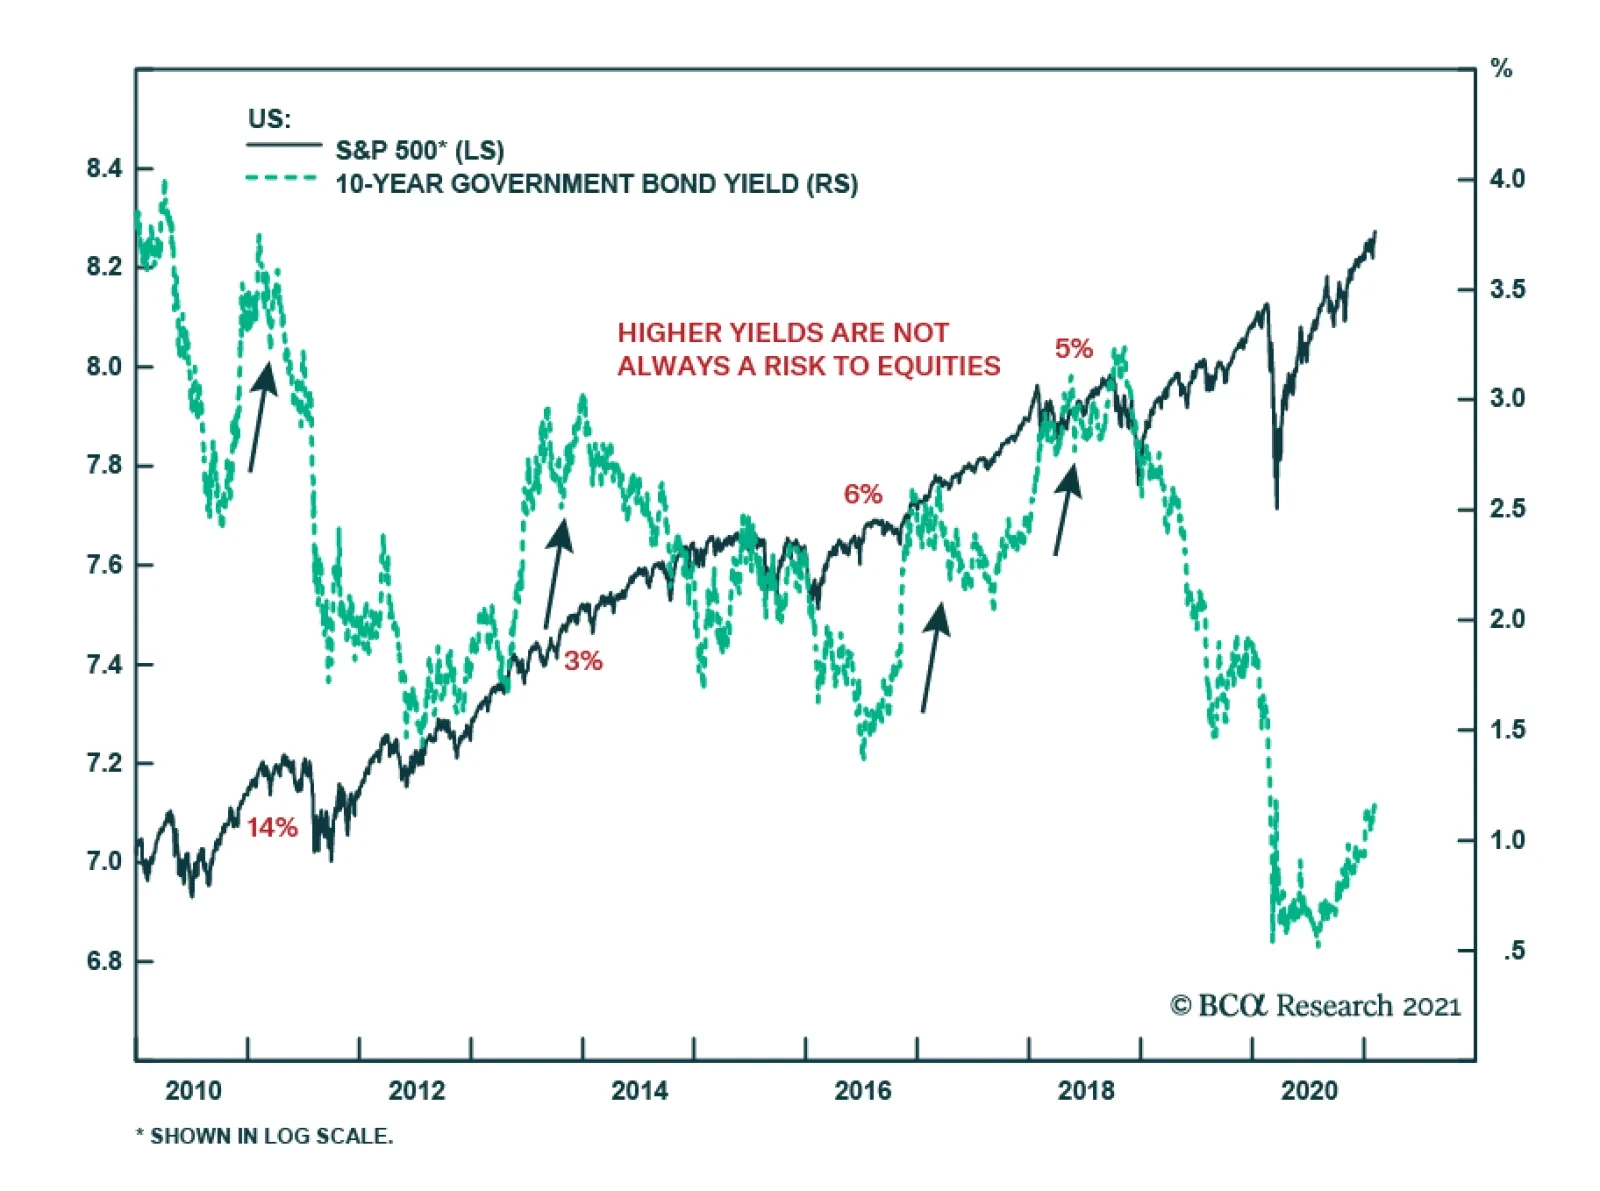
After bottoming in early August, US 10-year Treasury yields have risen steadily, just shy of the 1.2 mark. Do higher yields create a risk for equities? The dividend discount model provides some insight. The dividend yield can be expressed as a function of…
Dear client, On behalf of the China Investment Strategy team, I would like to wish you a very happy, healthy, and prosperous Chinese New Year of the Ox (Bull)! Gong Xi Fa Chai, Jing Sima, China Strategist Highlights A projected 8% increase in China’s real GDP for 2021 will not be an acceleration from the V-shaped economic recovery from the second half of last year. Excluding an exceptionally strong year-over-year economic expansion in Q1, the average growth in the rest of this year will be slower than in 2H20, which implies China’s economic growth momentum has already passed its peak. On a quarter-over-quarter basis, an expected 18% annual growth in Q1 would mean that China’s economic growth momentum has moderated from Q4 last year. Chinese policymakers are not in a hurry to press the stimulus accelerator again, with good reason. Commodity and risk-asset prices will be the most vulnerable to a weakened demand growth. Feature China’s real GDP is expected to grow by more than 8% this year, which would be a significant improvement over last year’s 2.3%.1 However, it is misleading to compare this year’s growth with that of 2020 as a whole. The first three months of this year will undergo an exceptionally high year-on-year growth (YoY) rate due to the deep contraction experienced in Q1 last year. An 8% annual growth for 2021 would imply that the rate of economic expansion in the rest of this year will be slower than the sharp recovery in 2H20. From a policy perspective, an 8% real GDP growth in 2021 implies an average rate of 5% over the 2020-2021 period, within the long-term growth range targeted in China’s 14th Five-Year Plan - this removes policymakers’ incentives to further stimulate the economy. The annual National People's Congress (NPC) in early March should provide clues about the government's growth priorities and policy directions. If policymakers set 2021’s real GDP growth target at around 8%, our interpretation is that Chinese leaders are not looking to accelerate growth beyond where it ended in 2020. Major equity indexes are already richly valued. A moderating growth momentum from China will weigh on commodity and risk asset prices, both in China and globally. We reiterate our view that downside risks are high in the near term; the market could take the easing demand growth from China as a reason for a long overdue correction. A Perspective On Growth In 2021 Investors should put this year’s GDP growth projections into perspective given last year’s distortions in China’s economic conditions and data. On a YoY basis, data in the first quarter this year will be artificially boosted due to the deep contraction in Q1 last year. The market consensus is that Q1 2021 will register an 18% YoY rate of real GDP expansion. If we assume the economy can expand by 8% this year over 2020, then the YoY GDP growth rates in the rest of this year will average less than 6%. This would be below the 6.5% YoY rate in the fourth quarter of 2020 – meaning that on a YoY basis, China’s growth momentum has peaked (Chart 1). Importantly, sequential growth, such as month-over-month (MoM) and quarter-over-quarter (QoQ), drives the financial markets. On a QoQ basis, Q1 business activities are typically weaker due to the Chinese New Year. However, when we compare the rate of QoQ slowdown in Q1 this year with previous years, an 18% YoY increase would mean China’s output in the first three months of 2021 would be one of the worst in the past 20 years (Chart 2). Chart 1Q1 GDP Growth Will Be Artificially Boosted, On A YoY Basis
Q1 GDP Growth Will Be Artificially Boosted, On A YoY Basis
Q1 GDP Growth Will Be Artificially Boosted, On A YoY Basis
Chart 2…But Will Be On The Weaker Side, On A QoQ Basis
Understanding China’s Growth Arithmetic For 2021
Understanding China’s Growth Arithmetic For 2021
The moderating growth momentum in Q1 this year was already reflected in high-frequency data in January. Most major components in last week’s PMI surveys in both the manufacturing and service sectors had larger setbacks than in January of previous years. Prices in major commodities as well as the Baltic Dry Index softened (Chart 3). Cyclical sector stocks in China’s onshore market, which is highly sensitive to domestic economic policies, have halted their outperformance relative to defensive stocks (Chart 4). Chart 3Chinese Economic Growth May Be Showing Signs Of Moderation
Chinese Economic Growth May Be Showing Signs Of Moderation
Chinese Economic Growth May Be Showing Signs Of Moderation
Chart 4Outperformance In Onshore Cyclical Stocks Is Rolling Over
Outperformance In Onshore Cyclical Stocks Is Rolling Over
Outperformance In Onshore Cyclical Stocks Is Rolling Over
Furthermore, it is useful to look past the growth outliers in the previous four quarters to gain insight into the status of China’s business cycle. On a two-year smoothed term, an 8% annual output growth in 2021 would represent a continuation of China’s downward economic growth trend (Chart 5). Chart 5This Years Rebound In Headline GDP Growth Does Not Alter Chinas Structural Downtrend
This Years Rebound In Headline GDP Growth Does Not Alter Chinas Structural Downtrend
This Years Rebound In Headline GDP Growth Does Not Alter Chinas Structural Downtrend
Bottom Line: It is misleading to consider an 8% YoY real GDP growth rate in 2021 as an acceleration in China’s economic recovery. On a quarterly basis, Q1 will undergo a moderation in growth momentum. The economy in the rest of the year will remain on a downward growth trend. No Rush To Stimulate Anew If Q1 growth turns out to be weaker than the market anticipates, then will Beijing continue to dial back stimulus? Or, will it become concerned about the underlying fragility in the economy and provide more support? So far, all signs point to a continuation of a stimulus pullback. Chart 6Tighter Monetary Conditions are Starting To Bite the Economy
Tighter Monetary Conditions are Starting To Bite the Economy
Tighter Monetary Conditions are Starting To Bite the Economy
The resurgence of domestic COVID-19 cases contributed significantly to January’s shaky demand. However, tighter monetary conditions in 2H20 are likely another reason for the growth moderation (Chart 6). Here are some factors that may have prompted Chinese authorities to stay on track to scale back stimulus: Policymakers appear to consider the massive fiscal stimulus last year overdone. In contrast with the previous two years, local governments are not issuing special-purpose bonds (SPBs) before the NPC sets its quota in early March. China’s broader fiscal budgetary deficit widened to 11% of GDP in 2020 from 6% in 2019. Local governments issued nearly 70% more SPBs in 2020 than in the previous year (Chart 7). SPBs are mostly used for investing in infrastructure projects and last year’s fiscal support along with substantial credit expansion helped to speed up infrastructure investment. However, towards the end of last year local governments reportedly experienced a shortage in profitable investment projects and thus, parked more than 400 billion yuan of proceeds from last year’s SPB issuance at the central bank (Chart 8). This will likely convince the central government to reduce the SPB quota by a large margin this year. Chart 7Fiscal Stimulus Last Year May Be Overdone
Fiscal Stimulus Last Year May Be Overdone
Fiscal Stimulus Last Year May Be Overdone
Chart 8Local Governments Reportedly Ran Out Of Profitable Infrastructure Projects To Invest Last Year
Local Governments Reportedly Ran Out Of Profitable Infrastructure Projects To Invest Last Year
Local Governments Reportedly Ran Out Of Profitable Infrastructure Projects To Invest Last Year
In addition, government revenues in 2020 were surprisingly strong and spending was well below budgeted annual expenditures, resulting in 2.5 trillion yuan in idle funds (Chart 9). Based on China’s fiscal budget laws, any unspent funds from the previous year will be carried over to the next year. In other words, the 2.5 trillion yuan will contribute to fiscal deficit reduction this year and are not extra savings that can be distributed. In addition, asset price bubbles are a perennial concern. Land sales and housing demand for top-tier cities roared back last year due to cheap loans and a relaxed policy environment (Chart 10). In our opinion, Chinese leaders allowed the real estate market to temporarily heat up last year to avoid a deep economic recession. As the economy recovered to its pre-pandemic level by late 2020, policymakers have sharply reduced their tolerance for the booming housing market and substantially tightened restrictions in the real estate sector. Chart 9Unspent Fiscal Stimulus Checks Do Not Lead To Higher Government Spending Next Year
Unspent Fiscal Stimulus Checks Do Not Lead To Higher Government Spending Next Year
Unspent Fiscal Stimulus Checks Do Not Lead To Higher Government Spending Next Year
Chart 10Housing Market Heats Up Again
Housing Market Heats Up Again
Housing Market Heats Up Again
The domestic labor market has been surprisingly resilient, removing the leadership’s political constraints and incentives to further stimulate the economy. Labor market conditions and household income are improving. The gap between household disposable income and spending growth has narrowed, the unemployment rate is back to its pre-pandemic level and consumer confidence has rebounded (Chart 11). More importantly, China’s labor market in urban areas is tightening again, with migrant workers receiving higher pay than prior to the pandemic (Chart 12). Chart 11Labor Market Is On The Mend
Labor Market Is On The Mend
Labor Market Is On The Mend
Chart 12China’s Urban Labor Market Is Tightening Again
Understanding China’s Growth Arithmetic For 2021
Understanding China’s Growth Arithmetic For 2021
Bottom Line: Growth rates will moderate, but policymakers will wait for more evidence of a pronounced slowdown in economic conditions before they ease policies. Concerns about financial risks and excesses in the property market entail authorities to allow stimulus of 2020 to relapse. It will take a much deeper slowdown in the business cycle before easing is re-introduced. Investment Implications Our baseline view indicates that credit growth will decelerate by two to three percentage points in 2021 from 2020, and the local government SPB quota will drop by 10%. The projected pullbacks on stimulus are small and more measured than the last policy tightening cycle in 2017/18. Nevertheless, a smaller stimulus and tighter policy environment will consequently lead to moderating growth momentum in China’s domestic economy and demand, particularly in the second half of this year. Chart 13How Far Can Chinas Inventory Restocking Cycle Go Without More Policy Tailwinds
How Far Can Chinas Inventory Restocking Cycle Go Without More Policy Tailwinds
How Far Can Chinas Inventory Restocking Cycle Go Without More Policy Tailwinds
Commodity prices may be at high risk of easing demand. The strong rebound in China’s commodity imports in 2H20 was not only due to a recovery in domestic consumption, but also inventory restocking from an extremely low level. Chart 13 shows that the change in China’s industrial inventories relative to exports has risen substantially from a two-year contraction. Going forward, the pace of inventory accumulation will slow following a weaker policy tailwind and growth momentum, which will weigh on the demand for and prices of key industrial raw materials. Corporate profits should continue to recover, albeit at a slower rate than in 2H20. At the same time, risks are tilted to the downside, and policy initiatives should be closely monitored going forward. As such, we maintain a cautious view on Chinese stocks. Jing Sima China Strategist jings@bcaresearch.com Footnote: 1 IMF World Economic Outlook and World Bank Global Outlook, January 2021 Footnotes Cyclical Investment Stance Equity Sector Recommendations