Fixed Income

Highlights Policy Responses: Australian policymakers have responded forcefully to the COVID-19 pandemic through massive fiscal stimulus and unprecedented monetary easing measures. The dovish pivot of the Reserve Bank of Australia (RBA) could last for longer given persistent inflation undershoots and an Australian dollar fundamentally supported more by an improving terms of trade and less by interest rate differentials. Bond Market Strategy: Maintain a below-benchmark strategic (6-12 months) stance on Australian duration exposure, as local bond yields will not be immune to the continued cyclical rise in global yields that we expect. Stay neutral on the country allocation to Australia in dedicated global bond portfolios, however, until there is greater clarity that the RBA’s recent dovish shift is indeed more lasting – an outcome that would turn Australia into a “low-beta” bond market that outperforms when global yields rise. FX Strategy: External conditions will likely dominate the trajectory of the Australian dollar in 2021. This argues for a modestly higher Aussie, which remains fundamentally undervalued. Beyond then, perceptions of the RBA’s policy bias should once again become an important driver for the trade-weighted currency when global reflation pressures begin to fade. Feature For investors with a global focus, Australia has always had a well-understood role within their portfolios. Australian bonds typically offer high yields relative to their developed market peers, largely due to a more inflationary economy that requires relatively higher central bank policy rates. The Australian dollar (AUD) is a commodity currency that benefits from stronger global growth but is also a “risk-on/risk-off” currency that performs better when uncertainty and volatility are low. Like all market correlations, however, there is no guarantee these will persist if the fundamental backdrop shifts. In this Special Report, jointly written by BCA Research’s Global Fixed Income Strategy and Foreign Exchange Strategy services, we discuss the cyclical outlook for bond yields and the currency in Australia. Our conclusion: the nature of both may have fundamentally changed as a result of the policy responses, both globally and within Australia, to the COVID-19 pandemic amid persistently low inflation Down Under. This Is Not Your Parents’ RBA 2020 was an exceptional year for global bond markets as yields collapsed due to the negative COVID-19 shock to global growth and dramatic easing of monetary policies. Australian sovereign debt, however, was a market laggard, delivering a total return of 4.4% (in USD-hedged terms) that underperformed much of the Bloomberg Barclays Global Treasury index universe (Chart 1). This occurred even with the RBA cutting its policy interest rate to near 0% and introducing large-scale quantitative easing (QE), while also maintaining a yield target on 3-year government bonds. Chart 1Australian Government Bonds Were A Global Underperformer In 2020
Australia: Regime Change For Bond Yields & The Currency?
Australia: Regime Change For Bond Yields & The Currency?
The decline in Australian interest rates was not solely related to the pandemic. The process of interest rate compression of Australia versus the other developed economies dates back to the 2008 Global Financial Crisis. The RBA Cash Rate was over 400bps higher than a GDP-weighted average of policy rates in the major developed markets before the Lehman default. That rate advantage is now gone, with the reduced interest rate support weighing heavily on the Australian dollar over the past decade (Chart 2). Chart 2Australia Is No Longer A High-Yielder
Australia Is No Longer A High-Yielder
Australia Is No Longer A High-Yielder
Chart 3RBA Policy Is Reflationary
RBA Policy Is Reflationary
RBA Policy Is Reflationary
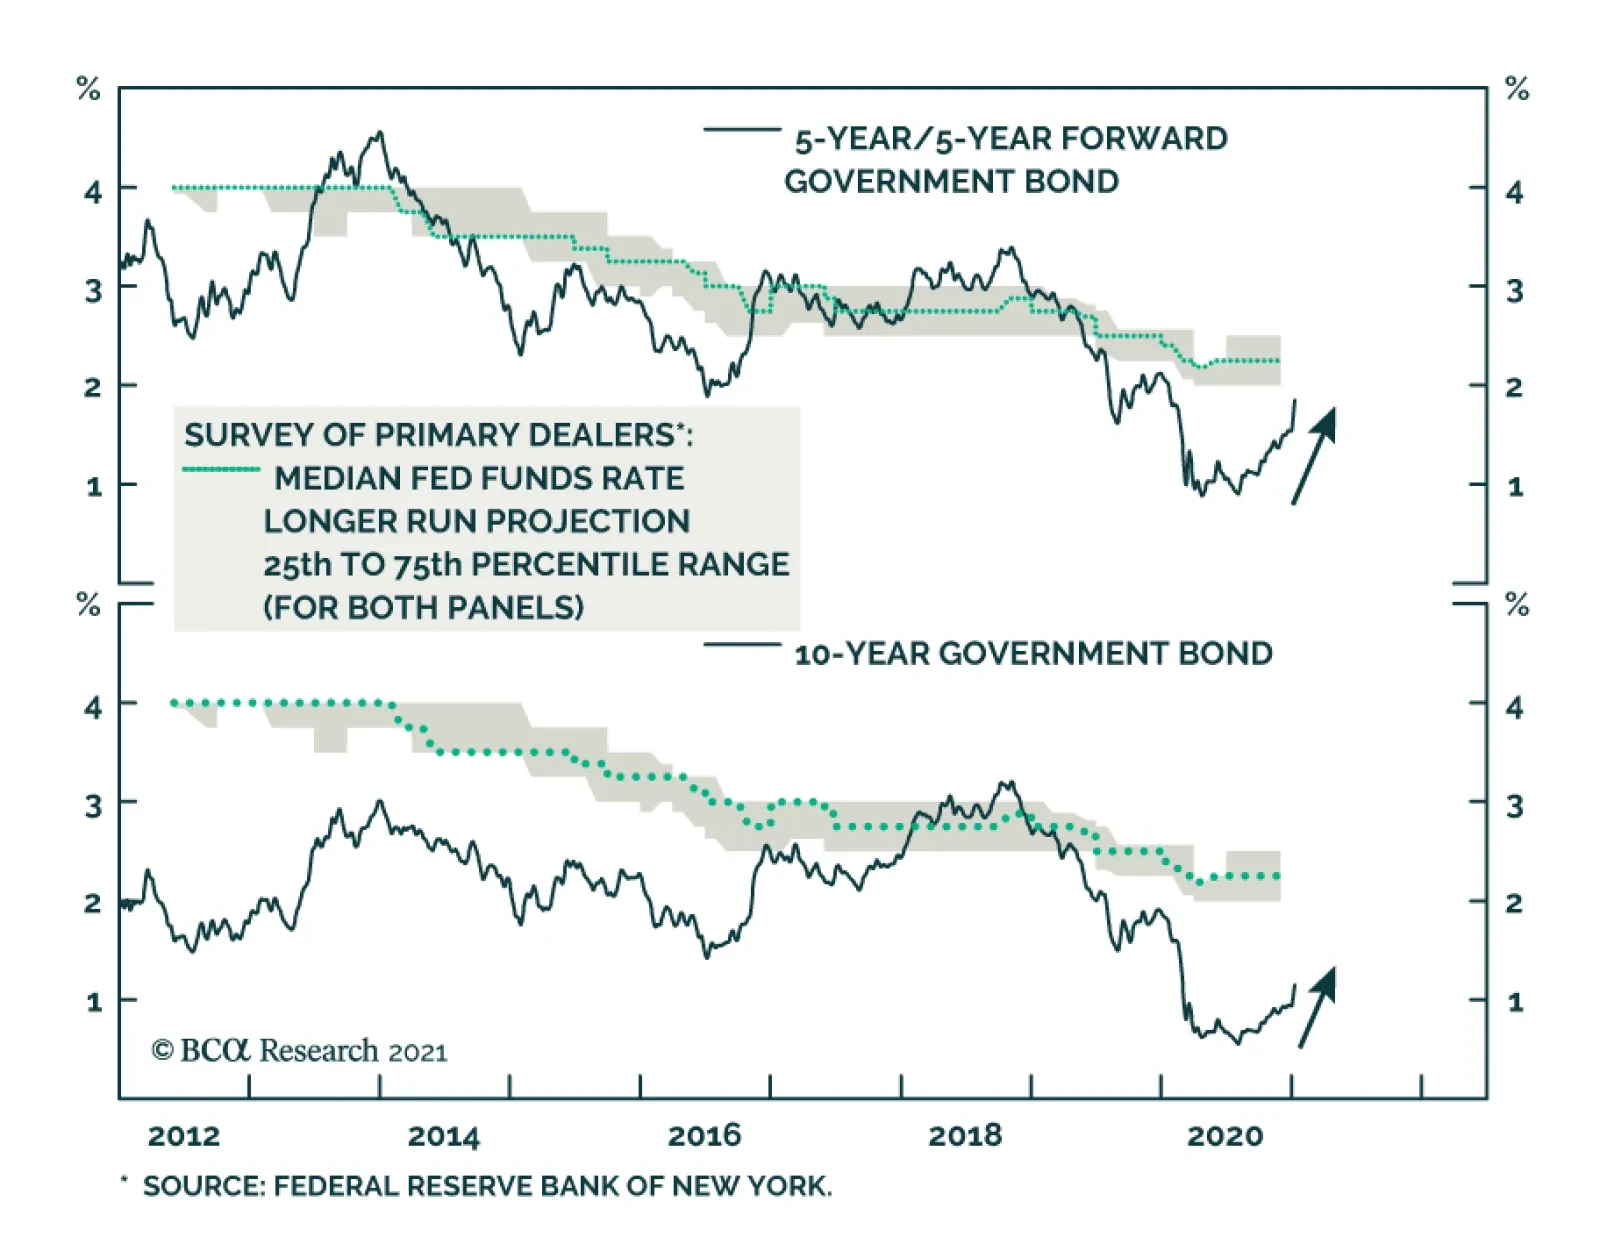
Something has shifted, however, since the trough in Australian economic growth in mid-2020. Our RBA Monitor, designed to measure cyclical pressure for monetary policy changes, is indicating a substantially reduced need for additional RBA easing. Inflation expectations have also recovered from the pandemic lows, with the 5-year/5-year forward Australian CPI swap rate now up to 2.5% - right in the middle of the RBA’s 2-3% inflation target band (Chart 3). The Australian dollar has also rallied solidly, up 22.4% from the 2020 low on a trade-weighted basis. All of this has occurred with virtually no support from higher Australian interest rates or even the threat of a more hawkish RBA. This is a common theme seen in other countries over the past several months. Markets are pricing in the reflationary aspects of recovering global growth and, potentially, an end to the pandemic as vaccines are now being distributed globally. At the same time, investors are taking the highly dovish forward guidance of the major central banks at face value, pricing in very moderate increases in policy rates over the next few years. Inflation expectations are rising as a result, as markets see central bankers taking more inflationary risks than in years past. This is most evident in the US where the Federal Reserve has changed its inflation targeting strategy while also signaling that monetary tightening would not begin before US inflation returned sustainably to the Fed’s 2% target. In Australia, the RBA has suggested no such change to how it approaches its 2-3% inflation target. The central bank, however, has also indicated that it will not consider any premature rate hikes without actual inflation (and inflation expectations) returning sustainably to the target band. Markets have taken the RBA’s message to heart, with the Australian overnight index swap (OIS) curve pricing in only 25bps of rate increases by the end of 2023 (Chart 4). The result has been a steady increase in Australian inflation expectations, and a decline in real bond yields, as markets discount a continued economic recovery but without any offsetting response from the RBA. Chart 4Markets Expect A Dovish RBA
Markets Expect A Dovish RBA
Markets Expect A Dovish RBA
Thus, the RBA’s next policy moves remain critical to the outlook for Australian bond yields. If the RBA continues on this highly dovish path, keeping rates on hold while rapidly expanding its balance sheet via QE even as global growth recovers, then Australian bonds will continue to behave in the “low-beta” fashion seen over the past year. That means Australian yields will be less sensitive to changes in the overall movements of global bond yields compared to years past, because of a less active RBA – especially if the Australian dollar continues to strengthen without the support of higher interest rates (more on that later). It is still unclear if the RBA has permanently changed its “reaction function” such that investors should perceive of Australian government bonds as having a lower beta to global yields. One way to assess if such a shift is occurring is to compile a list of indicators that would likely put pressure on the RBA to turn less dovish, and then monitor them versus the RBA’s policy guidance. Introducing Our RBA Checklist The RBA’s extraordinary policy measures taken over the past year have been undertaken to help the Australian economy deal with the disinflationary shock of the COVID-19 pandemic. Any attempt to begin unwinding that policy accommodation would therefore require evidence that the impacts of the pandemic on economic growth, inflation and financial stability were evolving such that aggressive monetary stimulus was no longer required. The most important things for the central bank to monitor, described below, comprise what we will call our “RBA Checklist". 1. The Vaccination Process Goes Smoothly And Quickly Australia has been one of the more fortunate countries during the entire COVID-19 pandemic with case numbers being a tiny fraction of what has taken place in the US or UK (Chart 5A). A big reason for this is that the Australian government has been aggressive on border control and international travel restrictions. This has limited the potential for outbreaks being “imported” into the country, while also reducing the need for the kind of draconian restrictions now in place in Europe and parts of the US like California (Chart 5B). Chart 5AAustralia Has Handled The Pandemic Well...
Australia Has Handled The Pandemic Well...
Australia Has Handled The Pandemic Well...
Chart 5B...With Fewer Restrictions
...With Fewer Restrictions
...With Fewer Restrictions
Australia has been very prudent in planning for the distribution of COVID-19 vaccines. Federal authorities have purchased 10 million doses of the Pfizer vaccine and 54 million doses of the Astra-Zeneca vaccine. For a country with a population of just over 25 million, this means that there are enough doses of the vaccine available to inoculate the entire nation. The government plans to begin the vaccine rollout in February. If the distribution can take place smoothly and efficiently, herd immunity could be achieved in Australia by the fourth quarter of 2021. That could prompt the RBA to begin planning to withdraw some of the extraordinary monetary accommodation measures. 2. Private Sector Demand Accelerates Alongside Fiscal Stimulus The Australian government’s fiscal stimulus response to the pandemic was one of the largest in the world, equal to A$267 billion (14% of GDP) through the 2023-24 fiscal year according to the IMF.1 A good portion of those measures have been in the form of wage subsidies and hiring credits for businesses, as well as personal income tax cuts and other household income support measures. The latter has been particularly effective at helping boost consumer confidence – the Westpac-Melbourne Institute index of consumer sentiment hit a ten-year high in December. Business confidence also rebounded in the latter half of 2020, but remains at relatively subdued levels according to the National Australia Bank survey (Chart 6). Chart 6Consumers Are Very Optimistic, Businesses Less So
Consumers Are Very Optimistic, Businesses Less So
Consumers Are Very Optimistic, Businesses Less So
Part of the most recent rebound in economic confidence is related to the positive news on COVID-19 vaccines, as well as the lack of a surge of new COVID cases in Australia. Chart 7Government Income Support Is Fuel For A Consumer Rebound
Government Income Support Is Fuel For A Consumer Rebound
Government Income Support Is Fuel For A Consumer Rebound
Chart 8No Fiscal Tightening Expected In 2021
Australia: Regime Change For Bond Yields & The Currency?
Australia: Regime Change For Bond Yields & The Currency?
The consumer confidence response has been much larger than the business confidence response, however, as the income boosting measures for households have been massive. The JobKeeper wage subsidy program alone was equal to nearly 5% of Australian GDP. The net result of that income support on household finances was impressive. Over the first three quarters of 2020, real household disposable income growth accelerated by 5 percentage points while the household savings ratio rose by a whopping 14 percentage points (Chart 7). This provides a strong base for a recovery in consumer spending, especially if the vaccine rollout is successful and existing economic restrictions can be eased. Australia is one of the rare countries that is not projected to suffer a fiscal drag on growth in 2021, even when compared to the massive stimulus measures introduced in 2020 (Chart 8). A sharper than expected rebound in consumer spending, coming on top of sustained fiscal stimulus, may embolden the RBA to consider a less dovish mix of monetary policies. 3. China Reins In Policy Stimulus By Less Than Expected Australia’s economy is inextricably linked to export demand from China, which is by far the country’s largest trading partner. BCA Research’s China strategists expect Chinese policymakers to begin tightening up on some of their own COVID-19 policy stimulus measures, with the “credit impulse” expected to peak by mid-2021 (Chart 9). Chart 92020 China Stimulus Will Boost 2021 Australian Exports
2020 China Stimulus Will Boost 2021 Australian Exports
2020 China Stimulus Will Boost 2021 Australian Exports
The China credit impulse leads the growth rate of Australian exports to China by about twelve months. Thus, Australia’s economy should continue to benefit from the lagged impact of China stimulus throughout 2021, but then see some pullback in 2022 as Chinese import demand slows. It is still uncertain how large of a pullback in credit expansion will take place, but our China strategists think it could be between 1.5% and 3% of Chinese GDP. If Chinese policymakers opt for the former, and Australian export demand is projected to remain solid in 2022, then the RBA could be prompted to begin taking its foot off the monetary policy accelerator. 4. Inflation, Both Realized And Expected, Returns To The RBA’s 2-3% Target Range The RBA will obviously need to reconsider its current policy stance if Australian inflation were to sustainably return to the RBA's 2-3% target range. The key word there is “sustainably”, as the last time Australian headline CPI inflation was even as high as 2.3% was 2014. A major reason for the underwhelming performance of Australian inflation has come from the lack of domestically generated price pressures. For example, the RBA wage price index, a measure of employment costs, has been in a structural decline for most of the past decade (Chart 10). The 2020 recession resulted in a sharp rise in Australian unemployment that further pushed down wage inflation. The sharp snapback in the under-employment rate - which measures employment in terms of hours worked and is much more strongly correlated to Australian wage inflation than the headline unemployment rate - in the latter half of 2020 suggests that wage growth could bottom faster than the RBA currently expects (bottom panel). The RBA’s own inflation forecasts call for headline CPI inflation, and more smoothed measures like the trimmed mean inflation rate, to remain below 2% through the end of 2022 (Chart 11). The RBA also expects the unemployment rate to remain nearly one full percentage point above the pre-COVID low by the end of next year. Chart 10Is The RBA Too Pessimistic On Employment?
Is The RBA Too Pessimistic On Employment?
Is The RBA Too Pessimistic On Employment?
Chart 11No Inflationary Trigger For A Less Dovish RBA...Yet
No Inflationary Trigger For A Less Dovish RBA...Yet
No Inflationary Trigger For A Less Dovish RBA...Yet
Any upside surprise in the Australian labor market that boosts wage growth would likely coincide with some improvement in the non-tradables component of Australian CPI inflation (bottom panel). This could trigger a more hawkish response from the RBA, as even the tradables component of inflation appears to be bottoming out despite a stronger Australian dollar. 5. House Price Inflation Begins To Accelerate The RBA may become concerned that its monetary policy settings are too stimulative if there are signs of asset price inflation that could endanger financial stability. The biggest concern, as always in Australia, is the housing market and the pace of house price inflation. The latest data on house prices at the national level show that annual growth rate slowed from a pre-COVID high of 8.1% to 5.0% in Q3/2020 (Chart 12). While building approvals picked up over that same period, this appeared to be entirely related to demand for owner-occupied homes rather than houses purchased as a speculative investment. The relative trends in housing loans to both groups of buyers shows steady growth for owner-occupied lending and no growth for investor-related loans (bottom panel). The lack of evidence of a speculative push higher in house price inflation should diminish RBA concerns that its near-0% interest rate policy was fueling a new housing bubble. More generally, there is little evidence of a pickup in credit growth outside of housing, even with money supply aggregates soaring in a likely response to fiscal support measures that are boosting household liquidity (Chart 13). Chart 12RBA Policy Has Not Boosted House Prices...Yet
RBA Policy Has Not Boosted House Prices...Yet
RBA Policy Has Not Boosted House Prices...Yet
Chart 13Monetary/Fiscal Policy Mix Boosting Liquidity, Not Credit
Monetary/Fiscal Policy Mix Boosting Liquidity, Not Credit
Monetary/Fiscal Policy Mix Boosting Liquidity, Not Credit
If house price inflation started to pick up alongside a rebound in investor-related home loans, the RBA may feel that its low-rate policy is starting to become a problem for financial stability, requiring some monetary tightening. Summing it all up, none of the elements in our RBA Checklist are signaling an imminent need for the RBA to consider withdrawing any of its extraordinary policy measures or signal future rate hikes. More likely, there is a greater chance that the RBA extends some of the programs that are set to expire in the next few months. The latest round of QE bond purchases, equal to A$100 billion, is set to expire in April. Also, the Term Funding Facility that has provided cheap funding for banks to continue lending during the pandemic is scheduled to end by mid-year. We think it is more likely that the RBA will look to extend those programs, while also maintaining the yield curve control target on 3-year government bond yields at 0.1%, until the end of 2021. This would give the central bank more time to evaluate the progress on vaccine distribution, while also giving some policy flexibility to offset the impact of a stronger Aussie dollar. The Australian Dollar: External Conditions Are Now The Main Driver The benign reading from our RBA Checklist suggests that Australian bond yields are likely to maintain their recent lower beta to global bond yields. At first blush, this suggests the Australian dollar’s high-beta status in currency markets might also ebb. The key will be whether the RBA is successful in steering the currency on a path that eases financial conditions for domestic concerns. This is especially important since the AUD has diverged from its traditional relationship with relative interest rates. Instead, an improving terms of trade, fueled by rising commodity prices, has become the more important driver of the Aussie’s performance and will remain so over the next 6-12 months as the cyclical commodity bull market is set to continue. While there are signs that the sharp rally in industrial commodity prices could be approaching an exhaustion point in the near-term, our bias is that this will be a buying opportunity for the Aussie. There are five key reasons for this. First, Australia’s basic balance remains very wide, even if it is rolling over from fresh secular highs (Chart 14). There is anecdotal evidence that some of the imports of Australia’s key commodities in 2020 were driven by restocking, rather than final demand. However, even if restocking hits an air pocket sometime this year, the supply side remains sufficiently tight to prevent a collapse in prices. As an example, global inventories for copper are hitting new cycle lows (Chart 15). Chart 14AUD Has Underperformed The Improvement In The Basic Balance
AUD Has Underperformed The Improvement In The Basic Balance
AUD Has Underperformed The Improvement In The Basic Balance
Chart 15Supply-Side Constraints On Key Commodities Like Copper
Supply-Side Constraints On Key Commodities Like Copper
Supply-Side Constraints On Key Commodities Like Copper
Second, Chinese stimulus is slated to peak this year as discussed earlier. The impact on Chinese demand will be felt long after liquidity injections ease, due to the lag between monetary policy and economic activity. Assuming Chinese bond yields are a proxy for domestic policy settings, Chart 16 shows that Chinese domestic imports are tracking the easing in financial conditions we saw last year. As a result, imports of key raw materials such as copper, iron ore, steel, and crude oil should remain strong in 2021, even if growth rates subside. These will continue to benefit Australian export volumes. Third, there has been increasing relative competitiveness in the types of raw materials that China needs and wants. For example, Australian exporters produce higher-grade ore, which is more expensive, but pollutes less and is in high demand in China. Recent supply disruptions in South America are also helping Australian commodity exporters gain a greater share of Chinese commodity demand. Fourth, the Aussie will continue to benefit from the long-term tailwind of liquefied natural gas (LNG) exports. This is primarily driven by a tectonic shift in China: an energy policy shift away from coal and towards natural gas. Given that reducing, if not outright eliminating pollution is a long-term strategic goal in China, this will provide a multi-year tailwind to Australian LNG demand. Chart 16Easy Financial Conditions Should Support Chinese Spending And Imports
Easy Financial Conditions Should Support Chinese Spending And Imports
Easy Financial Conditions Should Support Chinese Spending And Imports
Finally, the Aussie dollar is not yet expensive. It is undervalued by 3% on a purchasing power parity (PPP) basis and by 11% relative to its terms of trade (Chart 17). At a minimum, the Aussie could bounce by this magnitude, and not derail the domestic recovery. Chart 17The AUD Remains Undervalued, Relative To Terms Of Trade
The AUD Remains Undervalued, Relative To Terms Of Trade
The AUD Remains Undervalued, Relative To Terms Of Trade
Beyond the near term, as Chinese stimulus peaks and the impulse of commodity demand relapses, most likely sometime in 2022, the RBA will regain more control over the direction of the Aussie. This will be the point where relative interest rates become increasingly important. Should the RBA continue to maintain a more dovish bias, then the Aussie will become a lower-beta currency, relative to history. Investment Conclusions The goal of this report was to determine if bond yields and the currency in Australia now trade under a “new set of rules” compared to previous years. We conclude that there has indeed been a change in how Australian bond yields behave relative to movements in global bond yields. It is not yet clear, however, if the lower yield beta of Australian government debt is a lasting change or merely a cyclical response to the RBA’s emergency pandemic related monetary policies. We will monitor our RBA Checklist in the months ahead to determine if the central bank’s reaction function has changed in such a way as to make the shift in the yield beta more permanent. This will also have ramifications for the Australian dollar when the fundamental support from soaring commodity prices begins to fade. Our analysis leads us to make the following investment conclusions on a strategic (6-12 months) investment horizon. Duration: We recommend maintaining a below-benchmark stance for dedicated Australian fixed income portfolios. Yields are only now starting to respond to improving domestic and global growth prospects, and a growing “risk-on” mentality in financial markets fueled by COVID-19 vaccine optimism. Even though the RBA has plenty of scope to increase its QE buying of government debt compared to the experience of other countries (Chart 18), this will only limit, and not prevent, additional increases in Australian bond yields. Country allocation: We recommend maintaining a neutral allocation to Australian government debt within global bond portfolios. The uncertainty over the RBA’s reaction function, and the future path of the Australian yield beta, makes it unclear how to position Australian bonds within a dedicated bond portfolio. We do have more conviction that Australian government debt will outperform US Treasuries, however, as the yield beta of the former to the latter has clearly declined (Chart 19). Chart 18The RBA Has Room To Expand QE, If Necessary
The RBA Has Room To Expand QE, If Necessary
The RBA Has Room To Expand QE, If Necessary
Chart 19Australian Bond Strategy For 2021
Australian Bond Strategy For 2021
Australian Bond Strategy For 2021
Yield Curve: We recommend positioning for a steeper Australian government bond yield curve. The RBA is anchoring the short-end of the government bond yield curve, which is likely to be maintained until at least year-end. This leaves the slope of the curve to be driven more by longer-term inflation expectations that should continue drifting higher as the Australian economy continues its post-pandemic recovery. Currency: We recommend positioning for additional gains in the Australian dollar. Supportive external conditions will likely dominate the trajectory of the currency in 2021. This argues for a modestly higher Aussie, which remains fundamentally undervalued. Inflation-linked bonds: This is admittedly a trickier call to make, as our valuation model suggests 10-year inflation breakevens have overshot relative to their main drivers – the trend of realized inflation and the growth rate of oil prices denominated in AUD – by a substantial amount (Chart 20). As discussed earlier in this report, we see the sharp run-up in Australian inflation breakevens (and CPI swap rates) as a sign that markets view the RBA’s policy stance as highly reflationary. This suggests that real yields should continue moving lower, and breakevens should continue drifting higher, until the RBA begins to signal a shift to a less dovish policy stance (Chart 21). Our RBA Checklist should also prove useful in timing the peak in breakevens. Chart 20Australian Inflation Breakevens Are Overvalued
Australian Inflation Breakevens Are Overvalued
Australian Inflation Breakevens Are Overvalued
Chart 21Markets Discounting Negative Real Policy Rates For Longer
Markets Discounting Negative Real Policy Rates For Longer
Markets Discounting Negative Real Policy Rates For Longer
Chart 22Downgrade Australian Corporates To Neutral Vs Government Debt
Downgrade Australian Corporates To Neutral Vs Government Debt
Downgrade Australian Corporates To Neutral Vs Government Debt
Corporate bonds: We recommend downgrading Australian corporate bonds to neutral from overweight. This is purely a valuation-based recommendation, as there is limited scope for additional yield compression after the massive tightening since the spring of 2020 (Chart 22). Corporates will likely turn into a pure carry trade at tight spreads, which no longer justifies an overweight position even in a cyclical Australian growth upturn. Robert Robis, CFA Chief Fixed Income Strategist rrobis@bcaresearch.com Chester Ntonifor Foreign Exchange Strategist chestern@bcaresearch.com Footnotes 1 Full details of policy responses to COVID-19 at the country level can be found here: https://www.imf.org/en/Topics/imf-and-covid19/Policy-Responses-to-COVID-19.
Highlights Inflation: Additional fiscal stimulus will lead to higher inflation in the goods sector, where bottlenecks are already forming. But stronger services inflation is required (particularly in shelter) before broad price pressures emerge. Some leading indicators of shelter inflation suggest that a bottom may be near. Fed: The Fed will not lift rates or taper asset purchases until the unemployment rate is close to 4.5% and 12-month PCE inflation is firmly above 2%. This could occur in late-2021 if economic growth is very strong, but 2022 is more likely. Investment Strategy: Maintain below-benchmark portfolio duration and stay overweight TIPS versus nominal Treasuries. Nominal curve steepeners, real curve steepeners and inflation curve flatteners all continue to make sense. Feature Biden Goes Big Joe Biden unveiled his economic plan last week and, as expected, the incoming President is setting his sights high. First on the agenda is the American Rescue Plan, a $1.9 trillion package that contains $410 billion for fighting the coronavirus, $1 trillion of income support for households and $440 billion in direct aid to state & local governments. Biden will seek enough Republican support in the Senate to pass this legislation without using the budget reconciliation process. If that can be achieved, Democrats will still have two opportunities to pass reconciliation bills in 2021. Those bills will focus on other priorities such as infrastructure investment and expanding the Affordable Care Act. With households already flush with cash, an influx of new stimulus risks an earlier return of inflation than was previously anticipated. Biden’s announcement was in line with what our political strategists anticipated, and the federal deficit is on track to fall somewhere between the “Democratic Status Quo” and “Democratic High” scenarios shown in Chart 1. This means that the deficit will peak at between 22% and 25% of GDP in fiscal year 2021 before gradually converging back to the baseline. To put this number in context, the federal deficit peaked at just below 10% of GDP at the height of the Great Financial Crisis in 2009. The US economy is now on the cusp of receiving a much greater fiscal injection at a time when nominal GDP is only 2.7% off its prior peak. Chart 1Massive Fiscal Stimulus Is On The Way
Trust The Fed's Forward Guidance
Trust The Fed's Forward Guidance
As mentioned above, the American Rescue Plan contains $1 trillion of income support for households, delivered in the form of one-time $1400 checks and an expansion of unemployment insurance benefits. This is a lot of stimulus, and it looks like even more when you consider the significant income boost that households have already received. Chart 2 shows nominal personal income relative to a pre-COVID trend. Income has been significantly above trend since last spring’s passage of the CARES act, and with fewer spending opportunities than usual, households have been building up a significant buffer of excess savings. Chart 2A Mountain Of Excess Savings
A Mountain Of Excess Savings
A Mountain Of Excess Savings
The risk here is quite clear. With households already flush with cash, an influx of new stimulus risks an earlier return of inflation than was previously anticipated. The remainder of this report considers the likelihood of this risk materializing and what it might mean for Fed policy and our TIPS and portfolio duration recommendations. Inflation Outlook & TIPS Strategy One complication brought on by the pandemic is the stark divergence between goods and services sectors. The large fiscal response means that households have ample cash to deploy towards consumer goods, but service sectors remain shuttered. This divergence is reflected in the inflation data where price pressures are already emerging in the core goods space but services inflation (excluding shelter and medical care) remains below recent historical levels (Chart 3). Manufacturing indicators, such as the ISM Prices Paid survey and commodity prices, provide further evidence of a bottleneck in manufactured goods (Chart 4). Capacity utilization remains low, but it is rising quickly (Chart 4, bottom panel). Chart 3Goods Vs. Services Inflation
Goods Vs. Services Inflation
Goods Vs. Services Inflation
Chart 4A Bottleneck In Manufacturing
A Bottleneck In Manufacturing
A Bottleneck In Manufacturing
The split between goods and services inflation will persist until vaccination efforts gain enough traction for services to re-open, and it will only be exacerbated as more fiscal stimulus is rolled out. Households will continue to dump cash into goods, but service sector participation is likely needed before broad upward pressure on overall inflation emerges. Specifically, broad upward pressure on overall inflation will not be possible until we see a turnaround in shelter (roughly 40% of core CPI). Shelter inflation plummeted during the past year (Chart 5), but some tentative signals are emerging that suggest a bottom may occur within the next 3-6 months. Shelter inflation tends to fall when the unemployment rate is high and rise as labor slack dissipates. Shelter inflation is highly sensitive to the economic cycle. That is, it tends to fall when the unemployment rate is high and rise as labor slack dissipates. Abstracting from large swings in temporary unemployment, the permanent unemployment rate finally ticked down in December (Chart 6). If this marks an inflection point, then shelter inflation is likely close to its trough. The National Multi Housing Council’s Apartment Market Tightness Index is another excellent indicator of shelter inflation. It remains below 50, consistent with downward pressure on shelter inflation, but the tightly-linked Sales Volume Index recently jumped into “more volume” territory (Chart 6, bottom panel). Sales volume led the Market Tightness Index coming out of the last recession. If that happens again, we could soon see shelter inflation creep up Chart 5Shelter Inflation Near ##br##A Trough?
Shelter Inflation Near A Trough?
Shelter Inflation Near A Trough?
Chart 6Shelter Inflation Is Highly Sensitive To The Economic Cycle
Shelter Inflation Is Highly Sensitive To The Economic Cycle
Shelter Inflation Is Highly Sensitive To The Economic Cycle
It is still too soon to call a bottom in shelter inflation. However, if the permanent unemployment rate continues to fall and the Apartment Market Tightness Index follows sales volume higher, then a bottom in shelter could emerge within the next 3-6 months. TIPS Strategy Chart 7Base Effects Will Push Inflation Higher
Base Effects Will Push Inflation Higher
Base Effects Will Push Inflation Higher
Our strategy has been to position for higher TIPS breakeven inflation rates by going long TIPS versus nominal Treasuries, with a plan to tactically reverse this position for a time once the inflation narrative reaches a fever pitch in Q1 of this year. One reason for the inflation narrative to take hold is that base effects will naturally lead to a jump in year-over-year inflation rates during the next few months as the March and April 2020 datapoints fall out of the rolling 12-month average. Chart 7 shows that both 12-month core PCE and core CPI will soon spike above 2%, even if a modest 0.15% monthly growth rate is achieved. Our expectation is that inflation pressures will wane after April of this year, potentially giving us an opportunity to position for a drop in TIPS breakeven inflation rates. However, if shelter inflation does indeed reverse course, as leading indicators suggest it might, that opportunity may not present itself. Bottom Line: Stay positioned long TIPS / short duration-equivalent nominal Treasuries and watch for further evidence of a bottom in shelter inflation within the next 3-6 months. The Fed Has Already Told Us What It Will Do It is certainly possible (even likely) that large-scale fiscal stimulus will cause inflation pressures to emerge earlier than would have otherwise been the case. However, any meaningful monetary tightening in 2021 still seems like a long shot. The potential for Fed tightening in 2021 became a hot topic last week when Atlanta Fed President Raphael Bostic said he’s open to the possibility of tapering asset purchases in late-2021, assuming economic growth turns out to be stronger than anticipated. Fed Chair Powell downplayed the odds of a 2021 taper in his remarks later in the week, causing bond prices to regain some lost ground. Year-over-year inflation will peak in April. Our advice is to not get caught up in the different tones of Fed speakers. The Fed has already been very explicit about the economic criteria that will cause it to tighten policy. Any evaluation of when tightening will occur should be based on an assessment of the economic data relative to these criteria, not on whether certain Fed officials sound more or less optimistic about the future. Tapering & The Timing Of Liftoff Chart 8No Liftoff Until We Reach Full Employment
No Liftoff Until We Reach Full Employment
No Liftoff Until We Reach Full Employment
Our “Fed In 2021” Special Report laid out the three criteria that must be met before the Fed will consider lifting the funds rate.1 Fed Vice-Chair Richard Clarida reiterated this checklist in a recent speech.2 Before lifting rates: 12-month PCE inflation must be 2% or higher Labor market conditions must have reached levels consistent with the Fed’s assessment of maximum employment PCE inflation must be on track to moderately exceed 2% for some time 12-month core PCE inflation is currently 1.38%. As we already noted, it will likely jump above 2% by April but Fed officials will not view that increase as sustainable. The elevated unemployment rate is a big reason why. At 6.7%, the unemployment rate remains well above the range of 3.5% to 4.5% that Fed officials view as consistent with full employment (Chart 8). In his speech, Vice-Chair Clarida said that when “labor market indicators return to a range that, in the Committee’s judgment, is broadly consistent with its maximum-employment mandate, it will be data on inflation itself that policy will react to.” In other words, liftoff will not occur until the unemployment rate is between 3.5% and 4.5%, no matter what happens with inflation. Then, even when the “full employment” criterion has been met, 12-month PCE inflation must still rise above 2% before a rate hike will be considered. The guidance around the tapering of asset purchases is vaguer than the guidance around liftoff. All we know is that the Fed intends to start tapering asset purchases before it lifts the funds rate. Since Fed officials know that a tapering announcement will send a signal that liftoff is imminent, it is highly likely that tapering will occur only a few months before the Fed expects to raise rates. In all likelihood, the unemployment rate will be close to 4.5% before tapering is considered. This could happen by late-2021 if economic growth is very strong, as President Bostic suggested, but a 2022 tapering seems like a safer bet. The Pace Of Rate Hikes Once liftoff occurs, Vice-Chair Clarida has been very clear that inflation expectations will be the principal factor guiding the pace of policy tightening. Specifically, if long-maturity TIPS breakeven inflation rates are below the 2.3 to 2.5 percent range that has historically been consistent with “well anchored” inflation expectations, policy tightening will proceed more slowly than if breakevens are threatening to break above 2.5% (Chart 9). Other measures of inflation expectations based on surveys and inflation’s long-run trend will also be considered (Chart 10). Chart 9TIPS ##br##Breakevens
TIPS Breakevens
TIPS Breakevens
Chart 10Inflation Expectations: Survey And Trend Measures
Inflation Expectations: Survey And Trend Measures
Inflation Expectations: Survey And Trend Measures
The indicators of inflation expectations shown in Charts 9 & 10 are currently below “well-anchored” levels. However, this may not be the case when the Fed is finally ready to raise rates off the zero bound. In fact, when we look at the amount of policy tightening currently priced into the yield curve, we see a good chance that it will be exceeded. The market is currently priced for liftoff to occur in mid-2023, followed by only two more 25 basis point rate hikes over the subsequent 18 months (Chart 11). Chart 11Market Priced For Mid-2023 Liftoff
Market Priced For Mid-2023 Liftoff
Market Priced For Mid-2023 Liftoff
With all the fiscal stimulus coming down the pipe, we can easily envision liftoff occurring sometime in 2022, followed by a somewhat quicker pace of tightening. With that forecast in mind, investors should maintain below-benchmark portfolio duration. Ryan Swift US Bond Strategist rswift@bcaresearch.com Footnotes 1 Please see US Bond Strategy Special Report, “The Fed In 2021”, dated December 22, 2020, available at usbs.bcaresearch.com 2 https://www.federalreserve.gov/newsevents/speech/clarida20210113a.htm Fixed Income Sector Performance Recommended Portfolio Specification
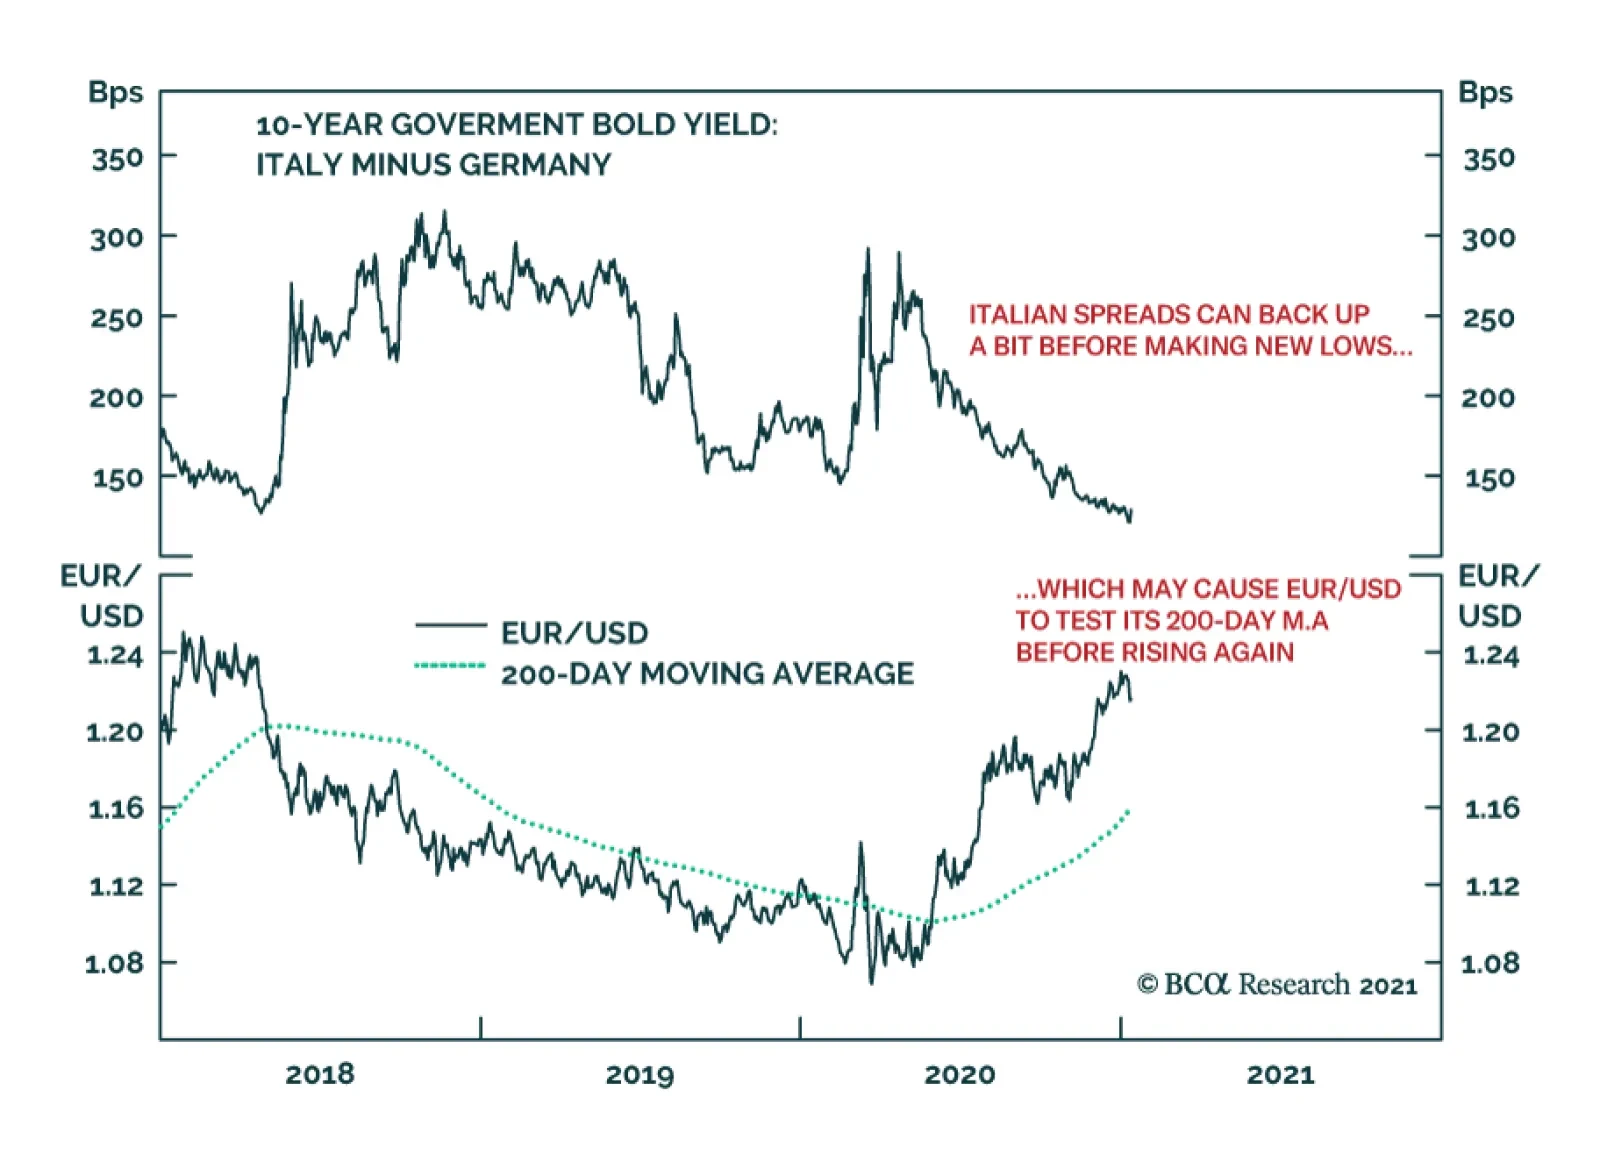
Yesterday, Matteo Renzi pulled out of the center-left coalition currently governing Italy. The former PM believes he can improve his party’s standing in parliament. The Conte government will try to create a new coalition, but this will be challenging…
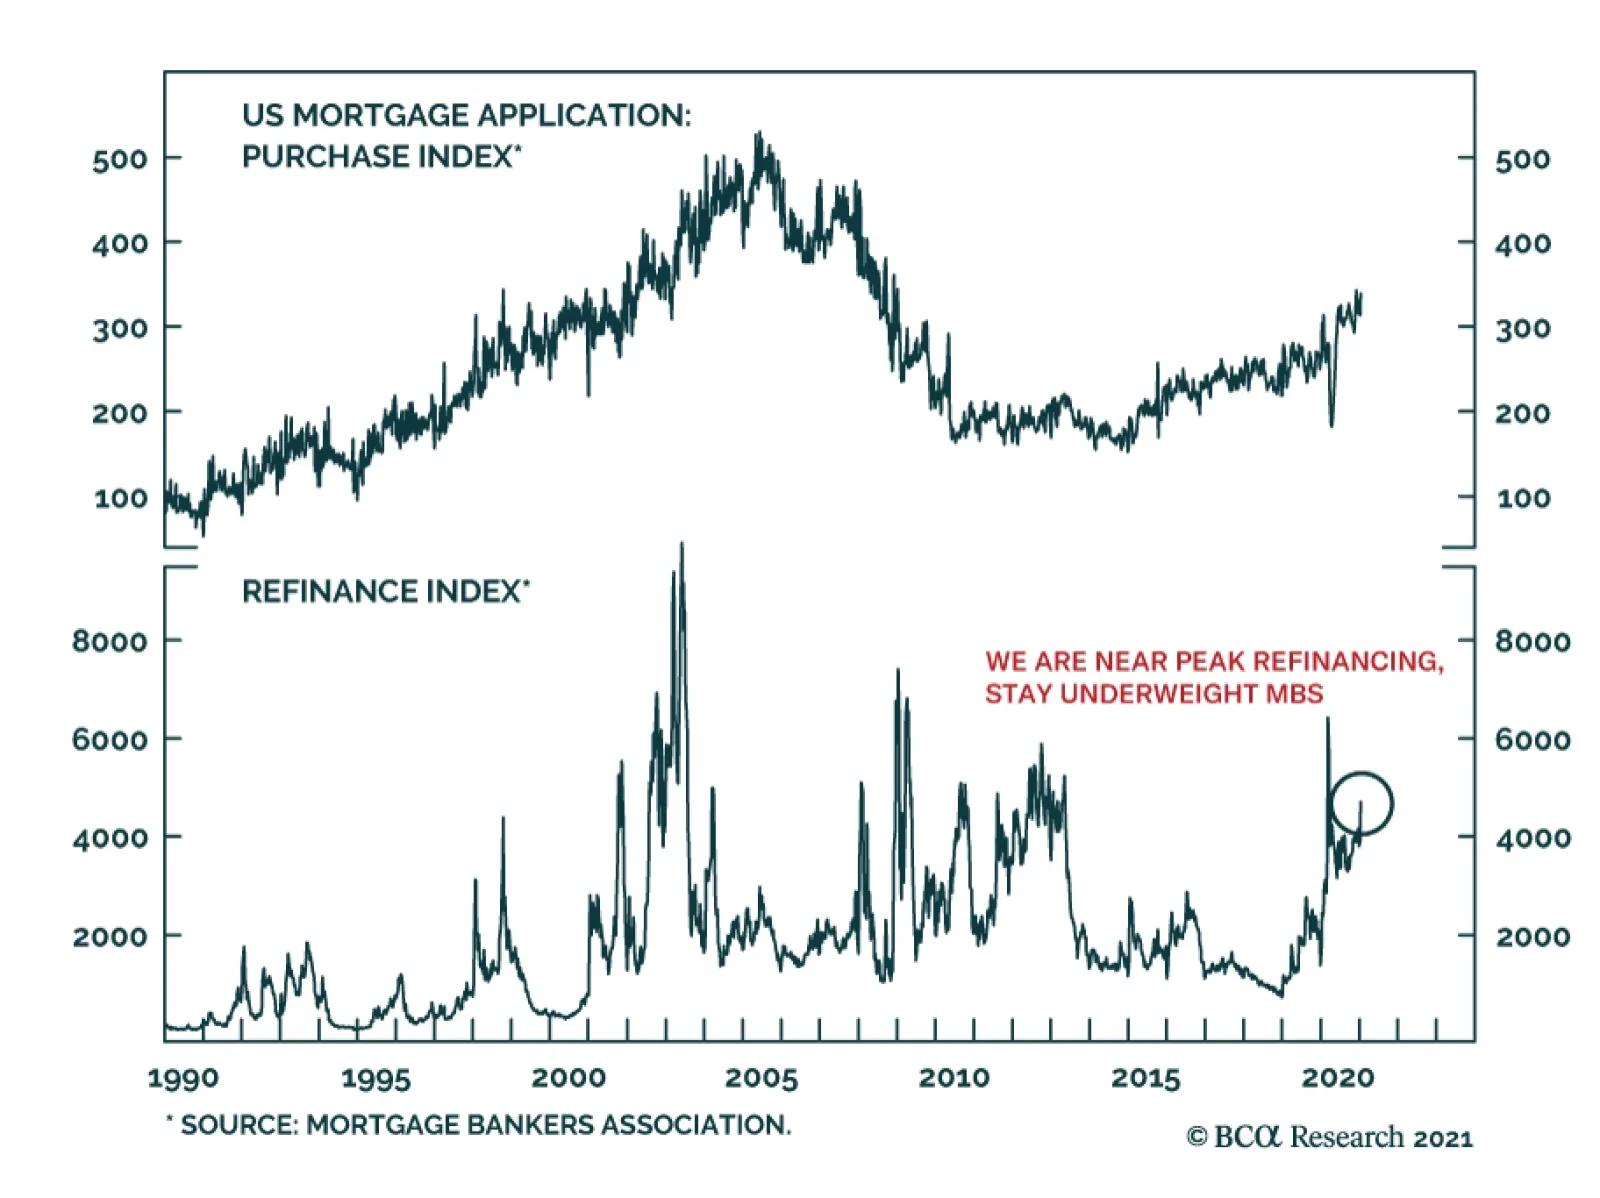
Demand for mortgages in the US remains strong. The MBA Mortgage Applications Index rose 16.7% in the week ending January 8, 2021 bringing mortgage applications to their highest level since March 2020, and October 2012 before that. This was supported by…
Highlights The incidents of state-owned enterprise (SOE) bond defaults late last year reflected deteriorating corporate balance sheets and exposed local governments’ weakening fiscal positions. Both were preexisting conditions that worsened due to the pandemic. China’s policymakers have vowed to accelerate restructuring the SOE/corporate sector, but they face a dilemma between economic stability and painful reforms; the outcome will ultimately depend on policymakers’ pain thresholds. In the next 6 to 12 months, the policy tightening cycle will continue and credit growth will decelerate. Chinese stocks are already more expensive than before the start of the last policy tightening cycle. We recommend a neutral position on domestic and investable stocks for now. Feature The days of China’s unconditional bailout of state firms may be over. In the past six months, Beijing has embarked on a series of reform agendas, including restructuring and stricter regulations targeting SOEs and the broader spectrum of the corporate sector. When three SOEs defaulted on bond payments late last year, neither the central nor the local government supported those firms. Allowing market forces to allocate capital to more productive firms by driving out the less efficient companies is structurally positive for the Chinese economy. However, the pursuit of meaningful SOE and broader corporate reforms will be a tough choice for Chinese policymakers this year while the economic recovery is underway. Ultimately, the degree and speed to reform SOEs will depend on how much near-term pain policymakers are willing to endure. We recommend a neutral position in Chinese stocks for now. We expect the financial markets to experience frequent mini-cycles in 2021 due to policy zigzags. Risks for policy miscalculations cannot be ruled out; equity prices will falter if Chinese authorities push for deeper reforms and tighter industry regulations while scaling back stimulus at the same time. Chinese stocks are already expensive and are vulnerable to authorities opting for much smaller stimulus and harsher corporate/SOE reforms. SOE Defaults: Policy Response Matters More Than Defaults Chart 1Policy Zigzags And Market Mini-Cycles
Policy Zigzags And Market Mini-Cycles
Policy Zigzags And Market Mini-Cycles
A flurry of high-profile defaults by state firms late last year unnerved investors and pushed up onshore corporate bond yields. Beijing’s move to allow SOEs to fail forced investors to reprice bonds issued by state firms as much riskier propositions. Following the defaults in November, the PBoC injected unusually large interbank liquidity; the de jure policy rate dropped and Chinese stock prices rallied (Chart 1). In our view, the recent liquidity injections do not provide enough evidence that macro policy is shifting to an easier bias. Despite a retreat in the short-term interbank rate, the authorities have plowed ahead with reforms and initiated more restrictions in key industries. In the coming months, investors should expect the following: SOE reforms will tolerate more bond defaults. Bank loans and local government bonds make up nearly 80% of China’s total domestic credit, whereas corporate bonds (including SOEs and local government financing vehicles (LGFVs)) account for only 10% of the total (Chart 2). Thus, even if corporate bond defaults push up yields, Beijing may see this as a small price to pay in the near term, in exchange for a market-driven system cleansing to eliminate inefficient SOEs. This outcome will be negative for corporate bonds (Chart 3). Chart 2Corporate Bond Issuance Make Up Only A Small Portion Of Total Financing
Corporate Bond Issuance Make Up Only A Small Portion Of Total Financing
Corporate Bond Issuance Make Up Only A Small Portion Of Total Financing
Chart 3Periods Of Financial Tightening Dampen Corporate Bond Market
Periods Of Financial Tightening Dampen Corporate Bond Market
Periods Of Financial Tightening Dampen Corporate Bond Market
Chart 4Higher Funding Costs Will Discourage Corporate Borrowing
Higher Funding Costs Will Discourage Corporate Borrowing
Higher Funding Costs Will Discourage Corporate Borrowing
Policymakers may underestimate the unintended consequences of SOE defaults on credit flow and the broader economy. The central bank was able to engineer a sharp drop in its policy rate last month, which may prompt policymakers to believe that interbank liquidity injections are efficient market-calming measures and rising corporate bond yields will not impede overall credit growth. This may be true in the short term, however, tightened policy in the name of reforms has previously pushed up both the 3-month SHIBOR and bank lending rates, leading to a significant slowing in credit growth and an eventual slowdown in economic expansion (Chart 4). Reasons for such chain reactions are twofold. First, banks become more risk averse during a tightening cycle and charge higher premiums when lending to smaller financial institutions and the private sector (Chart 4, bottom panel). Secondly, although Chinese SOEs can borrow from banks at much lower interest rates than private-sector entities (Chart 5), their heavy indebtedness makes them hyper-sensitive to even a slight uptick in financing costs. Chinese SOEs rely more on bank lending than bond issuance for financing and SOE borrowers dominate China’s bank credit to the corporate sector.1 Chart 6 shows that the rise in the weighted average lending rate in 2017 was relatively minor compared with levels that prevailed in the past decade. Nonetheless, a less than one percentage point hike in the lending rate materially slowed credit growth and the investment-driven sectors of China's economy. Chart 5SOEs Tend To Have Lower Borrowing Costs, Partially Reflecting Implicit Government Guarantees
China's SOE Reform Dilemma
China's SOE Reform Dilemma
Chart 6Small Rise In Lending Rate, Large Fall In Credit Growth
Small Rise In Lending Rate, Large Fall In Credit Growth
Small Rise In Lending Rate, Large Fall In Credit Growth
Regulatory pressures will lead to de facto tightening. As outlined in our 2021 Outlook report, as part of the macroeconomic policy normalization, credit growth will likely decelerate by two to three percentage points this year from 2020. The extended Macro Prudential Assessment (MPA) System will wrap up by year-end and financial institutions will need to start slowing their asset balance sheets to meet the assessments. Moreover, last week the central government revised Measures for the Performance Evaluation of Commercial Banks. The modified version factors lending to the new-economy sectors and micro and small enterprises into the performance evaluation and salaries of the state-owned and controlled commercial banks’ management.2 The new measures will likely dampen the banks’ propensity to lend to old-economy sectors, such as real estate and traditional infrastructure. All in all, a faster-than-desired slowdown in credit growth will ensue if policymakers simultaneously allow more SOE/corporate defaults, undertake industry reforms, and implement tighter banking regulations in 2021. This is negative for both economic growth and the equity market. Bottom Line: Chinese policymakers will likely allow more SOE defaults in the coming months. In addition to an increased number of SOE defaults that is negative for the corporate bond market, sped up industry restructuring and more stringent regulations may lead to a sharp fall in credit growth and stock prices. Worsening Old Economy SOEs’ Financial Positions Chart 7SOEs Are Less Efficient Than Private Firms In Profitability And Productivity
China's SOE Reform Dilemma
China's SOE Reform Dilemma
An acceleration in SOE reforms may trigger near-term risks, but a delay in restructuring China’s loss-making SOEs will have repercussions in the long term. The explicit and implicit government protections for SOEs have eroded their efficiencies compared with the private sector (Chart 7). The most significant side effect is a rapid rise in SOE leverage and diminishing profitability in some of the old economy sectors. It may be a dead end for the government to continue bailing out state firms with inefficient operations and financial losses. A Special Report we previously published showed that among SOEs in the industrial and construction sectors, which account for half of all SOEs in China, the adjusted return on assets (ROA) versus borrowing costs has been negative since 2013 (Chart 8). This suggests that SOE investment funded by higher leverage cannot produce sufficient income to repay debt. During the last tightening cycle that started in late 2016, policymakers managed to rein in local SOE debt growth, but it reversed course in 2018 due to a collapse in domestic demand (Chart 9). As Chart 8 illustrates, ROA among SOEs in the industrial and construction sectors has significantly deteriorated since then. Chart 8SOEs Financial Gains From Debt Are In Deep Contraction
SOEs Financial Gains From Debt Are In Deep Contraction
SOEs Financial Gains From Debt Are In Deep Contraction
Chart 9China Was Successful In Reining In SOE Debt, But Only Briefly
China Was Successful In Reining In SOE Debt, But Only Briefly
China Was Successful In Reining In SOE Debt, But Only Briefly
Bottom Line: A continued capital misallocation by perpetually leveraging SOEs and LGFVs with negative marginal operating gains will eventually lead to a self-reinforcing debt trap. In turn, that would precipitate a default en masse and necessitate a larger government bailout. Another Layer To The SOE Reform Dilemma The central government’s SOE reform agenda is further complicated by the involvement of local governments (LGs). We have several observations: First, a meaningful SOE restructuring, which would require consolidating/liquidating some of the unprofitable SOE assets, may expose the LGs’ fiscal vulnerabilities to both investors and regulators. The fiscal weakness of China’s provincial-level governments is illustrated by the bond-payment default of Yongcheng Coal, a SOE from Henan Province. Henan is economically sound with GDP growth above the national average. However, when considering the province’s direct and hidden debt, debt servicing costs, and liquidity availability, Henan is in a group of 10 provinces with the worst fiscal conditions in 2020.3 This implies that LG officials may not have been able to bail out Yongcheng even if they wanted to. Moreover, cash-strapped LGs have reportedly formed reciprocal and entrenched relationships with local SOEs. These SOEs may carry debt for LGs and in turn, free up an LG’s borrowing capacity. When these SOEs fail, the credibility of LG officials may be questioned and investigated by the central government. As such, LGs are incentivized to protect their local SOEs. Chart 10More Defaults, More Bank Lending
China's SOE Reform Dilemma
China's SOE Reform Dilemma
Secondly, removing the government’s bailout of SOE debt defaults does not negate the underlying factor eroding SOE productivity: the government’s support of local SOEs with easier access to bank loans. Banks, which heavily influence LGs, are not always vigilant about risks associated with local SOE debt. Banks provide loans at preferential rates to localities and their affiliated SOEs. In return, LGs often award banks financing opportunities for profitable infrastructure projects. In this regard, local SOE bond defaults are not necessarily detrimental to bank profits because banks can make up their losses through financing more lucrative projects. Studies show that even when some LGs have experienced large-scale SOE bond defaults, lending to these LGs from commercial banks actually increased relative to other forms of financing (Chart 10). Beijing must take bold measures to break up the long-standing relationship between LGs and SOEs in order to achieve any market-oriented reform of local SOEs. The LGs will likely strongly resist severing the connection. Lastly, given that SOEs are often deployed to support the central government’s economic, political and strategic initiatives, LGs can use those grand initiatives to help justify their local SOEs’ existence - even unprofitable ones. Bottom Line: Beijing faces a tough choice between implementing effective SOE reforms and worsening local governments’ fiscal conditions with negative implications for economic growth. While allowing more SOE bond defaults can force investors to reprice SOE credit risks, as long as the implicit government support for SOEs through bank lending still exists, allocating capital to more efficient private-sector companies will be a formidable task. Investment Conclusions Some economists argue that China’s SOE debt should be considered part of public-sector leverage because many SOE investments are affiliated with government projects. Additionally, Chinese SOEs have accumulated massive assets, which can more than offset their debt4 and make SOE bonds and debt low- risk propositions. Moreover, even though the government may allow more SOE bond defaults, if the defaults threaten China’s financial stability, then the government can move non-performing debt from LGs and SOEs to the balance sheets of the central bank or central government. There are several issues with this argument. The stock of assets in a large portion of Chinese SOEs5 has persistently failed to generate sufficient cash flow to service debt, which implies that the true value of the assets may be low and will likely be sold at below cost when liquidated. It is not useful to compare book value of assets with debt because the true value of assets is contingent on the income/cash flow that they generate. We agree that public-sector leveraging/deleveraging is fundamentally a political choice in countries with control over their own monetary policy and debt is in local currency. Theoretically, a country can monetize public and private local currency-denominated debt via a central bank or government- controlled commercial banks. In such a case, the authorities will have little control over inflation, the exchange rate, and the long-term productivity. For now, Chinese policymakers seem to be on a path of accelerating reform, an indication that they want to avoid bailing out state firms and private-sector companies. In addition, President Xi’s “dual circulation” mantra emphasizes the importance of improving the country’s corporate efficiency and productivity. We think that consolidating some inefficient SOE sectors in the old economy fits such initiative. Our baseline view is that the SOE consolidation process will be gradual and the PBoC will provide sufficient liquidity in an effort to prevent market jitters. At the same time, the sharp turns in the policy rate in the past six months are prime examples of the periodic oscillation in China’s policymaking between maintaining economic stability and pursuing meaningful reforms. The policy swings will create mini-cycles for Chinese risk asset prices. Chinese stocks are not cheap compared with values at the start of the last policy tightening cycle (Chart 11A and 11B). We recommend a neutral position on domestic and investable equities for the time being. CHART 11AInvestable Stocks Are More Expensive Now Than Prior To The Last Tightening Cycle
Investable Stocks Are More Expensive Now Than Prior To The Last Tightening Cycle
Investable Stocks Are More Expensive Now Than Prior To The Last Tightening Cycle
CHART 11BA-Shares Are Less Expensive, But Valuations Are Still Elevated
China's SOE Reform Dilemma
China's SOE Reform Dilemma
Jing Sima China Strategist jings@bcaresearch.com Footnotes 1Based on the OECD estimates, SOEs’ share of China’s total corporate debt escalated from 46% in 2013 to roughly 80% in 2018. 2Banks included in the new appraisal system are state-owned and state-controlled commercial lenders, and other commercial banks may also refer to the guidelines. Lenders will be evaluated yearly and the results will be factored into the annual reviews of top bank executives as salary determinants. Each of the four new categories will carry an equal weighting. The “national development goals and real economy” category has four benchmarks: serving the government’s “ecological civilization strategy” to encourage lending for green industries and companies; serving strategic emerging industries; implementing the “two increases” - inclusive lending to micro and small enterprises; and implementing the “two controls” - nonperforming loans and borrowing costs of micro and small enterprises. The category “controlling and preventing risks” includes metrics on bad loan ratios, the nonperforming loan growth rate, provision coverage, liquidity ratios and capital adequacy ratios. 3“Seeing Through the Frosted Glass: Assessing Chinese Local Governments’ Creditworthiness”, Pengyuan Rating Public Finance Report, June 2020 4Chinese SOE assets are estimated to have reached 2.3 times China’s 2019 GDP, whereas their debt is close to 130% of GDP. 5IMF estimated that about a quarter of Chinese SOEs were operating at a loss in 2017. Cyclical Investment Stance Equity Sector Recommendations
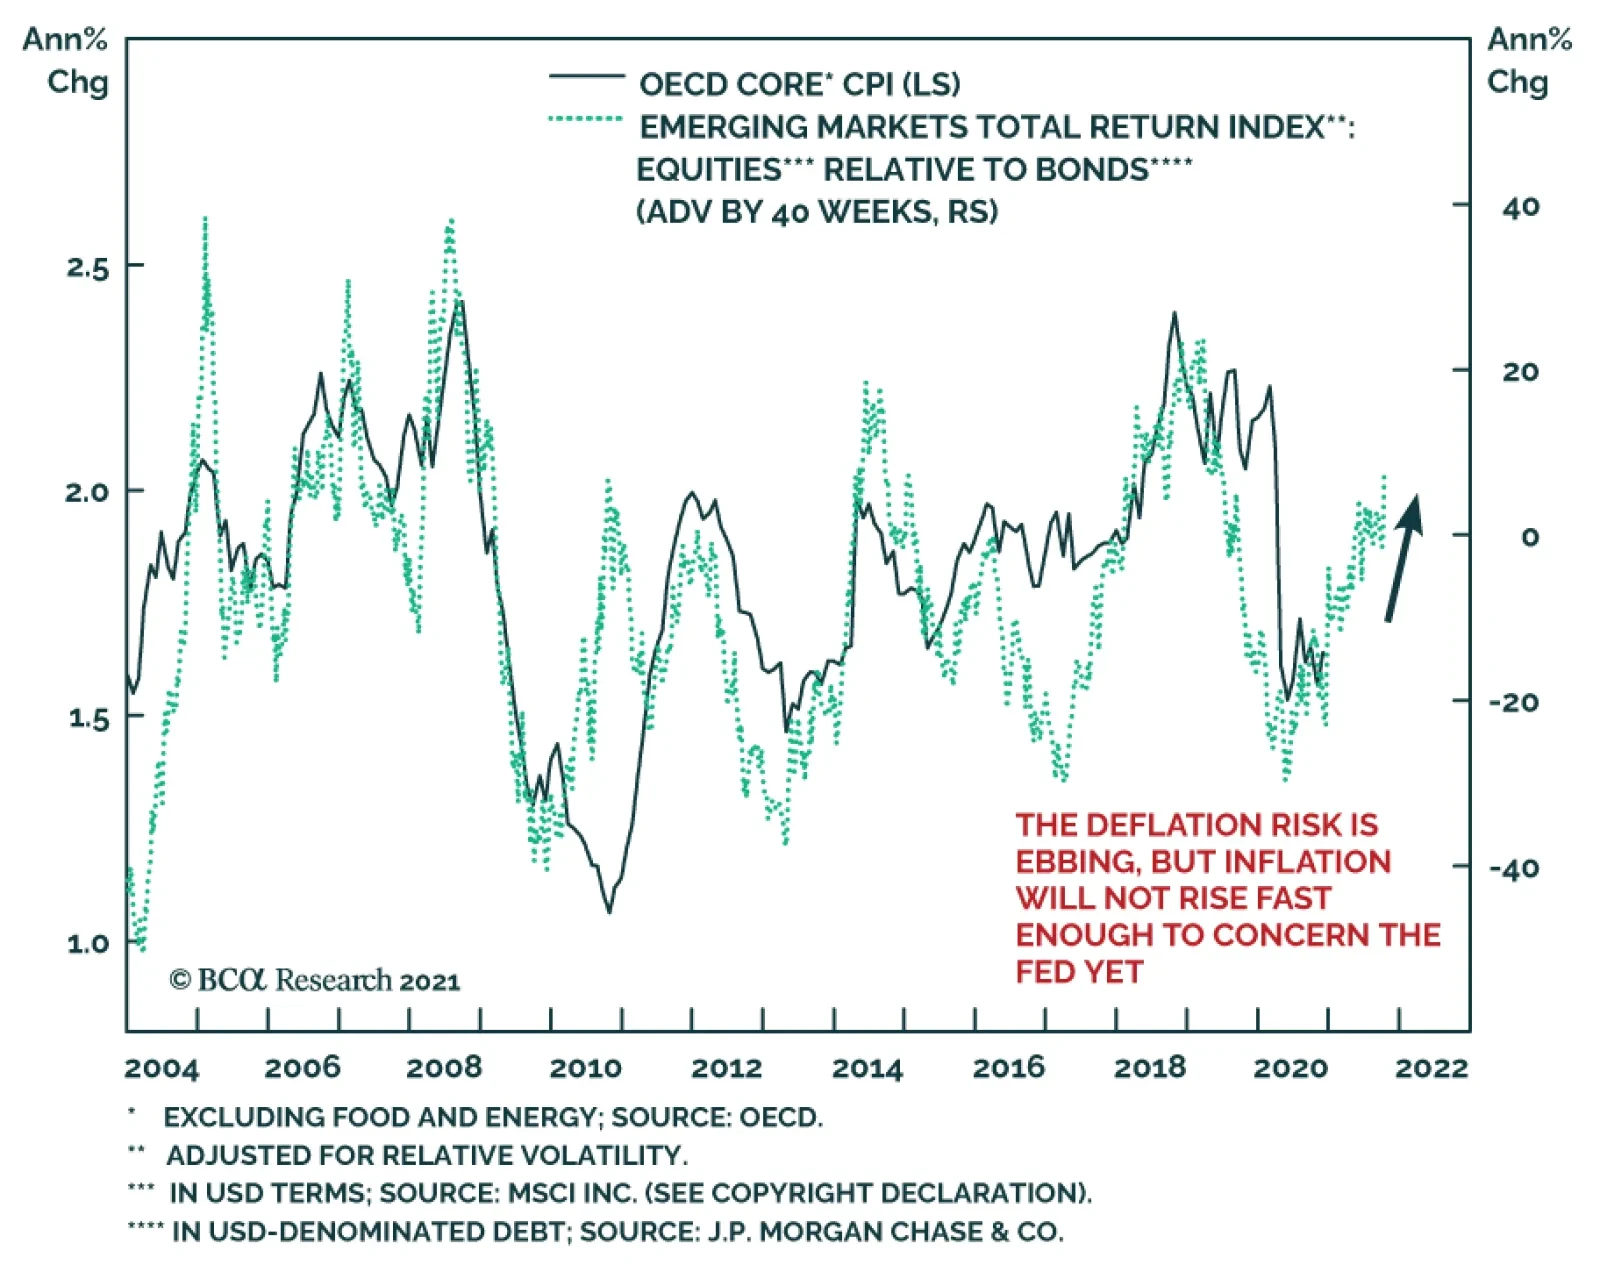
Much of the cyclical outlook for yields hinges on the outlook for inflation. For now, global core CPI continues to linger toward its nadir. However, important indicators suggest that it is set to trend higher in the coming quarters. One of the most…
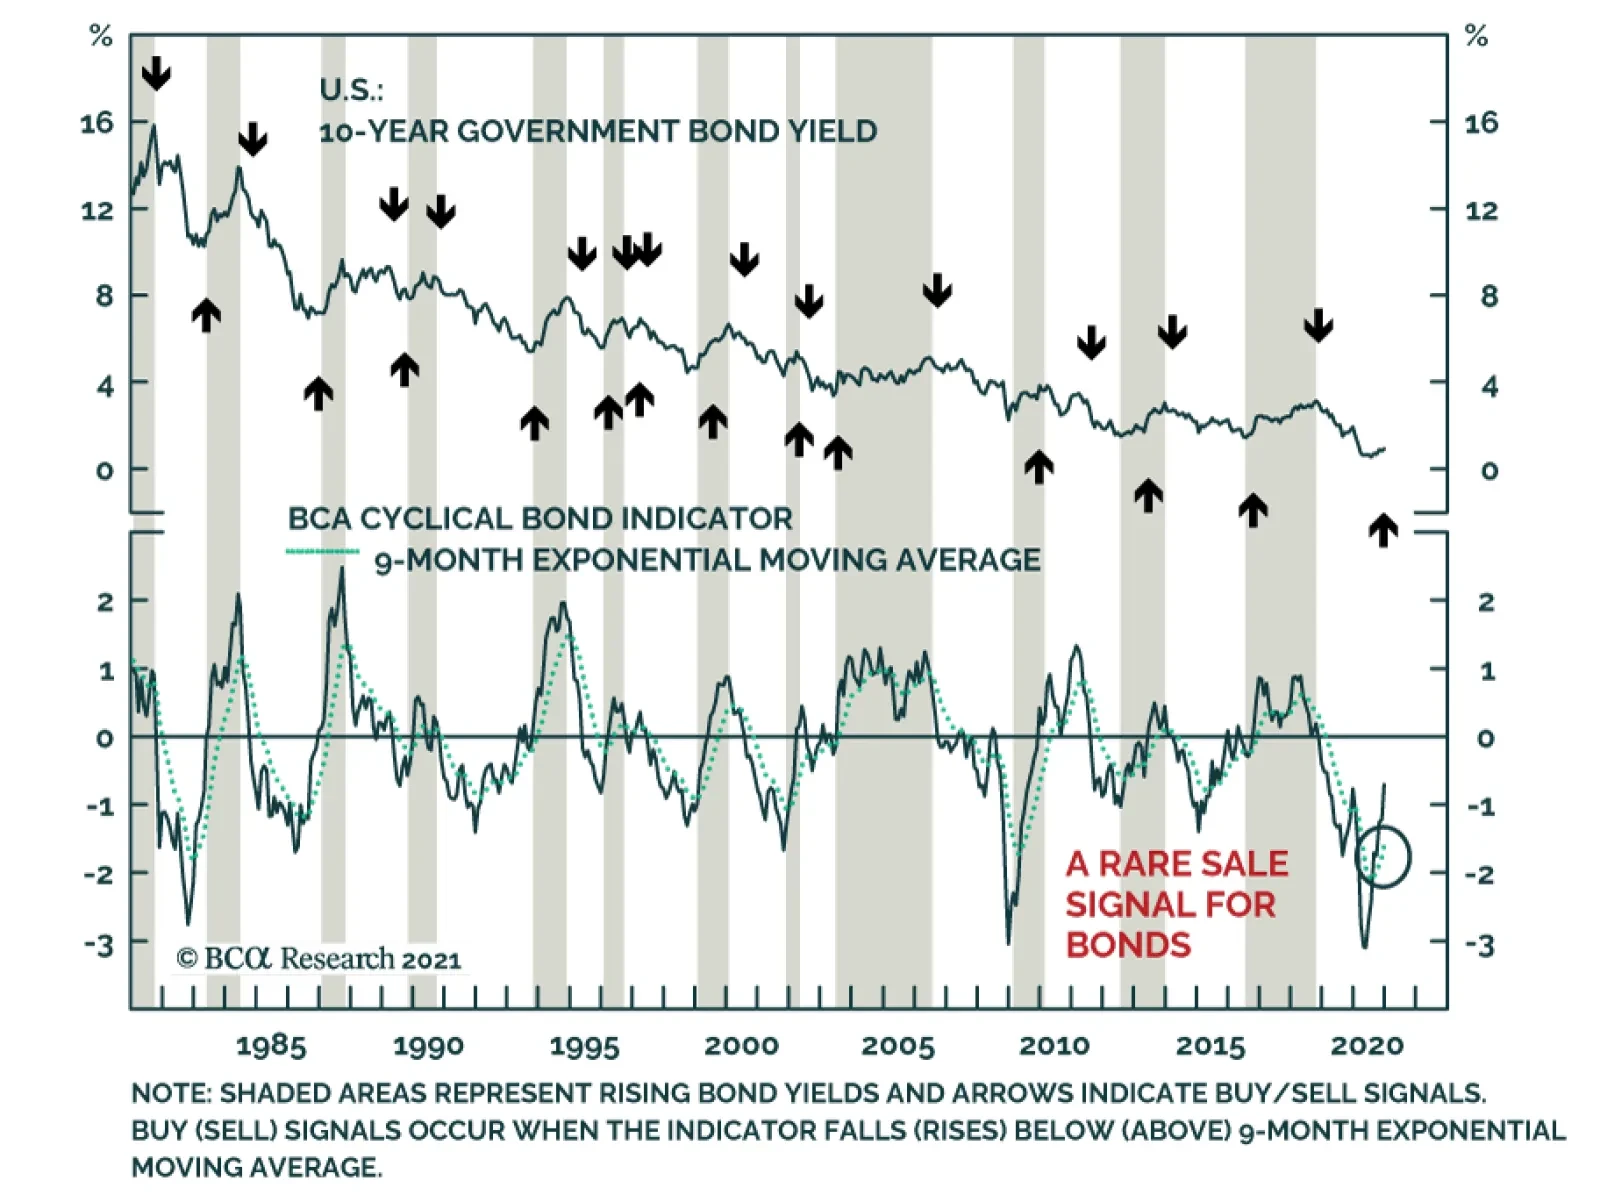
BCA Research’s time-tested indicators are sending bearish warnings for bonds. The BCA Cyclical Bond Indicator is rising quickly and has crossed over the signal line, which indicates that yields have significantly more upside over the coming 9 to 12 months. We…
According to BCA Research’s Global Fixed Income Strategy service, the odds of a major US fiscal spending boost from the incoming Biden Administration, both in the short-run and over the medium term, are now much higher after the Georgia senate elections. More…
Highlights US Reflation: The Georgia senate victories for the Democratic Party have returned the bond-bearish “Blue Sweep” scenarios to the forefront. More fiscal stimulus and an easy Fed will extend the policy-driven reflation of the US economy and financial markets. US Treasury Strategy: Stay underweight US Treasuries, with below-benchmark duration exposure, in global bond portfolios. Stay overweight TIPS versus nominal US Treasuries and continue to position for more bear-steepening of the Treasury curve. Global Corporate Sector Valuation: Developed market investment grade corporate spread valuations look stretched. Maintain only neutral levels of spread risk for higher-quality corporates while targeting sectors that look undervalued across the majority of regions, such as Energy and Financials. Avoid universally expensive consumer sectors such as Retailers, Restaurants, and Food & Beverages. Feature Chart of the WeekUS Policy Reflation Is Negative For USTs
US Policy Reflation Is Negative For USTs
US Policy Reflation Is Negative For USTs
In a week of stunning US political events, the most important one for financial markets was not the mob invasion of the US Capitol. The Georgia senate runoff votes completed the unfinished business of the 2020 US elections, with Democratic Party candidates winning both seats. This effectively delivered a change in party control of the US Senate to the Democrats, with a 50/50 seat split that would give incoming Vice-President Kamala Harris the potential tiebreaking vote. With the Democratic Party now in control of the US House of Representatives, the Senate and the White House, the bond-bearish “Blue Sweep” scenario that we discussed in our pre-election Special Report last October – with greater odds that the highly expansionary Biden policy agenda can be more fully implemented - is now coming to fruition.1 The benchmark 10-year US Treasury yield broke above 1% after the election results, continuing to climb to 1.13% yesterday. The overall US Treasury market action has continued the reflationary trends seen in the latter half of 2020, with a bear-steepening of the Treasury curve and wider inflation breakevens in the TIPS market (Chart of the Week). Treasuries continue to underperform other developed economy government bond markets (in USD-hedged terms), continuing a move that started back in the spring of 2020. We expect these trends to remain in place over the next several months, given the current and likely future monetary and fiscal policy mix in D.C. The Biden Boost To US Treasury Yields BCA Research’s newest service, US Political Strategy, launched last week with a discussion of the US fiscal policy outlook after the Georgia senate elections.2 The conclusion was that the most radical parts of the Democratic Party agenda will be difficult to pass given their narrow majorities in the House and Senate, but some sizeable fiscal stimulus is still likely. In the near term, an expansion of the COVID relief passed in the December stimulus bill, such as boosting monthly checks to individuals from $600 to $2000, is likely to come relatively quickly after Biden is inaugurated via a “reconciliation bill”. Additional stimulus measures could also be enacted, partially funded by some rollback of the Trump tax cuts. Beyond that, the Biden administration will attempt to push through some of the more expansionary parts of incoming president’s campaign platform related to items like infrastructure spending. In the end, the expectation is that the US fiscal drag (a reduction in the deficit) that was set to occur in 2021 after the massive stimulus measures enacted in 2020 will be much smaller with full Democratic control in D.C. This will help boost US GDP growth this year. A greater implementation of the Biden agenda would have a more lasting impact on US economic growth in the following years. Last September, Moody’s published a report that compared the policy platforms of Candidate Biden and President Trump, running the details of the agendas into the Moody’s US economic model.3 The analysts concluded that under realistic assumptions about how much of the Biden platform would be implemented under a “Blue Sweep” scenario, US real GDP growth would average 6% in 2021 and 2022 under President Biden, a full two percentage points higher than the baseline scenario (Chart 2). This would also drive the US unemployment rate back toward pre-pandemic levels more quickly. Moody’s concluded that the Fed would start hiking rates in 2023 under the Democratic sweep scenario, similar to the current pricing in the US overnight index swap (OIS) curve, but with a more aggressive pace of tightening expected over the subsequent two years (bottom panel) – a bond bearish outcome that would push the 10-year Treasury yield back to 2% by the end of 2022 and 3% by the end of 2023. We expect the Fed to normalize US monetary policy at a slower pace than Moody’s, but we do agree on there is still plenty of upside potential for Treasury yields over the next 1-2 years. This will initially come more from rising inflation breakevens than real yields. Currently, US TIPS breakevens are drifting steadily higher, even as realized US inflation is starting to cool off a bit (Chart 3). The 10-year breakeven is now up to 2.1%, a level last seen in 2018 but still below the 2.3-2.5% level we deem consistent with the market expecting that the Fed’s 2% inflation target will be sustainably achieved. The idea that inflation breakevens can widen without higher realized inflation may seem odd on the surface, but it is not unprecedented. In the years immediately after the 2008 financial crisis, when the Fed kept rates at 0% while the economy recovered from the Great Recession, TIPS breakevens rose alongside very weak US inflation. Chart 2How 'Bidenomics' Can Be Bond-Bearish
How 'Bidenomics' Can Be Bond-Bearish
How 'Bidenomics' Can Be Bond-Bearish
Chart 3Fed Policy Stance Favors Wider TIPS Breakevens
Fed Policy Stance Favors Wider TIPS Breakevens
Fed Policy Stance Favors Wider TIPS Breakevens
With the Fed having shifted to an Average Inflation Targeting framework last year, we don’t expect the Fed to turn more hawkish too quickly. We expect the Fed to keep the funds rate well below US realized inflation for at least the next couple of years and likely longer, keeping real US interest rates negative and preventing an unwanted flattening of the Treasury curve (Chart 4). The Fed’s low interest rate policies will also make it easier to service the growing stock of US government debt during the Biden Administration (Chart 5). Net-net, we continue to see additional upside for US Treasury yields in the aftermath of the “Blue Sweep”. Chart 4US Policy Mix Favors UST Curve Steepening
US Policy Mix Favors UST Curve Steepening
US Policy Mix Favors UST Curve Steepening
Net-net, we continue to see additional upside for US Treasury yields in the aftermath of the “Blue Sweep”. We expect the benchmark 10-year Treasury yield to rise to the 1.25-1.5% range over the next six months, with higher yields possible if the market begins to question the Fed’s commitment to keeping the funds rate anchored at 0% - an outcome that could occur by year-end if the Fed starts to consider a slower pace of Treasury purchases via quantitative easing (Chart 6). Chart 5Low Interest Rates Help Service Rising Debt
Low Interest Rates Help Service Rising Debt
Low Interest Rates Help Service Rising Debt
Chart 6More Upside Room For UST Yields
More Room Upside For UST Yields
More Room Upside For UST Yields
We continue to recommend an overall US Treasury investment strategy that will perform well as yields rise. Stay underweight US Treasuries, with below-benchmark duration exposure, in global bond portfolios. Stay overweight TIPS versus nominal US Treasuries and continue to position for more bear-steepening of the Treasury curve. Bottom Line: The odds of a major US fiscal spending boost from the incoming Biden Administration, both in the short-run and over the medium term, are now much higher after the Georgia senate elections. More fiscal stimulus and an easy Fed will extend the policy-driven reflation of the US economy and financial markets. Maintain positions that will benefit from higher Treasury yields. Finding Value In Global Investment Grade Corporate Bond Sectors As we discussed in our 2021 Model Bond Portfolio Update published last week,4 the strong performance of global spread product in H2/2020 has led to an across-the-board narrowing of credit spreads, with investment grade spreads hovering close to, or below, pre-COVID levels in developed markets (Chart 7). Predictably, this has stretched valuations to historically expensive levels across developed economy investment grade corporate bond markets. Our preferred measure of spread valuation, the 12-month breakeven spread, measures how much spread widening is required over a one-year horizon to eliminate the yield advantage of owning corporate bonds versus duration-matched government debt. We then show those breakeven spreads as a percentile ranking versus its own history, to allow comparisons over periods with differing underlying spread volatility. These breakeven spread percentile rankings for investment grade corporates are now at the bottom percentile in the US and below the 25th percentile level in the euro area, UK, Australia, and Canada, indicating that there is limited potential for additional spread tightening from current levels (Chart 8). Chart 7Investment Grade Spreads At Or Below Pre-Covid Lows
Investment Grade Spreads At Or Below Pre-Covid Lows
Investment Grade Spreads At Or Below Pre-Covid Lows
As the gains from the “beta” of owning corporate credit have been largely exhausted, it now makes sense to pay more attention to the “alpha” in corporate debt markets by looking at relative valuations across sectors. To accomplish this, we return to our cross-sectional relative value framework, which we last discussed in the summer of 2020.5 Readers should refer to that report for details on our framework methodology. In this report, we apply our relative value framework to investment grade corporate bond markets in the US, euro area, UK, Canada and Australia. Chart 8Valuations Look Stretched On A Breakeven Spread Basis
Valuations Look Stretched On A Breakeven Spread Basis
Valuations Look Stretched On A Breakeven Spread Basis
US In Table 1, we present the latest output from our US investment grade sector valuation model. In keeping with the framework used by BCA Research US Bond Strategy, we use the average credit rating, duration, and duration-squared (convexity) of each sector as the model inputs. As the gains from the “beta” of owning corporate credit have been largely exhausted, it now makes sense to pay more attention to the “alpha” in corporate debt markets by looking at relative valuations across sectors. Table 1US Investment Grade Corporate Sector Valuation & Recommended Allocation
Something Borrowed, Something Blue
Something Borrowed, Something Blue
To determine our US sector recommendations, we not only need to look at the spread valuations from the relative value model, but we must also consider what level of overall US spread risk, which we measure as duration-times-spread (DTS), to target. With valuations for US investment grade looking stretched, we are looking to target only a neutral DTS at or around that of the benchmark index. Investors willing to take on a greater amount of spread risk should look at the beaten-up Airlines sector, which offers the most attractive risk-adjusted valuation in US investment grade within our model. The sweet spot, therefore, is the upper half of Chart 9, around the dotted horizontal line denoting the benchmark DTS. Given the large amount of spread narrowing seen since we last published these models, there are fewer obvious overweight candidates, with most sectors priced close to our model-implied fair value. However, Finance Companies, Lodging, and REITs are interesting opportunities that fit our “risk budget”. Investors willing to take on a greater amount of spread risk should look at the beaten-up Airlines sector, which offers the most attractive risk-adjusted valuation in US investment grade within our model. Sectors to avoid, meanwhile, are Restaurants, Environmental, and Other Utilities. Chart 9US Investment Grade Corporate Sectors: Risk Vs. Reward
Something Borrowed, Something Blue
Something Borrowed, Something Blue
Euro Area In Table 2, we present the results of our euro area investment grade sector valuation model. The independent variables in this model are each sector’s duration, trailing 12-month spread volatility, and credit rating. Note that we will be using the same independent variables in our UK model. Table 2Euro Area Investment Grade Corporate Sector Valuation & Recommended Allocation
Something Borrowed, Something Blue
Something Borrowed, Something Blue
In keeping with our neutral stance on euro area investment grade, we will be targeting an overall level of spread risk at or around the benchmark. Therefore, we are interested in overweighting sectors in the upper half of Chart 10 that are close to the overall index DTS. Chart 10Euro Area Investment Grade Corporate Sectors: Risk Vs. Reward
Something Borrowed, Something Blue
Something Borrowed, Something Blue
On that basis, Subordinated Debt, Brokerage Asset Managers, and Integrated Energy seem appealing overweight candidates while Airlines, Independent Energy, and Building Materials are ones to avoid. UK In Table 3, we present the latest output from our UK relative value spread model. We are currently overweight UK investment grade, one of the best performers in our model bond portfolio universe last year. Although investment grade spreads are below pre-pandemic lows, the major factor to watch is how the economy adjusts to the Brexit trade deal. Table 3UK Investment Grade Corporate Sector Valuation & Recommended Allocation
Something Borrowed, Something Blue
Something Borrowed, Something Blue
As with other regions, our ideal overweight candidates here are those with positive risk-adjusted residuals and a relatively neutral DTS—represented in the upper half of Chart 11 near the dotted line. The best overweight candidates are concentrated within Financials, with Brokerage Asset Managers, REITs and Insurance appearing attractive. Tobacco and Railroads also fit our criteria. Meanwhile, Metals and Mining, Aerospace, and Restaurants are sectors to avoid. Chart 11UK Investment Grade Corporate Sectors: Risk Vs. Reward
Something Borrowed, Something Blue
Something Borrowed, Something Blue
Canada Table 4 shows the output from our Canadian relative value spread model. The independent variables in this model are: sector duration, one-year ahead default probability (as calculated by Bloomberg) and credit rating. While we do not have an allocation to Canadian corporate debt in our model bond portfolio, our key insight regarding other markets also applies here—historically expensive valuations for the overall market mean that we recommend keeping exposure to spread risk neutral while finding pockets of value where available. Table 4Canada Investment Grade Corporate Sector Valuation & Recommended Allocation
Something Borrowed, Something Blue
Something Borrowed, Something Blue
On that basis, some of the most appealing overweight candidates, shown in the top half of Chart 12, are Finance Companies, Office and Healthcare REITs, Brokerage Asset Managers, Life Insurance, and Other Industrials. Meanwhile, we are staying away from Cable Satellite, Media Entertainment, and Environmental sectors. Chart 12Canada Investment Grade Corporate Sectors: Risk Vs. Reward
Something Borrowed, Something Blue
Something Borrowed, Something Blue
Australia Table 5 shows the output from our new Australia relative value spread model. The independent variables in this model are sector credit rating, one-year ahead default probability (as calculated by Bloomberg), and yield-to-maturity. Due to the relatively small size of the Australian corporate bond market, we are focusing our analysis on Level 3 sectors within the Bloomberg Barclays Classification System (BCLASS) rather than the more granular Level 4 analysis we have employed for other markets. Table 5Australia Investment Grade Corporate Sector Valuation & Recommended Allocation
Something Borrowed, Something Blue
Something Borrowed, Something Blue
As with Canada, we have no exposure to this market in our model bond portfolio but are looking to maintain a neutral level of recommended overall spread risk while looking at sectors in Chart 13 that show positive risk-adjusted valuations and have a DTS close to the Australian corporate benchmark. On that basis, Finance Companies and Insurance appear attractive while Energy, Technology, and REITs should be avoided. Chart 13Australia Investment Grade Corporate Sectors: Risk Vs. Reward
Something Borrowed, Something Blue
Something Borrowed, Something Blue
Comparing Sector Valuations Across Regions The above analyses have allowed us to paint a picture of sector valuation within regions. However, there is added benefit in looking at risk-adjusted valuations across the three major corporate bond markets—the US, euro area and UK—with the intent of spotting broader sector level trends in the global investment grade universe that are not limited to just one market. Table 6 allows us to highlight some clear trends: Table 6Valuations Across Major Corporate Bond Markets
Something Borrowed, Something Blue
Something Borrowed, Something Blue
Industrials such as Chemicals, Capital Goods, and Diversified Manufacturing look overvalued across the board. These cyclicals, which are deeply sensitive to the health of business investment and confidence, rallied strongly on vaccine optimism but now look overbought. On the consumer side, there is weakness in cyclicals such as retailers and restaurants, and non-cyclicals like consumer products and food & beverages. The new round of lockdowns instituted in Europe and the UK are a major risk for these sectors as we head into the final stretch before mass vaccination. Energy looks undervalued in all three regions. This result is supported by the outlook from our BCA Research Commodity & Energy strategists, who are bullish on oil and believe that Brent prices will average at $63/bbl in 2021 as demand continues to grow and OPEC 2.0 keeps a tight grip on supply. Financials look to be a bastion of value, with finance companies/institutions and insurance looking cheap across the board. These sectors have obviously benefited from the steepening in yield curves we have already seen but there is still remaining upside as inflation expectations continue to rise and push up nominal yields at the long-end of the curve. Financials look to be a bastion of value, with finance companies/institutions and insurance looking cheap across the board. Bottom Line: Developed market investment grade corporate spread valuations look stretched. Maintain only neutral levels of spread risk for higher-quality corporates while targeting sectors that look undervalued across the majority of regions, such as Energy and Financials. Avoid universally expensive consumer sectors such as Retailers, Restaurants, and Food & Beverages. Robert Robis, CFA Chief Fixed Income Strategist rrobis@bcaresearch.com Shakti Sharma Research Associate ShaktiS@bcaresearch.com Footnotes 1 Please see US Bond Strategy / Global Fixed Income Strategy Special Report, "Beware The Bond-Bearish Blue Sweep", dated October 20, 2020, available at usbs.bcaresearch.com 2 Please see US Political Strategy Report, "Buy Reflation Plays On Georgia’s Blue Sweep", dated January 6, 2021, available at usps.bcaresearch.com. 3 The full report can be found here: https://www.moodysanalytics.com/-/media/article/2020/the-macroeconomic-consequences-trump-vs-biden.pdf 4 Please see BCA Research Global Fixed Income Strategy Report, "Our Model Bond Portfolio Strategy For 2021: Leaning Into Reflation", dated January 6, 2021, available at gfis.bcaresearch.com. 5 Please see BCA Research Global Fixed Income Strategy Report, "Hunting For Alpha In The Global Corporate Bond Jungle", dated May 27, 2020, available at gfis.bcaresearch.com. Recommendations The GFIS Recommended Portfolio Vs. The Custom Benchmark Index
Something Borrowed, Something Blue
Something Borrowed, Something Blue
Duration Regional Allocation Spread Product Tactical Trades Yields & Returns Global Bond Yields Historical Returns
Highlights Rates: The Democratic sweep of the election has caused the uptrend in bond yields to accelerate and has benefited our recommended rates positions (below-benchmark duration, nominal and real curve steepeners, inflation curve flatteners). We aren’t yet ready to exit any of these positions, and our medium-term target of 2% - 2.25% for the 5-year/5-year forward nominal Treasury yield remains unchanged. Municipal Bonds: Though valuation has become more expensive, we continue to recommend a maximum overweight allocation to municipal bonds. In particular, investors should favor municipal bonds over investment grade corporate bonds with equivalent credit rating and duration. Economy: December’s employment report showed the first monthly contraction in nonfarm payrolls since April. However, this negative headline reflects the transitory impact of the latest COVID wave. It does not signal renewed weakness in the pace of economic recovery. Feature A Politically Driven Bond Rout In a Special Report last October, we argued that the bond market was vulnerable in a scenario where the November 3rd election resulted in the Democratic party winning the House, Senate and White House.1 It took some time, but after Democrats won both of Georgia’s Senate seats in last week’s special election, we are finally seeing the impact on the bond market. Nominal Treasury Yields First, the 10-year nominal Treasury yield moved above 1% for the first time since March. It currently sits at 1.13% (Chart 1). Meanwhile, the front-end of the Treasury curve held steady as the Fed continued to signal that liftoff is unlikely to occur within the next two years. The result has been a persistent steepening of the nominal curve (Chart 1, bottom panel). The 10-year nominal Treasury yield moved above 1% for the first time since March. We are positioned for a bear-steepening of the nominal Treasury curve, but the speed of this most recent move raises the question of how much further the bond sell-off can run. As we wrote in our year-end Special Report, we see yields continuing to rise until the 5-year/5-year forward Treasury yield reaches levels consistent with survey estimates of the long-run equilibrium fed funds rate (Chart 2).2 This would be in line with where yields peaked during the prior two global growth recoveries (2013/14 and 2017/18). At present, survey responses put our target for the 5-year/5-year forward Treasury yield at roughly 2% to 2.25%, still 18 to 43 bps above current levels. Chart 1Nominal Curve Bear-Steepening
Nominal Curve Bear-Steepening
Nominal Curve Bear-Steepening
Chart 2How Much Upside For Yields?
How Much Upside For Yields?
How Much Upside For Yields?
The prospect of greater fiscal stimulus under a Democratic government doesn’t necessarily translate into a higher ceiling for Treasury yields, but it does increase the speed with which yields will reach our target. All in all, we remain positioned for a bear-steepening of the nominal Treasury curve but will re-consider this stance if the 5-year/5-year forward yield reaches a range of 2% to 2.25%. Inflation Compensation Chart 3Stay Overweight TIPS For Now
Stay Overweight TIPS For Now
Stay Overweight TIPS For Now
The recent 20 bps jump in the 10-year nominal Treasury yield was driven by a 15 bps increase in the 10-year TIPS yield and a 5 bps increase in the 10-year TIPS breakeven inflation rate. Notably, the 10-year and 5-year/5-year forward TIPS breakeven inflation rates have both pushed above 2% and are sitting at 2.08% and 2.06%, respectively. While these long-maturity TIPS breakevens have recovered nicely, the Fed won’t be tempted to adopt a more hawkish policy stance until they reach a range of 2.3 – 2.5 percent, a range that has been consistent with “well-anchored” inflation expectations in the past (Chart 3).. While TIPS breakeven inflation rates aren’t yet high enough to worry the Fed, they are starting to look elevated compared to actual inflation. At 2.08%, the 10-year TIPS breakeven inflation rate is 27 bps above the fair value reading from our Adaptive Expectations Model (Chart 3, panel 3).3 Given this expensive valuation, we are currently looking for an opportunity to tactically reduce our allocation to TIPS. We expect that opportunity will come when the 12-month core and trimmed mean inflation rates re-converge (Chart 3, bottom panel). The low level of core CPI inflation relative to the trimmed mean suggests that inflation has near-term upside as some downtrodden sectors that are excluded from the trimmed mean recover from the pandemic. But inflation will moderate once that “snapback phase” is over, and we should get an opportunity to reduce our TIPS allocation.4 Along with an overweight allocation to TIPS versus nominal Treasuries, we also recommend owning inflation curve flatteners. The inflation curve tends to flatten when the cost of inflation protection rises, and this has indeed been the case during the past few weeks (Chart 4). It will make sense to exit this flattener when we tactically reduce our TIPS allocation, but this will only be a temporary move. In the long run, the inflation curve will eventually invert and then remain in negative territory for an extended period. This is the result of the Fed’s plan to engineer an overshoot of its 2% inflation target. If the Fed is successful, it means that it will be attacking its inflation target from above for the first time since the 1980s. In such an environment, it makes sense for the inflation curve to be inverted. Chart 4Inflation Curve Flattening
Inflation Curve Flattening
Inflation Curve Flattening
Real Yield Curve Chart 5Real Curve Steepening
Real Curve Steepening
Real Curve Steepening
Our final rates curve recommendation is a real yield curve steepener. This position has also performed well during the recent bond rout, as a 14 bps increase in the 10-year real yield occurred alongside a 13 bps drop in the 2-year real yield (Chart 5). As with our other rates positions, we are inclined to stay the course. A 2/10 real yield curve steepener can be thought of as the combination of a 2/10 nominal curve steepener and a 2/10 inflation curve flattener. During the recent bond sell-off, the 2/10 real curve has steepened by 27 bps, split between 17 bps of nominal curve steepening and 10 bps of inflation curve flattening. We will likely maintain our real yield curve steepener as a core portfolio position even if we eventually close our inflation curve flattener. Gradual progress toward fed funds liftoff and the resulting steepening of the nominal curve should be sufficient to steepen the real yield curve, even if inflation takes a pause. Corporate Credit Chart 6Move Down In Quality
Move Down In Quality
Move Down In Quality
Corporate spreads have reacted well to the news of a Democratic sweep, even though it means that a corporate tax hike is coming in 2021. All else equal, the one-time hit to profits from a tax hike is negative for corporate balance sheets, but this is a minor consideration when the macro back-drop remains so positive for spread product. The combination of above-trend economic growth and highly accommodative monetary policy will encourage investors to keep adding credit risk, and the average investment grade and high-yield index spreads have still not quite recovered to their pre-COVID tights (Chart 6). We continue to view the Ba credit tier as the most attractive from a risk/reward perspective, as the incremental spread pick-up in Ba compared to Baa is elevated compared to what we’ve seen in recent years (Chart 6, panel 3). Bottom Line: The Democratic sweep of the election has caused the uptrend in bond yields to accelerate and has benefited our recommended rates positions (below-benchmark duration, nominal and real curve steepeners, inflation curve flatteners). We aren’t yet ready to exit any of these positions, and our medium-term target of 2% - 2.25% for the 5-year/5-year forward nominal Treasury yield remains unchanged. Fiscal Policy In 2021 Chart 7Organic Household Income Has Recovered
Organic Household Income Has Recovered
Organic Household Income Has Recovered
Our US Political Strategy service debuted last week with a report that considers the outlook for fiscal policy in 2021 given that Democrats now have control of the House, Senate and White House.5 In short, the Democrats now have complete control of the government but their majorities in the House and Senate are thin. This means that the most radical parts of the Democratic agenda, like the Green New Deal, will be hard to pass. However, the Democrats will be able to deliver two reconciliation bills in 2021. The first bill could come soon and will likely focus on additional COVID relief and social support, such as $2000 checks to individuals instead of $600 ones. After that, the Democrats will focus on expanding and entrenching the Affordable Care Act (Obamacare). They will partially repeal the Trump tax cuts to help finance these priorities. On the issue of COVID relief, we are no longer concerned about the US economy receiving enough stimulus to avoid a double-dip recession. We had previously estimated that a further $600 billion to $1 trillion of income support for households would be required to support consumer spending at reasonable levels.6 This estimate now looks too high because non-CARES act household income has recovered much more quickly than we had anticipated. Non-CARES act household income is already back to pre-COVID levels (Chart 7). In our prior research, we assumed this wouldn’t happen until July 2021. In any event, another round of $2000 checks will provide more than enough income support to sustain a recovery in consumer spending. A Democratic sweep suggests big fiscal thrust in 2021 and less contraction in 2022. More generally, our US Political Strategy team has estimated the medium-term path for the US deficit under a “Democratic Status Quo” scenario that assumes another round of $2000 checks and that the remaining $2.5 trillion of the proposed HEROES Act will be enacted. It also considers a “Democratic High” scenario that adds Joe Biden’s $5.6 trillion policy agenda on top of the Democratic Status Quo (Chart 8). Biden will not achieve all of his agenda, so the reality will lie somewhere between the Democratic Status Quo and Democratic High scenarios. In either case, we will see considerably more fiscal thrust compared to the Republican Status Quo and Baseline scenarios. Chart 8Democratic Sweep Suggests Big Fiscal Thrust In FY2021 And Less Contraction FY2022
A Blue Sweep After All
A Blue Sweep After All
Municipal Bonds The prospect of federal government aid for challenged state & local governments is a crucial issue for municipal bond investors. Fortunately, the Democratic party’s HEROES act contains more than $1 trillion of aid to state & local governments and this will likely form the basis of the next COVID relief package. On top of that, further support for household incomes will also help support state & local tax revenues that are already recovering (Chart 9). Chart 9State & Local Austerity Will Continue
State & Local Austerity Will Continue
State & Local Austerity Will Continue
That said, we are likely still in for a considerable period of state & local austerity given the large budget gaps that have opened during the past nine months. However, the expectation of help from the federal government makes us even more confident that state & local governments will muddle through without a spate of muni downgrades or defaults. We maintain our “maximum overweight” recommendation for tax-exempt municipal bonds, though valuation is turning more expensive by the day. Muni yield spreads versus Treasuries are contracting, particularly at the long end of the curve (Chart 10A) and valuations appear more expensive if we look at yield ratios instead of spreads (Chart 10B). In both cases, value looks better at the front end of the curve than at the long end. Chart 10AMuni / Treasury Yield Ratios
Muni / Treasury Yield Ratios
Muni / Treasury Yield Ratios
Chart 10BMuni / Treasury Yield Ratios
Muni / Treasury Yield Ratios
Muni / Treasury Yield Ratios
Bottom Line: The new Democratic government will deliver more than enough income support to sustain the recovery in consumer spending. Aid for state & local governments is also forthcoming and it will help sustain municipal bond outperformance versus both Treasuries and investment grade corporates. Though valuation has become more expensive, we continue to recommend a maximum overweight allocation to municipal bonds. In particular, investors should favor municipal bonds over investment grade corporate bonds with equivalent credit rating and duration. December Payrolls Only A Temporary Setback At first blush, last week’s December employment report looks disastrous. Nonfarm payrolls fell by 140 thousand, the first monthly contraction since April. The contraction looks especially worrying when you consider that payrolls remain almost 10 million below pre-COVID levels and should be rising quickly at this stage of the economic recovery (Chart 11). Chart 11Payrolls Contracted In December
Payrolls Contracted In December
Payrolls Contracted In December
Chart 12Permanent Unemployment Fell In December
Permanent Unemployment Fell In December
Permanent Unemployment Fell In December
The grim headline numbers, however, severely overstate the magnitude of the problem. Rather than implying underlying economic weakness, the drop in payrolls reflects the transitory impact of the pandemic’s latest violent wave. December’s job losses came from the Leisure and Hospitality sector (-498k), the sector most impacted by the virus. Job gains remained solid elsewhere in the economy (+358k). The unemployment rate held flat at 6.7% in December, but encouragingly, this stable number masks both an increase in the number of temporarily unemployed (or furloughed) workers and a drop in the number of permanently unemployed workers (Chart 12). Those furloughed workers will return to work once the virus is better contained. Meanwhile, the drop in the number of permanently unemployed suggests that the economic recovery is taking hold. It will only gain momentum as the COVID vaccine is rolled out and additional fiscal stimulus is delivered in 2021. Ryan Swift US Bond Strategist rswift@bcaresearch.com Footnotes 1 Please see US Bond Strategy / Global Fixed Income Strategy Special Report, “Beware The Bond-Bearish Blue Sweep”, dated October 20, 2020, available at usbs.bcaresearch.com 2 Please see US Bond Strategy Special Report, “2021 Key Views: US Fixed Income”, dated December 15, 2020, available at usbs.bcaresearch.com 3 For more details on our model please see US Bond Strategy Weekly Report, “How Are Inflation Expectations Adapting?”, dated February 11, 2020, available at usbs.bcaresearch.com 4 For more details on inflation’s “snapback phase” please see US Bond Strategy Weekly Report, “More Stimulus Needed”, dated September 15, 2020, available at usbs.bcaresearch.com 5 Please see US Political Strategy Weekly Report, “Buy Reflation Plays On Georgia’s Blue Sweep”, dated January 6, 2021, available at usps.bcaresearch.com 6 Please see US Bond Strategy Weekly Report, “More Stimulus Needed”, dated September 15, 2020, available at usbs.bcaresearch.com Fixed Income Sector Performance Recommended Portfolio Specification