Fixed Income
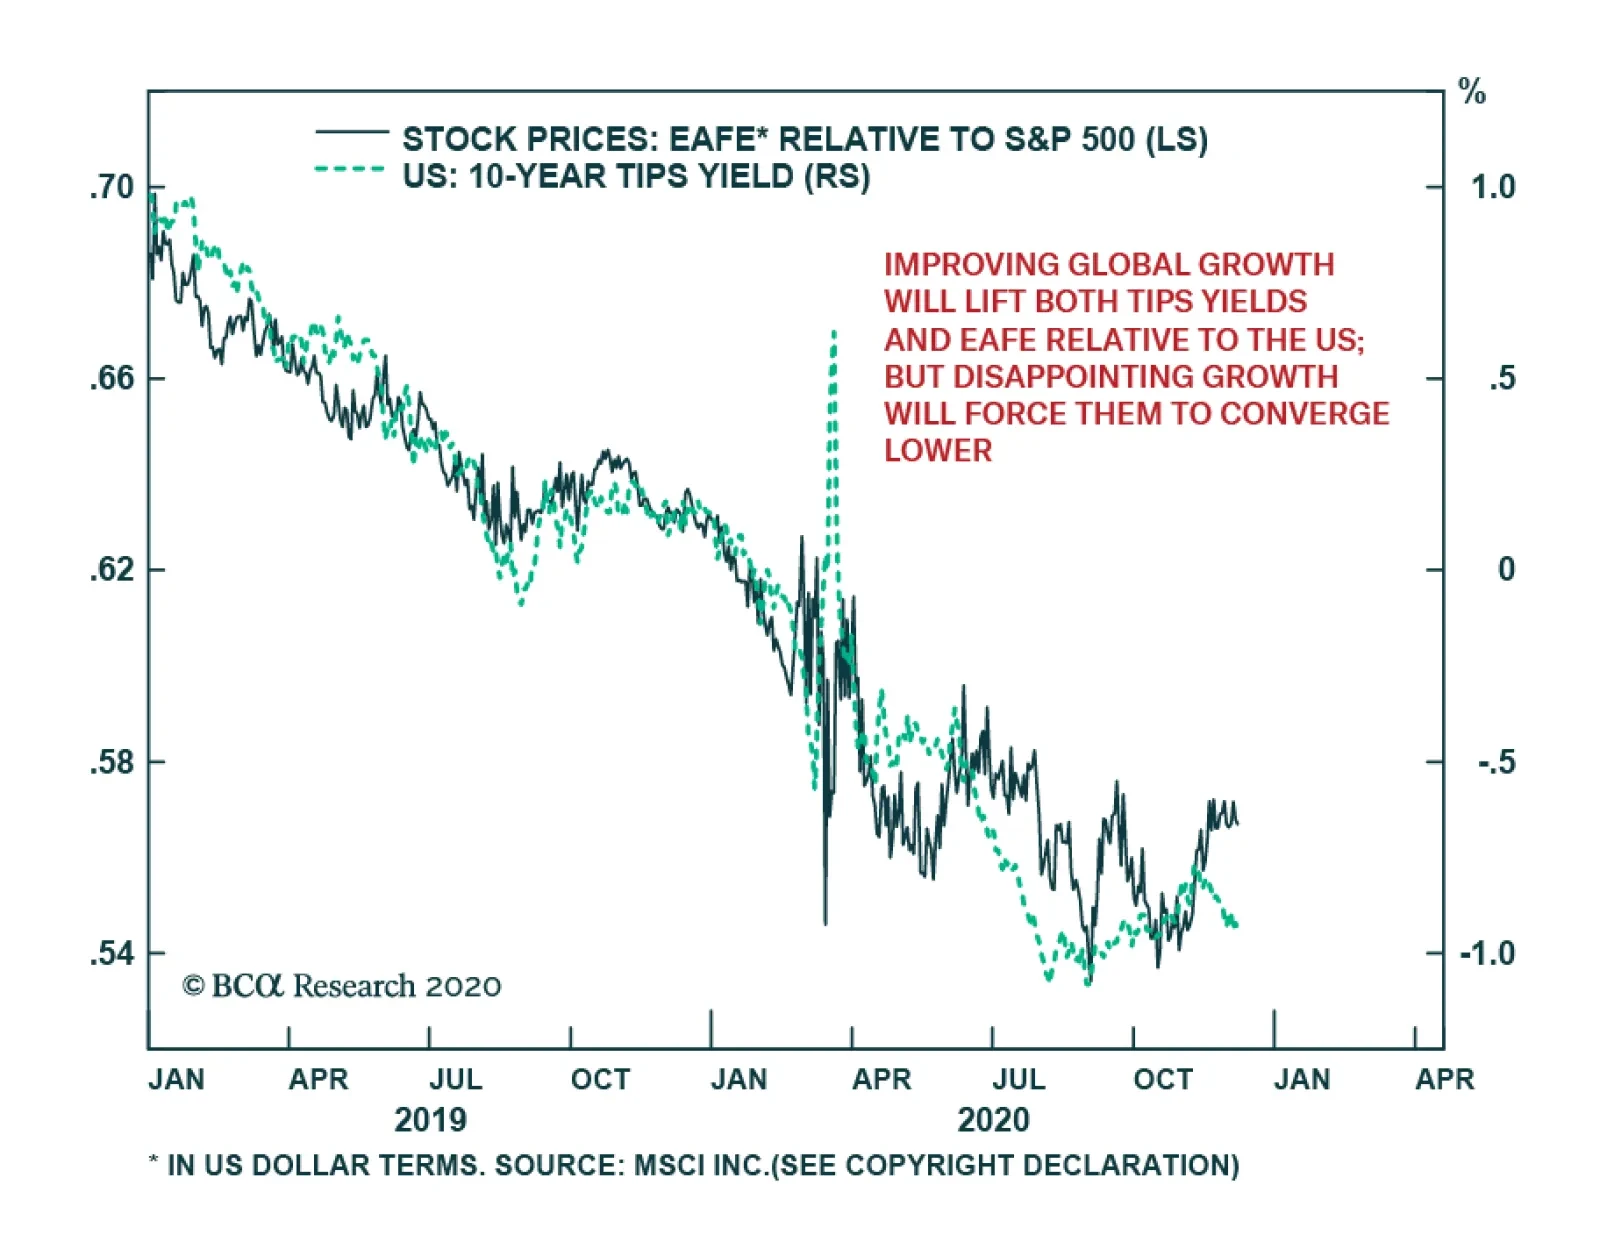
Over the past two years, the performance of EAFE equities relative to the US has tightly followed real bond yields. This is because both the relative performance of foreign equities and real interest rates are extremely sensitive to the global economic…

Highlights Chart 1Bond Yields & The CRB/Gold Ratio
Bond Yields & The CRB/Gold Ratio
Bond Yields & The CRB/Gold Ratio
In our last report of November, we noted that the rising COVID case count was likely to lead to a challenging few months for the US economy, but we also questioned whether financial markets would pay attention or whether they would stay focused on the vaccine roll-out and eventual economic recovery. We now have our answer. November’s employment report was the worst since April, but the Treasury curve has bear-steepened, credit spreads have come in and TIPS have outperformed nominals. What’s more, the jump in the CRB Raw Industrials / Gold ratio suggests that the 10-year Treasury yield has even more near-term upside (Chart 1). With a vaccine on the horizon and Congress closing in on a fiscal relief package, investors should stay positioned for the reflation trade on a 6-12 month horizon: below-benchmark portfolio duration, nominal and real yield curve steepeners, inflation curve flatteners, overweight TIPS versus nominals and overweight corporate bonds rated Ba and higher. Feature Investment Grade: Overweight Investment grade corporate bonds outperformed the duration-equivalent Treasury index by 233 basis points in November, bringing year-to-date excess returns up to -74 bps. The strong rally in corporate bonds since March has culminated in extremely tight valuations for investment grade corporates. The 12-month breakeven spread for the Bloomberg Barclays Corporate Index (adjusted to keep the average credit rating constant) has only been tighter 4% of the time since 1995 (Chart 2). The same figure for the Baa-rated credit tier is 5%. We retain a positive outlook on corporate credit despite these stretched valuations. In our view, an environment where the economy is recovering and where the Fed will be very cautious about scaling back accommodation is the exact sort of environment where we should expect a lot of enthusiasm for spread product and, as a result, extremely tight spreads. We will not be surprised if our 12-month breakeven spread percentile rank valuation measure reaches its all-time expensive level within the next couple of months. While the macro environment makes it difficult to turn negative on investment grade corporates, we acknowledge that other sectors may offer better opportunities, particularly in the higher credit tiers. Specifically, we find better value in tax-exempt municipal bonds than in corporates and recommend that investors favor the former over the latter. At the sector level, we continue to recommend overweight allocations to subordinate Bank bonds, Healthcare and Energy bonds. We also advise underweight allocations to Technology and Pharmaceutical bonds. Chart 2Investment Grade Market Overview
Investment Grade Market Overview
Investment Grade Market Overview
Table 3ACorporate Sector Relative Valuation And Recommended Allocation*
Stay Positioned For Reflation
Stay Positioned For Reflation
Table 3BCorporate Sector Risk Vs. Reward*
Stay Positioned For Reflation
Stay Positioned For Reflation
High-Yield: Neutral High-Yield outperformed the duration-equivalent Treasury index by 382 basis points in November, bringing year-to-date excess returns up to -5 bps. After last month’s strong outperformance, Ba-rated junk bonds are now beating duration-equivalent Treasuries by 267 bps, year-to-date. The B and Caa credit tiers are lagging by 179 bps and 548 bps, respectively. We still view Ba-rated junk bonds as the sweet spot within the corporate credit space. The sector is relatively insulated from default risk and yet still offers a sizeable spread pick-up over investment grade corporates (Chart 3). We remain underweight B-rated and lower junk bonds for now as those securities are pricing-in a relatively optimistic outlook for the default rate. But, an imminent vaccine roll-out makes that outlook appear more realistic and we could soon upgrade the lower-rated junk credit tiers when we think the value is exhausted in the Ba-rated and higher securities. Looking at value for the junk index as a whole, we see that the index is pricing-in a default rate of 3% for the next 12 months, significantly below the 8.3% that was observed during the most recent 12-month period (panel 3). However, only four corporate issuers defaulted in October down from a monthly peak of 22 in July. Job cut announcements, an excellent indicator of the default rate, are also falling rapidly (bottom panel). At the sector level, we advise overweight allocations to high-yield Technology and Energy bonds. We are underweight the Healthcare and Pharmaceutical sectors. Chart 3High-Yield Market Overview
High-Yield Market Overview
High-Yield Market Overview
MBS: Underweight Mortgage-Backed Securities underperformed the duration-equivalent Treasury index by one basis point in November, dragging year-to-date excess returns down to -39 bps. The conventional 30-year MBS index option-adjusted spread (OAS) tightened 1 bp on the month, and it currently sits at 64 bps (Chart 4). This is significantly higher than the 59 bps offered by Aa-rated corporate bonds, the 53 bps offered by Agency CMBS and the 25 bps offered by Aaa-rated consumer ABS. Despite the relatively attractive OAS, we continue to view the elevated primary mortgage spread as a risk for MBS investors. It suggests that mortgage rates need not rise alongside Treasury yields in the near-term, meaning that mortgage refinancings can continue at their current rapid pace (panel 3). All else equal, this elevated refinancing activity will pressure MBS spreads wider. The recent spike in the mortgage delinquency rate does not pose a near-term risk to spreads as it is being driven by households that have been granted forbearance from the federal government (panel 4). The risk for MBS holders only comes into play if many households are unable to resume their regular mortgage payments when the forbearance period expires early next year. But even in that case, further government intervention to either support household incomes or extend the forbearance period would mitigate the risk. Chart 4MBS Market Overview
MBS Market Overview
MBS Market Overview
Government-Related: Underweight The Government-Related index outperformed the duration-equivalent Treasury index by 64 basis points in November, bringing year-to-date excess returns up to -222 bps. Sovereign debt outperformed duration-equivalent Treasuries by 157 bps on the month, bringing year-to-date excess returns up to -269 bps. Foreign Agencies outperformed the Treasury benchmark by 46 bps in November, bringing year-to-date excess returns up to -647 bps. Local Authority debt outperformed Treasuries by 139 bps in November, bringing year-to-date excess returns up to -228 bps. Domestic Agency bonds outperformed by 10 bps, bringing year-to-date excess returns up to -23 bps. Supranationals outperformed by 9 bps, bringing year-to-date excess returns up to +2 bps. US dollar weakness is usually a boon for Emerging Market (EM) Sovereign and Foreign Agency returns. However, this year’s dollar weakness has occurred mostly relative to other Developed Market currencies (Chart 5). Value has improved somewhat for EM Sovereigns during the past few weeks, but the index continues to offer less spread than the Baa-rated US Credit index (panel 4). At the country level, Turkey, Colombia, Mexico, Russia and South Africa are the only countries that offer a spread pick-up relative to duration and quality-matched US corporates. Of those, only Mexico looks attractive on a risk/reward basis. Chart 5Government-Related Market Overview
Government-Related Market Overview
Government-Related Market Overview
Municipal Bonds: Overweight Municipal bonds outperformed the duration-equivalent Treasury index by 130 basis points in November, bringing year-to-date excess returns up to -340 bps (before adjusting for the tax advantage). Municipal bond spreads tightened sharply relative to both Treasuries and Corporates in November, but they remain exceptionally attractive relative to history (Chart 6). In fact, as we showed in a recent report, the Bloomberg Barclays Revenue Bond index offers a greater yield than the quality-matched Credit index across the entire maturity spectrum (before adjusting for the tax advantage).1 This is also true for the Bloomberg Barclays General Obligation (GO) index beyond the 12-year maturity point. Eight-to-twelve-year maturity GO bonds trade only 1 basis point through the Credit index, implying a breakeven effective tax rate of 4%. Six-to-eight-year maturities trade 11 bps through the Credit index, implying a breakeven effective tax rate of 16%. Extraordinary valuation is the main reason for our recommendation to overweight municipal bonds. The severe ongoing state & local government credit crunch is a concern, but it is a risk we are willing to take. It now looks possible that a relief package containing some federal funds for state & local governments will be passed before the end of the year. This would alleviate a lot of the concern. But even in the absence of federal assistance, the combination of austerity measures (bottom panel) and all-time high State Rainy Day Fund balances should help stave off a wave of municipal downgrades. Chart 6Municipal Market Overview
Municipal Market Overview
Municipal Market Overview
Treasury Curve: Buy 5-Year Bullet Versus 2/10 Barbell The Treasury curve bull-flattened in November, but then bear-steepened sharply during the first week of December. All told, the 2/10 Treasury slope is currently 81 bps, 7 bps steeper than at the end of October. The 5/30 Treasury slope is 131 bps, 4 bps steeper than at the end of October. Our expectation is that continued economic recovery will cause investors to price-in eventual monetary tightening at the long-end of the Treasury curve. With the Fed maintaining a firm grip on the front end, this will lead to Treasury curve bear steepening. A timely vaccine roll-out and/or further fiscal stimulus will speed this process up. We recommend positioning for a steeper curve by owning the 5-year Treasury note and shorting a duration-matched barbell consisting of the 2-year note and 10-year notes. This position is designed to profit from 2/10 curve steepening. Valuation is a concern with our recommended steepener, as the 5-year yield is below the yield on the duration-matched 2/10 barbell (Chart 7). However, the 5-year looked much more expensive during the last zero-lower-bound period between 2010 and 2013 (bottom 2 panels). We anticipate a return to similar levels. Chart 7Treasury Yield Curve Overview
Treasury Yield Curve Overview
Treasury Yield Curve Overview
TIPS: Overweight TIPS outperformed the duration-equivalent nominal Treasury index by 70 basis points in November, bringing year-to-date excess returns up to -23 bps. The 10-year and 5-year/5-year forward TIPS breakeven inflation rates rose 8 bps and 5 bps on the month. They currently sit at 1.91% and 1.96%, respectively. Core CPI was flat in October and the year-over-year rate dropped from 1.73% to 1.63%. The 12-month trimmed mean CPI fell even more – from 2.37% to 2.22% – so the gap between core and trimmed mean inflation continued to narrow (Chart 8). We expect further narrowing in the months ahead, and therefore expect core CPI to come in relatively hot. For this reason, we recommend maintaining an overweight allocation to TIPS versus nominal Treasuries for the time being, even though the 10-year TIPS breakeven rate is now somewhat expensive according to our Adaptive Expectations Model (panel 2).2 Inflation pressures may moderate once core and trimmed mean inflation measures converge, and this could give us an opportunity to tactically reduce TIPS exposure sometime next year. We also recommend holding real yield curve steepeners and inflation curve flatteners. With the Fed now officially targeting an overshoot of its 2% inflation goal, we would expect the cost of 2-year inflation protection to rise above the cost of 10-year inflation protection (panel 4). With the Fed also exerting more control over short-dated nominal yields than over long-term ones, we expect that short-maturity real yields will come under downward pressure relative to the long end (bottom panel). Chart 8TIPS Market Overview
TIPS Market Overview
TIPS Market Overview
ABS: Overweight Asset-Backed Securities outperformed the duration-equivalent Treasury index by 11 basis points in November, bringing year-to-date excess returns up to +82 bps. Aaa-rated ABS outperformed the Treasury benchmark by 10 bps on the month, bringing year-to-date excess returns up to +68 bps. Non-Aaa ABS outperformed by 17 bps, bringing year-to-date excess returns up to +174 bps (Chart 9). On paper, the Treasury department’s decision to let the Term Asset-Backed Loan Facility (TALF) expire at the end of the year is quite negative for ABS. However, as we explained in a recent report, we don’t expect a material impact on spreads.3 For one thing, Aaa ABS spreads are already well below the borrowing cost offered by TALF. But more importantly, consumer credit quality remains quite robust. As we first explained back in June, the stimulus received from the CARES act led to a significant increase in disposable income and a jump in the savings rate (panel 4).4 Faced with an income boost and few spending opportunities, many households took the opportunity to pay down consumer debt. Granted, further income support from Congress is needed now that the CARES act’s enhanced unemployment benefits have expired. But given the substantial boost to savings that has already occurred, we are confident that more stimulus will arrive in time to prevent a wave of consumer bankruptcies. Chart 9ABS Market Overview
ABS Market Overview
ABS Market Overview
Non-Agency CMBS: Neutral Chart 10CMBS Market Overview
CMBS Market Overview
CMBS Market Overview
Non-Agency Commercial Mortgage-Backed Securities outperformed the duration-equivalent Treasury index by 85 basis points in November, bringing year-to-date excess returns up to -168 bps. Aaa Non-Agency CMBS outperformed Treasuries by 71 bps on the month, bringing year-to-date excess returns up to -2 bps. Non-Aaa Non-Agency CMBS outperformed by 127 bps, bringing year-to-date excess returns up to -620 bps (Chart 10). We continue to recommend an overweight allocation to Aaa-rated Non-Agency CMBS and an underweight allocation to non-Aaa CMBS. Even with the imminent expiry of TALF, Aaa CMBS spreads are already well below the cost of borrowing through TALF and thus will not be negatively impacted.5 Meanwhile, the structurally challenging environment for commercial real estate could lead to problems for lower-rated CMBS (panels 3 & 4). Agency CMBS: Overweight Agency CMBS outperformed the duration-equivalent Treasury index by 38 basis points in November, bringing year-to-date excess returns up to +55 bps. The average index spread tightened 6 bps on the month. It currently sits at 53 bps, above typical historical levels (bottom panel). At its September meeting, the Fed decided to slow its pace of Agency CMBS purchases. It is no longer looking to increase its Agency CMBS holdings, but rather, it is only purchasing what is “needed to sustain smooth market functioning”. This is nonetheless a Fed back-stop of the market, and it does not change our overweight recommendation. Appendix A: Buy What The Fed Is Buying The Fed rolled out a number of aggressive lending facilities on March 23. These facilities focused on different specific sectors of the US bond market. The fact that the Fed has decided to support some parts of the market and not others has caused some traditional bond market correlations to break down. It has also led us to adopt of a strategy of “Buy What The Fed Is Buying”. That is, we favor those sectors that offer attractive spreads and that benefit from Fed support. The below Table tracks the performance of different bond sectors since the March 23 announcement. We will use this to monitor bond market correlations and evaluate our strategy’s success. Table Performance Since March 23 Announcement Of Emergency Fed Facilities
Stay Positioned For Reflation
Stay Positioned For Reflation
Appendix B: Butterfly Strategy Valuations The following tables present the current read-outs from our butterfly spread models. We use these models to identify opportunities to take duration-neutral positions across the Treasury curve. The following two Special Reports explain the models in more detail: US Bond Strategy Special Report, “Bullets, Barbells And Butterflies”, dated July 25, 2017, available at usbs.bcaresearch.com US Bond Strategy Special Report, “More Bullets, Barbells And Butterflies”, dated May 15, 2018, available at usbs.bcaresearch.com Table 4 shows the raw residuals from each model. A positive value indicates that the bullet is cheap relative to the duration-matched barbell. A negative value indicates that the barbell is cheap relative to the bullet. Table 4Butterfly Strategy Valuation: Raw Residuals In Basis Points (As Of December 4TH, 2020)
Stay Positioned For Reflation
Stay Positioned For Reflation
Table 5 scales the raw residuals in Table 4 by their historical means and standard deviations. This facilitates comparison between the different butterfly spreads. Table 5Butterfly Strategy Valuation: Standardized Residuals (As Of December 4TH, 2020)
Stay Positioned For Reflation
Stay Positioned For Reflation
Table 6 flips the models on their heads. It shows the change in the slope between the two barbell maturities that must be realized during the next six months to make returns between the bullet and barbell equal. For example, a reading of 70 bps in the 5 over 2/10 cell means that we would only expect the 5-year to outperform the 2/10 if the 2/10 slope steepens by more than 70 bps during the next six months. Otherwise, we would expect the 2/10 barbell to outperform the 5-year bullet. Table 6Discounted Slope Change During Next 6 Months (BPs)
Stay Positioned For Reflation
Stay Positioned For Reflation
Appendix C: Excess Return Bond Map The Excess Return Bond Map is used to assess the relative risk/reward trade-off between different sectors of the US bond market. It is a purely computational exercise and does not impose any macroeconomic view. The Map’s vertical axis shows 12-month expected excess returns. These are proxied by each sector’s option-adjusted spread. Sectors plotting further toward the top of the Map have higher expected returns and vice-versa. Chart 11Excess Return Bond Map (As Of December 4TH, 2020)
Stay Positioned For Reflation
Stay Positioned For Reflation
Our novel risk measure called the “Risk Of Losing 100 bps” is shown on the Map’s horizontal axis. To calculate it, we first compute the spread widening required on a 12-month horizon for each sector to lose 100 bps or more relative to a duration-matched position in Treasury securities. Then, we divide that amount of spread widening by each sector’s historical spread volatility. The end result is the number of standard deviations of 12-month spread widening required for each sector to lose 100 bps or more versus a position in Treasuries. Lower risk sectors plot further to the right of the Map, and higher risk sectors plot further to the left. Ryan Swift US Bond Strategist rswift@bcaresearch.com Footnotes 1 Please see US Bond Strategy Weekly Report, “Political Risk Will Dominate In A Pivotal Month For The Bond Market”, dated October 13, 2020, available at usbs.bcaresearch.com 2 For more details on our model please see US Bond Strategy Weekly Report, “How Are Inflation Expectations Adapting?”, dated February 11, 2020, available at usbs.bcaresearch.com 3 Please see US Bond Strategy Weekly Report, “Preparing For A Dark Winter … But Do Markets Care?”, dated November 24, 2020, available at usbs.bcaresearch.com 4 Please see US Bond Strategy Weekly Report, “No Holding Back”, dated June 16, 2020, available at usbs.bcaresearch.com 5 Please see US Bond Strategy Weekly Report, “Preparing For A Dark Winter … But Do Markets Care?”, dated November 24, 2020, available at usbs.bcaresearch.com Fixed Income Sector Performance Recommended Portfolio Specification Corporate Sector Relative Valuation And Recommended Allocation
Highlights Every year we review our best and worst calls – both in terms of geopolitics and markets. This year our geopolitical forecasting and strategic market recommendations performed well, given the COVID-19 shock, but our tactical trades often went awry. We correctly forecast the presidency, Senate, Democratic nomination, and impeachment outcome. We anticipated “stimulus hiccups” but expected them to be resolved by November 3. The Georgia runoff on January 5 presents a 30% risk to our Senate prediction. In the main, we were right on Chinese politics, EU politics, US-Iran tensions, and Russian politics. US-China tensions kept rising, as expected, but the market ignored it. We missed the Saudi-Russia cartel break-up in Q1. The jury is still out on Brexit. Strategically, we got the big market moves right, but we were too risk-averse during the summer and after the election. Stay long cyber-security stocks in general, but close the pair trade versus Big Tech. Close the 10-year Treasury hedge. Feature Chart 1The Black Swan
The Black Swan
The Black Swan
The COVID-19 pandemic took investors by surprise, defined the year 2020, and caused the shortest bear market in history, lasting 33 days (Chart 1). On the whole this year’s crisis illustrates how geopolitical analysis is not primarily concerned with “black swan” events, which are inherently unpredictable. Rather the wholly unexpected pandemic reinforced several of our pre-existing geopolitical themes and trends: de-globalization, American sociopolitical instability, European integration, and US-China conflict. This year our geopolitical forecasting and strategic market recommendations performed well, given the COVID-19 shock, but our tactical trades often went awry. Whether these and other trends will continue in 2021 will be the subject of our strategic outlook due next week. This week we offer our annual report card, which reviews our best and worst calls for the year with a desire to hold ourselves accountable to clients, learn investment lessons from mistakes, and hone our geopolitical method of analysis. Successful Strategy, Debatable Tactics Overall our performance this year was good. Specifically, our political forecasting was on target and our investment recommendations got the big moves correct. But our risk-averse tactical trades were less successful. In last year’s annual outlook, “2020 Key Views: The Anarchic Society,” our main investment recommendation was long gold – based on sky-high geopolitical risk and a shift toward reflationary policy by the Federal Reserve, China, and the European Union (Chart 2). We maintain this trade today, despite its losing some altitude recently, as we expect to see low real rates, reflationary global policy, and rising inflation expectations. Geopolitical risk will also remain elevated despite dropping off from recent peaks, and not only during President Trump’s “lame duck” final days in office. We sounded the alarm for clients in our January 24 report, “Market Hurdles: From Sanders To Iran,” warning that global equities and risk appetite would suffer “in the very near term” due to conventional political risks as well as the new coronavirus, which we feared would explode as a result of Chinese New Year. In retrospect we were not bearish enough even in these reports. In our March 27 report, “No Depression,” we advised that the extraordinary monetary and fiscal response to the crisis would reflate the global economy and thus went long Brent crude oil. From this point onward we gradually added risk to our strategic portfolio, including by going long global equities relative to bonds in June (Chart 3). Chart 2Gold Paid Off When Black Swan Arose
Gold Paid Off When Black Swan Arose
Gold Paid Off When Black Swan Arose
Of course, despite getting these big moves right, we abandoned several of our strategic recommendations during the crisis and some of our tactical trades went awry throughout the year. Chart 3When Crisis Hits, Buy Risk Assets!
When Crisis Hits, Buy Risk Assets!
When Crisis Hits, Buy Risk Assets!
Our Worst Calls Of 2020 We chose a very bad time, last December, to bet heavily on global equity rotation from growth to value and away from tech sector leadership. US equities and tech stocks surged ahead of global equities on the back of the pandemic. Our long energy / short tech trade proved disastrous. Only now, with a vaccine on the horizon, are these recommendations coming to fruition. On the other hand, we should have remained committed to our long EUR-USD position rather than cutting it short when the crisis erupted (Chart 4). Global stimulus and the Fed’s sharp reduction in interest rates and gigantic infusion of US dollar liquidity ensured that the dollar would plummet. Strategically, we got the big market moves right, but we were too risk-averse during the summer and after the election. In some cases our geopolitical forecast proved dead-on while our market recommendation faltered. One of biggest geopolitical forecasts, in September 2019, was that the US and China could well conclude a trade deal but that it would be extremely limited in scope and strategic tensions would continue to rise dangerously. This prediction has proved accurate, judging by US high-tech export controls and China’s suppression of Hong Kong this year. But we misjudged the market response, particularly after China contained the virus: the renminbi saw a tremendous rally this year while we remained short, suffering a 4.96% loss so far (Chart 5). Chart 4Stick With Your Guns...Even Amidst Crisis
Stick With Your Guns...Even Amidst Crisis
Stick With Your Guns...Even Amidst Crisis
Chart 5US-China Tensions Persisted, But The Market Didn't Care
US-China Tensions Persisted, But The Market Didn't Care
US-China Tensions Persisted, But The Market Didn't Care
Along these lines, President-elect Joe Biden’s statement that he will maintain President Trump’s tariffs is another confirmation of one of our most contrarian views over the past year.1 We would expect the People’s Bank to allow the yuan to slip both to deal with lingering deflationary pressures and to build up some poker chips for the coming negotiations with Biden. We also would expect the US dollar to witness a near-term tactical bounce. However, if we are wrong, our short CNY-USD trade will fall further and we will have to cut our losses. Chart 6You Can't Time The Market
You Can't Time The Market
You Can't Time The Market
Other mistakes occurred when solid economic and political views combined with bad market timing. Our long position in cyber-security stocks is well grounded – we remain invested – but once again we jumped the gun on the rotation away from Big Tech, which constituted the short end of two of our pair trades, now closed. Separately, we coupled our long gold bet with a long silver bet that came far too late into the rally – though we remain strategically optimistic on silver due to its industrial uses, which should revive in the post-pandemic context. Lamentably, we ran up against our stop-loss threshold on our structural position in US aerospace and defense stocks not long before the vaccine announcement would have begun the arduous process of recuperating losses (Chart 6). We have reinitiated the latter trade, albeit in global defense stocks rather than just American. The inverse also occurred, in which our political forecasting proved faulty but our market implications worked out quite well. One of our biggest political forecasting failures stemmed from an initial success. Beginning in May, we signaled that the US Congress would experience “stimulus hiccups” in trying to pass additional fiscal relief for the economy. This view proved prescient as negotiations fell through in July and a range of benefits expired. Real rates began to recuperate at this time. The problem is that we also predicted that the fiscal impasse was merely a hiccup, i.e. would be resolved prior to the election. It remains unresolved to this day. Fortunately, our market recommendation – to go long US municipal bonds relative to duration-matched treasuries – was rooted in the principle of “buy what the Fed is buying” and therefore continued to appreciate, along with our similarly justified position in investment grade bonds (Chart 7). Chart 7Stimulus Hiccup Occurred, But Was Not Resolved
Stimulus Hiccup Occurred, But Was Not Resolved
Stimulus Hiccup Occurred, But Was Not Resolved
Our biggest error of political forecasting was the collapse of OPEC 2.0 at the beginning of the year. We signaled to clients in January that Russia was growing internally unstable and that this would result in an external action that would prove market-negative. This was correct, but we failed to anticipate that the most important consequence would be a temporary Russian rejection of Saudi demands for oil production cuts. Still, we advised clients to stay the course, arguing that the Russians and Saudis were geopolitically constrained and would return to their cartel, which proved to be the case, thus hastening the restoration of balance to oil markets. This view supported our long spot oil recommendation in late March, though the idea that US producers might collaborate proved fanciful. Alternatively we suggested that clients go long oil relative to gold, which has performed well. Other mistakes stemmed from our tactical trades. Generally, we were insufficiently bullish both during the summer and after the US election. In both cases we overemphasized the absence of US fiscal stimulus as a risk to the rally. In reality the first stimulus was sufficient and the V-shaped recovery of the private economy reduced the need for additional support over the course of the year. Our long tactical positions in US treasuries, consumer staples, and JPY-EUR did not pan out. The takeaway going forward, given that the market is not pressuring politicians to act, is that the risk of another congressional fiscal failure prior to Christmas is underrated. Lastly, some minor emerging market trades went awry, such as our long positions in Thai and Malay equities and our shorting the South African rand. We wrongly predicted that Michelle Obama would be Joe Biden’s pick for vice president, when in fact that honor went to Senator Kamala Harris. Our Best Calls Of 2020 While we got the big market moves right in 2020, our best calls were political and geopolitical in nature: Joe Biden won the US election. He won through his ability to win back blue-collar workers and compete in the Sun Belt as well as the Rust Belt, which we outlined as a key geographic strength during his run in the Democratic primary election (Map 1). We downgraded Trump from 55% odds of re-election to 35% in March, when the lockdowns occurred, and we upgraded Trump only to 45% in October when he rallied. The thin margins in the swing states confirmed this higher-than-consensus probability of a Trump win. Map 1Joe Biden Won The Rust Belt And The Sun Belt
Geopolitical Report Card: 2020
Geopolitical Report Card: 2020
Republicans retained the Senate. Beginning in late September, we saw that President Trump was rallying and that this would increase the odds of a Republican Senate even if Trump himself fell short. On October 16 we signaled that the Senate was too close to call, and on October 30 we upgraded the GOP again and argued that a Democratic White House plus a Republican Senate was the most likely scenario (Chart 8). There is a lingering risk to this view: a double Democratic victory in the Georgia runoffs on January 5, 2021. But we put the odds of that at 30% at best. Chart 8Republicans Held The Senate (Pending Georgia Runoffs)
Geopolitical Report Card: 2020
Geopolitical Report Card: 2020
Chart 9Biden Won The Democratic Primary Nomination
Geopolitical Report Card: 2020
Geopolitical Report Card: 2020
Biden won the Democratic nomination, which we first highlighted in November 2018 and June 2019 and consistently thereafter, though we never underrated his challengers (Chart 9). Trump was acquitted of impeachment charges, which seems like ages ago. We said from the start that Democrats did not have the votes (Chart 10). China stimulated the economy massively and avoided massive domestic unrest. Investors doubted that Beijing would stimulate enough to lead to a global recovery, given the leadership’s preference to avoid systemic financial risk. We insisted that constraints would prevail over preferences and the stimulus would be gigantic. Our “China Play Index” skyrocketed, though it did not outperform global equities (Chart 11). We also argued that President Xi Jinping would not face significant domestic unrest after the crisis erupted, though we view domestic political risk as underrated for the coming years. Chart 10Impeachment Failed
Geopolitical Report Card: 2020
Geopolitical Report Card: 2020
Long Emerging markets and deep cyclicals recovered. The combination of Chinese stimulus and a US “return to normalcy” led us to go long emerging markets after the election. We articulated this trade by going long Trans-Pacific Partnership countries, on the expectation that Washington will remain hawkish toward China over trade (Chart 12). We also went long deep cyclicals and US infrastructure plays on the basis of Chinese stimulus and the Biden-Trump common denominator on building projects (Chart 13). Chart 11China Stimulated Massively
China Stimulated Massively
China Stimulated Massively
Chart 12Long Trans-Pacific Partnership Worked As EM Play
Long Trans-Pacific Partnership Worked As EM Play
Long Trans-Pacific Partnership Worked As EM Play
The Taiwan Strait was a bigger geopolitical risk than the Korean peninsula, which markets are at last recognizing (Chart 14). Unfortunately for investors Taiwan remains a serious geopolitical risk regardless of Trump’s exit. Hong Kong attracted investors’ attention more than Taiwan in 2020, whereas we have treated Hong Kong as a red herring. Chart 13Long Infrastructure And Cyclicals Paid Off
Long Infrastructure And Cyclicals Paid Off
Long Infrastructure And Cyclicals Paid Off
Chart 14Hong Kong Was A Red Herring, Korea Beat Taiwan
Hong Kong Was A Red Herring, Korea Beat Taiwan
Hong Kong Was A Red Herring, Korea Beat Taiwan
Brexit has been a red herring throughout 2020, as expected, though an end-of-year failure to agree to a UK-EU trade deal would upend our predictions (Chart 15). Chart 15Brexit Was A Sideshow
Brexit Was A Sideshow
Brexit Was A Sideshow
Germany’s shift to more dovish fiscal policy strengthened European solidarity, keeping peripheral bond yields and “break-up risk” contained (Chart 16). In August 2019 we argued that Germany was easing fiscal policy but would not surge spending until a crisis happened – which proved to be the case when the coronavirus prompted Olaf Scholz to wheel out the “bazooka” this year. We also argued that Europe would be willing to mutualize debt, which was officially confirmed when outgoing Chancellor Angela Merkel forged an agreement on an EU Recovery Fund with French President Emmanuel Macron (though not exactly a “Hamiltonian moment”). Chart 16European Solidarity Strengthened
European Solidarity Strengthened
European Solidarity Strengthened
Chart 17Peak Shinzo Abe' Theme Boosted The Yen
Peak Shinzo Abe' Theme Boosted The Yen
Peak Shinzo Abe' Theme Boosted The Yen
Japan saw “Peak Abenomics,” which was confirmed this year when he handed the helm over to his deputy, Yoshihide Suga, whose policies are continuous. Abe’s late-2019 tax hike was only one of many reasons we anticipated a rally in the yen, which was supercharged by this year’s crisis (Chart 17). Russia’s political risk premium spiked, as we expected, though we did not anticipate that the cause would be a temporary breakdown in OPEC 2.0 (Chart 18). We were more prepared for an event like the poisoning of Alexei Navalny and US sanctions against the Nordstream II pipeline. Our argument that Russia would lie low, for fear of domestic unrest, has so far borne out in the Belarus protests and the conflict in Nagorno-Karabakh. Whether it will continue to do so in the face of what will likely be a pro-democracy assault in eastern Europe from the US Democratic Party remains to be seen. Chart 18Russian Geopolitical Risk Spiked As Predicted
Russian Geopolitical Risk Spiked As Predicted
Russian Geopolitical Risk Spiked As Predicted
India-China tensions were a red herring. India benefited from the western world’s turn against China. Partnerships and alliances were already taking shape before the coronavirus spurred a move in the West to diminish reliance on China’s health care exports. Our long Indian pharmaceuticals trade was highly profitable, though our overweight in Indian bonds was less so (Chart 19). Chart 19India Benefited From West's Anti-China Turn
India Benefited From West's Anti-China Turn
India Benefited From West's Anti-China Turn
Brazilian political risk surged to the highest levels since the 2018 election, and President Jair Bolsonaro suffered a setback in municipal elections, as we expected, especially after witnessing his cavalier attitude toward the pandemic (Chart 20). However, his approval rating rose on the back of fiscal largesse, implying that debt dynamics will continue to trouble this market despite the bullish backdrop for emerging markets in 2021. Chart 20Brazil Remained A Muddle
Brazil Remained A Muddle
Brazil Remained A Muddle
Chart 21Turkish Populism Exacted A Toll
Turkish Populism Exacted A Toll
Turkish Populism Exacted A Toll
Chart 22A Bull Market In Iran Tensions
Bull Market In US-Iran Tensions
Bull Market In US-Iran Tensions
The Turkish lira collapsed, as Turkish President Recep Erdogan maintained reckless domestic economic policies and foreign adventurism (Chart 21). As we go to press, Erdogan appears to be backing down from his aggressive approach to maritime-territorial disputes in the Mediterranean, for fear of European sanctions, which would be a positive surprise, albeit temporary. The “bull market in Iran tensions” continued, with US-Israeli sabotage and assassinations of key Iranian figures bookending the year (Chart 22). With Trump still in office for another 45 days, we would not be surprised to see another move on Iran, where hardliners are ascendant in the unstable advance of the Supreme Leader Ali Khamenei’s eventual succession. So far, Trump has taken market-negative actions in his “lame duck” period on Iran, China, and Big Tech, as we argued, which means more is coming despite the market’s enthusiasm over the partly sunny outlook for 2021. Investment Takeaways Geopolitical analysis is about structural themes and trends – not unpredictable black swans, which may even further entrench structural trends. When a crisis triggers a massive selloff, buy risk assets, then reassess. The gargantuan, coordinated monetary and fiscal response to this year’s crisis presented a clear buy signal. Once the virus was revealed not to be as deadly as first suspected, the rally gained steam. Political and geopolitical forecasts may be dead-on and yet fail to drive the market. There is a constant need to refine the ability to articulate and implement trades that seek to generate alpha from policy insight. Tactical views and attempts at cleverness are a liability when one’s strategic views – geopolitical, macro-economic, financial – are firmly grounded. Matt Gertken Vice President Geopolitical Strategy mattg@bcaresearch.com Footnotes 1 Thomas L. Friedman, "Biden Made Sure ‘Trump Is Not Going To Be President For Four More Years,’" New York Times, December 2, 2020, nytimes.com.
Our semi-annual virtual meeting with the long-standing client Ms. Mea took place on December 1. Given it is the end of the year, Ms. Mea inquired about our strategies for 2021 and reviewed the evolution of our views during 2020. Below is a transcript of our discussion, which we hope will help clients better grasp our views and analysis. Chart 1EM Relative Equity Performance And EM Currencies Versus DM ex-US
EM Relative Equity Performance And EM Currencies Versus DM ex-US
EM Relative Equity Performance And EM Currencies Versus DM ex-US
Ms. Mea: Before we get to investment recommendations for next year, let’s review which of your views have worked in 2020 and which have not. Answer: From a big picture perspective, we went from being very negative on EM over the last decade to being neutral on EM risk assets in both absolute terms and relative to DM peers. Since April, we have been waiting for a pullback to go long and overweight EM, but a meaningful setback has not materialized. That said, although EM risk assets and currencies have rallied substantially in absolute terms, they have not outperformed their DM peers, as shown in Chart 1. Concerning the evolution of our strategy, as you might recall, we had to chase EM stocks higher late last year after the trade deal between the US and China created euphoria in financial markets, pushing EM assets higher. But even then, we did not change our bullish view on the US dollar and continued recommending an underweight allocation in EM versus DM in global equity and credit portfolios. In our January 23, 2020 report we contended that the risk premium in global markets was extremely low and that risk assets were extremely overbought. The following week, as news of the COVID-19 outbreak in China emerged, we recommended closing the long position in EM stocks. On February 20, we asserted that odds of a breakdown were substantial and recommended shorting EM stocks outright. We closed this position on March 19 with a substantial gain. On March 26, we argued that it was too late to sell but too early to buy. In retrospect, the latter part of this assessment was incorrect. Then, on April 23, we recommended going long duration in EM local currency bonds or buying domestic EM bonds while hedging currency risk. We recommended receiving 10-year swap rates in several EM countries. We changed our long-standing strategic bullish stance on the US dollar to bearish on July 9. Simultaneously, we closed our shorts in various EM currencies versus the greenback and recommended shorting many of these EM currencies versus an equal-weighted basket of the euro, CHF and JPY (please refer to the bottom panel of Chart 1). We upgraded EM credit from underweight to neutral on June 4 and lifted the allocation to EM stocks from underweight to neutral on July 30. EM relative equity performance versus DM has been in a broad trading range for the whole of 2020 (please refer to the top panel of Chart 1). Chart 2Facing Technical Resistance
Facing Technical Resistance
Facing Technical Resistance
Ms. Mea: What is your EM outlook going into 2021? Answer: The odds of a major breakout in EM equities, currencies and fixed-income markets have risen, yet there could be a shakeout before the breakout. Both EM equity and the global ex-US equity indexes have risen to their previous highs which proved to be a formidable resistance level (Chart 2). The main reasons to expect a major breakout in EM and global ex-US share prices are as follows: First, the global economy could experience periodic setbacks, but things cannot be worse than they were during the pandemic-induced lockdowns in early 2020. The deployment of vaccines is likely to improve global economic conditions in 2021, especially in hard hit services sectors. Second, asset purchases by major central banks around the world have effectively removed many securities (mostly government bonds) from the marketplace while creating an enormous supply of money (Chart 3). The upshot is that too much money is chasing fewer assets. Chart 4 illustrates this phenomenon in the case of US dollar securities. Cash in both US institutional and retail money market funds is still elevated. As a share of market value of US dollar denominated equities and bonds, the amount in US money market funds has declined but it is still above its February lows. Provided that US money market rates are zero, one can make the case for more flows from money markets into both equities and bonds. Chart 3Booming Money Supply Worldwide
Booming MoneySupply Worldwide
Booming MoneySupply Worldwide
Chart 4How Much Cash On-SidelinesIs There Left In The US?
How Much Cash On-SidelinesIs There Left In The US?
How Much Cash On-SidelinesIs There Left In The US?
Finally, odds that EM equities will break above the trading range they have been in over the last 10 years have increased. As we discussed in our previous reports, EM ex-China, Korea and Taiwan have been facing hard budget constraints due to limited fiscal stimulus packages, a breakdown in their monetary transmission mechanism, and massive foreign capital outflows in early 2020. These harsh conditions have forced many companies to restructure to boost their efficiency. The banking system has been recognizing and provisioning for bad assets. Finally, some governments have adopted difficult structural reforms. These could be sowing seeds of structural transformation in these economies, in turn producing a secular bull market in their equities and currencies. As was discussed in a recent Country In-Depth report, India is one example where structural reforms stand to have a positive effect on its long-term outlook. Indonesia, Colombia, Mexico, and Brazil are other candidates that could undergo similar transformations. In a nutshell, unless the global economy craters – which has low odds – one can envision a scenario in which risk assets continue marching higher. Ms. Mea: However, you mentioned that there could be a shakeout before the breakout. What makes you say that? Answer: A potential shakeout before the breakout may occur due to the following three peaks: Peak investor sentiment: Investor sentiment is very elevated and risk assets are overbought. The ZEW global growth expectations index (a survey of analysts on DM economies) has rolled over after reaching an all-time high (Chart 5, top panel). The Sentix survey of investor future expectations has reached an apex (Chart 5, bottom panel). Importantly, net long positions in copper and net bullish sentiment on copper are at their previous highs (Chart 6). This is a plausible proxy for investor sentiment on both China and global growth. Chart 5Investor Expectations Are Elevated Edited
Investor Expectations Are ElevatedEdited
Investor Expectations Are ElevatedEdited
Chart 6Investors Are Super Bullish On And Very Long Copper
Investors Are Super Bullish On And Very Long Copper
Investors Are Super Bullish On And Very Long Copper
Chart 7Investors Are Bullish On US Equities
Investors Are Bullish On US Equities
Investors Are Bullish On US Equities
Finally, sentiment among US equity investors is also elevated (Chart 7). Peak stimulus: In China, both credit and fiscal stimulus will likely peak in Q4 2020, as demonstrated in Charts 8 and 9. The US and the euro area will experience a negative fiscal thrust in 2021 equal to 7.4% and 3.8% of GDP, respectively. A new fiscal package worth $1.5 trillion is needed in order for the US fiscal thrust to be neutral. As Republicans are likely to retain control of the Senate, even after Georgia’s Senate election vote on January 5, 2021, a new fiscal package larger than $500-750 billion is unlikely. On the whole, many countries in DM and EM are experiencing peak stimulus in 2020. Chart 8China: Peak Credit Stimulus
China: Peak Credit Stimulus
China: Peak Credit Stimulus
Chart 9China: Peak Fiscal Stimulus
China: Peak Fiscal Stimulus
China: Peak Fiscal Stimulus
Peak manufacturing growth: We should differentiate between the top in a business cycle and an end in growth acceleration. As far as global manufacturing is concerned, we are likely currently experiencing growth acceleration at its height. Global manufacturing will continue to expand, but at a slower rate. Share prices could either rally or correct when growth begins to decelerate. The stock market reaction is contingent upon how overbought and how expensive equity prices are. The top panel of Chart 10 illustrates that the tops in the US ISM manufacturing new orders-to-inventory ratio have historically marked setbacks in global cyclical stocks. Similarly, EM share prices and industrial metals fluctuate with the EM and China manufacturing PMI (Chart 10, middle and bottom panels). Having risen sharply to very elevated levels, odds are that global and China manufacturing PMIs are probably topping out. Granted, these are diffusion indexes, and declines/rollovers in global manufacturing PMIs do not necessarily imply that a recession is on the horizon. Rather, they signal the end of the acceleration phase in a cycle. Bottom Line: Given how overbought and expensive they are, share prices might react negatively to peak stimulus. Ms. Mea: Your outlook on the Chinese economy has become more nuanced since the spring. How do you see China’s business cycle and financial markets evolving? Answer: We upgraded our view on the Chinese business cycle in late May after it had become apparent that China had again injected enormous credit and fiscal stimulus into the economy. On June 18, we upgraded Chinese stocks to overweight within an EM equity portfolio. We continue to expect decent growth numbers and reviving corporate profits in most of H1 2021. That said, authorities have been tightening monetary policy since May. Policymakers realize that China’s credit excesses have become even larger and they have been proactive in policy tightening to rein in leverage and speculative activities. The central bank has siphoned off banks’ excess reserves causing interbank rates to rise considerably (Chart 11). With a time lag, money/credit will decelerate and the business cycle will follow. We expect the Chinese business cycle to crest around the middle of 2021. Chart 10Cyclical Assets Fluctuate With Manufacturing PMIs
Cyclical Assets Fluctuate With Manufacturing PMIs
Cyclical Assets Fluctuate With Manufacturing PMIs
Chart 11China: Liquidity Tightening Works With A Time Lag
China: Liquidity Tightening Works With A Time Lag
China: Liquidity Tightening Works With A Time Lag
The recent shakeout in the onshore corporate bond market will lead to a reduction in corporate bond issuance as investors now require higher yields to finance SOEs. In addition, banks and non-bank financial institutions have to comply with the asset management regulation by the end of 2021. This will restrict banks’ ability to expand their balance sheets and curb NBFI risk appetite. All in all, credit-sensitive sectors like capital spending and the property market will decelerate considerably in H2 2021. Provided that they make up a large share in the mainland economy, overall income growth will also slump. Concerning financial markets, if there is a selloff in Chinese stocks in the coming weeks or months, it will give way to another upleg later in H1 2021. Ms. Mea: Going forward, what will be the driving forces of EM risk assets and how will they shape up? Answer: EM risk assets – equities, credit markets and high-yielding domestic bonds – are by and large driven by three factors: (1) China’s import and commodities cycles (which often move in tandem); (2) domestic fundamentals in EM ex-China; and (3) sharp swings in US growth and the S&P500. (1) We elaborated on the intricacies of the Chinese business cycle above and will now offer a few insights on commodities prices. There has been a broad-based recovery in Chinese demand for commodities and various commodities prices have risen substantially. Nevertheless, the outlook for commodities prices is less certain going forward. Chart 12China's Booming Copper Imports Imply Inventory Accumulation
China's Booming Copper Imports Imply Inventory Accumulation
China's Booming Copper Imports Imply Inventory Accumulation
In particular, copper prices have surged but the rally is only partially attributable to recovering real demand in China. Other forces, namely inventory restocking in China and financial (investor) demand, have been responsible for the massive rise in copper prices. The mainland’s imports of copper and copper products have boomed since spring, growing at a rate of 70-80% from a year ago. Meanwhile, the recovery in Chinese infrastructure investment in electricity, water, and gas – which are the largest consumers of copper – has been considerable but not extraordinary (Chart 12). This surge leads us to infer that a sizable inventory restocking cycle has been taking place in China since last spring. Such large inventory accumulation has likely been prompted by the easy availability of credit and rising copper prices. Besides, investors hold record net long positions in copper on the New York Mercantile Exchange (refer to Chart 6). In brief, as we discussed in detail in the Special Report from November 25, Chinese purchases of copper will decline even as its real demand for copper continues to expand. Oil prices are at risk of excess supply as many producers are reluctant to continue suppressing their crude output. Saudi Arabia has been trying hard to limit OPEC+ production. However, it will be increasingly difficult for it to do so. The basis is that many producers are naturally looking to maximize the net present value of cash flow from their oil reserves. Due to inflation, $45 today is worth more than $45 in five years. As and when oil producers accept that global demand for oil will stagnate as the world switches to more environmentally friendly sources of energy, they will have an incentive to produce and sell as much crude as possible at current prices. Chart 13EM Sovereign Credit Spreads (Shown Inverted) Fluctuate With Commodities Prices
EM Sovereign Credit Spreads (Shown Inverted) Fluctuate With Commodities Prices
EM Sovereign Credit Spreads (Shown Inverted) Fluctuate With Commodities Prices
If Saudis lose control over output, they will ramp up their own production to increase their market share. Crude prices will plunge anew. The timing is uncertain, but we expect it to happen sooner rather than later. Overall, even though China’s business cycle recovery will continue in H1 2021, prices for certain important commodities like oil and copper will likely struggle. Setbacks in commodities prices will have ramifications for financial markets in resource-producing EM countries. EM currencies, as well as their sovereign spreads, correlate with commodities prices (Chart 13). (2) Domestic demand in EM ex-China, Korea and Taiwan will gradually improve but from a very low point. Many developing countries still face major hurdles, including banking systems that are struggling with non-performing loans, a looming fiscal drag, and a lack of control over the pandemic. Further, EM outside North Asia will lag behind advanced countries in procuring and deploying COVID-19 vaccines. Consequently, consumer and business confidence will be slow to recover in these countries, and their business cycle revival will continue to trail that of North Asia (China, Korea and Taiwan) and advanced economies. (3) Finally, any shakeout in the S&P500 will reverberate through EM. Having rallied considerably, North Asian equity and currency markets have already priced in a great deal of good news. In EM ex-North Asia, the level of economic activity, albeit reviving, remains low. This makes these EM ex-North Asian financial markets very sensitive to fluctuations in global/US financial markets. Chart 14EM Equities Have Been A Low-Beta Play On The S&P500
EM Equities Have Been A Low-Beta Play On The S&P500
EM Equities Have Been A Low-Beta Play On The S&P500
The resilience of US equity and credit markets in recent months in the face of numerous challenges has surprised us. US share prices and credit markets have not corrected meaningfully despite (1) the third wave of COVID-19 which has resulted in partial lockdowns and a deterioration in consumer sentiment; (2) the lack of a second fiscal stimulus package and (3) uncertainty surrounding the presidential elections. In retrospect, investors have been willing to buy any small dip. Interestingly, in the past three years, EM share prices outperformed DM share prices when the S&P500 sold off and underperformed when US stocks rallied (Chart 14). EM versus DM relative share prices are shown inverted on this chart. This reveals that EM stocks are not a high beta on the S&P 500 and rising US equity markets do not guarantee that EM share prices will outperform their DM peers. Overall, the outlook for EM risk assets is convoluted, warranting a neutral stance for now both in absolute terms and relative to DM. Chart 15The US Dollar Is Oversold
The US Dollar Is Oversold
The US Dollar Is Oversold
Ms. Mea: Where and how does the US dollar enter your analysis? Answer: The dynamics between EM and the US dollar is push-pull in nature, i.e., the causality runs both ways. EM fundamentals – that could be broadly defined as return on capital in these economies – drive their exchange rates’ trends versus the US dollar. Further, US dollar trends are also shaped by several global macro forces, including the global business cycle. The US fiscal position and monetary policy stance also drive fluctuations in the value of the greenback. Over the next several years, the US dollar will likely be in a bear market because US inflation will rise and the Federal Reserve will fall behind the inflation curve. US real rates will remain negative, which will continue to undermine the dollar’s value. All that said, the US dollar has become very oversold and investor sentiment is bearish on the greenback (Chart 15). From a contrarian perspective, the dollar might be set up for a countertrend rebound. Interestingly, after the 2016 US elections, the US dollar rallied strongly for several weeks before selling off violently. It seems that the broad trade-weighted dollar is now following a reverse pattern (Chart 16). The US dollar in 2016 is shown inverted in this chart. The greenback was selling off before the 2020 US elections and has continued weakening since. If this reverse pattern were to play out, the US dollar will near its bottom soon and then stage a playable rebound. Chart 16The US Dollar Before And After 2016 And 2020 Presidential Elections
The US Dollar Before And After 2016 And 2020 Presidential Elections
The US Dollar Before And After 2016 And 2020 Presidential Elections
Chart 17EM Stocks Are Cheap If The Structural EPS Trend Is Up
EM Stocks Are Cheap If The Structural EPS Trend Is Up
EM Stocks Are Cheap If The Structural EPS Trend Is Up
In short, a long-term bear market but near-term rebound in the US dollar is consistent with our view of a shakeout before a breakout for EM equities and risk assets. Ms. Mea: What about EM equity and currency valuations? Are they not still cheap despite their recent rally? Answer: From a secular perspective, EM equities appear modestly cheap as illustrated by our cyclically-adjusted P/E (CAPE) ratio (Chart 17). However, it is vital to realize that this CAPE valuation model assumes that EPS (earnings per share) in real (inflation-adjusted) US dollar terms will revert to its long-term trend sooner rather than later (Chart 17, bottom panel). There is a lot of uncertainty regarding the structural trend in EM EPS. For the past decade – and therefore well before the pandemic – EM EPS in nominal US dollar terms has been fluctuating in a wide range (Chart 18). Not surprisingly, EM share prices have been flat for the past ten years. Further, EM EPS has massively underperformed US EPS in local currency terms for the past ten years (Chart 19). Consistently, EM share prices have underperformed the S&P 500 even in local currency terms. Chart 18EM EPS: No Growth For 10 years
EM EPS: No Growth For 10 years
EM EPS: No Growth For 10 years
Chart 19EM Versus US: Relative Stock Prices And Relative EPS
EM Versus US: Relative Stock Prices And Relative EPS
EM Versus US: Relative Stock Prices And Relative EPS
As for EM currencies, the aggregate real effective exchange rate of EM ex-China, Korea, Taiwan currencies suggests that they are cheap (Chart 20). Overall, to argue that EM stocks are cheap, one should be confident that EM EPS in real (inflation-adjusted) USD terms will be expanding in the years to come (Chart 17, bottom panel). While some EM economies have undertaken some restructuring, there is currently no strong evidence to suggest that EM EPS will be in a structural uptrend. From a cyclical perspective, EM EPS will certainly be recovering in 2021 (Chart 21). However, a notable chunk of this profit recovery has already been largely priced in. Chart 20EM ex-China, Korea, Taiwan: Currency Valuations
EM ex-China, Korea, Taiwan: Currency Valuations
EM ex-China, Korea, Taiwan: Currency Valuations
Chart 21EM Profits Will Recover In 2021
EM Profits Will Recover In 2021
EM Profits Will Recover In 2021
To sum up, a bet on EM share prices breaking out above their decade-long trading range implies betting on EM EPS entering a period of structural growth. Over the past ten years, EM companies have not delivered the secular growth needed to warrant higher equity multiples. We are open to the idea that structural reforms carried out in several nations will allow for higher productivity, income and profit growth. However, it is still too early to jump to that conclusion. Chart 22Will Asian Markets Finally Break Out?
Will Asian Markets Finally Break Out?
Will Asian Markets Finally Break Out?
Ms. Mea: Where in your analysis and strategy might you be wrong? Answer: The key risks to our view are twofold: First, FOMO (fear of missing out) on the part of investors continues to propel EM risk assets higher while either their fundamentals remain mediocre or they are already very expensive. As we have shown in Chart 4, there is still a lot of US dollar cash sitting in US money market funds and these could feed the EM rally, preventing the materialization of a shakeout. Second, we might be late to recognize structural shifts in certain EM economies and, might therefore miss breakouts in those bourses. Notably, there is no single EM equity market that has clearly broken above its previous highs (Chart 22). Ms. Mea: What are your overweights and underweights for equity, currency and fixed-income portfolios? Answer: For an EM equity portfolio, our strong conviction overweights have been and remain China, Korea and Mexico. Chart 23 shows the performance of our fully-invested EM equity portfolio based on our recommended country allocation. It has outperformed the EM MSCI equity benchmark by 3.7% in 2020 and by 74% since its initiation in May 2008. The latter translates into a 4.7% CAGR outperformance versus the EM MSCI equity benchmark in 10.5 years. Critically, this outperformance has been achieved with very low volatility and small drawdowns. Chart 23Performance Of Our EM Equity Country Allocation Portfolio (Country Recommendations)
Performance Of Our EM Equity Country Allocation Portfolio (Country Recommendations)
Performance Of Our EM Equity Country Allocation Portfolio (Country Recommendations)
As for EM local bonds, we continue to recommend receiving ten-year swap rates in Korea, Malaysia, Russia, Mexico, Colombia, South Africa, China and India. We are looking for a setback in their currencies to switch to holding cash bonds, i.e., without hedging currency risk. Among EM currencies, our short basket consists of BRL, CLP, ZAR, TRY and IDR while our favored ones have been MXN, RUB, CZK, INR THB and SGD. All these country recommendations and positions as well as the one in the EM sovereign credit space (US dollar bonds) are always presented at the end of our reports (please refer to the following pages). Arthur Budaghyan Chief Emerging Markets Strategist arthurb@bcaresearch.com Footnotes Equities Recommendations Currencies, Credit And Fixed-Income Recommendations
Highlights Don’t trust market inflation expectations or real interest rates. When inflation is near-zero, think in nominal terms not in real terms. New structural recommendation: Underweight inflation protected bonds versus conventional bonds. For the time being stay overweight stocks versus bonds, but sell stocks if the 10-year T-bond yield rises by 0.3 percent. We address four concerns about inflation raised by clients. Fractal trade: short copper versus gold. Don’t Trust Market Inflation Expectations Or Real Interest Rates Are the markets any good at predicting inflation? No, they are not (Chart of the Week). Both the inflation forwards market and the breakeven inflation rate implied in inflation protected bonds have been lousy predictors of inflation.1 We can forgive that. What we cannot forgive is how these markets derive their inflation forecasts. Chart of the Week AThe Markets Are Lousy At Predicting Inflation
The Markets Are Lousy At Predicting Inflation
The Markets Are Lousy At Predicting Inflation
Chart of the Week BThe Markets Are Lousy At Predicting Inflation
The Markets Are Lousy At Predicting Inflation
The Markets Are Lousy At Predicting Inflation
Expected inflation in the UK just tracks the commodity price index (Chart I-2), and expected inflation in the US just tracks the oil price (Chart I-3 and Chart I-4). This link between expected inflation and the level of commodity prices is absurd, for three reasons: Chart I-2UK Bond Markets' Expected Inflation Just Tracks Commodity Prices
UK Bond Markets' Expected Inflation Just Tracks Commodity Prices
UK Bond Markets' Expected Inflation Just Tracks Commodity Prices
Chart I-3US Bond Markets' Expected Inflation Just Tracks The Oil Price
US Bond Markets' Expected Inflation Just Tracks The Oil Price
US Bond Markets' Expected Inflation Just Tracks The Oil Price
Chart I-4US Inflation Swaps' Expected Inflation Just Tracks The Oil Price
US Inflation Swaps' Expected Inflation Just Tracks The Oil Price
US Inflation Swaps' Expected Inflation Just Tracks The Oil Price
Inflation measures a change in a price. Therefore, inflation expectations should not track the price level of anything. Even if expected inflation is incorrectly tracking a price level, a lower price today will increase the scope for future inflation, and vice-versa. Hence, any relationship with the current price level should be an inverse relationship, not a positive relationship. Most absurd of all, how can the level of commodity prices today conceivably forecast the inflation rate five years ahead through 2026-31, as the inflation forwards seem to be suggesting? There are two important takeaways from the absurdity of inflation expectations. First, it follows that the market’s estimates of the real interest rate must also be lousy, and taken with a huge dose of salt. The market’s estimates of the real interest rate must be taken with a huge dose of salt. Second, as the market’s inflation expectations just track commodity prices, the relative performance of UK index-linked gilts versus conventional gilts just tracks commodity prices too (Chart I-5); and the performance of US TIPS versus T-bonds just tracks the oil price. Nothing more and nothing less (Chart I-6). As we expect the structural bear market in commodities has much further to run, the structural recommendation for bond investors is: Chart I-5UK Index-Linked Gilts Vs. Conventional Gilts = Commodity Prices
UK Index-Linked Gilts Vs. Conventional Gilts = Commodity Prices
UK Index-Linked Gilts Vs. Conventional Gilts = Commodity Prices
Chart I-6US TIPS Vs. T-Bonds = The Oil Price
US TIPS Vs. T-Bonds = The Oil Price
US TIPS Vs. T-Bonds = The Oil Price
Underweight inflation protected bonds versus conventional bonds. When Inflation Is Near-Zero, Think In Nominal Terms Not In Real Terms If the market is lousy at predicting long-term inflation, then it might also be lousy at predicting the long-term nominal return on equities. After all, shouldn’t prospective inflation impact the prospective 10-year nominal return on equities? The surprising answer is no. The prospective 10-year nominal return on the stock market depends only on the stock market’s starting valuation. The 10-year nominal return on the stock market does not depend on prospective inflation, it depends only on the stock market’s starting valuation. The same relationship between the stock market’s starting valuation and prospective nominal return applied in the high-inflation 1970s and 1980s as it did in the low-inflation 2000s (Chart I-7). Chart I-7The Stock Market's Starting Valuation Establishes The Prospective Nominal Return, Irrespective Of The Inflation Backdrop
The Stock Market's Starting Valuation Establishes The Prospective Nominal Return, Irrespective Of The Inflation Backdrop
The Stock Market's Starting Valuation Establishes The Prospective Nominal Return, Irrespective Of The Inflation Backdrop
The reason is that the stock market’s 10-year nominal return has two components: the income through the 10 years, and the terminal value at the end of the 10 years. When inflation is high, the income component is larger, but the terminal value component is smaller – because in an inflationary environment the market will demand a higher subsequent return, requiring a lower price. When inflation is low, the opposite is true: lower income, but higher terminal value. These effects cancel out, so the result is a prospective nominal return that is independent of prospective inflation. Crucially, the required prospective return on equities in excess of bonds is also established in nominal terms. This is because the bond yield’s lower limit is nominal, at say -1 percent. Proximity to this nominal yield limit makes bonds very risky because there is no longer any upside to price, only downside. Witness Swiss bonds this year. As the riskiness of equities and bonds converges, the required prospective nominal return on equities collapses towards the ultra-low bond yields. The upshot is that both the prospective return on equities and the required prospective return on equities should always be calculated in nominal terms, never in real terms. Right now, the high valuation of the aggregate stock market means a very low prospective nominal return, and this valuation is hypersensitive to ultra-low bond yields (Chart I-8 and Chart I-9). Chart I-8The Stock Market Is Priced To Generate A Feeble Long-Term Return
The Stock Market Is Priced To Generate A Feeble Long-Term Return
The Stock Market Is Priced To Generate A Feeble Long-Term Return
Chart I-9AUltra-Low Bond Yields Have Created The Greatest Asset-Price Inflation Of All Time
The Absurdity Of Inflation Expectations
The Absurdity Of Inflation Expectations
Chart I-9BUltra-Low Bond Yields Have Created The Greatest Asset-Price Inflation Of All Time
Ultra-Low Bond Yields Have Created The Greatest Asset-Price Inflation Of All Time
Ultra-Low Bond Yields Have Created The Greatest Asset-Price Inflation Of All Time
For the time being stay overweight stocks versus bonds, but as we warned two weeks ago, Sell Stocks If The Bond Yield Rises By 0.3 Percent. Four Concerns About Inflation Raised By Clients In this section, which is in question and answer format, we will address four concerns about long-term inflation that our clients have raised. 1, Isn’t the unprecedent fiscal stimulus in 2020 setting us up for inflation down the road? No, not in itself. Understand that the unprecedented stimulus is in response to unprecedented shocks to incomes that have come from the rolling waves of the pandemic. As incomes disappeared, governments provided income-substitution. As and when incomes reappear, governments will withdraw the income-substitution. Indeed, the UK government tried to withdraw its income-substitution (furlough) scheme prematurely and had to backtrack when the virus resurged. This illustrates that the unprecedented fiscal stimulus is a much-needed stabiliser of the economy, rather than a source of inflation. 2. But if governments want a bit of inflation, they can get it, can’t they? No. Understand that inflation is a non-linear system with two states, price stability and price instability. You can shift between these two states, but you cannot get a ‘little bit of inflation’ in a controlled fashion, or hit an arbitrary inflation target like 2 percent, 3 percent, or 5 percent. This is something that we have been arguing for years, and it is comforting that some great thinkers – like (the late) Paul Volker and William White – fully support our non-linear system thesis. You cannot get a ‘little bit of inflation’ in a controlled fashion. Any government can take its economy into the state of price instability if it so chooses. Witness Turkey and Argentina. But price stability is the much better state to be in. Given that developed economies have expended decades of blood, sweat, and tears to reach the state of price stability, we think that it would be a monumental policy error to embark on the road to price instability (Chart I-10). Chart I-10Inflation Is A Non-Linear System With Two States, Price Stability And Price Instability
The Absurdity Of Inflation Expectations
The Absurdity Of Inflation Expectations
3. But doesn’t rampant Argentina-type inflation bail out the heavily indebted? No, not necessarily. It will only bail you out if your debt is a one-off lump sum payment in the distant future. If your debt requires ongoing refinancing, then inflation will not bail you out, because the refinancing interest rate could rise in line with, or even faster than, the inflation rate. Therefore, those highly indebted governments, firms, and households that need to refinance their debts would not benefit from rampant inflation. 4. In which case, isn’t the solution to let inflation rip while keeping interest rates depressed – so-called ‘financial repression?’ No. While it is conceivable that a government could corner its government bond market and thereby repress it, it would be near-impossible to repress the much larger asset-classes of equities and real estate. Once these large and privately priced markets sniffed out the government’s nefarious plan, the required prospective nominal return would surge as a compensation for the higher inflation. The result being an almighty crash in stock and real estate markets. Given that the near $500 trillion combined worth of such markets dwarfs the $90 trillion global economy, the impact of such a crash would make this year’s pandemic feel like a waltz in the park. Fractal Trading System* This week’s recommended trade is short copper versus gold, given that the spectacular relative outperformance is showing fragility in both its 65-day and 130-day fractal structures. The profit target and symmetrical stop-loss is set at 10 percent. Chart I-11Copper Vs. Gold
Copper Vs. Gold
Copper Vs. Gold
In other trades, long RUB/CZK reached the end of its holding period with a marginal partial loss. The rolling 12-month win ratio now stands at 53 percent. When the fractal dimension approaches the lower limit after an investment has been in an established trend it is a potential trigger for a liquidity-triggered trend reversal. Therefore, open a countertrend position. The profit target is a one-third reversal of the preceding 13-week move. Apply a symmetrical stop-loss. Close the position at the profit target or stop-loss. Otherwise close the position after 13 weeks. * For more details please see the European Investment Strategy Special Report “Fractals, Liquidity & A Trading Model,” dated December 11, 2014, available at eis.bcaresearch.com. Dhaval Joshi Chief European Investment Strategist dhaval@bcaresearch.com Footnotes 1 Europe and the US have deep and liquid markets in 5-year 5-year inflation swaps (or forwards), which price the expected 5-year inflation rate 5 years ahead. The current swap measures the annual inflation rate expected through 2026-31. The UK and the US also have deep and liquid markets in inflation-protected government bonds: UK index-linked gilts, and US Treasury Inflation Protected Securities (TIPS). The yield offered on such a security is real, which means in excess of inflation. The yield offered on a similar-maturity conventional bond is nominal. This means that the difference between the two yields equates to the market’s expectation for inflation over the maturity, known as the ‘breakeven inflation rate.’ Fractal Trading System Cyclical Recommendations Structural Recommendations Closed Fractal Trades Trades Closed Trades Asset Performance Currency & Bond Equity Sector Country Equity Indicators Bond Yields Chart II-1Indicators To Watch - Bond Yields
Indicators To Watch - Bond Yields
Indicators To Watch - Bond Yields
Chart II-2Indicators To Watch - Bond Yields
Indicators To Watch - Bond Yields
Indicators To Watch - Bond Yields
Chart II-3Indicators To Watch - Bond Yields
Indicators To Watch - Bond Yields
Indicators To Watch - Bond Yields
Chart II-4Indicators To Watch - Bond Yields
Indicators To Watch - Bond Yields
Indicators To Watch - Bond Yields
Interest Rate Chart II-5Indicators To Watch - Interest Rate Expectations
Indicators To Watch - Interest Rate Expectations
Indicators To Watch - Interest Rate Expectations
Chart II-6Indicators To Watch - Interest Rate Expectations
Indicators To Watch - Interest Rate Expectations
Indicators To Watch - Interest Rate Expectations
Chart II-7Indicators To Watch - Interest Rate Expectations
Indicators To Watch - Interest Rate Expectations
Indicators To Watch - Interest Rate Expectations
Chart II-8Indicators To Watch - Interest Rate Expectations
Indicators To Watch - Interest Rate Expectations
Indicators To Watch - Interest Rate Expectations
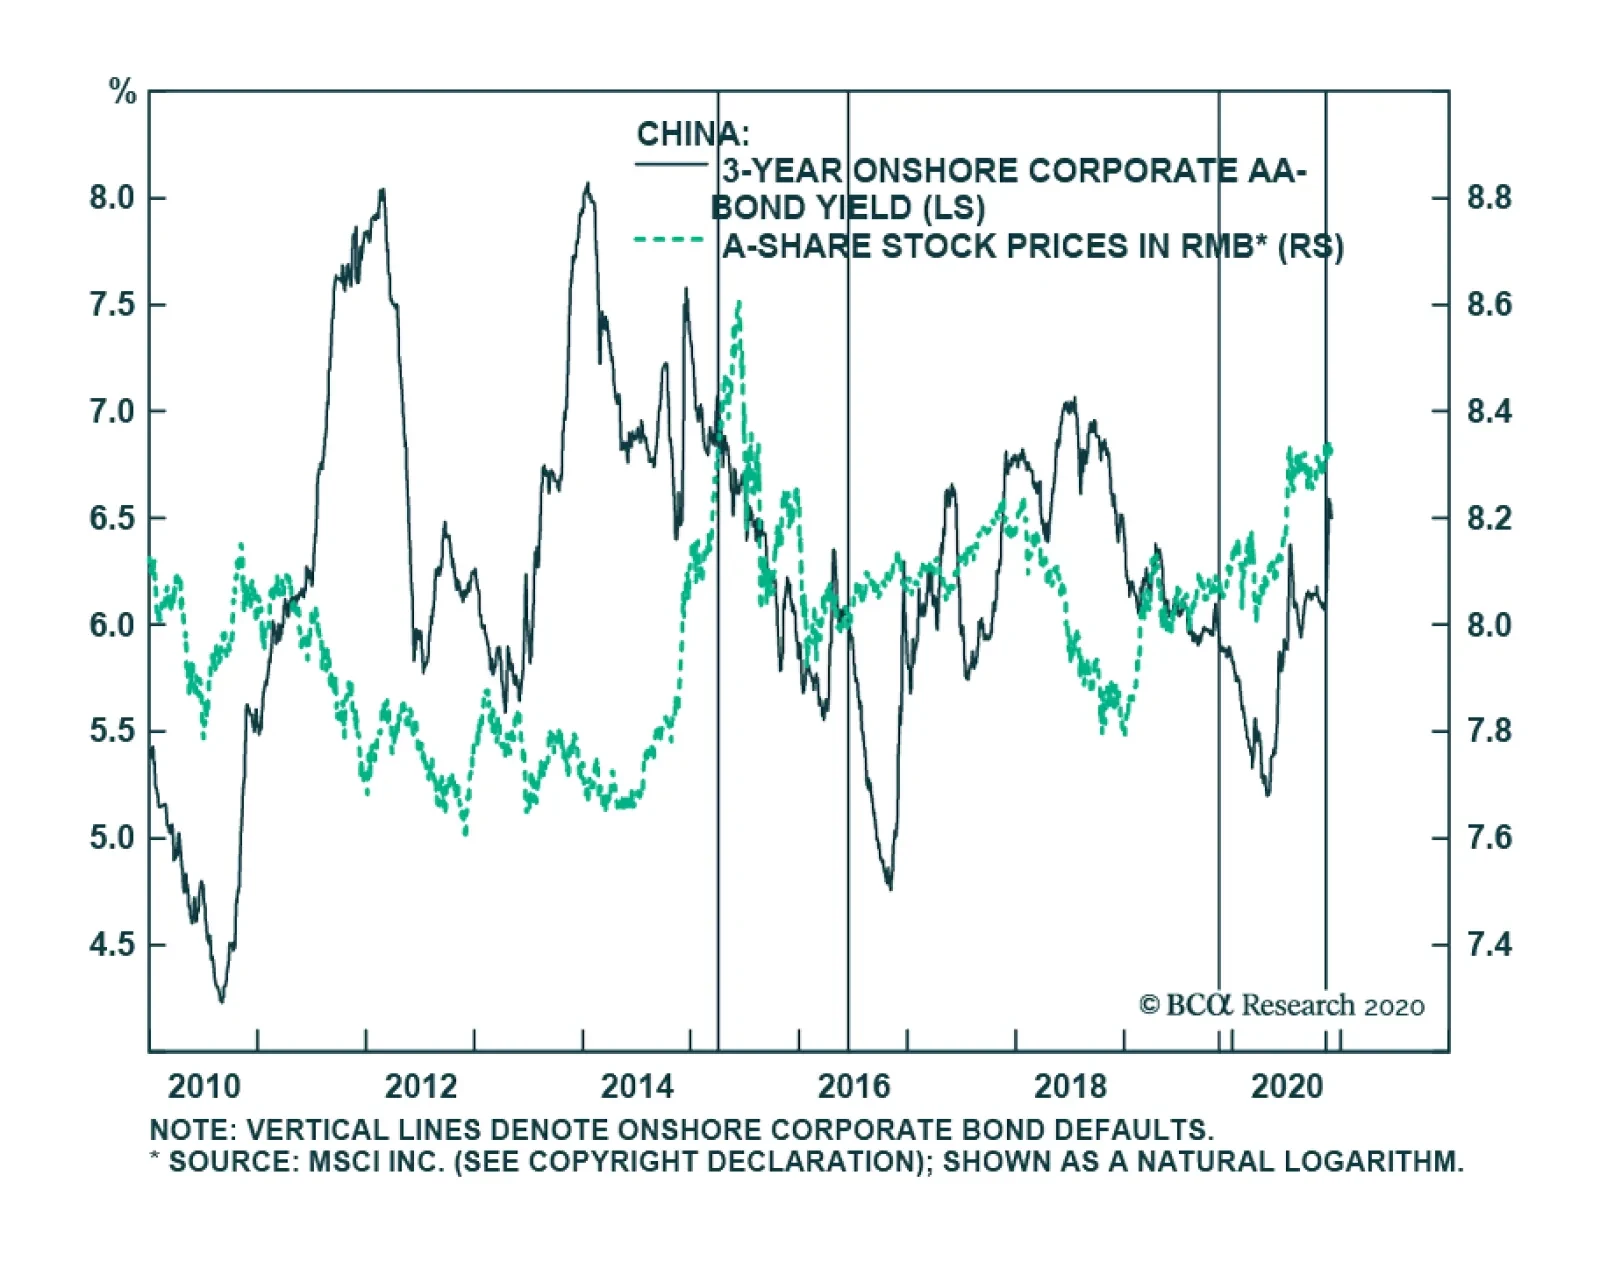
Although the onshore corporate bond market is under stress, BCA Research’s China Investment Strategy service concludes that it will not be the force that buckles Chinese equities. Recent bond payment defaults by several SOEs have led to a spike in onshore…
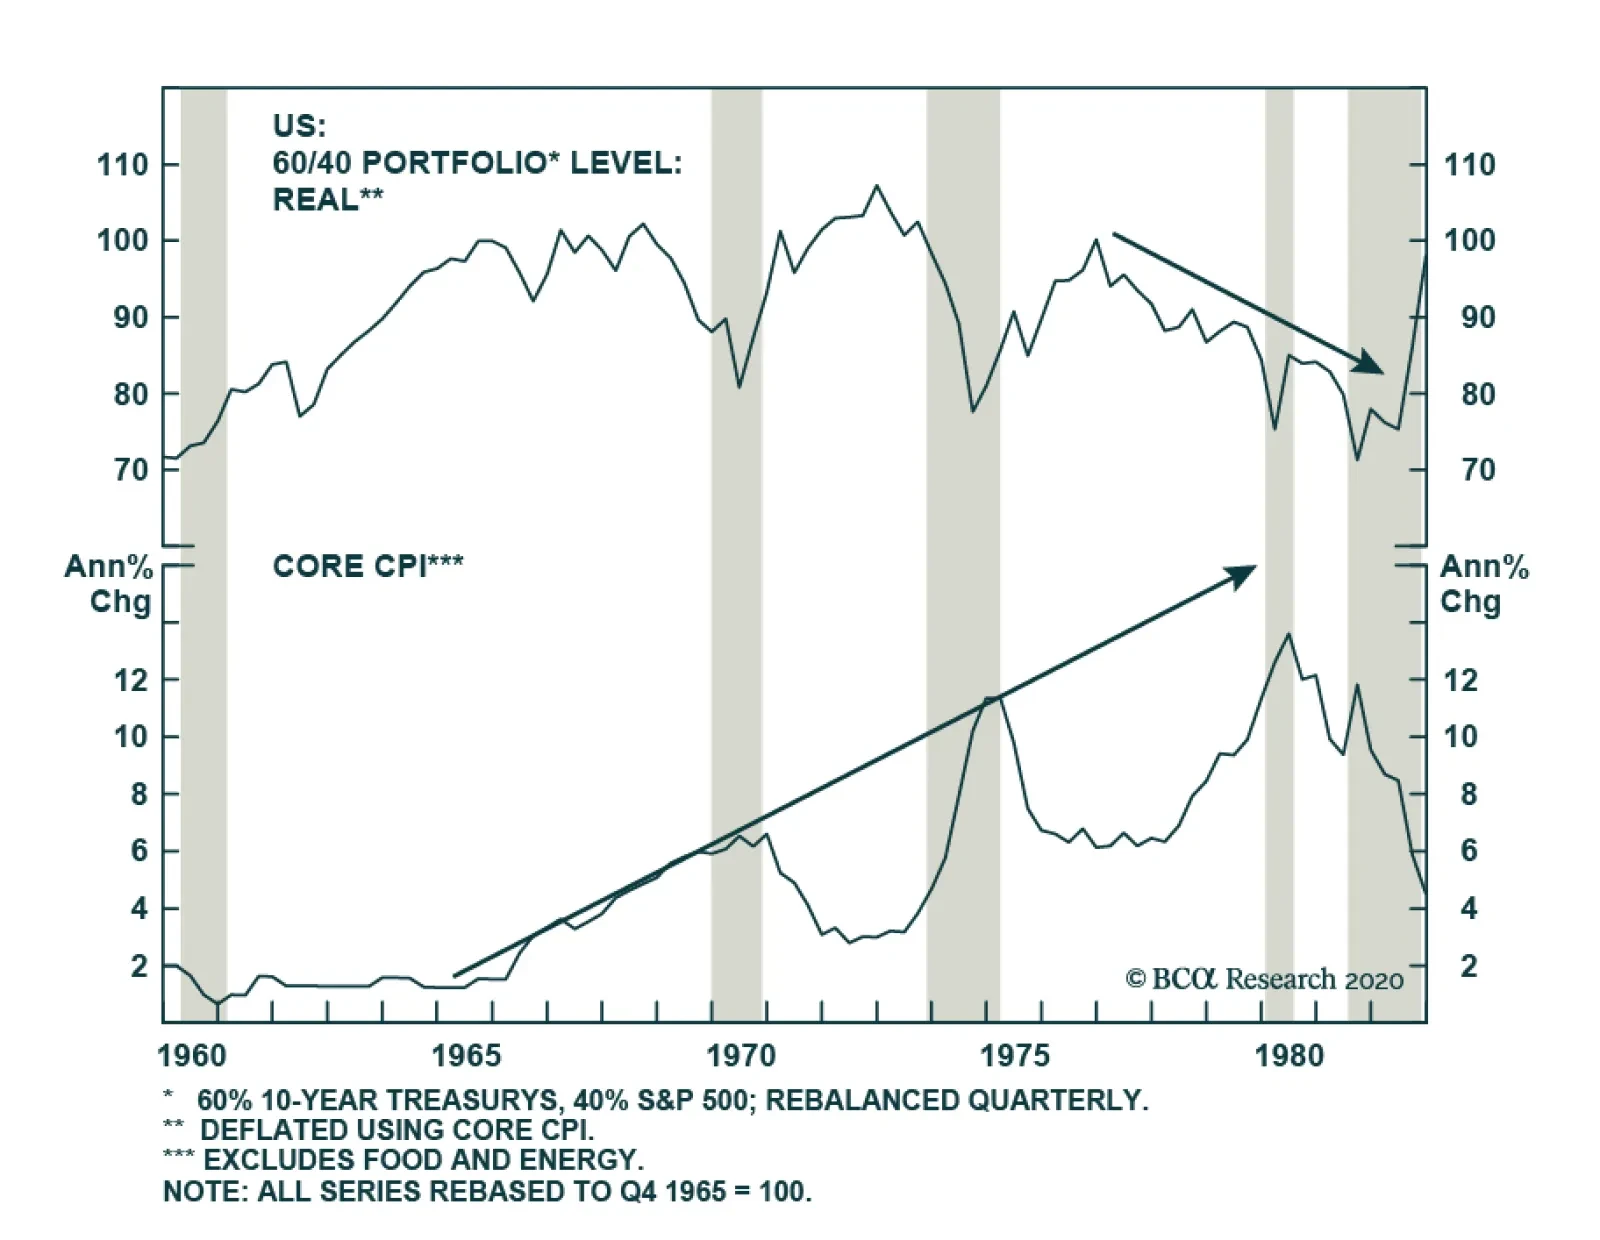
While the near-term inflation risk is limited, various forces point toward expanding odds of higher long-term inflation. The broadening preference among the population toward greater government involvement in the economy suggests that fiscal deficits will…
The strength in China’s post-pandemic policy support likely peaked in October. Interbank rates have normalized to their pre-pandemic levels and bond yields have risen sharply since May. The renewed emphasis on financial de-risking is evident in China’s recent anti-trust regulations against domestic leading online retail and lending providers, rising corporate bond defaults and readouts from recent PBoC meetings. In the near term, US President-elect Joe Biden will focus on reviving the economy and this may restore some balance to the Sino-US trade relationship. Additionally, China’s economic recovery is on track. The odds are rising that next year the Chinese leadership will accelerate structural reforms and the de-risking campaign, which began in 2017 but was delayed due to the US-China trade war and the COVID pandemic. These policy actions will improve China’s productivity growth and industrial competitiveness in the medium to long term, but they will create short-term headwinds to the economic recovery and the stock market’s performance. The uptrend in China’s business cycle will likely be maintained for another two quarters, propelled by the momentum from this year's massive stimulus. Historically, turning points in China’s business activities lag credit cycles by six to nine months. Given that China’s policy support apexed in Q4 this year, a peak in the country’s business cycle will probably be reached by mid-2021. Qingyun Xu, CFA Senior Analyst qingyunx@bcaresearch.com Jing Sima China Strategist jings@bcaresearch.com Below is a set of market relevant charts along with our observations: Monetary policy has tightened, but fiscal spending by local governments should pick up in the next two quarters to support the ongoing business cycle expansion into H1 2021. Fiscal spending has been constrained due to shortfalls in revenues this year, despite record sales of special-purpose bonds.1 Government expenditures will gain strength as local governments’ tax revenues start to improve and the proceeds from bond sales are distributed. Chart 1Credit Impulse Has Peaked...
Credit Impulse Has Peaked...
Credit Impulse Has Peaked...
Chart 3Business Cycle Expansion To Continue In 1H21
Business Cycle Expansion To Continue In 1H21
Business Cycle Expansion To Continue In 1H21
Chart 2...But Fiscal Spending Should Pick Up
...But Fiscal Spending Should Pick Up
...But Fiscal Spending Should Pick Up
Part of the buildup in this year’s industrial inventory is due to the solid recovery in domestic demand and proactive restocking by manufacturers. However, the pace of inventory pileup this year has been the highest since 2014, while infrastructure investment and industrial output growth have barely recovered to pre-pandemic levels. The rapid expansion in industrial inventory may be the result of cheap credit and commodity prices and could lead to a period of destocking and slower imports of raw materials in Q1 2021. Chart 4Industrial Inventory Has Run Ahead Of Economic Recovery...
Industrial Inventory Has Run Ahead Of Economic Recovery...
Industrial Inventory Has Run Ahead Of Economic Recovery...
Chart 5...Propelled By Solid Recovery And Cheap Credit
...Propelled By Solid Recovery And Cheap Credit
...Propelled By Solid Recovery And Cheap Credit
Core CPI has reached its weakest level in more than a decade, while the PPI remains in negative territory. A delayed recovery in the household consumption and services sector has been disinflationary to core CPI along with the PPI’s consumer goods price subcomponent.2 Historically, when the growth rate in the PPI outpaces that in the CPI, industrial output and profits tend to improve even if the PPI is in contraction. However, a deflationary PPI is the result of depressed demand for both industrial products and household goods. Hence, neither the widening gap between the PPI and CPI nor the improvement in industrial profits can be sustained on the back of falling consumer prices. Credit impulse tends to lead an increase in both the PPI and CPI by six to nine months. Improving service sector activities and rebounding energy and commodity prices will also be reflationary to both the CPI and the PPI. Meanwhile, the peaking credit impulse coupled with tighter domestic monetary policy and a rapidly rising RMB will limit the upside in both the consumer and producer price indexes. Chart 6Rising Deflation Risks
Rising Deflation Risks
Rising Deflation Risks
Chart 7PPI Has Been Dragged Down By Its Consumer Goods Price Component
PPI Has Been Dragged Down By Its Consumer Goods Price Component
PPI Has Been Dragged Down By Its Consumer Goods Price Component
Chart 8Improvement In Industrial Profits Is Unsustainable In A Deflationary Environment
Improvement In Industrial Profits Is Unsustainable In A Deflationary Environment
Improvement In Industrial Profits Is Unsustainable In A Deflationary Environment
Chart 9While The Economic Recovery Should Support Prices...
While The Economic Recovery Should Support Prices...
While The Economic Recovery Should Support Prices...
Chart 10...A Rapidly Rising RMB Will Limit The Upside In Producer Prices Next Year
...A Rapidly Rising RMB Will Limit The Upside In Producer Prices Next Year
...A Rapidly Rising RMB Will Limit The Upside In Producer Prices Next Year
Retail sales growth further strengthened in October. However, despite a sharp rebound in auto sales, other consumption segments, such as catering, tourism and consumer durable goods, remain sluggish. Household disposable income and employment have improved from troughs earlier this year, but both continue to lag behind the recovery in the industrial sector. The sluggish household sector has prompted Chinese leaders to take actions. In a State Council executive meeting on November 18, Primer Li Keqiang pledged to promote the consumption of home appliances, catering, and automobiles.3 Stocks of consumer goods and automakers rallied following the pro-consumption stimulus announcement. We continue to favor consumer discretionary stocks in both onshore and offshore markets. Even though the valuations in both sectors are elevated compared with the broad market, their earnings outlook also shows a notable improvement. In the next 6 months, targeted pro-consumption stimulus policies should further boost investors’ sentiment as well as profits in these sectors. Chart 11The Ex-Auto Retail Sales Remain Sluggish
The Ex-Auto Retail Sales Remain Sluggish
The Ex-Auto Retail Sales Remain Sluggish
Chart 12Improving Household Income And Employment Will Support Consumption
Improving Household Income And Employment Will Support Consumption
Improving Household Income And Employment Will Support Consumption
Chart 13Policy Support Will Continue Boosting Auto Sales...
Policy Support Will Continue Boosting Auto Sales...
Policy Support Will Continue Boosting Auto Sales...
Chart 14...And Promote NEV Sales
...And Promote NEV Sales
...And Promote NEV Sales
Chart 15Auto Sector's Outperformance Should Continue
Auto Sector's Outperformance Should Continue
Auto Sector's Outperformance Should Continue
Chart 16Consumer Discretionary Sector Will Also Benefit From More Policy Support
Consumer Discretionary Sector Will Also Benefit From More Policy Support
Consumer Discretionary Sector Will Also Benefit From More Policy Support
Chart 17Housing Demand In Second- And Third-Tier Cities Has Already Rolled Over
Housing Demand In Second- And Third-Tier Cities Has Already Rolled Over
Housing Demand In Second- And Third-Tier Cities Has Already Rolled Over
In the past four weeks, the high-frequency data show that momentum in housing demand in second- and third-tier cities has quickly abated. Moreover, bank lending to property developers has rolled over, reflecting tighter financing regulations and pressure to deleverage in the property sector. Growth has flattened in medium- and long-term consumer loans while the propensity for home purchase has ticked up slightly. This divergence may be a sign that demand for real estate has not softened, but that home buyers are waiting for more discounts from property developers. As such, the rebound in floor space started in October should be short-lived as property developers’ profit margins continue to narrow and their financing remains constrained. We expect aggregate home sales growth to decelerate slightly in 1H21 from the past six months. However, real estate developers need to complete their existing projects, which will support construction activities into H1 next year. Chart 18Home Buyers May Be Expecting More Home Price Discounts Ahead
Home Buyers May Be Expecting More Home Price Discounts Ahead
Home Buyers May Be Expecting More Home Price Discounts Ahead
Chart 19Financing Constrains Will Limit Investments In New Building Projects
Financing Constrains Will Limit Investments In New Building Projects
Financing Constrains Will Limit Investments In New Building Projects
This year’s strong outperformance in China’s offshore equity prices has been driven by the TMT sector’s stocks (Information Technology, Media & Entertainment, and Internet & Direct Marketing Retail). Since October, however, Chinese stocks excluding the TMT sector have also started to outperform the global benchmarks. Moreover, domestic cyclicals, which do not feature some of China’s leading tech companies such as Alibaba and Tencent, have outpaced onshore defensive stocks. These developments indicate that as the upswing in China’s business cycle continues to strengthen, the outperformance in China’s ex-TMT stocks will likely be sustained into early 2021. Within cyclical sectors, we continue to favor the materials and consumer discretionary sectors aimed at policy dividends and a rebound in commodity prices. Chart 20China's Ex-TMT Stocks Starting To Outperform Global
China's Ex-TMT Stocks Starting To Outperform Global
China's Ex-TMT Stocks Starting To Outperform Global
Chart 21Domestic Cyclicals Are Now Breaking Out Relative To Defensives
Domestic Cyclicals Are Now Breaking Out Relative To Defensives
Domestic Cyclicals Are Now Breaking Out Relative To Defensives
Chart 22Accelerating Economic Recovery Will Continue To Support Chinese Cyclical Stocks
Accelerating Economic Recovery Will Continue To Support Chinese Cyclical Stocks
Accelerating Economic Recovery Will Continue To Support Chinese Cyclical Stocks
Chart 23Rebounding Commodity Prices Will Bode Well For Material Stocks
Rebounding Commodity Prices Will Bode Well For Material Stocks
Rebounding Commodity Prices Will Bode Well For Material Stocks
Recent bond payment defaults by several SOEs have led to a spike in onshore corporate bond yields. Nonetheless, the ripple effect on China’s financial markets has been limited outside of the corporate bond market; onshore stocks were little changed by news of the defaults. Moreover, the PBoC’s recent liquidity injections helped to stabilize the interbank rate. Historically, corporate bond defaults and rising bond yields have not had an imminent negative impact on China’s domestic stock market performance; none of the defaults in 2015, 2016 or 2019 led to selloffs in the equity market. However, during a business cycle upswing and following a large-scale stimulus, increasing corporate defaults typically mark the onset of tightening in financial regulations and the monetary cycle. We expect the upswing in the business cycle to begin losing momentum as the tightening policy cycle gains further traction in 2021. Prices in the forward-looking equity market will likely peak sooner on the expectation that the rate of economic and corporate earnings growth will slow in 2H21. Chart 24Stress In Chinese Onshore Corporate Bond Market
Stress In Chinese Onshore Corporate Bond Market
Stress In Chinese Onshore Corporate Bond Market
Chart 25Stress In Chinese Onshore Corporate Bond Market
Stress In Chinese Onshore Corporate Bond Market
Stress In Chinese Onshore Corporate Bond Market
Chart 26But So Far Negative Impacts On The Stock Market Are Limited
But So Far Negative Impacts On The Stock Market Are Limited
But So Far Negative Impacts On The Stock Market Are Limited
Table 1China Macro Data Summary
China Macro And Market Review
China Macro And Market Review
Table 2China Financial Market Performance Summary
China Macro And Market Review
China Macro And Market Review
Footnotes 1Please see China Investment Strategy Weekly Report "China Macro And Market Review," dated October 7, 2020, available at cis.bcaresearch.com 2Headline PPI is comprised of producer and consumer goods. The weights of producer and consumer goods are roughly 75% and 25%, respectively. As for producer goods by industry, the weight of the manufacturing sector is around 50%, followed by 20% for the raw material sector; the mining sector accounts for only around 5%. 3Pro-auto consumption plans include: providing subsidies to encourage urban car owners to replace older and higher-emission models with newer environmentally friendly ones; encouraging automobile sales and upgrades in rural areas; and promoting New Energy Vehicle (NEV) sales. The plan will also loosen some existing restrictions on auto sales and increase the permits for vehicle license plates. Cyclical Investment Stance Equity Sector Recommendations
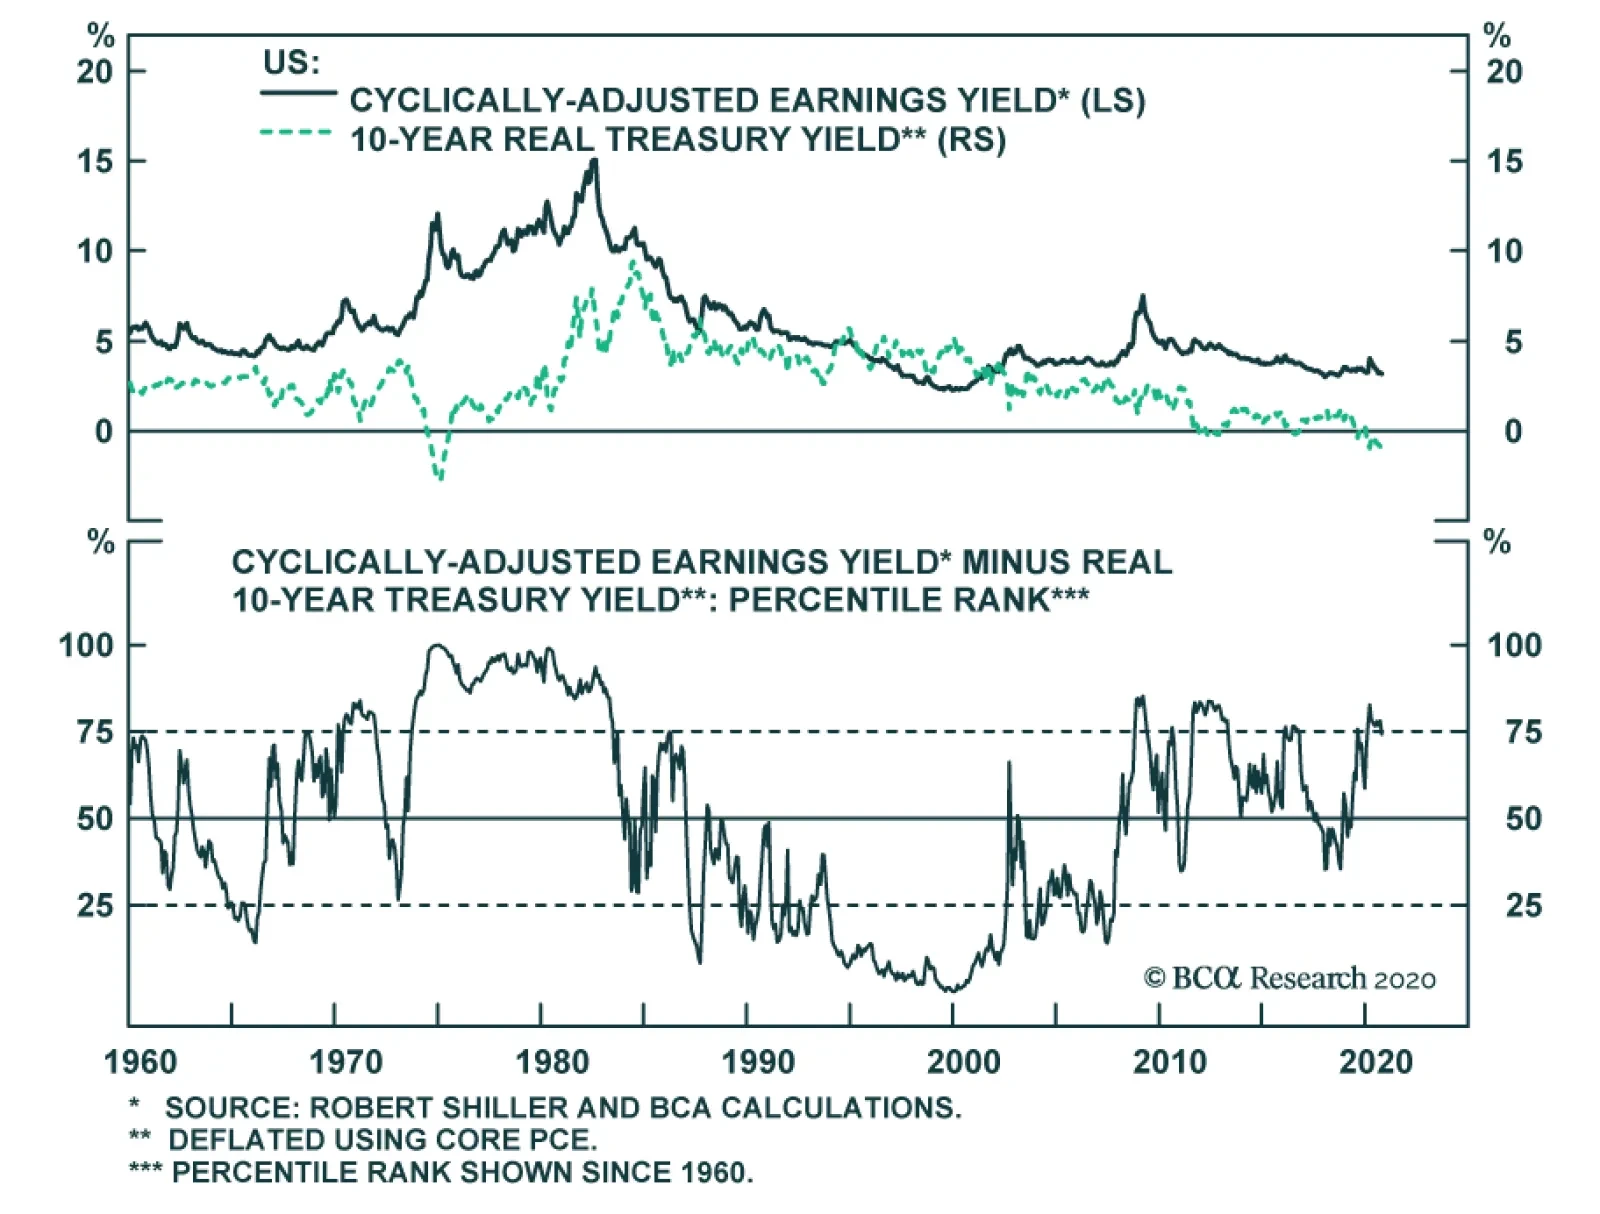
According to BCA Research’s Global Asset Allocation service, equity valuations look compelling compared to bonds. The spread between the US cyclically adjusted earnings yield to the 10-year Treasury real yield has been higher only 25% of the time since 1960.…
Highlights Inflation Breakeven Trades: We are taking profits on our recommended inflation breakeven widening trades in Italy and Canada, as breakevens in both countries are no longer below the fair values implied by our models. We are initiating a new trade this week, going long French 10-year inflation-linked bonds versus French nominal OATs, as French breakevens remain below fair value. Yield Curve Butterfly Trades: We are closing three of our four outstanding government bond yield curve trade recommendations, taking profits in France and Italy and realizing a loss in the UK. We are maintaining our US 5/7/10 butterfly trade, which is the cheapest way to position for an expected steepening of the Treasury curve based on our valuation models. Cross-Country Spread Trades: We are cutting our losses in our New Zealand-UK government bond spread trade, with the odds of the RBNZ shifting to a negative interest rate policy severely curtailed by political pressure over surging New Zealand house prices. We are maintaining our US-Germany spread widening trade, as the spread is too narrow based on our fair value model and we see more scope for US Treasury yields to drift higher in the coming months. Feature Dear Client, Next week, we will be jointly publishing our semi-annual Central Bank Monitor Chartbook along with our colleagues at BCA Research Foreign Exchange Strategy. You will receive that report a few days later than usual on Friday, December 11. We will return to our regular publishing schedule on Tuesday, December 15 with our 2021 Key Views report outlining our main investment themes and ideas for the upcoming year. Best Regards, Rob Robis As we enter the final weeks of an incredibly eventful and (unfortunately) all too memorable 2020, our attention now turns to investment ideas for the coming New Year. This week, all BCA Research clients will receive the 2021 Outlook report, detailing the key themes and recommendations from all our strategists. We will follow that up with our own 2021 Global Fixed Income Strategy outlook report later this month. The waning days of the year also offer a good time to review our more short-term trade recommendations currently in our Tactical Overlay portfolio. In addition, the waning days of the year also offer a good time to review our more short-term trade recommendations currently in our Tactical Overlay portfolio (Table 1). Several of our suggested trades have generated a solid profit (like inflation breakeven wideners) but have now outlived their original rationale. Others, like some of our yield curve trades in Europe, have not gone as we expected and should therefore be closed out. Table 1Changes To Our Tactical Overlay Portfolio
A Year-End Review Of Our Tactical Overlay Trades
A Year-End Review Of Our Tactical Overlay Trades
As a reminder to our regular readers, our Tactical Overlay is a portfolio of individual trade ideas within the global fixed income space with an investment horizon of six months or less. These differ from our more typical strategic (6-12 month) recommendations that also populate our model bond portfolio. Ideas for our Tactical Overlay trades often stem from our fair value models, but can also be plays on events that we expect will be market relevant on a near-term basis, like central bank meetings. All recommended trades are implemented using specific securities, rather than generic Bloomberg tickers or bond indices. This allows for a more transparent process where clients can follow along with the performance of our trades. Evaluating Our Tactical Inflation-Linked Breakeven Trades We currently have two open tactical trade recommendations involving inflation-linked bonds: Long 10-year Italian inflation-linked bonds vs short 10-year Italian bond futures Long 10-year Canadian inflation-linked bonds vs short 10-year Canadian bond futures We initiated both of these trades back in June of this year, as well as an additional trade involving US TIPS, based on the output of our inflation breakeven fair value framework. In our models, we regress 10-year inflation breakevens on the annual rate of change of oil prices in local currency terms and a multi-year moving average of realized headline inflation.1 At the time of our mid-year report, inflation breakevens were too low on our models in the majority of developed market countries with inflation-linked bonds – a lingering after-effect of the COVID-19 shock to global growth in the second quarter of 2020 (Chart 1). Since then, 10-year inflation breakevens have caught up to fair value in the US, Germany, Italy and Canada, and have even moved above fair value in the UK and Australia. Chart 1A Big Shift In Inflation Breakeven Valuations
A Year-End Review Of Our Tactical Overlay Trades
A Year-End Review Of Our Tactical Overlay Trades
In June, we also entered into a US 10-year TIPS breakeven widening trade, but we took profits on the trade once US breakevens returned back to our model fair value estimate in September. We now see a similar situation in Canada (Chart 2) and Italy (Chart 3) where breakevens have converged to our model-implied fair value. Chart 2Canadian 10-Year Inflation Breakeven Model
Canadian 10-Year Inflation Breakeven Model
Canadian 10-Year Inflation Breakeven Model
A move above fair value is possible, but could be harder to achieve with the Canadian dollar and euro steadily trending higher which could weigh on the market’s view on future inflation in Canada and Italy. We are taking profits on our Canada and Italy 10-year breakeven trades, realizing profits of 4.7% and 5.6% respectively. Thus, we are taking profits on our Canada and Italy 10-year breakeven trades, realizing profits of 4.7% and 5.6% respectively. The Italian returns were boosted considerably by the long side of this trade, as we entered the position when the 10-year real yield was +1.05% and which has since collapsed to -0.05% on the back of the massive rally in Italian bonds. One place where breakevens still look attractively cheap, trading close to one standard deviation below our model fair value, is in France (Chart 4). This contrasts with the breakevens in Italy and Germany that have fully converged to fair value. Thus, we are entering a new trade this week, going long the on-the-run 10yr French inflation-linked bond (OATi) and shorting French bond futures (Euro-OATs). The hedge ratio used for this trade to keep both legs duration matched, given the much shorter duration of the OATi relative to nominal French bonds, is 0.49 (see the Tactical Overlay table on page 17 for specific details on the securities used in the trade). Chart 3Italian 10-Year Inflation Breakeven Model
Italian 10-Year Inflation Breakeven Model
Italian 10-Year Inflation Breakeven Model
Chart 4French 10-Year Inflation Breakeven Model
French 10-Year Inflation Breakeven Model
French 10-Year Inflation Breakeven Model
Bottom Line: We are taking profits on our recommended inflation breakeven widening trades in Italy and Canada, while initiating a new breakeven widening position in France, based on the output of our breakeven fair value models. Evaluating Our Yield Curve/Butterfly Spread Trades Back in July, we initiated a series of yield curve butterfly spread trades in the US, UK, Italy and France.2 Butterfly spreads compare the yield of a single bond (bullets) to that of a duration-neutral combination of bonds with shorter and longer maturities relative to the bullet (barbells). Our valuation models produce fair value estimates of various butterfly combinations based on the relation of the butterfly spreads to the slope of the yield curve. We then combine those valuations with our own macro views on the future slope of yield curves to come up with potential value-based curve trades.3 We now evaluate our four existing curve trades in turn. Long UK 3/20 Barbell vs. 10-Year Bullet Our original rationale for entering this trade was two-fold. Firstly, this position was the most attractive butterfly combination in terms of the standardized deviation of the spread from its model-implied fair value. Secondly, there was a relatively low correlation between nominal UK bond yields and inflation breakevens--meaning that we could see a rise in long-dated inflation expectations that did not also push up nominal bond yields by a proportional amount. This made the trade consistent with our overall macro view back in July that the Gilt curve would flatten (the same rationale applies to the other two long barbell versus short bullet trades, or “flatteners”, in France and Italy that we discuss below). Unfortunately, our rationale did not play out as expected (Chart 5). Instead of reverting to fair value, the butterfly spread was mostly flat while the bullet grew more expensive relative to the barbell, driven by a rise in the model fair value. This in turn was due to significant steepening in the underlying 3/20 curve, contrary to our expectations. We also saw a significant overall upward shift in the overall UK Gilt curve, which generated losses on our long barbell position (which has a higher interest rate convexity) that overwhelmed the profits on our short bullet position. Going forward, there are good technical and strategic reasons to exit this trade. The butterfly spread is not yet at levels where it tends to mean-revert (second panel). In addition, Joe Biden’s US election victory has also increased the odds of a Brexit deal, which would put bear-steepening pressure on the UK Gilt curve. With that in mind, we are closing our Long UK 3/20 Barbell vs. 10-Year Bullet for a loss of -0.17%. Long France 2/30 Barbell vs. 5-Year Bullet Our rationale for entering this flattener was the same as in the UK. However, we fared quite a bit better here. The underlying 2/30 curve did flatten, as we expected, however, the butterfly spread itself moved further away from fair value, with the bullet component becoming relatively more expensive (Chart 6). So, as with the UK, the returns on this trade can be largely explained by the relative outperformance of the barbell component due to its higher convexity. In France, however, the effect worked to our favor as the yield curve shifted downwards significantly. The positive returns on the long French 30-year OAT component, where yields have been nearly slashed in half since July, dominated the other parts of the trade - even with the 30-year bond only being a small piece (11%) of the duration-weighted barbell Chart 5UK 3/10/20 Spread Fair Value Model
UK 3/10/20 Spread Fair Value Model
UK 3/10/20 Spread Fair Value Model
Chart 6France 2/5/30 Spread Fair Value Model
France 2/5/30 Spread Fair Value Model
France 2/5/30 Spread Fair Value Model
Although we did make profits on the flattener, it turned into a convexity bet that was not our original intention. Seeing as our underlying logic did not work out as expected, we are not comfortable remaining in this position. Thus, we are closing our France butterfly trade for a profit of 0.56%. Long Italy 5/30 Barbell vs. 10-Year Bullet As with the UK and France, we entered this trade based on its attractive model-based valuation and the relatively low correlation between inflation breakevens and nominal yields in France. Our expectation of flattening in the underlying 5/30 curve did not bear out as it remained mostly flat (Chart 7). We did see some reversion in the butterfly spread towards our model-implied fair value, which helped us make profits on our trade. Again, we cannot ignore the effect of convexity when looking at the outperformance of the barbell component. Yields fell dramatically across the Italian curve in one of the clearest examples of the yield-chasing behavior we have been describing this year.4 As Italian yields continue their race to the bottom, supported by ECB asset purchases and perceptions of more fiscal co-operation between the countries of Europe, there is a chance that this trade will continue to perform by virtue of its exposure to the long end of the Italian curve. However, as our original bias towards curve flattening did not play out, we prefer to maintain our exposure to Italian government debt via an overweight allocation in our model bond portfolio instead. We therefore close our Long Italy 5/30 Barbell vs. 10-Year Bullet for a profit of 0.83% Long US 7-Year Bullet vs. 5/10 Barbell The US was the only region where we initiated a “steepener” trade, with a long bullet versus short barbell combination that does well when the yield curve steepens. We chose this particular 5/7/10 butterfly as it was the most attractive steepener available based on our model-implied valuation that also fit our fundamental macro bias back in July towards US Treasury curve steepening – a view that we still hold today. With signs pointing towards further bear steepening of the Treasury curve, we feel comfortable keeping this US 5/7/10 butterfly spread trade open. Our rationale for initiating the trade was borne out, with the underlying 5/10 Treasury curve steepening and the butterfly spread tightening towards fair value (Chart 8). Our trade was supported by a continued rebound in long-dated US inflation expectations as well as the US election result, the most bond-bearish event of the year. Chart 7Italy 5/10/30 Spread Fair Value Model
Italy 5/10/30 Spread Fair Value Model
Italy 5/10/30 Spread Fair Value Model
Chart 8US 5/7/10 Spread Fair Value Model
US 5/7/10 Spread Fair Value Model
US 5/7/10 Spread Fair Value Model
Going forward, we see good reasons to maintain this trade. The butterfly spread, after briefly reaching expensive levels, is back to being attractively valued. Even if the residual were to dip back below zero, it would still have room to become more expensive, shoring up our trade. This trade also remains the most attractive of all the steepener trades on a model-implied valuation basis, removing any incentive to rotate towards another part of the curve. The odds favor more reflationary Treasury curve steepening after the US election. President-elect Biden has a stated goal of more fiscal stimulus, while his selection of Janet Yellen as Treasury Secretary signaling increased cooperation between monetary and fiscal authorities. With signs pointing towards further bear steepening of the Treasury curve, we feel comfortable keeping this US 5/7/10 butterfly spread trade open. Bottom Line: We are closing three of our four outstanding government bond yield curve trade recommendations, taking profits in France and Italy and realizing a loss in the UK. We are maintaining our US 5/7/10 butterfly trade, which is the cheapest way to position for an expected steepening of the Treasury curve based on our valuation models. Evaluating Our Cross-Country Yield Spread Trades We currently have two recommended trades involving plays on the spread between government bonds: Long 5-year New Zealand government bonds versus short 5-year UK Gilts, currency-hedged into GBP We initiated this trade on August 25, and to date the trade is severely underwater with a total return of -1.8%.5 That loss comes from the long New Zealand leg of the trade, as the 5-year NZ bond yield has increased by 34bps from our entry level. Chart 9A Rapid Shift Upward In NZ Rate Expectations
A Rapid Shift Upward In NZ Rate Expectations
A Rapid Shift Upward In NZ Rate Expectations
The rationale for this trade was based on our assessment of the relative probability of the Bank of England (BoE) and Reserve Bank of New Zealand (RBNZ) moving to a negative interest rate policy. Both central banks hinted strongly at such a move throughout the summer months as part of their efforts to support pandemic-stricken economies. Our view back in late August was that it was more likely that the RBNZ would choose negative rates, as New Zealand had far lower inflation expectations than the UK and, unlike the British pound, the New Zealand dollar was not undervalued. This trade was initially profitable, but all that changed rapidly during the month of November. The RBNZ disappointed investor expectations on a move to negative rates at the November 11 monetary policy meeting. The central bank elected instead to increase the size of its existing quantitative easing program, while giving no hint that negative rates were coming soon. The response was a sharp move higher in both New Zealand bond yields and the New Zealand dollar (Chart 9). There was an even more violent adjustment in yields and the currency last week, after New Zealand Finance Minister Grant Robertson wrote a letter to RBNZ Governor Adrian Orr asking the central bank to change its policy remit to include controlling New Zealand house price inflation. Markets interpreted this blatant political pressure on the central bank as the end of any hopes of negative rates in New Zealand, with bond yields and the currency spiking higher once again. House prices have surged after the RBNZ aggressively cut interest rates earlier this year, with a rapidly rising share of new mortgages having higher loan-to-value ratios (Chart 10). House price inflation is now running at 19.8%, and Finance Minister Robertson did cite deteriorating housing affordability and inequality as the basis for his letter to the RBNZ. It is clear that a move to negative interest rates – which could further fuel the explosion in house prices – is now very difficult for the RBNZ to pull off without facing intense criticism. It is clear that a move to negative interest rates – which could further fuel the explosion in house prices – is now very difficult for the RBNZ to pull off without facing intense criticism. This shatters the underlying rationale for our long New Zealand/short UK yield spread trade (Chart 11). Chart 10RBNZ-Fueled Boom In House Prices
RBNZ-Fueled Boom In House Prices
RBNZ-Fueled Boom In House Prices
Thus, we are choosing to cut our losses and close out our recommended trade. Long 10-year German Bunds versus short 10-year US Treasuries Chart 11Time To Cut Our Losses On The NZ-UK Trade
Time To Cut Our Losses On The NZ-UK Trade
Time To Cut Our Losses On The NZ-UK Trade
We initiated this recommendation on October 27, and to date the trade is running a small loss of -0.17%.6 The rationale behind the trade was two-fold: Our valuation model for the 10-year UST-Bund yield spread showed that the spread was far below fair value; We turned more bearish on US Treasuries just before the US presidential election, downgrading our recommended allocation to underweight while also upgrading more defensive Germany – with its low yield-beta to US Treasuries - to overweight. The trade initially performed well, driven by faster growth and inflation in the US versus the euro area (Chart 12). The Treasury selloff has stalled of late, but we view this as more a consolidative pause than a near-term peak in yields. Chart 12Fundamentals Justify A Wider UST-Bund Spread
Fundamentals Justify A Wider UST-Bund Spread
Fundamentals Justify A Wider UST-Bund Spread
With our Treasury-Bund valuation model still showing that the spread is too tight, and with the spread not looking overly stretched versus its 200-day moving average (Chart 13), we are keeping our US versus Germany trade in our Tactical Overlay portfolio. Chart 13Valuation & Momentum Point To A Wider UST-Bund Spread
Valuation & Momentum Point To A Wider UST-Bund Spread
Valuation & Momentum Point To A Wider UST-Bund Spread
Bottom Line: We are cutting our losses in our New Zealand-UK government bond spread trade, with the odds of the RBNZ shifting to a negative interest rate policy severely curtailed by political pressure over surging New Zealand house prices. We are maintaining our US-Germany spread widening trade, as the spread is too narrow based on our fair value model and we see more scope for US Treasury yields to drift higher in the coming months Robert Robis, CFA Chief Fixed Income Strategist rrobis@bcaresearch.com Shakti Sharma Research Associate ShaktiS@bcaresearch.com Footnotes 1 Please see BCA Research Global Fixed Income Strategy Weekly Report, " How To Play The Revival Of Global Inflation Expectations", dated June 23, 2020, available at gfis.bcaresearch.com. 2 Please see BCA Research Global Fixed Income Strategy Weekly Report, "Global Yield Curve Trades: Netting Returns With Butterflies", dated July 7, 2020, available at gfis.bcaresearch.com. 3 Readers looking for more detailed background on butterfly trades and our yield curve modelling framework should refer to the July 7, 2020 Strategy Report where we initiated these trades. 4 Please see BCA Research Global Fixed Income Strategy Weekly Report, "We’re All Yield Chasers Now", dated August 11, 2020, available at gfis.bcaresearch.com. 5 Please see BCA Research Global Fixed Income Strategy Weekly Report, "Assessing The Leading Candidates To Join The Negative Rates Club", dated August 26, 2020, available at gfis.bcaresearch.com. 6 Please see BCA Research Global Fixed Income Strategy Weekly Report, "The Global Bond Implications Of Rising Treasury Yields", dated October 27, 2020 available at gfis.bcaresearch.com. Recommendations The GFIS Recommended Portfolio Vs. The Custom Benchmark Index
A Year-End Review Of Our Tactical Overlay Trades
A Year-End Review Of Our Tactical Overlay Trades
Duration Regional Allocation Spread Product Tactical Trades Yields & Returns Global Bond Yields Historical Returns