Fixed Income

Mr. X and his daughter, Ms. X, are long-time BCA clients who visit our office toward the end of each year to discuss the economic and financial market outlook for the year ahead. This report is an edited transcript of our recent conversation, which we held remotely due to the COVID-19 pandemic. Mr. X: As always, I welcome the opportunity to discuss the economic and financial outlook with you. The past year has been truly ghastly with the wretched COVID-19 disease wreaking extraordinary economic and social havoc. I take comfort from the hope that a vaccine will allow a gradual return to more normal conditions in 2021, but my concerns about the longer-run outlook have increased. The extreme monetary and fiscal responses to the virus-related economic collapse may have been necessary but will leave most developed economies much more vulnerable down the road. Risk assets have been propped up by easy money, but I fear that simply means lower returns in the future. Ms. X: The social impact of the virus has weighed heavily on me, making me quite depressed about the outlook. I can only hope that my normal optimism will return when a vaccine ends the pandemic. Of course, I am happy that equities have done much better than might have been expected in the past year, but I share my father’s concerns about long-term returns. I look forward to discussing ideas about how to position our portfolio. BCA: The past year has indeed been grim on many levels. The economic disruption has been severe, but the social toll of the virus has been even more damaging for many people in terms of being forcibly isolated from family and friends. It is very encouraging that vaccines should start to become widely available early in the year, but the return to normality likely will take time. During the northern hemisphere winter months, the pandemic may even get worse before it gets better. As far as the longer run outlook is concerned, the policy response to the crisis will indeed have consequences. Government debt has soared in most countries and this raises the issue of how this will be dealt with in the years ahead. Meanwhile, central bank support to the markets cannot continue indefinitely, which raises the prospect of severe withdrawal pains at some point. Furthermore, both fiscal and monetary trends pose the question of whether higher inflation is inevitable. It is therefore unlikely that voters will reward politicians who impose upon them the painful deflationary pressures. Markets are forward looking and one could take the view that the strength of equity markets in the past eight months has reflected optimism about the economic outlook. However, a more plausible explanation is that hyper-stimulative monetary policies have been the main driving force behind asset prices. If that is the case, then there is some cause for optimism because central banks have made it clear that they will not be tightening policy for quite some time. While you are both right to be concerned about low returns over the long run, risk asset prices seem likely to rise further in the coming year with equities continuing to outperform bonds. We can get into that in more details later. Ms. X: Before we get into our discussion of the outlook, let’s briefly review your predictions from last year. BCA: That will be a humbling experience given that we never built a global pandemic into our forecasts! A year ago, our key conclusions were that: Global equities would enter the end game of their nearly 11-year bull market. Stocks were expensive, but bonds were even more so. As a result, if global growth could recover and the US could avoid a recession in 2020, earnings would not weaken significantly and stocks would again outperform bonds. Low rates reflected the end of the debt super cycle in the advanced economies. However, the debt super cycle was still alive in EM, particularly in China. The global economic slowdown that began more than 18 months prior to our meeting started when China tried to limit debt growth. If Beijing continued to push for more deleveraging, global growth would continue to suffer as the EM debt super cycle would end. Nonetheless, we expected China to try to mitigate domestic deflationary pressures in 2020. As a result, a small wave of Chinese reflation, coupled with the substantial easing in global monetary and liquidity conditions should have promoted a worldwide reacceleration in economic activity. Policy uncertainty would recede in 2020. Domestic constraints would force China and the US toward a trade détente. The risk of a no-deal Brexit was seen as marginal, and President Trump was still the favorite in the election. A decline in policy risk would foster a global economic rebound. That being said, some pockets of geopolitical risk remained, such as in the Middle East. Global central banks were highly unlikely to remove the punch bowl. Not only would it take some time before global deflationary forces receded, monetary authorities in the G-10 would want to avoid the Japanification of their economies. As a result, they were already announcing that they would allow inflation to overshoot their 2% target for a period of time. This would ultimately raise the need for higher rates in 2021, which would push the global economy into recession in late 2021 or early 2022. These dynamics were key to our categorization of 2020 as the end game. US growth would reaccelerate. The US consumer was in good shape thanks to healthy balance sheets as well as robust employment and wage growth prospects. Meanwhile, corporate profits and capex should have benefited from a decline in global uncertainty and a pickup in global economic activity. China would continue to stimulate its economy but would not do so as aggressively as it did over the past 10 years. Consequently, EM growth would also bottom but was unlikely to boom. Europe and Japan would reaccelerate in 2020. Bond yields would continue to grind higher in 2020. However, Treasury yields were unlikely to break above the 2.25% to 2.5% range until much later in the year. Inflationary pressures would not resurface quickly, so the Fed was unlikely to signal its intention to raise interest rates until late 2020 or later. European bonds were particularly unattractive. Corporate bonds were a mixed offering. Investment grade credit was unattractive owing to low option-adjusted spreads and high duration, especially as corporate health was deteriorating. Agency mortgage-backed securities and high-yield bonds offered better risk-adjusted value. Global stocks would enjoy their last-gasp rally in 2020. As global growth would recover, we favored the more cyclical sectors and regions which also happened to offer the best value. US stocks were the least attractive bourse; they were very expensive and loaded with defensive and tech-related exposure, two groups that would suffer from higher bond yields. We were neutral on EM equities. We recommended that investors pare exposure to equities only after inflation breakevens had moved back into their 2.3% to 2.5% normal range and the Fed fund rates had moved closer to neutral. We anticipated this to be a risk in 2021. The dollar was likely to decline because it is a countercyclical currency. Balance of payment dynamics and valuation considerations were also becoming headwinds. The pro-cyclical European currencies and the euro were expected to be the main beneficiaries of any dollar depreciation. We anticipated oil and gold to have upside. Crude would benefit from both supply-side discipline and a recovery in oil demand on the back of the improving growth outlook. Gold would strengthen as global central banks would limit the upside to real rates by allowing inflation to run a bit hot. A weaker dollar would boost both commodities. We expected a balanced portfolio to generate an average return of only 2.4% a year in real terms over the next decade. This compares to average returns of around 6.5% a year between 1982 and 2018. Obviously, our forecasts were undone by the defining event of the year: the pandemic. Nonetheless, in February we warned that asset prices did not embed enough of a risk premium to protect investors against the threat that the pandemic could terminate the global business cycle. The more deflationary risk we confront today, the more inflation we will face in the future. At the beginning of the second quarter, we were quick to recommend buying stocks back, so we participated in the rally that followed. We erred in preferring foreign to US equities, which turned out to be key winners of the pandemic thanks to their heavy exposure to growth stocks (Table 1). The economic downturn meant that bond yields fell rather than rose. They have remained exceedingly low in response to exceptionally accommodative monetary conditions, a surge in savings and deeply negative output gaps. We were right to favor peripheral bonds, which benefited from the ECB’s purchases and the European Commission’s Recovery Fund (Table 1). Finally, the market rewarded our negative stance on the dollar and our bullish view on gold. However, we were offside on oil, where the continued impact of the pandemic on global transport has left crude prices at very depressed levels. Table 12020 Asset Market Returns
OUTLOOK 2021: A Brave New World
OUTLOOK 2021: A Brave New World
A Brave New World Mr. X: You mentioned that you prefer stocks over bonds for 2021. I can accept this view; while stocks are expensive, their valuations are less demanding than that of bonds. Moreover, I agree that policymakers around the world are very afraid of the deflationary consequences of removing accommodation too early but they cannot ease monetary policy much from here. This creates an asymmetric payoff in favor of stocks versus safe-haven securities. However, my favorite asset class for the near future is cash. Granted, I enjoy the luxury of not having to track a benchmark and my core focus is capital preservation. With both stocks and bonds richly valued, I see no margin of safety and I would rather stand on the sidelines. The longer-term outlook is particularly concerning. The extraordinary accommodation implemented this year was unavoidable, but its future consequences worry me greatly. Real rates have never been so low and we are leaving unprecedented public debt loads to our children and grandchildren. Moreover, I fear further adoption of populist policies because inequalities have risen in the wake of the crisis. The worst affected families stand at the bottom of the income distribution while people like me have benefited from inflated asset prices. Therefore, I am inclined to believe that we will suffer a large inflation shock in the coming decade. The global broad money supply has exploded and it is very unlikely that central banks will normalize interest rates in due time because of the burden created by gigantic public debt loads and the spectrum of further populism. My worries extend beyond these obvious concerns. Last year I was already anxious about the incredibly large stock of global debt with negative yields. This situation has only worsened since. Moreover, the various programs implemented by the Federal Reserve, the European Central Bank and other major monetary authorities to provide liquidity directly to the private sector at the apex of the crisis have prevented the purge of unhealthy firms necessary under a capitalist system. Instead of creative destruction, zombification has become the norm. Thus, I fear that more capital is misallocated than at any point in the past 10 years. Putting it all together, my expectations are that real returns will be poor for years to come, if not outright negative. I therefore believe that gold should stand at the core of my family’s portfolio. Ms. X: I share many of my father’s concerns. It is difficult to see how monetary and fiscal authorities will normalize policy. Hence, I agree that we will face the painful legacy of a large debt overhang and poor long-term returns. Moreover, the poor demographic profile in most advanced economies as well as China bodes ill for trend growth. I do see opportunities within this bleak picture. Healthcare stocks should benefit from an aging of the world’s population and tech equities will remain a source of disruption, innovation and profit growth in the coming decades. Thus, an equity portfolio built around these themes should generate positive real returns. In light of the positive vaccine news, next year will offer investors with both rapidly expanding profits and low discount rates and it is hard to imagine equities performing poorly. BCA: Clearly, we have many things to discuss. We should start with the COVID-19 pandemic. The news that vaccines developed by Pfizer/BioNTech and Moderna are around 95% effective is very encouraging. The Oxford/AstraZeneca announcement also is a source of optimism, even if the trial results have been less clear-cut. Moreover, other vaccines are currently in the mass-testing stage. By next winter, approximately 1.5 billion people globally should have been vaccinated. These positives hide many issues. First, transporting the Pfizer and Moderna vaccines (particularly the one produced by Pfizer, which needs to be kept at -70°C) will be challenging, especially for poorer countries. Second, the mRNA technology used in these vaccines is new and its long-term impact is unknown. Hence, many people will be reluctant to take this shot, especially as the confidence in the safety of vaccines has declined among the general public. Only 58% of Americans said they would probably take a COVID-19 vaccine, a number that will rise once the vaccine is demonstrated but which still highlights the challenge (Chart 1). Third, the virus could mutate and render the current generation of vaccines ineffective. The recent news of such mutations in mink farms in Denmark is worrisome, especially as the new strain of the virus has already jumped back into the human population. Chart 1The Vaccine Blues
OUTLOOK 2021: A Brave New World
OUTLOOK 2021: A Brave New World
Our base case is that the vaccines will allow a progressive reopening of the economic sectors currently still under lockdown. They will lead to a further improvement in employment, consumer and business sentiment, and aggregate demand. With less fear of getting infected, consumers will return to shops, restaurants, hotels, etc. This will have a very beneficial impact on capex and profit growth. It will result in higher stock prices, especially for value stocks, cyclical stocks, as well as higher yields and commodity prices. Despite this optimistic base case, investors must have contingencies ready. The three aforementioned risks around the vaccines suggest that additional waves of infections cannot be entirely ruled out and that lockdowns may continue in 2021. Thus, we could still face periods of downward pressure on activity, yields, and value stocks. For now it remains prudent not to tilt portfolios fully toward a post-COVID bias. In contrast to the past 40 years, a 60/40 portfolio will fare poorly once we account for higher inflation. Even if the vaccines enjoy widespread adoption, near-term threats to economic activity remain. The realization that the end of the pandemic is close may prompt a temporary period where households hunker down and behave in a very conservative fashion. After all, few consumers will want to contract the virus just before a vaccine becomes available. Moreover, the sight of the end of the lockdowns reduces the fiscal authorities’ urgency to provide additional support to the population and small businesses. These two dynamics could prompt a deep contraction in spending in the first quarter of 2021, which would hurt stock prices. Mr. X: Thank you. While these near-term dynamics are crucial, the emergence of the vaccine increases the importance of discussing the long-term implications of the extreme policy conducted in recent months. BCA: The long-term implications of aggressive policy stimulus tie into the evolution of the debt super cycle. As a share of US GDP, total private debt has spiked near a record high and total nonfinancial debt has surged to new all-time highs (Chart 2). This reflects two phenomena. First, the denominator of the ratio – GDP – has collapsed. Second, total nonfinancial debt also highlights the rapid increase in government deficits. Hence, climbing leverage was a consequence of the necessary dissaving by the public sector to alleviate the deflationary forces created by the crisis. This problem is repeated around the world. As Chart 3 demonstrates, nonfinancial debt levels across the G10 are rapidly rising. Moreover, debt loads in emerging markets are also extremely elevated. Chart 2COVID-19 Boosted Debt Ratios
COVID-19 Boosted Debt Ratios
COVID-19 Boosted Debt Ratios
Chart 3Elevated Debt Everywhere
Elevated Debt Everywhere
Elevated Debt Everywhere
Going forward, either rising savings or faster nominal GDP growth will cause the debt ratios to decline. The first option is difficult; increasing savings is deflationary and it could worsen the debt arithmetic by keeping real interest rates stubbornly high. Moreover, it is politically unpopular, especially when the public sector has been the borrower. Here, we echo the words of Keynes from his 1923 Tract On Monetary Reform: "The progressive deterioration in the value of money through history is not an accident, and has had behind it two great driving forces – the impecuniosity of governments and the superior political influence of the debtor class (…). No state or government is likely to decree its own bankruptcy or its own downfall so long as the instrument of taxation by currency depreciation through the creation of legal tender (money) still lies at hand… The active and working elements (i.e., debtors) in no community, ancient or modern will consent to hand over to the rentier or bond holding class more than a certain proportion of the fruits of their work. When the piled up debt demands more than a tolerable proportion, relief has usually been sought in (…) repudiation (…) and currency depreciation." Nominal rates cannot fall further, while large inequalities and social immobility are fomenting populism (Chart 4). Moreover, the recent COVID-19 crisis has deepened the angst of the general population and its dissatisfaction with policymakers. It is therefore unlikely that voters will reward politicians who impose upon them the painful deflationary pressures that result from the high savings necessary to reduce public sector debt loads. Even a Republican-controlled US Senate will have to allow larger deficits than usual in today’s climate. Chart 4Inequalities And Immobility Are The Roots Of Populism
OUTLOOK 2021: A Brave New World
OUTLOOK 2021: A Brave New World
Instead, we expect fiscal and monetary policy to work in tandem to lift inflation and deflate the global debt load. The rising popularity of Modern Monetary Theory fits within this paradigm shift. MMT posits that as long as governments issue debt in their own currency, central bank money printing can finance the deficit. The only constraint on policymakers becomes the level of inflation that society tolerates. Society is likely to tolerate a rise in inflation. MMT is unpalatable to savers, but the majority of citizens are debtors, not lenders. In an MMT framework where the median voter is a borrower, the tolerance for inflation will likely be high, which will hurt the value of financial assets. Moreover, the corporate sector is unlikely to fight strongly against large deficits funded by central banks. If we accept the Kalecki Equation of Profits, which can be simplified as: Profits = Investment – Household Savings – Government Savings – Foreign Savings + Dividends then business profits will suffer if deleveraging takes hold, whether in the public or private sector. Instead, MMT-like policies, which will keep savings at low levels and prevent deleveraging, offers a way to keep nominal profits afloat. For businesses too, the path of least resistance steers toward higher inflation. Different countries will vary in their ability to pass MMT-like policies, but the policy shift toward inflationary policies is clear. The specter of rising populism should result in heavier regulation, at least in the EU and the US under the incoming Biden administration. Regulation further hurts the growth rate of the supply-side of the economy. It limits competition, it protects workers and it increases the cost of doing business. We expect additional fiscal stimulus will come through in the coming months. Beyond political forces, the demographic deterioration highlighted by Ms. X points in the same direction. An aging population means that the dependency ratio (the number of dependents per worker) is increasing. Moreover, analysis by the UN underscores that in old age, consumption increases due to rising spending on healthcare (Chart 5). We are therefore likely to witness a slowing expansion of the supply side relative to the demand side of the economy. By definition, this process is inflationary. In the second half of the decade, inflation could average as high as between 3% and 5%. Keep in mind that inflation is not a linear process. Once it starts to rise, it becomes very hard to control. In this regard, the experience of the late 1960s is extremely instructive. Through the 1960s boom, inflation was well behaved, contained between 0.7% and 1.2%. Then it started to rise in 1966, and quickly hit 6.1% by 1970 (Chart 6). While the average-inflation target the Fed recently adopted is well intentioned, in an environment where governments are unlikely to curtail deficits as fast as the private sector cuts its savings, it could easily unleash a long-term inflationary trend. Chart 5Aging Doesn't Spell Less Spending
Aging Doesn't Spell Less Spensing
Aging Doesn't Spell Less Spensing
Chart 6Inflation Is Stable Until It Is Not
Inflation Is Stable Until It Is Not
Inflation Is Stable Until It Is Not
Ms. X: Why won’t technological advancements such as AI and automation cause low inflation to prevail for the rest of the decade? Chart 7Low Productivity
Low Productivity
Low Productivity
BCA: The great paradox of this crisis is that the more deflationary risk we confront today, the more inflation we will face in the future. This relationship is the consequence of financial repression. Debt arithmetic will only stay manageable as long as real interest rates remain low; consequently, central banks will only be able to increase interest rates if nominal growth rises significantly from its low average of the past decade. Both workforce and productivity growth are low, thus quicker inflation is the only solution. As you hinted, technology is a risk to our long-term inflation view. However, technology has most often been a deflationary force. The key question is whether we are experiencing a greater impact than normal on productivity from current technological developments. So far, the answer seems to be no. Even if the statistical estimation methods for GDP overestimate inflation and thus underestimate productivity, we are still nowhere near the kind of productivity gains registered in the post-WWII period or at the turn of the millennium. We remain much closer to the productivity recorded in the 1970s or early 1980s (Chart 7). As a result, we expect technology not to be enough of a game changer to undo the inflationary effect of the shift away from the pro-capital, deregulatory, pro-global-trade consensus that prevailed for the past forty years. Ms. X: Your view rests on an assessment that political forces are structurally moving toward populism. Doesn’t the most recent US election counter this argument? Was it not a victory of centrism over populism? Chart 8AValuations Point To Poor Long-Term Returns
Valuations Point To Poor Long-Term Returns
Valuations Point To Poor Long-Term Returns
Chart 8BValuations Point To Poor Long-Term Returns
Valuations Point To Poor Long-Term Returns
Valuations Point To Poor Long-Term Returns
Chart 8CValuations Point To Poor Long-Term Returns
Valuations Point To Poor Long-Term Returns
Valuations Point To Poor Long-Term Returns
Chart 8DValuations Point To Poor Long-Term Returns
Valuations Point To Poor Long-Term Returns
Valuations Point To Poor Long-Term Returns
BCA: It was a victory of moderation over populism, but it was a narrow victory that reveals powerful populist undercurrents, particularly the strong demand for economic reflation. Despite a pandemic and recession in the election year, President Trump narrowly lost in the key swing states, and managed to garner roughly 74 million votes, the second highest tally in history. Moreover he led the Republican Party to gain seats in the House of Representatives and (likely) to retain control of the Senate. Exit polls reveal that the economy was still the number one issue on voters’ minds – they rejected Donald Trump’s personality but embraced his “growth at any cost” approach. By the same token, the Democratic Party lost elections down the ballot because they became associated with lockdowns and revolutionary social causes. President-Elect Joe Biden won the election, first, by not being Donald Trump, and second, by campaigning on a larger government spending program, a moderately liberal social stance, and a less belligerent protectionism on trade and China. The fact that both candidates wanted large stimulus packages and infrastructure programs tells us something about the median voter’s stance on economic policy: it is reflationary. Going forward, if Republicans control the Senate then the Biden administration will have to appeal to moderate Republican senators to get enough votes for COVID relief and economic recovery. If Democrats gain control of the Senate on January 5, they will have a one-vote majority and their legislative agenda will depend on winning over moderate Democratic senators. The Republican scenario is less reflationary but more likely, while the Democratic scenario is more reflationary but less likely. What investors can count on in 2021 is that the US government will not enact the mammoth splurge of government spending but that Republican senators will also be cognizant of the need for some fiscal support. Mr. X: If you expect inflation to rise structurally, how should we position our portfolio on a long-term basis? Bonds will obviously suffer, but so will an extremely expensive equity market that requires low bond yields to justify current prices. It seems like there is nowhere to hide but gold. BCA: The next one to two decades will not look like the past four, which were extraordinarily rewarding for investors. The taming of inflation, the broadening of globalization and far-reaching deregulation both cut interest rates and boosted profit margins. These trends stimulated demand and lifted asset valuations. These dynamics fed exceptional returns for all financial assets. However, these tailwinds have dissipated. The Fed will look through next year’s temporary inflation rebound. This change has many important implications for portfolio construction. You are correct that it will be hard for equities to generate decent real returns in the coming decade. Valuations may be a poor gauge of immediate stock returns, but they are clearly correlated with long-term returns (Chart 8). The odds of higher inflation in the second half of the decade will eventually cause policymakers to raise interest rates and force a normalization of equities multiples. Moreover, greater regulation and rising populism will raise the share of GDP absorbed by wages. Profit margins are likely to decline from here (Chart 9). Chart 9Profit Margins Under Threat?
Profit Margins Under Threat?
Profit Margins Under Threat?
Despite the poor long-term outlook for real stock returns, equities should still outperform bonds. Over the past 150 years, shares beat bonds in each episode of cyclically rising inflation, even if stocks generate paltry inflation-adjusted returns (Table 2). This time will not be different. Equities are significantly cheaper than bonds. Based on the current level of bond and dividend yields, US, Eurozone, UK and Japan bourses need to fall in real terms 23%, 32% 50% and 20%, respectively, over the next 10-year to underperform local government bonds (Chart 10). Additionally, the duration of bonds is very high due to their extremely low yields, which means that bond prices are exceptionally sensitive to rising rates. Table 2Stocks Beat Bonds, Part I
OUTLOOK 2021: A Brave New World
OUTLOOK 2021: A Brave New World
In contrast to the past 40 years, a 60/40 portfolio will fare poorly once we account for higher inflation. During the period from 1965 to 1982, when US core CPI inflation rose from 1.2% to 13.6%, the 60/40 portfolio lost 30% of its value in real terms (Chart 11). Moreover, the portfolio started to suffer poor inflation-adjusted returns well before inflation moved into double digits. As soon as CPI accelerated in 1966, the standard portfolio began to lose value. This time, inflation will not reach the dizzying height of the late 70s, but equities are trading at price-to-sales, price-to-book or Shiller P/E 33% above that of 1965 and Treasury yields stand at 0.88%, not 4.65%. Chart 10Stocks Beat Bonds, Part II
Stocks Beat Bonds, Part II
Stocks Beat Bonds, Part II
Chart 11The 60/40 Portfolio Doesn't Like Inflation
The 60/40 Portfolio Doesn't Like Inflation
The 60/40 Portfolio Doesn't Like Inflation
The problematic long-term outlook for the 60/40 portfolio will demand greater creativity from investors than over the past 40 years. We like assets such as farmland, timberland, and natural resources as inflation hedges. We also like precious metals. Silver is particularly attractive; like gold it thrives from rising inflation, but unlike its yellow counterpart, silver trades at a discount to its fair value implied by the long-term trend in consumer prices (Chart 12). Industrial metals are also interesting; the effort to reduce carbon emissions will hurt fossil fuel prices but will require greater reliance on electricity. Hence, the demand for copper will stay robust while investments in extraction capacity have been poor for the last decade. Silver, a great electricity and heat conductor, will also benefit from this trend. Chart 12Silver Is Cheaper Than Gold
Silver Is Cheaper Than Gold
Silver Is Cheaper Than Gold
Within equity portfolios, winners and losers will also change. Empirically, technology, utilities and telecom services underperform when inflation rises durably. On the other hand, healthcare, materials and real estate outperform. The first group does not possess much pricing power in an accelerating CPI environment while the second does, justifying the bifurcated relative performances. We recommend tilting long-term equity exposure this way. Finally, this sectoral view implies a structural overweight in Europe and Japan at the expense of the US and emerging markets. Mr X: Thank you. This discussion about long-term risks and portfolio construction was very useful. That being said, the thought of MMT becoming more mainstream leaves me extremely uncomfortable. The Economic Outlook Ms. X: From your observations on the vaccine rollout, I presume you expect the recovery to remain robust next year. Aren’t you concerned that a big part of the G-10 could experience a double dip recession in the first half of the year? BCA: Near-term risks are very elevated and it is likely that Europe is experiencing a renewed slump in activity as we speak. In response to the recent violent second wave of infections, consumers have avoided public spaces and governments across the continent and in the UK have implemented increasingly stringent lockdowns. Various high-frequency indicators and live trackers for the regions already indicate that another contraction in activity is taking place (Chart 13). The US is not immune to a slowdown. The country is in the thrall of its third wave of infections and local governments are increasingly imposing lockdowns. Just look at New York City, which is somewhat of a canary in the coalmine for the nation, where schools have closed. This development is happening as the economy was already slowing down after a blistering recovery in the third quarter. Naturally, the US economic surprise index is quickly declining, which indicates that economic data is falling short of expectations (Chart 14). Chart 13The European Economy Is Slowing Right Now
The European Economy Is Slowing Right Now
The European Economy Is Slowing Right Now
Chart 14The US Economy Is Decelerating
The US Economy Is Decelerating
The US Economy Is Decelerating
Growth is slowing but the level of US GDP is not doomed to contract. First, inventory restocking could add as much as 3.5% to current quarter GDP. Second, consumer spending is still robust. This summer, household savings jumped massively in response to both the large transfers created by the CARES act as well as the low marginal propensity to spend caused by depressed consumer confidence. Now, consumers are deploying this large pool of funds, which is buttressing expenditures. Despite these short-term headwinds, growth in 2021 should be well above trend in the US and in Europe. The ECB Target II balance permanently attaches Germany to its weaker neighbors. Mr. X: What about the risk that a lack of fiscal stimulus could scuttle the recovery? BCA: We are not overly concerned about that as we expect additional fiscal stimulus will come through in the coming months. Chart 15Borrowing Costs Are Not A Constraint To Spending
OUTLOOK 2021: A Brave New World
OUTLOOK 2021: A Brave New World
In Europe, the case for additional fiscal support is clear. All the major euro area countries, including Greece, can borrow at negative interest rates, depending on the maturity (Chart 15). This too is true for Sweden, Switzerland and even the UK. Within the Eurozone, the issuance linked to the European Commission’s Recovery Fund represents the first wave of common-debt issuance. It is an embryonic tool for fiscal risk sharing, one that goes further than the European Stability Mechanism, and it is an important driver of the spread compression in the European bond market. European governments are under little pressure to apply any fiscal brake because of these low borrowing costs. Moreover, the various European central banks are buttressing government bond markets. Thus, fiscal authorities have a free hand to provide additional support if they choose to do so while lockdowns remain in place. The loose fiscal setting will allow activity to recover quickly. In the US, the situation is more complex, but we expect at least a minimal level of support. The gridlock in Washington prevents the large stimulus that would have passed under a unified Democratic control of Congress. However, a Biden administration faced with a Senate controlled by the GOP also cannot increase taxes significantly. Meanwhile the Republicans are willing to provide additional help as long as it targets households and small businesses. Netting these forces out, we expect a stimulus package of $500 billion to $1 trillion. This is smaller than the various offers on the table prior to the election, but the more concrete eventuality of a vaccine deployment in the first half of 2021 also means that the economy needs help for a shorter period. While the risk to the forecast is that the Democrats and the Republican reach a larger compromise, investors may have to wait months for a deal. This delay could magnify the underlying weakness in the US economy. Chart 16The Chinese Locomotive Is Intact
The Chinese Locomotive Is Intact
The Chinese Locomotive Is Intact
In Japan, the law prescribes a negative fiscal thrust of –7.1% of GDP. We doubt this will transpire. Prime Minister Suga does not want to kill a nascent recovery and feed powerful deflationary pressures. Hence, supplementary budgets will provide more support to growth. Ms. X: Last year, we spoke a lot about China as an important driver of the global manufacturing cycle and growth. Is this still the case? BCA: China remains an important factor supporting our positive stance on global growth in 2021. Thanks to the aggressive use of testing and tracing, China has contained the virus, which is letting the economy heal and respond normally to monetary policy. On this front, the lagged impact of the easing enacted since 2019 will continue. Total social financing flows have rebounded to 33% of GDP and are consistent with a further improvement in our China Activity Indicator (Chart 16). Strengthening Chinese cyclical spending will lift imports of raw materials and machinery. The uptick in the Chinese credit and fiscal impulse suggests that China will remain a positive force for the rest of the world until the second half of 2021. After the summer, the positive impact of China on global growth will ebb. The PBoC is already allowing market interest rates to increase, which suggests that the apex of the credit easing was reached in Q4. Nonetheless, President Xi Jinping cannot tolerate any kind of instability ahead of the 100th anniversary of the CCP in October 2021. Thus, the fiscal and monetary policy tightening will be calibrated before that date and will only become a major risk afterwards. As a result, global growth will enjoy its maximum contribution from Chinese demand around Q2 2021. After that, Chinese activity will still be high enough to keep global industrial production elevated, but not enough to cause a further acceleration. Chart 17China's Marginal Propensity To Consume Augurs Well
China's Marginal Propensity To Consume Augurs Well
China's Marginal Propensity To Consume Augurs Well
Another good news for the Chinese and global economies is the recent pickup in China’s marginal propensity to consume (MPC), as approximated by the gap between the growth rate of M1 and M2 money supply (Chart 17). When M1 accelerates faster than M2, demand deposits are growing quicker than savings deposits, which highlights that economic agents are positioning their liquidity for increased spending. The MPC’s uptick will reinforce the positive signal for global economic activity from China’s credit trend. It also creates upside risk for China’s economy in the second half of the year compared to what policy dynamics imply. Ms. X: Beyond China and fiscal policy, do you foresee any other tailwinds for the global business cycle? BCA: Yes, there are plenty. As we already mentioned, the vaccine should allow the service sector to normalize progressively over the course of the year. Households’ healthy balance sheets will underpin US consumer spending next year. At the end of 2019, debt to disposable income stood at an 18-year low and the debt servicing-costs ratio was near generational troughs. In addition, both of these measures of financial health only improved during the crisis. Collapsing interest rates allowed households to refinance their mortgages and government transfers boosted disposable income. Likewise, after a very negative shock in Q1, household net worth quickly rebounded in Q2 when asset prices surged and household savings grew (Chart 18). The wealth effect will therefore help consumption, especially because employment continues to improve. The odds of higher yields are most pronounced for longer maturities. The outlook for capex is also bright. Capex intentions have been surprisingly robust in recent months and core durable goods shipments have reached all-time highs (Chart 19). Admittedly, capex is a lagging economic variable – companies take their cues from the behavior of households. But, this means that, as household spending continues to recover, so will capital investment. Another way to approach this topic is to think about the link between capex and corporate profitability. In capital budgeting, the pecking order theory argues that retained earnings are the preferred source of financing for corporate investments. This theory is echoed by empirical evidence. Business capital formation follows operating profits by roughly six months (Chart 20). The positive outlook for profits therefore bodes well for capex. Chart 18Solid Household Balance Sheets In The US
Solid Household Balance Sheets In The US
Solid Household Balance Sheets In The US
Chart 19Surprising Capex Rebound
Surprising Capex Rebound
Surprising Capex Rebound
Chart 20Earnings Drive Capex
Earnings Drive Capex
Earnings Drive Capex
A major concern for the US economy is commercial real estate. This sector’s losses will likely be very large because many buildings are now uneconomical. Even if vaccines normalize daily activities, post-pandemic life has in some ways been reshaped. Workers are likely to conduct more of their job from home and shoppers have become used to the convenience of E-commerce. As a result, the need for office and retail space will decrease, which falling rents are already reflecting. The hit to the US banking system is still unknown. While CRE accounts for 13% of bank assets, this exposure is concentrated within smaller regional banks, which are much frailer than their SIFI counterparts (Chart 21). We could therefore see some localized troubles within a banking system that is tightening credit standards already (Chart 22). This danger warrants close monitoring. Chart 21CRE Is A Threat For Small Banks
CRE Is A Threat For Small Banks
CRE Is A Threat For Small Banks
Chart 22Another Tightening In Standards Would Be Dangerous
Another Tightening In Standards Would Be Dangerous
Another Tightening In Standards Would Be Dangerous
Chart 23Europe Is More Exposed To Chinese Demand
Europe Is More Exposed To Chinese Demand
Europe Is More Exposed To Chinese Demand
It is not clear whether the US or the euro area will enjoy the sharpest growth improvement in 2021. Normally, Europe benefits the most during a manufacturing upswing, especially when China’s marginal propensity to consume is expanding (Chart 23). The European economy is more cyclical than that of the US because exports and manufacturing constitute a larger share of employment and gross value added (Chart 23, bottom panel). Moreover, the fiscal drag in Europe is likely to subtract roughly 3% from GDP next year while it could subtract 5% to 7% from the US GDP. However, an important handicap will counterbalance these advantages for Europe; the biggest source of economic delta next year should be the service sector because spending on goods began to recover in earnest in 2020. There is simply more pent-up demand left in services than goods and the service sector accounts for a larger share of output in the US than in Europe. Three additional factors could also favor the US against both Europe and Japan. First, residential activity is rebounding more quickly in North America. Historically, residential investment makes a large contribution to cyclical expenditures and it galvanizes additional spending on durable goods. Second, the Fed was able to engineer deeper declines in real interest rates than the ECB or the BoJ while Washington expanded the deficit faster than Tokyo or most European capitals. Finally, the weak dollar is creating another relief valve unavailable to Japan and Europe. In fact, the euro’s strength is potentially the greatest dampener of the European recovery in the coming quarter. Finally, emerging economies face important domestic hurdles that will handicap them significantly versus advanced economies in the first half of the year. EM banking systems remain fragile after the violent capital outflows witnessed in the first half of 2020. Thus, their ability to expand credit is comparatively limited. Moreover, EM economies have yet to withstand the inevitable second wave of infections, and their healthcare systems are even weaker than in advanced economies. The logistical complications associated with the rollouts of the vaccine will be most acute in poorer countries. Mr. X: I share your worries about long-term inflation, but where do you stand regarding near-term dynamics? A faster inflation recovery would amount to the kiss of death for asset markets. BCA: You are correct that faster inflation would threaten asset markets. It would force a rapid re-pricing of the Fed’s policy path and lift yields higher. Expensive stocks would buckle under this impulse. However, while it is a risk we monitor closely, it is far from our base case. We particularly like real yield curve steepeners. To begin with, both the output gap and the unemployment gap will remain meaningful in 2021. Our US Composite Capacity Utilization Indicator is not consistent with higher inflation (Chart 24). Additionally, at 6.9%, the US unemployment rate understates the amount of slack in the labor market. The employment-to-population ratio for prime-age workers offers a more accurate read of the labor market because it accounts for discouraged workers. This labor market indicator points toward limited inflation in the Employment Cost Index (Chart 25). Chart 24Limited Immediate Inflationary Pressures
Limited Immediate Inflationary Pressures
Limited Immediate Inflationary Pressures
Chart 25The Labor Market Is Replete With Slack
OUTLOOK 2021: A Brave New World
OUTLOOK 2021: A Brave New World
Inflation is still likely to spike in the first half of the year, but this jump will prove temporary. In the second quarter, both the core CPI and the core PCE inflation will incorporate a strong base effect when annual comparisons include the extremely depressed numbers that prevailed at the nadir of the recession. Moreover, once the service sector reopens in response to broadening vaccination programs, service sector inflation could pop higher, as goods prices did once the goods sector reopened last summer. The base effect will quickly ebb and the initial surge in service inflation should also dissipate because shelter inflation will remain dampened by stubborn permanent unemployment (Chart 26). The Fed will look through next year’s temporary inflation rebound. Its new average inflation target officialized last September is designed to avoid this kind of premature response and Fed officials are currently more afraid of committing deflationary errors than inflationary ones. Markets understand this well. Hence, as long as inflation breakeven rates remain below the 2.3% to 2.5% band consistent with market participants believing in the Fed’s ability to achieve 2% inflation durably (Chart 27), market wobbles caused by higher inflation will create buying opportunities. Chart 26Shelter Inflation Will Remain Downbeat
Shelter Inflation Will Remain Downbeat
Shelter Inflation Will Remain Downbeat
Chart 27The Fed Monitors Inflation Expectations
The Fed Monitors Inflation Expectations
The Fed Monitors Inflation Expectations
One factor could cause inflation to start moving durably higher than our base case anticipates. So far, money supply is behaving very differently than in the wake of the GFC. Back then, the Fed aggressively expanded its balance sheet, but the private sector’s deleveraging compressed money demand. Consequently, the Fed’s money injections stayed trapped in the banking system where excess reserves swelled. Broad money growth was tepid and the money multiplier collapsed. Today, the private sector is not deleveraging and M2 has surged at its fastest pace since 1944. Thanks to this lack of monetary bottlenecks, real interest rates fell much faster than in 2008/9 even if the nominal Fed Funds rate dropped to zero in both instances (Chart 28). Monetary conditions are therefore much more accommodative than they were 12 years ago. Another consequence of a functioning monetary system is that the broad money supply’s advance is outstripping the Treasury’s issuance. Historically, when money supply grows quicker than government debt, inflation emerges (Chart 29). We are tracking the velocity of money closely to gauge whether this risk is morphing into reality. Chart 28Policy Is More Accommodative Than During the GFC
bca.ems_ctm_2024_04_29_c6
Policy Is More Accommodative Than During the GFC
Policy Is More Accommodative Than During the GFC
Chart 29An Inflationary Risk
An Inflationary Risk
An Inflationary Risk
Ms. X: Before we move on to asset market forecasts for 2021, I would like to hear your thoughts on Brexit and the extraordinary showing of European unity last summer. BCA: We came very close to ending the Brexit transition period without a free-trade agreement between the UK and the EU. First, PM Boris Johnson had been under attack from the right wing of the Conservative party. In response, his government ramped up the hard rhetoric in recent months. However, the negative impact on the British economy in the absence of a free trade agreement with the EU was always a binding constraint on the PM. Hence, the tough rhetoric was mostly bluster and negotiation tactic with Brussels. Second, the electoral defeat of President Donald Trump in the US means that the UK is unlikely to receive preferential treatment from the US if it cannot reach a trade deal with the EU. The UK would be on its own, especially because President-Elect Joe Biden is likely to side with the EU, with whom he wants to rebuild a relationship. On the EU side, it is highly unlikely that Berlin will let French demands on fishing rights threaten its capacity to sell to its 5th export market. Thus, we expect a deal to come to fruition imminently. The move toward fiscal integration in Europe is also crucial beyond its near-term bullish impact on Italian, Spanish or Portuguese bonds. Jean Monnet, one of the architects of the 1951 Treaty of Paris that created the European Coal and Steel Community (the EU’s embryo), famously wrote in his memoirs that: “Europe will be forged in crises, and will be the sum of the solutions adopted for those crises.” We witnessed these dynamics last summer. The EUR750 billion Recovery Fund created by the European Commission to help economies struggling with the pandemic will issue its own bonds. It is the first step toward a permanent common bond issuance mechanism and fiscal risk sharing in the euro area. As expensive as stocks may be in absolute terms, the monetary and yield backdrop creates a large enough buffer for now. The experience of last decade’s euro crisis shows that temporary solutions often become permanent features of the EU, even if its treaties originally forbade them. The latest move will be no exception. The euro is popular; it is supported by 83%, 60%, 72%, 76% and 82% of the Spanish, Italian French, Dutch and German populations, respectively (Chart 30). Moreover, German support for the euro is particularly important. Germany’s current account surplus equals 7% of GDP because of the euro. The euro is a lot weaker than the Deutsche mark would be, which boosts German exporters’ competitiveness in international markets and within the euro area. Without the common currency, German cars would be much more expensive in France, Italy or China than they are today. Chart 30The Glue That Binds Europe Together
The Glue That Binds Europe Together
The Glue That Binds Europe Together
Likewise, the ECB Target II balance permanently attaches Germany to its weaker neighbors. Italy and Spain owe EUR 1 trillion to this settlement system while Germany is owed EUR915 billion. If Italy or Spain were to go bankrupt or to leave the euro and redenominate their debt in lira or pesetas, the resulting hit would threaten the viability of the German banking system (Chart 30, bottom panel). Chart 31Competitiveness Convergence
Competitiveness Convergence
Competitiveness Convergence
The past competitiveness problems of the European periphery are also steadily diminishing. Compared to Germany, harmonized unit labor costs in Italy or Spain have fallen 15% since 2009 and are not far from the levels prevailing at the introduction of the euro in 1999 (Chart 31). Consequently, current account deficits in Spain and Italy are narrowing considerably. Germany’s euro benefits, the tie created by the Target II imbalances and the periphery's improved competitiveness only bring Europe together and they allow the COVID-19 crisis to force a closer union. While these developments have little implication for Europe’s growth next year, they constitute a major long-term positive because they will curtail the cost of capital in the periphery and permit the sharing of funds necessary to build a lasting monetary union. Ms. X: To summarize; at the beginning of 2021, global growth should remain volatile. However, the recovery will ultimately strengthen over the remainder of the year thanks to the rollout of vaccines, the sustained fiscal support across major economies, the continued positive impact of China’s economic healing, and the strength of household balance sheets. Capex will remain robust as well, even if commercial real estate is a dangerous spot that we must monitor. Moreover, it is too early to ascertain whether the US or the EU will experience the strongest recovery in 2021, but emerging economies should lag behind. In addition, while you are concerned about the long-term inflation risk, consumer prices should not experience a durable pickup this year. Likewise, you foresee a benign outcome to the UK-EU trade negotiations and are positive on European integration. BCA: Yes, you summed it up nicely. Bond Market Prospects Ms. X: I find the Treasury market very puzzling right now. On the one hand, demanding valuations of US government bonds worry me, particularly in light of the upbeat economic outlook for 2021. On the other hand, if inflation remains low and the Fed is unlikely to push up rates until 2022 at the earliest, the upside for yields should be limited. BCA: We recommend a below-benchmark duration for fixed-income portfolios with an investment horizon of 12 months or so. Valuations partially underpin this recommendation. Our Global and US Bond Valuation Indices highlight that government bonds are at the level of overvaluation that, over the past 30 years, often produce a negative return in the following 12 months (Chart 32). However, valuations only indicate the degree of vulnerability of an asset but they rarely trigger price moves. Instead, timing most often relies on cyclical and technical factors. Favor cyclical equities relative to defensive ones. Cyclical forces are increasingly negative for bonds. In the US, our BCA Pipeline Inflation Indicator has perked up. It is not pointing toward an imminent rise in inflation but it suggests that deflationary risks are ebbing, something BCA’s Corporate Pricing Power Proxy also captures (Chart 33). A removal of the left-tail risk in CPI should push up yields, especially as our BCA Nominal Cyclical Spending Proxy is also firming, which normally happens ahead of meaningful yield pickups (Chart 33, bottom panel). Chart 32Pricey Bonds
Pricey Bonds
Pricey Bonds
Chart 33Cyclical Risks For Bond Prices
Cyclical Risks For Bond Prices
Cyclical Risks For Bond Prices
Chart 34Investors Will Want Protection Against Inflation Uncertainty
Investors Will Want Protection Against Inflation Uncertainty
Investors Will Want Protection Against Inflation Uncertainty
The odds of higher yields are most pronounced for longer maturities. First, our central forecast expects a significant rise in inflation in the latter part of the decade. Second, monetary and fiscal policy will remain very accommodative over the coming years even as private demand increases, which will lift medium- to long-term inflation uncertainty. Rising inflation uncertainty usually facilitates a steepening of the yield curve (Chart 34). Despite these forces, the upside to yields will prove limited in 2021. The Fed’s new inflation target means that it will be patient, and waiting for core PCE inflation to move sustainably above 2% could take time. The US central bank is therefore unlikely to increase interest rates for many years. This inertia limits the immediate upside in Treasury yields, but does not preclude it. While the Fed will not be quick to lift off, its forward interest rate guidance is not going to get any more dovish and the bond market is already pricing-in the first rate hike for late 2023. This expected liftoff date will be brought forward as the economy recovers, meaning that long-maturity nominal yields, real yields and inflation breakeven rates all have moderate upside. The recent equity market leadership of growth stocks is another limiting factor for higher yields. Growth stocks are extremely sensitive to long bond yields. If the latter back up too fast, it will scuttle bourses and unleash risk aversion and deflationary pressures. This creates an upper bound on the speed at which yields can move up. Mr. X: Even with their limited room to fall in the near term, the meaningful long-term and valuation risks of bonds make them so unappealing to me that I refrain from using them as near-term portfolio hedges. How can I protect my equity holdings right now? BCA: Hedging near-term risks to stocks has become one of the most hotly discussed topic with our clients because investors are witnessing the increasingly asymmetric payoffs of bonds. When equity prices rise, bond prices typically decline, but when stocks correct, bond prices barely rally. This newfound behavior of safe-haven bonds is a consequence of global policy rates having moved to or near their lower bound. We increasingly like small-cap firms relative to large-cap ones. For non-US based investors, there is a simple solution to this problem: parking some funds in US cash because the USD still acts as an effective hedge against market corrections. For US-based investors, finding adequate protection is more challenging. Those who can short and use leverage should sell currency pairs with an elevated sensitivity to changes in risk aversion, such as the EUR/CHF, AUD/JPY or MXN/JPY, to achieve some protection. Otherwise, holding cash to buy back stocks at lower levels remains an appropriate strategy. Mr. X: Which government bond market do you like most, or more accurately, which one should I avoid most right now? BCA: At the moment, we prefer the European periphery. The valuation ranking we often use when we see you is clear: Portuguese, Greek, Italian or Spanish bonds are the cheapest while German Bunds and US T-Notes are exceptionally expensive (Chart 35). Real bond yields confirm this estimation. Additionally, the nascent fiscal risk-sharing created by the European Commission’s Recovery Fund should result in declining breakup risk premia embedded in peripheral bonds. Furthermore, the ECB’s asset purchases are set to rise in response to Frankfurt’s efforts to fight off the deflationary effect of both the euro’s appreciation and the second wave’s lockdowns. Chart 35The Value Is In Europe’s Periphery
OUTLOOK 2021: A Brave New World
OUTLOOK 2021: A Brave New World
We are more negative on US Treasuries than Bunds. The valuation difference between the two safe havens is minimal. However, in 2020 the US has been more reflationary than Europe and the recent decline in the USD should lift US inflation relative to Germany’s, which will widen yield differentials in favor of Bund prices (Chart 36). Besides, the US economy has a higher potential GDP growth than Europe, which warrants a superior neutral rate of interest. Consequently, investors should expect US real yields to rise relative to the euro area’s benchmark. Outside of these markets, dedicated fixed-income investors should also overweight JGBs within their portfolio. JGBs have a low yield beta, which will limit their price declines if global yields move up. If the global recovery peters off, this feature will not create a major handicap because global yields have limited room to fall from here. Moreover, Japanese bonds are the cheapest safe haven (Chart 37). Chart 36Bunds vs Treasuries: Follow The Inflation Gap
Bunds vs Treasuries: Follow The Inflation Gap
Bunds vs Treasuries: Follow The Inflation Gap
Chart 37JGBs Are The More Attractive Safe Haven
OUTLOOK 2021: A Brave New World
OUTLOOK 2021: A Brave New World
We are neutral Canadian and Australian bonds. Historically, Canadian and Australian yields tend to have high betas to US T-Note yields. However, the BoC and the RBA are very active purchasers in their domestic markets, which will dampen the volatility of Canadian and Australian bonds. Ms. X: Considering the limited scope for major interest rate moves next year, what are your high-conviction trades for fixed-income portfolios? BCA: Within US government bond markets, we like curve steepeners. We also recommend positioning for rising inflation expectations by going overweight TIPS relative to nominal Treasuries. We particularly like real yield curve steepeners (within the TIPS curve). The cost of short-maturity inflation protection is below that of long-maturity protection, which means that short-term inflation breakeven rates have more upside as core PCE returns to the Fed’s target. A TIPS-curve steepener benefits from both a flattening of the inflation breakeven curve and a steepening of the nominal Treasury curve. It is therefore a high-octane play on both our favored strategies. We like both Europe and Japan. Within US corporate credit, we are currently overweight investment grade and Ba-rated high-yield bonds. However, valuation at the upper-end of the credit spectrum heavily favors tax-exempt municipal bonds over corporates. Investors that can take advantage of the tax exemption should prefer munis over investment grade corporates. Elsewhere, we are underweight MBS as pre-payment risk is elevated, but we like consumer ABS due to the strong position of household balance sheets. Ms. X: Before we moved on to equities, where do you stand on EM credit? Do you expect any global search for yield to push EM bond prices higher? BCA: With a few exceptions like Mexico and Russia, we prefer US corporate bonds to dollar denominated EM bonds of similar credit quality. EM bonds offer poorer value, but EM spreads will continue to evolve in line with US corporate spreads. Because of this directional correlation, our preference for US investment grade bonds translates to EM bonds as well. Our more circumspect attitude toward EM high-yield bonds also reflects our more conservative stance on US high-yield bonds. For local-currency rates, we are receivers in the swap market because the near-term outlook for EM currencies is difficult. Most EM countries have a deflation problem, not inflation troubles. Hence, real and nominal rates in emerging economies will fall as central banks try to stimulate their economies. These declines will be positive for the local-currency performance of EM bonds but it will hurt their currencies. Over the next twelve months, this challenge will be most pronounced against non-US DM currencies. In the short-term, this hindrance will also exist against the USD because the Greenback should rebound temporarily, something we can discuss in more detail in our chat about the currency and commodity markets. Our favorite bets are to receive Mexican, Colombian, Russian, Indian, Chinese and Korean swap rates. Mr. X: I agree that the case to make a major duration bet next year is limited, but risks are slightly skewed toward upside for yields. I am a little surprised that you like European peripheral bonds so much and yet prefer Bunds to Treasuries. I will have to digest your view on EM bonds because I would have bought EM currencies outright. Finally, I find your real yield curve steepener idea extremely intriguing. Thank you for giving me ideas to ponder. Now, shall we move to next year’s equity outlook? Equity Market Outlook Chart 38The Bubble Can Grow
The Bubble Can Grow
The Bubble Can Grow
Mr. X: I am a firm believer that growth stocks, tech in particular, are in a massive bubble. My daughter tries to convince me that we cannot generalize. Yet, both my gut and my brain tell me to seek refuge in value stocks. I appreciate that the outlook for tech stocks hinges on the evolution of monetary policy. Nonetheless, I think that any small shock can topple the so-called FANGs because they are so expensive and over-owned. I fear that where the FANGs go, so will the market. BCA: We have recently published a report broaching the question of bursting bubbles. When real interest rates are negative, when money supply is expanding at a double digit pace and when the Fed is extremely reluctant to tighten policy, the chances that a bubble will deflate are extremely low, even if stocks are furiously expensive (Chart 38). Beyond monetary tightening, an escalation in the supply of financial instruments also caused some bubbles to deflate. For example, an increase in the number of tulips following a harvest contributed to the end of the tulip mania. Bubbles from the eighteenth century, such as the South Sea Bubble and the Mississippi Company Bubble, followed stock issuances or regulatory changes. Even during the tech bubble, the large IPOs of the late 1990s added to the supply of securities available to investors. Right now, we are not witnessing this surge in supply. Buybacks, which are a contraction in supply, have acted as a key fuel to the bubble in the tech sector. Moreover, dominant tech titans have built large moats around their businesses because they often rely on pronounced network effects, if they are not a network themselves. These monopolistic behaviors account for their large profit margins, but they also prevent the emergence of viable competitors in the near term. Meanwhile, the mushrooming of Special Purpose Acquisition Companies (SPACs) is worrisome in the long-term. They are mostly vehicles to conduct backdoor IPOs of private firms. For now, they remain too small to topple the bubble. The real worry for tech investors is the eventual resurgence of inflation. During the tech bubble at the turn of the millennium, the rise in core CPI in early 2000 forced investors to discount more rate hikes, which toppled tech equities (Chart 39). As we discussed already, the outlook for inflation is benign for 2021, but if it were to change, tech stocks could fall in absolute terms. We expect tech names to underperform the S&P 500 over the next 12 months, but not to fall outright. This is akin to the experience of Japanese banks in the 1980s. In the first half of that decade, Japanese lenders stood at the forefront of the equity bubble. However, in the late 1980s, they lagged behind the rest of the Nikkei, even if they generated positive absolute returns (Chart 40). Chart 39Inflation Is The Threat To Tech Stocks
Inflation Is The Threat To Tech Stocks
Inflation Is The Threat To Tech Stocks
Chart 40Without Falling, Bubble Leaders Can Still Lag
Without Falling, Bubble Leaders Can Still Lag
Without Falling, Bubble Leaders Can Still Lag
Ms. X: I agree, it is hard to be too negative on stocks next year with the Fed standing firmly on the sidelines. What do you see as the market’s main driver in 2021 and what is the biggest risk to the outlook? BCA: Many important factors underpin global equities. First, we still are in the early innings of a new business cycle upswing. Statistically, bull markets most often end when earnings permanently decline. This observation means that equity bear markets rarely develop in the absence of recession (Chart 41). Chart 41Recessions And Bear Markets Travel Together
Recessions And Bear Markets Travel Together
Recessions And Bear Markets Travel Together
Second, as expensive as stocks may be in absolute terms, the monetary and yield backdrop creates a large enough buffer for now. The combination of our Valuation and Monetary Indicators remains in low-risk territory, which historically is consistent with positive absolute returns for the S&P 500 over the coming 12 to 18 months (Chart 42). However, the gap between the two indicators is narrower than it was last spring, which suggests that the easy market gains lie behind us. Another tool to think about valuations is the Equity Risk Premium. Our measure, which adjusts for the lack of stationarity of the ERP’s mean as well as for the expected growth of cash flows, is not as wide as it was in Q2 or Q3, but it remains congruent with positive prospective equity returns (Chart 43). Chart 42Monetary Policy Beats Valuations, For Now
Monetary Policy Beats Valuations, For Now
Monetary Policy Beats Valuations, For Now
Chart 43The ERP Points To Positive Stock Returns in 2021
The ERP Points To Positive Stock Returns in 2021
The ERP Points To Positive Stock Returns in 2021
Third, forward earnings estimates will rise further. The gap between the Backlog of Orders and the Customers’ Inventories subcomponents of the ISM survey indicates that earnings revisions will continue to climb from here (Chart 44). Additionally, our Corporate Pricing Power Proxy is back into neutral territory after having flashed dangerous deflationary pressures. Thanks to the operating leverage embedded in equities, improving selling prices can quickly push the bottom line higher (Chart 45). The rollout of vaccines next year will only feed these dynamics and help profit growth even further. Chart 44Room For Positive Earnings Revisions
Room For Positive Earnings Revisions
Room For Positive Earnings Revisions
Chart 45Less Deflation Is Good For Earnings
Less Deflation Is Good For Earnings
Less Deflation Is Good For Earnings
Fourth, our benign expectations for the credit market is consistent with both higher multiples and earnings. A well-functioning credit market is essential to risk taking and multiples. It also allows capex to remain well sustained and cyclical spending to expand. Both these forces are bullish for profits. Fifth, our negative stance on the dollar will ease global financial conditions. A weaker dollar pushes down the global cost of capital, which strengthens the global industrial cycle. Global stock markets overweight the industrial and goods sectors relative to the economy. Therefore, global bourses benefit from a weaker dollar. The greatest risk for stocks is an uncontrolled jump in bond yields, where 10-year Treasury yields climb above 1.2% in a short period, especially if real rates drive the leap. Too quick an adjustment in the cost of capital would threaten the ERP and it would hurt the multiples of growth stocks that are highly sensitive to fluctuations in the discount rate. Moreover, a rapid rise in borrowing costs would likely force a more precipitous deceleration in the housing sector, which is a key locomotive of the recovery. Another risk is that vaccine rollouts are delayed, which would rapidly sap growth expectations. Mr. X: Rather than taking a large net long exposure in equities, I would favor value stocks at the expense of growth stocks. The valuation gap between both styles is exceptionally wide, and value equities have not been this cheap on a relative basis since at least 2000, or more, depending on the indices used . As a result, they embed a much greater margin of safety than growth stocks, which makes me rest easier because I am less comfortable than you are about this equity bubble’s near-term prospects. Chart 46Favor Cyclicals Over Defensives
Favor Cyclicals Over Defensives
Favor Cyclicals Over Defensives
Ms. X: As I mentioned at the beginning of our chat, I, however, prefer growth stocks. The sectors most represented in the value indices face secular headwinds such as low rates, a move away from carbon, and the increasing role of software, not goods, as the source of value added in our economies. Meanwhile, growth stocks also benefit from the aging of the population, the historically low trend growth rate of the global economy, and the network effects, which protect the profit margins of large tech firms. As you can see, my father and I have been clashing on this topic. Where do you stand? BCA: Within the firm, we have had our disagreements on this topic as well. One thing we all agree upon is that the growth-versus-value debate amounts to a sector call. One common preference we share is to favor cyclical equities relative to defensive ones. Over the coming 12 months, a weak dollar, rising inflation expectations, the strengthening of the Chinese and global economy and improving capex will all conspire to boost the profit and multiples of cyclical stocks at the expense of defensive sectors (Chart 46). Nonetheless, if the Chinese economy starts to slow in the second half of 2021, we will have to evaluate if this bet remains valid. Within the cyclicals, we prefer the more traditional ones, like industrials and materials at the expense of the tech sector. The expected growth rate embedded in tech stocks is extremely elevated compared to the rest of the market in general and other cyclicals in particular (Chart 47). This aggressive pricing is rooted in the recent experience, whereby tech earnings significantly outperformed the rest of the market. However, this outperformance mirrored strong sales of techs goods and services during the pandemic, when households and firms prepared for long lockdowns and remote working. Gravity-defying sales in the midst of the deepest recession in 90 years stole demand away from the future. Now that the economy recovers, pent-up demand for tech goods is smaller than for other categories of cyclical spending. Thus, the current pricing of tech earnings growth leaves room for disappointments. Within traditional cyclicals, financials are a question mark. The broadening of the economic reopening subsequent to the rollout of the vaccines is positive for the quality of banks’ loan books. However, the scope for yields to rise is restricted, which will limit how steep the yield curve will become and how wide net interest margins will swell. Thus, for 2021, industrials and materials remain our favored sectors. Chart 47Too Much Earnings Optimism For Tech Stocks
Too Much Earnings Optimism For Tech Stocks
Too Much Earnings Optimism For Tech Stocks
We also favor a basket of “back to work” stocks at the expense of “COVID-19 winners”. With vaccines coming through next year, this trade has further to run. The first group includes some airlines, hotels, oil producers, restaurant operators, capital goods manufacturers, credit card companies, automobile manufacturers and a steel producer.1 The second basket includes a bankruptcy consultant, a software company, some grocers, some biotech names, a Big Pharma company, a large e-commerce business, an online streaming service, a teleconferencing company and two household products leaders.2 For the next 12 to 18 months, we favor value stocks at the expense of growth stocks, which is a consequence of our preference for traditional cyclical names and of the “back to work” names. Moreover, since 2008, periods of economic acceleration correspond to quicker earnings growth of value stocks compared to growth equities (Chart 48). Additionally, if bond yields move up – even if not much, the multiples of value stocks should expand relative to growth firms (Chart 48, bottom panel). We also increasingly like small-cap firms relative to large-cap ones. Small cap indices have substantial underweights in healthcare and tech names, which contrasts with the S&P 500 or the S&P 100. Accordingly, the Russell 2000 both has a cyclical and value bend relative to large-cap benchmarks. Moreover, small call equities outperform the S&P 500 when the dollar declines and when commodity prices appreciate (Chart 49). Additionally, the recent sharp rebound in US railroad freight volumes will support the more-cyclical Russell 2000. Besides, greater shipments lead to upgrades of junk-bond credit ratings, which decreases the perceived riskiness of the heavily levered small cap firms (Chart 50). Chart 48Value Investors Will Like 2021
Value Investors Will Like 2021
Value Investors Will Like 2021
Chart 49The Case For Small Cap Stocks, Part I
The Case For Small Cap Stocks, Part I
The Case For Small Cap Stocks, Part I
Chart 50The Case For Small Cap Stocks, Part II
The Case For Small Cap Stocks, Part II
The Case For Small Cap Stocks, Part II
The long-term picture is less clear. Many key supports for growth stocks remain in place. Principally, the aging of the population and the risk of rising inflation in the second half of the decade should flatter healthcare stocks. In addition, the wide profit margins of tech stocks are unlikely to fully mean-revert because firms like Amazon, Google or Microsoft benefit from monopolistic positions that have decoupled their profitability from their capital stock. For now, the biggest risk to these sectors would be a regulatory onslaught from Washington and Brussels. Meanwhile, the sectors composing value indices suffer from the structural headwinds that Ms. X already noted. Counterbalancing this narrative, the extreme relative overvaluation of growth stocks suggests that their prices reflect these long-term forces already. On a very near-term basis (next two to three months), the rapid rise in investor sentiment as well as the collapse in the put-call ratio are consistent with a correction or sideways move in equities (Chart 51). When this correction materializes, no meaningful trend in growth relative to value stocks should emerge. Therefore, we recommend tactical traders play relative value within growth stocks and within value equities, where overextended sectors should correct. Within growth, we would like to rotate away from tech into healthcare. Within value, the next three months should reward financials at the expense of materials. Chart 51Near-Term Risks For Stocks
Near-Term Risks For Stocks
Near-Term Risks For Stocks
Ms. X: Based on these sectoral views, I gather you would underweight the US market. But where do you stand on emerging markets? BCA: You are correct, in 2021, we expect US equities to underperform the rest of the world. Their large weight in healthcare combined with the low beta of the US economy to global growth gives a defensive twist to the S&P 500. In addition to healthcare, the most significant overweight in the US equity benchmark is tech, which reinforces the growth style of US stocks. The US’s tech overweight is greater than appears because US communication services and consumer discretionary sectors are mostly tech names such as Facebook, Google, Netflix or Amazon (Table 3). Finally, our bearish outlook on the USD creates an additional hurdle for US equities relative to the rest of the world (Chart 52). Table 3Sector Representation In Various Regions
OUTLOOK 2021: A Brave New World
OUTLOOK 2021: A Brave New World
While we like both Europe and Japan, the latter stands out for 2021. Japanese stocks have particularly large allocations to the most attractive deep cyclicals (industrial and consumer discretionary equities) and are very cheap, even on a sector-to-sector comparison (Chart 53). To like Japan, we do not need to bet on a multiples convergence. This equity market’s low valuations mean that we are buying each unit of profit growth at a discount to the same sectors in the rest of the world. As a result, Japanese equities are more levered to our positive view on the earnings of deep cyclicals than any other major bourse. Chart 52US Stocks Underperform When The Dollar Weakens
US Stocks Underperform When The Dollar Weakens
US Stocks Underperform When The Dollar Weakens
Chart 53Japan Offers The Right Exposure At The Right Price
OUTLOOK 2021: A Brave New World
OUTLOOK 2021: A Brave New World
Finally, we are neutral on EM stocks. We like them more than US equities but less than Japan or Europe. EM stocks will benefit from a weaker dollar, but they have become tightly correlated to the NASDAQ due to the leadership of a few large tech names in Asia. Essentially, like the US, EM stocks have a very large weighting in the tech sector. If our view is correct that growth underperforms value next year, North Asian EM, which have driven EM stocks since March, will lag behind Latin America in 2021. Mr X: Thank you for your thoughts on equities. I agree that a monetary shock normally is needed to burst bubbles, but I also worry that the current extreme overvaluation of tech stocks could lead to gravity taking hold without the help of the Fed. This means that I am slightly less confident than you are that equities will rise this year. However, I agree with you that value stocks should beat growth stocks and that US equities should become the laggards after years of leadership. Ms. X: Should we move on to the currency and commodity markets? Currencies And Commodities Chart 54The Dollar Is Vulnerable Technically
OUTLOOK 2021: A Brave New World
OUTLOOK 2021: A Brave New World
Mr. X: I was skeptical last year, but your bearish dollar view panned out very well. However, you did not get its cause correctly. For one, you were constructive on global growth and consequently, negative on the dollar. I am skeptical that the dollar will depreciate much further in 2021 because it possesses a considerable yield advantage over other G-10 currencies. BCA: Today, the dollar sits at a critical spot. As you mentioned, we were negative on the USD last year; since then, it has breached all the major trend lines that have defined its bull market over the past nine years (Chart 54). This technical configuration suggests that more weakness is in store. One thing is very clear, dollar bulls have gone missing. Speculators are heavily selling the USD. Bullish sentiment on the euro is at its most elevated level in a decade. Historically, when it faces such one-sided negativity, the dollar enjoys temporary rebounds. Nonetheless, the DXY’s upside should be limited, at 2-4%, not more. A few forces cap the dollar’s upside. The currencies with the most upside against the dollar in 2021 are the European currencies. The liquidity crunch that handicapped global markets in March is over. Most foreign central banks have ample access to dollar liquidity and do not rely on the Fed anymore, as its outstanding swap lines stand close to zero (Chart 55). In 2009, this was a clear signal that the dollar liquidity shortage was behind us. The Fed has increased its supply of domestic currency more aggressively than other central banks. Today, interest rates around the world are at zero. Therefore, central banks’ balance sheet policy and forward guidance are the main tools to communicate the future path of interest rates. Chart 56 shows that other G-10 central banks have been lagging the Fed in terms of their balance sheet expansion. This has hurt the dollar and benefitted other currencies. Chart 55No More Liquidity Crunch
No More Liquidity Crunch
No More Liquidity Crunch
Chart 56Currencies Respond To Balance Sheets
Currencies Respond To Balance Sheets
Currencies Respond To Balance Sheets
US growth is lagging the rest of the world. This might not last, but growth differentials will continue to drive the performance of currencies, as they did in recent years. The November PMIs showed that the US economy held up well, but 2021 growth expectations from the IMF and other agencies favor the Eurozone. Finally, we are also deeply uncomfortable with negative interest rates. However, negative rates are the symptom and not the disease. China has positive interest rates because its domestic demand is strong. Europe or Japan are very sensitive to Chinese growth, which could cause the US rate advantage to evaporate. Ms. X: Earlier, you mentioned that the dollar is the perfect hedge for non-US based investors, which is a view I share. Are there any other currencies outside the dollar that we should hold that provide some safety? BCA: The currencies with the most upside against the dollar in 2021 are the European currencies, especially the Norwegian krone and the Swedish krona. They are the most undervalued currencies within the G-10, and they offer some margin of safety. While less attractive than the Scandinavian currencies, the pound will nonetheless appreciate more than the euro next year. Even if most currencies should gain against the USD, the yen is the one that will offer the most protective ability in a portfolio. It would be an excellent defensive complement to the dollar for investors looking to hedge portfolio risk. Gold will not perform effectively as a deflation hedge, but its ability to protect portfolios against long-term inflation risks remains intact. First, the yen is cheap. Over the years, falling Japanese price levels have tremendously improved the value of the yen. This cheapness makes Japanese equities an attractive investment, especially on an unhedged basis. These unhedged flows into Japan are very positive for the yen. Second, Japan offers the highest real interest rates in the G10. This attribute will incite investors to purchase JGBs. Moreover, Japanese investors could represent a major source of fixed-income flows into the country because of a large proportion of US Treasuries will mature, which will invite repatriation flows. Chart 57The Yen Likes A Weaker USD
The Yen Likes A Weaker USD
The Yen Likes A Weaker USD
Finally, the yen is a low beta currency versus the USD. Both the DXY and the USD/JPY are positively correlated, thus when the dollar declines, the yen rises, but less so than other currencies (Chart 57). This means that when global equity markets enter risk-off phases, the yen appreciates against non-dollar currencies, but it loses less value against these same currencies when markets are rallying. This places the yen in a very enviable “heads I win, tails I don’t lose too much” position, which is what we need out of a portfolio hedge. Mr. X: I find it difficult to share your enthusiasm for the yen, but I agree that it is an interesting portfolio hedge. Nonetheless, my precious metals still provide me with a lot more comfort than any fiat currencies. Moving to commodities; it has been a remarkable year. Oil was crushed by the COVID-19 pandemic – more so than other commodities. Crude now appears to be attempting a comeback. Gold did well this year, but it recently dipped below $1,800/oz., and seems to be struggling to get back above that level. Let’s start with oil. Where do you see it going and how should we play it? BCA: Oil is about one principle: Supply and demand have to clear the market. Even more than with other commodities, the COVID-19 pandemic clobbered oil demand, especially those segments of the market tied to transportation, such as motor fuels (gasoline and diesel fuel), jet and marine fuels. While the news around vaccines are encouraging, it will be months before these treatments are available on the massive scale required to revive transportation demand. Chart 58Crude Forecasts
Crude Forecasts
Crude Forecasts
Ms. X: Are you saying the oil prices will remain depressed in 2021? BCA: Not really. We expect demand to recover following local – as opposed to national – lockdowns in the US and Europe. This process will become evident even before the vaccines have been rolled out on a large-enough scale to affect transportation demand. The impact on energy demand of the vaccines themselves should become visible toward the end of the first half of 2021. On the supply side, we believe the producer coalition lead by Saudi Arabia and Russia will continue to adjust supply to meet demand. Hence, global oil inventories will fall further, which will tighten the market. Based on these supply/demand dynamics, Brent crude-oil prices will average $63/bbl next year, which is above the forward curve in oil markets (Chart 58). Mr. X: Oil-market risk seems very difficult to pin down right now. Do you expect downside or upside risks to dominate prices next year? BCA: At the current juncture, risks to the oil market are exceptionally two-sided. On the downside, with the exception of China, most major economies have been unable to control the rapid spread of COVID-19. If the health crisis lingers, oil demand could remain weaker than our base case anticipates. On the upside, Big Pharma has acted with unprecedented speed in developing vaccines to combat this coronavirus. Netting all these forces out, the balance of risks, in our view, favors the upside, as our price forecast indicates. Mr. X: Thank you. I would like to move on to gold. You mentioned that the dollar was your favourite hedge against equity risk for non-US based investors. As I mentioned earlier, I tend to prefer gold. BCA: Gold and the US dollar are both safe-haven assets; when risk aversion and uncertainty increase, investors buy both these assets to hedge their portfolios. Typically, a weaker dollar is good for gold, and vice versa. The past four or five years have been extraordinarily uncertain – trade wars, political uncertainty, the global rise of nationalist populism, the COVID-19 pandemic, you name it. All of these factors drove investors to hold dollars and gold at the same time. While the bullish dollar forces are dissipating, we cannot say the same for gold. The Fed is committed to maintaining an ultra-accommodative monetary policy indefinitely, which, along with the US government’s ever-expanding budget deficits, will keep the supply of money and credit extremely high for years. As we already argued, this policy setup will have a positive impact on inflation expectations. On the geopolitical front, even if the Sino-US tensions become less acute in the near-term, an undercurrent of distrust and rivalry will prevail. This combination will let bullion prices reach $2,000/oz. next year. Despite these positive fundamentals, gold will not hedge portfolios well against temporary deflationary shocks. Stuck at their lower bound, interest rates cannot decline any more. Consequently, negative growth shocks weigh on inflation expectations, which lifts real interest rate and the dollar, albeit briefly. This process is bearish for gold. Thus, gold will not perform effectively as a deflation hedge, but its ability to protect portfolios against long-term inflation risks remains intact. Mr. X: Thank you. Any other natural resource you would highlight for 2021? BCA: In our research, we heavily focus on the evolution of the global economy toward a low-carbon regime. Hence, we have opened up a whole line of investigation on CO2 markets, particularly in the EU, which is the largest such venue in the world. We are expecting it to become a leading indicator of global efforts to price carbon going forward. On a related note, we are very interested in the buildout and modernization of China’s electric grid as it embarks on its 14th Five-Year Plan in 2021. Similar efforts are arising globally. We think this will be very important for base metals prices, particularly copper and aluminium. Geopolitics Mr. X: Before we conclude, let us talk about global geopolitical risks. The past two years were replete with tensions, many stocked by the Trump administration. Does a change of leadership in the US will fundamentally alter global relations, especially between the US and China? Chart 59Peak US Polarization
Peak US Polarization
Peak US Polarization
BCA: The fundamental geopolitical dynamic at the outset of the 2020s is the division of the United States and the rise of China. The sharp increase in US political polarization began with the decline of a common enemy, the Soviet Union, in the 1980s. Pro-growth policies that widened the wealth gap, and a series of political, military, economic, and financial shocks in the twenty-first century, drove polarization to levels not witnessed since the late nineteenth and early twentieth centuries. The anti-establishment Trump administration marked the latest peak in polarization (Chart 59). Now, in 2020, the Democratic Party-led political establishment has reclaimed the White House, but only narrowly. The popular vote was roughly evenly divided (47% to 51%) and the Republicans have likely retained the Senate. Because the popular vote and Electoral College vote are now aligned, and because Biden looks limited to center-left policies, polarization is likely to come off its highs. But it will remain elevated due to gridlock in Congress and persistent socio-economic disparities. President Xi Jinping’s “New Era” has led to a backlash from foreign powers. Polarization is globally relevant because it increases uncertainty over the US’s role in the world, particularly on fiscal policy and foreign policy. At home, gridlock produces periodic budget crises that weigh on global risk appetite. Abroad, partisanship causes new presidents to reverse the foreign policies of their predecessors (see President Obama on Iraq and President Trump on Iran). These dramatic reversals increase global policy uncertainty and geopolitical risk (Chart 60). Chart 60A Bull Market In Policy Uncertainty
A Bull Market In Policy Uncertainty
A Bull Market In Policy Uncertainty
As the US descended into internal partisan conflict, China expanded its global influence. In the wake of the 2008 crisis, the Communist Party was forced to change its national strategy to better handle demographic decline, structural economic transition, rising social ills, and foreign protectionism. Slower trend growth increases long-term risks to single-party rule, forcing the CCP to shift the basis of its legitimacy from rapid income growth to Chinese nationalism. Hence Beijing has aggressively sought a technological “Great Leap Forward” to improve productivity while adopting a much more assertive foreign policy to build a sphere of influence in Asia Pacific. President Xi Jinping’s “New Era” has led to a backlash from foreign powers, most markedly with COVID-19 but also with the removal of Hong Kong’s autonomy, saber-rattling in neighboring seas, and politically motivated boycotts of neighboring countries like Australia. The sharp decline in China’s international image has occurred despite the damage that President Trump did to America’s image at the same time (Chart 61). The Xi administration is not likely to change course anytime soon as it seeks to consolidate power even further ahead of the critical 2022 leadership transition. Chart 61A Broadening Distrust Of China
OUTLOOK 2021: A Brave New World
OUTLOOK 2021: A Brave New World
American polarization and Chinese nationalism are a dangerous combination. China is increasingly fearful of US containment policy and is adopting a new five-year plan built on accelerating its quest for economic self-sufficiency and technological leadership. The US is fearful of China as the first peer competitor that it has faced since the Soviet Union, and one of the few sources of national unity is the bipartisan agenda of confronting China over its illiberal policies. The Biden administration will mark the third US presidency in a row whose foreign policy will be preoccupied with how to handle Beijing. With Biden likely facing gridlock at home, and likely a one-term president due to old age, his administration will largely amount to restoring the Obama administration’s policies. Internationally, this means an attempt to rejoin or renegotiate the Iranian nuclear deal of 2015 so that the US can reduce its involvement in the Middle East and pivot to Asia. Assuming that any American or Israeli action against Iran in the waning days of the Trump administration is limited, Biden will probably achieve a temporary solution with Iran, which otherwise faces economic collapse just ahead of a critical presidential election and eventual succession of the supreme leader. But the process could involve force or the threat of force before a solution is reached, and this would temporarily trouble markets. The greatest geopolitical opportunity in 2021 lies in Europe. Biden will also seek to re-engage China to manage the dangerous rise in tensions, while making amends with US allies for Trump’s “America First” approach. There is already a tension between Biden’s commitment to multilateralism and his need to get things done. The Trump tariffs are viewed as illegal according to the WTO but give Biden leverage over China. Biden is forced to confront China and Russia over their authoritarian actions, but he also needs their assistance on Iran and North Korea. Meanwhile unforeseen crises will emerge, likely in emerging markets badly shaken by this year’s deep recession. Chart 62The Taiwan Strait Is The Top Geopolitical Risk In 2021
OUTLOOK 2021: A Brave New World
OUTLOOK 2021: A Brave New World
The greatest geopolitical risk in 2021 lies in the Taiwan Strait. If China becomes convinced that Biden is not attempting a real diplomatic reset, but is instead pursuing a full-fledged containment policy and technological blockade, then it will be increasingly aggressive over rising Taiwanese pro-independence sentiment (Chart 62). A fourth Taiwan Strait crisis is still possible and would have a cataclysmic impact on markets. But Biden will start by trying to lower tensions with Beijing, which is positive for global equity markets until otherwise indicated. China’s long-run strategy has paid off in Hong Kong so it will likely think long-term on Taiwanese matters as well. Ms. X: In your opinion, which region will experience the greatest geopolitical tailwind next year? The greatest geopolitical opportunity in 2021 lies in Europe. The UK will likely be forced to accept a trade deal with the EU for the sake of the economy and internal unity with Scotland. Meanwhile Trump will not be able to impose sweeping unilateral tariffs on Europe and his maximum pressure policy on Iran will dissipate, reducing the risk of a major war in the Middle East. Germany’s transition from the era of Chancellor Angela Merkel will bring debates and concerns, but Germany is fundamentally stable and its agreement with France to upgrade European solidarity puts a lid on Italian political risk as well (Chart 63). Russia remains aggressive, but it is increasingly worried about domestic stability, and now faces an onslaught of democracy promotion from the Biden administration. Chart 63EU Solidarity Is The Top Geopolitical Opportunity In 2021
EU Solidarity Is The Top Geopolitical Opportunity In 2021
EU Solidarity Is The Top Geopolitical Opportunity In 2021
Investors are rightly optimistic about 2021 because of the vaccine for COVID-19 are the reduction in global policy uncertainty and geopolitical risk as a result of the change in the White House. But a lot of optimism is being priced as we go to press, whereas the US-China and US-Russia rivalries have gotten consistently more dangerous since 2008. While geopolitical risk is abating from the extreme peaks of 2019-20, it will remain elevated in 2021 and the years after. Conclusions Mr. X: This is a good place to conclude our discussion. We have covered a lot of ground but I remain deeply concerned. On the one hand, the global reflationary policies forced through the system this year remains positive for risk assets. On the other, valuations of both stocks and bonds are uncomfortably stretched for my taste. Moreover, the pandemic is still not under control and while the news on the vaccine front is encouraging, the economy still has ample room to negatively surprise next year. Furthermore, I find the long-term picture particularly concerning, especially if inflation and populism rear their ugly heads. As a result, while I feel like I must be invested in equities rights now, I prefer to slant my portfolio toward value stocks and to keep generous holdings of cash and gold to protect myself. Ms. X: I agree with my father that the uncertain nature of the evolution of the pandemic, especially when contrasted with the demanding valuations of equities, creates many risks for investors. Nonetheless, I do not expect inflation to come back anytime soon. Thus, monetary policy will not become a threat in the near future. Moreover, I am quite optimistic on the earnings outlook. Accordingly, I am more comfortable than my father is with taking some risk in our portfolio this year, even if a slightly larger-than-normal allocation to cash and gold is reasonable. Unlike the BCA team, I believe growth stocks, not value stocks, will generate excess returns from equities in the coming years. Thus, I favor US markets and I am less negative on the US dollar than you are. BCA: Your family debate mirrors our own internal discussions. There is always a trade-off between maximizing short-term returns and taking a longer-term approach to investing. Nonetheless, many assets have become more expensive this year and long-term inflation risks are increasing. Thus, real long-term returns are likely to be uninspiring compared to recent history. Table 4 shows our baseline calculations of what a balanced portfolio will earn over the coming decade. We estimate that such a portfolio will deliver average annual returns of 4.0% over the next ten years, or 1.0% after adjusting for inflation. That is a deterioration from our inflation-adjusted estimate of 2.4% from last year, and also still well below the 6.1% real return that a balanced portfolio earned between 1990 and 2020. Table 4Lower Long-Term Returns
OUTLOOK 2021: A Brave New World
OUTLOOK 2021: A Brave New World
The uncertainty around the base case scenario for the global economy and asset markets remains very large. Hence, as we did last year, we recommend a list of guideposts to evaluate whether global markets stay on track to generate gains in 2021: The rollout of the vaccines: Much of the outlook will depend on the global health crisis. As the recent weeks have shown, the subsequent waves of COVID-19 are still debilitating and deadly, even if recent lockdowns are not as stringent as in the spring. Thus, if the vaccines take longer to be distributed, the economy will suffer a greater risk of relapse, which will hurt asset prices. Realized and expected inflation: If both realized and expected inflation rise quickly, the market will price in a faster withdrawal of monetary accommodation. The market is too expensive to withstand this shock, which would prove more painful than another wave of lockdowns. A stronger dollar and a flattening yield curve: If these two phenomena develop in tandem, this will indicate that the global economy is suffering another deflationary shock. Because fiscal and monetary authorities remain on guard, this may not force any meaningful equity correction. However, growth stocks and defensive names will outperform the rest of the market. US diplomacy: Starting January 20, a new president will occupy the Oval Office. Markets have rejoiced at the anticipation of a more conciliatory approach by the US toward its allies and commercial partners. If the US proves colder than expected, markets will have to reprice their optimistic take on global relations. Bank health: We expect sour commercial real estate loans to create limited damage to the banking system. If we are wrong, credit standards will tighten further instead of easing. This would be a bad omen for global demand and would suggest that yields have downside and that growth stocks would beat value stocks. Fiscal policy: We expect fiscal policy to remain accommodative next year, even if less so than in 2020. An absence of a deal in Washington and a quicker return to fiscal rectitude in the rest of the world would mean that global growth will be weaker than we expect. This would impact equities negatively, especially value stocks. Ms. X: Thank you for this list of variables to monitor. As always, you have left us with much to think about. We look forward to these discussions every year. Before we conclude, it would be helpful to have a recap of your key views. BCA: It would be our pleasure. The key points are as follows: In 2021, stocks will outperform bonds thanks to the global economic recovery, the lack of immediate inflationary pressures and the prospects of a resolution to the pandemic. Imbalances in the global economy are growing, and the explosion in debt loads witnessed this year will carry significant future costs. Rising inflation is the most likely long-term consequence because of rising populism and the meaningful chance of financial repression. This change in inflation dynamics will generate poor long-term returns for a 60/40 portfolio, especially because asset valuations are so expensive. Compared to the past two years, geopolitical uncertainty will recede in 2021, but will remain elevated by historical standards. China and the US are interlocked in a structural rivalry, which means that flashpoints, such as Taiwanese independence, will remain a source of tensions. Europe will enjoy geopolitical tailwinds next year. For now, no central bank or government wants to remove economic support too quickly. Monetary policy will remain very stimulative as long as inflation is low, which means no tightening until late 2022, at the earliest. Fiscal deficits will narrow, but more slowly than private savings will decline. The US will grow faster than potential thanks to this policy backdrop. Moreover, household finances are robust and industrial firms are taking advantage of low interest rates as well as surprisingly resilient goods demand to increase their capex plans. Outside of the US, China’s stimulus and an inventory restocking will fuel a continued upswing in the global industrial cycle that will push 2021 GDP growth well above trend. However, at the beginning of the year, we will likely feel the remnants of the lockdowns currently engulfing Western economies. The uncertainty around the base case scenario for the global economy and asset markets remains very large. Bond yields can rise next year, but not by much. Ebbing deflationary pressures and the global industrial cycle upswing will lift T-Note and T-Bond yields. However, the extremely low probability of monetary tightening in 2021 and 2022 will create a ceiling for yields. We favor peripheral European bonds at the expense of German Bunds and US Treasuries. Corporate spreads should stay contained thanks to a very easy policy backdrop and the positive impact on cash flows and defaults of the ongoing recovery. We also like municipal bonds but worry about pre-payment risks for MBS. Global stocks should enjoy a robust advance in 2021, even if the market’s gains will be smaller and more volatile than from March 2020 to today. Easy monetary conditions will buttress valuations while recovering economic activity will support earning expectations. Within equities, we favor cyclical versus defensive names and value stocks relative to growth stocks. As a corollary, we prefer small cap to large cap and foreign DM-equities to US equities. We are neutral on EM equities due to their large tech sector weighting. The dollar bear market is set to continue, and high-beta European currencies will benefit most. The yen remains an attractive portfolio hedge. Oil and gold have upside next year. Crude will benefit from both supply-side discipline and a recovery in oil demand. Gold will strengthen as global central banks will maintain extremely accommodative conditions and global fiscal authorities will remain generous. A weaker dollar will flatter both commodities. A balanced portfolio is likely to generate average returns of only 1.0% a year in real terms over the next decade. This compares to average returns of around 6.1% a year between 1990 and 2020. We sincerely hope that next year, we will get to see each other in person instead of via computer screens. Finally, we would like to take this opportunity to wish you and all of our clients a very peaceful, healthy and prosperous New Year. The Editors November 30, 2020 Footnotes 1 The tickers of the stocks in the “back to work” basket are: LUV, DAL, MAR, HLT, CVX, EOG, SBUX, MCD, CAT, HON, AXP, COF, NUE, GM. 2 The tickers of the stocks in the “COVID-19 winners” basket are: TDOC, FCN, ZM, CTXS, JNJ, AMGN, REGN, CLX, RBGLY, WMT, COST, KR, NFLX, AMZN.
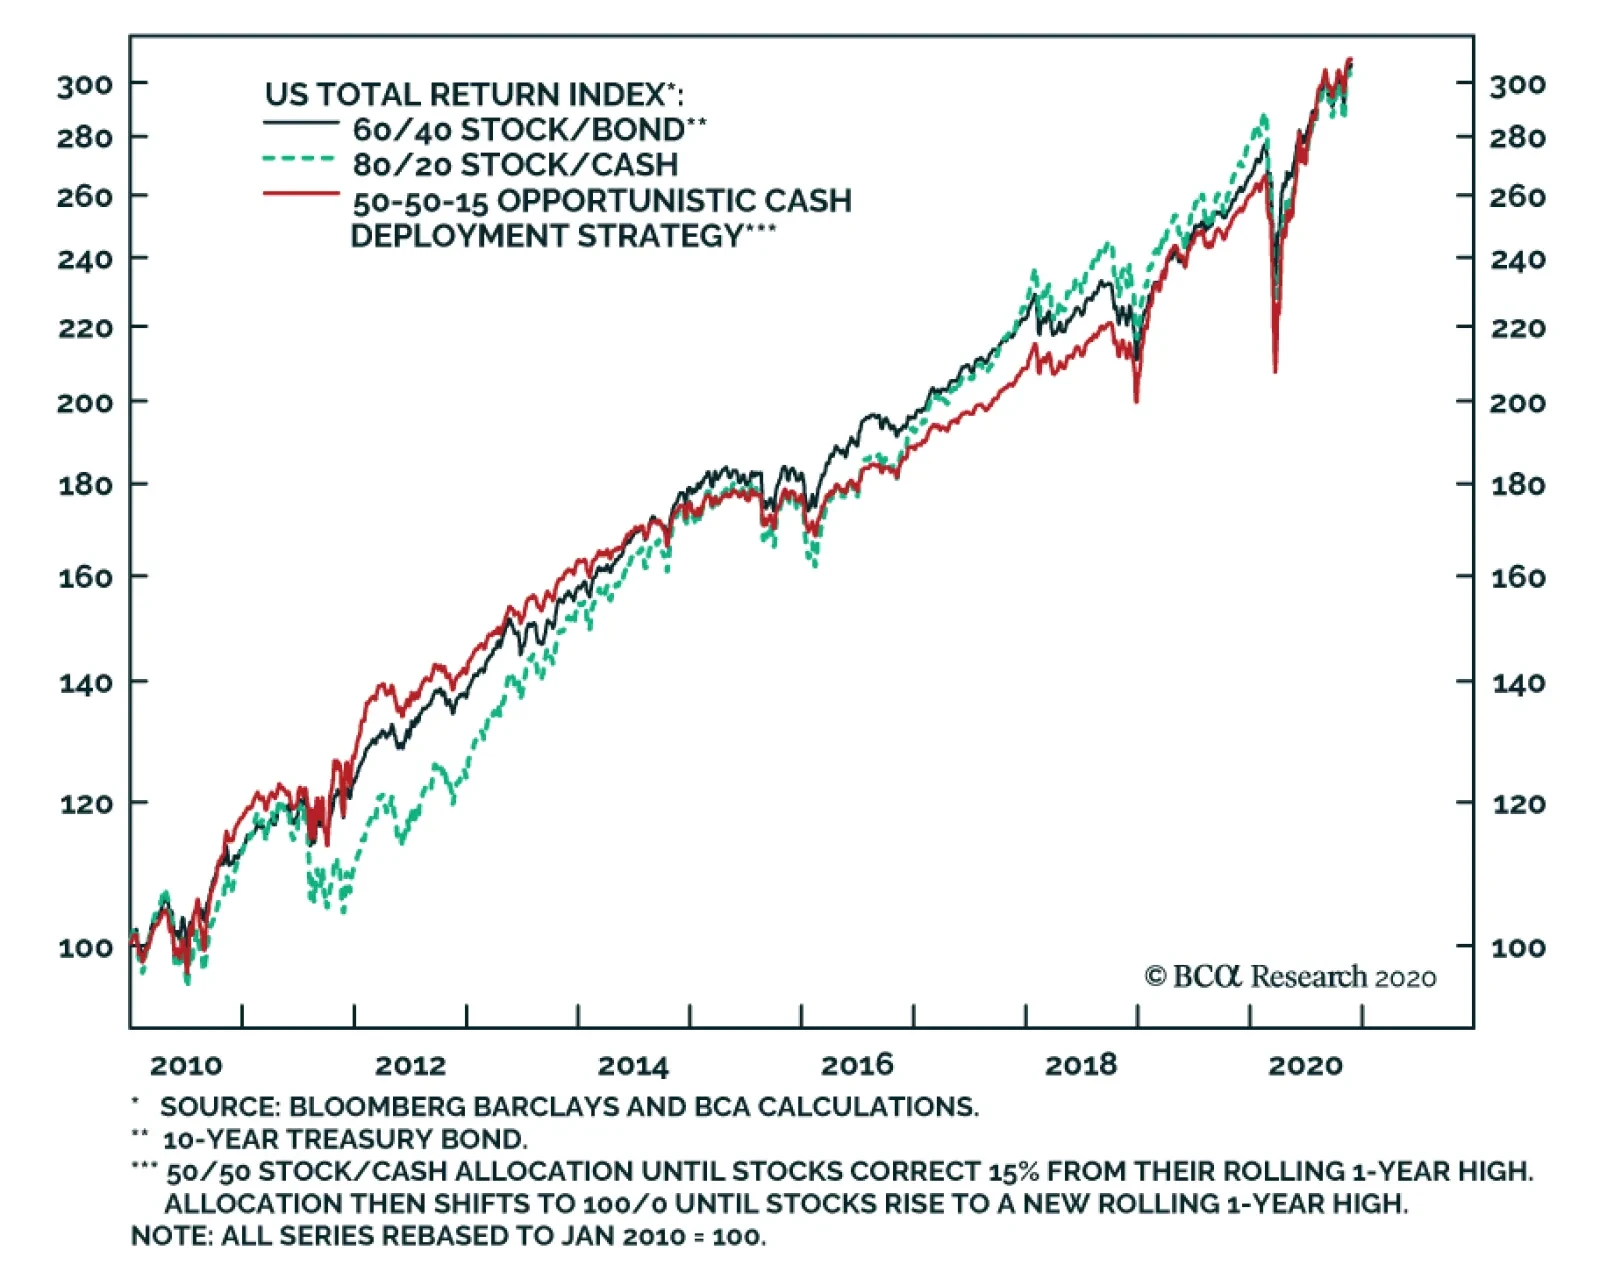
In a previous Insight, we noted that the Fed’s adoption of an Average Inflation Target has likely created a new hedging reality for equity investors, and that cash is likely to be the least uncompelling diversifying asset over the coming 6-12 months. We…
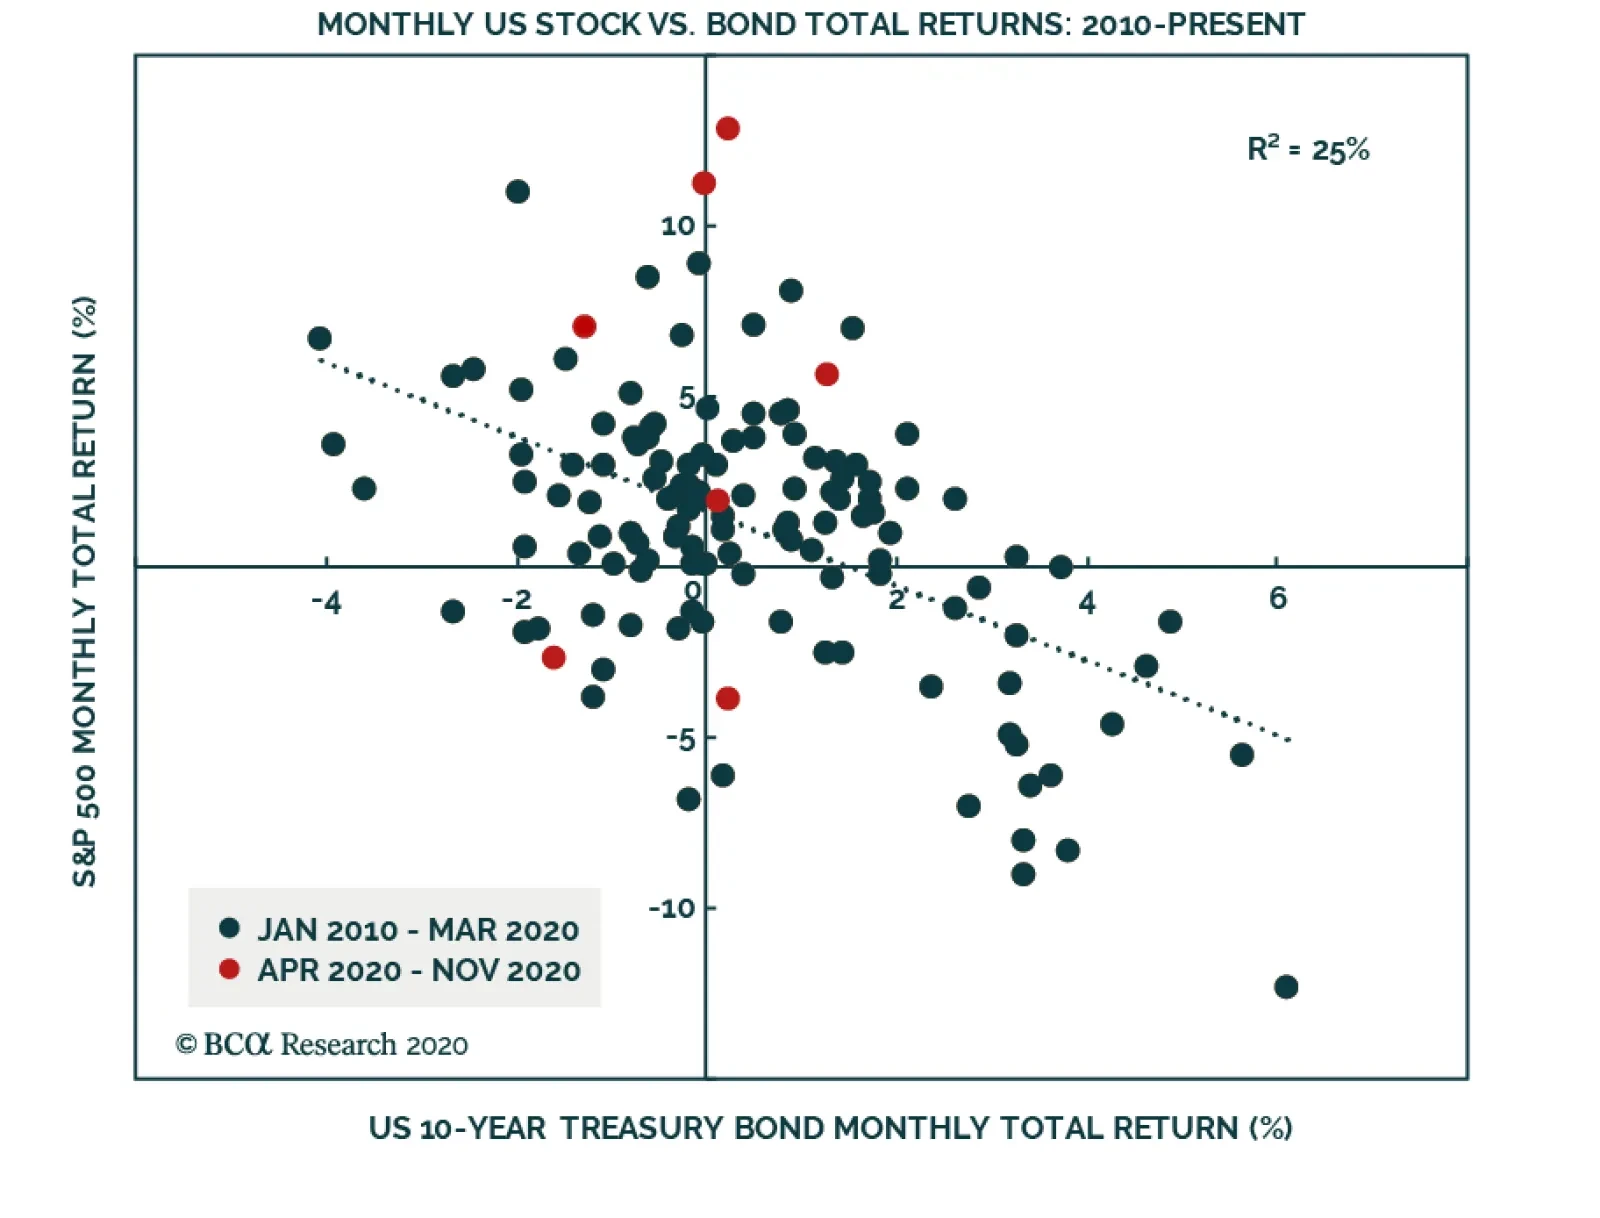
The chart above presents a scatterplot of monthly total returns for the S&P 500 index and 10-year US Treasurys. The chart highlights that the relationship has been reliably negative over the past decade, meaning that the correlation between stock prices…
Highlights US Corporates: The decision by the US Treasury to let the Fed’s emergency lending programs expire does not sound the death knell for the bull market in US corporate debt. Credit markets are functioning normally and US economic growth remains resilient, even amid a surge in COVID-19 cases, with politically unpopular European-style lockdowns unlikely. Global Corporate Strategy: Remain moderately overweight developed market corporate debt, favoring the US over the euro area. Look to increase allocations to lower-rated US high-yield credit on any near-term spread widening, as there is more room for junk spread compression over the next 6-12 months as defaults peak. Feature When looking at the 2020 year-to-date total returns from global corporate credit, the performance at first blush has not been terrible. The Bloomberg Barclays Global Investment Grade Corporate index has returned 8.2% since the start of the year, while the benchmark global high-yield index has returned 3.6%. While the bulk of those returns have come from duration exposure as global bond yields have fallen sharply, a passive allocation to corporate bonds on January 1 has been a money-making investment in 2020. Chart of the WeekUS Credit Markets Need Less Policymaker Support
US Credit Markets Need Less Policymaker Support
US Credit Markets Need Less Policymaker Support
Of course, a lot has happened since the beginning of the year. A global pandemic, a historically severe global recession, a massive selloff of risk assets in February and March and an equally robust recovery of equity and credit markets on the back of huge monetary and fiscal stimulus. It should come as no surprise that the 2020 peak in US corporate bond spreads occurred on March 23 – the day that the Fed and US Treasury introduced asset purchase vehicles designed to support stricken US credit markets. This is why the announcement last week that outgoing US Treasury Secretary Steve Mnuchin has decided to let those emergency lending facilities expire on December 31, with the Fed returning the US Treasury’s capital invested in those programs, is potentially of major significance for credit investors. It is reasonable to think that credit markets could suffer without the Fed’s involvement. The growth and market liquidity backdrop, however, has improved substantially over the past several months. US corporate bonds can live, and likely thrive, without the Fed backstop. The US economy remains surprisingly resilient, with the November flash estimate for the Markit composite PMI index reaching the highest level since 2015. This occurred even in the midst of a huge surge of global COVID-19 cases that has weighed heavily on European economies (Chart of the Week). Add to that signs that corporate bond markets are functioning smoothly - investors are willing to commit capital to credit markets, and borrowers are having no problem placing large volumes of debt at low yields and spreads – and it is easy to conclude that Fed’s explicit support is no longer required. The growth and market liquidity backdrop, however, has improved substantially over the past several months. US corporate bonds can live, and likely thrive, without the Fed backstop. From the point of view of corporate bond investment strategy, we continue to recommend a moderate overweight stance on global corporate debt versus government bonds over the next 6-12 months, favoring US investment grade and high-yield over European equivalents, even with the Fed pulling away its bid. Steve Mnuchin May Have A Good Point Even though Fed Chair Jerome Powell publicly disagreed with Treasury Secretary Mnuchin’s decision, the Fed will shut down the Primary Market Corporate Credit Facility, the Secondary Market Corporate Credit Facility, the Term Asset-Backed Loan Facility, the Municipal Liquidity Facility and the Main Street Lending Program on December 31. Those facilities are part of the US government support programs under the Coronavirus Aid, Relief and Economic Security (CARES) Act. The US Treasury seeded the facilities with $195 billion in capital, which the Fed levered up to create as much as $2 trillion in buying power (Table 1). Yet the actual usage of that spending capacity has been quite low, with only $13.3 billion spent in the Fed’s secondary market facility. Not a single dollar was spent in the primary market facility, as companies had no problems issuing debt directly to markets rather than selling new bonds to the Fed. Table 1US CARES Act Programs: Little-Used, But Highly Successful
US Corporate Credit Can Walk Without Crutches
US Corporate Credit Can Walk Without Crutches
According to data from the Securities Industry and Financial Markets Association (SIFMA), the pace of monthly US corporate bond issuance and daily trading volumes are now following the typical seasonal pattern seen over the past two years (Chart 2). This occurred after a surge of issuance activity in Q2 as issuers took advantage of the vastly improved trading conditions in corporate bond markets after the initiation of the Fed’s liquidity backstop. Treasury Secretary Mnuchin noted these trends in his letter to Fed Chair Powell that was essentially an order to shut down the Fed’s emergency lending facilities.1 Chart 2US Credit Markets Are Functioning Normally
US Credit Markets Are Functioning Normally
US Credit Markets Are Functioning Normally
Chart 3No Stomach For Nation-Wide Lockdowns In The US
No Stomach For Nation-Wide Lockdowns In The US
No Stomach For Nation-Wide Lockdowns In The US
US credit markets are not only functioning well, so is the US economy. The Markit US services PMI rose in November to 57.7 (from 56.9 in October), while the same index fell to 41.3 (from 46.9) in the euro area and 45.8 (from 51.4) in the UK (Chart 3). As services industries like dining, travel and retail spending are most directly impacted by lockdowns related to COVID-19, it should not be a surprise that the data underperformed massively in Europe, where severe economic restrictions have been imposed to slow the spread of the virus. This compares to the US where the restrictions have been far more modest and varying across cities and regions. The pace of monthly US corporate bond issuance and daily trading volumes are now following the typical seasonal pattern seen over the past two years. Some slowing of US domestic economic activity should be expected over the next month or two, with more parts of the country putting greater restrictions on activities like indoor dining and in-person schooling. However, the political will to impose the sort of harsh nation-wide “shelter at home” type lockdowns currently in place in Europe is simply not there in the US after the shock of the Q2 lockdown-induced economic slump. US growth should thus continue to outperform – to the benefit of US corporate bond market performance relative to US Treasuries and European corporate equivalents. US corporate bond yields, both for investment grade and high-yield credit, have already declined massively in 2020, as have yields for European credit and even emerging market bonds (Chart 4). Given our view that US Treasury yields have bottomed and will likely drift higher over the next 6-12 months, it will be difficult to see further declines in corporate bond yields that are already near record lows. Chart 4Corporate Yields Falling To New Lows
Corporate Yields Falling To New Lows
Corporate Yields Falling To New Lows
Chart 5Corporate Spreads Approaching 2020 Lows
Corporate Spreads Approaching 2020 Lows
Corporate Spreads Approaching 2020 Lows
Corporate bond spreads, on the other hand, do have room to compress even just to levels seen before the February/March credit market rout – especially for US high-yield. The option-adjusted spread (OAS) for the Bloomberg Barclays US investment grade index is now 17bps away from the 2020 low, while the OAS for the euro area and UK are 7bps and 8bps away, respectively. For high-yield, the US index OAS is 107bps above the 2020 low, compared to 95bps for euro area high-yield and 81bps for UK high-yield (Chart 5). The near-term economic case for favoring US corporates over European corporates is a strong one, given the slightly larger spread cushions for US credit and the absence of large-scale US lockdowns. Given the severity of the lockdown-induced economic slump in the euro area and UK, which is likely to linger over the holiday season and into the early part of 2021, the near-term economic case for favoring US corporates over European corporates is a strong one, given the slightly larger spread cushions for US credit and the absence of large-scale US lockdowns. Bottom Line: The decision by the US Treasury to let the Fed’s emergency lending programs expire does not sound the death knell for the bull market in US corporate debt. Credit markets are functioning normally and US economic growth remains resilient, even amid a surge in COVID-19 cases, with politically unpopular European-style lockdowns unlikely. A Quick Look At Corporate Bond Spread Valuations In The US & Europe The tremendous rally in global corporate bond markets since late March has pushed credit spreads down to levels that raise concerns about valuations. Thus, it is now a good time to revisit some of our favorite spread valuation metrics. One simple way to evaluate the attractiveness of the level of spreads, and how much further they could fall, is to compare them to standard macro volatility gauges like the US VIX index. Credit spreads and equity volatility are highly correlated, as both are measures of investor uncertainty that rise during risk-off episodes and vice versa. The ratio of corporate credit spreads to equity volatility, therefore, can signal if spreads appear stretched relative to the broader risk backdrop. Chart 6US Corporate Spreads Look Tight Vs Equity Vol
US Corporate Spreads Look Tight Vs Equity Vol
US Corporate Spreads Look Tight Vs Equity Vol
Chart 7Euro Area Corporate Spreads Look Tight Vs Equity Vol
Euro Area Corporate Spreads Look Tight Vs Equity Vol
Euro Area Corporate Spreads Look Tight Vs Equity Vol
We show the ratio of the US investment grade and high-yield index OAS to the VIX index in Chart 6. For both higher-quality and lower-rated corporate credit, the spread-to-VIX ratio is now close to the lowest level seen since 2000 – both around 1.7 standard deviations below the long-run mean – suggesting that spreads are tight relative to overall macro volatility We show similar ratios for euro area corporates versus the VStoxx European equity volatility index in Chart 7, and UK corporates versus the IVI UK equity volatility index in Chart 8. The conclusions are similar to US credit, with spread-to-volatility ratios for both investment grade and high-yield now at low levels, one standard deviation below the mean since 2000. Chart 8UK Corporate Spreads Look Tight Vs Equity Vol
UK Corporate Spreads Look Tight Vs Equity Vol
UK Corporate Spreads Look Tight Vs Equity Vol
Chart 9Notable Duration Differences Between Corporates
Notable Duration Differences Between Corporates
Notable Duration Differences Between Corporates
It is difficult to draw any relative conclusions about credit valuations between the regions from the spread/volatility ratios, as they all point to spreads looking tight. Thus, we need to look at other valuation tools. Our more preferred metric to assess credit spreads is to look at the percentile rankings of 12-month breakeven spreads. The 12-month breakeven spread is the amount of credit spread widening that must occur for a credit product to have a return equal to a duration-matched, risk-free government bond over a one-year horizon. We look at the historical percentile ranking of the 12-month breakeven spreads to determine how current levels compare with the past. It is difficult to draw any relative conclusions about credit valuations between the regions from the spread/volatility ratios, as they all point to spreads looking tight. To calculate the 12-month breakeven spreads for corporate bonds, we take the ratio of the index OAS to the index duration for the specific bond market in question. This allows a comparison of breakeven spreads across different markets with varying risks, with duration being a main source of price risk (Chart 9). The 12-month breakeven spreads for the investment grade and high-yield corporate debt for the US, euro area and UK are shown in Charts 10, 11 and 12, respectively. For the US, the breakeven spread for investment grade corporates is currently in the bottom decile of its history, suggesting that the spread does not look particularly attractive on a risk-adjusted basis. Chart 10US Corporate Bond Breakeven Spread Percentile Rankings
US Corporate Bond Breakeven Spread Percentile Rankings
US Corporate Bond Breakeven Spread Percentile Rankings
Chart 11Euro Area Corporate Bond Breakeven Spread Percentile Rankings
Euro Area Corporate Bond Breakeven Spread Percentile Rankings
Euro Area Corporate Bond Breakeven Spread Percentile Rankings
Chart 12UK Corporate Bond Breakeven Spread Percentile Rankings
UK Corporate Bond Breakeven Spread Percentile Rankings
UK Corporate Bond Breakeven Spread Percentile Rankings
Euro area and UK investment grade breakeven spread percentile rankings are a bit higher than in the US, right on the cusp of the bottom quartile for both. Although for euro area corporates, the breakeven spread is boosted by the much lower duration of the euro area investment grade index and does not necessarily suggest that spreads there are currently more attractive than in the US and UK. Turning to junk bonds, the US high-yield 12-month breakeven spread is currently in the 67th percentile of its own history, suggesting that spreads are relatively attractive. The UK high-yield breakeven spread is also above average, with the latest reading in the 55th percentile. Euro area high-yield is the least attractive, with the latest 12-month breakeven spread in the 33rd percentile of its own history. Taking the 12-month breakeven spread as a measure of value (and, hence, a gauge of prospective future returns), we can compare it to a measure of spread volatility to evaluate the risk/return tradeoff for various credit markets. To measure spread risk, our preferred metric is duration times spread (DTS). We show a scatter chart of the latest 12-month breakeven percentile ranking for the overall US, UK and euro area corporate bond markets – for investment grade and high-yield, and including all the major credit rating tiers – in Chart 13. The most attractive trade-off of valuation versus spread risk is currently in the lower rated US junk bond tiers (B-rated and Caa-rated). Chart 13Comparing Value (Breakeven Spreads) With Risk (Duration Times Spread)
US Corporate Credit Can Walk Without Crutches
US Corporate Credit Can Walk Without Crutches
Chart 14A Lingering Positive Impact On Credit Markets From Global QE
A Lingering Positive Impact On Credit Markets From Global QE
A Lingering Positive Impact On Credit Markets From Global QE
What stands out in the chart is that the most attractive trade-off of valuation versus spread risk is currently in the lower rated US junk bond tiers (B-rated and Caa-rated). At the other end of the spectrum, US investment grade offers one of the least attractive risk/reward tradeoffs. This suggests a potential attractive opportunity to move down in quality within US corporate debt, particularly with ultra-accommodative global monetary policies providing a lingering tailwind for global corporate bond performance over the next 6-12 months (Chart 14). We prefer scaling into that trade on any bouts of US high-yield weakness, however. There are still near-term risks associated with the rapid spread of COVID-19 in the US and the lack of momentum on US fiscal stimulus negotiations during the transition period to the new Biden administration. Turning across the Atlantic, euro area high-yield looks far less attractive than US high-yield on a risk/reward basis. This fits with our current recommendation to underweight euro area junk bonds versus US equivalents (see our strategic recommendation tables on page 14). We also continue to recommend an overweight stance on UK investment grade corporates, which still offer a slightly more attractive risk/return tradeoff versus US equivalents. Bottom Line: Remain moderately overweight developed market corporate debt, favoring the US over the euro area. Look to increase allocations to lower-rated US high-yield credit on any near-term spread widening, as there is more room for junk spread compression over the next 6-12 months as defaults peak. Robert Robis, CFA Chief Fixed Income Strategist rrobis@bcaresearch.com Footnotes 1 Mnuchin’s letter to Powell can be found here: https://home.treasury.gov/system/files/136/letter11192020.pd Recommendations The GFIS Recommended Portfolio Vs. The Custom Benchmark Index
US Corporate Credit Can Walk Without Crutches
US Corporate Credit Can Walk Without Crutches
Duration Regional Allocation Spread Product Tactical Trades Yields & Returns Global Bond Yields Historical Returns
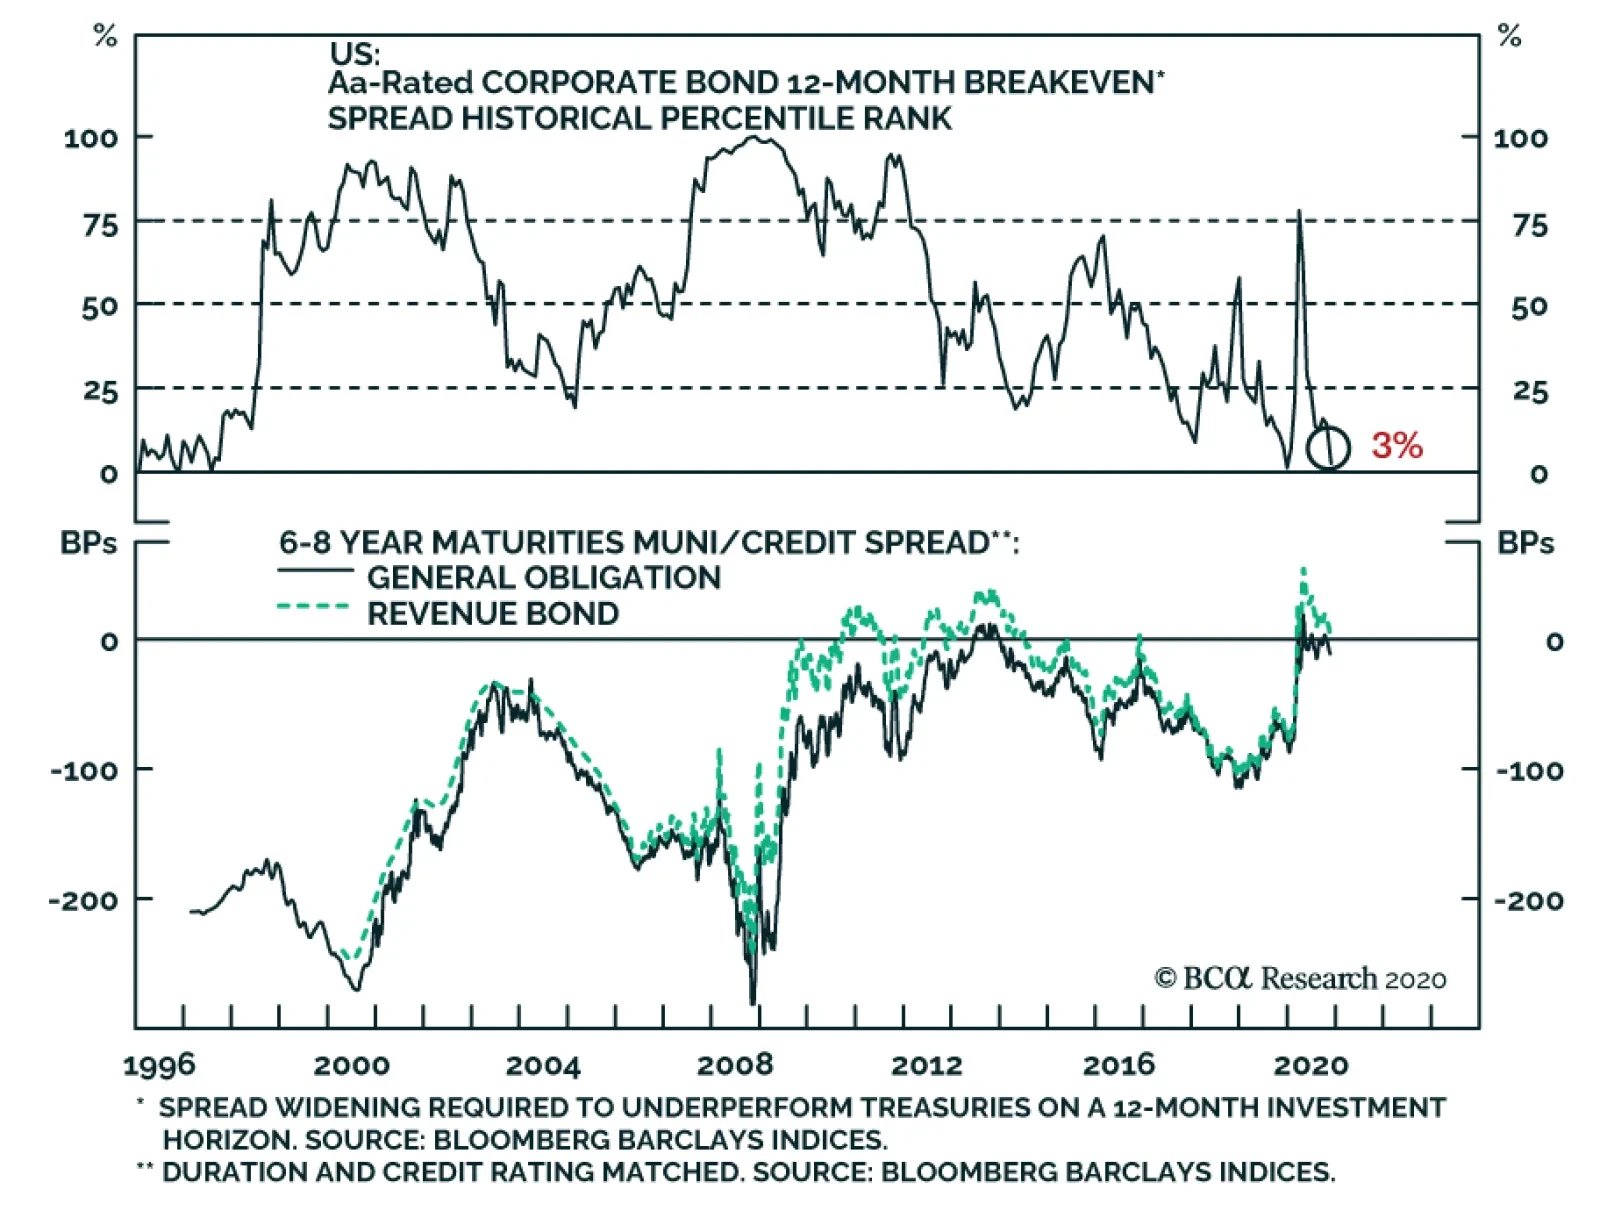
According to BCA Research's US Bond Strategy service, weaker Q4 economic growth could cause Treasury yields to fall in the near-term, but the knowledge that a vaccine is coming in 2021 will limit the downside. Investors should maintain below-benchmark…
Please note that there will be no US Bond Strategy report next week. We will publish December’s Portfolio Allocation Summary on December 8th, followed by our Key Views For 2021 on December 15th and a Special Report titled “The Fed In 2021” on December 22nd. Highlights Duration: Weaker Q4 economic growth could cause Treasury yields to fall in the near-term, but knowledge of a vaccine coming in 2021 will limit the downside. Investors should maintain below-benchmark portfolio duration on a 6-12 month horizon. Fed: The Treasury’s decision to let the Fed’s emergency lending facilities expire is unlikely to have a meaningful impact on credit spreads, and it may even increase the odds of getting another fiscal stimulus bill through Congress. Spread Product: Value is quickly disappearing from high-rated corporate bonds, and municipal bonds look like an attractive alternative. Stay overweight municipal bonds and corporate bonds rated Ba and higher. Avoid junk bonds rated B and lower. Feature Increasingly, financial markets look caught in a tug-of-war between two competing economic outlooks. On the one hand, the US sits on the precipice of what is likely to be a dark winter. COVID hospitalizations are breaking through prior peaks and deaths are following closely behind (Chart 1). On the other hand, excellent results from vaccine trials offer a ray of light in the not-too-distant future. Focusing on the next 1-to-2 months, economic activity is poised to slow. This is partly because many states will respond to the surging case count by enacting stricter lock-down measures (Chart 2). In fact, New York shuttered schools just last week. But even in the absence of stricter quarantine laws, consumers will certainly exercise greater caution this holiday season. Already, consumer sentiment looks to be waning at a time when more than 700 thousand people are filing new unemployment claims each week (Chart 2, bottom 2 panels). Chart 1A Dark Winter
A Dark Winter
A Dark Winter
Chart 2Look For Slower Growth In Q4
Look For Slower Growth In Q4
Look For Slower Growth In Q4
With consumer sentiment souring at a time when the household income support from the CARES act has expired, it is only a matter of time before consumer spending dips. Added to that, last week’s decision by the Treasury Department to call in the funds used to back-stop the Fed’s emergency lending facilities demonstrates that Donald Trump’s administration will be increasingly erratic during the next two months.1 Chart 3Treasury & Corporate Excess Returns
Treasury & Corporate Excess Returns
Treasury & Corporate Excess Returns
Heightened political uncertainty during a period of slowing economic growth should point to lower bond yields and wider credit spreads in the near term. But, at least so far, the market reaction has been muted (Chart 3). Treasuries have strengthened somewhat during the past week. Treasury returns in excess of cash are running at +735 bps, year-to-date. This is up from +617 bps on November 10th. However, year-to-date investment grade corporate returns in excess of duration-matched Treasuries just hit -121 bps, the highest since February. Year-to-date High-Yield excess returns have dipped to -72 bps, after peaking at -39 bps on November 9th. It’s possible that investors need more evidence of weakening economic growth before the market impact is really felt. Or, it could simply be that forward-looking markets are much more focused on news about the COVID vaccine, and that investors are willing to tolerate a couple months of poor growth if they are confident that better times lie ahead. It’s also conceivable that financial markets would look through a spate of poor economic data if investors believed that more fiscal stimulus is on the way. Given the protracted nature of fiscal negotiations so far, it’s fair to be skeptical that a deal can be struck. But with the election now over, the House Democrats and Senate Republicans may have a greater incentive to compromise on a small relief bill, on the order of $1 trillion or less. According to surveys, a compromise deal would curry favor with voters of all political stripes. Most Republicans, Democrats and Independents support further fiscal aid (Table 1). What’s more, having a timeline for vaccine distribution could make negotiations less contentious, since any stimulus can be sold as the final COVID relief bill before a vaccine is available. Finally, it’s possible that Treasury Secretary Steve Mnuchin’s gambit will pay off, and that policymakers will view the funds being returned by the Fed as “free money” that should be re-deployed in the form of fiscal support. All in all, we are optimistic that a moderately-sized relief bill will be passed, if not this year then early next year. Table 1The Public Supports Another Round Of Stimulus
Preparing For A Dark Winter … But Do Markets Care?
Preparing For A Dark Winter … But Do Markets Care?
Investment Implications Chart 4Better Value In Munis Than IG Corporates
Better Value In Munis Than IG Corporates
Better Value In Munis Than IG Corporates
With regards to our outlook for Treasury yields, we could see yields dip during the next month or two as the economic data weaken. However, we expect the knowledge that a vaccine is on the horizon will prevent yields from falling that much. We also could see progress made on a fiscal stimulus package, which would offset any downward pressure on yields. With that in mind, we advise investors to maintain below-benchmark portfolio duration on a 6-12 month horizon. On spread product, our investment conclusion is similarly colored by the tug of war between a negative near-term economic outlook and the positive news of a COVID vaccine. We recommend maintaining our current positioning: overweight investment grade corporates and Ba-rated junk, underweight junk bonds rated B and lower. If we do get some spread widening during the next month or two, driven by negative economic news or the expiry of the Fed’s emergency lending facilities, we would view that as an opportunity to get more aggressive by upgrading the lower-rated junk credit tiers. One caveat to our positive view on corporate credit is that value has deteriorated markedly in recent months, particularly for higher-rated investment grade corporates (Chart 4). At the same time, tax-exempt municipal bonds offer an exceptional spread pick-up relative to both Treasuries and equivalently-rated corporate bonds (Chart 4, bottom panel). We recommend that investors favor municipal bonds over corporate credit, particularly at the upper-end of the credit spectrum. The value in high-rated investment grade corporates has deteriorated markedly. Bottom Line: Maintain below-benchmark portfolio duration on a 6-12 month horizon. Stay overweight investment grade corporates and Ba-rated junk, while avoiding high-yield bonds rated B and below. Stand ready to upgrade low-rated junk bonds if spreads widen significantly during the next two months. Favor municipal bonds over equivalently-rated corporate credit, particularly at the upper-end of the credit spectrum. Treasury – Fed Disaccord As mentioned above, last week’s big news was that Treasury Secretary Steve Mnuchin sent a letter to the Federal Reserve saying that he would (a) not authorize an extension of some of the Fed’s emergency lending facilities beyond December 31st and (b) would like the Fed to return the unused funds that the Treasury Department had allocated to serve as the equity back-stop for those facilities. Though the Fed issued a statement saying that it would prefer to extend the facilities, Chair Powell eventually acceded to both requests. This means that the Secondary and Primary Market Corporate Credit Facilities (SMCCF & PMCCF), the Municipal Liquidity Facility (MLF), the Main Street Lending Facilities (MSLF) and the Term Asset-Backed Securities Loan Facility (TALF) will all cease operations at the end of the year.2 Gone For Good? Given the Fed’s stated desire for the facilities to continue and the fact that a new Treasury Secretary – presumably one that will show greater deference to the Fed – will take over in January. It’s conceivable that the facilities could be quickly re-started. If the Treasury had simply not authorized an extension of the facilities without taking its money back, this would be as simple as flicking a switch. The fact that the Fed will return the money makes the process slightly more complicated, but by no means impossible. The facilities in question are all structured as Special Purpose Vehicles (SPVs) to which the Treasury Department supplies some amount of equity financing. The Fed then loans money to the SPVs, levering them up dramatically in the process. Crucially, there is no statutory limit on the amount of leverage the Fed can provide to the SPVs. This means that the Fed could ramp them back up, even if it gets only a small injection of capital from the Treasury. A new Treasury Department could easily find enough money in the Exchange Stabilization Fund for the Fed to re-start the facilities in January, without seeking Congressional approval. While the Fed and Treasury will be able to re-start the facilities in January, we aren’t sure they will feel the need to do so. While the Fed and Treasury will be able to re-start the facilities in January, we aren’t sure they will feel the need to do so. In our view, Secretary Mnuchin has a point when he writes that markets are functioning well enough on their own. Simply look at how little the emergency facilities have been used (Table 2). The Fed has purchased only $13 billion of corporate bonds in the SMCCF. TALF has only been tapped for $3.75 billion and both the MSLF and MLF are operating at less than 1% of their maximum capacities. The PMCCF, which the Fed can use to purchase new issuance in the corporate bond market, has never been accessed! Table 2Usage Of The 2020 Federal Reserve Emergency Lending Facilities
Preparing For A Dark Winter … But Do Markets Care?
Preparing For A Dark Winter … But Do Markets Care?
Even the SMCCF, the facility through which the Fed buys corporate bonds and corporate bond ETFs in the secondary market, has significantly scaled back its purchases during the past few months. It also hasn’t purchased an ETF since August (Chart 5). Chart 5The Fed Is Not Very Active In The Corporate Bond Market
Preparing For A Dark Winter … But Do Markets Care?
Preparing For A Dark Winter … But Do Markets Care?
At a certain point, if the facilities aren’t being used, it is entirely reasonable to ask whether they are still necessary. They would no doubt prove useful if we hit another crisis – like in March – where spreads widen sharply and primary markets shut down. But that seems like a relatively low-risk tail event at this stage of the recovery. Finally, Secretary Mnuchin made the case in his letter that the returned funds from the Fed could be re-deployed as fiscal stimulus by Congress. This argument doesn’t make a lot of sense economically. When it scored the CARES act, the Congressional Budget Office assumed that the Treasury would take no losses on the money used to finance the Fed’s emergency lending facilities, so clawing those funds back has no impact on the deficit. But this may not matter. What matters is whether Senate Republicans can use the Treasury’s maneuver as political cover to justify voting for more fiscal relief. We think they might be able to do so, and we therefore see the Treasury’s move as increasing the odds of getting another fiscal relief bill through Congress. Investment Implications Chart 6MLF And TALF Aren't Pushing Yields Lower
MLF And TALF Aren't Pushing Yields Lower
MLF And TALF Aren't Pushing Yields Lower
This development does not immediately influence our recommended investment strategy. On corporate bonds, we can’t definitively rule out the possibility that the expiry of the facilities will cause spreads to widen in the near-term. But if that does occur, we will view it as an opportunity to quickly increase exposure. For municipal bonds, the MLF allows municipal governments to place new debt with the Fed at a rate that varies depending on the municipality’s credit rating. At present, that MLF rate is well above municipal bond yields for all credit ratings (Chart 6), meaning that it would only become important in the event of a crisis that caused municipal yields to rise sharply. Similarly, TALF allows participants to take out loans from the Fed using Aaa-rated securitizations as collateral. But the current yields on Aaa-rated consumer ABS and Aaa-rated non-agency CMBS are 91 bps and 33 bps below this rate, respectively (Chart 6, bottom panel). In other words, spreads would need to widen fairly sharply for TALF to be relevant for investors. The expiry of TALF is more concerning for CMBS than consumer ABS. Commercial real estate is structurally challenged by the current crisis, while consumer balance sheets are in good shape. We recommend overweighting consumer ABS across the entire credit spectrum but would limit non-agency CMBS exposure to the Aaa credit tier. Appendix: Buy What The Fed Is Buying The Fed rolled out a number of aggressive lending facilities on March 23. These facilities focused on different specific sectors of the US bond market. The fact that the Fed has decided to support some parts of the market and not others has caused some traditional bond market correlations to break down. It has also led us to adopt of a strategy of “Buy What The Fed Is Buying”. That is, we favor those sectors that offer attractive spreads and that benefit from Fed support. The below Table tracks the performance of different bond sectors since the March 23 announcement. We will use this to monitor bond market correlations and evaluate our strategy’s success. TablePerformance Since March 23 Announcement Of Emergency Fed Facilities
Preparing For A Dark Winter … But Do Markets Care?
Preparing For A Dark Winter … But Do Markets Care?
Ryan Swift US Bond Strategist rswift@bcaresearch.com Footnotes 1 The second section of this report (titled “Treasury – Fed Disaccord”) examines the specific market implications of the Treasury Department’s decision to not authorize an extension of the Fed’s emergency lending facilities. 2 For details on how these facilities are structured and what they are designed to do please see US Investment Strategy / US Bond Strategy Special Report, “Alphabet Soup: A Summary Of The Fed’s Anti-Virus Measures”, dated April 14, 2020 and US Investment Strategy / US Bond Strategy Special Report, “Alphabet Soup Part 2: Shocked And Awed”, dated July 28, 2020, available at usbs.bcaresearch.com Fixed Income Sector Performance Recommended Portfolio Specification
We are publishing the November issue of Charts That Matter. The key message from the charts on the following pages is that investor sentiment on global growth is elevated and the reflation trade is a bit overstretched. As a result, risk assets and commodities prices will likely correct, and the US dollar will rebound. Investors should keep dry powder to buy EM assets at a better entry point. A trigger for a selloff could be one or a combination of the following: the lack of a large US fiscal stimulus package, falling activity in Europe, peak stimulus in China or the recent jitter in the Chinese onshore corporate bond market. CHART OF THE WEEKThe Global Stock-To-Bond Ratio Is At A Critical Juncture
The Global Stock-To-Bond Ratio Is At A Critical Juncture
The Global Stock-To-Bond Ratio Is At A Critical Juncture
US Equity Sentiment Is Elevated US equity sentiment is somewhat elevated and is consistent with a correction in share prices. Chart 1US Equity Sentiment Is Elevated
US Equity Sentiment Is Elevated
US Equity Sentiment Is Elevated
Chart 2US Equity Sentiment Is Elevated
US Equity Sentiment Is Elevated
US Equity Sentiment Is Elevated
Peak Growth Sentiment Investors are quite optimistic on global growth. A record large net long positions in copper corroborate a very bullish investor stance on China/EM growth. From a contrarian perspective, this heralds a correction in commodities prices and EM as well as a rebound in the US dollar. Chart 3Peak Growth Sentiment
Peak Growth Sentiment
Peak Growth Sentiment
Chart 4Peak Growth Sentiment
Peak Growth Sentiment
Peak Growth Sentiment
Defensive Versus Cyclical Equity Segments Defensive sectors/markets have been underperforming and are oversold. Their outperformance is likely in the near term. Chart 5Defensive Versus Cyclical Equity Segments
Defensive Versus Cyclical Equity Segments
Defensive Versus Cyclical Equity Segments
Chart 6Defensive Versus Cyclical Equity Segments
Defensive Versus Cyclical Equity Segments
Defensive Versus Cyclical Equity Segments
Near-Term Risks To Industrial Metal Prices The Baltic Dry index is falling and iron ore prices have relapsed. This is consistent with diminishing Chinese imports of iron ore. However, iron ore inventories in China are not excessive, so odds are it is a correction and not a bear market in iron ore prices. Chart 7Near-Term Risks To Industrial Metal Prices
Near-Term Risks To Industrial Metal Prices
Near-Term Risks To Industrial Metal Prices
Chart 8Near-Term Risks To Industrial Metal Prices
Near-Term Risks To Industrial Metal Prices
Near-Term Risks To Industrial Metal Prices
Chart 9Near-Term Risks To Industrial Metal Prices
Near-Term Risks To Industrial Metal Prices
Near-Term Risks To Industrial Metal Prices
Chinese Imports Of Commodities Are At Risk From Destocking Starting April-May, Chinese imports of copper and other commodities was running at very high rates, exceeding any reasonable estimates of final demand. This suggests China has been accumulating commodities. Even as final demand continues recovering, China might diminish imports of commodities weighing on their prices in the near term. Chart 10Chinese Imports Of Commodities Are At Risk From Destocking
Chinese Imports Of Commodities Are At Risk From Destocking
Chinese Imports Of Commodities Are At Risk From Destocking
Chart 11Chinese Imports Of Commodities Are At Risk From Destocking
Chinese Imports Of Commodities Are At Risk From Destocking
Chinese Imports Of Commodities Are At Risk From Destocking
Oil Prices, Energy Stocks And Glencore Share Price Oil prices and energy stocks are facing a technical resistance. Yet, the share price of the world’s largest global commodity trader – Glencore – seems to be breaking out. The coming weeks will reveal which way the commodities complex will trade. Our bias is that a near-term correction is overdue. The US dollar holds the key, please refer to the next page. Chart 12Oil Prices, Energy Stocks And Glencore Share Price
Oil Prices, Energy Stocks And Glencore Share Price
Oil Prices, Energy Stocks And Glencore Share Price
Chart 13Oil Prices, Energy Stocks And Glencore Share Price
Oil Prices, Energy Stocks And Glencore Share Price
Oil Prices, Energy Stocks And Glencore Share Price
Rising US Real Rates (TIPS Yields) Will Lead To A US Dollar Rebound US inflation expectations – which have risen sharply since March – are likely to retreat as the US Senate does not approve a large fiscal stimulus package. Falling US inflation expectations will translate into higher TIPS yields. The latter and very bearish sentiment/positioning on the US dollar will trigger a rebound in the greenback. Chart 14Rising US Real Rates (TIPS Yields) Will Lead To A US Dollar Rebound
Rising US Real Rates (TIPS Yields) Will Lead To A US Dollar Rebound
Rising US Real Rates (TIPS Yields) Will Lead To A US Dollar Rebound
Chart 15Rising US Real Rates (TIPS Yields) Will Lead To A US Dollar Rebound
Rising US Real Rates (TIPS Yields) Will Lead To A US Dollar Rebound
Rising US Real Rates (TIPS Yields) Will Lead To A US Dollar Rebound
Chart 16Rising US Real Rates (TIPS Yields) Will Lead To A US Dollar Rebound
Rising US Real Rates (TIPS Yields) Will Lead To A US Dollar Rebound
Rising US Real Rates (TIPS Yields) Will Lead To A US Dollar Rebound
US Elections And The US Dollar: Is 2020 The Opposite Of 2016? After the 2016 US elections, the US dollar rallied strongly for several weeks and then it sold off considerably. It seems the broad trade-weighted dollar is following a reverse pattern now. It was selling off before the 2020 US elections and has continued weakening afterwards. If the reverse of the 2016 pattern persists, it means the US dollar is about make a major bottom and stage a playable rebound. Chart 17US Elections And The US Dollar: Is 2020 The Opposite Of 2016?
US Elections And The US Dollar: Is 2020 The Opposite Of 2016?
US Elections And The US Dollar: Is 2020 The Opposite Of 2016?
Chart 18US Elections And The US Dollar: Is 2020 The Opposite Of 2016?
US Elections And The US Dollar: Is 2020 The Opposite Of 2016?
US Elections And The US Dollar: Is 2020 The Opposite Of 2016?
Chart 19US Elections And The US Dollar: Is 2020 The Opposite Of 2016?
US Elections And The US Dollar: Is 2020 The Opposite Of 2016?
US Elections And The US Dollar: Is 2020 The Opposite Of 2016?
More Reasons To Expect A US Dollar Rebound The periods when US share prices outperform their global peers in local currency terms often coincide with strength in the US dollar. Recently, this relationship has broken down. The greenback might soon recouple to the upside, re-establishing this relationship (Chart 21). Besides, the broad trade-weighted dollar is very oversold (Chart 22). Chart 20More Reasons To Expect A US Dollar Rebound
More Reasons To Expect A US Dollar Rebound
More Reasons To Expect A US Dollar Rebound
Chart 21More Reasons To Expect A US Dollar Rebound
More Reasons To Expect A US Dollar Rebound
More Reasons To Expect A US Dollar Rebound
Rising Real US Yields And Growth Stocks Rising US TIPS yields could create headwinds for growth stocks. FAANG and Tencent share prices have risen about 20-fold since January 2010 – as much as the Nasdaq 100 did in the 1990s before topping out. Chart 22Rising Real US Yields And Growth Stocks
Rising Real US Yields And Growth Stocks
Rising Real US Yields And Growth Stocks
Chart 23Rising Real US Yields And Growth Stocks
Rising Real US Yields And Growth Stocks
Rising Real US Yields And Growth Stocks
Drivers Of EM Corporate And Sovereign Credit Spreads EM corporate and sovereign credit spreads are driven by EM exchange rates and commodities prices. A potential US dollar rebound and a correction in commodities prices warrant near-term caution on EM credit markets. Chart 24Drivers Of EM Corporate And Sovereign Credit Spreads
Drivers Of EM Corporate And Sovereign Credit Spreads
Drivers Of EM Corporate And Sovereign Credit Spreads
Chart 25Drivers Of EM Corporate And Sovereign Credit Spreads
Drivers Of EM Corporate And Sovereign Credit Spreads
Drivers Of EM Corporate And Sovereign Credit Spreads
Messages From Indicators And Chart Patterns Various indicators and technical chart configurations send mixed signals. Our bias is to expect a correction in risk assets in the near term. Chart 26Messages From Indicators And Chart Patterns
Messages From Indicators And Chart Patterns
Messages From Indicators And Chart Patterns
Chart 27Messages From Indicators And Chart Patterns
Messages From Indicators And Chart Patterns
Messages From Indicators And Chart Patterns
Chart 28Messages From Indicators And Chart Patterns
Messages From Indicators And Chart Patterns
Messages From Indicators And Chart Patterns
Chart 29Messages From Indicators And Chart Patterns
Messages From Indicators And Chart Patterns
Messages From Indicators And Chart Patterns
Peak Stimulus In China Fiscal stimulus is running out. In addition, the PBoC has been tightening liquidity in the interbank market and interest rates have risen. Banks’ loan approvals have rolled over. All these point to a peak in the credit and fiscal impulse as well as money impulses in Q4 2020. Does it mean China’s economy is about to decelerate? – refer to the next page. Chart 30Peak Stimulus In China
Peak Stimulus In China
Peak Stimulus In China
Chart 31Peak Stimulus In China
Peak Stimulus In China
Peak Stimulus In China
Chart 32Peak Stimulus In China
Peak Stimulus In China
Peak Stimulus In China
China: Business Cycle Expansion To Continue In H1 2021 Our credit and fiscal spending impulse points to a continuous expansion in the Chinese economy for now. If the credit and fiscal impulse rolls over in Q4 2020, as shown in the previous page, the business cycle in China will peak around middle of 2021 given the nine-month time lag between this impulse and economic data. Chart 33China: Business Cycle Expansion To Continue in H1 2021
China: Business Cycle Expansion To Continue in H1 2021
China: Business Cycle Expansion To Continue in H1 2021
Chart 35China: Business Cycle Expansion To Continue in H1 2021
China: Business Cycle Expansion To Continue in H1 2021
China: Business Cycle Expansion To Continue in H1 2021
Chart 34China: Business Cycle Expansion To Continue in H1 2021
China: Business Cycle Expansion To Continue in H1 2021
China: Business Cycle Expansion To Continue in H1 2021
Stress In The Chinese Onshore Corporate Bond Market The recent defaults by several SOEs on their bond payments have led to a spike in corporate bond yields. However, there is no stable historical relationship between onshore corporate bond yields and the A-share market. Chart 36Stress In The Chinese Onshore Corporate Bond Market
Stress In The Chinese Onshore Corporate Bond Market
Stress In The Chinese Onshore Corporate Bond Market
Chart 37Stress In The Chinese Onshore Corporate Bond Market
Stress In The Chinese Onshore Corporate Bond Market
Stress In The Chinese Onshore Corporate Bond Market
Chart 38Stress In The Chinese Onshore Corporate Bond Market
Stress In The Chinese Onshore Corporate Bond Market
Stress In The Chinese Onshore Corporate Bond Market
China: Can Share Prices Rally Amid Rising Corporate Borrowing Costs? During periods of rising onshore corporate bond yields, the MSCI ex-TMT Investable equity index rallied if Chinese EPS expectations where improving. The latest rollover in EPS growth expectations amid rising corporate bond yields is a warning to share prices. Chart 39China: Can Share Prices Rally Amid Rising Corporate Borrowing Costs?
China: Can Share Prices Rally Amid Rising Corporate Borrowing Costs?
China: Can Share Prices Rally Amid Rising Corporate Borrowing Costs?
Chinese And EM Equity Relative Performance Versus Global Stocks China’s outperformance versus global stocks has been due to its TMT stocks (Alibaba, Tencent and Meituan). In turn, excluding Chinese stocks, EM ex-China has not really outperformed the global equity index. Chart 40Chinese And EM Equity Relative Performance Versus Global Stocks
Chinese And EM Equity Relative Performance Versus Global Stocks
Chinese And EM Equity Relative Performance Versus Global Stocks
Chart 41Chinese And EM Equity Relative Performance Versus Global Stocks
Chinese And EM Equity Relative Performance Versus Global Stocks
Chinese And EM Equity Relative Performance Versus Global Stocks
Various EM Equity Indexes Till very recent (before the announcement of progress in vaccines), EM small caps, the equal-weighted index, EM ex-TMT stocks and the EM index ex-China, Korea and Taiwan had been lackluster. Will the latest spike persist? It depends on the S&P500 and global risk asset performance. Chart 42Various EM Equity Indexes
Various EM Equity Indexes
Various EM Equity Indexes
Chart 43Various EM Equity Indexes
Various EM Equity Indexes
Various EM Equity Indexes
Chart 44Various EM Equity Indexes
Various EM Equity Indexes
Various EM Equity Indexes
Chart 45Various EM Equity Indexes
Various EM Equity Indexes
Various EM Equity Indexes
Emerging Asia And Overall EM Relative Equity Performance Versus Global Stocks Emerging Asia’s and overall EM relative performance versus global stocks is unlikely to break out now. We continue recommending a neutral allocation to EM equities in a global equity portfolio. Chart 46Emerging Asia And Overall EM Relative Equity Performance Versus Global Stocks
Emerging Asia And Overall EM Relative Equity Performance Versus Global Stocks
Emerging Asia And Overall EM Relative Equity Performance Versus Global Stocks
Chart 47Emerging Asia And Overall EM Relative Equity Performance Versus Global Stocks
Emerging Asia And Overall EM Relative Equity Performance Versus Global Stocks
Emerging Asia And Overall EM Relative Equity Performance Versus Global Stocks
Chart 48Emerging Asia And Overall EM Relative Equity Performance Versus Global Stocks
Emerging Asia And Overall EM Relative Equity Performance Versus Global Stocks
Emerging Asia And Overall EM Relative Equity Performance Versus Global Stocks
Chart 49Emerging Asia And Overall EM Relative Equity Performance Versus Global Stocks
Emerging Asia And Overall EM Relative Equity Performance Versus Global Stocks
Emerging Asia And Overall EM Relative Equity Performance Versus Global Stocks
Equities Recommendations Currencies, Credit And Fixed-Income Recommendations
Highlights The stock market’s 60 percent rally since mid-March is reaching a near-term valuation test. Sell stocks and wait on the side lines if the 10-year T-bond yield rises by 0.3 percent. Go aggressively overweight T-bonds on any modest rise in yields. New recommendation: Go overweight healthcare versus technology on a 6-12-month investment horizon. New recommendation: Go overweight Europe versus Emerging Markets on a 6-12-month investment horizon. Fractal trade: Fractal analysis supports the decision to go overweight healthcare versus technology. Feature Since early 2018, a rise in the long bond yield has sent shudders through the stock market on four occasions: February 2018, October 2018, April 2019, and January 2020. On all four occasions, the tipping point was the earnings yield premium on tech stocks versus the 10-year T-bond yield falling towards its lower limit of 2.5 percent (Chart of the Week). Chart of the WeekSell Stocks If The Bond Yield Rises By 0.3 Percent
Sell Stocks If The Bond Yield Rises By 0.3 Percent
Sell Stocks If The Bond Yield Rises By 0.3 Percent
Today, this all-important yield premium stands at 2.8 percent. Meaning that it would take the 10-year T-bond yield to rise by just 30 basis points to retest this four times tipping point. Alternatively, with the T-bond yield unchanged, the tipping point would be retested if tech stocks rallied by around 10 percent. The stock market’s 60 percent rally since mid-March is reaching a near-term valuation test. Crucially, this means that the stock market’s 60 percent rally since mid-March is reaching a near-term valuation test. We recommend selling stocks and waiting on the side lines if the earnings yield gap on tech stocks versus the T-bond yield approaches its lower limit of 2.5 percent – from any combination of moderately higher bond yields or higher stock prices over the coming weeks. Record Low Bond Yields Have Lifted The Stock Market To An All-Time High ‘A once-in-a-century global pandemic lifts the world stock market to an all-time high’ sounds like an obscene headline. Yet this is the correct narrative for 2020. Yes, the European stock market is still languishing 10 percent below its mid-February peak. But the much larger and tech-heavy US stock market stands 10 percent higher, taking the world market to around 5 percent higher (Chart I-2). How can the aggregate market stand at an all-time high when a terrible plague continues to ravage the global economy? The simple answer: because of record low bond yields. Chart I-2Record Low Bond Yields Have Lifted The Stock Market To An All-Time High
Record Low Bond Yields Have Lifted The Stock Market To An All-Time High
Record Low Bond Yields Have Lifted The Stock Market To An All-Time High
Back on February 27, we wrote: “for stock markets, the best inoculation against Covid-19 is ultra-low bond yields.” And so it proved. Though stock market profits are down by 15 percent this year, the multiple paid for those profits is up by 20 percent, resulting in a 5 percent uplift in the market price (Chart I-3). Chart I-3Valuations, Not Profits, Are Driving The Stock Market
Valuations, Not Profits, Are Driving The Stock Market
Valuations, Not Profits, Are Driving The Stock Market
Specifically, tech sector valuations have become hyper-sensitive to any change in the long bond yield (Chart I-4). Meaning that for those stock markets with a high weighting to tech stocks, the valuation boost from a decline in bond yields has more than countered the profit slump from the pandemic. In fact, the pivotal role of bond yields precedes the pandemic. For the past three years, a good motto for investors has been: don’t focus on profits, focus on valuations. Chart I-4Valuations, Not Profits, Are Driving The Tech Sector
Valuations, Not Profits, Are Driving The Tech Sector
Valuations, Not Profits, Are Driving The Tech Sector
The Biggest Threat To The Stock Market Is Higher Bond Yields Through 2018-19, stock market profits drifted sideways. Yet the stock market fell 30 percent, then rose 30 percent – because the multiple paid for the profits plunged in 2018 then surged in 2019. In 2020, as the pandemic devastated profits, a further surge in the multiple immunised the stock market against the ravages of Covid-19. The dramatic swing in multiples was driven by the dramatic swing in bond yields. This is hardly surprising given that the prospective return on equities is sensitive to the prospective return offered by competing long-duration bonds. But at ultra-low bond yields, this sensitivity becomes hyper-sensitivity. When bond yields approach their lower limit, bond prices approach their upper limit. This means that the scope for further price rises diminishes while the scope for price collapses increases. For proof, just look at Swiss 10-year bonds. Their prices can barely rise anymore! Yet they can fall precipitously (Chart I-5). In short, the lower that bond yields go, the riskier that bonds become as an investment. Chart I-5Swiss Bond Prices Can Barely Rise, But They Can Fall A Lot
Swiss Bond Prices Can Barely Rise, But They Can Fall A Lot
Swiss Bond Prices Can Barely Rise, But They Can Fall A Lot
As bonds become a riskier investment, the excess return on equities versus bonds, the equity risk premium (ERP), collapses towards zero. After all, if the riskiness of equities and bonds converges, then any risk premium must disappear. The result is that the prospective return (discount rate) required on equities declines exponentially, because both of its components – the bond yield plus the ERP – decline in tandem. Given that valuation is just the inverse of the discount rate, the valuation of equities rises exponentially when the bond yield declines to an ultra-low level. Conversely, the valuation of equities falls exponentially when the bond yield rises from an ultra-low level. The valuation of equities rises exponentially when the bond yield declines to an ultra-low level. Yet doesn’t a higher bond yield also imply a higher nominal growth rate for profits, which should be good for the stock market? Yes, but understand that the increase in the discount rate (nominal bond yield plus ERP) will be much larger than the increase in the profit growth rate. The result is a plunge in the stock market’s net present value. Once you grasp this exponential relationship, the penny suddenly drops. The pandemic has proved that the biggest structural threat to the stock market does not come from a negative growth shock like a once-in-a-century global plague. The pandemic has been good for the aggregate stock market because it has forced bond yields to decline to ultra-low levels. Instead, the biggest threat to the stock market is higher bond yields. Please note that this disagrees with the BCA house view – which does not preclude stocks from rising even if yields rise by 0.3 percent, if this takes place against the backdrop of better growth prospects. Sell Stocks If The Bond Yield Rises By 0.3 Percent As the first chart powerfully illustrates, higher bond yields sent shudders through the stock market on four occasions in the past three years. We are close to a similar near-term valuation test. Of course, given enough time, a gradual rise in earnings can lift the tech earnings yield gap versus the bond yield to well above its danger level of 2.5 percent. However, over shorter periods, it would require stock prices and/or bond yields to stop rising. Or indeed, to reverse. For equities, the upshot is that the 60 percent rally since mid-March is reaching near-term exhaustion. We recommend selling stocks and waiting on the side lines if the 10-year T-bond yield was to rise by another 30 bps. For bonds, the upshot is that all else being equal, 10-year bond yields can rise by no more than 30 basis points before sending shudders through the stock market. Which would then cause bond yields to give back their gains, as they did on each of the four previous occasions that higher bond yields spooked the stock market. On this basis, it is not worth underweighting bonds. The much smarter strategy is to go aggressively overweight T-bonds on any modest rise in yields. Within equity sectors, there are three arguments in favour of healthcare. First, while the tech sector earnings yield gap versus the T-bond yield is approaching its lower limit of 2.5 percent, the healthcare sector earnings yield gap stands at a very comfortable and attractive 4.1 percent, well above its recent lower limit of 2.0 percent (Chart I-6). Second, unlike tech, the healthcare sector rally is being driven by profits, not by a valuation uplift (Chart I-7). Third, fractal analysis confirms that the massive underperformance of healthcare versus technology is reaching technical exhaustion (see last section). Chart I-6Healthcare's Earnings Yield Premium Looks Very Attractive
Healthcare's Earnings Yield Premium Looks Very Attractive
Healthcare's Earnings Yield Premium Looks Very Attractive
Chart I-7Profits, Not Valuation, Are Driving The Healthcare Sector
Profits, Not Valuation, Are Driving The Healthcare Sector
Profits, Not Valuation, Are Driving The Healthcare Sector
Hence, today we are recommending that on a 6-12-month horizon, equity investors should go overweight healthcare versus technology. Go Overweight Europe Versus Emerging Markets Finally, sector strategy has huge implications for regional and country allocation. Given that the European stock market is overweight healthcare and emerging markets (EM) is overweight technology, the decision to overweight Europe versus EM is simply the decision to overweight healthcare versus technology. Nothing more, and nothing less (Chart I-8). Chart I-8Europe Versus EM = Healthcare Versus Tech
Europe Versus EM = Healthcare Versus Tech
Europe Versus EM = Healthcare Versus Tech
Hence, today we are also recommending that on a 6-12-month horizon, equity investors go overweight Europe versus emerging markets. Fractal Trading System* Supporting the fundamental arguments for healthcare versus tech in the main body of this report, the 130-day fractal structure of relative performance is extremely fragile. This implies that the massive underperformance of healthcare versus tech is at a potential inflection point. Accordingly, this week’s recommenced trade is to go long healthcare versus technology. Set the profit target and symmetrical stop-loss at 6 percent. In other trades, we are pleased to report that long financials versus basic resources achieved its 3.5 percent profit target, and short MSCI India versus MSCI Czech Republic achieved its 8 percent profit target. The rolling 1-year win ratio now stands at 54 percent. Chart I-9
World: Healthcare Vs. Technology
World: Healthcare Vs. Technology
When the fractal dimension approaches the lower limit after an investment has been in an established trend it is a potential trigger for a liquidity-triggered trend reversal. Therefore, open a countertrend position. The profit target is a one-third reversal of the preceding 13-week move. Apply a symmetrical stop-loss. Close the position at the profit target or stop-loss. Otherwise close the position after 13 weeks. * For more details please see the European Investment Strategy Special Report “Fractals, Liquidity & A Trading Model,” dated December 11, 2014, available at eis.bcaresearch.com. Dhaval Joshi Chief European Investment Strategist dhaval@bcaresearch.com Fractal Trading System Cyclical Recommendations Structural Recommendations Closed Fractal Trades Trades Closed Trades Asset Performance Currency & Bond Equity Sector Country Equity Indicators Bond Yields Chart II-1Indicators To Watch - Bond Yields
Indicators To Watch - Bond Yields
Indicators To Watch - Bond Yields
Chart II-2Indicators To Watch - Bond Yields
Indicators To Watch - Bond Yields
Indicators To Watch - Bond Yields
Chart II-3Indicators To Watch - Bond Yields
Indicators To Watch - Bond Yields
Indicators To Watch - Bond Yields
Chart II-4Indicators To Watch - Bond Yields
Indicators To Watch - Bond Yields
Indicators To Watch - Bond Yields
Interest Rate Chart II-5Indicators To Watch - Interest Rate Expectations
Indicators To Watch - Interest Rate Expectations
Indicators To Watch - Interest Rate Expectations
Chart II-6Indicators To Watch - Interest Rate Expectations
Indicators To Watch - Interest Rate Expectations
Indicators To Watch - Interest Rate Expectations
Chart II-7Indicators To Watch - Interest Rate Expectations
Indicators To Watch - Interest Rate Expectations
Indicators To Watch - Interest Rate Expectations
Chart II-8Indicators To Watch - Interest Rate Expectations
Indicators To Watch - Interest Rate Expectations
Indicators To Watch - Interest Rate Expectations
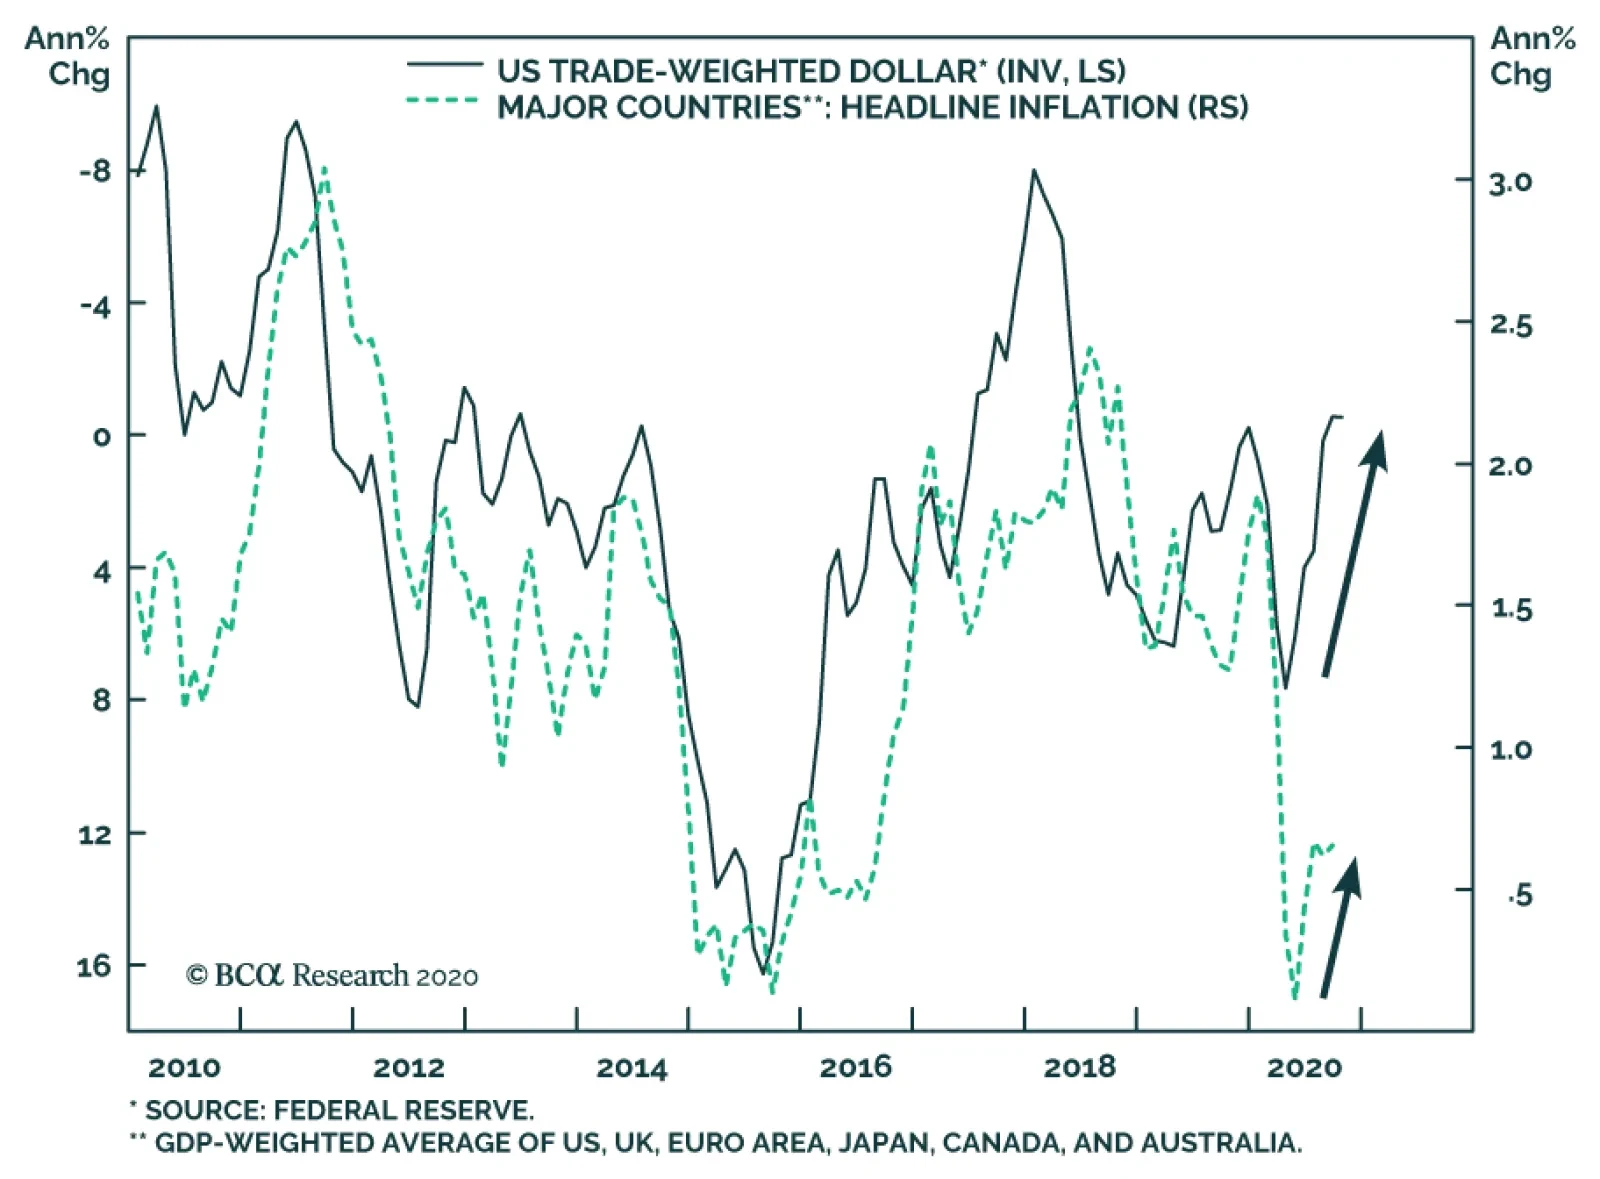
BCA Research's Global Fixed Income Strategy service recently highlighted that an increasing number of central banks have raised concerns about unwanted currency appreciation. On the surface, more US dollar weakness should be welcome by policymakers…
Highlights COVID-19: Markets are trading off the longer-term positive news on COVID-19 vaccines, rather than the shorter-term negative news of surging numbers of new virus cases in Europe and North America. This will continue as long as the vaccine results stay promising, further boosting global equity and credit market performance, especially versus government bonds, as investors price in a return to “normalcy”. FX & Monetary Policy: An increasing number of central banks have raised concerns about unwanted currency appreciation. With interest rates stuck near-zero, asset purchases and balance sheet expansion will be the marginal policy tool used to limit currency moves, especially vs the US dollar. The greater impact will be on bond yield spreads versus US Treasuries with the Fed being less aggressive on QE. Stay underweight the US in global government bond portfolios. Feature Chart of the WeekMarkets Reacting Calmly To This COVID-19 Surge
Markets Reacting Calmly To This COVID-19 Surge
Markets Reacting Calmly To This COVID-19 Surge
With US election uncertainty now fading away on a stream of failed Trump legal challenges, investors have turned their attention back to COVID-19. On that front, there has been both good and bad news. New cases and hospitalizations have surged across the US and Europe, leading to renewed economic restrictions to slow the spread at a time when governments are dragging their heels on fresh fiscal stimulus measures. Yet markets are seeing past the near-term hit to growth, focusing on the positive news from both Pfizer and Moderna about their COVID-19 vaccine trials with +90% success rates. With markets looking ahead to a possible end to the pandemic, growth sensitive risk assets have taken off. The S&P 500 is now at an all-time high, with beaten-up cyclical sectors outperforming. Market volatility is calm, with the VIX index back down to the low-20s. The riskier parts of the corporate bond universe are rallying hard, with CCC-rated US junk bond spreads tightening back to levels last seen in May 2019. Even the US dollar, which tends to weaken alongside improving global growth perceptions, continues to trade with a soggy tone - the Fed’s trade-weighted dollar index has fallen to a 19-month low (Chart of the Week). Expect more non-US quantitative easing (QE) over the next 6-12 months, to the benefit of non-US government bond performance. The weakening trend of the US dollar has already become a monetary policy issue for some central banks that do not want to see their own currencies appreciate versus the greenback at a time of depressed inflation expectations. Expect more non-US quantitative easing (QE) over the next 6-12 months, to the benefit of non-US government bond performance. There Is Room For Optimism Amid More Lockdowns The latest wave of coronavirus spread has dwarfed anything seen since the start of the pandemic. The number of daily new cases in the US, scaled by population, has climbed to 430 per million people in the US, setting a sad new high for the pandemic. The numbers are even worse in Europe, led by France where the number of new cases reached a high of 757 per million people on November 8 (Chart 2A). COVID-19 related hospitalization rates have also surged in the US and Europe, straining the capacity of health care systems to care for the newly sickened. In Europe, governments have already imposed severe restrictions on activity to limit the spread of the virus. According the data from Oxford University, the so-called “Government Response Stringency Index”, designed to measure the depth and intensity of lockdown measures such as school closures and travel restrictions, has returned to levels last seen during the first lockdowns back in March and April (Chart 2B). Chart 2AA Huge Second Wave of COVID-19
A Huge Second Wave of COVID-19
A Huge Second Wave of COVID-19
Chart 2BEconomic Restrictions Weighing On European Growth Vs US
Economic Restrictions Weighing On European Growth Vs US
Economic Restrictions Weighing On European Growth Vs US
Oxford data on spending on sectors most impacted by lockdowns, like retail and recreation, also show declines in Europe and the UK similar in magnitude to those seen last spring. The data in the US, on the other hand, shows no nationwide pickup in lockdown stringency, or decline in spending. While economic restrictions are starting to be imposed in parts of the US, the hit to the overall domestic economy, so far, has been limited compared to what has taken place on the other side of the Atlantic. To be certain, the positive headlines on the vaccines will limit the ability of US local governments to impose unpopular restrictions anywhere near as severe as was seen earlier this year. Yet even if a vaccine ready for mass inoculation arrives relatively quickly, it will not be a smooth path to getting widespread public acceptance of the vaccine. According to a Pew Research survey conducted in late September, only 51% of Americans would take a COVID-19 vaccine as soon as it was available (Chart 3). This was down from 72% in a similar survey conducted in May during the panic of the first US wave of the virus. The declines in willingness to take the vaccine were consistent across groupings of age, race, education and political leanings. Of those who said they would not take a vaccine right away, 76% cited a concern about potential side effects as a major reason. Chart 3Most Americans Are Wary Of A COVID-19 Vaccine
Nobody Wants A Stronger Currency
Nobody Wants A Stronger Currency
So even with an effective vaccine now on the horizon, it may take some time to convince people that it is safe to take it. What is clear now, however, is that economic sentiment took a hit from the surge in COVID-19 cases before the vaccine news arrived. The latest ZEW survey of economic forecasters, published last week, showed a decline in growth expectations across the developed economies in the early days of November (Chart 4). The decline occurred for all countries, including the US, but was most severe for the UK, where there are not only new COVID-19 lockdowns but also the looming risk of a messy upcoming resolution to the Brexit saga. Yet the net balance of survey respondents was still positive for all countries in the survey, suggesting that underlying economic sentiment remains robust even in the face of more COVID-19 cases and increased lockdowns in Europe. The ZEW survey also asks questions on sentiment for other factors besides growth. Expectations for longer-term bond yields have moved moderately higher in recent months, as have inflation expectations, although both took a slight dip in the latest survey (Chart 5). No changes for short-term interest rates are expected, consistent with most central banks promising to keep policy rates near 0% for at least the next couple of years. Chart 4COVID-19 Surge Weighing On Global Growth Expectations
COVID-19 Surge Weighing On Global Growth Expectations
COVID-19 Surge Weighing On Global Growth Expectations
While global bond yield expectations have clearly bottomed, the ZEW survey shows that expectations for global equity and currency markets have also shifted in what appears to be pro-growth fashion. Chart 5Global Interest Rate Expectations Have Bottomed
Global Interest Rate Expectations Have Bottomed
Global Interest Rate Expectations Have Bottomed
Survey respondents expect both the US dollar and British pound to weaken versus the euro. At the same time, expectations for future equity market returns have improved, even for European bourses full of companies whose profitability would presumably suffer with a stronger euro (Chart 6). As the US dollar typically trades as an “anti-growth” currency, depreciating during global growth upturns and vice versa, greater bullishness on global equities and more bearishness on the US dollar are not inconsistent views – especially with bond yield and inflation expectations also rising. Greater bullishness on global equities and more bearishness on the US dollar are not inconsistent views – especially with bond yield and inflation expectations also rising. Chart 6Bullish Equity Sentiment, Bearish USD Sentiment
Bullish Equity Sentiment, Bearish USD Sentiment
Bullish Equity Sentiment, Bearish USD Sentiment
The big question that investors must now grapple with is if the near-term hit to growth from the latest COVID-19 surge will be large enough to offset the more medium-term improvement in economic sentiment with a vaccine now more likely to be widely distributed in 2021. Given the message from bullish equity and corporate credit markets, and with US Treasury yields drifting higher even with US COVID-19 cases surging, investors are clearly viewing the vaccine news as more significant for medium-term growth than increased near-term economic restrictions. We agree with that conclusion. We continue to recommend staying moderately below-benchmark on overall duration exposure, with an overweight tilt towards corporate credit versus government bonds, in global fixed income portfolios. A more comprehensive breakdown of the US dollar would be a signal that investors have grown even more comfortable with the economic outlook for 2021. Chart 7A New Leg Of USD Weakness On The Horizon?
A New Leg Of USD Weakness On The Horizon?
A New Leg Of USD Weakness On The Horizon?
A more comprehensive breakdown of the US dollar would be a signal that investors have grown even more comfortable with the economic outlook for 2021. The DXY index now sits at critical downside resistance levels, while a basket of commodity-sensitive currencies tracked by our foreign exchange strategists is approaching upside trendline resistance (Chart 7). While emerging market (EM) currencies have generally lagged the US dollar weakness story of the past several months, the Bloomberg EM Currency Index is also approaching a potentially important breakout point. The US dollar is very technically oversold now, so some consolidation of recent moves is likely needed before a new wave of weakness can unfold. Any such breakout of non-US currencies versus the US dollar will open up a whole new assortment of problems for policymakers outside the US, however – particularly those suffering from depressed inflation expectations. Bottom Line: Markets are trading off the longer-term positive news on COVID-19 vaccines, rather than the shorter-term negative news of surging numbers of new virus cases in Europe and North America. This will continue as long as the vaccine results stay promising, further boosting global equity and credit market performance, especially versus government bonds, as investor’s price in a return to “normalcy”. Currency Wars 2.0? On the surface, more US dollar weakness should be welcome by policymakers around the world. Much of the downward pressure on global traded goods prices over the past decade can be traced to the stubborn strength of the greenback. With the Fed’s trade-weighted dollar index now -1.9% lower on a year-over-year basis, global export prices and commodity indices like the CRB Raw Industrials are no longer deflating (Chart 8). While a weaker US dollar would help mitigate the downward pressure on global inflation rates from traded goods prices, such a move would hardly be welcomed everywhere. Within the developed world, some countries are currently suffering from more underwhelming inflation rates than others. The link between currency swings and headline inflation is particularly strong in the US, euro area and Australia (Chart 9). While a weaker dollar has helped lift headline US CPI inflation over the past few months, a stronger euro and Australian dollar have dampened euro area and Australian realized inflation. It should come as no surprise that both the European Central Bank (ECB) and Reserve Bank of Australia (RBA) have recently cited currency strength as a factor weighing on their latest dovish policy choices. Chart 8An Inflationary Impulse From A Weaker USD
An Inflationary Impulse From A Weaker USD
An Inflationary Impulse From A Weaker USD
There is not only a link between exchange rates and inflation for policymakers to worry about – currencies represent an important part of financial conditions, and therefore growth, in many countries. Chart 9Currency Impact On Inflation Greater In Some Countries
Currency Impact On Inflation Greater In Some Countries
Currency Impact On Inflation Greater In Some Countries
Chart 10Biggest Currency Impact On Financial Conditions Outside The US
Biggest Currency Impact On Financial Conditions Outside The US
Biggest Currency Impact On Financial Conditions Outside The US
Financial conditions indices, which combine financial variables like equity prices and corporate bond yields, typically place a big weighting on trade-weighted currencies in countries with large export sectors like the euro area, Japan, Canada and Australia (Chart 10). This makes sense, as a strengthening currency represents a meaningful drag on growth via worsening export competitiveness. In the US with its relatively more closed economy and greater reliance on market-based corporate finance, the dollar is a less important factor determining financial conditions. So what can central banks do to limit appreciation of their currencies? The choices are limited when policy rates are at 0% as is the case in most developed countries. Negative policy rates are a possible option to help weaken currencies, but seeing how negative rates have destroyed the profitability of Japanese and euro area banks, central bankers in other countries are reluctant to go down that road. It is noteworthy that the two central banks that have made the loudest public flirtation with negative rates in 2020, the Bank of England (BoE) and the Reserve Bank of New Zealand (RBNZ), have not yet pulled the trigger on that move. Both have chosen to go down a more “traditional” route doing more QE to ease monetary policy at a time of weak domestic inflation. The ECB is set to do the same thing next month, increasing its balance sheet via asset purchases and cheap bank funding in an attempt to stem the dramatic decline in euro area inflation expectations. Currencies represent an important part of financial conditions, and therefore growth, in many countries. Can more QE help weaken currency levels in any individual country? Like anything involving currencies, it must be considered on a relative basis to developments in other countries. In Chart 11, we plot the ratio of the Fed’s balance sheet to other developed economy central bank balance sheets versus the relevant US dollar currency pair. The thick dotted lines denote the projected balance sheet ratio based on current central bank plans for asset purchases.1 The visual evidence over the past few years suggests a weak correlation between balance sheet ratios and currency levels. At best, more QE can help mitigate currency appreciation that would otherwise have occurred – which might be all that the likes of the RBA and RBNZ can hope for now. There is a more robust correlation is between relative balance sheets and cross-country government bond spreads. Where there is a more robust correlation is between relative balance sheets and cross-country government bond spreads (Chart 12). This is reasonable since expanding QE purchases of government bonds can dampen the level of bond yields - either by signaling a desire to push rate hikes further into the future (forward guidance) or by literally creating a demand/supply balance for bonds that is more favorable for higher bond prices and lower yields. Chart 11Relative QE Matters Less For Currencies
Relative QE Matters Less For Currencies
Relative QE Matters Less For Currencies
Chart 12Relative QE Matters More For Bond Yield Spreads
Relative QE Matters More For Bond Yield Spreads
Relative QE Matters More For Bond Yield Spreads
This is the critical point to consider for investors: the more efficient way to play the relative QE game is through cross-country bond spread trades, not currency trades. On that basis, favoring government bonds of countries where central banks have turned more aggressive with expanding their QE programs – like the UK, Australia and Canada – relative to the debt of countries where the pace of QE has slowed – like the US, Japan and Germany – in global bond portfolios makes sense (Chart 13). Although in the case of Germany (and euro area debt, more generally), we see the ECB’s likely move to ramp up asset purchases at next month’s policy meeting moving euro area bonds into the “expanding QE” basket of countries. Chart 13More Non-US QE Will Support Non-US Bond Outperformance
More Non-US QE Will Support Non-US Bond Outperformance
More Non-US QE Will Support Non-US Bond Outperformance
Chart 14Central Banks Are Increasingly 'Funding' Government Spending
Central Banks Are Increasingly 'Funding' Government Spending
Central Banks Are Increasingly 'Funding' Government Spending
One final note: central banks that choose to expand their QE buying of government bonds may actually provide the biggest economic benefit by “funding” fiscal stimulus and limiting the damage to bond yields from rising budget deficits (Chart 14). This may be the most important factor to consider as governments contemplate more stimulus measures to offset any short-term hit to growth from the rising spread of COVID-19. Bottom Line: With interest rates stuck near-zero, asset purchases and balance sheet expansion will be the marginal policy tool used to limit currency moves, especially versus the US dollar. The greater impact will be on bond yield spreads versus US Treasuries with the Fed being less aggressive on QE. Stay underweight the US in global government bond portfolios. Robert Robis, CFA Chief Fixed Income Strategist rrobis@bcaresearch.com Footnotes 1 The projections incorporate the following: by June 2021, the Fed grows its balance sheet by US$840 billion, the ECB by €600 billion, the BoJ by ¥80 trillion, the BoE by £150 billion, the BoC by C$180 billion, and the RBA by A$100 billion. Recommendations The GFIS Recommended Portfolio Vs. The Custom Benchmark Index
Nobody Wants A Stronger Currency
Nobody Wants A Stronger Currency
Duration Regional Allocation Spread Product Tactical Trades Yields & Returns Global Bond Yields Historical Returns