Fixed Income

Highlights The vaccine promises an eventual return to “normal” life – just as Americans voted to “return to normalcy.” Markets are cheering and hinting at an eventual rotation into value stocks. The contested US election can still cause volatility even though Trump is highly unlikely to change the result. The fiscal stimulus cliff is still a risk to the normalcy rally in the short run. But gridlock is the best political outcome over the coming 12-24 months. Stay strategically long global stocks over bonds. Tactically maintain safe-haven positions, add risk gradually, and stay short China/Taiwan. Feature The news of Pfizer’s success in developing a COVID-19 vaccine galvanized financial markets this week. America’s leading public health official Anthony Fauci also predicted that Moderna’s vaccine candidate would be similarly effective. It will take time to distribute these vaccines but the world can look toward economic recovery next year. Stocks rallied, bonds sold off, and value outperformed growth on the back of the news (Charts 1A and 1B). Chart 1ABiden: Return To Normalcy
Biden: Return To Normalcy
Biden: Return To Normalcy
Chart 1BVaccine: Return To Normalcy
Vaccine: Return To Normalcy
Vaccine: Return To Normalcy
The vaccine announcement super-charged the “return to normalcy” rally that followed the US election. The election’s likeliest policy outcome is that President Elect Joe Biden will not raise sweeping tariffs while Republican senators will not raise taxes next year, the best-case scenario for markets. This is genuinely positive news. The benefits are very clear over the next 12 months. But the risks are also very clear over the next three months: the virus will remain a problem until the vaccine is widely distributed, the US is in the midst of a contested election that could still cause negative surprises, the Republican senators are less likely to agree to fiscal relief, and President Trump will take aggressive actions to cement his legacy during the “lame duck” period of his last 68 days in office. The takeaway is that the US dollar will see a near-term, counter-trend rally and developed markets will outperform emerging markets for a while longer. We are only gradually adding risk to our strategic portfolio as we keep dry powder and maintain tactical safe-haven trades. Is The Election Over Or Not? Yes, most likely the election is over. But our definitive guide to contested US elections will teach any reader to be sensitive to the tail risks. The counting of ballots is not finished and the Electoral College does not vote until December 14. First, it is still possible that President Trump could pull off a victory in Georgia, which will now recount ballots by hand. Biden’s margin of victory of 14,045 votes is not so large there as to make it impossible that Trump would come back with a win (though history suggests recounts only change hundreds, not thousands, of votes). Trump is also narrowing the gap in Arizona, where counting continues, though the latest reports suggest he is still falling short of the roughly 60% share of late ballots that he needs to close the 11,635 vote gap and win the state. Second, there is a 50/50 chance that the Supreme Court will rule that Pennsylvania must stick to the statutory November 3 deadline, i.e. not accept mail-in ballots that arrived in the three days after that date. While the high court would prefer to let Pennsylvania settle its own affairs, this case is of the sort that the court could feel compelled to weigh in. The constitution is crystal clear that legislatures, not courts, decide how a state’s electors are chosen. Such a ruling probably would not reverse Biden’s projected victory in Pennsylvania. Trump is currently trailing Biden by 53,980 votes in this state. State officials say that the ballots that arrived late amount to only 7,800 and would not be able to change the outcome.1 This may be understating the risk but it is probably accurate in the main. Table 1 shows the share of mail-in votes that arrived late in this year’s primary elections. The share was 1.07% in Pennsylvania and up to 3% in other states. Applying the high water mark of 3% to the November 3 general election mail-in ballots, it is possible that 77,187 votes arrived late and would be excluded by a Supreme Court ruling. However, 85% of those ballots would have to have gone to Biden in order for Trump to come out the winner. This is far-fetched. Table 1Share Of Ballots Arriving Late In Primary Election Extrapolated To General Election
The "Normalcy" Rally
The "Normalcy" Rally
It is also unlikely that Republican legislatures will take matters into their own hands and defy the election boards of their state by nominating their own slate of Republican electors – a scenario we entertained in our definitive guide. If Biden leads the statewide vote, then a state legislature would be politically suicidal to appoint the state’s electors to vote for Trump. It would invite a popular backlash. In the case of Pennsylvania, Republican leaders of the lower and upper chambers have explicitly denied any willingness or ability to choose electors other than those entailed by the popular vote. Thus the 1876 “Stolen Election” scenario is extremely unlikely in this critical state. It is just as unlikely in Arizona, Nevada, or Georgia.2 Nevertheless, if President Trump wins in Georgia or gets a favorable Supreme Court verdict, investors will have to increase the probability that the election result will be overturned, which currently stands at 16% (Chart 2). This will cause a bout of volatility even if it changes nothing in the end. If somehow Trump pulls off a Rutherford B. Hayes and overturn the result, markets should sell off. Yes, Trump is an exclusively commercial and reflationary president, but his election on a constitutional technicality would create nearly unprecedented social and political instability in the United States and it would presage major instability globally. Chinese, European, and Canadian assets would be hardest hit (Chart 3). Chart 2Trump’s Tiny Chance Of Reversing Election
The "Normalcy" Rally
The "Normalcy" Rally
Otherwise Trump and the Republicans are trying to do four things with their litigation: (1) probing for weaknesses that can delay or change the Electoral College math (2) conducting due diligence in case fraud really did tip over one of the states (3) saving face for President Trump and his allies, who otherwise would be exposed as failures (4) keeping their base motivated for the showdown in Georgia on January 5, which will determine control of the Senate. Chart 3Trump's Loss Favors Euro, Renminbi, Loonie
Trump's Loss Favors Euro, Renminbi, Loonie
Trump's Loss Favors Euro, Renminbi, Loonie
In Georgia, opinion polls show Republican David Perdue slightly leading Democrat Jon Ossoff, in keeping with his superior showing on November 3. However, Republican Kelly Loeffler is trailing Democrat Raphael Warnock (Charts 4A and 4B). Last week we argued that the odds of Democrats winning both races stood around 20%. If anything this view is generous – given that Perdue already beat Ossoff, and Warnock will continue to suffer attacks for associating with Fidel Castro – but it is in line with online betting markets (Chart 5). Chart 4AVoters Split On Georgia Senate Runoffs
The "Normalcy" Rally
The "Normalcy" Rally
Chart 4BVoters Split On Georgia Senate Runoffs
The "Normalcy" Rally
The "Normalcy" Rally
Chart 5Democrats Have ~20% Chance To Win Senate
The "Normalcy" Rally
The "Normalcy" Rally
Investors should plan on the US government being gridlocked unless something occurs that fundamentally changes the Georgia race. Gridlock is positive, so if Trump’s election disputes keep the Republican political base spirited for the Georgia runoffs, then Trump’s activities have an ironic upside for markets. That is, as long as he doesn’t succeed in overturning the election result and the flames of discontent do not break out into a significant violent incident. Other fears about the transition period are less concerning. Several clients have asked us what should happen if President Elect Biden came down with COVID-19 or were otherwise incapacitated. The answer is that Vice President Elect Kamala Harris would take his place, as she now has popular consent to do exactly that. Prior to the Electoral College voting on December 14, the Democratic National Committee would have to nominate a candidate to replace Biden, almost certainly Harris. After December 14, the regular succession would apply under the twentieth amendment and Harris would automatically fill Biden’s shoes. Harris is only slightly more negative for equities than Biden: her regulatory pen would be more anti-business, but like Biden her main policies depend entirely on control of the senate. Bottom Line: It ain’t over till it’s over. The big picture is positive for risk assets but a surprise from ongoing election disputes or the unusually rocky transition of power would trigger a new bout of volatility. Stay long Japanese yen and health stocks on a tactical time frame. Trump’s Lame Duck Risk An investor in the Wild West has often criticized us for arguing that Trump would become a “war president” as he became a political lame duck at home. This war president view did pay off with Iran in January 2020, but otherwise the criticism is valid (see Trump’s Abraham Accords). Now Trump is almost certainly a lame duck so we will find out what he intends to do when unshackled from election concerns. Stay long Japanese yen and health stocks on a tactical time frame. Since losing the election, Trump has fired Defense Secretary Mark Esper, several defense officials have resigned, and CIA Director Gina Haspel is rumored to be next on the chopping block. Most of the officials to depart had broken with the president over the course of the election year, so he may just be dishing out punishment now that the campaign is over. But it is possible that Trump is planning a series of final actions to cement his legacy and that these officials were removed because they got in the way. Chart 6Trump's Lame Duck Risk To China And Taiwan Strait
Trump's Lame Duck Risk To China And Taiwan Strait
Trump's Lame Duck Risk To China And Taiwan Strait
First, there is no doubt that Trump is already tightening sanctions on China and Iran. China was the origin of the coronavirus pandemic and Trump has called for reparations, which could mean more tariff hikes. His outstanding legacy in US history will be his insistence that the US confront China. We are fully prepared for this outcome and remain short the renminbi and Taiwanese equities, despite their strong performance year-to-date (Chart 6). Trump could also raise tariffs on Europe. However, investors should be used to tariffs and sanctions by now. The impact would be fleeting and the next administration could reverse it. In the case of the renminbi, or any tariffs that weigh on the euro, investors should buy on the dips. By contrast, there are some conceivable actions – we are speculating – that would be extremely destabilizing and possibly irreversible. These would include: Extending diplomatic recognition to Taiwan, potentially provoking a war with China. Sending aircraft carriers into the Taiwan Strait, like Bill Clinton did during the Third Taiwan Strait Crisis, to shore up US deterrence. Launching surgical strikes against Iran’s ballistic missile and nuclear facilities or critical infrastructure. A prominent official has already denied that Trump intends anything of the sort. Launching surgical strikes against North Korea’s ballistic missile and nuclear facilities. No sign of this, but Kim Jong Un did enhance his capabilities after his meetings with Trump, thus embarrassing the president on a major foreign policy initiative ahead of the election. Providing intelligence and assistance to US allies like Israel who may seek to sabotage or attack Iran now or in future to prevent it from acquiring nuclear weapons. Withdrawing US troops from Germany or South Korea – which is much more consequential than hasty withdrawals from Afghanistan or Syria, which Trump clearly intends. War actions are largely infeasible. The bureaucracy would refuse to implement them. Assuming the Department of Defense would slow-walk any attempts to reduce troops in important regions like Germany or Korea, it would almost certainly avoid instigating a war. Withdrawing troops from Afghanistan or Syria is manageable, and fitting with Trump’s legacy, but it would not be disruptive for financial markets. A diplomatic upgrade or a show of force to demonstrate the American commitment to defend Taiwan is possible and highly disruptive for global financial markets. The critical risk may come from US allies or partners that are threatened by the impending Biden administration and have a window of opportunity to act with full American support while Trump still inhabits the Oval Office. The likeliest candidate would be Israel and Saudi Arabia on the Iranian nuclear program. Trump’s onetime national security advisor, H. R. McMaster, has already warned that Israel could act on the “Begin Doctrine,” which calls for targeted preventive strikes against hostile nuclear capabilities.3 Even here, Israel is unlikely to jeopardize its critical security relationship with the United States, so any actions would be limited, but they could still bring a major increase in regional tensions. Saudi Arabia can do little on its own but President Trump could willingly or unwilling encourage provocative actions. Chart 7Big Tech Is Not Priced For Surprises
Big Tech Is Not Priced For Surprises
Big Tech Is Not Priced For Surprises
Any number of incidents or provocations could occur in this risky interregnum between Trump and Biden. Some suggest Trump will release a treasure trove of documents to discredit Washington and the Deep State. If that is all that occurs, then investors will be able to give a sigh of relief, as revelations of government intrigue would have to be truly consequential for future events in order to cause a notable market impact. Last-minute executive orders on regulating domestic industries are just as likely to shock markets as any international moves. We speculate that Big Tech is in Trump’s sights for censoring his comments during the election. In the wake of the Supreme Court’s decision in Department of Homeland Security versus Regents of the University of California, the Trump administration is positively incentivized to issue a flurry of executive orders and write them in a way that makes them hard for the Biden administration to rescind them.4 Tech is priced for perfection, despite ruffles due to the vaccine this week, and investors expect Biden-Harris to maintain Obama’s alliance with Silicon Valley, not least because Biden has named executives from Facebook and Apple to his transition team and is considering putting former Google chief Eric Schmidt in charge of a Big Tech task force (Chart 7).5 Ultimately we have no idea what the Trump administration will do in its final two months. A lot of Trump’s attention will be focused on contesting the election. Drastic or reckless decisions will likely be obstructed by the bureaucracy. But the president still retains immense powers and there are executive orders that are legitimate and would benefit the US’s long-term interests even if disruptive for financial markets – and these would be harder for officials to disobey. Trump is an anti-establishment player who intends to shake up Washington, stay involved in politics, and cement his legacy. There is a reason for investors to take political risk seriously rather than to assume that the transition to a more market-friendly administration will be smooth. Bottom Line: Stay long gold on geopolitical risk, despite the potential for a counter-trend rise in the US dollar. We are neutral tech: polarization and fiscal risks are positive for tech shares but reopening and Trump lame duck risks are negative. Biden’s Cabinet Picks This “lame duck Trump” risk explains why we are not overly concerned about Biden’s cabinet picks. Insofar as Biden’s choices affect the market at all, they will confirm the “return to normalcy” theme and hence will be market-friendly. Take for example Biden’s just-announced chief of staff, Ronald Klain, who was chief of staff when Biden served as vice president from 2009- 16. The current transition is obstructed by election disputes, as occurred in November-December of 2000, but the cabinet picks are not likely to bring negative surprises. Already Biden has announced a coronavirus advisory board, a bipartisan transition team, and is pondering other picks, some of which will be known by Thanksgiving. None of the choices are in the least disruptive or radical – and most are acceptable to Wall Street. Biden will pick experts and technocrats who are known from his political career, the Obama administration, the Clinton administration, the Democratic Party, and academia. The market will invariably approve of establishment nominations after four years of anti-establishment picks and spontaneous firings. Since the Senate will remain in Republican hands, the cabinet members will have to be centrist enough to be confirmed. While Biden will inevitably nominate a few progressives, they will either fail in the Senate or take up marginal posts. Stay long gold on Trump “lame duck” geopolitical risks. Biden may have the opportunity to appoint three or even four members to the Federal Reserve’s board of governors. The Trump administration failed to fill two seats, while Fed Chair Jerome Powell’s term will expire in February 2022 (Diagram 1). If Biden appoints Lael Brainard to another post, such as Treasury Secretary, he will have a fourth space to fill. Diagram 1Biden Could Have Three-To-Four Fed Picks
The "Normalcy" Rally
The "Normalcy" Rally
Chart 8Facing Gridlock, Biden Will Re-Regulate
The "Normalcy" Rally
The "Normalcy" Rally
The implication will be a further entrenchment of dovish policy, with greater attention to new concerns that fall outside of traditional monetary policy such as climate change and racial inequality. The Fed has already committed to pursuing “maximum employment,” refraining from rate hikes till the end of 2023, and targeting average inflation – all a major boon to the Biden administration as it attempts to revive the economy. What is negative for markets is that Biden will re-regulate the economy – after Trump’s deregulatory shock – and that this will bring about political risks for small business and key industries like health, financials, and energy (Chart 8). Biden has little other option given that his legislative agenda will be largely stymied. Nevertheless, the sectors most likely to be heavily impacted are attractively valued and stand to benefit from economic normalization if not from Biden’s version of normalcy. Bottom Line: Stay long health and energy. Yes, Gridlock Is Best For Markets Some clients have asked us about our view that gridlocked government is truly the best for financial markets. Wouldn’t Democrats winning control of the Senate in Georgia be better, as it would usher in greater political certainty and larger fiscal spending? We have addressed this issue in previous reports so we will be brief. First, yes, gridlock has higher returns than single-party sweep governments on average over the past 120 years (Chart 9). Clearly the normalcy rally can go higher, but it is equally clear that it will get caught by surprise when the political reality hits home. Second, however, the stock market’s annual returns are roughly average under single-party sweeps during this period (Chart 10). Chart 9Gridlock Best For Markets
The "Normalcy" Rally
The "Normalcy" Rally
Chart 10Single-Party Sweeps Generate Average Annual Returns
The "Normalcy" Rally
The "Normalcy" Rally
So while investors can cheer gridlock, it is not as if they should sell everything if Democrats do win control of the Senate on January 5. Chart 11Sweeps As Good As Gridlock Over 70 Years
The "Normalcy" Rally
The "Normalcy" Rally
Indeed, looking at the period after World War II, sweep governments have witnessed average annual returns that are the same or slightly better than under gridlock (Chart 11). Whereas limiting the study to the post-Reagan era, gridlocks are clearly favored. If greater fiscal resources are needed then gridlock will quickly become a market risk rather than an opportunity. It is notable that over the past 120 years, there is not an example of a Democratic president presiding over a Republican senate and a Democratic House. There was only one case of the inverse – a Republican President, a Democratic senate, and a Republican House – which occurred in 2001-02 and coincided with a bear market. In fact, this episode should be classified as a Republican sweep, as in Table 2, since a sweep was the result of the 2000 election and the context of the key market-relevant legislation in 2001.6 Table 2Average Annual Equity Returns And Gridlock Government
The "Normalcy" Rally
The "Normalcy" Rally
Chart 12Market Predicted Gridlock In 2020
Market Predicted Gridlock In 2020
Market Predicted Gridlock In 2020
In 2020 the stock market clearly anticipated a gridlocked outcome – the market’s performance matches with the historical profile of divided government (Chart 12). We argued that this was the best case for the market because it meant neither right-wing populism nor left-wing socialism. But we also highlighted that any relief rally on election results (reduced uncertainty) would be cut short by the major near-term implication of gridlock: a delay of fiscal support for the economy in the near term. This was the only deflationary scenario on offer in this election. Hence bad news in winter 2020-21 would precede the good news over the entire 2020-22 period. This is still largely our view, but we admit that the vaccine announcement erodes near-term risk aversion even further. There is little substance to the discussion of whether Americans will take the vaccine or not. Evidence shows that Americans are no less likely to take vaccines than other developed country citizens – assuming they are demonstrated to be safe and effective (Chart 13). Chart 13Yes, Americans Take Vaccines
The "Normalcy" Rally
The "Normalcy" Rally
So gridlock looks even better now than it did previously. Yet we still think the near-term fiscal risks will hit markets sometime soon. Senate Republicans have been emboldened by the fact that their relative hawkishness paid off in the election on November 3. If they would not capitulate to House Speaker Nancy Pelosi prior to the election, they are even less likely to do so after gaining seats in the House, retaining the Senate, and crying foul over the presidential election. McConnell could agree to a $500 billion deal before Christmas – or not. There is no clear basis for optimism. A government shutdown is even possible if the continuing resolution expires on December 12. If the economic data turns sour and/or markets sell off dramatically then the Republicans will be forced to agree to a bigger deal, but as things stand they are not forced to do anything. And that presents a downside risk to the normalcy rally. Investment Takeaways Today’s post-election environment is comparable to the period after 2010, when a new business cycle was beginning and a new President Barack Obama had to face down Republican fiscal hawks in the House of Representatives. Today’s GOP senators may prove somewhat more cooperative with President Elect Biden, but that remains to be seen. Given how tight the election was, Republicans have an incentive to obstruct, slow down the economic recovery, and contest the 2022 midterms and 2024 election on the back of another slow-burn recovery. It worked last time. The debt ceiling crises of 2011 and 2012-13 were different than the fiscal stimulus cliff that Washington faces today but the market implications are similar. At the climax of brinkmanship between the president and the senate, treasuries will rally, the dollar will rally, stocks will fall, and emerging markets will underperform (Charts 14A and 14B). Today there is a greater limit on how far the dollar will rise and how far treasury yields will fall, but a fiscal impasse will still drive flows into these assets. Chart 14AObama’s Debt Ceiling Crises…
Obama's Debt Ceiling Crises...
Obama's Debt Ceiling Crises...
Chart 14B… Presage Biden’s Fiscal Cliffs
... Presage Biden's Fiscal Cliffs
... Presage Biden's Fiscal Cliffs
This is what we expect over the next three months. The fact that President Trump could bring negative surprises only enhances this expectation. Therefore we are only gradually adding risk to our strategic portfolio and maintaining tactically defensive positions. Clearly the normalcy rally can go higher, but it is equally clear to us that it will get caught by surprise when the political reality hits home. Since this could be anytime over the next two months, we are only gradually adding new risk. We would not deny that the outlook is brighter over the 12-24-month periods due to the vaccine and election results. Matt Gertken Vice President Geopolitical Strategy mattg@bcaresearch.com Footnotes 1 See Chris Matthews, "Alleging fraud, GOP seeks to overturn election results in Michigan, Pennsylvania," MarketWatch, November 10, 2020, marketwatch.com. 2 See Senator Jake Corman and Representative Kerry Benninghoff, "Pennsylvania lawmakers have no role to play in deciding the presidential election," Centre Daily, October 19, 2020, centredailly.com. As for the 1876 “Stolen Election,” the initial election results suggested that Democrat Samuel Tilden had won 184 electoral votes while Republican Rutherford B. Hayes had won 165. The amount needed for a majority in the Electoral College at the time was 185, so Tilden fell one vote short while Hayes fell 20 votes short. After partisan litigation, actions by state legislatures, an intervention by the US House of Representatives, and a grand political compromise, Hayes won with 185 votes. 3 See Charles Creitz, "McMaster warns Biden on Iran deal: Don't resurrect 'political disaster masquerading as a diplomatic triumph,’" Fox News, November 12, 2020, foxnews.com. 4 In this ruling, which was decided on a 5-4 split with Chief Justice John Roberts siding with liberal justices, the Supreme Court denied the Trump administration’s effort to overturn the Obama administration’s policy known as Deferred Action on Childhood Arrivals (DACA), which stopped the US from deporting illegal immigrants who came to the US as children. The majority opinion argued that the Trump administration had merely asserted, not demonstrated, that the Obama administration’s executive orders were unconstitutional. In doing so, it established a precedent by which the court can determine whether one president’s executive orders should overrule another’s. While future administrations may follow better procedures in attempting to revoke their predecessors’ orders, this decision likely incentivizes the Trump administration to try to issue decrees that will be difficult to revoke. See John Yoo, "How the Supreme Court’s DACA decision harms the Constitution, the presidency, Congress, and the country," American Enterprise Institute, June 22, 2020, aei.org. 5 See Kiran Stacey, “What can Silicon Valley expect from Joe Biden?” Financial Times, November 8, 2020, ft.com. 6 The election produced a Republican sweep, with a 50-50 balance in the Senate, that led to the Bush tax cuts in May 2001. The business cycle was ending, however. In June, Democrats took the senate majority when Republican Senator Jim Jeffords of Vermont became an independent and began caucusing with Democrats. In September terrorists attacked the World Trade Center causing a market collapse.
Highlights US inflation expectations will moderate, and US real yields will rise. This will support the US dollar. The potential rebound in the US dollar will cap any upside in EM ex-TMT stocks. Rising US real yields are a risk to high-multiple global growth stocks. Maintain a neutral allocation to EM in global equity and credit portfolios. Feature In this week’s report we identify market-relevant issues and topics and then present the investment implications of these potential developments. Current key investment-relevant topics and issues are as follows: 1. Implications of the US elections Fiscal Stimulus: In the context of Biden’s victory and the Senate remaining Republican, the odds of a meaningful fiscal package in the next several months are quite low. The Republican Senate did not support a fiscal package going into the elections. Odds are low that it will now agree to a fiscal package larger than $750 billion. Chart 1Rising US Real Yields Are Positive For The US Dollar
Rising US Real Yields Are Positive For The US Dollar
Rising US Real Yields Are Positive For The US Dollar
According to the US Congressional Budget Office’s calculations, without a new fiscal package, the fiscal thrust in 2021 will be -7.5% of GDP or $1.5 trillion. Hence, fiscal stimulus should be more than $1 trillion to avoid a slump in growth. Granted that the recovery in US consumer income and spending that has been underway since April has to a large extent been supported by US fiscal transfers, the lack of current government income support to households poses a risk to the economy. Of course, if US economic activity tanks again and the stock market plunges, Republicans will support a much larger package. However, as things stand now, the probability of a substantial (more than $1 trillion) fiscal package is low. The lack of fiscal stimulus implies that US growth and inflation expectations will moderate. Chart 1 shows that US inflation expectations have probably reached an apex and will downshift for now. US nominal bond yields are capped on the upside (by the Fed’s purchases and its commitment not to raise interest rates for several years) and on the downside (by the Fed’s reluctance to reach negative interest rates). Consequently, swings in inflation expectations will drive fluctuations in real yields, as has been occurring in recent months. As inflation expectations decline, real yields will rise. Impact of rising US real yields on financial markets: A stronger US dollar and lower prices for Nasdaq stocks. Rising real rates will support the US dollar (Chart 1, bottom panel). Chart 5 on page 5 reveals that the real rates differential between the US and the euro area has recently been moving in favor of the greenback. Chart 2Rising US Real Yields Are Negative For Growth Stocks
Rising US Real Yields Are Negative For Growth Stocks
Rising US Real Yields Are Negative For Growth Stocks
Budding investor realization that the US might not pursue an aggressively expansionary fiscal policy, as has been expected since spring, could also support the greenback. Less issuance of Treasury securities might be interpreted as less public debt monetization and less money creation by the Federal Reserve. Such a viewpoint will also be marginally positive for the US dollar. As to the equity market, US real (TIPS) yields have been negatively correlated with the Nasdaq index (Chart 2). As US real yields continue to rise, odds are that global growth stocks will come under selling pressure. Geopolitical ramifications: The impact of the forthcoming change in the White House on US foreign policy has been widely anticipated and has already been priced in by financial markets. A Biden administration will have a positive impact on the euro area, Canada, Mexico and Asia Pacific countries with the exception of China – as was not the case under the Trump administration. On the other end, Russia, Turkey and Saudi Arabia will be under heat from Biden’s White House. In our view, the impact on China will be neutral, not better than during Trump’s administration. It might be mildly positive in the near term but negative in the long run. In the short run, the new US administration will be less likely to use global trade as a weapon. In the long run, however, Biden will likely mobilize Europe to join its geopolitical confrontation with China. This will be negative for the Middle Kingdom. One country where the impact of Biden’s administration has not been fully priced in is Brazil. The US executive branch will take a tougher stance in its dealings with Brazil’s right-wing government because their social values are not aligned and policy priorities differ. We remain short the BRL and underweight Brazilian equity and fixed-income markets within their respective EM portfolios. 2. Vaccines We have no better expertise than the market’s judgement on the timing of vaccine availability and its effectiveness in containing the pandemic in EM ex-China countries. It is clear, however, that the process of vaccine acquisition and distribution might be slower in EM ex-China than in advanced countries. On all three fronts – the spread of the pandemic, policy stimulus and vaccine distribution – EM excluding China, Korea and Taiwan will continue lagging DM. Therefore, EM ex-China domestic demand will continue to underperform relative to expectations and versus those in DM. This argues for continuous underweight, or at best a neutral allocation, in EM ex-China, Korea and Taiwan equities versus their DM peers. Chart 3Chinese Onshore Equities Have Been In A Trading Range Since Early July
Chinese Onshore Equities Have Been In A Trading Range Since Early July
Chinese Onshore Equities Have Been In A Trading Range Since Early July
3. China: the business cycle and regulatory clampdown China’s business cycle recovery has further to go. The stimulus injected into the economy has been considerable and will continue to work its way into the economy. Even though we believe that China has reached peak stimulus, the latter works with a time lag of 6-12 months and economic growth will top only around mid-2021. That said, Chinese onshore share prices have been in a consolidation phase since early July and this is likely not over yet (Chart 3). In turn, Chinese investable stocks have been surging in absolute terms and outperforming the global equity index (Chart 4, top panel). However, the entire Chinese equity outperformance has been due to growth stocks (TMT/new economy). Excluding these, the absolute and relative performance of Chinese investable stocks has been lackluster (Chart 4, top and bottom panels). Chart 4Chinese Investable Stocks: Surging TMT And Lackluster Performance By Ex-TMT Stocks
Chinese Investable Stocks: Surging TMT And Lackluster Performance By Ex-TMT Stocks
Chinese Investable Stocks: Surging TMT And Lackluster Performance By Ex-TMT Stocks
In short, the spectacular performance of Chinese investable stocks this year has been attributed to three new economy stocks: Alibaba, Tencent and Meituan. These three stocks presently account for 40.5% of China’s MSCI Investable Index and 17.5% of the aggregate EM MSCI equity index. Concerns about regulatory clampdowns on new economy stocks have been, and remain, a major risk, not only in China but also in advanced economies. It is impossible to time regulatory actions. Nevertheless, investors should take into account the possibility that regulation may curb the profitability of new economy companies, especially if they are de-facto monopolies or oligopolies. Chinese authorities will not back down from imposing new regulation and scrutiny over the activities of giant new economy companies. Hence, risks of further de-rating remain elevated. In short, even though the mainland business cycle recovery is on a track, Chinese share prices remain at risk of correction due to overbought conditions and re-pricing of regulatory risks for new economy stocks. Will The US Dollar Capture Some Of Its Luster? US real yields are rising not only in absolute terms, but also relative to real yields in the euro area (Chart 5). Rising real yields in the US versus the euro area generally lead to a dollar rally against the euro. Apart from rising US real bond yields, there are a number of other factors that will likely support the greenback: Investor sentiment on the US dollar is very low (Chart 6). From a contrarian perspective, this is positive. Chart 5The US Versus Euro Area: Real Yield Differentials And Exchange Rate
The US Versus Euro Area: Real Yield Differentials And Exchange Rate
The US Versus Euro Area: Real Yield Differentials And Exchange Rate
Chart 6Investors Are Downbeat On The US Dollar
Investors Are Downbeat On The US Dollar
Investors Are Downbeat On The US Dollar
Consistently, investors are very short the US dollar, especially versus DM currencies (Charts 7and 8). Positioning is less short in the US dollar versus cyclical DM and high-beta EM currencies (Chart 8). That said, the fundamentals of EM high-beta currencies such as BRL, TRY, ZAR and IDR are poor. Chart 7Investors Are Very Long Safe-Haven Currencies…
Investors Are Very Long Safe-Haven Currencies...
Investors Are Very Long Safe-Haven Currencies...
Chart 8...And Modestly Long Cyclical Currencies
...And Modestly Long Cyclical Currencies
...And Modestly Long Cyclical Currencies
The Republican Senate will block corporate tax increases and limit any regulatory initiatives by Democrats in Congress. Such business-friendly policies are currency bullish. In short, a Republican Senate is broadly positive for the US dollar, and markets have not priced it in. The fact that broad US equity averages – such as small caps and equal-weighted equity indexes – continue outperforming the rest of the world in local currency terms is also dollar bullish (Chart 9). The reasoning is that US equity outperformance versus the rest of the world suggests better profitability and return on capital in the US versus its peers. That favors a firmer US dollar. Finally, the broad-trade weighted US dollar is oversold and is sitting on a long-term technical resistance level (Chart 10). Chart 9US Relative Equity Outperformance Heralds A Stronger US Dollar
US Relative Equity Outperformance Heralds A Stronger US Dollar
US Relative Equity Outperformance Heralds A Stronger US Dollar
Chart 10The US Dollar Is Very Oversold
The US Dollar Is Very Oversold
The US Dollar Is Very Oversold
Bottom Line: We have been highlighting downside risks to the US dollar since July 9. However, the conclusion of the US election raises the odds of a playable US dollar rebound. EM Strategy EM Equities We have been advocating for a neutral allocation toward EM in a global equity portfolio since July 30. If the US dollar rebounds, as we expect, EM stocks will not outperform the global equity index (Chart 11). Notably, excluding Chinese investable stocks, EM share prices have not outperformed the global benchmark (Chart 12). Besides, as shown in the top panel of Chart 4 on page 4, China’s outperformance against the global equity benchmark has been driven exclusively by new economy stocks. Chart 11EM Stocks Do Not Outperform When The Dollar Rallies
EM Stocks Do Not Outperform When The Dollar Rallies
EM Stocks Do Not Outperform When The Dollar Rallies
Chart 12EM Versus Global Equity Performance: With And Without China
EM Versus Global Equity Performance: With and Without China
EM Versus Global Equity Performance: With and Without China
All in all, Charts 4 and 12 reveal that excluding three large Chinese new economy stocks – Alibaba, Tencent and Meituan – EM share prices have underperformed the global equity benchmark. Going forward, the potential rebound in the US dollar will cap any upside in EM ex-TMT stocks. Meanwhile, the correction in the NASDAQ and the increased scrutiny on the part of Chinese authorities over new economy stocks poses a risk to Chinese mega-cap TMT share prices. In absolute terms, we have been waiting for a pullback to buy EM equities, but they have surged following the US elections and the news on Pfizer’s vaccine. Chart 13EM Equity Index: No Breakout Yet
EM Equity Index: No Breakout Yet
EM Equity Index: No Breakout Yet
The EM equity index could still advance and reach its 2011 or 2018 highs before rolling over (Chart 13). However, given our view on the US currency and risks to EM stemming from a rising US dollar, we refrain from playing such limited upside. EM currencies EM currencies will be at a risk if the US dollar stages a rebound. Since July 9, we have been shorting a basket of BRL, CLP, TRY, KRW, ZAR and IDR versus an equally-weighted basket of the euro, CHF and JPY. We are sticking with this strategy. Even if the US dollar rebounds, downsides in the euro, CHF and JPY against the greenback will be relatively limited. However, investors might consider adding the US dollar to the long side of this strategy. EM local bonds and EM credit markets We continue recommending long duration in EM local rates. However, we remain reluctant to take on currency risk. We maintain our recommendations from April 23 about receiving 10-year swap rates in Mexico, Colombia, Russia, India, China and Korea. We are also receiving 2-year rates in Malaysia and South Africa as a bet on rate cuts in these economies. In the EM credit space, we are also neutral. Our sovereign credit overweights are Mexico, Colombia, Peru, Russia, Thailand, Malaysia and the Philippines. Our underweights are South Africa, Turkey, Indonesia, Argentina and Brazil. Arthur Budaghyan Chief Emerging Markets Strategist arthurb@bcaresearch.com Footnotes Equities Recommendations Currencies, Credit And Fixed-Income Recommendations
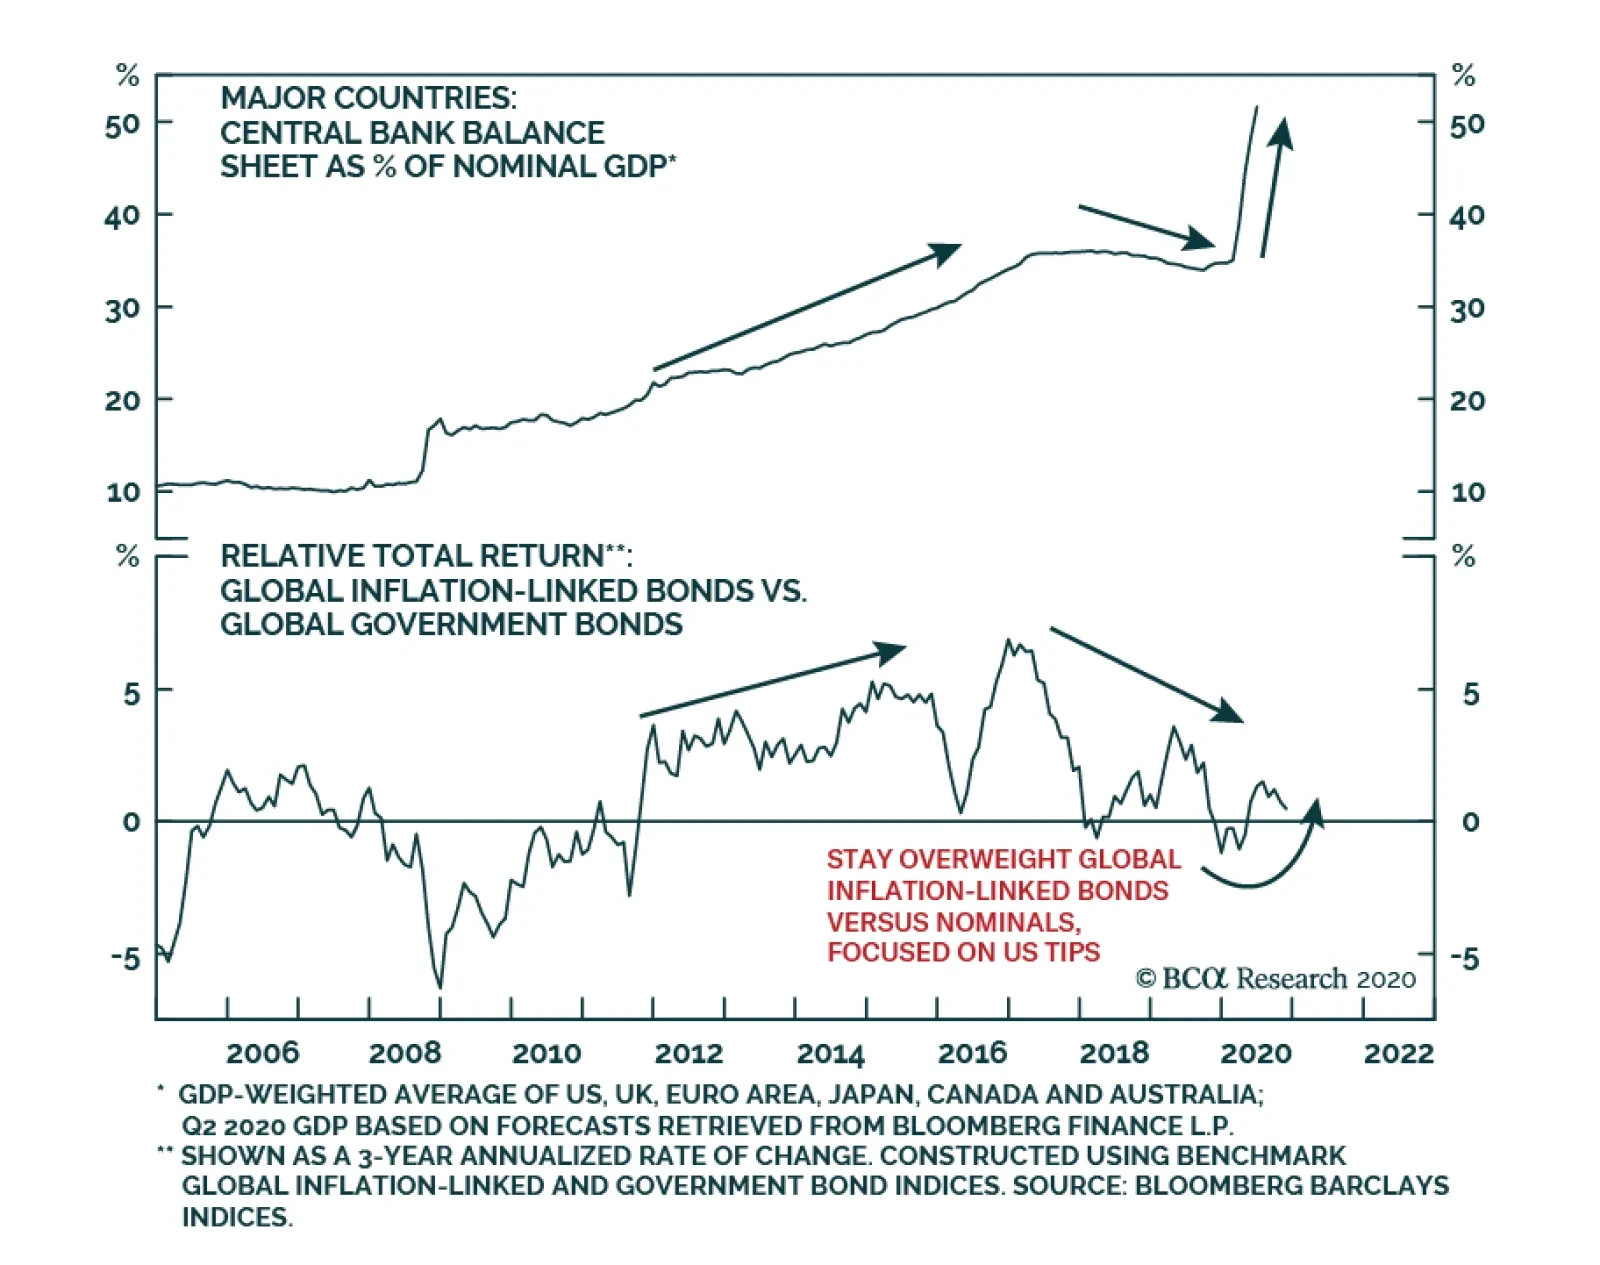
Highlights US Election & COVID-19: Joe Biden’s apparent victory in the US presidential race, as well as the announcement of a potential successful COVID-19 vaccine trial, are both bond-bearish outcomes. This is especially so for US Treasuries given the more resilient growth momentum in the US. Fixed Income Strategy: The big news announcements do not motivate us to change our fixed income investment recommendations. Stay below-benchmark on overall duration, and underweight the US in global bond portfolios. Stay overweight global inflation-linked bonds versus nominal government debt, particularly in the US and Italy. Maintain an overweight stance on global spread product, focused on US corporates (investment grade and Ba-rated high-yield) and emerging market US dollar denominated corporates. Feature Chart of the WeekUS Yields Leading The Way Higher
US Yields Leading The Way Higher
US Yields Leading The Way Higher
Investors have digested two major pieces of news over the past few days – the projected election of Joe Biden as the 46th US President and the positive results of Pfizer’s COVID-19 vaccine trial. Both outcomes are bond-bearish, but the bigger response came after the news of a potential vaccine, with the 10-year US Treasury yield hitting an 8-month high of 0.96% yesterday. Yields in other countries rose by a lesser amount, continuing the recent trend of US Treasury underperformance (Chart of the Week). After the US election result, however, we remain comfortable with our recommended below-benchmark overall duration stance and underweight allocation to US Treasuries in global bond portfolios. The introduction of a successful vaccine would obviously be a game-changer for all financial markets, not just fixed income, as it would allow investors to see an end to the pandemic and a return to more normal economic activity. While we are heartened by the vaccine trial announcement, there are still many hurdles that need to be cleared before any vaccine is approved and distributed around the world. It is still too soon to adjust our bond investment strategy in anticipation of a post-COVID world. After the US election result, however, we remain comfortable with our recommended below-benchmark overall duration stance and underweight allocation to US Treasuries in global bond portfolios. While a Biden victory combined with the Republicans likely keeping control of the US Senate was the least bond-bearish outcome - thus avoiding the big surge in government spending likely after a Democratic “blue wave” - there is clear upward momentum in US economic growth that suggests more upside for Treasury yields on both an absolute basis and relative to other countries. Cross-Country Divergences Are Starting To Appear Our recent decision to cut our recommended overall global duration stance to below-benchmark was motivated by our more bearish view on US Treasuries. However, a more defensive duration posture was justified by the rapid rebound in global growth seen since the depths of the COVID-19 recession. Our Global Duration Indicator, comprised of leading economic data, has been calling for a bottom in global bond yields toward the end of 2020 (Chart 2). The rise in global yields we are witnessing now appears to be right on cue. There are now more relative growth, inflation and policy divergences opening up that will allow country allocation to become a bigger source of outperformance for fixed income investors. Chart 2Global Yields Are Bottoming
Global Yields Are Bottoming
Global Yields Are Bottoming
Importantly, inflation expectations across the developed world have yet not risen by enough to force central banks to become less dovish. This suggests that global yield curves will have a steepening bias over at least the next six months, with longer-term yields rising more on the back of faster growth (and additional increases in inflation expectations) than shorter-maturity yields which are more sensitive to monetary policy shifts. Those trends will not be seen equally across all countries, though. There are now more relative growth, inflation and policy divergences opening up that will allow country allocation to become a bigger source of outperformance for fixed income investors. For example, the October US manufacturing ISM and Payrolls data released last week showed robust strength, even in a month where new US COVID-19 cases rose sharply. Europe, on the other hand, has seen an even bigger surge in new cases, resulting in a wave of national lockdowns that has already begun to weigh on domestic economic activity. Thus, core European bond yields have remained stable, even with the euro area manufacturing PMI remaining elevated (Chart 3). We see similar divergences in other developed economies, with generally strong manufacturing PMIs and mixed responses from bond yields. When looking at the breakdown of nominal bond yields into the real yield and inflation expectations components, even more divergences are evident (Chart 4).1 Chart 3Mixed Responses To Rebounding Growth
Mixed Responses To Rebounding Growth
Mixed Responses To Rebounding Growth
Chart 4Real Yield Trends Are Starting To Diverge
Real Yield Trends Are Starting To Diverge
Real Yield Trends Are Starting To Diverge
Chart 5Discounting An Extended Period Of Negative Real Rates
Discounting An Extended Period Of Negative Real Rates
Discounting An Extended Period Of Negative Real Rates
The real yields on benchmark 10-year inflation-linked bonds are slowly rising in the US and Canada, but remain stable in Germany, the UK and Australia. Market expectations for central bank policy rates, extracted from overnight index swap (OIS) curves, are currently priced for an extended period of low policy rates over the next few years. This is no surprise, as central banks have told the markets this would be the case via dovish forward guidance. Yet central banks are also projecting inflation rates to move higher between 2021 and 2023, even as they are signaling unchanged interest rates over that same period (Chart 5). Central banks are effectively telling markets that they want an extended period of negative real policy rates - a major reason why real bond yields are negative across the developed world. At some point, however, markets will begin to challenge the need for deeply negative real policy rates as economies recover from the COVID-19 shock to growth. Unemployment in the US and Canada has already declined sharply since spiking during the first wave of COVID-19 lockdowns. In the US, the unemployment rate has fallen from a peak of 14.7% to 6.9%; in Canada, the decline has been from 13.7% to 8.9% (Chart 6). This contrasts sharply to trends in Europe and Australia, where unemployment rates remain elevated. Chart 6Diverging Trends In Unemployment
A Vaccine For Uncertainty
A Vaccine For Uncertainty
At some point, however, markets will begin to challenge the need for deeply negative real policy rates as economies recover from the COVID-19 shock to growth. With the Fed and Bank of Canada (BoC) projecting additional declines in unemployment over the next few years, markets are starting to discount a less dovish stance from both central banks. The US and Canadian OIS curves are now discounting one full 25bp policy rate hike by Aug 2023 and May 2023, respectively. This is a bit sooner than signaled by the forward guidance of the Fed and BoC. Thus, markets are now pricing in a less negative path for real policy rates – and, by association, real bond yields. Chart 7Markets Still Discounting Low Yields For Longer
A Vaccine For Uncertainty
A Vaccine For Uncertainty
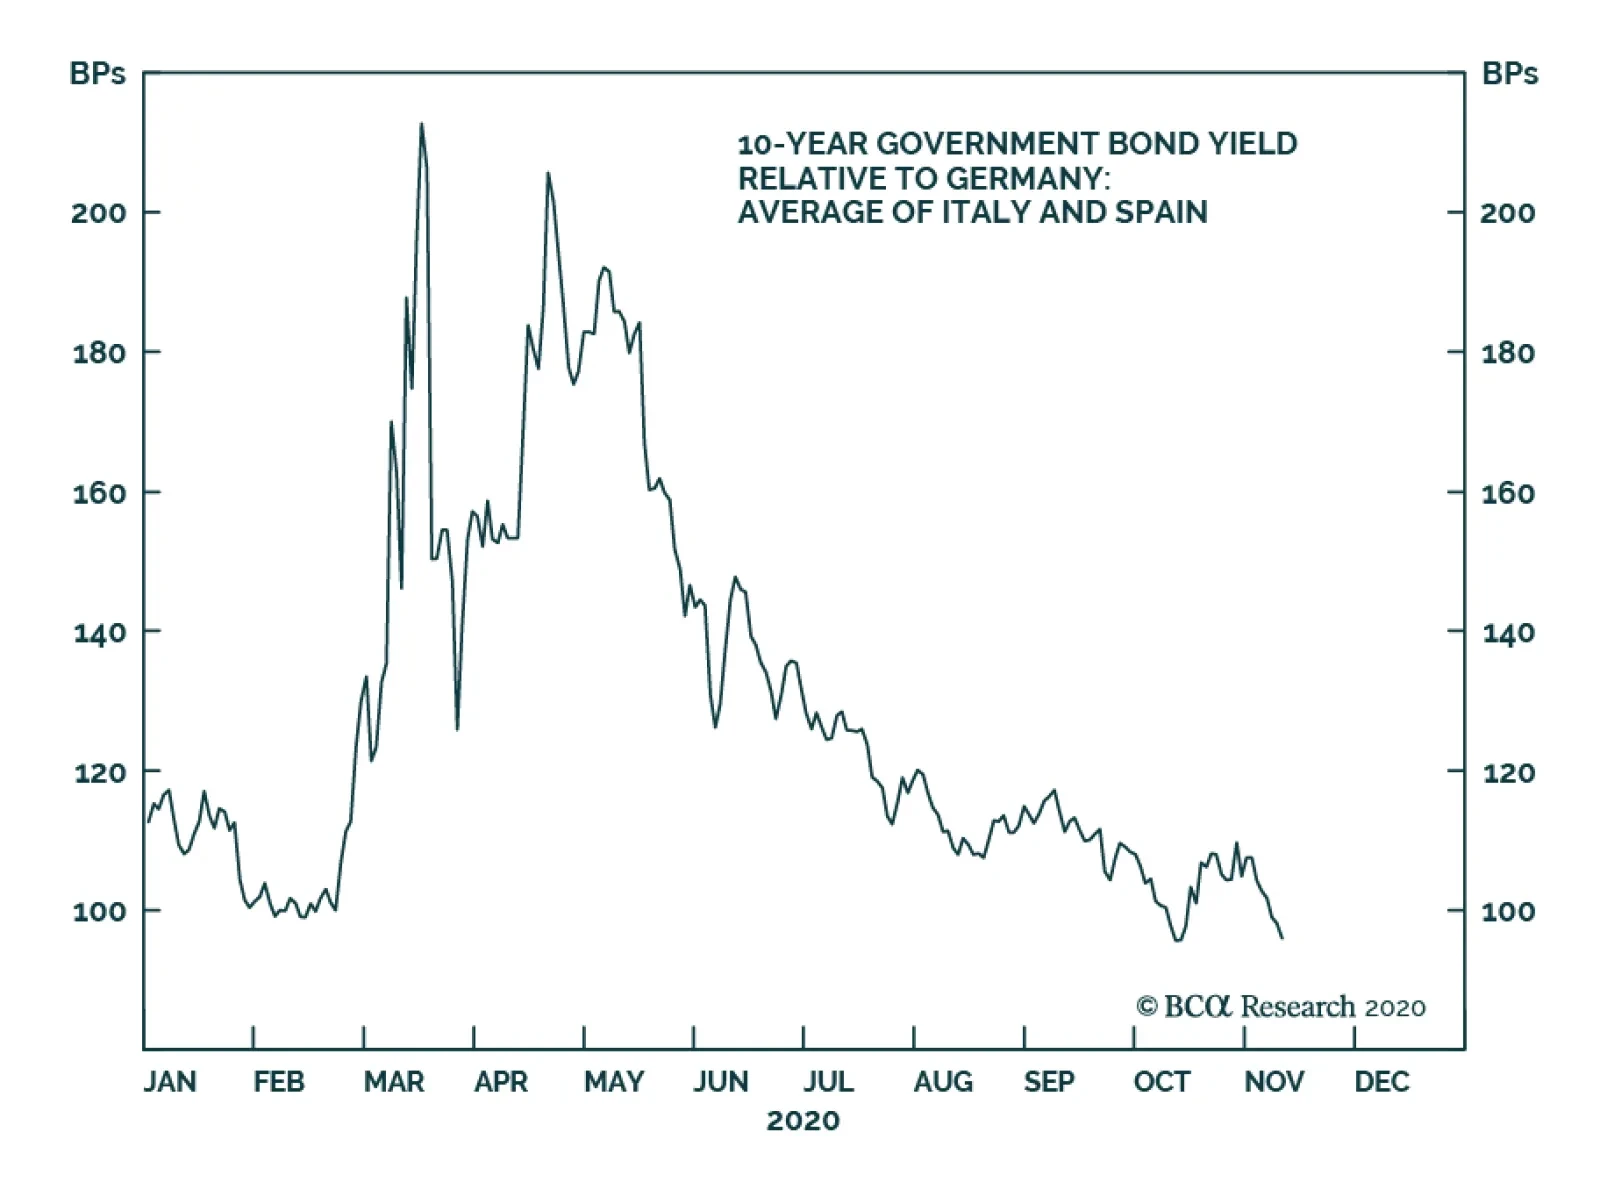
This contrasts to the euro area, Australia and the UK, where unemployment rates remain elevated. The recent surge in coronavirus cases across Europe means that the ECB and Bank of England will be under no pressure by markets to reconsider their current easy money policies. While in Australia, persistently weak inflation and, more recently, worries about an appreciating Australian dollar are keeping expectations for Reserve Bank of Australia (RBA) policy ultra-dovish. Given the likely hit to longer-term potential growth from the COVID-19 pandemic, coming at a time of elevated debt levels (both government and private), markets are justified in pricing in a structurally lower level of policy rates for longer (Chart 7). Yet even in such a world, there will be cyclical upswings in growth and inflation that will upward pressure on bond yields. At the moment, those pressures seem greatest in the developed world in the US and Canada. This suggests that global bond investors should underweight both the US and Canada. However, the Fed seems more willing to accept a period of rising bond yields than the BoC, which has been very aggressive in the expansion of its quantitative easing (QE) program, which leaves us to only consider the US as a recommended underweight. Bottom Line: Joe Biden’s apparent victory in the US presidential race, as well as the announcement of a potential successful COVID-19 vaccine trial, are both bond-bearish outcomes. This is especially so for US Treasuries given the more resilient growth momentum in the US. Recommended Fixed Income Strategy After A Busy Few Days Joe Biden’s election victory and the potential COVID-19 vaccine do not lead us to make any changes to our main fixed income investment recommendations, which generally have a pro-growth, pro-risk bias that would benefit from the reduction in US political uncertainty and, potentially, the beginning of the end of the pandemic. On duration, we continue to recommend a moderate below-benchmark overall exposure. Our main fixed income investment recommendations, which generally have a pro-growth, pro-risk bias that would benefit from the reduction in US political uncertainty and, potentially, the beginning of the end of the pandemic. On country allocation, we remain underweight the US, neutral Canada and Australia, and overweight the UK, core Europe, Italy, Spain and Japan. The country allocations are determined by each country’s sensitivity to changes in US Treasury yields, particularly during periods of rising yields. We are overweight the countries with a lower “yield beta” to changes in US yields. We view Italy and Spain as credit instruments, supported by large-scale ECB purchases and more fiscal cooperation within Europe. We are not recommending underweights to higher-beta Canada and Australia, however, with both the BoC and RBA being very aggressive with bond purchases (Chart 8). On credit, the backdrop remains very conducive to spread product outperformance versus government bonds, particularly with the monetary policy backdrop remaining highly accommodative (Chart 9). Chart 8Global QE Has Been Aggressive
Global QE Has Been Aggressive
Global QE Has Been Aggressive
We expect some additional spread tightening for developed market corporate debt as well also emerging market US dollar denominated corporates. In terms of regions and credit tiers, we prefer US investment grade and Ba-rated high-yield to euro area credit. Chart 9Central Bank Liquidity Still Supportive For Global Credit
Central Bank Liquidity Still Supportive For Global Credit
Central Bank Liquidity Still Supportive For Global Credit
Chart 10More Global QE Is Good For Inflation-Linked Bonds
More Global QE Is Good For Inflation-Linked Bonds
More Global QE Is Good For Inflation-Linked Bonds
Finally, we continue to recommend overweight allocations to inflation-linked bods versus nominal government debt in the US, Italy and Canada. Central banks will continue to err on the side of maintaining stimulative monetary policy settings to keep financial conditions easy to support economic growth. That means no hawkish surprises on the interest rate front, while also continuing to buy bonds via quantitative easing (Chart 10) – reflationary policies that should help boost inflation expectations. Robert Robis, CFA Chief Fixed Income Strategist rrobis@bcaresearch.com Footnotes 1 We have deliberately left Japan out of this analysis, as the Bank of Japan’s Yield Curve Control policy has effectively short-circuited the link between Japanese economic growth, inflation and bond yields. Recommendations The GFIS Recommended Portfolio Vs. The Custom Benchmark Index
A Vaccine For Uncertainty
A Vaccine For Uncertainty
Duration Regional Allocation Spread Product Tactical Trades Yields & Returns Global Bond Yields Historical Returns
Joe Biden’s election victory and the potential COVID-19 vaccine have not led BCA Research's Global Fixed Income Strategy team to make any changes to their main fixed income investment recommendations. The existing recommendations generally have a pro-growth,…
Yesterday, Christine Lagarde provided a clear signal that vaccine optimism would not prevent the ECB from easing further in December, reinforcing the message that she gave at the last ECB meeting: that the central bank would “recalibrate its instruments”…
BCA Research's US Bond Strategy service concludes that a moderate bear-steepening of the Treasury curve remains the most likely outcome for the next 6-to-12 months. Of course, the outlook is somewhat clouded by the fact that the dust has not completely…
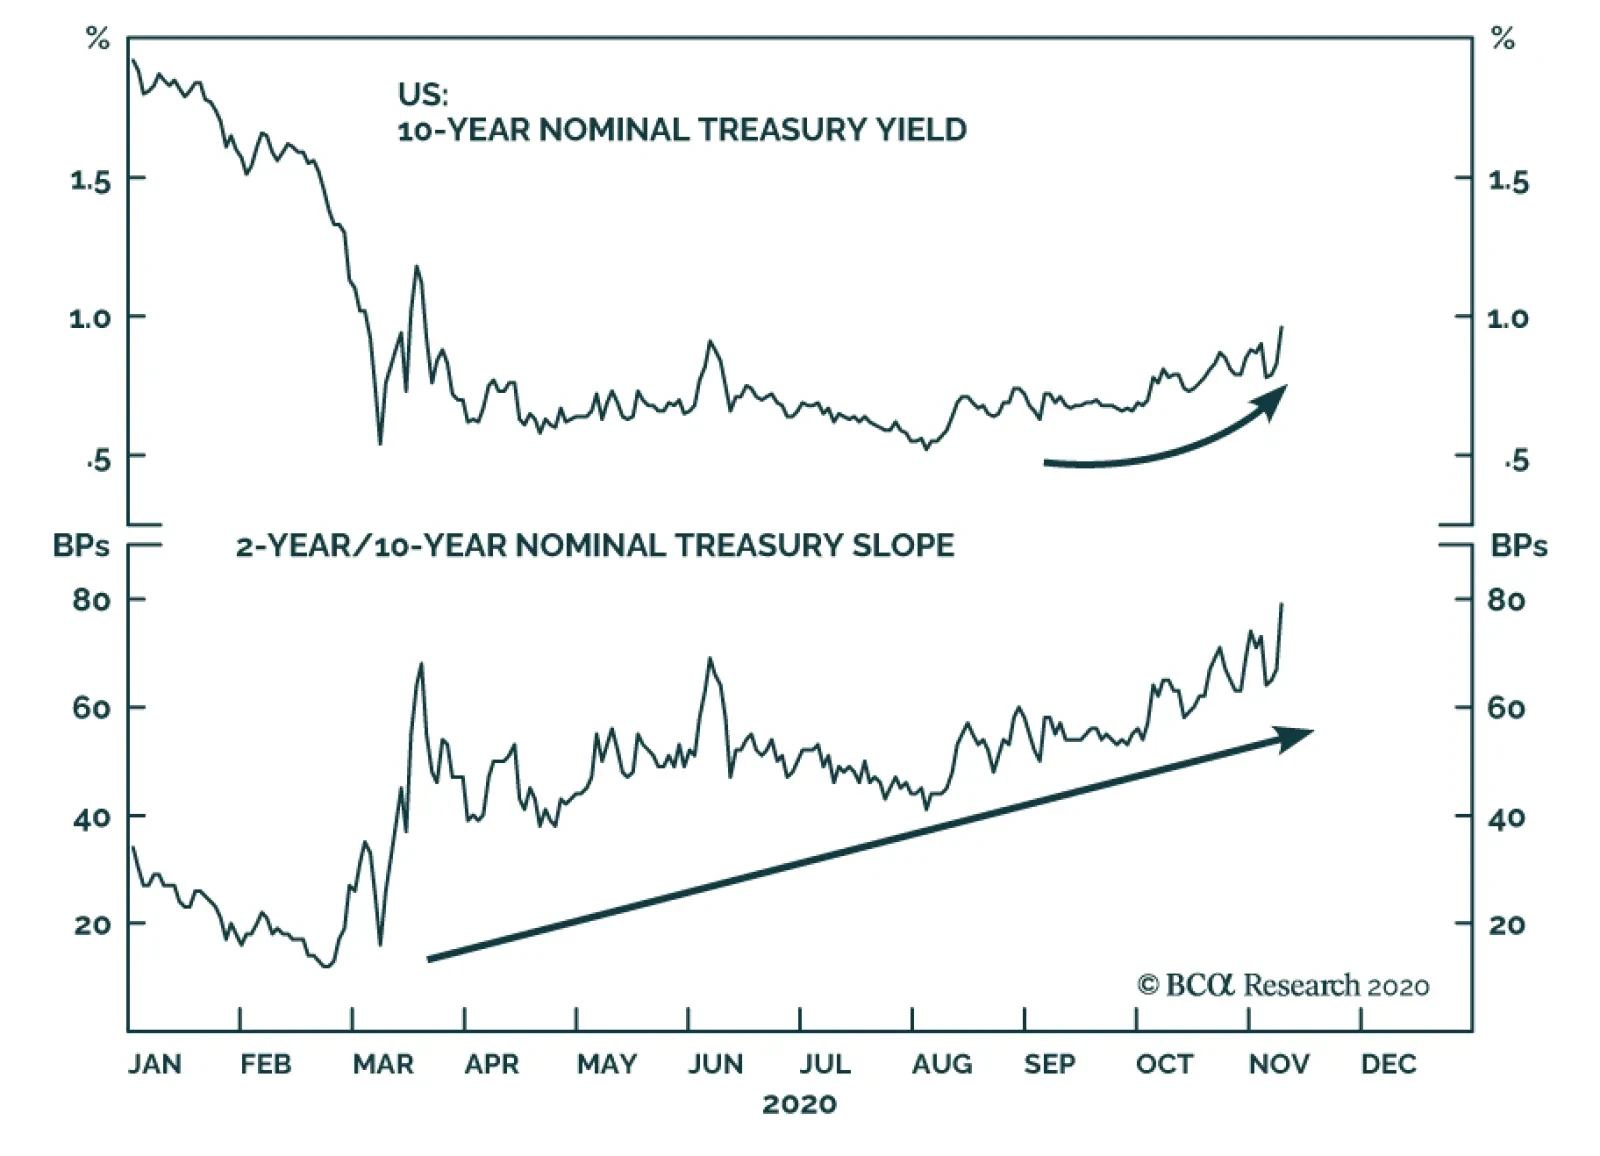
Highlights Economy: The Democrats did not sweep the US election, but the Democratic House and Republican Senate will likely find some middle ground on a stimulus deal. This will keep the economic recovery on track. A highly effective COVID vaccine that becomes widely available would supercharge it. Rates: Investors should continue to position for a bear-steepening nominal Treasury curve on a 6-12 month horizon. They should also overweight TIPS versus nominal Treasuries, favor inflation curve flatteners and real yield curve steepeners. Treasury Supply & Fed Demand: The Treasury department will continue to increase coupon issuance at the expense of bills. If current policy remains in place, Fed purchases will decline as a percent of coupon issuance in the coming quarters. But the Fed could take steps to modify its asset purchase strategy during the next few months. Feature We’ve seen enough. After a week of checking and re-checking the numbers, BCA’s US Bond Strategy service has concluded that a moderate bear-steepening of the Treasury curve remains the most likely outcome for the next 6-to-12 months. Of course, the dust has not completely settled on the US election. President Trump has issued several legal challenges and control of the Senate won’t be decided until early January when two run-off elections take place in Georgia. However, it now looks safe to assume that Joe Biden will take over as President next year. We also expect, with slightly less conviction, that the Republican party will keep control of the Senate, as Democrats need to win both Georgia races in order to secure a majority. In this week’s report, we assess the fall-out from the election on different sectors of the US bond market. We also consider how the election result impacts the outlook for fiscal stimulus and provide an update on supply and demand trends in the Treasury market. The Election Fall-Out In Bond Markets Nominal Yields Chart 1A Moderate Bear-Steepening
A Moderate Bear-Steepening
A Moderate Bear-Steepening
The 10-year Treasury yield got as high as 0.90% in advance of election day, as the market was pricing-in a Democratic sweep that would have led to a substantial increase in government spending. This outcome is still technically possible, but it now looks unlikely. The 10-year Treasury yield fell back to 0.78% as the election results came in but returned to 0.90% yesterday morning on news that Pfizer’s COVID vaccine was 90% effective in phase 3 trials. This market action affirms our recommended positioning. The Bloomberg Barclays Treasury Index has been underperforming cash since August, the uptrend in the 10-year Treasury yield remains intact and the yield curve continues to steepen (Chart 1). All these trends will remain in place as long as the economic recovery continues, and timely distribution of an effective COVID vaccine will certainly speed that process up. The biggest risk to our view is that a Democrat-controlled House and Republican-controlled Senate are unable to agree on a follow-up fiscal stimulus package during the next few months, and that the economic recovery stalls as a result. This is possible, but our base case scenario is that a compromise will be easier to reach now that the election is over. We expect a moderately-sized relief bill to be delivered relatively soon, possibly even before the end of the year. The Inflation Curve Chart 2Own Inflation Curve Flatteners...
Own Inflation Curve Flatteners...
Own Inflation Curve Flatteners...
The 10-year TIPS breakeven inflation rate fell 8 bps immediately after the election, but unlike with nominal yields, the trend in the cost of inflation compensation had been relatively flat heading into election day (Chart 2). It’s not hard to see why. Inflationary pressures in the economy have clearly moderated compared to the summer. The oil price has taken a step down (Chart 2, panel 3) and month-over-month CPI growth has been trending lower (Chart 2, bottom panel). We don’t expect this deceleration in inflation to continue. Global economic recovery will keep commodities well bid, and core inflation will slowly recover back to target. This argues for staying overweight TIPS versus nominal Treasuries. We also recommend owning inflation curve flatteners. The inflation curve has been steepening since August, as the short-dated cost of inflation compensation has fallen by more than the long-dated cost (Chart 2, panel 2). This steepening is typical for periods when TIPS breakeven rates are falling, and it will reverse when breakevens start rising again. Looking further out, the Fed’s commitment to allow a temporary overshoot of its 2% inflation target means that we should expect the inflation curve to invert. This means that inflation curve flatteners have a lot of room to run. Real Yields With almost no volatility in short-maturity nominal yields, short-maturity real yields are simply the mirror image of short-maturity inflation expectations. For this reason, the 2-year real yield has been moving up since August as the 2-year cost of inflation compensation has declined (Chart 3). This dynamic doesn’t hold for long maturities, where nominal yields have been rising as markets price-in eventual Fed tightening (Chart 3, top panel). Inflationary pressures in the economy have clearly moderated compared to the summer. The different behavior of long- and short-maturity real yields gives us high conviction in recommending a real yield curve steepener (Chart 3, bottom panel). A recovery in inflation expectations will push short-maturity real yields lower but will not have the same impact at the long-end where nominal yields will also rise. Chart 3…And Real Yield Curve Steepeners
...And Real Yield Curve Steepeners
...And Real Yield Curve Steepeners
Corporate Credit Chart 4Credit Spreads Welcomed The Election Results
Credit Spreads Welcomed The Election Results
Credit Spreads Welcomed The Election Results
Interestingly, the election result of a Biden presidency and divided House and Senate was viewed positively by both the “risk-free” Treasury market and risky credit spreads (Chart 4). Treasury yields fell on expectations of less fiscal stimulus, but credit spreads also tightened because a Republican Senate will keep corporate tax hikes at bay and a Biden presidency will ratchet down trade tensions with China. We maintain our positive outlook on credit and continue to recommend overweight allocations to corporate bonds rated Ba and higher. We remain underweight low-rated junk bonds (B & below) for now, because those spreads are pricing-in a rapid drop in the default rate. We may soon shift into low-rated junk as well, depending on how quickly an effective vaccine can be distributed. One less discussed risk for corporate spreads is the expiration of the Fed’s emergency lending facilities at the end of the year. The facilities are currently scheduled to expire on December 31st, though Fed Chair Powell seemed to imply last week that he would like to extend them. The one hitch could be that the Treasury department will also have to sign-on to an extension. It is currently unclear whether it is interested in doing so. Municipal Bonds Chart 5Munis Still Very Attractive
Munis Still Very Attractive
Munis Still Very Attractive
The strong relative performance of municipal bonds since election day has been the most confounding market move (Chart 5). All logic tells us that Municipal / Treasury yield spreads should have widened as it became clear that the Republicans will likely keep control of the Senate. A Republican Senate will prevent Joe Biden from raising income taxes, which would have made tax-advantaged munis look more attractive on a relative basis. A Republican Senate has also been staunchly opposed to providing federal aid to cash-strapped state & local governments. But munis have outperformed Treasuries despite these obvious negative catalysts, possibly in part due to Mitch McConnell’s post-election comments that suggested he is open to compromise on a fiscal relief bill and would even be open to including some funds for state & local governments. Despite McConnell’s comments, the prospect of federal funds for state & local governments is uncertain at best. But we nonetheless maintain an overweight allocation to municipal bonds due to continued extraordinary valuations relative to both Treasuries (Chart 5, panel 2) and corporates (Chart 5, bottom panel). The Stimulus Risk As we alluded to above, the biggest risk to our bond-bearish view is that the failure to pass a follow-up to the CARES act results in a spate of negative economic data that spooks investors. This negative data would likely first show up in consumer spending, which so far continues to recover (Chart 6). However, we think the odds are that, in the absence of stimulus, we will see a disappointing consumer spending report within the next few months. How markets react to that news will depend on the status of stimulus talks at that time, as well as news about a potential vaccine roll-out. Disposable personal income was still above pre-COVID levels in September, but it continues to be buttressed by income support from the federal government. Notice that non-transfer income remains below pre-COVID levels (Chart 6, panel 3). Further, the drop in the savings rate during the past few months has outpaced the improvement in consumer sentiment (Chart 6, bottom panel). This suggests that any excess savings that households may have accumulated in the spring are now close to being exhausted. In the absence of stimulus, we will see a disappointing consumer spending report within the next few months. Elsewhere, the labor market continues to make steady improvements, but it could also use some help from policymakers. Excluding temporary census employment, nonfarm payrolls rose 786k in October, slightly above September’s pace but below the rapid gains seen in May and June (Chart 7). Further, initial jobless claims remain above 700k per week and real-time employment data from Homebase has been steady at a low level. All this to say that the labor market is making only modest gains and there remains a gap of 10 million jobs between current nonfarm payrolls and those from February (Chart 7, top panel). Chart 6Keep Monitoring Consumer Spending
Keep Monitoring Consumer Spending
Keep Monitoring Consumer Spending
Chart 7A Slow Recovery In Employment
A Slow Recovery In Employment
A Slow Recovery In Employment
The bottom line is that, without further fiscal stimulus, the odds are high that the economic data will disappoint at some point during the next few months. This will cause bond yields to fall and credit spreads to widen, unless it looks like Congress is close to a deal or like a vaccine will be available in a timely manner. Fortunately, we do think the odds are relatively high that a Republican Senate and Democratic House will be able to reach a compromise stimulus deal, albeit a modest one in the range of $700 billion to $1 trillion. The political incentives against compromise have faded now that the election is over, and we expect a deal either this year or early next year. Treasury Supply And Fed Demand The Treasury department recently released its financing estimates for the next two quarters. A few trends are worth mentioning. First, the Treasury will continue to increase coupon issuance as it seeks to extend the average maturity of the outstanding debt (Chart 8, top panel). Chart 8The Path For Treasury Supply And Fed Demand
Bond Bear Intact
Bond Bear Intact
Second, the Treasury will continue to operate with an historically elevated cash balance, but it will seek to reduce its cash holdings to $800 billion from $1.6 trillion currently (Chart 9). Chart 9Treasury Will Deploy Some Cash
Treasury Will Deploy Some Cash
Treasury Will Deploy Some Cash
Third, the Treasury assumed in its projections that Congress will deliver another $1 trillion of stimulus. The combination of (i) increased coupon issuance, (ii) a falling cash balance and (iii) stimulus projections that may be too high, points to a continued drop in T-bill issuance (Chart 10). In fact, the Treasury acknowledged that bill issuance will likely fall going forward and said that it would be comfortable with a distribution where bills account for 15%-20% of the outstanding debt (Chart 11). Chart 10Expect T-Bill Issuance To ##br##Keep Falling…
Expect T-Bill Issuance To Keep Falling...
Expect T-Bill Issuance To Keep Falling...
Chart 11…And To Settle At Around 15-20% Of Outstanding Debt
...And To Settle At ArouNd 15-20% Of Oustanding Debt
...And To Settle At ArouNd 15-20% Of Oustanding Debt
Fed Chairman Powell also addressed the media last week, after the conclusion of the November FOMC meeting, and announced that the Fed made no changes to its asset purchases. For the time being, the Fed will continue to purchase “at least” $80 billion of Treasuries and $40 billion of MBS per month. However, Powell did indicate that FOMC participants discussed different ways in which they might modify the asset purchase program in the future. Presumably this means that if the Committee feels the need to deliver further monetary stimulus it will do so by either shifting its Treasury purchases to the long-end of the curve – in order to remove more duration risk from the market – or by increasing the outright pace of purchases. Powell made it clear that he sees these sorts of balance sheet moves as viable forms of monetary stimulus, though the tone of the questions he received during the press conference suggests that the consensus increasingly senses that the Fed might be out of ammo. Several questioners noted Powell’s repeated calls for fiscal stimulus and asked directly whether the Fed has done all it can. In conclusion, if the Fed maintains the current pace and distribution of Treasury purchases (Chart 8, panel 2), its asset purchases will continue to trend down compared to gross Treasury issuance (Chart 8, bottom panel). However, we could see the Fed taking a step to mitigate that decline at the long-end of the curve by shifting the maturity distribution of its asset purchases towards longer maturities. This move could occur as early as next month. The Treasury will continue to operate with an historically elevated cash balance, but it will seek to reduce its cash holdings to $800 billion from $1.6 trillion currently. The bar for actually increasing the monthly pace of purchases is likely much higher, and it would require a significant tightening of financial conditions or drop in economic activity to push the Fed into action. The bigger question, however, is whether the market even cares anymore about tweaks to the Fed’s asset purchase program. The tone of questions at last week’s press conference suggests it might not. Appendix: Buy What The Fed Is Buying The Fed rolled out a number of aggressive lending facilities on March 23. These facilities focused on different specific sectors of the US bond market. The fact that the Fed has decided to support some parts of the market and not others has caused some traditional bond market correlations to break down. It has also led us to adopt of a strategy of “Buy What The Fed Is Buying”. That is, we favor those sectors that offer attractive spreads and that benefit from Fed support. The below Table tracks the performance of different bond sectors since the March 23 announcement. We will use this to monitor bond market correlations and evaluate our strategy’s success. TablePerformance Since March 23 Announcement Of Emergency Fed Facilities
Bond Bear Intact
Bond Bear Intact
Ryan Swift US Bond Strategist rswift@bcaresearch.com Fixed Income Sector Performance Recommended Portfolio Specification
I will be co-hosting a webcast with our Chief Geopolitical Strategist, Matt Gertken, in which we will discuss arguably the two biggest topics of the moment. The US Election Result, And The Pandemic: What Happens Next? on Friday November 6 at 8.00AM EST (1.00PM GMT, 2.00PM CET, 9.00PM HKT). Also, in lieu of the next strategy report, I will be presenting the quarterly webcast on Thursday November 12 at 10.00AM EST (3.00PM GMT, 4.00PM CET, 11.00PM HKT). I hope you can join both webcasts. Highlights Productivity growth will continue to outperform in the US versus Europe through 2021. Equity investors should tilt towards viable small companies and businesses with operations in the US rather than in Europe. Higher productivity growth in the US means that this cycle’s low in US versus euro area core CPI inflation is unlikely to be reached until deep into 2021, at the earliest. Remain structurally overweight long-dated US bonds versus long-dated core European bonds. Structurally favour European currencies versus the dollar. Investors who cannot tolerate volatility should own CHF/USD. Investors who can tolerate volatility should own the more undervalued SEK/USD. Fractal trade: Underweight Australian construction. Feature If the economic difference between the US and Europe could be encapsulated in one picture, then the Chart of the Week would be that picture. In the US, you can hire and fire workers very easily. In Europe, you cannot. This means that in good times, the US can create millions of jobs, Europe much less so. The flip side is that in bad times, the US can destroy millions of jobs, Europe much less so. Chart of the WeekThe US Can Hire And Fire Workers. Europe Much Less So
The US Can Hire And Fire Workers. Europe Much Less So
The US Can Hire And Fire Workers. Europe Much Less So
After the dot com bust of 2000, employment fell by 2 percent in the US, but did not fall at all in France. After the global financial crisis of 2008, employment fell by 6 percent in the US, but by just 1.5 percent in France. After the pandemic recession of this year, US employment has rebounded strongly, yet is still down by 7 percent. In contrast, employment in France is down by just 3 percent. After A Recession, Productivity Surges In The US, But Not In Europe If an economy can shed millions of jobs in a recession, then it is easier to restructure the economy with a new labour-saving technology or strategy that substitutes for the labour input permanently. In which case – to paraphrase Ernest Hemingway – the economy’s productivity growth comes gradually, and then suddenly. The suddenly tends to be immediately after a recession. In Europe, where the economy cannot easily shed workers in a recession, such a sudden post-recession productivity boom never happens. In the US, it always does. For example, at the start of the Great Depression a substantial part of the US automobile industry was still based on skilled craftsmanship. These smaller, less productive craft-production plants were the ones that shut down permanently, while plants that had adopted labour-saving mass production had the competitive advantage that enabled them to survive. The result was a major restructuring of the auto productive structure. Another simple example is the ‘typing pool’ which was a ubiquitous feature of the office environment until the late 1990s. Following the 2000 downturn, these typing jobs became extinct, to be replaced by the wholesale roll-out of Microsoft Word. Productivity growth will continue to outperform in the US versus Europe through 2021. After the 2000 downturn, productivity surged by 9 percent in the US, but rose by just 2 percent in France. After the 2008 recession, productivity increased by 5 percent in the US, but did not increase at all in France. And after this year’s recession, productivity is already up by 4 percent in the US, while it is down by 1 percent in France1 (Chart I-2). Chart I-2After Recessions, Productivity Surges In The US But Not In Europe
After Recessions, Productivity Surges In The US But Not In Europe
After Recessions, Productivity Surges In The US But Not In Europe
If history is any guide, productivity growth will continue to outperform in the US versus Europe through 2021. One conclusion is that equity investors should tilt towards viable small companies and businesses with operations in the US rather than in Europe. A Surge In Productivity Means Lower Inflation Yet the flip side of the post-recession productivity boom is rising unemployment. After the 2000 downturn, the number of permanently unemployed US workers continued to rise until September 2003, two years after the trough in economic activity. After the 2008 recession, permanent unemployment continued to rise until February 2010, almost a year after the economy had bottomed (Chart I-3). Chart I-3US Permanent Unemployment Peaks Well After The Economy Bottoms
US Permanent Unemployment Peaks Well After The Economy Bottoms
US Permanent Unemployment Peaks Well After The Economy Bottoms
Therefore, optimistically assuming the pandemic trough in the economy occurred in the second quarter of 2020, the rise in the number of permanently unemployed US workers is likely to continue through the winter. In fact, it could last much longer because, compared to the global financial crisis, the pandemic is wreaking much more structural havoc on the way that we live, work, and interact. This means that compared to a common-or-garden recession, many more jobs are now economically unviable. Worse, if a resurgent pandemic causes a double-dip recession, then the peak in structural unemployment will be pushed back even further. Higher structural unemployment depresses rent inflation. Higher structural unemployment hurts the security and growth of wages. Therefore, as we pointed out in last week’s Special Report, The Real Risk Is Real Estate, one major consequence is that it depresses housing rent inflation (Chart I-4). It also depresses owner equivalent rent (OER) inflation – the imputed costs that homeowners notionally pay ‘to consume’ their home – because OER inflation closely tracks actual rent inflation (Chart I-5). Chart I-4Higher US Permanent Unemployment Depresses Rent Inflation
Higher US Permanent Unemployment Depresses Rent Inflation
Higher US Permanent Unemployment Depresses Rent Inflation
Chart I-5Owner Equivalent Rent Inflation Tracks Actual Rent Inflation
Owner Equivalent Rent Inflation Tracks Actual Rent Inflation
Owner Equivalent Rent Inflation Tracks Actual Rent Inflation
This is important for European investors, because another big difference between the US and Europe is the treatment of owner-occupied housing costs in the consumer price index (CPI). The US includes OER in its inflation rate, whereas Europe does not. The result is that shelter – the sum of OER and actual rents – carries a 42 percent weighting in the US core CPI, compared with just a 13 percent weighting in the euro area core CPI. Hence, US core CPI inflation closely tracks rent inflation (Chart I-6). Meaning that US core CPI inflation reaches its cycle low only after the number of permanently unemployed workers reaches its peak. This holds true both in absolute terms, and in relative terms versus euro area core CPI inflation. After the 2000 downturn, both the absolute and relative inflation cycle lows were not reached until late 2003. After the 2008 recession, the inflation lows were not reached until late 2010 (Chart I-7 and Chart I-8). Chart I-6US Core CPI Inflation Tracks ##br##Rent Inflation
US Core CPI Inflation Tracks Rent Inflation
US Core CPI Inflation Tracks Rent Inflation
Chart I-7Only After Permanent Unemployment Peaks Does US Core Inflation Bottom, Both In Absolute Terms...
Only After Permanent Unemployment Peaks Does US Core Inflation Bottom, Both In Absolute Terms...
Only After Permanent Unemployment Peaks Does US Core Inflation Bottom, Both In Absolute Terms...
Chart I-8...And Relative To Euro Area Core CPI Inflation
...And Relative To Euro Area Core CPI Inflation
...And Relative To Euro Area Core CPI Inflation
On this basis, this cycle’s low in US versus euro area core CPI inflation is unlikely to be reached until deep into 2021, even on the most optimistic assumptions. Some Investment Conclusions From an investment perspective, US versus euro area core CPI inflation is important because it drives relative bond yields. As the spread between relative inflation rates compresses, the spread between long-dated bond yields also compresses (Chart I-9). Chart I-9When US And Euro Area Core CPI Inflation Rates Converge, So Do US And Euro Area Bond Yields
When US And Euro Area Core CPI Inflation Rates Converge, So Do US And Euro Area Bond Yields
When US And Euro Area Core CPI Inflation Rates Converge, So Do US And Euro Area Bond Yields
One conclusion is to remain overweight long-dated US bonds versus long-dated core European bonds. Our preferred expression is to stay overweight a 50:50 portfolio of higher yielding US T-bonds and Spanish Bonos versus a 50:50 portfolio of near-zero yielding German Bunds and French OATs. In this strategic position, any price moves in the aftermath of the US election result are just short-term noise. A second conclusion is that the likely yield spread compression between US and European long-dated bond yields will structurally favour European currencies versus the dollar. Though an important caveat is that the dollar will retain its haven qualities during periods of market stress, because many haven assets and markets are denominated in the greenback. Remain overweight long-dated US bonds versus long-dated core European bonds. Therefore, investors who cannot tolerate volatility should own Europe’s haven currency, the Swiss franc versus the dollar. Investors who can tolerate volatility should own the more undervalued Swedish krona versus the dollar. Fractal Trading System* This week’s recommended trade is to underweight the Australian construction sector versus the market. One way to implement this is to short an equally-weighted basket of James Hardie, Lendlease, and Boral versus the market. Set the profit target and symmetrical stop-loss at 5.7 percent. In other trades, short MSCI Finland versus MSCI Switzerland achieved its 7 percent profit target. But long 30-year T-bond versus French 30-year OAT reached its 3.2 percent stop-loss just before the T-bond’s strong post-election rally. The rolling 1-year win ratio now stands at 53 percent. Chart I-10Australia: Construction Materials Vs. Market
Australia: Construction Materials Vs. Market
Australia: Construction Materials Vs. Market
When the fractal dimension approaches the lower limit after an investment has been in an established trend it is a potential trigger for a liquidity-triggered trend reversal. Therefore, open a countertrend position. The profit target is a one-third reversal of the preceding 13-week move. Apply a symmetrical stop-loss. Close the position at the profit target or stop-loss. Otherwise close the position after 13 weeks. * For more details please see the European Investment Strategy Special Report “Fractals, Liquidity & A Trading Model,” dated December 11, 2014, available at eis.bcaresearch.com. Dhaval Joshi Chief European Investment Strategist dhaval@bcaresearch.com Footnotes 1 Productivity is defined here as real GDP per employed person, and productivity growth is quoted for the periods q1 2002 through q4 2003, q2 2008 through q4 2010, and q4 2019 through q3 2020. Fractal Trading System Cyclical Recommendations Structural Recommendations Closed Fractal Trades Trades Closed Trades Asset Performance Currency & Bond Equity Sector Country Equity Indicators Bond Yields Chart II-1Indicators To Watch - Bond Yields
Indicators To Watch - Bond Yields
Indicators To Watch - Bond Yields
Chart II-2Indicators To Watch - Bond Yields
Indicators To Watch - Bond Yields
Indicators To Watch - Bond Yields
Chart II-3Indicators To Watch - Bond Yields
Indicators To Watch - Bond Yields
Indicators To Watch - Bond Yields
Chart II-4Indicators To Watch - Bond Yields
Indicators To Watch - Bond Yields
Indicators To Watch - Bond Yields
Interest Rate Chart II-5Indicators To Watch - Interest Rate Expectations
Indicators To Watch - Interest Rate Expectations
Indicators To Watch - Interest Rate Expectations
Chart II-6Indicators To Watch - Interest Rate Expectations
Indicators To Watch - Interest Rate Expectations
Indicators To Watch - Interest Rate Expectations
Chart II-7Indicators To Watch - Interest Rate Expectations
Indicators To Watch - Interest Rate Expectations
Indicators To Watch - Interest Rate Expectations
Chart II-8Indicators To Watch - Interest Rate Expectations
Indicators To Watch - Interest Rate Expectations
Indicators To Watch - Interest Rate Expectations
Highlights Our base case of a Biden win with a GOP Senate may come to pass. But the US election is not over yet. Trump still has a chance of victory by winning Pennsylvania and one other state. If the vote count does not settle the outcome clearly this week, a full-fledged contested election will emerge that may not be settled until just before December 14 (or even January). Risk-off sentiment will prevail in the interim, given the importance of the executive-legislative configuration for the pandemic response and the fiscal policy outlook. What we know is that Republicans kept the Senate, in line with our final forecast last week. This means gridlock is assured – which is positive for US stocks beyond near-term fiscal risks. Stay long JPY-USD, short CNY-USD, long stocks over bonds, long health care equipment, and long infrastructure plays. Keep dry powder for the presidential outcome, as global trade hangs in the balance. Feature The US presidential election is unsettled as we go to press, but we know that Republicans will keep control of the Senate and hence that American government will be divided or “gridlocked” for the next two years. As things stand, Democrats picked up two senate seats, Arizona and Colorado, but fell short everywhere else. They may even have lost a seat in Michigan. This leaves the balance of power at ~52-48 in favor of Republicans – which is one seat better than our final 51-49 forecast in their favor (Chart 1).1 Chart 1Our Senate Election Model Correctly Predicted Republican Control
Gridlock
Gridlock
Table 1Gridlock Is Inevitable Regardless Of Presidential Outcome
Gridlock
Gridlock
Gridlock is the inevitable consequence. If President Trump pulls off a victory in any two of the upper Midwestern states (Michigan, Pennsylvania, Wisconsin), then he will still face a Democrat-controlled House of Representatives. If former Vice President Joe Biden pulls off a victory in two of these states, then he will face a Republican controlled Senate (Table 1). Chart 2Gridlock More Favorable Than Sweep For Wall Street, But Fiscal Risks Abound In Short Run
Gridlock More Favorable Than Sweep For Wall Street, But Fiscal Risks Abound In Short Run
Gridlock More Favorable Than Sweep For Wall Street, But Fiscal Risks Abound In Short Run
Historically gridlock offers more upside for the S&P 500 than a single-party sweep (Chart 2), and we agree with this expectation when it comes to the long-run impact of this election. However, we have also warned against the fiscal risks of a Biden win with a Republican Senate in the short run. The status quo Trump gridlock is reflationary at first but later problematic due to trade war. The Biden gridlock is deflationary at first but the best outcome for investors over the long run. Consider the following: Trump with Senate Republicans: Trump is a spendthrift and he and his party joined the House Democrats in blowing out the budget deficit from 2018-20. Trump’s victory will force House Speaker Nancy Pelosi to concede to a Republican-drafted ~$1-$1.5 trillion new COVID-19 fiscal relief bill right away. For the second term, Trump will push an infrastructure bill, border security, and make his tax cuts permanent. The fiscal thrust in 2021 will be flat-to-up. The budget deficit will probably end up somewhere between the Republican “high spending” scenario and the Democratic “low spending” scenario in our budget deficit projections (Chart 3). This is positive for US growth and especially corporate earnings, but it comes with a catch: Trump will be emboldened in his trade wars, which could expand beyond China to Europe or others. Tariffs and currency depreciation will weigh on global growth. Still, Trump’s second term will occur in the early stages of the business cycle and the Fed is committed not to hike rates until 2023, so the overall picture is reflationary. Chart 3Trump Gridlock Reflationary, Biden Gridlock Deflationary Over Short Run
Gridlock
Gridlock
Biden with Senate Republicans: Since Senate Republicans did not capitulate to large Democratic spending demands prior to the election, when their seats were at risk, they will have less incentive to do so afterwards when the president hails from the opposing party. The only way they will agree to a new fiscal stimulus in the “lame duck” session (November-December) is if the Democrats concede to their skinny proposals for the time being. But Democrats will probably insist on their demands having made electoral gains. In this case, either financial markets will sell off, forcing Republicans to capitulate, or investors will have to wait until early 2021 to receive a new fiscal bill that is uncertain in size and timing. The first battle of Biden’s presidency will be with the GOP Senate. The Republican “low spending” scenario in Chart 3 is most likely. It is not realistic that Congress will allow the baseline scenario, in which the budget deficit contracts by ~7.4% of GDP. Republican senators today are not the Tea Party House Republicans of 2010, who were rabid fiscal hawks. Still, uncertainty will weigh heavily and markets will have to fall before GOP senators wake up to the underlying risk to the economic recovery. The consolation is that beyond this 3-6 month period of negative sentiment and deflationary fiscal risk, the outlook will be fairly positive. Biden will not use broad-based unilateral tariffs the way Trump did, with the possible exception of China later in his term. And the Republican Senate will not agree to tax hikes at any point, making taxes a concern for 2023 or thereafter. This is the best of both worlds for US business sentiment and the corporate earnings outlook over the two-year period. Risk-off sentiment will prevail until the election is decided. This could be in a couple of days if the vote count is clear in Michigan, Pennsylvania, and Wisconsin. Or it could extend until just before December 14, when the Electoral College votes, if the litigation and court rulings in these critical states drag on, which we discuss below. The reason risk-off sentiment will prevail is that the US economy is burning through its remaining stimulus funds rapidly, the fiscal trajectory is unclear until the presidency is decided, Europe is going into partial lockdowns over the pandemic, and a Biden victory would imply more US lockdowns. Diagram 1 outlines the macro and market implications as we see them, depending on the presidential outcome. We never took the view that a Democratic sweep of White House and Senate would be the best outcome for the overall investment outlook, though we conceded that it was the most reflationary and bullish in the short term. But now this point is moot. Investors will have to wait another two years at minimum for the full smorgasbord of Democratic spending proposals to have a chance at passage. Diagram 1Gridlock Rules Out Massive Fiscal Boost
Gridlock
Gridlock
Bottom Line: The presidency is indeterminate as we go to press. What is clear is that Republicans retained the Senate. Therefore gridlock will prevail. This is generally market positive, though a Biden win would weigh on risk assets in the near term until financial markets force Republican senators to capitulate to a new fiscal bill. A Controversial Election Or A Contested Election? The critical battleground states are undecided as we go to press. Trump needs to win any two of Michigan, Pennsylvania, and Wisconsin to retain the White House. The vote count will last through Wednesday and possibly beyond. The Republican and Democratic legal teams are preparing for trench warfare. Major legal challenges are highly likely and will delay the final outcome into December or even January. The first thing is to finish counting the absentee and mail-in ballots. Georgia, Michigan, Wisconsin, and Arizona are not accepting ballots after election day, so they will finish counting soon. Then all that remains is to see if any legal disputes arise that prevent the Electoral College members from being settled in these states, which is still possible. For example, Wisconsin is within a percentage point. Nevada will accept ballots by November 10 and North Carolina by November 12 as long as they are postmarked by election day. It is likely but not certain that Democrats will keep Nevada (~75% counted) while Republicans will keep North Carolina (~100% counted). Thus Pennsylvania poses the biggest risk of a contested result – and this was anticipated. The deadline to receive mailed ballots is Friday, November 6, but a legal dispute is already underway as to whether the original November 3 deadline should be reinstated.2 We will not pretend to predict the final court verdict on Pennsylvania, but it would not be surprising at all if the Supreme Court ruled that ballots received after election day cannot be accepted. The constitution grants state legislatures the sole power of choosing a state’s electors. Each state passes its own election laws. The Pennsylvania state legislature clearly stated that ballots must be returned by election day. It was a court decision that extended the deadline. The Supreme Court could easily determine that a lower court does not have the power to change the deadline. But nobody will know until the court rules. The fact that Trump appointed several of the judges has little bearing on their decisions because they serve lifetime appointments. Once election disputes rise above state vote-counting to the federal level, Trump gets a lifeline. First, the two-seat conservative leaning on the Supreme Court should produce strict readings of the law that could favor his bid. Second, the GOP’s victory in the Senate means that Democrats cannot unilaterally settle disputed electoral votes in their own favor at the joint session of Congress on January 6, which they could have done with a united Congress. Third, the Republicans are likely to have maintained a one or two-state majority of state delegations in the House of Representatives (based on results as we go to press), which means that Trump would win if the candidates failed to reach a 270-vote majority on the Electoral College or tied at 269. Note that an Electoral College tie is a distinct possibility in this election. Right now, if Trump loses in Michigan and Wisconsin, but wins Pennsylvania, and nothing else changes, then an Electoral College tie could result at 269-269 electoral votes.3 Polls … And Exit Polls Before condemning the entire profession of opinion pollsters to death it will be important to receive the verified results of the election and compare them with the final polling averages. It is clear that Trump was widely underrated yet again, but it is not yet clear that this was primarily or exclusively the fault of pollsters. Right now Trump is down by 1.8% in the nationwide popular vote, whereas he lagged by 7.2% in the average of the national polls and 2.3% in the battleground average on election day. This is a big 5.4% gap in the national poll, but in the battleground poll it is a minor 0.5% polling gap and as such merely confirms what many observers knew, that the battleground polls were the ones that really mattered due to the Electoral College. Trump’s battleground support average was 46.6% and his approval rating was 45.9% on election day, which respectively is 1.8% and 2.5% below his tentative share of the national vote at 48.4%. These gaps are within the average 3% margin of error – and normally sitting presidents outperform their polling by around 1%. State opinion polling had huge errors like the national poll. Charts 4 and 4B shows the final election polling in the critical swing states along with a “T” or “B” to mark Trump’s and Biden’s tentative vote share as we go to press. Swing state polls showed Trump staging a major rally in the final weeks of the campaign, which is what prompted us to upgrade his odds to 45%. Neither major pundits nor the mainstream media paid enough attention to this shift. Several prominent outlets denied that there was any real tightening in the polls even in late October. Chart 4APundits Overlooked Trump’s Rally In Swing State Polls In Final Weeks
Pundits Overlooked Trump's Rally In Swing State Polls In Final Weeks
Pundits Overlooked Trump's Rally In Swing State Polls In Final Weeks
Chart 4BPundits Overlooked Trump’s Rally In Swing State Polls In Final Weeks
Pundits Overlooked Trump's Rally In Swing State Polls In Final Weeks
Pundits Overlooked Trump's Rally In Swing State Polls In Final Weeks
What this demonstrates to us is the power of momentum in opinion polling, especially in the final week before an election when people’s attitudes harden and they bare more of their true opinions. It does not tell us that opinion polling is dead. What about the exit polls? Biden cut into Trump’s lead in key demographic groups just as the Democratic Party machinery anticipated, but it is not clear if it was enough to win the election. Trump lost ground and Democrats gained ground, relative to 2016, with white voters, old folks, and non-college-educated voters. But Trump improved his support among blacks and Hispanics, a signal point that gives the lie to much of this year’s media hype (Charts 5A and 5B). Chart 5ADemocrats Gained Ground With White, Elderly, And Non-College-Educated Voters; GOP Gained Among Blacks And Hispanics
Gridlock
Gridlock
Chart 5BDemocrats Gained Ground With White, Elderly, And Non-College-Educated Voters; GOP Gained Among Blacks And Hispanics
Gridlock
Gridlock
By far voters cared most about the issues, not personalities, and the biggest issue was the economy (35% of voters versus 20% on racial inequality and 17% on the coronavirus, which was apparently overrated as an issue by Democrats). The economic focus is the only explanation for Trump’s outperformance – the law and order narrative was less popular. Trump’s vote share may end up exactly equal to the number of respondents who said the economy was “good” or “excellent” (48%). Otherwise Trump’s base is well known: it consists predominantly of white people, rural people, those in the Midwest and South, those who have been fairly successful in income, and those who think America needs a “strong leader” more than a unifier with good judgment who seems to care about the average person. If Trump is defeated, the clear implication is that he failed to expand his base. If he wins, the clear implication is that Democrats suffered in the key regions for their aggressive approach to COVID lockdowns, their condoning of lawlessness, and their divisive handling of racial inequality and police brutality. With such a close vote for the White House, sweeping narratives are questionable. It is not clear yet whether liberalism or nationalism won, and at any rate the margin was thin. What is clear is that Democrats substantially disappointed in the Senate and they might even have failed to gain the White House. Given that this year witnessed a recession, pandemic, and widespread social unrest – well-attested historical signs that point to the failure of the incumbent party and recession – Democrats apparently failed to capitalize. National exit polls suggest the fault lay in their relative neglect of bread and butter in favor of the coronavirus or left-wing social theory. This is true not so much in the House of Representatives but in the presidential and senate races. If Trump wins – especially through a contested election – then US political polarization will rise due to the continued divergence of popular opinion and the constitutional system. “Peak polarization” will last another four years at least. But if Trump loses, given that Republicans held the Senate, there is room for compromise that would reduce polarization. But it is too early to say. Investment Takeaways Trade and foreign policy hinge on the presidency. Trump is favored in several of the key states at the moment and he is especially favored in a contested election process, but it is too soon to make investment recommendations on the executive branch other than that US equity outperformance is likely to continue on both of the scenarios at hand. Table 2Earnings Shock From Partial Repeal Of Trump Tax Cuts Has Been Averted
Gridlock
Gridlock
For now we recommend investors stay long JPY-USD, short CNY-USD, long health care equipment, and overweight stocks relative to bonds. On the Senate, the key takeaway is that Biden and the Democrats will not be able to raise taxes. This is a big benefit to the sectors that faced the greatest earnings shock from a partial repeal of Trump’s Tax Cuts and Jobs Act – namely real estate, tech, health care, utilities, consumer discretionary, and financials (Table 2). A simple play on these sectoral benefits courtesy of Anastasios Avgeriou, our US equity strategist, would be to go long small caps versus large caps, i.e. S&P 600 relative to the S&P 500, but wait till the fiscal hurdle is cleared. The BCA infrastructure basket should benefit regardless, as infrastructure is one of the few areas of bipartisan agreement, especially amid a large output gap. Matt Gertken Vice President Geopolitical Strategy mattg@bcaresearch.com Footnotes 1 We upgraded the Republicans to favored status last week based on our quantitative Senate election model, which showed a 51% chance that Republicans would maintain control, with 51-49 votes. Our presidential model also showed Trump winning with a 51% chance, but we subjectively capped his odds at 45% due to our doubts about his ability to win Michigan given Biden’s 4% lead in head-to-head public opinion polls there. 2 It is possible that Nevada’s November 10 deadline or North Carolina’s November 12 deadline could become relevant, but we doubt it. 3 Precise Electoral College outcomes cannot be predicted due to faithless electors, i.e. electoral college members who vote differently than required based on their state’s popular vote. In 2016 there were seven faithless electors and in 2020 there could be several and they could make the difference. Material punishments may not prevent an elector from making a conscientious decision to stray from his or her state’s results in an election viewed as having historic importance.
Highlights Chart 1Bond Yields Have Upside In A Blue Sweep
Bond Yields Have Upside In A Blue Sweep
Bond Yields Have Upside In A Blue Sweep
Today’s US election has important implications for the near-term path of bond yields. In particular, a “blue sweep” outcome where the Democrats win control of the House, Senate and White House will probably cause yields to jump (Chart 1), as such an outcome virtually guarantees a large fiscal relief package early next year. Fiscal negotiations will be more contentious if the Republicans maintain control of the Senate, and yields could decline this evening if that occurs. However, no matter the election outcome, our 6-12 month below-benchmark portfolio duration recommendation will not change tomorrow. The economic recovery appears to be on track and some further fiscal stimulus is likely next year no matter who prevails tonight. The stimulus will just be smaller if a divided government necessitates compromise. In any case, bond investors should keep portfolio duration below-benchmark and stay overweight TIPS versus nominal Treasuries. They should also maintain positions in nominal and real yield curve steepeners and inflation curve flatteners. Feature Investment Grade: Overweight Chart 2Investment Grade Market Overview
Investment Grade Market Overview
Investment Grade Market Overview
Investment grade corporate bonds outperformed the duration-equivalent Treasury index by 99 basis points in October, bringing year-to-date excess returns up to -300 bps. Corporate bonds are certainly not as cheap as they were back in March, but we still see acceptable value in the sector. The corporate index’s 12-month breakeven spread is at its 20th percentile since 1995 and the equivalent Baa spread is at its 28th percentile (Chart 2). Both levels appear somewhat expensive at first blush. However, considering the strong tailwinds from the Fed’s extraordinarily accommodative interest rate policy and emergency lending facilities, we see a lot of room for further tightening. Corporate bond issuance increased in September, though it remains well below the extreme levels seen in the spring (panel 4). The fact that the Financing Gap – the difference between capital expenditures and retained earnings – turned negative in the second quarter suggests that firms have enough cash to cover their investment needs (bottom panel). This will keep issuance low in the coming months. At the sector level, we continue to recommend overweight allocations to subordinate bank bonds,1 Healthcare and Energy bonds.2 We also advise underweight allocations to Technology3 and Pharmaceutical bonds.4 Table 3ACorporate Sector Relative Valuation And Recommended Allocation*
A Big Night For The Bond Market
A Big Night For The Bond Market
Table 3BCorporate Sector Risk Vs. Reward*
A Big Night For The Bond Market
A Big Night For The Bond Market
High-Yield: Neutral Chart 3High-Yield Market Overview
High-Yield Market Overview
High-Yield Market Overview
High-Yield outperformed the duration-equivalent Treasury index by 86 basis points in October, bringing year-to-date excess returns up to -373 bps. Ba-rated bonds outperformed lower-rated credits in October, and they remain the best performing corporate credit tier since the March 23 peak in spreads (See Appendix A). In terms of value, if we assume a 25% recovery rate on defaulted debt and a minimum required spread of 150 bps in excess of default losses, then the High-Yield index is priced for a default rate of 4.8% during the next 12 months (Chart 3). Such a large drop in the default rate cannot be ruled out completely, but it would necessitate a rapid pace of economic recovery. We are not yet confident enough in the recovery to position for such a fast drop-off in defaults, especially with Job Cut Announcements still well above pre-COVID levels (bottom panel). We therefore continue to recommend an overweight allocation to the Ba-rated credit tier – where access to the Fed’s emergency lending facilities is broadly available – and an underweight allocation to bonds rated B and below. At the sector level, we advise overweight allocations to high-yield Technology5 and Energy bonds.6 We are underweight the Healthcare and Pharmaceutical sectors.7 MBS: Underweight Chart 4MBS Market Overview
MBS Market Overview
MBS Market Overview
Mortgage-Backed Securities outperformed the duration-equivalent Treasury index by 12 basis points in October, bringing year-to-date excess returns up to -39 bps. The conventional 30-year MBS index option-adjusted spread (OAS) tightened 11 bps on the month to land at 72 bps. This is now slightly below the 76 basis point spread offered by Aa-rated corporate bonds but well above the 62 bps offered by Agency CMBS and the 29 bps offered by Aaa-rated consumer ABS. Despite the relatively attractive OAS, we remain concerned that the elevated primary mortgage spread is a warning that refinancing risk is greater than what is currently being priced in the market (Chart 4). Yes, the mortgage spread has tightened during the past few months, but it remains 35 bps above its average 2019 level. This suggests that the mortgage rate could fall another 35 bps due to spread compression alone, even if Treasury yields are unchanged. Such a move would lead to a significant increase in prepayment losses. The recent spike in the mortgage delinquency rate does not pose a near-term risk to spreads as it is being driven by households that have been granted forbearance from the federal government (panel 4). The risk for MBS holders only comes into play if many households are unable to resume their regular mortgage payments when the forbearance period expires early next year. But even in that case, further government intervention to either support household incomes or extend the forbearance period would mitigate the risk. Government-Related: Underweight Chart 5Government-Related Market Overview
Government-Related Market Overview
Government-Related Market Overview
The Government-Related index outperformed the duration-equivalent Treasury index by 30 basis points in October, bringing year-to-date excess returns up to -284 bps. Sovereign debt outperformed duration-equivalent Treasuries by 151 bps on the month, bringing year-to-date excess returns up to -420 bps. Foreign Agencies outperformed the Treasury benchmark by 18 bps in October, bringing year-to-date excess returns up to -690 bps. Local Authority debt underperformed Treasuries by 21 bps in October, dragging year-to-date excess returns down to -362 bps. Domestic Agency bonds outperformed by 7 bps, bringing year-to-date excess returns up to -33 bps. Supranationals outperformed by 5 bps, bringing year-to-date excess returns up to -7 bps. US dollar weakness is usually a boon for Emerging Market (EM) Sovereign and Foreign Agency returns. However, this year’s dollar weakness has been relative to other Developed Market currencies. In recent months, the dollar has actually strengthened versus EM currencies (Chart 5). Value also remains poor for EM Sovereigns, which continue to offer a lower spread than Baa-rated corporate debt (panel 4). We looked at EM Sovereign valuation on a country-by-country basis in a recent report.8 We concluded that Mexican and Russian bonds offer the most compelling risk/reward trade-offs relative to the US corporate sector. Of those two countries, Mexican debt offers the best opportunity as US politics remain a concern for the Russian currency. Municipal Bonds: Overweight Chart 6Municipal Market Overview
Municipal Market Overview
Municipal Market Overview
Municipal bonds outperformed the duration-equivalent Treasury index by 41 basis points in October, bringing year-to-date excess returns up to -464 bps (before adjusting for the tax advantage). Municipal bond spreads versus Treasuries tightened in October, but value remains exceptional with most maturities trading at a positive before-tax spread. As we showed in a recent report, municipal bonds are also attractively priced relative to corporate bonds across the entire investment grade credit spectrum.9 On a duration-matched basis, the Bloomberg Barclays General Obligation and Revenue Bond indexes trade at before-tax premiums relative to corporate bonds of the same credit rating, an extremely rare occurrence (Chart 6). Extraordinary valuation is the main reason for our recommendation to overweight municipal bonds. The severe ongoing state & local government credit crunch is a concern, but it is a risk we are willing to take. If the Democrats win the House, Senate and White House this evening – a fairly likely scenario – federal aid for state & local governments will be delivered in January. This would alleviate a lot of concern. But even in the absence of federal assistance, the combination of austerity measures (bottom panel) and all-time high State Rainy Day Fund balances should help stave off a wave of municipal downgrades. Treasury Curve: Buy 5-Year Bullet Versus 2/10 Barbell Chart 7Treasury Yield Curve Overview
Treasury Yield Curve Overview
Treasury Yield Curve Overview
The Treasury curve bear-steepened in October, largely due to rising expectations of a “blue sweep” election outcome. The 2/10 and 5/30 Treasury slopes steepened 18 bps and 9 bps, respectively, to reach 74 bps and 127 bps. Our expectation is that continued economic recovery will cause investors to price-in eventual monetary tightening at the long-end of the Treasury curve. With the Fed maintaining a firm grip on the front end, this will lead to Treasury curve bear steepening. More bear steepening is likely if the Democrats win the House, Senate and White House tonight, as this would mean that a large amount of fiscal stimulus is coming early next year. But we will stick with our curve steepening recommendation regardless of the election outcome. No matter who wins the election, some further fiscal stimulus is likely on a 6-12 month horizon. We recommend positioning for a steeper curve by owning the 5-year Treasury note and shorting a duration-matched barbell consisting of the 2-year and 10-year notes. This position is designed to profit from 2/10 curve steepening. Valuation is a concern with our recommended steepener, as the 5-year yield is below the yield on the duration-matched 2/10 barbell (Chart 7). However, the 5-year looked much more expensive during the last zero-lower-bound period between 2010 and 2013 (bottom 2 panels). We anticipate a return to similar valuation levels. TIPS: Overweight Chart 8TIPS Market Overview
TIPS Market Overview
TIPS Market Overview
TIPS outperformed the duration-equivalent nominal Treasury index by 38 basis points in October, bringing year-to-date excess returns up to -93 bps. The 10-year and 5-year/5-year forward TIPS breakeven inflation rates rose 7 bps and 5 bps on the month. They currently sit at 1.71% and 1.82%, respectively. Core CPI rose 0.19% in September and the year-over-year rate held steady at 1.73%. The 12-month trimmed mean CPI ticked down from 2.48% to 2.37%, so the gap between core and trimmed mean continued to narrow (Chart 8). We anticipate further narrowing in the months ahead, and therefore expect core CPI to come in relatively hot. For this reason, we recommend maintaining an overweight allocation to TIPS versus nominal Treasuries for the time being, even though the 10-year TIPS breakeven rate is no longer cheap according to our Adaptive Expectations Model (panel 2).10 Inflation pressures may moderate once core and trimmed mean inflation measures converge, and this could give us an opportunity to tactically reduce TIPS exposure sometime next year. We also recommend holding real yield curve steepeners and inflation curve flatteners. With the Fed now officially targeting an overshoot of its 2% inflation goal, we would expect the cost of 2-year inflation protection to rise above the cost of 10-year inflation protection (panel 4). With the Fed also exerting more control over short-dated nominal yields than over long-term ones, we expect that short-maturity real yields will come under downward pressure relative to the long end (bottom panel). ABS: Overweight Chart 9ABS Market Overview
ABS Market Overview
ABS Market Overview
Asset-Backed Securities outperformed the duration-equivalent Treasury index by 9 basis points in October, bringing year-to-date excess returns up to +72 bps. Aaa-rated ABS outperformed the Treasury benchmark by 6 bps on the month, bringing year-to-date excess returns up to +59 bps. Non-Aaa ABS outperformed by 29 bps, bringing year-to-date excess returns up to +157 bps. Aaa ABS are a high conviction overweight, given that spreads remain elevated compared to historical levels and that the sector benefits from Fed support through the Term Asset-Backed Loan Facility (TALF). However, spreads are even more attractive in non-Aaa ABS (Chart 9) and we recommend owning those securities as well. This is despite the fact that only Aaa-rated bonds are eligible for TALF. We explained our rationale for owning non-Aaa consumer ABS in a June report.11 We noted that stimulus received from the CARES act caused disposable income to increase significantly since February. Then, faced with fewer spending opportunities, households used much of that windfall to pay down consumer debt (panel 4). Granted, further income support from fiscal policymakers is needed now that the CARES act’s enhanced unemployment benefits have expired. But given the substantial boost to savings that has already occurred, we are confident that more stimulus will arrive in time to prevent a wave of consumer bankruptcies. Non-Agency CMBS: Neutral Chart 10CMBS Market Overview
CMBS Market Overview
CMBS Market Overview
Non-Agency Commercial Mortgage-Backed Securities outperformed the duration-equivalent Treasury index by 9 basis points in October, bringing year-to-date excess returns up to -250 bps. Aaa Non-Agency CMBS underperformed Treasuries by 10 bps on the month, dragging year-to-date excess returns down to -73 bps. Non-Aaa Non-Agency CMBS outperformed by 72 bps, bringing year-to-date excess returns up to -738 bps (Chart 10). We continue to recommend an overweight allocation to Aaa Non-Agency CMBS and an underweight allocation to non-Aaa CMBS. Our reasoning is simple. Aaa CMBS are eligible for TALF, meaning that spreads can still tighten even as the hardship in commercial real estate (CRE) continues. Without Fed support, non-Aaa CMBS will struggle to deal with tightening CRE lending standards and falling demand (panels 3 & 4). Agency CMBS: Overweight Agency CMBS outperformed the duration-equivalent Treasury index by 29 basis points in October, bringing year-to-date excess returns up to +17 bps. The average index spread tightened 6 bps on the month. It currently sits at 62 bps, well above typical historical levels (bottom panel). At its last meeting, the Fed decided to slow its pace of Agency CMBS purchases. It will no longer seek to increase its Agency CMBS holdings, but will instead purchase only what is “needed to sustain smooth market functioning”. This is nonetheless a Fed back-stop of the market, and it does not change our overweight recommendation. Appendix A: Buy What The Fed Is Buying The Fed rolled out a number of aggressive lending facilities on March 23. These facilities focused on different specific sectors of the US bond market. The fact that the Fed has decided to support some parts of the market and not others has caused some traditional bond market correlations to break down. It has also led us to adopt of a strategy of “Buy What The Fed Is Buying”. That is, we favor those sectors that offer attractive spreads and that benefit from Fed support. The below Table tracks the performance of different bond sectors since the March 23 announcement. We will use this to monitor bond market correlations and evaluate our strategy’s success. TablePerformance Since March 23 Announcement Of Emergency Fed Facilities
A Big Night For The Bond Market
A Big Night For The Bond Market
Appendix B: Butterfly Strategy Valuations The following tables present the current read-outs from our butterfly spread models. We use these models to identify opportunities to take duration-neutral positions across the Treasury curve. The following two Special Reports explain the models in more detail: US Bond Strategy Special Report, “Bullets, Barbells And Butterflies”, dated July 25, 2017, available at usbs.bcaresearch.com US Bond Strategy Special Report, “More Bullets, Barbells And Butterflies”, dated May 15, 2018, available at usbs.bcaresearch.com Table 4 shows the raw residuals from each model. A positive value indicates that the bullet is cheap relative to the duration-matched barbell. A negative value indicates that the barbell is cheap relative to the bullet. Table 4Butterfly Strategy Valuation: Raw Residuals In Basis Points (As Of October 30TH, 2020)
A Big Night For The Bond Market
A Big Night For The Bond Market
Table 5 scales the raw residuals in Table 4 by their historical means and standard deviations. This facilitates comparison between the different butterfly spreads. Table 5Butterfly Strategy Valuation: Standardized Residuals (As Of October 30TH, 2020)
A Big Night For The Bond Market
A Big Night For The Bond Market
Table 6 flips the models on their heads. It shows the change in the slope between the two barbell maturities that must be realized during the next six months to make returns between the bullet and barbell equal. For example, a reading of 63 bps in the 5 over 2/10 cell means that we would only expect the 5-year to outperform the 2/10 if the 2/10 slope steepens by more than 63 bps during the next six months. Otherwise, we would expect the 2/10 barbell to outperform the 5-year bullet. Table 6Discounted Slope Change During Next 6 Months (BPs)
A Big Night For The Bond Market
A Big Night For The Bond Market
Appendix C: Excess Return Bond Map The Excess Return Bond Map is used to assess the relative risk/reward trade-off between different sectors of the US bond market. It is a purely computational exercise and does not impose any macroeconomic view. The Map’s vertical axis shows 12-month expected excess returns. These are proxied by each sector’s option-adjusted spread. Sectors plotting further toward the top of the Map have higher expected returns and vice-versa. Our novel risk measure called the “Risk Of Losing 100 bps” is shown on the Map’s horizontal axis. To calculate it, we first compute the spread widening required on a 12-month horizon for each sector to lose 100 bps or more relative to a duration-matched position in Treasury securities. Then, we divide that amount of spread widening by each sector’s historical spread volatility. The end result is the number of standard deviations of 12-month spread widening required for each sector to lose 100 bps or more versus a position in Treasuries. Lower risk sectors plot further to the right of the Map, and higher risk sectors plot further to the left. Chart 11Excess Return Bond Map (As Of October 30TH, 2020)
A Big Night For The Bond Market
A Big Night For The Bond Market
Ryan Swift US Bond Strategist rswift@bcaresearch.com Footnotes 1 Please see US Bond Strategy Weekly Report, “The Case Against The Money Supply”, dated June 30, 2020, available at usbs.bcaresearch.com 2 Please see US Bond Strategy Special Report, “The Outlook For Energy Bonds Part 1: A Model Of Energy Bond Excess Returns”, dated July 14, 2020 and US Bond Strategy Special Report, “The Outlook For Energy Bonds Part 2: Buy The Dip In High-Yield Energy”, dated July 21, 2020, available at usbs.bcaresearch.com 3 Please see US Bond Strategy Weekly Report, “Take A Look At High-Yield Technology Bonds”, dated June 23, 2020, available at usbs.bcaresearch.com 4 Please see US Bond Strategy Weekly Report, “Assessing Healthcare & Pharma Bonds In A Pandemic”, dated June 9, 2020, available at usbs.bcaresearch.com 5 Please see US Bond Strategy Weekly Report, “Take A Look At High-Yield Technology Bonds”, dated June 23, 2020, available at usbs.bcaresearch.com 6 Please see US Bond Strategy Special Report, “The Outlook For Energy Bonds Part 1: A Model Of Energy Bond Excess Returns”, dated July 14, 2020 and US Bond Strategy Special Report, “The Outlook For Energy Bonds Part 2: Buy The Dip In High-Yield Energy”, dated July 21, 2020, available at usbs.bcaresearch.com 7 Please see US Bond Strategy Weekly Report, “Assessing Healthcare & Pharma Bonds In A Pandemic”, dated June 9, 2020, available at usbs.bcaresearch.com 8 Please see US Bond Strategy Weekly Report, “Trading Bonds In A Dollar Bear Market”, dated September 22, 2020, available at usbs.bcaresearch.com 9 Please see US Bond Strategy Weekly Report, “Political Risk Will Dominate In A Pivotal Month For The Bond Market”, dated October 13, 2020, available at usbs.bcaresearch.com 10 For more details on our model please see US Bond Strategy Weekly Report, “How Are Inflation Expectations Adapting?”, dated February 11, 2020, available at usbs.bcaresearch.com 11 Please see US Bond Strategy Weekly Report, “No Holding Back”, dated June 16, 2020, available at usbs.bcaresearch.com Fixed Income Sector Performance Recommended Portfolio Specification Corporate Sector Relative Valuation And Recommended Allocation