Fixed Income

Highlights COVID-19 In Europe: The latest surge in COVID-19 cases in Europe has unnerved investors who now see renewed national lockdowns increasing the risk of a double-dip European recession and continued deflationary pressures. ECB: The signals from last week’s ECB policy meeting could not be more clear – the central bank will deliver new stimulus measures in December in response to the second wave of coronavirus sweeping through the euro area. This will be a combination of policies focused on expanding and extending the existing bond-buying vehicles and TLTROs, rather than cutting policy rates deeper into negative territory. European Bond Strategy: Stay overweight core European government debt, particularly versus US Treasuries. Remain overweight Italian and Spanish government bonds, as well, which remain supported by both ECB asset purchases and perceptions of increases European fiscal integration. Stay cautious on euro area corporate debt, however, as the renewed recession risk comes at a time when yields and spreads offer poor protection from future credit downgrades and defaults. Feature Chart of the WeekA Bad Time For A Second Wave
A Bad Time For A Second Wave
A Bad Time For A Second Wave
Today’s long anticipated US election will be the focus for investors in the coming days (and, potentially, weeks) as all votes are counted. We have discussed our views on the potential bond market impact of the election - bearish for US Treasuries with both Joe Biden and Donald Trump promising big fiscal stimulus in 2021 – in our previous two reports. We will provide an update of those views as soon as we get clarity on the election result. This week, we discuss a new concern for jittery markets - the explosion of new COVID-19 cases in Europe that has already led to governments imposing aggressive lockdown measures. The timing of the new viral surge could not be worse for the euro area economy, which had recovered smartly from the massive lockdown-related demand shock this past spring. Real GDP for the entire euro area exploded higher at a 12.7% rate in Q3/2020, a big rebound from the 11.8% drop in Q2. Yet the second wave of coronavirus is starting to weigh on the more domestically focused service sectors most vulnerable to lockdowns and declining consumer confidence (Chart of the Week). From the perspective of European fixed income strategy, the imposition of lockdowns will only force the ECB to turn more dovish at a time when Europe is already in deflation, as was strongly signaled at last week’s ECB policy meeting. This will support the performance of euro area government bond markets, both in absolute terms and especially versus US Treasuries where yields are drifting higher and should continue to do so after the US election. Another Deflationary Shock To Europe From The Virus The surge in COVID-19 cases has hit the euro area hard and fast. France has seen the most stunning increase, with a population-adjusted daily increase of 596 new cases per million, a nearly six-fold increase in just two months (Chart 2). Importantly, this second wave has so far been nowhere near as lethal as the first wave. The “case fatality ratio” – confirmed deaths as a percentage of confirmed cases – is down in the low single digits for the largest euro area countries (bottom panel). The imposition of lockdowns will only force the ECB to turn more dovish at a time when Europe is already in deflation, as was strongly signaled at last week’s ECB policy meeting. Even with this second wave being less deadly, governments are taking no chances. France and Germany announced national lockdowns last week for at least the month of November, and Italy and Spain have put new restrictions on activity as well. The new lockdowns are already denting consumer confidence across the euro area and this trend will continue as people choose to spend less time outside of their homes to avoid infection. If the case numbers do not begin to stabilize and the lockdown measures extend into December or beyond, governments will likely be forced to consider new fiscal stimulus measures. According to the latest IMF Fiscal Monitor, the largest euro area economies are projected to have a negative “fiscal thrust” – the change in the cyclically-adjusted primary budget balance as a share of potential GDP – in 2021 of at least -3% of GDP (Chart 3). Chart 22nd Wave Of European Coronavirus Is Far Less Lethal
2nd Wave Of European Coronavirus Is Far Less Lethal
2nd Wave Of European Coronavirus Is Far Less Lethal
Chart 3A Big European Fiscal Drag Coming Next Year
The Implications Of Europe's Second Wave Of Coronavirus
The Implications Of Europe's Second Wave Of Coronavirus
In the case of Italy, the fiscal thrust is expected to be a whopping -6.6% of GDP. The main cause is reduced government spending as the massive temporary stimulus measures to fight the 2020 COVID-19 recessions roll off. Chart 4The ECB Has A Deflation Problem
The ECB Has A Deflation Problem
The ECB Has A Deflation Problem
A fresh set of lockdowns will result in a need for more government support measures for unemployed workers, especially those in service-related industries like hospitality and tourism most exposed to lost business as consumers stay home. This poses a serious problem in countries like Spain and Italy that saw a rise in unemployment during the first lockdown but have seen no reversal since (Chart 4). More elevated unemployment rates suggest a lack of inflationary pressure, a point confirmed by recent inflation data. Overall headline HICP inflation fell to -0.3% in September, while core inflation is now a mere +0.4%. Headline HICP inflation rates are now below 0% in the largest euro area economies (Germany, France, Italy and Spain), while core HICP inflation in Italy fell to -0.3% in September. The collapse in oil prices earlier in 2020 has been the main cause of the negative headline inflation prints in the euro area, but is not the only source of weak inflation. According to a decomposition of inflation presented in the Bank of Italy’s October 2020 Economic Bulletin, a falling contribution from services inflation was responsible for about one-third of the entire decline in euro area headline HICP inflation since January (Chart 5). This comes from the part of the euro area economy most exposed to COVID-19 restrictions, highlighting the deflationary risk of the second wave. Chart 5Euro Area Deflation Is Mostly, But Not Only, Driven By Oil
The Implications Of Europe's Second Wave Of Coronavirus
The Implications Of Europe's Second Wave Of Coronavirus
Simply put, the second wave of COVID-19 could not have come at a worse time. The euro area economy is still dealing with excess capacity and deflation, made worse by previous appreciation of the euro, with a looming fiscal tightening next year. Policymakers need to spring into action to help provide support for the euro area economy during this time, starting with the ECB. The second wave of COVID-19 could not have come at a worse time. The euro area economy is still dealing with excess capacity and deflation, made worse by previous appreciation of the euro, with a looming fiscal tightening next year. Bottom Line: The latest surge in COVID-19 cases in Europe has unnerved investors who now see renewed national lockdowns increasing the risk of a double-dip European recession and continued deflationary pressures. The ECB Will Deliver New Stimulus In December At last week’s policy meeting, ECB President Christine Lagarde announced that the Governing Council would reassess its monetary policy stance at the December meeting, when a new set of economic projections would be presented that factored in the negative impact of the second COVID-19 wave. Lagarde was very candid about the expected outcome of that next meeting, when she stated that the ECB would “recalibrate its instruments” based on the new economic forecasts. Chart 6European Banks Are Tigthening Lending Standards
European Banks Are Tigthening Lending Standards
European Banks Are Tigthening Lending Standards
In our view, the ECB’s next policy options can only realistically focus on three options: Cutting policy rates deeper into negative territory Increasing the size, or altering the composition of its bond-buying programs Altering the terms of its current Targeted Long-Term Refinancing Operations (TLTROs) We view a rate cut as a low probability outcome. Not only are policy rates at or below 0%, but it is not clear that a cut would even help boost the demand or supply of new loans. According to the ECB’s latest Bank Lending Survey, euro area banks tightened credit conditions in Q3/2020 (Chart 6). Worsening perceptions of risk and a deteriorating economic outlook were cited as the main reasons for tightening lending standards. The tightening was most severe in Spain, but Italy also saw a big swing away from the easing standards seen in the Q2/2020 survey. Within the details of the Q3/2020 survey, the demand for loans from companies was expected to improve in Q4/2020. The demand for housing and consumer credit increased due to favorable borrowing conditions and a softening in negative contribution from consumer sentiment. Not only are policy rates at or below 0%, but it is not clear that a cut would even help boost the demand or supply of new loans. The ECB’s bond buying programs – the Asset Purchase Program (APP) and the Pandemic Emergency Purchase Program (PEPP) – were deemed to have a positive impact on bank liquidity and financing but a negative impact on profitability. Chart 7Low Interest Rates Are Crushing European Bank Stocks
Low Interest Rates Are Crushing European Bank Stocks
Low Interest Rates Are Crushing European Bank Stocks
Therein lies the problem of the ECB’s negative interest rate policy and large-scale bond buying – it has lowered borrowing costs for euro area governments, consumers and businesses, but has crushed the profits of Europe’s banks. That can be seen when looking at the ongoing miserable performance of euro area bank stocks, which continue to plumb new lows. The relative performance of euro area banks versus the broad equity market benchmark index tracks the slope of government bond yield curves quite closely in the major euro area economies (Chart 7), highlighting the link between the level of euro area interest rates and bank profits. In Chart 8A, we show the Tier 1 capital ratio, as well as the non-performing loan (NPL) ratio for the five largest banks in Germany, France, Italy, Spain and the Netherlands. The message from the chart is clear – European banks remain well capitalized, with double-digit Tier 1 capital ratios well in excess of regulatory minimums, and have a relatively low share of assets that are non-performing. This is especially true in Italy, where the NPL ratio has collapsed from a high of 20% to 7% over the past five years. In Chart 8B, we present the return on equity and return on asset ratios for the same banks presented in the previous chart. Most large euro area banks suffer from a very low return on assets, not materially above 0%, reflecting the non-existent interest rates banks earn on their government bond holdings as well as the low rates on their loan books. Chart 8AEuropean Banks: The Good News
European Banks: The Good News
European Banks: The Good News
Chart 8BEuropean Banks: The Bad News
European Banks: The Bad News
European Banks: The Bad News
So given the fragile state of euro area bank health, and with banks already tightening lending standards in anticipation of slower economic activity because of second wave lockdowns, we can rule out a policy interest rate cut as an option to ease policy in December. This leaves only two other easing options, both associated with an expansion of the ECB’s balance sheet – more asset purchases of sovereign bonds and encouraging bank lending through cheap funding via TLTROs (Chart 9). The impact of either policy in offsetting slowing growth is debatable. Government bond yields are already miniscule, if not outright negative, across the euro area and do not represent a hindrance to increased government spending. The ECB can tweak some of the terms of the existing TLTRO programs, like maturity or the price of funding, but that may not encourage new lending if both borrowers and lenders fear a double-dip recession because of the second wave. The pressure is on the ECB to do something to stem the decline in euro area inflation. Nonetheless, the pressure is on the ECB to do something to stem the decline in euro area inflation. While real interest rates are still negative, they are increasingly becoming less so as inflation expectations continue to drift lower. The 5-year/5-year forward EUR CPI swap rate is now down to 1.1%, and was last trading near the ECB’s inflation target of just under 2% in 2013-14 (Chart 10). Unsurprisingly, the rising real rate backdrop has helped boost the value of the euro, especially versus the US dollar, which has suffered under the weight of falling real US interest rates this year. Chart 9The ECB Can Only Expand Its Balance Sheet
The ECB Can Only Expand Its Balance Sheet
The ECB Can Only Expand Its Balance Sheet
In the end, greater fiscal stimulus will be the only option available to get Europe through the second wave. All the ECB can do is provide a backdrop of loose monetary policy that supports easy financial conditions, so that any stimulus will have the maximum effect on growth. Chart 10Deflation Is Pushing Up Real Rates In Europe
Deflation Is Pushing Up Real Rates In Europe
Deflation Is Pushing Up Real Rates In Europe
Bottom Line: The signals from last week’s ECB policy meeting could not be more clear – the central bank will deliver new stimulus measures in December in response to the second wave of coronavirus sweeping through the euro area. This will be a combination of policies focused on expanding and extending the existing bond-buying vehicles and TLTROs, rather than cutting policy rates deeper into negative territory. Stay Overweight European Government Bonds, But Stay Cautious On Euro Area Credit With the ECB set to deliver some form of easing in December, core European bond yields are likely to remain stable over at least the next six months. The ECB has shown no reservations about expanding its balance sheet via bond purchases when needed. A surge of buying similar in size to that of the first COVID-19 wave is not out of the question if Europe faces a double-dip second wave recession (Chart 11). Chart 11Stay Overweight Core European Government Bonds
Stay Overweight Core European Government Bonds
Stay Overweight Core European Government Bonds
Chart 12Italian BTPs Are Preferable To Euro Area Corporate Credit
Italian BTPs Are Preferable To Euro Area Corporate Credit
Italian BTPs Are Preferable To Euro Area Corporate Credit
In an environment where we see US Treasury yields having more upside on the back of post-election fiscal stimulus, this makes the likes of German bunds and French OATs good “defensive” lower-beta plays to replace high-beta US Treasury exposure in global USD-hedged bond portfolios. We also like core Europe as a pure spread trade versus Treasuries, as we see scope for the UST-Bund spread to widen further – a tactical trade we initiated last week (see our Tactical Overlay table on page 15). We continue to recommend overweighting Italian government bonds as the preferred way to add scarce yield to a European bond portfolio with an asset that will directly benefit from more ECB buying. We continue to recommend overweighting Italian government bonds as the preferred way to add scarce yield to a European bond portfolio with an asset that will directly benefit from more ECB buying (Chart 12). The ECB has already been purchasing a greater share of Italy in the PEPP, allowing significant deviations from the Capital Key weights that limit purchases in the older APP. ECB President Lagarde noted last week that those deviations will continue over the life of the PEPP, which should help support further declines in Italian bond yields over at least the next six months. We are maintaining a relatively cautious stance on European credit, however, even with the ECB likely to make a move in December. The renewed recession risk from the second wave comes at a time when low yields and spreads for euro area corporate bonds offer poor protection from future credit downgrades and defaults. We continue to prefer owning US corporate credit, both investment grade and high-yield, versus US equivalents in USD-hedged bond portfolios. Robert Robis, CFA Chief Fixed Income Strategist rrobis@bcaresearch.com Recommendations The GFIS Recommended Portfolio Vs. The Custom Benchmark Index
The Implications Of Europe's Second Wave Of Coronavirus
The Implications Of Europe's Second Wave Of Coronavirus
Duration Regional Allocation Spread Product Tactical Trades Yields & Returns Global Bond Yields Historical Returns
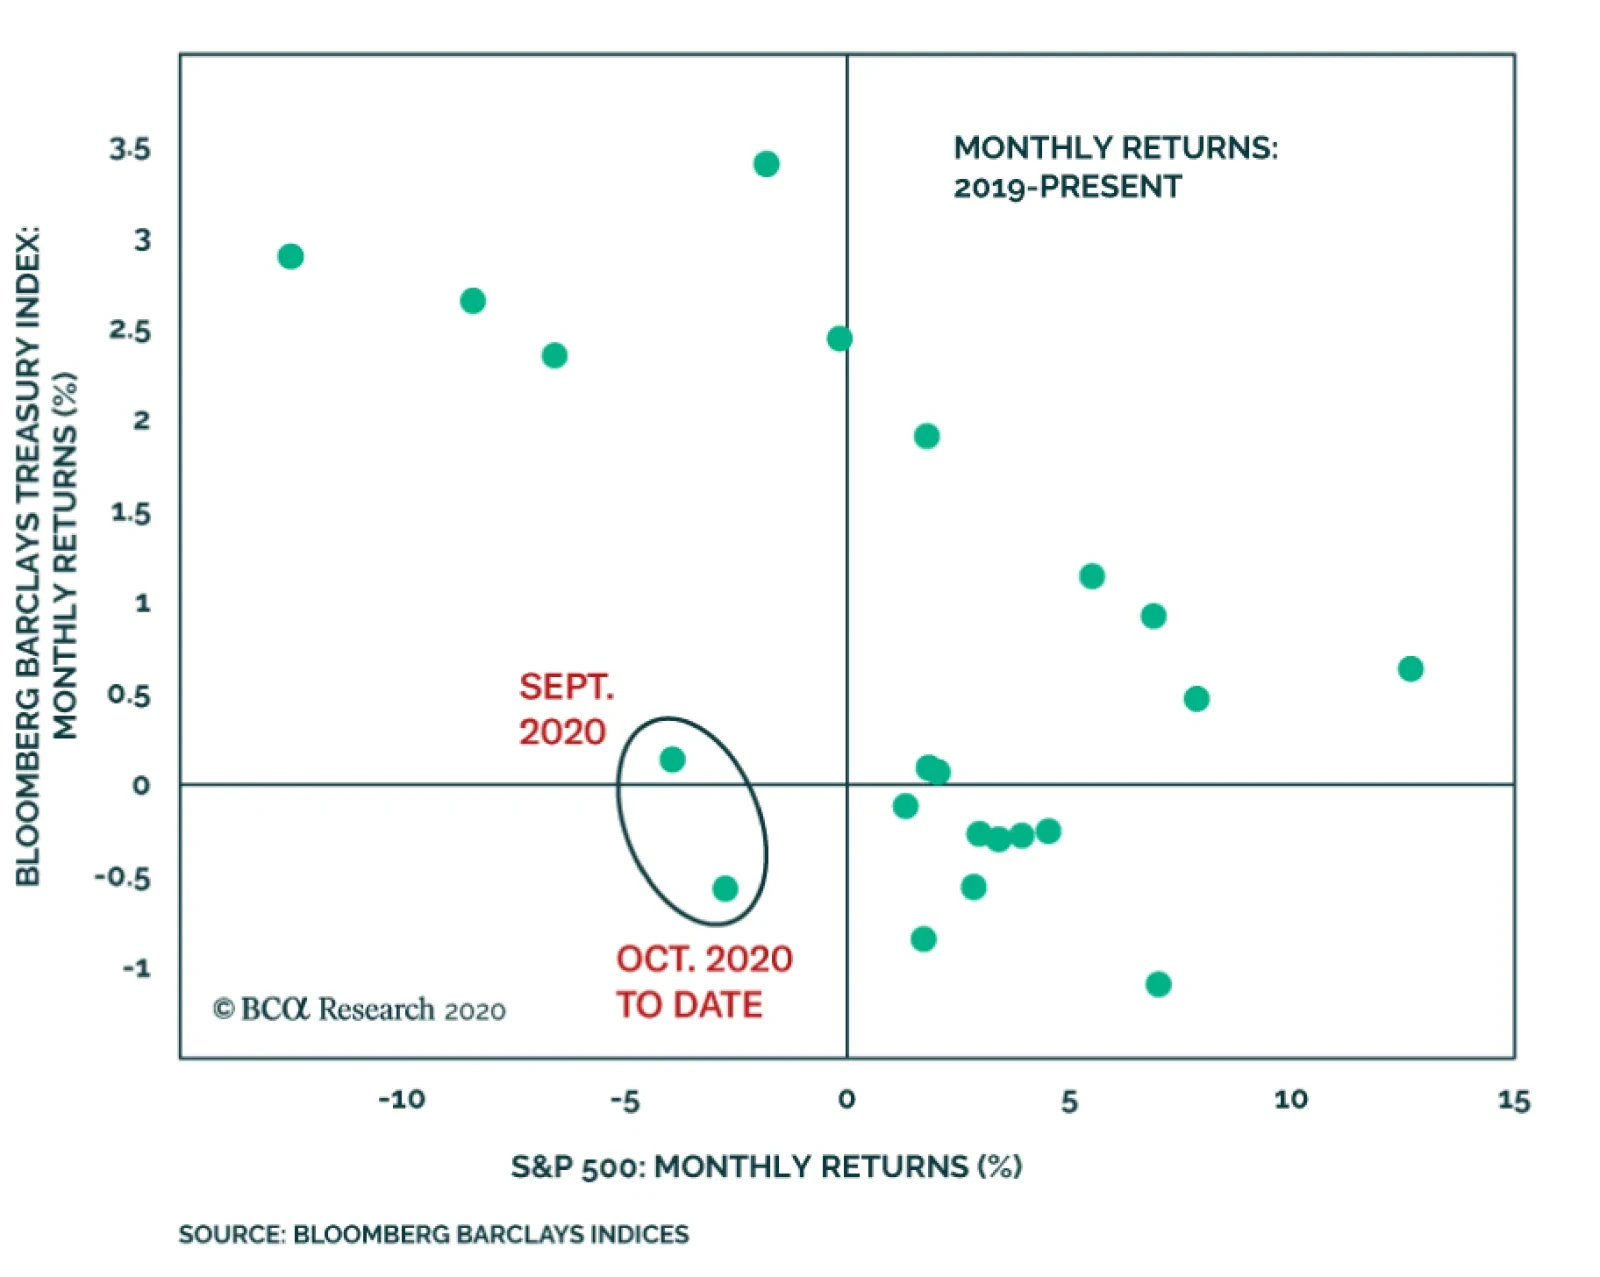
The S&P 500 fell 3.5% on Wednesday, the largest daily decline since June. Yet, the benchmark 10-year Treasury yield didn’t budge. If this was only a 1-day occurrence, it could be written off as a fluke. But in fact, the data show that investors hoping to…
Highlights Global risk assets have more downside in the near term. The US dollar is primed to rebound. Without major fiscal stimulus in the US, the upside in the greenback will be substantial. China’s business cycle recovery will continue but Chinese stocks and China-related plays are over-hyped and will experience a setback. For equity and credit investors, we recommend maintaining a neutral allocation to EM versus their DM counterparts. Feature Global risk assets have been in a twilight zone. On the one hand, there has been enormous uncertainty related to the US elections, the US fiscal stimulus and the impact of renewed social mobility restrictions on economic activity, especially in Europe. On the other hand, ultra-accommodative central banks, zero or negative interest rates on risk-free investments and the possibility of positive news on the COVID-19 vaccine front have until recently precluded a carnage in global risk assets. What will be the path going forward? We believe the risk-off period in global markets will continue in the near run, i.e., there will be a dusk before a sunrise. Hence, investors should maintain dry powder at the moment. Several negative outcomes have a non-trivial probability of occurring over the very near term. Chiefly these include a contested US presidential election or a Republican Senate under a Biden presidency acting as a constraint on large fiscal stimulus. Chart I-1The US Needs $1.5tn (7.4% Of GDP) Of Fiscal Stimulus In 2021 To Have A Neutral Fiscal Thrust
The US Needs $1.5bn (7.4% Of GDP) Of Fiscal Stimulus In 2021 To Have A Neutral Fiscal Thrust
The US Needs $1.5bn (7.4% Of GDP) Of Fiscal Stimulus In 2021 To Have A Neutral Fiscal Thrust
Needless to say, without a large fiscal stimulus package, the US is facing a fiscal cliff. According to the US Congressional Budget Office, the fiscal thrust will be negative 7.4% of GDP in 2021 if no further stimulus is enacted (Chart I-1). The fiscal thrust is the change in the cyclically-adjusted budget deficit. Even if the cyclically-adjusted budget deficit as a share of GDP remains the same, fiscal thrust will be zero. Hence, to achieve a positive fiscal thrust in the US, the fiscal stimulus must be greater than 7.4% of GDP or above $1.5 trillion. Even though Congress eventually approves a large fiscal package, there is a risk that the economy will slip in the interim. To emphasize, we do not mean there will be no fiscal stimulus. The point is that a large fiscal package is possible only if markets riot. With equity and credit markets still richly priced relative to their fundamentals, the carnage in global risk assets will likely continue. With equity and credit markets still richly priced relative to their fundamentals, the carnage in global risk assets will likely continue. Chart I-2The US: Lower Inflation Expectations, Higher Real Rates And A Stronger Dollar
The US: Lower Inflation Expectations, Higher Real Rates And A Stronger Dollar
The US: Lower Inflation Expectations, Higher Real Rates And A Stronger Dollar
In the absence of a large US fiscal package and amid falling oil prices, US break-even inflation expectations will drop and the TIPS (real) yields will bounce in the near term (Chart I-2). A rebound in TIPS (real) yields will induce a bounce in the US dollar (Chart I-2, bottom panel). Provided that the primary risks presently stem from DM rather than Chinese growth, we recommend maintaining a neutral allocation to EM within respective global equity and credit portfolios. Why not overweight EM versus DM? First, the rebound in the greenback will weigh on EM financial markets. Second, outside China, Korea and Taiwan, EM fundamentals are poor. Net-net, odds of EM out- and under-performance versus DM are, for now, balanced. China: Peak Stimulus, Equities And Commodities China’s business cycle recovery is intact. However, Chinese equities have become fully priced and are at risk of a setback (in absolute terms) along with global share prices. Notably, there are several elements that could trigger a meaningful setback in Chinese stocks. First, the money and credit impulses are about to peak. The top panel of Chart I-3 shows that changes in commercial banks’ excess reserves ratio lead the credit impulse by about six months. The drop in the excess reserves ratio since May foreshadows the top in the private credit impulse. Interbank rates – shown inverted in the bottom panel of Chart I-3 – point to an apex in the narrow money (M1) impulse. Authorities have been shrinking commercial banks’ excess reserves at the PBoC since May/June. Tightening liquidity conditions in the banking system have led to higher interbank rates as well as government and corporate bond yields. Higher borrowing costs will weigh on money and credit growth. Second, the loan approval index of the PBoC banking survey has rolled over (Chart I-4). This implies that bank loan origination will subside going forward. Chart I-3China: Money/Credit Impulses Are At An Apex
China: Money/Credit Impulses Are At An Apex
China: Money/Credit Impulses Are At An Apex
Chart I-4China: Loan Growth To Moderate
China: Loan Growth To Moderate
China: Loan Growth To Moderate
Finally, fiscal stimulus is also peaking. Chart I-5 shows that the issuance of local government bonds is set to dwindle in the coming months. A peak in stimulus does not herald an immediate end of the recovery in the business cycle. China’s combined credit and fiscal spending impulse leads the business cycle by about nine months (Chart I-6). Therefore, even as the credit and fiscal spending impulse reaches an apex, the Chinese mainland’s economic activity will stay firm in H1 2021. Consequently, corporate profits will continue to recover. Chart I-5China: Fiscal Stimulus Is Peaking
China: Fiscal Stimulus Is Peaking
China: Fiscal Stimulus Is Peaking
Chart I-6China: The Economy Will Continue Recovering
China: The Economy Will Continue Recovering
China: The Economy Will Continue Recovering
What do all these imply for share prices? In periods when borrowing costs rise along with accelerating profit growth/improving net EPS revisions, share prices could still advance (Chart I-7). Hence, peak stimulus is not a sufficient reason to turn negative on share prices. Chart I-7China: Share Prices (ex-TMT), EPS Expectations And Corporate Bond Yields
China: Share Prices (ex-TMT), EPS Expectations And Corporate Bond Yields
China: Share Prices (ex-TMT), EPS Expectations And Corporate Bond Yields
That said, there are some signs that the Chinese equity market is overbought and over-hyped, making it vulnerable: A major IPO often marks a top in an asset class. Chart I-8 illustrates that Goldman Sachs’ IPO in 1999 preceded the secular top in US equities, IPOs of KKR and Blackstone in 2007 took place before the US credit bubble and the LBO boom unraveled; and finally, Glencore, the largest commodity trading house, went public in 2011 at the very peak of the secular bull market in commodities. In this respect, will Ant Group’s upcoming IPO mark a major top in Chinese or new economy stocks? Time will tell. Chart I-9 illustrates that Chinese IPO booms were historically associated with equity market tops. The current surge in Chinese IPOs – in various jurisdictions including China, Hong Kong, and the US – is a symptom of an over-hyped market. Chart I-8A Major IPO Often Marks The Top in Respective Asset Classes
A Major IPO Often Marks The Top in Respective Asset Classes
A Major IPO Often Marks The Top in Respective Asset Classes
Chart I-9China: Booming IPOs = An Equity Market Top?
China: Booming IPOs = An Equity Market Top?
China: Booming IPOs = An Equity Market Top?
Finally, new economy stocks in both the US and China have risen by about 20-fold since January 2010. Both in terms of duration and magnitude, their rallies are identical to the bull market in the Nasdaq 100 index in the 1990s (Chart I-10). The striking similarity with those episodes as well as current euphoria among investors about FAANG and Chinese new economy stocks warrant caution. In regard to commodities, in recent months we have been arguing that China is entering a commodity destocking cycle following the major restocking cycle that occurred in April-August. As Chinese imports of key commodities temporarily diminish due to destocking, commodities prices will relapse. Importantly, investor sentiment and net long positions in some key commodities are very elevated, suggesting overbought conditions (Chart I-11). Chart I-10FAANG And Tencent Have Been Tracking The Trajectory Of Nasdaq 100 In The 1990s
FAANG And Tencent Have Been Tracking The Trajectory Of Nasdaq 100 In The 1990s
FAANG And Tencent Have Been Tracking The Trajectory Of Nasdaq 100 In The 1990s
Chart I-11Investors Are Very Bullish On Copper
Investors Are Very Bullish On Copper
Investors Are Very Bullish On Copper
Critically, global mining stocks have been dropping since early September and are signaling a relapse in industrial metals prices (Chart I-12). In brief, commodity prices and commodity plays remain vulnerable. Chart I-12Global Mining Stocks Point To A Relapse In Industrial Commodities Prices
Global Mining Stocks Point To A Relapse In Industrial Commodities Prices
Global Mining Stocks Point To A Relapse In Industrial Commodities Prices
Bottom Line: Marrying the positive outlook for China’s business cycle on the one hand with an impending potential correction in global stocks, the peak in Chinese stimulus and signs of Chinese equity investor euphoria, we conclude that the risk-reward profiles of Chinese stocks and China-related plays in absolute terms are unattractive. That said, we continue recommending overweighting Chinese stocks within an EM equity portfolio. From a cyclical perspective, Chinese corporate profits will outperform EM and DM corporate earnings because China has dealt with the pandemic much better than almost all other countries. An Update On Currencies And Local Fixed-Income We have been shorting a basket of EM currencies – BRL, CLP, ZAR, TRY, KRW and IDR – against an equally-weighted basket of the euro, CHF and JPY. This strategy remains intact. However, we believe the US dollar is primed to stage a major rebound, in general, and versus EM currencies, in particular. Therefore, US dollar-based investors should hedge their currency risk or short the same EM currency basket versus the greenback. In EM local fixed-income markets, we have been receiving 10-year swap rates but have not recommended owning cash domestic bonds because of currency risk. We continue to recommend investors receive 10-year swap rates in the following markets: Mexico, Colombia, Russia, China, India and Korea. We have also been recommending long positions in domestic bonds in certain frontier markets like Egypt, Ukraine, and Pakistan. The global risk-off phase will cause their currencies to relapse versus the US dollar, raising the possibility that local bond yields will rise. Therefore, investors who are long these markets should close these positions. Arthur Budaghyan Chief Emerging Markets Strategist arthurb@bcaresearch.com Equities Recommendations Currencies, Credit And Fixed-Income Recommendations
Your feedback is important to us. Please take our client survey today. Highlights US Election & Duration: We estimate that there is an 80% probability of a US election result that will give a lift to US Treasury yields via increased fiscal stimulus. Those are strong enough odds to justify a move to a below-benchmark cyclical US duration stance on a 6-12 month horizon. US Treasuries: We anticipate a moderate bear market in US Treasuries to unfold during the next 6-12 months. In addition to below-benchmark portfolio duration, investors should overweight TIPS versus nominal Treasuries, hold nominal and real yield curve steepeners, and hold inflation curve flatteners. Non-US Country Allocation: Within global government bond portfolios, downgrade the US to underweight. Favor countries that have lower sensitivity to rising US Treasury yields with central banks that are likely to be more dovish than the Fed in the next few years. That means increasing allocations to core Europe and Japan, while reducing exposure to Canada and Australia. Stay neutral on the UK given the near-term uncertainties over the final Brexit outcome. Feature With the US presidential election just two weeks away, public opinion polls continue to show that Joe Biden is the favorite to win the White House. However, the odds of a “Blue Sweep” - combining a Biden victory with the Democratic Party winning control of both the US Senate and House of Representatives - have increased since the end of September according to online prediction markets. US Treasury yields have also moved higher over that same period (Chart II-1), which we interpret as the bond market becoming more sensitive to the likelihood of a major increase in US government spending under single-party Democratic control. Chart II-1A Blue Sweep Is Bond Bearish
A Blue Sweep Is Bond Bearish
A Blue Sweep Is Bond Bearish
Table II-1A Comparison Of The Candidates' Budget Proposals
November 2020
November 2020
According to a recent analysis done by the Committee for a Responsible Federal Budget, President Trump’s formal policy proposals would increase US federal debt by $4.95 trillion between 2021 and 2030, while Biden’s plan would increase the debt by $5.60 trillion (Table II-1).1 While those are both massive fiscal stimulus plans, there is a stark difference in the policy mix of their proposals that matters for the future path of US bond yields. Under Biden, spending is projected to increase by a cumulative $11.1 trillion, partially offset by $5.8 trillion in revenue increases and savings with the former vice-president calling for tax hikes on corporations and high-income earners. On the other hand, Trump’s plan includes $5.45 trillion of spending increases and tax cuts over the next decade, offset by $0.75 trillion in savings. Conclusion: Biden would increase spending by over twice that of a re-elected Trump, with much of that spending expected to be front-loaded in the early part of his first term. Outright spending is more reflationary than tax cuts because it puts more money in the pockets of consumers (spenders) relative to producers (savers). The Biden plan would be more stimulating for overall activity even if the increase in debt is about the same. Chart II-2The Biden Platform Is Highly Stimulative
The Biden Platform Is Highly Stimulative
The Biden Platform Is Highly Stimulative
Another analysis of the Biden and Trump platforms was conducted by Moody’s in September, based on estimates of how much of each candidate’s promises could be successfully implemented under different combinations of White House and Congressional control.2 The stimulus figures were run through the Moody’s US economic model, which is similar to the budget scoring model of the US Congressional Budget Office, to produce a year-by-year path for the US economy over the next decade (Chart II-2). Moody’s concluded that the US economy would return to full employment in the second half of 2022 under a President Biden – especially if the Democrats win the Senate - compared to the first half of 2024 under a re-elected President Trump. Such a rapid closing of the deep US output gap that opened up because of the COVID-19 recession would likely trigger a reassessment of the Fed’s current highly dovish policy stance. At the moment, the US overnight index swap (OIS) curve discounts one full 25bp Fed hike by late 2023/early 2024, and two full hikes by late 2024/early 2025 (Chart II-3). This pricing of the future path of interest rates has occurred even with the Fed promising to keep the funds rate anchored near 0% until at least the end of 2023. The likelihood of some form of increased fiscal spending after the election will cause the bond market to challenge the Fed’s current forward guidance even more, putting upward pressure on Treasury yields. Chart II-3US Fiscal Stimulus Will Pull Forward Fed Liftoff
US Fiscal Stimulus Will Pull Forward Fed Liftoff
US Fiscal Stimulus Will Pull Forward Fed Liftoff
Our colleagues at BCA Geopolitical Strategy see a Blue Sweep as the most likely outcome of the US election, although their forecasting models suggest that the race for control of the Senate will be much closer than the Biden vs Trump battle (there is little chance that control of the House of Representatives would switch back to the Republicans).3 Their scenarios for each of the White House/Senate combinations, along with their own estimated probability for each, are the following: Biden wins in a Democratic sweep: BCA probability = 27%. The US economy will benefit from higher odds of unfettered fiscal stimulus in 2021, although financial markets will simultaneously have to adjust for the negative shock to US corporate earnings from higher taxes and regulation. Government bond yields should rise on the generally reflationary agenda. Trump wins with a Republican Senate: BCA probability = 23%. In this status quo scenario, a re-elected President Trump would still face opposition from House Democrats on most domestic economic issues, forcing him to tilt towards more protectionist foreign and trade policies in his second term. Fiscal stimulus would be easy to agree, though not as large as under a Democratic sweep. US Treasury yields would rise, but would later prove volatile due to the risk to the cyclical recovery from a global trade war, as Trump’s tariffs will not be limited to China and could even affect the European Union. Biden wins with the Senate staying Republican: BCA probability = 28%. This is ultimately the most positive outcome for financial markets - reduced odds of a full-blown trade war with China, combined with no new tax hikes. Bond yields would drift upward over time, but not during the occasional fiscal battles that would ensue between the Democratic president and Republican senators. The first such battle would start right after the election. Treasuries would remain well bid until financial market pressures forced a Senate compromise with the new president sometime in H1 2021. Trump wins with a Democratic Senate: BCA probability = 22%. This is the least likely scenario but one that could produce a big positive fiscal impulse. Trump is a big spender and will veto tax hikes, but will approve populist spending on areas where he agrees. The Democratic Senate would not resist Trump’s tough stance on China, however, thus keeping the risk of US-China trade skirmishes elevated. This is neutral-to-bearish for US Treasuries, depending on the size of any bipartisan stimulus measures and Trump’s trade actions. The key takeaway is that the combined probability of scenarios that will put upward pressure on US Treasury yields is 72%, versus a 28% probability of a more bond-neutral outcome. That is a bond-bearish skew worth positioning for by reducing US duration exposure now, ahead of the November 3 election. Of this 72%, 45 percentage points come from scenarios in which President Trump would remain in power. Hence his trade wars would eventually undercut his reflationary fiscal policy. This would become the key risk to the short duration view after the initial market response. Bottom Line: The most likely scenarios for the US election will give a cyclical lift to US Treasury yields via increased fiscal stimulus. This justifies a move to a below-benchmark US duration stance on a 6-12 month horizon. If Trump is re-elected, the timing of Trump’s likely return to using broad-based tariffs will have to be monitored closely. A Moderate Bear Market While our anticipated Blue Sweep election outcome will lead to a large amount of fiscal spending in 2021 and beyond, we anticipate only a modest increase in bond yields during the next 6-12 months. In terms of strategy, our recommended reduction in portfolio duration reflects the fact that fiscal largesse meaningfully reduces the risk of another significant downleg in bond yields and strengthens our conviction in a moderate bear market scenario for bonds. This does raise the question of how large an increase in US Treasury yields we expect during the next 6-12 months. We turn to this question now. Chart II-4Less Election-Day Upside Than In 2016
Less Election-Day Upside Than In 2016
Less Election-Day Upside Than In 2016
Not Like 2016 First, we do not expect a massive election night bond rout like we saw in 2016 (Chart II-4). For one thing, the Fed was much more eager to tighten policy in 2016 than it is today, and it did deliver a rate hike one month after the Republicans won the House, Senate and White House (Chart II-4, bottom panel). This time around, the Fed has made it clear that it will wait until inflation is running above its 2% target before lifting rates off the zero bound and will not respond directly to expectations for greater fiscal stimulus. Second, 2016’s election result was mostly unanticipated. This led to a dramatic adjustment in market prices once the results came in. The PredictIt betting market odds of a “Red Sweep” by the Republicans in 2016 were only 16% the night before the election. As of today, the betting markets are priced for a 58% chance of a Blue Sweep in 2020. Unlike in 2016, bonds are presumably already partially priced for the most bond-bearish election outcome. A Slow Return To Equilibrium To more directly answer the question of how high bond yields can rise, survey estimates of the long-run (or equilibrium) federal funds rate provide a useful starting point. In a world where the economy is growing at an above-trend pace and inflation is expected to move towards the Fed’s target, it is logical for long-maturity Treasury yields to settle near estimates of the long-run fed funds rate. Indeed, this theory is borne out empirically. During the last two periods of robust global economic growth (2017/18 & 2013/14), the 5-year/5-year forward Treasury yield peaked around levels consistent with long-run fed funds rate estimates (Chart II-5). As of today, the median estimates of the long-run fed funds rate from the New York Fed’s Survey of Market Participants and Survey of Primary Dealers are 2% and 2.25%, respectively. In other words, a complete re-convergence to these equilibrium levels would impart 80 – 100 bps of upward pressure to the 5-year/5-year forward Treasury yield. We expect this re-convergence to play out eventually, but probably not within the next 6-12 months. In both prior periods when the 5-year/5-year forward Treasury yield reached these equilibrium levels, the Fed’s reaction function was much more hawkish. The Fed was hiking rates throughout 2017 & 2018 (Chart II-5, panel 4), and the market moved quickly to price in rate hikes in 2013 (Chart II-5, bottom panel). The Fed’s new dovish messaging will ensure that the market reacts less quickly this time around. Also, continued curve steepening will mean that the 5-year/5-year forward yield’s 80 – 100 bps of upside will translate into significantly less upside for the benchmark 10-year yield. The 10-year yield and 5-year/5-year forward yield peaked at similar levels in 2017/18 when the Fed was lifting rates and the yield curve was flat (Chart II-6). But, the 10-year peaked far below the 5-year/5-year yield in 2013/14 when the Fed stayed on hold and the curve steepened. Chart II-5How High For Treasury Yields?
How High For Treasury Yields?
How High For Treasury Yields?
Chart II-6Less Upside In 10yr Than In 5y5y
Less Upside In 10yr Than In 5y5y
Less Upside In 10yr Than In 5y5y
The next bear move in bonds will look much more like 2013/14. The Fed will keep a firm grip over the front-end of the curve, leading to curve steepening and less upside in the 10-year Treasury yield than in the 5-year/5-year forward. In addition to shifting to a below-benchmark duration stance, investors should maintain exposure to nominal yield curve steepeners. Specifically, we recommend buying the 5-year note versus a duration-matched barbell consisting of the 2-year and 10-year notes (Chart II-6, bottom panel).4 TIPS Versus Nominals We have seen that a full re-convergence to “equilibrium” implies 80 – 100 bps of upside in the 5-year/5-year forward nominal Treasury yield. Bringing TIPS into the equation, we have also observed that long-maturity (5-year/5-year forward and 10-year) TIPS breakeven inflation rates tend to settle into a range of 2.3 – 2.5 percent when inflation is well-anchored and close to the Fed’s target (Chart II-7). The additional fiscal stimulus that will follow a Blue Sweep election makes it much more likely that the economic recovery will stay on course, leading to an eventual return of inflation to target and of long-maturity TIPS breakeven inflation rates to a 2.3 – 2.5 percent range. However, as with nominal yields, this re-convergence will be a long process whose pace will be dictated by the actual inflation data. To underscore that point, consider that our Adaptive Expectations Model of the 10-year TIPS breakeven inflation rate – a model that is driven by trends in the actual inflation data – has the 10-year breakeven rate as close to fair value (Chart II-8).5 This fair value will rise only slowly over time, alongside increases in actual inflation. Chart II-7Overweight TIPS Versus Nominals
Overweight TIPS Versus Nominals
Overweight TIPS Versus Nominals
Chart II-8Real Yields Have Likely Bottomed
Real Yields Have Likely Bottomed
Real Yields Have Likely Bottomed
All in all, we continue to recommend an overweight allocation to TIPS versus nominal Treasuries. TIPS breakeven inflation rates will move higher during the next 6-12 months, but are unlikely to reach our 2.3 – 2.5 percent target range within that timeframe. TIPS In Absolute Terms As stated above, we expect nominal yields to increase more than real yields during the next 6-12 months, but what about the absolute direction of real (aka TIPS) yields? Here, our sense is that real yields have also bottomed. If we consider the extreme scenario where the 5-year/5-year forward nominal yield returns to its equilibrium level and where long-maturity TIPS breakeven inflation rates return to our target range, it implies about 80 bps of upside in the nominal yield and 40 bps of upside in the breakeven. This means that the 5-year/5-year real yield has about 40 bps of upside in a complete “return to equilibrium” scenario. While we don’t expect this “return to equilibrium” to be completed within the next 6-12 months, the process is probably underway. The only way for real yields to keep falling in this reflationary world is for the Fed to become increasingly dovish, even as growth improves and inflation rises. After its recent shift to an average inflation target, our best guess is that Fed rate guidance won’t get any more dovish from here. Real yields fell sharply this year as the market priced in this change in the Fed’s reaction function, but the late-August announcement of the Fed’s new framework will probably mark the bottom in real yields (Chart II-8, bottom panel).6 Chart II-9Own Inflation Curve Flatteners And Real Curve Steepeners
Own Inflation Curve Flatteners And Real Curve Steepeners
Own Inflation Curve Flatteners And Real Curve Steepeners
Two More Curve Trades In addition to moving to below-benchmark duration, maintaining nominal yield curve steepeners and staying overweight TIPS versus nominal Treasuries, there are two additional trades that investors should consider in order to profit from the reflationary economic environment. The first is inflation curve flatteners. The cost of short-maturity inflation protection is below the cost of long-maturity inflation protection, meaning that it has further to run as inflation returns to the Fed’s target (Chart II-9). In addition, if the Fed eventually succeeds in achieving a temporary overshoot of its inflation target, then we should expect the inflation curve to invert. Real yield curve steepeners are in some ways the mirror image of inflation curve flatteners. Assuming no change in nominal yields, the real yield curve will steepen as the inflation curve flattens. But what makes real yield curve steepeners look even more attractive is that increases in nominal yields during the next 6-12 months will be concentrated in long-maturities. This will impart even more steepening pressure to the real yield curve. Investors should continue to hold inflation curve flatteners and real yield curve steepeners. Bottom Line: We anticipate a moderate bear market in US Treasuries to unfold during the next 6-12 months. In addition to below-benchmark portfolio duration, investors should overweight TIPS versus nominal Treasuries, hold nominal and real yield curve steepeners, and hold inflation curve flatteners. Non-US Government Bonds: Reduce Exposure To US Treasuries The mildly bearish case for US Treasuries that we have laid out above not only matters for our recommended duration stance, but also for our suggested country allocation within global government bond portfolios. Simply put, the risk of rising bond yields is much higher in the US than elsewhere, both for the immediate post-election period but also over the medium-term. Thus, the immediate obvious portfolio decision is to downgrade US Treasuries to underweight. The move higher in US Treasury yields that we expect is strictly related to spillovers from likely US fiscal stimulus. While other countries in the developed world are contemplating the need for additional fiscal measures, particularly in Europe where there is a renewed surge in coronavirus infections and growing economic restrictions, no country is facing as sharp a policy choice as the US with its upcoming election. We can say with a fair degree of certainty that the US will have a relatively more stimulative fiscal policy stance than other developed economies over at least the next couple of years. This implies a higher relative growth trajectory for the US that hurts Treasuries more on the margin than non-US government debt. In addition, the likely path of relative monetary policy responses are more bearish for US Treasuries. As described above, the scope of the US stimulus will cause bond investors to further question the Fed’s commitment to keeping the funds rate unchanged for the next few years. That also applies to the Fed’s other policy tools, like asset purchases. The Fed is far less likely to continue buying US Treasuries at the same aggressive pace it has for the past eight months if there is less need for monetary stimulus because of more fiscal stimulus. Chart II-10The Fed Will Gladly Trade Less QE For More Fiscal Stimulus
November 2020
November 2020
According to the IMF, the Fed has purchased 57% of all US Treasuries issued since late February of this year, in sharp contrast to the ECB and Bank of Japan that have purchased over 70% of euro area government bonds and JGBs issued (Chart II-10). If US Treasury yields are rising because of improving US growth expectations, fueled by fiscal stimulus, the Fed will likely tolerate such a move and buy an even lower share of Treasuries issued – particularly if the higher bond yields do not cause a selloff in US equity markets that can tighten financial conditions and threaten the growth outlook. The fact that US equities have ignored the rise in Treasury yields seen since the end of September may be a sign that both bond and stock investors are starting to focus on a faster trajectory for US growth. In terms of country allocation, beyond downgrading US Treasuries to underweight, we recommend upgrading exposure to countries that are less sensitive to changes in US Treasury yields (i.e. countries with a lower yield beta to changes in US yields). In Chart II-11, we show the rolling beta of changes in 10-year government bond yields outside the US to changes in 10-year US Treasury yields. This is a variation of the “global yield beta” concept that we have discussed in the BCA Research bond publications in recent years. Here, we modify the idea to look at which countries are more or less correlated to US yields, specifically. A few points stand out from the chart: Chart II-11Reduce Exposure To Bond Markets More Correlated To UST Yields
Reduce Exposure To Bond Markets More Correlated To UST Yields
Reduce Exposure To Bond Markets More Correlated To UST Yields
All countries have a “US yield beta” of less than 1, suggesting that Treasuries are a consistent outperformer when US yields fall and vice versa. This suggests moving to underweight the US when US yields are rising is typically a winning strategy in a portfolio context. The list of higher beta countries includes Canada, Australia, New Zealand, the UK and Germany; although Canada stands out as having the highest yield beta in this group. The list of lower beta countries includes France, Italy, Spain, and Japan. In Chart II-12, we show what we call the “upside yield beta” that is estimated only using data for periods when Treasury yields are rising. This gives a sense of which countries are more likely to outperform or underperform during a period of rising Treasury yields, as we expect to unfold after the election. From this perspective, the “safer” lower US upside yield beta group includes the UK, France, Germany and Japan. The riskier higher US upside yield beta group includes Canada, Australia, New Zealand, Italy and Spain. Chart II-12Favor Bond Markets Less Correlated to RISING UST Yields
Favor Bond Markets Less Correlated to RISING UST Yields
Favor Bond Markets Less Correlated to RISING UST Yields
Spain and Italy are less likely to behave like typical high-beta countries as US yields rise, however, because the ECB is likely to remain an aggressive buyer of their government bonds as part of their asset purchase programs over the next 6-12 months. We also do not recommend trading UK Gilts off their yield beta to US Treasuries in the immediate future, given the uncertainties over the negotiations over a final Brexit deal. Both sets of US yield betas suggest higher-beta Canada, Australia and New Zealand are more at risk of relative underperformance versus lower-beta France, Germany and Japan. In terms of government bond country allocation, we recommend reducing exposure to the former group and increasing allocations to the latter group. Bottom Line: Within global government bond portfolios, downgrade the US to underweight. Favor countries that have lower sensitivity to rising US Treasury yields, especially those with central banks that are likely to be more dovish than the Fed in the next few years. That means increasing allocations to core Europe and Japan, while reducing exposure to “higher-beta” Canada and Australia. Robert Robis, CFA Chief Fixed Income Strategist rrobis@bcaresearch.com Ryan Swift US Bond Strategist rswift@bcaresearch.com Footnotes 1 http://www.crfb.org/papers/cost-trump-and-biden-campaign-plans 2 https://www.moodysanalytics.com/-/media/article/2020/the-macroeconomic-consequences-trump-vs-biden.pdf 3 Please see BCA Research Geopolitical Strategy Special Report, “Introducing Our Quantitative US Senate Election Model”, dated October 16, 2020, available at gps.bcaresearch.com 4 For more details on this recommended steepener trade please see US Bond Strategy Weekly Report, “Positioning For Reflation And Avoiding Deflation”, dated August 11, 2020, available at usbs.bcaresearch.com 5 For more details on our Adaptive Expectations Model please see US Bond Strategy Weekly Report, “How Are Inflation Expectations Adapting?”, dated February 11, 2020, available at usbs.bcaresearch.com 6 For a detailed look at the implications of the Fed’s policy shift please see US Bond Strategy / Global Fixed Income Strategy Special Report, “A New Dawn For US Monetary Policy”, dated September 1, 2020, available at usbs.bcaresearch.com
Your feedback is important to us. Please take our client survey today. Highlights Mounting populism has created a structural tailwind behind inflation. The risk that inflation accelerates quickly is greater than the market appreciates. Monetary dynamics strongly influence consumer prices when inflation is stationary. The Federal Reserve’s back-door monetization of debt is inflationary. Financial assets do not embed a sufficiently large risk premium against higher inflation. The long-term, real returns of equities are likely to be poor. Small cap stocks and commodities offer cheap protection against higher inflation. Feature The equity market is extremely vulnerable to positive inflation surprises. The expectation of an extended period of low interest rates and extraordinarily easy monetary policy is the crucial justification for the S&P 500’s exceptionally elevated multiples. Anything that could threaten this policy set up would create a danger for stocks. Whether the mean of inflation in a given period is stationary will determine the influence that money has on inflation. The problem for the S&P 500 is that investors assign a much-too-small probability to the inflation risk, especially as structural and political forces point to an elevated chance that inflation will reach 3% to 5% within the next 10 years. There is also a non-trivial probability that inflation begins rising significantly faster than the market anticipates, even if it is not BCA Research’s base case. The dichotomy between the low odds of a quick turnaround in inflation embedded in financial asset prices and the inflationary threat created by monetary and fiscal choices is too large. It will force market participants to assign a greater inflation risk premium in bonds and stocks to protect against this eventuality. This process could precipitate painful corrections in both bond and equity prices. The good news is that inflation protection remains cheap. Three Stages Of Inflation The staggering recent increase in money supply and the extraordinary fiscal stimulus rolled out this year raise two questions: Are we exiting the recent period of low and stable inflation that has prevailed? Is inflation becoming a threat to financial asset prices? Major turning points in inflation provide context to assess the risk of an impending threat of increased inflation. From a statistical perspective, three phases in inflation dynamics have defined the past 100 years (Chart I-1): Chart I-1Three Stages Of Inflation
Three Stages Of Inflation
Three Stages Of Inflation
1922 to 1965: Inflation gyrated violently from as low as -12.1% to as high as 11.9% in response to various shocks such as the Great Depression or World War II. Nonetheless, inflation’s mean was stationary or trendless. 1965 to 1998: A period of great upheaval when inflation trended strongly, moving up until 1980 and then down until 1998. 1998 to present: Inflation has been stable, flatlining between 0.6% and 2.9%. Chart I-2More Often Than Not, Money Matters
More Often Than Not, Money Matters
More Often Than Not, Money Matters
Empirically speaking, whether the mean of inflation in a given period is stationary will determine the influence that money has on inflation. The era of stationary inflation from 1922 to 1965 saw M2 closely correlated with changes in US consumer prices, but the link was severed from 1965 to 1998 when inflation trended strongly (Chart I-2, top and bottom panel). When inflation stabilized again from 1998 to 2020, M2 growth again explained gyrations in consumer prices (Chart I-2, bottom panel). Why did inflation behave differently from 1965 to 1998 compared with other episodes in the past 100 years? The defining factor of the pre-1965 era was an adherence to the gold standard. The gold standard created a hard anchor on prices because its rigidity made monetary policy credible, which produced stable inflation expectations. The velocity of money was also steady. Consequently, using the Fisher formulation of the equation of exchange (Price*Output = Money*Velocity or PY=MV), inflation became a direct derivative of the money supply. Various shocks such as a war or a depression would impact the rate of expansion of money, leading to a nearly linear effect on prices. When we examine unstable inflation from 1965 to 1998, it helps if we split the period into two subsamples: 1965 to 1977 and 1977 to 1998. The first interval generated accelerating inflation due to a multitude of factors. In the mid-1960s, slack in the US economy disappeared while demand became excessive as a result of the federal government’s increased spending from The Great Society programs and the Vietnam War. Additionally, by 1965, the gold standard was under attack. The US current account disappeared between 1965 and 1969. Worried by the deteriorating US balance of payment dynamics, French President De Gaulle sent his navy to repatriate France’s gold at the New York Fed. Other countries followed suit. The continued pressure on the US balance of payments, along with the need for easier monetary policy following the 1970 recession, lead to the 1971 Smithsonian Agreement whereby President Nixon unpegged the dollar from gold, effectively killing the gold standard. Any semblance of monetary rectitude disappeared and inflation expectations began to drift up. The oil shock of 1973 fueled the inflationary dynamics and pushed inflation higher through the rest of the decade. The developments outside of monetary policy reinforced downward pressure on inflation expectations created by the Fed’s orthodoxy. The second interval began in 1977, three years before inflation peaked. This date marks the implementation of the Federal Reserve Reform Act, which modified the Fed’s mandate from only targeting full employment to full employment and stable inflation. At first, the Act had little practical impact until Paul Volker became Fed chair in 1979 and began to combat inflation. Prior to 1977, the unemployment rate was below NAIRU (the unemployment rate consistent with full employment) most of the time, the economy overheated and ultimately, inflation trended up (Chart I-3). However, since 1977, the unemployment rate has mostly been above NAIRU and the labor market has predominantly experienced excess slack. Consequently, inflation expectations re-anchored to the downside and realized inflation collapsed. Chart I-3The Effect Of The Federal Reserve Reform Act Of 1977
The Effect Of The Federal Reserve Reform Act Of 1977
The Effect Of The Federal Reserve Reform Act Of 1977
Chart I-4The Monetarist Fed: 1977 to 1998
The Monetarist Fed: 1977 to 1998
The Monetarist Fed: 1977 to 1998
The relationship between short rates and money supply provides another way to appreciate the change in monetary policy after 1977. The Fed opted for a monetarist approach (officially and unofficially) when it had to combat high realized and expected inflation. During most of the past 100 years, money supply changes and short rates were either negatively correlated or not linked at all (Chart I-4, top and second panel); however, they began to move together from 1979 to 1998 (Chart I-4, bottom panel). The Fed boosted rates to preempt the inflationary impact of faster money supply expansion, which curtailed the link between prices and M2. Between 1977 and 1998, major structural forces also pushed down inflation and severed the bond between money supply and CPI. Starting with President Reagan, a period of aggressive deregulation and union-busting increased competition and removed some pricing power from labor.1 Most importantly, the rapid widening in globalization resulted in international trade representing an ever-climbing portion of global GDP. By adding more people to the global network of supply chains, globalization further entrenched the loss of workers’ pricing power, which caused wages to lag productivity and decline as a share of national income (Chart I-5). The developments outside of monetary policy reinforced downward pressure on inflation expectations created by the Fed’s orthodoxy. In the final phase from 1998 to 2020, the stabilization of inflation reunited prices and money supply. Inflation flattened due to several factors. By 1998, 70% of the global population lived in a capitalist system (compared to market shares only 28% in 1977). Thus, most of the expansion of the global labor supply was completed. China entered the WTO only in 2001, but it had been exerting its deflationary influence for many years by stealing market share away from newly industrialized Asian economies. Additionally, following the Asian Crisis of 1997, many Asian economies (including China and Japan) elected to build large dollar FX reserves to contain their currencies versus the USD, and subsidize economic activity. This process created some stability in global goods prices and slowed the USD’s depreciation started in 2002. In response to these influences, inflation expectations stabilized in the late 1990s, creating an anchor for realized inflation (Chart I-6). Thanks to this steadiness in inflation expectations, the Phillips curve (the inverse link between wages and the unemployment rate) flattened. The economy entered a feedback loop where consistent inflation rates begat stable wages, which in turn created more stability in aggregate prices. Fluctuations in the rate of inflation became directly linked to changes in the output gap and thus, variations in demand. Importantly, the flat Phillips curve and the well-anchored inflation expectations freed the Fed to maintain easier policy during expansions and allow money supply to expand in line with money demand. Chart I-5Expanding Globalization Robbed Labor Of Its Bargaining Power
Expanding Globalization Robbed Labor Of Its Bargaining Power
Expanding Globalization Robbed Labor Of Its Bargaining Power
Chart I-6The Anchoring Of Inflation Expectations
The Anchoring Of Inflation Expectations
The Anchoring Of Inflation Expectations
Bottom Line: The correlation between inflation and M2 growth since 1998 is as relevant as it was from 1922 to 1965. What The Future Holds Structurally, inflation will likely trend higher. The Median Voter Theory (MVT), developed by Anthony Downs and upheld by our Geopolitical Strategy service as the key constraint on global and US policymakers, is at the heart of our position. Over the past 40 years, income and wealth inequalities have soared worldwide, especially in the US and the UK, which have both embraced ‘laissez-faire’ capitalism enthusiastically. Moreover, these countries also suffer from pronounced levels of intergenerational social immobility.2 The effect of these aforementioned trends has become so pervasive that life expectancy for a large swath of the US population is decreasing (Chart I-7). The shift by median voters to the left on economic matters will force greater fiscal profligacy and regulatory rigidity. This policy mix will add a secular drift to inflation. In response to widening inequalities, voter preferences have shifted to the left on economic matters and toward populism. Brexit and the election of President Trump both fit this pattern because they represent the repudiation of the prevalent neoliberal discourse that pushed toward more globalization, more immigration and more deregulation. Moreover, voters in the UK and the US increasingly doubt the benefits of free trade (Chart I-8). Chart I-7Inequalities Are Physically Hurting Many US Voters
November 2020
November 2020
Chart I-8Free Trade Is Out…
November 2020
November 2020
Attitudes toward the government’s role in the economy have also changed. Voters in the US are much more open than they were 10 or 20 years ago to a greater involvement of the public sector in the economy. Additionally, support toward socialism has become more widespread among various demographic groups (Chart I-9). The MVT posits that politicians who want to access or remain in power must cater to voter preferences. Hence, when compared with the Great Financial Crisis, the swift fiscal policy easing that accompanied the COVID-19 recession illustrates the understanding by politicians that spending is popular, especially in times of crisis (Chart I-10). Chart I-9…But State Intervention Is In
November 2020
November 2020
Chart I-10Politicians Deliver What Voters Want
November 2020
November 2020
Greater government spending and larger fiscal deficits are used to achieve faster nominal growth. When the output gap is negative, public spending helps the economy and may even increase national savings. However, if profligacy continues after the economy has reached full employment, it generates excess demand relative to aggregate supply and puts downward pressure on the national savings rate. This is inflationary. To redistribute income toward the middle class, populists aim to diminish competition in the economy. They reregulate the economy, which indirectly protects workers. They also limit global trade flows as much as possible. Free trade is good for the economy, but it puts downward pressure on the price of goods relative to services. Therefore, to remain competitive domestic goods producers must compress their labor costs, which either hurts wages for middle-class workers or destroys the number of manufacturing jobs with high wages. Undoing this process raises labor costs and undermines a major deflationary influence on the economy. Tax policy is another tool to force a redistribution of income and wealth toward the middle class. We should expect increased taxes on higher-income households. This process puts more money in the pockets of a middle class whose marginal propensity to consume is around 95% to 99% compared with 50% to 60% for households at the top of the income distribution. Re-shuffling the composition of national income toward the middle class will boost demand and puts upward pressure on consumer prices. Central banks are not immune to the preference of the median voter. As we showed earlier, the Fed Reform Act of 1977 had a meaningful impact on inflation, but only after Volcker took the helm of the FOMC. Given the damages wrought by high inflation in the 1970s, the median voter wanted to see less inflation, which enabled Volcker’s hawkish shift. As Marko Papic argued in a recent BCA Research webcast,3 a minority of voters (and policymakers) remember the pain created by inflation, but everyone is aware of the difficulties created by low nominal growth. Moreover, the Fed is still a creature of Congress and the median voter’s preferences greatly affect the legislative body’s decisions. Consequently, the Fed’s policy stance will likely become structurally looser in response to indirect voter pressure. Inflation accelerates when the Fed expands money supply faster than the federal government sucks in liquidity via its deficit. The Fed’s recent adoption of an average inflation mandate fits within this paradigm. According to its new strategy, the Fed will start tightening policy after the unemployment gap has closed and inflation is above 2%. This is reminiscent of the model prior to 1977 (when full employment conditions were paramount), which generated a significant inflation upside. Bottom Line: The shift by median voters to the left on economic matters will force greater fiscal profligacy and regulatory rigidity. It will also contribute to a more dovish bias by central banks. This policy mix will add a secular drift to inflation. What About Now? Markets may be failing to recognize the risk that inflation will rise sooner rather than later. Low yields, subpar inflation expectations, dovish central bank pricing and the valuation premium of growth relative to value stocks already reflect the strong deflationary force created by a deeply negative output gap. Thus, a quicker-than-expected recovery in inflation threatens the financial markets. Our structural inflation view is not the source of this danger. The hidden, near-term inflationary risk arises because we are still in an environment where broad money matters because inflation remains stationary. M2 is expanding at 23.7%, its fastest rate on record. If relationships of the past 20-plus years hold, then this is a warning sign for inflation. The catalyst to crystalize the structural inflationary pressures created by economic populism may be the loose monetary and fiscal conditions caused by the COVID-19 recession. Chart I-11The Real Near-term Inflation Risk
The Real Near-term Inflation Risk
The Real Near-term Inflation Risk
This view may seem simplistic in light of the current large output gap, but when fiscal policy is included in the assessment, the picture becomes clearer. Since 1998, the gap between the expansion of M2 and the issuance of debt to the public by the federal government has explained inflation better than broad money alone (Chart I-11). Inflation accelerates when the Fed expands money supply faster than the federal government sucks in liquidity via its deficit. However, inflation decelerates when the Fed expands the money supply slower than the public sector pulls in private funds. In other words, if the Fed eases monetary conditions enough to finance the deficit, then debt monetization occurs, the private sector is not crowded out and demand gets a massive boost. This point is crucial and feeds the stronger economic recovery compared with the one post-GFC. In 2009 and 2010, the private sector was deleveraging and commercial banks were retrenching their lending. Neither the demand for nor the supply of credit was ample. Therefore, the Fed’s rapid balance sheet expansion had a limited impact on broad money. Instead, it skewed the composition of M2 toward commercial bank excess reserves at the Fed and away from private-sector deposits. Broad money was not rising quickly enough to fully finance the government and real interest rates did not fall as far as they should have. The economy suffered. A virtuous cycle has emerged, one which creates more inflation risks than are priced in. Nowadays, broad money responds much better to the Fed’s intervention because the balance sheets of the nonfinancial private sector are much healthier than in 2008 and deleveraging is absent. This mitigates the tightening credit standards of commercial banks. As Chart I-12 illustrates, household net worth is more robust than it was 12 years ago, debt-servicing costs account for a much narrower slice of disposable income and the government’s aggressive actions have bolstered household finances. Moreover, the majority of job losses have been concentrated in low-income jobs, thus, above-average earners have kept their incomes. Under these conditions, households have taken advantage of record low mortgage rates to purchase real estate, which is contributing to growth in the residential sector (Chart I-13, top two panels). Meanwhile, the rapid rebound in businesses’ capex intentions (which even small firms exhibit) and in core capital goods orders indicates that animal spirits are much more vigorous than anyone expected this past spring (Chart I-13, bottom two panels). At that time, the dominant narrative posited that firms were tapping their credit lines to set aside cash. Chart I-12Robust Household Balance Sheets = No Liquidity Trap
Robust Household Balance Sheets = No Liquidity Trap
Robust Household Balance Sheets = No Liquidity Trap
Chart I-13Housing And Capex Are In The Driver's Seat
Housing And Capex Are In The Driver's Seat
Housing And Capex Are In The Driver's Seat
Chart I-14Unlike In 2008/09, Real Rates Have Collapsed
Unlike In 2008/09, Real Rates Have Collapsed
Unlike In 2008/09, Real Rates Have Collapsed
Thanks to these more favorable balance sheet dynamics, the Fed’s injection of liquidity is boosting M2 enough to finance the Treasury’s issuance. Hence, real interest rates are much lower than in 2009/10 even if the economy is recovering much more quickly (Chart I-14). Policymakers are not crowding out the private sector. A virtuous cycle has emerged, one which creates more inflation risks than are priced in. A counterargument is that technology is too deflationary for the above dynamics to matter. The reality is that technology is always a deflationary force. The expansion of the capital stock has always been about providing each worker with access to newer and better technology to boost productivity. The current low level of productivity gains suggests that the dominant discourse exaggerates the economic advances from new technologies. Thus, inflation stationarity and the interplay between monetary and fiscal policy still matters to CPI. Investors should monitor factors that would indicate if the upside risk to near-term inflation described above is morphing into reality. Doing so would seriously damage financial asset prices made vulnerable to higher inflation by prohibitive valuations. We propose tracking the following variables: The household savings rate. If savings normalize faster because consumer confidence firms, then spending will accelerate, profits will rise more quickly and money will expand further, all of which will bring back inflation sooner. A Blue Sweep in the US presidential election. If the Democrats take control of both the executive and legislative branches, then they will expand stimulating policies that will bolster demand. This, too, would boost profits and broad money supply, which would be inflationary. The velocity of money. An increase in money velocity, which remains depressed, would accentuate the impact of rapid money growth. It would also suggest that animal spirits are strengthening, which will further encourage economic transactions. A weak dollar. The dollar is set to weaken because of savings dynamics and the global recovery. A runaway decline in the USD would indicate that the interplay between monetary and fiscal policy is debasing money, unleashing an inflationary spiral. Bottom Line: The probability that inflation returns quickly is much more meaningful than financial markets appreciate because of the interplay between money growth, fiscal deficits and robust private-sector balance sheets. This dissonance will create a substantial risk for asset prices next year. Investment Implications The most important implication of the analysis above is that investors should consider inflation protection in all asset classes. However, this protection is cheap to acquire because investors are focusing on deflation, not inflation. Chart I-15Inflation Protection Remains Cheap
Inflation Protection Remains Cheap
Inflation Protection Remains Cheap
Bonds Our bond strategists recently moved to a below-benchmark duration in fixed-income portfolios in light of the economic recovery and the increasing probability of a Blue Wave on November 3, an argument highlighted in the Section II Special Report written by our colleagues Rob Robis and Ryan Swift. The Fed’s new average-inflation target, coupled with the global economic recovery, should put upward pressure on inflation breakeven rates, which are still well below 2.3%-2.5% normally associated with stable inflation near 2% (Chart I-15). The underestimated upward risk to inflation further favors climbing yields. Beyond lifting inflation breakeven rates, this risk would also raise inflation uncertainty, which warrants a greater term premium and a steeper yield curve (Chart I-16). Additionally, higher inflation would occur lockstep with declining savings. The recent surge in excess savings was a primary driver of the collapse in yields; its reversal would push up long-term interest rates (Chart I-17). Chart I-16Rising Inflation Uncertainty Will Steepen The Yield Curve
Rising Inflation Uncertainty Will Steepen The Yield Curve
Rising Inflation Uncertainty Will Steepen The Yield Curve
Chart I-17Excess Savings Will Fall And Yields Will Rise
Excess Savings Will Fall And Yields Will Rise
Excess Savings Will Fall And Yields Will Rise
The Dollar The US dollar is the major currency most exposed to growing populism because of the extraordinary income inequalities observed in the US. Moreover, a generous combined monetary and fiscal policy setting in the US has eroded the dollar’s appeal as the country’s trade deficit widens (it normally narrows during a recession) in response to pronounced national dissaving (Chart I-18, left panel). Furthermore, US broad money growth stands far above that of other major economies (Chart I-18, right panel). Compared with other major central banks, the Fed is more guilty of financing the public-sector’s debt binge. Debt monetization creates a real risk to a stable USD. Chart I-18AFalling Savings And The Fed's Generosity Will Tank The Greenback
November 2020
November 2020
Chart I-18BFalling Savings And The Fed’s Generosity Will Tank The Greenback
November 2020
November 2020
The expanding global recovery creates an additional problem for the countercyclical dollar. China’s role is particularly important in this regard as the nation’s domestic economic activity will improve further in response to the lagged impact of a rapid climb in total social financing (Chart I-19, top panel). Sturdy Chinese demand results in climbing global industrial production, which will hurt the greenback. Likewise, China’s healthy recovery has lifted interest rate differentials in favor of the yuan (Chart I-19, bottom panel). A strong CNY flatters China’s purchasing power abroad and diminishes deflationary pressures around the world. This combination should stimulate the global manufacturing sector, which benefits foreign economies more than it does the US. Investors should consider inflation protection in all asset classes. Equities BCA Research still prefers global equities to bonds on a cyclical basis. The early innings of a pickup in inflation would solidify this bias. Our Adjusted Equity Risk Premium, which accounts for the expected growth rate of earnings and the non-stationarity of the traditional ERP, shows a solid valuation cushion in favor of stocks (Chart I-20). Moreover, forward earnings for the S&P 500 have upside, judging by the gap between the Backlog of Orders and the Customer Inventories components of the ISM Manufacturing survey (Chart I-21). Chart I-19China's Robust Growth Hurts The Dollar
China's Robust Growth Hurts The Dollar
China's Robust Growth Hurts The Dollar
Chart I-20The Adjusted ERP Still Favors Stocks
The Adjusted ERP Still Favors Stocks
The Adjusted ERP Still Favors Stocks
We also continue to overweight cyclical sectors over defensive ones. The existence of greater inflation risk than the market believes confirms this view. Cyclicals would outperform if investors priced in quicker inflation because they would also bid down the dollar and push up inflation breakeven rates (Chart I-22). These relationships exist because industrials and materials enjoy greater pricing power in an inflationary environment and financials would benefit from a steeper yield curve. An outperformance of deep cyclicals relative to defensive equities should result in an underperformance of US shares relative to the rest of the world. Chart I-21Earnings Revisions Have Upside
Earnings Revisions Have Upside
Earnings Revisions Have Upside
Chart I-22Deep Cyclicals Will Like The Brand New World
Deep Cyclicals Will Like The Brand New World
Deep Cyclicals Will Like The Brand New World
The long-term outlook for real stock returns is poor, despite a positive six- to nine-month view. Higher inflation will force a greater upside in yields. However, the current extraordinary market multiples can only be justified if one believes that yields will stay depressed for many more years. Thus, inflation would likely prompt a de-rating of equities. Furthermore, our structural inflation view rests on the imposition of populist economic policies. A move backward in globalization and redistributionist policies would lift the share of wages in national income, which would compress extraordinarily wide profit margins (Chart I-23). Therefore, real long-term profits will probably suffer. Paradoxically, nominal stock prices may still eke out positive nominal gains, but that will be a consequence of the money illusion created by higher inflation. Chart I-23Populism Threatens Profit Margins
Populism Threatens Profit Margins
Populism Threatens Profit Margins
BCA Research still prefers global equities to bonds on a cyclical basis. Investors should continue to overweight equities versus bonds, despite pronounced hurdles to long-term, real returns in stocks. Historically, periods of transition from low inflation to higher inflation have allowed stocks to outperform bonds, even if equities generate negative real returns (Table I-1). The exceptionally low real yields and thin inflation protection offered by government bonds increases the likelihood that history will be repeated. Table I-1Rising Inflation: Equities Beat Bonds
November 2020
November 2020
A size bias may offer some protection against higher inflation both in the near and long term. We have been positive on small cap equities since September and our US Equity Strategy service upgraded the Russell 2000 to overweight this week.4 A bump in railroad freight volumes augurs well for the domestic economy to which small caps are very sensitive. Additionally, stronger railroad freight volumes also indicate net rating upgrades for junk bonds, which decreases the riskiness of a highly levered small cap sector (Chart I-24). Moreover, small cap stocks are positively linked to major trends produced by higher inflation, such as a weaker dollar and higher commodity prices (Chart I-25). Small firms also enjoy rising consumer confidence, a variable targeted by populist politicians (Chart I-26). Therefore, the potential for a re-rating of the Russell 2000 relative to the S&P 500 is elevated, especially if investors reassess the likelihood of higher inflation. Chart I-24Small-Cap Stocks Are Set To Shine
Small-Cap Stocks Are Set To Shine
Small-Cap Stocks Are Set To Shine
Chart I-25Small-Cap Will Enjoy Higher Inflation...
Small-Cap Will Enjoy Higher Inflation...
Small-Cap Will Enjoy Higher Inflation...
Chart I-26...And Populists
...And Populists
...And Populists
Commodities BCA Research remains positive on the prices of natural resources on a cyclical basis even if there is more risk of a near-term correction for this asset class. Commodities are highly sensitive to a global industrial cycle that offers significant upside and to China in particular. Moreover, commodities are high-beta plays on a weaker dollar and higher inflation expectations (Chart I-27). Natural resources will benefit from economic populism because it lifts demand for cyclical spending. Moreover, commodities are natural hedges against the risk of higher inflation. In this context, it makes sense to allocate more funds to resource stocks to protect an equity portfolio against inflation. Investors worried about the near-term outlook for commodities should rotate out of copper into crude. Copper has withstood the COVID-19 shock much better than Brent despite the strong cyclicality of both natural resources. Following this move, net speculative positions and sentiment measures for copper are toward the top of their ranges of the past 15 years. Meanwhile, the opposite is true for oil. Since 2005, increases in the Brent-to-copper ratio have followed declines to the current levels in the relative Composite Sentiment Indicator (Chart I-28), which includes sentiment and positioning measures for both commodities. Chart I-27Commodities Remain Efficient Inflation Hedges
Commodities Remain Efficient Inflation Hedges
Commodities Remain Efficient Inflation Hedges
Chart I-28A Contrarian Tactical Trade: Buy Brent / Sell Copper
A Contrarian Tactical Trade: Buy Brent / Sell Copper
A Contrarian Tactical Trade: Buy Brent / Sell Copper
Fundamentals also point in that direction. After collapsing in recent months, global inventories of copper are beginning to climb relative to Brent. Moreover, oil production has dropped significantly relative to copper. Oil demand fell even more dramatically than that of copper, but the gap between production and demand growth is moving in favor of crude. Real long-term profits will probably suffer. This trade is agnostic to the direction of the business cycle. Copper prices embed a much more optimistic take toward global economic activity than Brent. Therefore, copper is more vulnerable to a negative economic upset than oil and less likely to benefit from a positive economic surprise. Mathieu Savary Vice President The Bank Credit Analyst October 29, 2020 Next Report: November 30, 2020 II. Beware The Bond-Bearish Blue Sweep US Election & Duration: We estimate that there is an 72% probability of a US election result that will give a lift to US Treasury yields via increased fiscal stimulus. Those are strong enough odds to justify a move to a below-benchmark cyclical US duration stance on a 6-12 month horizon. US Treasuries: We anticipate a moderate bear market in US Treasuries to unfold during the next 6-12 months. In addition to below-benchmark portfolio duration, investors should overweight TIPS versus nominal Treasuries, hold nominal and real yield curve steepeners, and hold inflation curve flatteners. Non-US Country Allocation: Within global government bond portfolios, downgrade the US to underweight. Favor countries that have lower sensitivity to rising US Treasury yields with central banks that are likely to be more dovish than the Fed in the next few years. That means increasing allocations to core Europe and Japan, while reducing exposure to Canada and Australia. Stay neutral on the UK given the near-term uncertainties over the final Brexit outcome. With the US presidential election just two weeks away, public opinion polls continue to show that Joe Biden is the favorite to win the White House. However, the odds of a “Blue Sweep” - combining a Biden victory with the Democratic Party winning control of both the US Senate and House of Representatives - have increased since the end of September according to online prediction markets. US Treasury yields have also moved higher over that same period (Chart II-1), which we interpret as the bond market becoming more sensitive to the likelihood of a major increase in US government spending under single-party Democratic control. Chart II-1A Blue Sweep Is Bond Bearish
A Blue Sweep Is Bond Bearish
A Blue Sweep Is Bond Bearish
Table II-1A Comparison Of The Candidates' Budget Proposals
November 2020
November 2020
According to a recent analysis done by the Committee for a Responsible Federal Budget, President Trump’s formal policy proposals would increase US federal debt by $4.95 trillion between 2021 and 2030, while Biden’s plan would increase the debt by $5.60 trillion (Table II-1).5 While those are both massive fiscal stimulus plans, there is a stark difference in the policy mix of their proposals that matters for the future path of US bond yields. Under Biden, spending is projected to increase by a cumulative $11.1 trillion, partially offset by $5.8 trillion in revenue increases and savings with the former vice-president calling for tax hikes on corporations and high-income earners. On the other hand, Trump’s plan includes $5.45 trillion of spending increases and tax cuts over the next decade, offset by $0.75 trillion in savings. Conclusion: Biden would increase spending by over twice that of a re-elected Trump, with much of that spending expected to be front-loaded in the early part of his first term. Outright spending is more reflationary than tax cuts because it puts more money in the pockets of consumers (spenders) relative to producers (savers). The Biden plan would be more stimulating for overall activity even if the increase in debt is about the same. Chart II-2The Biden Platform Is Highly Stimulative
The Biden Platform Is Highly Stimulative
The Biden Platform Is Highly Stimulative
Another analysis of the Biden and Trump platforms was conducted by Moody’s in September, based on estimates of how much of each candidate’s promises could be successfully implemented under different combinations of White House and Congressional control.6 The stimulus figures were run through the Moody’s US economic model, which is similar to the budget scoring model of the US Congressional Budget Office, to produce a year-by-year path for the US economy over the next decade (Chart II-2). Moody’s concluded that the US economy would return to full employment in the second half of 2022 under a President Biden – especially if the Democrats win the Senate - compared to the first half of 2024 under a re-elected President Trump. Such a rapid closing of the deep US output gap that opened up because of the COVID-19 recession would likely trigger a reassessment of the Fed’s current highly dovish policy stance. At the moment, the US overnight index swap (OIS) curve discounts one full 25bp Fed hike by late 2023/early 2024, and two full hikes by late 2024/early 2025 (Chart II-3). This pricing of the future path of interest rates has occurred even with the Fed promising to keep the funds rate anchored near 0% until at least the end of 2023. The likelihood of some form of increased fiscal spending after the election will cause the bond market to challenge the Fed’s current forward guidance even more, putting upward pressure on Treasury yields. Chart II-3US Fiscal Stimulus Will Pull Forward Fed Liftoff
US Fiscal Stimulus Will Pull Forward Fed Liftoff
US Fiscal Stimulus Will Pull Forward Fed Liftoff
Our colleagues at BCA Geopolitical Strategy see a Blue Sweep as the most likely outcome of the US election, although their forecasting models suggest that the race for control of the Senate will be much closer than the Biden vs Trump battle (there is little chance that control of the House of Representatives would switch back to the Republicans).7 Their scenarios for each of the White House/Senate combinations, along with their own estimated probability for each, are the following: Biden wins in a Democratic sweep: BCA probability = 27%. The US economy will benefit from higher odds of unfettered fiscal stimulus in 2021, although financial markets will simultaneously have to adjust for the negative shock to US corporate earnings from higher taxes and regulation. Government bond yields should rise on the generally reflationary agenda. Trump wins with a Republican Senate: BCA probability = 23%. In this status quo scenario, a re-elected President Trump would still face opposition from House Democrats on most domestic economic issues, forcing him to tilt towards more protectionist foreign and trade policies in his second term. Fiscal stimulus would be easy to agree, though not as large as under a Democratic sweep. US Treasury yields would rise, but would later prove volatile due to the risk to the cyclical recovery from a global trade war, as Trump’s tariffs will not be limited to China and could even affect the European Union. Biden wins with the Senate staying Republican: BCA probability = 28%. This is ultimately the most positive outcome for financial markets - reduced odds of a full-blown trade war with China, combined with no new tax hikes. Bond yields would drift upward over time, but not during the occasional fiscal battles that would ensue between the Democratic president and Republican senators. The first such battle would start right after the election. Treasuries would remain well bid until financial market pressures forced a Senate compromise with the new president sometime in H1 2021. Trump wins with a Democratic Senate: BCA probability = 22%. This is the least likely scenario but one that could produce a big positive fiscal impulse. Trump is a big spender and will veto tax hikes, but will approve populist spending on areas where he agrees. The Democratic Senate would not resist Trump’s tough stance on China, however, thus keeping the risk of US-China trade skirmishes elevated. This is neutral-to-bearish for US Treasuries, depending on the size of any bipartisan stimulus measures and Trump’s trade actions. The key takeaway is that the combined probability of scenarios that will put upward pressure on US Treasury yields is 72%, versus a 28% probability of a more bond-neutral outcome. That is a bond-bearish skew worth positioning for by reducing US duration exposure now, ahead of the November 3 election. Of this 72%, 45 percentage points come from scenarios in which President Trump would remain in power. Hence his trade wars would eventually undercut his reflationary fiscal policy. This would become the key risk to the short duration view after the initial market response. Bottom Line: The most likely scenarios for the US election will give a cyclical lift to US Treasury yields via increased fiscal stimulus. This justifies a move to a below-benchmark US duration stance on a 6-12 month horizon. If Trump is re-elected, the timing of Trump’s likely return to using broad-based tariffs will have to be monitored closely. A Moderate Bear Market While our anticipated Blue Sweep election outcome will lead to a large amount of fiscal spending in 2021 and beyond, we anticipate only a modest increase in bond yields during the next 6-12 months. In terms of strategy, our recommended reduction in portfolio duration reflects the fact that fiscal largesse meaningfully reduces the risk of another significant downleg in bond yields and strengthens our conviction in a moderate bear market scenario for bonds. This does raise the question of how large an increase in US Treasury yields we expect during the next 6-12 months. We turn to this question now. Chart II-4Less Election-Day Upside Than In 2016
Less Election-Day Upside Than In 2016
Less Election-Day Upside Than In 2016
Not Like 2016 First, we do not expect a massive election night bond rout like we saw in 2016 (Chart II-4). For one thing, the Fed was much more eager to tighten policy in 2016 than it is today, and it did deliver a rate hike one month after the Republicans won the House, Senate and White House (Chart II-4, bottom panel). This time around, the Fed has made it clear that it will wait until inflation is running above its 2% target before lifting rates off the zero bound and will not respond directly to expectations for greater fiscal stimulus. Second, 2016’s election result was mostly unanticipated. This led to a dramatic adjustment in market prices once the results came in. The PredictIt betting market odds of a “Red Sweep” by the Republicans in 2016 were only 16% the night before the election. As of today, the betting markets are priced for a 58% chance of a Blue Sweep in 2020. Unlike in 2016, bonds are presumably already partially priced for the most bond-bearish election outcome. A Slow Return To Equilibrium To more directly answer the question of how high bond yields can rise, survey estimates of the long-run (or equilibrium) federal funds rate provide a useful starting point. In a world where the economy is growing at an above-trend pace and inflation is expected to move towards the Fed’s target, it is logical for long-maturity Treasury yields to settle near estimates of the long-run fed funds rate. Indeed, this theory is borne out empirically. During the last two periods of robust global economic growth (2017/18 & 2013/14), the 5-year/5-year forward Treasury yield peaked around levels consistent with long-run fed funds rate estimates (Chart II-5). As of today, the median estimates of the long-run fed funds rate from the New York Fed’s Survey of Market Participants and Survey of Primary Dealers are 2% and 2.25%, respectively. In other words, a complete re-convergence to these equilibrium levels would impart 80 – 100 bps of upward pressure to the 5-year/5-year forward Treasury yield. We expect this re-convergence to play out eventually, but probably not within the next 6-12 months. In both prior periods when the 5-year/5-year forward Treasury yield reached these equilibrium levels, the Fed’s reaction function was much more hawkish. The Fed was hiking rates throughout 2017 & 2018 (Chart II-5, panel 4), and the market moved quickly to price in rate hikes in 2013 (Chart II-5, bottom panel). The Fed’s new dovish messaging will ensure that the market reacts less quickly this time around. Also, continued curve steepening will mean that the 5-year/5-year forward yield’s 80 – 100 bps of upside will translate into significantly less upside for the benchmark 10-year yield. The 10-year yield and 5-year/5-year forward yield peaked at similar levels in 2017/18 when the Fed was lifting rates and the yield curve was flat (Chart II-6). But, the 10-year peaked far below the 5-year/5-year yield in 2013/14 when the Fed stayed on hold and the curve steepened. Chart II-5How High For Treasury Yields?
How High For Treasury Yields?
How High For Treasury Yields?
Chart II-6Less Upside In 10yr Than In 5y5y
Less Upside In 10yr Than In 5y5y
Less Upside In 10yr Than In 5y5y
The next bear move in bonds will look much more like 2013/14. The Fed will keep a firm grip over the front-end of the curve, leading to curve steepening and less upside in the 10-year Treasury yield than in the 5-year/5-year forward. In addition to shifting to a below-benchmark duration stance, investors should maintain exposure to nominal yield curve steepeners. Specifically, we recommend buying the 5-year note versus a duration-matched barbell consisting of the 2-year and 10-year notes (Chart II-6, bottom panel).8 TIPS Versus Nominals We have seen that a full re-convergence to “equilibrium” implies 80 – 100 bps of upside in the 5-year/5-year forward nominal Treasury yield. Bringing TIPS into the equation, we have also observed that long-maturity (5-year/5-year forward and 10-year) TIPS breakeven inflation rates tend to settle into a range of 2.3 – 2.5 percent when inflation is well-anchored and close to the Fed’s target (Chart II-7). The additional fiscal stimulus that will follow a Blue Sweep election makes it much more likely that the economic recovery will stay on course, leading to an eventual return of inflation to target and of long-maturity TIPS breakeven inflation rates to a 2.3 – 2.5 percent range. However, as with nominal yields, this re-convergence will be a long process whose pace will be dictated by the actual inflation data. To underscore that point, consider that our Adaptive Expectations Model of the 10-year TIPS breakeven inflation rate – a model that is driven by trends in the actual inflation data – has the 10-year breakeven rate as close to fair value (Chart II-8).9 This fair value will rise only slowly over time, alongside increases in actual inflation. Chart II-7Overweight TIPS Versus Nominals
Overweight TIPS Versus Nominals
Overweight TIPS Versus Nominals
Chart II-8Real Yields Have Likely Bottomed
Real Yields Have Likely Bottomed
Real Yields Have Likely Bottomed
All in all, we continue to recommend an overweight allocation to TIPS versus nominal Treasuries. TIPS breakeven inflation rates will move higher during the next 6-12 months, but are unlikely to reach our 2.3 – 2.5 percent target range within that timeframe. TIPS In Absolute Terms As stated above, we expect nominal yields to increase more than real yields during the next 6-12 months, but what about the absolute direction of real (aka TIPS) yields? Here, our sense is that real yields have also bottomed. If we consider the extreme scenario where the 5-year/5-year forward nominal yield returns to its equilibrium level and where long-maturity TIPS breakeven inflation rates return to our target range, it implies about 80 bps of upside in the nominal yield and 40 bps of upside in the breakeven. This means that the 5-year/5-year real yield has about 40 bps of upside in a complete “return to equilibrium” scenario. While we don’t expect this “return to equilibrium” to be completed within the next 6-12 months, the process is probably underway. The only way for real yields to keep falling in this reflationary world is for the Fed to become increasingly dovish, even as growth improves and inflation rises. After its recent shift to an average inflation target, our best guess is that Fed rate guidance won’t get any more dovish from here. Real yields fell sharply this year as the market priced in this change in the Fed’s reaction function, but the late-August announcement of the Fed’s new framework will probably mark the bottom in real yields (Chart II-8, bottom panel).10 Chart II-9Own Inflation Curve Flatteners And Real Curve Steepeners
Own Inflation Curve Flatteners And Real Curve Steepeners
Own Inflation Curve Flatteners And Real Curve Steepeners
Two More Curve Trades In addition to moving to below-benchmark duration, maintaining nominal yield curve steepeners and staying overweight TIPS versus nominal Treasuries, there are two additional trades that investors should consider in order to profit from the reflationary economic environment. The first is inflation curve flatteners. The cost of short-maturity inflation protection is below the cost of long-maturity inflation protection, meaning that it has further to run as inflation returns to the Fed’s target (Chart II-9). In addition, if the Fed eventually succeeds in achieving a temporary overshoot of its inflation target, then we should expect the inflation curve to invert. Real yield curve steepeners are in some ways the mirror image of inflation curve flatteners. Assuming no change in nominal yields, the real yield curve will steepen as the inflation curve flattens. But what makes real yield curve steepeners look even more attractive is that increases in nominal yields during the next 6-12 months will be concentrated in long-maturities. This will impart even more steepening pressure to the real yield curve. Investors should continue to hold inflation curve flatteners and real yield curve steepeners. Bottom Line: We anticipate a moderate bear market in US Treasuries to unfold during the next 6-12 months. In addition to below-benchmark portfolio duration, investors should overweight TIPS versus nominal Treasuries, hold nominal and real yield curve steepeners, and hold inflation curve flatteners. Non-US Government Bonds: Reduce Exposure To US Treasuries The mildly bearish case for US Treasuries that we have laid out above not only matters for our recommended duration stance, but also for our suggested country allocation within global government bond portfolios. Simply put, the risk of rising bond yields is much higher in the US than elsewhere, both for the immediate post-election period but also over the medium-term. Thus, the immediate obvious portfolio decision is to downgrade US Treasuries to underweight. The move higher in US Treasury yields that we expect is strictly related to spillovers from likely US fiscal stimulus. While other countries in the developed world are contemplating the need for additional fiscal measures, particularly in Europe where there is a renewed surge in coronavirus infections and growing economic restrictions, no country is facing as sharp a policy choice as the US with its upcoming election. We can say with a fair degree of certainty that the US will have a relatively more stimulative fiscal policy stance than other developed economies over at least the next couple of years. This implies a higher relative growth trajectory for the US that hurts Treasuries more on the margin than non-US government debt. In addition, the likely path of relative monetary policy responses are more bearish for US Treasuries. As described above, the scope of the US stimulus will cause bond investors to further question the Fed’s commitment to keeping the funds rate unchanged for the next few years. That also applies to the Fed’s other policy tools, like asset purchases. The Fed is far less likely to continue buying US Treasuries at the same aggressive pace it has for the past eight months if there is less need for monetary stimulus because of more fiscal stimulus. Chart II-10The Fed Will Gladly Trade Less QE For More Fiscal Stimulus
November 2020
November 2020
According to the IMF, the Fed has purchased 57% of all US Treasuries issued since late February of this year, in sharp contrast to the ECB and Bank of Japan that have purchased over 70% of euro area government bonds and JGBs issued (Chart II-10). If US Treasury yields are rising because of improving US growth expectations, fueled by fiscal stimulus, the Fed will likely tolerate such a move and buy an even lower share of Treasuries issued – particularly if the higher bond yields do not cause a selloff in US equity markets that can tighten financial conditions and threaten the growth outlook. The fact that US equities have ignored the rise in Treasury yields seen since the end of September may be a sign that both bond and stock investors are starting to focus on a faster trajectory for US growth. In terms of country allocation, beyond downgrading US Treasuries to underweight, we recommend upgrading exposure to countries that are less sensitive to changes in US Treasury yields (i.e. countries with a lower yield beta to changes in US yields). In Chart II-11, we show the rolling beta of changes in 10-year government bond yields outside the US to changes in 10-year US Treasury yields. This is a variation of the “global yield beta” concept that we have discussed in the BCA Research bond publications in recent years. Here, we modify the idea to look at which countries are more or less correlated to US yields, specifically. A few points stand out from the chart: Chart II-11Reduce Exposure To Bond Markets More Correlated To UST Yields
Reduce Exposure To Bond Markets More Correlated To UST Yields
Reduce Exposure To Bond Markets More Correlated To UST Yields
All countries have a “US yield beta” of less than 1, suggesting that Treasuries are a consistent outperformer when US yields fall and vice versa. This suggests moving to underweight the US when US yields are rising is typically a winning strategy in a portfolio context. The list of higher beta countries includes Canada, Australia, New Zealand, the UK and Germany; although Canada stands out as having the highest yield beta in this group. The list of lower beta countries includes France, Italy, Spain, and Japan. In Chart II-12, we show what we call the “upside yield beta” that is estimated only using data for periods when Treasury yields are rising. This gives a sense of which countries are more likely to outperform or underperform during a period of rising Treasury yields, as we expect to unfold after the election. From this perspective, the “safer” lower US upside yield beta group includes the UK, France, Germany and Japan. The riskier higher US upside yield beta group includes Canada, Australia, New Zealand, Italy and Spain. Chart II-12Favor Bond Markets Less Correlated to RISING UST Yields
Favor Bond Markets Less Correlated to RISING UST Yields
Favor Bond Markets Less Correlated to RISING UST Yields
Spain and Italy are less likely to behave like typical high-beta countries as US yields rise, however, because the ECB is likely to remain an aggressive buyer of their government bonds as part of their asset purchase programs over the next 6-12 months. We also do not recommend trading UK Gilts off their yield beta to US Treasuries in the immediate future, given the uncertainties over the negotiations over a final Brexit deal. Both sets of US yield betas suggest higher-beta Canada, Australia and New Zealand are more at risk of relative underperformance versus lower-beta France, Germany and Japan. In terms of government bond country allocation, we recommend reducing exposure to the former group and increasing allocations to the latter group. Bottom Line: Within global government bond portfolios, downgrade the US to underweight. Favor countries that have lower sensitivity to rising US Treasury yields, especially those with central banks that are likely to be more dovish than the Fed in the next few years. That means increasing allocations to core Europe and Japan, while reducing exposure to “higher-beta” Canada and Australia. Robert Robis, CFA Chief Fixed Income Strategist rrobis@bcaresearch.com Ryan Swift US Bond Strategist rswift@bcaresearch.com III. Indicators And Reference Charts The S&P 500 is experiencing its second correction in the past two months. The market looks even more fragile than it did in September. COVID-19 is heating up fast enough that lockdowns are re-emerging globally, the odds of an imminent fiscal deal have cratered to a near-zero chance, and investors are paying more attention to the growing risk of gridlock in Washington where a Biden Presidency and a Republican Senate majority would result in temporary fiscal paralysis. In this context, the decline in the momentum of the BCA Monetary Indicator, the elevated reading of our Speculation Indicator and the overvaluation of the stock market create the perfect cocktail for a dangerous few weeks. The longer we live in uncertainty regarding the elections’ result, the worse the market will fare. Short-term indicators confirm that equities are likely to remain under downward pressure in the coming weeks. Both the proportion of NYSE stocks above their 30-week and 10-week moving averages are still deteriorating after forming negative divergences with the S&P 500. They are also nowhere near levels consistent with a solid floor under the market. Moreover, our Intermediate Equity Indicator and the S&P 500 as a deviation from its 200-day moving average have rolled-over after reaching extremely overbought levels. Finally, both the poor performance of EM stocks as well as the underperformance of the Baltic Dry index and global chemical stocks relative to bond prices and the VIX indicate that cyclical assets could suffer from a wave of growth disappointment. Despite these short-term headwinds, the main pillar supporting the rally remains intact: global monetary conditions are highly accommodative. Moreover, the economic and financial risks created by the tepidity of fiscal support in recent months is self-limiting. As the economy progressively teeters toward a second leg of the recession, the pressure will rise for policymakers to spend generously once again to support their nations. Our cyclical indicators confirm the positive backdrop for stocks. Our Monetary Indicator remains at the top of its pre-COVID-19 distribution, which will put a natural floor under stocks, even if its recent deterioration is consistent with a market correction. Moreover, our Revealed Preference Indicator continues to flash a buy signal for stocks. Additionally, the BCA Composite Sentiment Indicator stands toward the middle of its historical distribution and the VIX has not hit the extremely compressed levels that normally precede major cyclical tops in the S&P 500. When weighing the short-term negative forces against the cyclical positives, we expect the S&P 500 to find a floor between 3000 and 3100. At this level, the froth highlighted by our Speculation Indicator will have dissipated. The bond market’s dynamics are interesting. Despite the violent sell-off in equities, Treasury yields are not declining much. Bonds are too expensive and with short-term rates near their lower bound, Treasurys are losing their ability to hedge equity risk in portfolios. Moreover, the bond market seems to understand that any recession will encourage additional fiscal profligacy, which puts a floor under yields. These dynamics suggest that once equities stabilize, yields could start rising meaningfully. Finally, the dollar continues its sideways correction. However, as risk aversion rises and global growth deteriorates, the dollar is likely to catch further upside in the near term, especially as it has not fully worked out this summer’s oversold conditions. Moreover, the dollar is a momentum currency. Thus, once its start to turn around, its rally is likely to be more powerful than most expect, which will put additional downward pressures on commodity prices. Consequently, it is too early to start selling the USD again or to bottom fish natural resources. EQUITIES: Chart III-1US Equity Indicators
US Equity Indicators
US Equity Indicators
Chart III-2Willingness To Pay For Risk
Willingness To Pay For Risk
Willingness To Pay For Risk
Chart III-3US Equity Sentiment Indicators
US Equity Sentiment Indicators
US Equity Sentiment Indicators
Chart III-4Revealed Preference Indicator
Revealed Preference Indicator
Revealed Preference Indicator
Chart III-5US Stock Market Valuation
US Stock Market Valuation
US Stock Market Valuation
Chart III-6US Earnings
US Earnings
US Earnings
Chart III-7Global Stock Market And Earnings: Relative Performance
Global Stock Market And Earnings: Relative Performance
Global Stock Market And Earnings: Relative Performance
Chart III-8Global Stock Market And Earnings: Relative Performance
Global Stock Market And Earnings: Relative Performance
Global Stock Market And Earnings: Relative Performance
FIXED INCOME: Chart III-9US Treasurys And Valuations
US Treasurys And Valuations
US Treasurys And Valuations
Chart III-10Yield Curve Slopes
Yield Curve Slopes
Yield Curve Slopes
Chart III-11Selected US Bond Yields
Selected US Bond Yields
Selected US Bond Yields
Chart III-1210-Year Treasury Yield Components
10-Year Treasury Yield Components
10-Year Treasury Yield Components
Chart III-13US Corporate Bonds And Health Monitor
US Corporate Bonds And Health Monitor
US Corporate Bonds And Health Monitor
Chart III-14Global Bonds: Developed Markets
Global Bonds: Developed Markets
Global Bonds: Developed Markets
Chart III-15Global Bonds: Emerging Markets
Global Bonds: Emerging Markets
Global Bonds: Emerging Markets
CURRENCIES: Chart III-16US Dollar And PPP
US Dollar And PPP
US Dollar And PPP
Chart III-17US Dollar And Indicator
US Dollar And Indicator
US Dollar And Indicator
Chart III-18US Dollar Fundamentals
US Dollar Fundamentals
US Dollar Fundamentals
Chart III-19Japanese Yen Technicals
Japanese Yen Technicals
Japanese Yen Technicals
Chart III-20Euro Technicals
Euro Technicals
Euro Technicals
Chart III-21Euro/Yen Technicals
Euro/Yen Technicals
Euro/Yen Technicals
Chart III-22Euro/Pound Technicals
Euro/Pound Technicals
Euro/Pound Technicals
COMMODITIES: Chart III-23Broad Commodity Indicators
Broad Commodity Indicators
Broad Commodity Indicators
Chart III-24Commodity Prices
Commodity Prices
Commodity Prices
Chart III-25Commodity Prices
Commodity Prices
Commodity Prices
Chart III-26Commodity Sentiment
Commodity Sentiment
Commodity Sentiment
Chart III-27Speculative Positioning
Speculative Positioning
Speculative Positioning
ECONOMY: Chart III-28US And Global Macro Backdrop
US And Global Macro Backdrop
US And Global Macro Backdrop
Chart III-29US Macro Snapshot
US Macro Snapshot
US Macro Snapshot
Chart III-30US Growth Outlook
US Growth Outlook
US Growth Outlook
Chart III-31US Cyclical Spending
US Cyclical Spending
US Cyclical Spending
Chart III-32US Labor Market
US Labor Market
US Labor Market
Chart III-33US Consumption
US Consumption
US Consumption
Chart III-34US Housing
US Housing
US Housing
Chart III-35US Debt And Deleveraging
US Debt And Deleveraging
US Debt And Deleveraging
Chart III-36US Financial Conditions
US Financial Conditions
US Financial Conditions
Chart III-37Global Economic Snapshot: Europe
Global Economic Snapshot: Europe
Global Economic Snapshot: Europe
Chart III-38Global Economic Snapshot: China
Global Economic Snapshot: China
Global Economic Snapshot: China
Mathieu Savary Vice President The Bank Credit Analyst Footnotes 1 Please see The Bank Credit Analyst Special Report "Labor Strikes Back," dated February 27, 2020, available at bca.bcaresearch.com 2 High odds of staying in the income decile of your parents. 3 Please see Geopolitical Strategy Webcast "Geopolitical Alpha In 2020-21," dated October 21, 2020. Marko also recently published a book "Geopolitical Alpha." 4 Please see US Equity Strategy Weekly Report "Vigilantes Gone Missing?" dated October 26, 2020, available at uses.bcaresearch.com 5 http://www.crfb.org/papers/cost-trump-and-biden-campaign-plans 6 https://www.moodysanalytics.com/-/media/article/2020/the-macroeconomic-consequences-trump-vs-biden.pdf 7 Please see BCA Research Geopolitical Strategy Special Report, “Introducing Our Quantitative US Senate Election Model”, dated October 16, 2020, available at gps.bcaresearch.com 8 For more details on this recommended steepener trade please see US Bond Strategy Weekly Report, “Positioning For Reflation And Avoiding Deflation”, dated August 11, 2020, available at usbs.bcaresearch.com 9 For more details on our Adaptive Expectations Model please see US Bond Strategy Weekly Report, “How Are Inflation Expectations Adapting?”, dated February 11, 2020, available at usbs.bcaresearch.com 10 For a detailed look at the implications of the Fed’s policy shift please see US Bond Strategy / Global Fixed Income Strategy Special Report, “A New Dawn For US Monetary Policy”, dated September 1, 2020, available at usbs.bcaresearch.com
Your feedback is important to us. Please take our client survey today. Highlights Duration: The Fed’s adoption of an Average Inflation Target and the emerging correlation between bond yields and a “blue sweep” election outcome were the two main catalysts that caused us to reduce our recommended portfolio duration stance last week. Monetary Policy: The Fed is unlikely to increase its pace of Treasury purchases, unless a selloff in risky assets (equities and credit) threatens the economic recovery. As long as the Fed sticks with its ultra-dovish interest rate guidance, a moderate bear-steepening of the Treasury curve will not cause such a selloff. Economy: Weekly claims data are consistent with a continued decline in the unemployment rate, due mostly to fewer temporarily unemployed workers. All in all, the US economy is recovering, but it remains very far from full employment. Feature Chart 1Real Yields Have Troughed
Real Yields Have Troughed
Real Yields Have Troughed
After having advocated “at benchmark” portfolio duration since March, we officially lowered our recommended duration stance to “below benchmark” in last week’s Special Report.1 Two main catalysts led us to this decision. First, there was the Fed’s late-August adoption of an Average Inflation Target. This was an important bond-bearish catalyst because it signaled that the Fed’s reaction function has reached its maximum dovishness. Treasury yields stayed low throughout the summer even as the economy recovered because the Fed was simultaneously guiding the market toward a more dovish reaction function. As evidence for this dynamic, notice that between March and August the uptrend in the cost of inflation compensation was completely offset by falling real yields (Chart 1). But now, the Fed has officially adopted its new Average Inflation Targeting framework. In addition, it has promised not to lift rates at all until inflation is above its 2% target and is expected to overshoot that target for some time. To get more dovish from here, the Fed would probably need to actually increase its long-run inflation target from 2% to 3%, a step it is not prepared to take. For this reason, we expect that the Fed has exhausted its ability to push real yields lower as the economy recovers. With the Fed’s interest rate reaction function at maximum dovishness, only a negative economic growth shock can push yields lower. With the Fed’s interest rate reaction function at maximum dovishness, only a negative economic growth shock can push yields lower. Such a shock would cause investors to anticipate a slower return of inflation and thus push bond yields down, even if the market’s assessment of the Fed’s willingness to respond to inflationary pressures (aka its reaction function) remains constant. The failure of Congress to deliver additional fiscal stimulus after the expiry of the CARES act’s main income-supporting provisions is the sort of thing that could cause such a shock. However, September’s market action made it clear that investors are willing to look past the failure to deliver a bill if they can look forward to a larger fiscal stimulus in January. As we wrote last week, the most likely election outcome of the Democrats winning the House, Senate and White House would certainly deliver on that promise. Bottom Line: The Fed’s adoption of an Average Inflation Target and the emerging correlation between bond yields and a “blue sweep” election outcome were the two main catalysts that caused us to reduce our recommended portfolio duration stance last week. Will The Fed Use Its Balance Sheet To Keep Bond Yields Low? Chart 2Fed Treasury Holdings Over Time
Fed Treasury Holdings Over Time
Fed Treasury Holdings Over Time
One possible counterargument to our bond-bearish view is that, even if the Fed’s interest rate guidance is as dovish as it will get, the central bank will simply ramp up asset purchases to prevent any significant rise in long-maturity bond yields. Certainly, the Fed has not shied away from transacting in the Treasury market this year (Chart 2). In fact, the Fed took down more than 100% of gross note and bond issuance in the second quarter (Chart 3) and its current stated policy is to purchase at least $80 billion of Treasury securities per month. At present, the Fed holds more than 35% of all outstanding Treasuries with more than 10 years to maturity and about one quarter of the outstanding supply for all other maturities (Chart 4). This is a significant presence in the Treasury market, but not so large that the Fed would think twice about increasing its pace of Treasury purchases if such a policy was deemed necessary. But what would actually make the Fed increase its pace of asset purchases? Would a modest bear-steepening of the Treasury curve (our base case outlook) be enough? We doubt it. Chart 3Fed Purchases Peaked In Q2
Fed Purchases Won’t Stop Bond Yields From Rising
Fed Purchases Won’t Stop Bond Yields From Rising
Chart 4Fed Owns A Good Chunk ##br##Of The Market
Fed Purchases Won’t Stop Bond Yields From Rising
Fed Purchases Won’t Stop Bond Yields From Rising
Chart 5Financial Conditions Are Highly Accommodative
Financial Conditions Are Highly Accommodative
Financial Conditions Are Highly Accommodative
The Fed would be concerned if broad measures of financial conditions started to tighten, as that would indicate a looming period of slower economic growth. But that’s very different from long-maturity Treasury yields moving somewhat higher in response to an improving economic outlook. In fact, to get a meaningful tightening in broad measures of financial conditions, we would need to see significant credit spread widening and weaker equity prices (Chart 5). A bear-steepening Treasury curve, even if long-dated yields move 40-50 bps higher, will not prompt a selloff in credit markets or equities as long as the market believes that the Fed is committed to maintaining an accommodative monetary policy stance. Bottom Line: The Fed is unlikely to increase its pace of Treasury purchases, unless a selloff in risky assets (equities and credit) threatens the economic recovery. As long as the Fed sticks with its ultra-dovish interest rate guidance, a moderate bear-steepening of the Treasury curve will not cause such a selloff. Can The Fed Use It’s Balance Sheet To Keep Bond Yields Low? Chart 6Fed Purchases Work Mainly Through Signaling Interest Rate Intentions
Fed Purchases Work Mainly Through Signaling Interest Rate Intentions
Fed Purchases Work Mainly Through Signaling Interest Rate Intentions
Of course, in the extreme, the Fed could decide to set a cap on the 10-year Treasury yield and promise to purchase as many securities as necessary to maintain that cap. This sort of Yield Curve Control would effectively prevent long-maturity Treasury yields from rising, even as the economy recovered. As discussed above, we think the economic situation would have to turn quite dire for the Fed to pursue such a policy. A more relevant question is whether, in the absence of a stated yield cap, the Fed’s current pace of $80 billion of Treasury purchases per month (or even $100 billion per month) will prevent Treasury yields from rising. Our sense is that, without a stated yield cap, Fed Treasury purchases won’t stop bond yields from rising. In fact, we see very little evidence to support the notion that changes in Fed Treasury purchases influence the trend in bond yields, beyond what the purchase announcements signal to markets about the Fed’s intentions with regards to interest rate policy. Consider Chart 6, which shows the 10-year Treasury yield alongside the Global Manufacturing PMI and two different measures of Fed Treasury purchases. At first blush, between 2010 and 2012, there is a fairly strong relationship between a falling 10-year Treasury yield and an increase in Fed Treasury holdings greater than five years. However, the correlation between the 10-year Treasury yield and the Global Manufacturing PMI during this period is even stronger. This suggests an alternative explanation where the decline in bond yields is driven by the market shifting its rate hike expectations out into the future in response to slowing economic growth. Greater Fed purchases only served to reinforce the Fed’s increasingly dovish interest rate guidance during this time. Without a stated yield cap, Fed Treasury purchases won’t stop bond yields from rising. The key point from Chart 6 is that it is difficult to identify periods when the Fed’s balance sheet policy and interest rate guidance suggest opposite outcomes for bond yields. Typically, when the Fed is ramping up asset purchases it is also signaling to the market that it will shift toward a more dovish interest rate policy. Similarly, when the Fed is reducing its asset purchases, it tends to also be preparing the market for eventual rate hikes. This makes it impossible to say conclusively whether a given move in bond yields is driven by interest rate guidance or balance sheet actions. In our minds, this casts a lot of doubt on the notion that the Fed could maintain its current interest rate guidance during the next 6-12 months while also preventing a rise in Treasury yields by increasing asset purchases. The policy of increasing asset purchases would appear incoherent if it wasn’t also paired with increasingly dovish forward rate guidance, guidance that the Fed is likely unwilling to deliver. Bottom Line: Even if the Fed modestly increases its monthly pace of Treasury purchases, or shifts some purchases further out the curve as some FOMC participants have suggested, the impact on long-dated Treasury yields will be negligible without a concurrent shift in interest rate guidance. The Hedging Effectiveness of Treasuries Is Diminished, But Not Gone Completely One topic that has come up a lot recently in our client interactions is the idea that Treasury securities are no longer an effective hedge for equity portfolios. There are two possible reasons why this could be true. The first is that with Treasury yields so close to the zero-lower-bound there is very little scope for capital appreciation in bonds. The second is that Treasury yields may not respond to falling equity prices by declining, as they have in the past. We don’t currently see much evidence for the second reason. The only way that bond yields wouldn’t decline alongside a major equity sell-off is if that sell-off was driven by high and rising inflation and expectations that the Fed would aggressively hike rates to combat higher prices. Inflation is nowhere near high enough for this to be a concern. The first reason, however, could hold some water. To test it, we first looked at this year’s COVID-driven 34% drop in the S&P 500 that occurred between February 19th and March 23rd (Table 1). If an investor purchased a 5-year Treasury note on February 19th and sold it on March 23rd, they would have earned 5.21% on that trade, offsetting some portion of the equity decline. The same trade in a 30-year T-bond would have earned 16.65%. Long-maturity Treasuries still perform their role as hedging instruments for equity portfolios. But with starting bond yields much lower today, Treasuries may not offer the same protection. Table 2 shows how much an investor would earn if they bought a Treasury security today, held it for six months, and during that timeframe the entire spot yield curve fell to zero. We also show what returns would be earned if the yield curve shifted in the same way it did during the Feb 19th – Mar 23rd equity selloff, except we don’t let any yields fall into negative territory.2 Table 1Total Returns From Stock Market Peak (Feb. 19th) To Stock Market Through (Mar. 23rd)
Fed Purchases Won’t Stop Bond Yields From Rising
Fed Purchases Won’t Stop Bond Yields From Rising
Table 2Treasury Total Returns Over A Hypothetical 6-Month Period
Fed Purchases Won’t Stop Bond Yields From Rising
Fed Purchases Won’t Stop Bond Yields From Rising
Notice that projected returns for shorter maturities in Table 2 are significantly lower than the returns earned during the Feb 19th – Mar 23rd episode. A 5-year Treasury note will earn only 1.90% during the next six months if the entire yield curve falls to zero, this is well below the 5.21% earned in February and March. However, for maturities beyond 10 years, returns are similar between Table 1 and Table 2. This makes sense because, unlike the short-end, those long-dated yields are still fairly far from the zero bound. Bottom Line: Treasuries still perform their role as hedging instruments for equity portfolios, but investors now have to move further out the curve, and thus take more interest rate risk, to get the same protection they received from less-risky shorter-maturity notes in the past. US Economy: Digging Into Claims Chart 7Labor Market Update
Labor Market Update
Labor Market Update
Initial unemployment claims spooked some investors when the weekly number jumped to +898k two weeks ago, even as the consensus was calling for a small decline.3 But that spike was completely reversed last week, and a good chunk of it was actually revised out of the data. A delay in California’s reporting was one reason for the big swing. The state had failed to report claims data for two consecutive weeks at the beginning of the month. This meant that the national claims number was based on an assumed figure for the state. California resumed reporting last week and the result was a big drop in overall claims, back down to +787k. Stepping back from the large swings of the past two weeks, a good portion of which are statistical artifacts stemming from California’s reporting delay, we see that overall employment trends haven’t changed much. Initial claims have flattened-off since late-August, but continuing claims are still falling rapidly (Chart 7). This suggests that the unemployment rate will drop again next week when October’s employment report is released. The big question in next week’s employment report will be whether the decline in the unemployment rate is once again driven by falling temporary unemployment, or whether the number of permanently unemployed workers will reverse its uptrend (Chart 7, bottom panel). All in all, the labor market data continue to paint a picture of an economy that is recovering but that still has a very large output gap. In other words, the economy is a long way from generating meaningful inflationary pressure. Appendix A: Buy What The Fed Is Buying The Fed rolled out a number of aggressive lending facilities on March 23. These facilities focused on different specific sectors of the US bond market. The fact that the Fed has decided to support some parts of the market and not others has caused some traditional bond market correlations to break down. It has also led us to adopt of a strategy of “Buy What The Fed Is Buying”. That is, we favor those sectors that offer attractive spreads and that benefit from Fed support. The below Table tracks the performance of different bond sectors since the March 23 announcement. We will use this to monitor bond market correlations and evaluate our strategy’s success. Table 3Performance Since March 23 Announcement Of Emergency Fed Facilities
Fed Purchases Won’t Stop Bond Yields From Rising
Fed Purchases Won’t Stop Bond Yields From Rising
Ryan Swift US Bond Strategist rswift@bcaresearch.com Footnotes 1 Please see US Bond Strategy/Global Fixed Income Strategy Special Report, “Beware The Bond-Bearish Blue Sweep”, dated October 20, 2020, available at usbs.bcaresearch.com 2 Blank cells in Table 2 mean that returns are the same as in the “Spot Curve Falls To 0%” scenario. 3 Please see BCA Daily Insights, “Slowing US Labor Market Momentum: Investors Should Not Have Been Surprised”, dated October 15, 2020, available at din.bcaresearch.com Fixed Income Sector Performance Recommended Portfolio Specification
Highlights Global Duration: US Treasury yields have started to creep higher and the move is likely to continue in the coming months regardless of who wins the White House. Reduce overall global duration exposure to below-benchmark, focused on the US. Country Allocation: Based on our view that US Treasury yields have more upside, we are making the following changes to our recommended country allocations in the government bond portion of our model bond portfolio: downgrading the US to underweight, downgrading higher-beta Canada and Australia to neutral, and raising lower-beta Germany, France, Japan and the UK to overweight. Treasury-Bund Spread: We introduce a new trade in our Tactical Overlay to capitalize on our expectation of higher US bond yields and a wider Treasury-Bund spread: selling 10-year Treasury futures versus buying 10-year German bund futures. Feature In a Special Report jointly published last week with our colleagues at BCA Research US Bond Strategy, we laid out the case for why US Treasury yields have bottomed and should now begin to drift higher.1 We reached that conclusion for two reasons: 1) there will be a major US fiscal stimulus after the upcoming US election, especially so if Joe Biden becomes president and the Democrats take the Senate; and 2) the Fed’s shift to Average Inflation Targeting in late August represented the point of maximum Fed dovishness. The investment conclusions were to reduce duration exposure, while also downgrading our recommended allocation to US government bonds to underweight. We also advised cutting exposure to non-US government bond markets with relatively higher sensitivity to changes in US bond yields, while increasing allocations to countries with a lower “yield beta” to US Treasuries (Table 1). Table 1Updated GFIS Model Bond Portfolio Recommended Positioning
The Global Bond Implications Of Rising Treasury Yields
The Global Bond Implications Of Rising Treasury Yields
In this follow-up report, we will further discuss the implications of our changed view on US yields for non-US developed market government bonds. This includes specific adjustments to the recommended country allocations in our model bond portfolio, as well as a new tactical trade to profit from a move higher in US yields that will not to be matched in Europe. Our Recommended Overall Duration Stance: Now Below-Benchmark The case for a future cyclical bottoming of global yields has been building for the past few months, even as yields have remained range-bound at very low levels across the developed economies. Our Global Duration Indicator, comprised of economic sentiment measures and leading economic indicators, bottomed back in March and has soared sharply since then (Chart of the Week). Given the usual lead time between peaks and troughs of the Indicator and global bond yields - around nine months, on average – that suggests yields should bottom out sometime before year-end. Chart of the WeekA Cyclical, US-Led Bottoming Of Global Bond Yields
A Cyclical, US-Led Bottoming Of Global Bond Yields
A Cyclical, US-Led Bottoming Of Global Bond Yields
Chart 2UST Yields About To Break Out?
UST Yields About To Break Out?
UST Yields About To Break Out?
In the US, we now think we are past that point, as we discussed last week. The 10-year US Treasury yield has been drifting higher during the month of October and is now bumping up against its 200-day moving average of 0.83% (Chart 2). This is only the first such attempt at a trend breakout in yields, and such a move is unlikely prior to US Election Day - or, more accurately, “US Election Is Decided Day” which may not be November 3! The case for a future cyclical bottoming of global yields has been building for the past few months, even as yields have remained range-bound. Outside the US, however, momentum of bond yields and potential trend breakouts paint a more mixed picture. German and French bond yields remain stable and generally trendless, with Italian and Spanish yields continuing to grind lower. At the same time, yields in the UK, Canada and Australia have started to perk up but remain just below their 200-day moving averages. Bond yields have not responded to the sharp cyclical rebound across the developed world, with large gaps between elevated manufacturing PMIs and stagnant bond yields (Chart 3). Low inflation, ample spare economic capacity and dovish monetary policies are all playing a role, with bond markets not expecting an imminent inflation surge that could drive up yields and fuel expectations of tighter monetary policy. By way of contrast, China - where domestic services sectors have improved at a rapid pace from the COVID-19 recession and where the central bank is not running an overly accommodative monetary policy – has seen a more typical positive correlation between government bond yields and the rising manufacturing PMI over the past several months (Chart 4). This suggests that developed market bond yields can begin to normalize if the domestic services side of those economies emerges more forcefully from the lockdown-induced downturn. Chart 3A Wide Gap Between Growth & Yields
A Wide Gap Between Growth & Yields
A Wide Gap Between Growth & Yields
Chart 4Are Chinese Yields Sending A Message?
Are Chinese Yields Sending A Message?
Are Chinese Yields Sending A Message?
The news on that front is more optimistic in the US compared in Europe. The Markit services PMIs for the euro area and UK have all weakened over the past few months, with headline inflation rates flirting with deflation (Chart 5). Similar data in the US has trended in the opposite direction, with stronger US services activity with rising inflation. Chart 5Deflation Risks In Europe, Not The US
Deflation Risks In Europe, Not The US
Deflation Risks In Europe, Not The US
The pickup in new COVID-19 cases, and the degree of the response by governments to contain it, has been far stronger in Europe and the UK than in the US on a population-adjusted basis (Chart 6). Lockdowns have become more widespread across Europe to contain the second larger wave of the virus. The recent softer services PMI data in the euro area and UK are a reflection of those greater economic restrictions and weaker confidence. This gap between the US economy and non-US economies is only magnified by the fiscal stimulus measures proposed by both US presidential candidates. In the US, governments have been far less willing to implement politically unpopular restrictions in an election year, while lockdown-weary consumers have been more willing to go about their lives rather than stay sheltered at home. The result is a healthier tone to the US data compared to other countries, even with the number of new US cases on the rise again. This gap between the US economy and non-US economies is only magnified by the fiscal stimulus measures proposed by both US presidential candidates. As we discussed in last week’s Special Report, both the Biden and Trump platforms are calling for major fiscal stimulus – between $5-6 trillion over the next decade, including tax changes – although the Biden plan has much more front-loaded direct government spending, only partially offset by tax increases, if fully implemented. This is the “Blue Sweep” scenario, with a Biden victory and Democratic Party control of the US Congress, that is most bearish for US Treasuries, as the outcome would eventually help reduce the expected 2021 US fiscal drag of -7.2% of GDP as estimated by the latest IMF Fiscal Monitor (Chart 7). Even a re-elected Trump, however, would also mean more US fiscal stimulus, although with a mix of tax cuts and spending increases. Chart 6The Latest COVID-19 Wave Is Hitting Europe Harder
The Latest COVID-19 Wave Is Hitting Europe Harder
The Latest COVID-19 Wave Is Hitting Europe Harder
Combined with an improving services sector and rising inflation, this puts the US in a much different economic position than the major economies of Europe. Chart 7Post-Election US Stimulus Will Offset Fiscal Drag
Post-Election US Stimulus Will Offset Fiscal Drag
Post-Election US Stimulus Will Offset Fiscal Drag
There, the IMF is also projecting some fiscal drag in 2021, but now with a much less healthy domestic economy due to the COVID-19 surge and where inflation is already near 0%. Our decision to reduce our recommended overall global duration stance to below-benchmark is largely driven by trends in the US that are more bond-bearish than in the rest of the developed world. There will likely be another round of fiscal measures to help combat virus-stricken economies in Europe and elsewhere, but the US election is bringing the issue to the forefront more quickly. In other words, the US will get a more bond-bearish fiscal stimulus before Europe does. Bottom Line: US Treasury yields have started to creep higher and the move is likely to continue in the coming months regardless of who wins the White House. Reduce overall global duration exposure to below-benchmark, focused on the US. Our Recommended Country Allocation: Downgrade US, Upgrade Lower-Beta Countries Net-net, our decision to reduce our recommended overall global duration stance to below-benchmark is largely driven by trends in the US that are more bond-bearish than in the rest of the developed world. This also has implications for our recommend country allocation in our model bond portfolio. First, are downgrading our recommended US Treasury allocation to underweight. We are also increasing our desired weighting in countries where government bond yields are less sensitive to changes in US Treasury yields – especially during periods when the latter are rising. We call this “upside yield beta”. The countries that have the highest such beta to US Treasuries are Canada, Australia and New Zealand, making them downgrade candidates (Chart 8). Similarly, lower upside beta countries like Germany, France, Japan and the UK are upgrade possibilities. Chart 8Favor Countries With Lower Yield Betas To USTs
Favor Countries With Lower Yield Betas To USTs
Favor Countries With Lower Yield Betas To USTs
Already, we are seeing the widening of yield spreads between US Treasuries and non-US government markets – with more to come as US Treasuries grind higher over the next 6-12 months. We see the greatest upside for spreads between the US and the low upside yield beta countries – that means wider spreads for US-Germany, US-France, US-Japan and US-UK (Chart 9). Chart 9Expect More Underperformance From USTs
Expect More Underperformance From USTs
Expect More Underperformance From USTs
Chart 10Fed QE Momentum Peaking, Unlike Other CBs
Fed QE Momentum Peaking, Unlike Other CBs
Fed QE Momentum Peaking, Unlike Other CBs
Thus, this week are making significant changes to our strategic government bond country allocations (see page 15), as well as the country weightings in our model bond portfolio (see pages 13-14), based on our new view on US bond yields and non-US yield betas. Specifically, we are not only cutting our recommended US weighting to underweight, but we are also downgrading Canada and Australia from overweight to neutral. On the other side, we are upgrading UK Gilts to overweight from neutral, while also upgrading Germany, France and Japan to overweight. Importantly, we are maintaining our overweight stance on Italian and Spanish sovereign debt, as those markets are supported by greater European fiscal policy integration in the world of COVID-19 and, just as importantly, large-scale ECB asset purchases. More generally, the relative “aggressiveness” of central bank quantitative easing (QE) does play a role in our recommended country allocation. We expect the Fed to be more tolerant of higher Treasury yields if the move is driven by improving US growth and/or greater US fiscal stimulus – as long as the higher yields were not having a negative impact on equity or credit markets. We expect the Fed to be more tolerant of higher Treasury yields if the move is driven by improving US growth and/or greater US fiscal stimulus – as long as the higher yields were not having a negative impact on equity or credit markets. This means less expected QE buying of Treasuries by the Fed. Conversely, given how aggressive the Reserve Bank of Australia and Bank of Canada have been with expanding their balance sheet via QE (Chart 10), this makes us reluctant to shift to the underweight stance on those countries implied by their high beta to rising US Treasury yields. Therefore, we are only downgrading those two countries to neutral. Bottom Line: Based on our view that US Treasury yields have more upside, we are making the following changes to our recommended country allocations in the government bond portion of our model bond portfolio: downgrading the US to underweight, downgrading higher-beta Canada and Australia to neutral, and raising lower-beta Germany, France, Japan and the UK to overweight. A New Tactical Trade: A UST-Bund Spread Widener Using Futures This week, we are also introducing a new recommended trade in our Tactical Overlay portfolio on page 16 to take advantage of our view on US bond yields: a 10-year US-Germany spread widening trade using government bond futures. Chart 11A Tactical Opportunity For A Wider UST-Bund Spread
A Tactical Opportunity For A Wider UST-Bund Spread
A Tactical Opportunity For A Wider UST-Bund Spread
This trade makes sense for several reasons: Germany has one of the lowest yield betas to US Treasuries during periods when the latter is rising, as shown earlier. Our US Treasury-German Bund fundamental fair value spread model – which uses relative policy interest rates, unemployment and inflation between the US and the euro area as inputs - suggests that the spread is now far too tight after the massive rally in US Treasuries in 2020 (Chart 11). The main reason why the spread looks so “expensive” is that the underlying fair value has risen with US inflation rising and euro area inflation falling (Chart 12, bottom panel). The UST-Bund yield differential is not stretched from a technical perspective, when looking at deviations of the spread from its 200-day moving average or the 26-week change in the spread; both measures suggest room for additional spread widening before reaching historical extremes (Chart 13). Also, duration positioning by US fixed income investors is only around neutral, according to the JP Morgan duration survey, suggesting scope to push yields higher if bond investors become more defensive. Chart 12Inflation Differentials Justify A Wider UST-Bund Spread
Inflation Differentials Justify A Wider UST-Bund Spread
Inflation Differentials Justify A Wider UST-Bund Spread
Chart 13Technical Trends Favor A Wider UST-Bund Spread
Technical Trends Favor A Wider UST-Bund Spread
Technical Trends Favor A Wider UST-Bund Spread
As a reference, we are initiating this trade with the cash bond 10-year US-Germany spread at +138bps, with a target range of +170-190bps over the 0-6 month horizon we maintain for our Tactical Overlay positions. Bottom Line: We introduce a new trade in our Tactical Overlay to capitalize on our expectation of higher US bond yields and a wider Treasury-Bund spread: selling 10-year Treasury futures versus buying 10-year German bund futures. Robert Robis, CFA Chief Fixed Income Strategist rrobis@bcaresearch.com Footnotes 1 Please see BCA Research US Bond Strategy Special Report, "Beware The Bond-Bearish Blue Sweep", dated October 20, 2020, available at usbs.bcaresearch.com and gfis.bcaresearch.com. Recommendations The GFIS Recommended Portfolio Vs. The Custom Benchmark Index
The Global Bond Implications Of Rising Treasury Yields
The Global Bond Implications Of Rising Treasury Yields
Duration Regional Allocation Spread Product Tactical Trades Yields & Returns Global Bond Yields Historical Returns
Highlights Under the newly released deleveraging policies, Chinese real estate developers have no choice but to deleverage. Over the next six months, the most likely scenario will be moderate growth in property sales, starts and completions, but a drop in land purchases. We expect Chinese onshore and offshore property stocks to continue underperforming their respective benchmarks. However, we recommend buying Chinese property developers’ offshore corporate bonds. Feature The country’s real estate sector has exhibited clear signs of improvement. As both commodity buildings’ floor space starts and sales showed four consecutive months of year-on-year growth, Chinese real estate investment has returned to its pre-pandemic annual rate of acceleration (Chart 1). In addition, our broad measures of Chinese real estate construction activity – the “building construction” floor area starts and completions – have also rebounded sharply (Chart 2). Chart 1Chinese Property Market: A Sustainable Recovery Ahead?
Chinese Property Market: A Sustainable Recovery Ahead?
Chinese Property Market: A Sustainable Recovery Ahead?
Chart 2Sharp Rebound In Post-Pandemic Construction Activity
Sharp Rebound In Post-Pandemic Construction Activity
Sharp Rebound In Post-Pandemic Construction Activity
One driving force behind the real estate sector’s recovery was that China loosened up its monetary policy and implemented fiscal stimulus earlier this year. However, since July, the government has implemented a flurry of restrictive policies to clamp down on flows of capital into the real estate sector, and has repeatedly stressed the mantra: “Houses are for living in, not for speculation.” Most importantly, in late August the government released a framework mandating Chinese property developers to deleverage. As Chinese homebuilders have no choice but to reduce their debt load, will the property market recovery continue? Chart 3Constrained Financing May Lead To A Drop In Land Sales Going Forward
Constrained Financing May Lead To A Drop In Land Sales Going Forward
Constrained Financing May Lead To A Drop In Land Sales Going Forward
Over the next six months, we expect a 4-6% year-on-year growth in property sales. The government-set deleveraging mandate will likely result in considerable property sales promotion by real estate developers. In the meantime, faced with constrained financing, homebuilders may prioritize completion of already sold but unfinished buildings over land investment (Chart 3). This may result in a moderate pickup in construction activity, but a drop in profit margins and land sales. Beyond the next six months, property sales in China will likely struggle to grow, as price discounts may not be enough to outweigh demand headwinds. In turn, construction activity may falter, as the government-led deleveraging mandate and weakening sales will curtail the cash flow to homebuilders. Mandated Deleveraging Chart 4Property Developers Will Have No Choice But To Deleverage
Property Developers Will Have No Choice But To Deleverage
Property Developers Will Have No Choice But To Deleverage
The Chinese real estate sector is highly indebted. According to the National Bureau of Statistics of China, the sector’s total liability-to-asset ratio rose to 80%, and its debt-to-equity ratio was at 4.1 by the end of last year (Chart 4). Policymakers in Beijing well recognize that excesses in the property market in general, and leverage among property developers in particular, constitute a major risk to financial stability. As part of the strategy to establish a long-term, sustainable mechanism for the real estate sector, the Chinese central bank and the housing ministry issued a framework – essentially a deleveraging mandate for Chinese property developers. This framework includes Three Red Lines and Four Tiers. Three Red Lines There will be a 70% ceiling on liabilities to assets, excluding advanced payments from presold houses; The net debt-to-equity ratio needs to be less than 100%; Short-term borrowings cannot exceed cash reserves. Four Tiers Companies that exceed all three red lines are placed into the red tier, while those passing any two of the three red lines are in the orange tier and enterprises that cross one of the three lines are in the yellow tier. Firms with financials within the three red lines are classified in the green tier. The government is using these debt tiers to control which firms will have access to new financing and how much new financing they can apply for. Failing to meet all three “red lines” (i.e., the red tier) may result in them being cut off from access to new loans from banks. If a firm passes all three red lines (i.e., the green tier), it can increase its debt up to a maximum of 15% in the next year. If it is in the yellow or orange tier, it can increase its debt up to a maximum of 10% and 5% in the following year, respectively (Table 1). Table 1The Mandated Deleveraging Framework: Three Red Lines And Four Tiers
China: The Implications Of Deleveraging By Property Developers
China: The Implications Of Deleveraging By Property Developers
Enterprises that break all three red lines are required to submit a report on their debt-reduction plan, listing their planned deleveraging measures to reduce the number of red-line breaches within one year, as well as the planned measures to reach the green tier within three years. Based on the 2020 mid-year data released by 100 major public-traded property-developing companies listed as either A-shares or H-shares, 86% of them are breaking at least one of the red lines, 22% of them are breaching all three red lines and only 14% of them are in the green tier. Bottom Line: Chinese home developers are set to embark on the deleveraging path due to the new regulation. This will limit their access to financing and has implications for their activity and, thereby, the overall economy. What Does This Mean? Property development is an asset-heavy and capital-intensive business, and this industry typically relies a lot on debt. Chart 5Chinese Real Estate Investment: A Breakdown Of Funding Source
China: The Implications Of Deleveraging By Property Developers
China: The Implications Of Deleveraging By Property Developers
There are several ways for homebuilders to finance themselves. Chart 5 shows the breakdown of the source of Chinese real estate investment funding, with 15.5% of the total funding from domestic and foreign loans, 32% from a self-raising fund through issuances of bonds or equity, 33.2% from deposits and advanced payments, and 16.2% from homebuyers’ mortgages. With limited financing from the loan and bond markets, the country’s real estate developers will have to seek more financing from deposits and advanced payments, homebuyers’ mortgages and equity issuances. Chart 6Property Developers Need To Boost Their Sales To Raise More Cash
Property Developers Need To Boost Their Sales To Raise More Cash
Property Developers Need To Boost Their Sales To Raise More Cash
As equity issuance dilutes existing shareholders' profits and drives down share prices, developers often opt for presales to raise financing, i.e., they pre-sell more properties to increase their revenue from deposits and advanced payment, as well as mortgages (Chart 6). Hence, in the short term, i.e., over the next six months, many property developers may need to cut home prices to boost their sales and shore up cash for their operations. For example, the country’s biggest real estate developer – Evergrande – falls short on all three metrics and lies in the red tier. The company announced in early September that it would do aggressive sales of properties by lowering the selling prices for all types of properties by 30% across the country during the period of September 7 to October 8. Indeed, the company’s sales reached a record high for this period. The aggressive sales promotion of properties will encourage demand. We expect the year-on-year growth of floor space sales to reach 4-6% over the next six months – an acceleration from 1.3% during the pre-pandemic period of 2H2019, but a moderation from the 6.4% growth in the post-pandemic months (Chart 7). Beyond the next six months, home sales may struggle to grow as the impact from price discounts diminishes and demand will face the following headwinds: The authorities continued to show their determination to crack down on speculative housing demand. Stricter policies, including tighter restrictions on both first and second home purchases and mortgage applications, as well as raising the down payment ratio, have been implemented recently in cities experiencing a rapid rise in property prices, such as Shenzhen, Hangzhou, Tangshan, Zhengzhou and many other cities. The government also set new bank lending regulations to the real estate sector; new bank loans issued to the real estate sector, measured as a share of total new bank loans, should be kept under 30% of total banks’ loans (Chart 8). The ratio has declined to the current 25% from 30-50% in the past four years. We believe the ratio will remain below 30% over the next six to twelve months. Chart 7Chinese Property Sales, Starts And Completions Will Grow Moderately In Coming Months
Chinese Property Sales, Starts And Completions Will Grow Moderately In Coming Months
Chinese Property Sales, Starts And Completions Will Grow Moderately In Coming Months
Chart 8Constrained Lending To Chinese Real Estate Sector From Banks
Constrained Lending To Chinese Real Estate Sector From Banks
Constrained Lending To Chinese Real Estate Sector From Banks
Lending to the real estate sector includes housing mortgages and loans for real estate development. The capped bank loans to the property sector suggests that tighter lending standards will be applied to mortgage loans as well as property development loans. This will likely curb demand for housing. The authorities stopped the Pledged Supplementary Lending (PSL) program in 2020. The PSL was a driving force behind property demand in China during 2015-2018, but this time the government has refrained from PSL injections. The government-subsidized shantytown renovation program (e.g., adding elevators, building parking spots, painting interior and exterior walls, paving roads, etc.) will reduce demand for new properties. With improved living conditions, some households may not need to buy new properties. The government’s renovation project covers 7 million houses this year, of which 76.4% (5.4 million) were completed during the first eight months of this year. Moreover, a renovation project of a similar scale will be implemented next year. The government’s active promotion of rental housing will also reduce the demand for new housing. Rental prices have been falling due to the pandemic, and that may delay home buyers from purchasing residential properties. Chart 9Chinese Property Demand Faces Structural Headwinds
Chinese Property Demand Faces Structural Headwinds
Chinese Property Demand Faces Structural Headwinds
The Chinese property market also faces strong structural headwinds. For example, property demand in China has already entered a saturation phase, and the working-age population (15-64 years of age) is shrinking (Chart 9). What about the outlook of property starts and completions? Constrained net borrowing will weigh on floor space starts and floor space completions. As such, we only expect moderate growth (i.e., smaller than 5%) in both property starts and completions over the next six months (Chart 7 on page 6). With constrained financing, homebuilders may have to allocate an increasing amount of funding to complete their unfinished projects instead of purchasing new land (Chart 3 on page 2). The pace of property completion has to catch up with both sales and starts. Property developers are currently under increased pressure to deliver units that were pre-sold about two years ago (Chart 10). Rising property sales will provide more financing for the developers to complete these projects under construction. The moderate growth in floor space starts and completions will lift construction activity slightly in the commodity buildings market (Chart 11). Chart 10Homebuilders Need To Deliver Their Unfinished Projects
Homebuilders Need To Deliver Their Unfinished Projects
Homebuilders Need To Deliver Their Unfinished Projects
Chart 11Construction Activity In China: Moderate Increase Ahead
Construction Activity In China: Moderate Increase Ahead
Construction Activity In China: Moderate Increase Ahead
That said, construction activity may relapse beyond the next six months. Both the enduring government-led deleveraging mandate and weakening sales will lead to funding shortages for Chinese homebuilders to carry on new construction projects. Bottom Line: Floor space sales, starts and completions will expand moderately despite the mandated deleveraging of developers in the next six months. Investment Implications First, it is reasonable to expect a moderate pickup in real estate construction activity in China over the next six months. This will be marginally positive for construction-related commodities demand. Chart 12Commodity Prices: Hold A Neutral Stance For Now
Commodity Prices: Hold A Neutral Stance For Now
Commodity Prices: Hold A Neutral Stance For Now
However, commodity prices have already rebounded sharply since April, and China's infrastructure-related construction activities usually peak in October. Therefore, a marginal increase in commodity demand from the real estate sector is not a catalyst for further price increases in commodities such as steel, cement, and glass. For now, we prefer to hold a neutral stance on these commodities (Chart 12). Beyond six months, the possibility of negative growth in home sales, starts and construction is rising, raising warning signs for construction-related commodities demand. Second, property developers may cut their land purchases in order to allocate more funds to completing unfinished homes. This heralds that a drop in the local government’s revenue may lie ahead. This will have ramifications for their spending in 2H2021. Third, regarding property stocks, they have been moving sideways in absolute terms this year, having significantly underperformed the benchmark (Charts 13 and 14). This reflects their poor profit growth prospects and weak financial fundamentals. We expect the Chinese property stocks to continue to underperform their benchmark, as the aggressive selling strategy will reduce companies’ profit margins. Chart 13Chinese Property Stocks: A Tapering Wedge In Absolute Terms, And…
Chinese Property Stocks: A Tapering Wedge In Absolute Terms, And...
Chinese Property Stocks: A Tapering Wedge In Absolute Terms, And...
Chart 14…Continuing Underperformances Relative To Their Respective Benchmarks
...Continuing Underperformances Relative To Their Respective Benchmarks
...Continuing Underperformances Relative To Their Respective Benchmarks
Lastly, we recommend buying Chinese offshore real estate bonds, as moderate growth recovery in the country’s real estate sector and deleveraging will lead to a narrowing of the sector’s corporate spread. In addition, the ongoing global search for yields will intensify the demand for high-yield bonds. Ellen JingYuan He Associate Vice President ellenj@bcaresearch.com Cyclical Investment Stance Equity Sector Recommendations
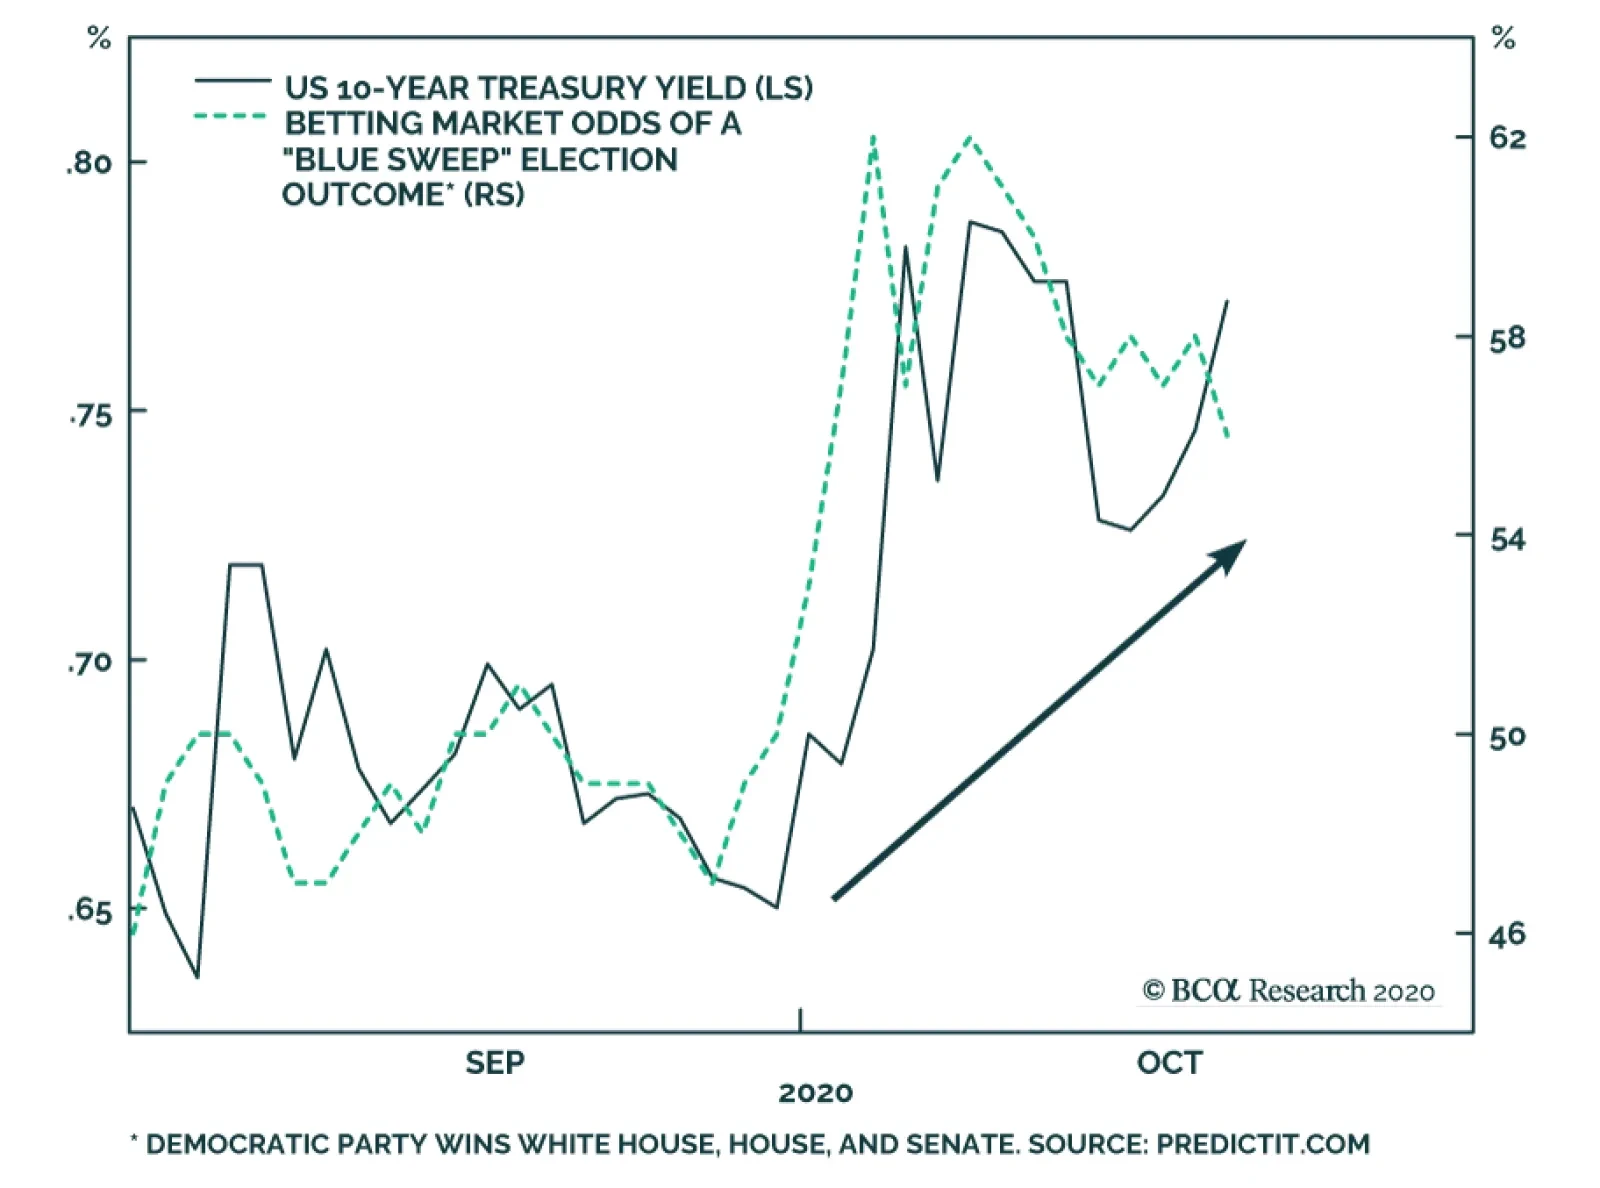
BCA Research's Global Fixed Income Strategy & US Bond Strategy services estimate that the combined probability of scenarios that will put upward pressure on US Treasury yields is 80%, versus a 20% probability of a more bond-neutral outcome. That is a…
Highlights US Election & Duration: We estimate that there is an 80% probability of a US election result that will give a lift to US Treasury yields via increased fiscal stimulus. Those are strong enough odds to justify a move to a below-benchmark cyclical US duration stance on a 6-12 month horizon. US Treasuries: We anticipate a moderate bear market in US Treasuries to unfold during the next 6-12 months. In addition to below-benchmark portfolio duration, investors should overweight TIPS versus nominal Treasuries, hold nominal and real yield curve steepeners, and hold inflation curve flatteners. Non-US Country Allocation: Within global government bond portfolios, downgrade the US to underweight. Favor countries that have lower sensitivity to rising US Treasury yields with central banks that are likely to be more dovish than the Fed in the next few years. That means increasing allocations to core Europe and Japan, while reducing exposure to Canada and Australia. Stay neutral on the UK given the near-term uncertainties over the final Brexit outcome. Feature With the US presidential election just two weeks away, public opinion polls continue to show that Joe Biden is the favorite to win the White House. However, the odds of a “Blue Sweep” - combining a Biden victory with the Democratic Party winning control of both the US Senate and House of Representatives - have increased since the end of September according to online prediction markets. US Treasury yields have also moved higher over that same period (Chart 1), which we interpret as the bond market becoming more sensitive to the likelihood of a major increase in US government spending under single-party Democratic control. Chart 1A Blue Sweep Is Bond Bearish
A Blue Sweep Is Bond Bearish
A Blue Sweep Is Bond Bearish
According to a recent analysis done by the Committee for a Responsible Federal Budget, President Trump’s formal policy proposals would increase US federal debt by $4.95 trillion between 2021 and 2030, while Biden’s plan would increase the debt by $5.60 trillion (Table 1).1 While those are both massive fiscal stimulus plans, there is a stark difference in the policy mix of their proposals that matters for the future path of US bond yields. Table 1A Comparison Of The Candidates' Budget Proposals
Beware The Bond-Bearish Blue Sweep
Beware The Bond-Bearish Blue Sweep
Under Biden, spending is projected to increase by a cumulative $11.1 trillion, partially offset by $5.8 trillion in revenue increases and savings with the former vice-president calling for tax hikes on corporations and high-income earners. On the other hand, Trump’s plan includes $5.45 trillion of spending increases and tax cuts over the next decade, offset by $0.75 trillion in savings. Conclusion: Biden would increase spending by over twice that of a re-elected Trump, with much of that spending expected to be front-loaded in the early part of his first term. Outright spending is more reflationary than tax cuts because it puts more money in the pockets of consumers (spenders) relative to producers (savers). The Biden plan would be more stimulating for overall activity even if the increase in debt is about the same. Another analysis of the Biden and Trump platforms was conducted by Moody’s in September, based on estimates of how much of each candidate’s promises could be successfully implemented under different combinations of White House and Congressional control.2 The stimulus figures were run through the Moody’s US economic model, which is similar to the budget scoring model of the US Congressional Budget Office, to produce a year-by-year path for the US economy over the next decade (Chart 2). Chart 2The Biden Platform Is Highly Stimulative
The Biden Platform Is Highly Stimulative
The Biden Platform Is Highly Stimulative
Moody’s concluded that the US economy would return to full employment in the second half of 2022 under a President Biden – especially if the Democrats win the Senate - compared to the first half of 2024 under a re-elected President Trump. Such a rapid closing of the deep US output gap that opened up because of the COVID-19 recession would likely trigger a reassessment of the Fed’s current highly dovish policy stance. The US output gap would close more rapidly under a President Biden, likely triggering a reassessment of the Fed’s current highly dovish policy stance. At the moment, the US overnight index swap (OIS) curve discounts one full 25bp Fed hike by late 2023/early 2024, and two full hikes by late 2024/early 2025 (Chart 3). This pricing of the future path of interest rates has occurred even with the Fed promising to keep the funds rate anchored near 0% until at least the end of 2023. The likelihood of some form of increased fiscal spending after the election will cause the bond market to challenge the Fed’s current forward guidance even more, putting upward pressure on Treasury yields. Chart 3US Fiscal Stimulus Will Pull Forward Fed Liftoff
US Fiscal Stimulus Will Pull Forward Fed Liftoff
US Fiscal Stimulus Will Pull Forward Fed Liftoff
Our colleagues at BCA Geopolitical Strategy see a Blue Sweep as the most likely outcome of the US election, although their forecasting models suggest that the race for control of the Senate will be much closer than the Biden vs Trump battle (there is little chance that control of the House of Representatives would switch back to the Republicans).3 Their scenarios for each of the White House/Senate combinations, along with their own estimated probability for each, are the following: Biden wins in a Democratic sweep: BCA probability = 45%. The US economy will benefit from higher odds of unfettered fiscal stimulus in 2021, although financial markets will simultaneously have to adjust for the negative shock to US corporate earnings from higher taxes and regulation. Government bond yields should rise on the generally reflationary agenda. Trump wins with a Republican Senate: BCA probability = 30%. In this status quo scenario, a re-elected President Trump would still face opposition from House Democrats on most domestic economic issues, forcing him to tilt towards more protectionist foreign and trade policies in his second term. Fiscal stimulus would be easy to agree, though not as large as under a Democratic sweep. US Treasury yields would rise, but would later prove volatile due to the risk to the cyclical recovery from a global trade war, as Trump’s tariffs will not be limited to China and could even affect the European Union. Biden wins with the Senate staying Republican: BCA probability = 20%. This is ultimately the most positive outcome for financial markets - reduced odds of a full-blown trade war with China, combined with no new tax hikes. Bond yields would drift upward over time, but not during the occasional fiscal battles that would ensue between the Democratic president and Republican senators. The first such battle would start right after the election. Treasuries would remain well bid until financial market pressures forced a Senate compromise with the new president sometime in H1 2021. Trump wins with a Democratic Senate: BCA probability = 5%. This is the least likely scenario but one that could produce a big positive fiscal impulse. Trump is a big spender and will veto tax hikes, but will approve populist spending on areas where he agrees. The Democratic Senate would not resist Trump’s tough stance on China, however, thus keeping the risk of US-China trade skirmishes elevated. This is neutral-to-bearish for US Treasuries, depending on the size of any bipartisan stimulus measures and Trump’s trade actions. The key takeaway is that the combined probability of scenarios that will put upward pressure on US Treasury yields is 80%, versus a 20% probability of a more bond-neutral outcome. That is a bond-bearish skew worth positioning for by reducing US duration exposure now, ahead of the November 3 election. Of this 80%, 35 percentage points come from scenarios in which President Trump would remain in power. Hence his trade wars would eventually undercut his reflationary fiscal policy. This would become the key risk to the short duration view after the initial market response. Bottom Line: The most likely scenarios for the US election will give a cyclical lift to US Treasury yields via increased fiscal stimulus. This justifies a move to a below-benchmark US duration stance on a 6-12 month horizon. If Trump is re-elected, the timing of Trump’s likely return to using broad-based tariffs will have to be monitored closely. A Moderate Bear Market Chart 4Less Election-Day Upside Than In 2016
Less Election-Day Upside Than In 2016
Less Election-Day Upside Than In 2016
While our anticipated Blue Sweep election outcome will lead to a large amount of fiscal spending in 2021 and beyond, we anticipate only a modest increase in bond yields during the next 6-12 months. In terms of strategy, our recommended reduction in portfolio duration reflects the fact that fiscal largesse meaningfully reduces the risk of another significant downleg in bond yields and strengthens our conviction in a moderate bear market scenario for bonds. This does raise the question of how large an increase in US Treasury yields we expect during the next 6-12 months. We turn to this question now. Not Like 2016 First, we do not expect a massive election night bond rout like we saw in 2016 (Chart 4). For one thing, the Fed was much more eager to tighten policy in 2016 than it is today, and it did deliver a rate hike one month after the Republicans won the House, Senate and White House (Chart 4, bottom panel). This time around, the Fed has made it clear that it will wait until inflation is running above its 2% target before lifting rates off the zero bound and will not respond directly to expectations for greater fiscal stimulus. A complete re-convergence to long-run fed funds rate estimates would impart 80 – 100 bps of upward pressure to the 5-year/5-year forward Treasury yield. Second, 2016’s election result was mostly unanticipated. This led to a dramatic adjustment in market prices once the results came in. The PredictIt betting market odds of a “Red Sweep” by the Republicans in 2016 were only 16% the night before the election. As of today, the betting markets are priced for a 58% chance of a Blue Sweep in 2020. Unlike in 2016, bonds are presumably already partially priced for the most bond-bearish election outcome. A Slow Return To Equilibrium To more directly answer the question of how high bond yields can rise, survey estimates of the long-run (or equilibrium) federal funds rate provide a useful starting point. In a world where the economy is growing at an above-trend pace and inflation is expected to move towards the Fed’s target, it is logical for long-maturity Treasury yields to settle near estimates of the long-run fed funds rate. Indeed, this theory is borne out empirically. During the last two periods of robust global economic growth (2017/18 & 2013/14), the 5-year/5-year forward Treasury yield peaked around levels consistent with long-run fed funds rate estimates (Chart 5). As of today, the median estimates of the long-run fed funds rate from the New York Fed’s Survey of Market Participants and Survey of Primary Dealers are 2% and 2.25%, respectively. In other words, a complete re-convergence to these equilibrium levels would impart 80 – 100 bps of upward pressure to the 5-year/5-year forward Treasury yield. We expect this re-convergence to play out eventually, but probably not within the next 6-12 months. In both prior periods when the 5-year/5-year forward Treasury yield reached these equilibrium levels, the Fed’s reaction function was much more hawkish. The Fed was hiking rates throughout 2017 & 2018 (Chart 5, panel 4), and the market moved quickly to price in rate hikes in 2013 (Chart 5, bottom panel). The Fed’s new dovish messaging will ensure that the market reacts less quickly this time around. Also, continued curve steepening will mean that the 5-year/5-year forward yield’s 80 – 100 bps of upside will translate into significantly less upside for the benchmark 10-year yield. The 10-year yield and 5-year/5-year forward yield peaked at similar levels in 2017/18 when the Fed was lifting rates and the yield curve was flat (Chart 6). But, the 10-year peaked far below the 5-year/5-year yield in 2013/14 when the Fed stayed on hold and the curve steepened. Chart 5How High For Treasury Yields?
How High For Treasury Yields?
How High For Treasury Yields?
Chart 6Less Upside In 10yr Than In 5y5y
Less Upside In 10yr Than In 5y5y
Less Upside In 10yr Than In 5y5y
The next bear move in bonds will look much more like 2013/14. The Fed will keep a firm grip over the front-end of the curve, leading to curve steepening and less upside in the 10-year Treasury yield than in the 5-year/5-year forward. In addition to shifting to a below-benchmark duration stance, investors should maintain exposure to nominal yield curve steepeners. Specifically, we recommend buying the 5-year note versus a duration-matched barbell consisting of the 2-year and 10-year notes (Chart 6, bottom panel).4 TIPS Versus Nominals We have seen that a full re-convergence to “equilibrium” implies 80 – 100 bps of upside in the 5-year/5-year forward nominal Treasury yield. Bringing TIPS into the equation, we have also observed that long-maturity (5-year/5-year forward and 10-year) TIPS breakeven inflation rates tend to settle into a range of 2.3 – 2.5 percent when inflation is well-anchored and close to the Fed’s target (Chart 7). The additional fiscal stimulus that will follow a Blue Sweep election makes it much more likely that the economic recovery will stay on course, leading to an eventual return of inflation to target and of long-maturity TIPS breakeven inflation rates to a 2.3 – 2.5 percent range. However, as with nominal yields, this re-convergence will be a long process whose pace will be dictated by the actual inflation data. To underscore that point, consider that our Adaptive Expectations Model of the 10-year TIPS breakeven inflation rate – a model that is driven by trends in the actual inflation data – has the 10-year breakeven rate as close to fair value (Chart 8).5 This fair value will rise only slowly over time, alongside increases in actual inflation. Chart 7Overweight TIPS Versus Nominals
Overweight TIPS Versus Nominals
Overweight TIPS Versus Nominals
Chart 8Real Yields Have Likely Bottomed
Real Yields Have Likely Bottomed
Real Yields Have Likely Bottomed
All in all, we continue to recommend an overweight allocation to TIPS versus nominal Treasuries. TIPS breakeven inflation rates will move higher during the next 6-12 months, but are unlikely to reach our 2.3 – 2.5 percent target range within that timeframe. TIPS In Absolute Terms As stated above, we expect nominal yields to increase more than real yields during the next 6-12 months, but what about the absolute direction of real (aka TIPS) yields? Here, our sense is that real yields have also bottomed. If we consider the extreme scenario where the 5-year/5-year forward nominal yield returns to its equilibrium level and where long-maturity TIPS breakeven inflation rates return to our target range, it implies about 80 bps of upside in the nominal yield and 40 bps of upside in the breakeven. This means that the 5-year/5-year real yield has about 40 bps of upside in a complete “return to equilibrium” scenario. While we don’t expect this “return to equilibrium” to be completed within the next 6-12 months, the process is probably underway. The only way for real yields to keep falling in this reflationary world is for the Fed to become increasingly dovish, even as growth improves and inflation rises. After its recent shift to an average inflation target, our best guess is that Fed rate guidance won’t get any more dovish from here. Real yields fell sharply this year as the market priced in this change in the Fed’s reaction function, but the late-August announcement of the Fed’s new framework will probably mark the bottom in real yields (Chart 8, bottom panel).6 Two More Curve Trades Chart 9Own Inflation Curve Flatteners And Real Curve Steepeners
Own Inflation Curve Flatteners And Real Curve Steepeners
Own Inflation Curve Flatteners And Real Curve Steepeners
In addition to moving to below-benchmark duration, maintaining nominal yield curve steepeners and staying overweight TIPS versus nominal Treasuries, there are two additional trades that investors should consider in order to profit from the reflationary economic environment. The first is inflation curve flatteners. The cost of short-maturity inflation protection is below the cost of long-maturity inflation protection, meaning that it has further to run as inflation returns to the Fed’s target (Chart 9). In addition, if the Fed eventually succeeds in achieving a temporary overshoot of its inflation target, then we should expect the inflation curve to invert. Real yield curve steepeners are in some ways the mirror image of inflation curve flatteners. Assuming no change in nominal yields, the real yield curve will steepen as the inflation curve flattens. But what makes real yield curve steepeners look even more attractive is that increases in nominal yields during the next 6-12 months will be concentrated in long-maturities. This will impart even more steepening pressure to the real yield curve. Investors should continue to hold inflation curve flatteners and real yield curve steepeners. Bottom Line: We anticipate a moderate bear market in US Treasuries to unfold during the next 6-12 months. In addition to below-benchmark portfolio duration, investors should overweight TIPS versus nominal Treasuries, hold nominal and real yield curve steepeners, and hold inflation curve flatteners. Non-US Government Bonds: Reduce Exposure To US Treasuries The mildly bearish case for US Treasuries that we have laid out above not only matters for our recommended duration stance, but also for our suggested country allocation within global government bond portfolios. Simply put, the risk of rising bond yields is much higher in the US than elsewhere, both for the immediate post-election period but also over the medium-term. Thus, the immediate obvious portfolio decision is to downgrade US Treasuries to underweight. The move higher in US Treasury yields that we expect is strictly related to spillovers from likely US fiscal stimulus. While other countries in the developed world are contemplating the need for additional fiscal measures, particularly in Europe where there is a renewed surge in coronavirus infections and growing economic restrictions, no country is facing as sharp a policy choice as the US with its upcoming election. The Fed has purchased 57% of all US Treasuries issued since late February of this year, in sharp contrast to the ECB and Bank of Japan that have purchased over 70% of euro area government bonds and JGBs issued. We can say with a fair degree of certainty that the US will have a relatively more stimulative fiscal policy stance than other developed economies over at least the next couple of years. This implies a higher relative growth trajectory for the US that hurts Treasuries more on the margin than non-US government debt. Chart 10The Fed Will Gladly Trade Less QE For More Fiscal Stimulus
Beware The Bond-Bearish Blue Sweep
Beware The Bond-Bearish Blue Sweep
In addition, the likely path of relative monetary policy responses are more bearish for US Treasuries. As described above, the scope of the US stimulus will cause bond investors to further question the Fed’s commitment to keeping the funds rate unchanged for the next few years. That also applies to the Fed’s other policy tools, like asset purchases. The Fed is far less likely to continue buying US Treasuries at the same aggressive pace it has for the past eight months if there is less need for monetary stimulus because of more fiscal stimulus. According to the IMF, the Fed has purchased 57% of all US Treasuries issued since late February of this year, in sharp contrast to the ECB and Bank of Japan that have purchased over 70% of euro area government bonds and JGBs issued (Chart 10). If US Treasury yields are rising because of improving US growth expectations, fueled by fiscal stimulus, the Fed will likely tolerate such a move and buy an even lower share of Treasuries issued – particularly if the higher bond yields do not cause a selloff in US equity markets that can tighten financial conditions and threaten the growth outlook. The fact that US equities have ignored the rise in Treasury yields seen since the end of September may be a sign that both bond and stock investors are starting to focus on a faster trajectory for US growth. In terms of country allocation, beyond downgrading US Treasuries to underweight, we recommend upgrading exposure to countries that are less sensitive to changes in US Treasury yields (i.e. countries with a lower yield beta to changes in US yields). In Chart 11, we show the rolling beta of changes in 10-year government bond yields outside the US to changes in 10-year US Treasury yields. This is a variation of the “global yield beta” concept that we have discussed in the BCA Research bond publications in recent years. Here, we modify the idea to look at which countries are more or less correlated to US yields, specifically. A few points stand out from the chart: Chart 11Reduce Exposure To Bond Markets More Correlated To UST Yields
Reduce Exposure To Bond Markets More Correlated To UST Yields
Reduce Exposure To Bond Markets More Correlated To UST Yields
All countries have a “US yield beta” of less than 1, suggesting that Treasuries are a consistent outperformer when US yields fall and vice versa. This suggests moving to underweight the US when US yields are rising is typically a winning strategy in a portfolio context. The list of higher beta countries includes Canada, Australia, New Zealand, the UK and Germany; although Canada stands out as having the highest yield beta in this group. The list of lower beta countries includes France, Italy, Spain, and Japan. In Chart 12, we show what we call the “upside yield beta” that is estimated only using data for periods when Treasury yields are rising. This gives a sense of which countries are more likely to outperform or underperform during a period of rising Treasury yields, as we expect to unfold after the election. From this perspective, the “safer” lower US upside yield beta group includes the UK, France, Germany and Japan. The riskier higher US upside yield beta group includes Canada, Australia, New Zealand, Italy and Spain. Chart 12Favor Bond Markets Less Correlated to RISING UST Yields
Favor Bond Markets Less Correlated to RISING UST Yields
Favor Bond Markets Less Correlated to RISING UST Yields
Spain and Italy are less likely to behave like typical high-beta countries as US yields rise, however, because the ECB is likely to remain an aggressive buyer of their government bonds as part of their asset purchase programs over the next 6-12 months. We also do not recommend trading UK Gilts off their yield beta to US Treasuries in the immediate future, given the uncertainties over the negotiations over a final Brexit deal. Both sets of US yield betas suggest higher-beta Canada, Australia and New Zealand are more at risk of relative underperformance versus lower-beta France, Germany and Japan. In terms of government bond country allocation, we recommend reducing exposure to the former group and increasing allocations to the latter group. Bottom Line: Within global government bond portfolios, downgrade the US to underweight. Favor countries that have lower sensitivity to rising US Treasury yields, especially those with central banks that are likely to be more dovish than the Fed in the next few years. That means increasing allocations to core Europe and Japan, while reducing exposure to “higher-beta” Canada and Australia. Robert Robis, CFA Chief Fixed Income Strategist rrobis@bcaresearch.com Ryan Swift US Bond Strategist rswift@bcaresearch.com Footnotes 1 http://www.crfb.org/papers/cost-trump-and-biden-campaign-plans 2 https://www.moodysanalytics.com/-/media/article/2020/the-macroeconomic-consequences-trump-vs-biden.pdf 3 Please see BCA Research Geopolitical Strategy Special Report, “Introducing Our Quantitative US Senate Election Model”, dated October 16, 2020, available at gps.bcaresearch.com 4 For more details on this recommended steepener trade please see US Bond Strategy Weekly Report, “Positioning For Reflation And Avoiding Deflation”, dated August 11, 2020, available at usbs.bcaresearch.com 5 For more details on our Adaptive Expectations Model please see US Bond Strategy Weekly Report, “How Are Inflation Expectations Adapting?”, dated February 11, 2020, available at usbs.bcaresearch.com 6 For a detailed look at the implications of the Fed’s policy shift please see US Bond Strategy / Global Fixed Income Strategy Special Report, “A New Dawn For US Monetary Policy”, dated September 1, 2020, available at usbs.bcaresearch.com