Fixed Income

Last Friday, my colleague Dhaval Joshi and I held a webcast discussing investment strategies. The topics of discussion included global equity valuations, mega-cap stocks leadership and the outlook for EM stocks, fixed-income and currencies. You can listen to the webcast recording by clicking here. An Opportunity In Pakistani Equities And Bonds Pakistani stock prices in US dollar terms are currently 20% lower than their January high and 56% lower than their 2017 high (Chart I-1, top panel). Meanwhile, the government projected a contraction in real GDP during the fiscal year 2019-20 (ending on June 30), the first in 68 years. We believe stock prices have already priced in plenty of negatives, and that Pakistani equities are likely to move higher over the next six months. Strengthening the balance of payments (BoP) position and continuing policy rate cuts will increase investors’ confidence and benefit its stock market (Chart I-2). We also expect the Pakistani bourse to outperform the EM equity benchmark (Chart I-1, bottom panel). Chart I-1Pakistani Equities: More Upside Ahead
Pakistani Equities: More Upside Ahead
Pakistani Equities: More Upside Ahead
Chart I-2Monetary Easing Will Help Pakistani Equities
Monetary Easing Will Help Pakistani Equities
Monetary Easing Will Help Pakistani Equities
Chart I-3The Current Account Deficit Is Set To Shrink Further
The Current Account Deficit Is Set To Shrink Further
The Current Account Deficit Is Set To Shrink Further
Balance Of Payments Position Pakistan’s BoP position is set to improve. First, its trade deficit will shrink further, as Pakistan’s export will likely improve more than its imports (Chart I-3). The country’s total exports declined 6.8% year-on-year in June, which is a considerable improvement as compared to the massive 54% and 33% contractions that occurred in April and May, respectively. The country was on a strict lockdown for the whole month of April, which was then lifted in early May. As the number of daily new cases and deaths are falling, the country is likely to remain open, lowering the odds of a domestic supply disruption. In addition, as DM growth recovers, the demand for Pakistani products will improve as well. Europe and the US together account for about 54% of Pakistan’s exports. The government is keen to boost the performance of the domestic textile sector, which accounts for nearly 60% of the country’s total exports. The government will likely approve the industry’s request for supportive measures, including access to competitively priced energy, a lower sales tax rate, quick refunds, and a reduction of the turnover tax rate. Moreover, the government has prepared an incentive package for the global promotion of the country’s information technology (IT) sector, aiming to increase IT service exports from the current level of US$1 billion to US$10 billion by 2023. Currently, over 6,000 Pakistan-based IT companies are providing IT products and services to entities in over 100 countries worldwide. Regarding Pakistan’s imports, low oil prices will help reduce the country’s import bill year-on-year over the next six months. Second, remittance inflows – currently at 9% of GDP – have become an extremely important source of financing for Pakistan’s trade deficit. Even though about half of the remittances sent to Pakistan are from oil-producing regions like Saudi Arabia, UAE, Oman and Qatar, low oil prices may only have a limited impact on Pakistan’s remittance inflows. For example, when Brent oil prices fell to US$40 in early 2016, remittances sent to Pakistan in the second half of that year declined by only 1.9% on year-on-year terms. Over the first six months of this year, the remittances received by Pakistan still had a year-on-year growth of 8.7%. At the same time, the government has planned various measures to boost remittances. For example, a “national remittance loyalty program” will be launched on September 1, 2020, in which various incentives would be given to remitters. Strengthening the balance of payments (BoP) position and continuing policy rate cuts will increase investors’ confidence and benefit its stock market. Third, Pakistan will receive considerable financial inflows this year, probably amounting to over US$12 billion1 from multilateral and bilateral sources. This will be more than enough to finance its current account deficit, which was at US$11 billion over the past 12 months. In April, the International Monetary Fund (IMF) approved the disbursement of about US$1.4 billion to Pakistan under the Rapid Financing Instrument designed to address the economic impact of the Covid-19 shock. The World Bank and the Asian Development Bank have also pledged around US$ 2.5 billion in assistance. The IMF and the Pakistani government are in talks about the completion of the second review for the Extended Fund Facility (EFF) program. If completed in the coming months, the IMF will likely disburse about US$1 billion to Pakistan in the second half of this year. In April, G20 countries also awarded Pakistan a suspension of debt service payments, valued at US$ 1.8 billion, which will be used to pay for Pakistan’s welfare programs. In early July, the State Bank of Pakistan (SBP) received a US$1 billion loan disbursement from China. This came after Beijing awarded Pakistan a US$300 million loan last month. The authorities plan to raise US$1.5 billion through the issuance of Eurobonds over the next 12 months. Other than the funds borrowed by the Pakistani government, net foreign direct inflows, mainly driven by phase II of the China-Pakistan Economic Corridor (CPEC), are set to continue to increase over the remainder of this year, having already grown 40% year-on-year during the first six months of this year. About 63% of that increase came from China. Meanwhile, as we expect macro dynamics to improve in the next six months, net portfolio investment is also likely to increase after having been record low this year (Chart I-4). In addition, as the geopolitical confrontation between the US and China is likely to persist over many years, both Chinese and global manufacturers may move their factories from China to Pakistan.2 Bottom Line: Pakistan’s BoP position will be ameliorating in the months to come. Lower Inflation And Monetary Easing Continuous monetary easing is very likely and will depend on the extent of the decline in domestic inflation. Both headline and core inflation rates seem to have peaked in January (Chart I-5). Significant local currency depreciation last year had spurred inflation in Pakistan. Then, early this year, supply disruptions and hoarding behaviors attributed to the pandemic have contributed to elevated inflation. Chart I-4Net Portfolio Investment Inflows Are Likely To Increase
Net Portfolio Investment Inflows Are Likely To Increase
Net Portfolio Investment Inflows Are Likely To Increase
Chart I-5Both Headline And Core Inflation Rates Will Likely Fall Further
Both Headline And Core Inflation Rates Will Likely Fall Further
Both Headline And Core Inflation Rates Will Likely Fall Further
A closer look at the inflation subcomponents shows that recreation and culture, communication, and education have already fallen well below 5% in the last month. Transport inflation came in negative at 4.4% in June. The inflation of non-perishable food items was still stubbornly high at 14.9% last month. Increasing the food supply and reducing hoarding will help ease that. This, along with a stable exchange rate and a negative output gap will cause a meaningful drop in inflation. As inflation drops, interest rates will be reduced to facilitate an economic recovery. While the current 7% policy rate is lower than headline inflation, and on par with core inflation, Pakistani interest rates remain much higher than those in many other emerging countries. Investment Recommendations We recommend buying Pakistani equities in absolute terms and continuing to overweight this bourse within the emerging markets space. The stock market will benefit from a business cycle recovery following the worst recession in history, worse than during the 2008 Great Recession (Chart I-6). Fertilizer and cement producers, which together account for nearly 30% of the overall stock market, will benefit from falling energy prices, a significant cut in interest rates and supportive government measures. The government recently approved subsidies to encourage fertilizer output. In the meantime, the country’s construction stimulus package and its easing of lockdown orders will help lift demand for cement over the second half of 2020. As a result, both fertilizer and cement output are set to increase (Chart I-7). Besides, a cheapened currency will limit fertilizer imports and help cement producers export their output, which will benefit their revenue. Chart I-6Manufacturing Activity In Pakistan Will Soon Rebound
Manufacturing Activity In Pakistan Will Soon Rebound
Manufacturing Activity In Pakistan Will Soon Rebound
Chart I-7Both Fertilizer And Cement Output Are Set To Increase
Both Fertilizer And Cement Output Are Set To Increase
Both Fertilizer And Cement Output Are Set To Increase
Banks account for about 22% of the overall stock market. Our stress test on the Pakistani banking sector shows it is modestly undervalued at present (Table I-1). Even assuming the worst-case scenario for non-performing loans (NPL), where the NPL ratio would rise to 17.5% from the current 6.6%, the resulting adjusted price-to-book ratio will be only 1.6. Table I-1Stress Test On Pakistani Banking Sector
Pakistani, Chilean & Czech Markets
Pakistani, Chilean & Czech Markets
Both in absolute terms, and relative to EM valuations, Pakistani stocks appear attractive (Charts I-8 and I-9). Finally, foreign investors have bailed out of Pakistani stocks and local currency bonds since 2018, as illustrated in Chart I-4 on page 4. Ameliorating economic conditions will lure foreign investors back. Chart I-8Pakistani Equities: Valuation Measures Are Attractive In Both Absolute Terms…
Pakistani Equities: Valuation Measures Are Attractive In Both Absolute Terms...
Pakistani Equities: Valuation Measures Are Attractive In Both Absolute Terms...
Chart I-9…And Relative To The EM Benchmark
...And Relative To The EM Benchmark
...And Relative To The EM Benchmark
For fixed-income investors, we recommend continuing to hold the long Pakistani local currency 5-year government bonds position, which has produced a 12% return since our recommendation on December 5th 2019. We expect interest rates to drop another 100 basis points (Chart I-5, bottom panel, on page 5). Ellen JingYuan He Associate Vice President ellenj@bcaresearch.com Chile: Not Out Of The Woods Copper prices have staged an impressive rally in the past four months, but the performance of Chilean markets remains lackluster (Chart II-1). While the red metal has broken above its January highs, Chile’s equities and currency are still trading 25% and 5% below their January peak, respectively. The government’s mismanagement of the pandemic has reignited and heightened the existing socio-political discontent, thus increasing the fragility of the situation. We therefore recommend that investors maintain a cautious stance on Chilean assets. As for dedicated EM portfolios, we recommend moving this bourse from neutral to underweight: First, the lockdowns resulting from the pandemic have revealed the precarious financial condition of low and middle-class households. The lack of savings among these groups prevented workers from self-isolating for more than a couple of weeks. The urge for them to return to work enabled the outbreak to escalate in May. Consequently, these social groups have suffered from infections, and Chile has rapidly become one of the worst affected countries in the world in terms of per-capita COVID-19 cases and deaths. Chart II-2 shows that, as a share of total population, Chile tops the region in terms of cummulative cases and deaths. Moreover, Chile has the eighth highest COVID-19 infections per capita in the world, even though its testing rate per capita is lower than that of Europe and the US. Chart II-1Chilean Markets Have Been Much Weaker Than Copper
Chilean Markets Have Been Much Weaker Than Copper
Chilean Markets Have Been Much Weaker Than Copper
Chart II-2The Pandemic Has Hit Chile Hard
The Pandemic Has Hit Chile Hard
The Pandemic Has Hit Chile Hard
Chart II-3The Economy Is In The Doldrums
The Economy Is In The Doldrums
The Economy Is In The Doldrums
Given the wide spread of the virus, Chile has implemented harsher quarantine measures than the rest of the region, which means that the economic reopening and recovery will start from a lower level of activity. The inability of President Pinera’s administration to protect low and middle-class households from being exposed to the virus has renewed a nation-wide distrust in the government. According to Cadem, one of the country’s most cited polling companies, President Pinera’s approval rating has fallen back to just 17%, not far from the lows seen during last year’s violent social unrest. In sum, these recent events have confirmed our major theme for Chile, discussed in our December Special Report. It reads as follows: Chile’s political elite has been greatly underestimating the depth and gravity of the popular frustration and has been reluctant to address the issue in a meaningful way. Consequently, Chile is set to experience a renewal in protests and a rise in political volatility as the date of the referendum on the Constitution, which is scheduled to take place in October, nears. Second, Chile is experiencing its worst recession in modern history. Chart II-3shows that the economy was already in a slump at the beginning of the year, and the economic lockdown has caused double-digit contractions in many sectors. Further, business confidence never fully recovered from last year’s social protests and has been plummeting deeper since the start of the pandemic (Chart II-3, bottom panel). Chart II-4Banks' NPLs Are Set To Rise
Banks' NPLs Are Set To Rise
Banks' NPLs Are Set To Rise
While President Pinera’s decision to prioritize small and medium-sized businesses (SMEs) has been popular among the middle class, the reality is that Chile remains a highly oligopolistic market, dominated by large companies. The failure to support these businesses will prevent a revival in business sentiment, hiring and investment and, hence, prolong the economic downtrend. This unprecedent economic contraction has caused a rapid surge in non-performing loans (NPLs), which will hurt banks’ capital profits and tighten lending standards. NPLs will rise much further given the record depth of this recession (Chart II-4). Moreover, bank stocks compose 25% of the MSCI Chile index, so a hit to banking profitability will exert downward pressure on the equity index. Third, even though fiscal and monetary stimuli have been large and were implemented rapidly, they are probably insufficient to produce a quick recovery. The government first announced a fiscal plan between March 19 and April 8 worth US$ 17 billion (or 6% of GDP), the third largest in the region. However, it is still quite small compared to that of OECD members. Excluding liquidity provisions for SMEs and tax reductions, the size of new government spending in 2020 is only 3.5% of GDP. On June 14, the government devised another fiscal plan, worth US$ 12 billon (or 5% of GDP). However, it will be spread out over the next 24 months – only 1.5% of GDP of additional stimulus will be injected over the next 12 months. This extra kick in spending seems too small given the depth of the recession. In terms of monetary policy, the Chilean central bank has already reached the limits of its orthodox toolkit. The monetary authorities have cut the policy rate by 125 basis points since November of last year, but they have reached the constitutional technical minimum of 0.5%. The central bank is now using alternative tools to stimulate the economy, such as offering cheap lending to SMEs and a US$ 8 billion quantitative easing program for buying financial institutions’ bonds, as the Constitution forbids the purchasing of government and non-financial corporate debt. In a nutshell, the overall efficiency of these monetary policies will be subdued as the main drags on the economy are downbeat business and consumer confidence stemming from ongoing socio-political tensions, not high interest rates. Chile is shrouded in a cloud of political uncertainty. Monetary policy has reached its limits, and fiscal stimulus is insufficient for now. Fourth, higher copper prices will help on the margin, but will not bail out the Chilean economy. Even with the latest rally in copper prices, Chilean copper exports will continue contracting in US$ terms. The latest increase in prices will be more than offset by output cuts caused by social distancing rules and reduced staff in mines all over the country. Bottom Line: Chile is shrouded in a cloud of political uncertainty. Monetary policy has reached its limits, and fiscal stimulus is insufficient for now. Investment recommendations Chart II-5Our CLP vs. USD Trade
Our CLP vs. USD Trade
Our CLP vs. USD Trade
Continue shorting the CLP relative to a basket of the CHF, EUR and JPY. We closed our short CLP/USD on July 9th with a 29% profit (Chart II-5) and began shorting it versus an equal-weighted basket of the CHF, EUR and JPY. Within an EM equity portfolio, downgrade Chilean stocks from neutral to underweight. An ailing economy and political uncertainty will divert capital from the country despite attractive equity valuations. For an EM local bond portfolio, we are also downgrading Chile from neutral to underweight, as the risk of renewed currency depreciation is too large to ignore and downside in yields is limited due to the zero bound. Juan Egaña Research Associate juane@bcaresearch.com The Czech Republic: Pay Rates And Go Long The Currency An opportunity to bet on higher longer-term interest rates and on a stronger currency has emerged in the Czech Republic (Chart III-1). Consumer price inflation is above the central bank’s 2% target and will continue to rise, which will necessitate higher interest rates (Chart III-2). The latter will lead to currency appreciation. Chart III-1Pay Rates And Go Long CZK vs. USD
Pay Rates And Go Long CZK vs. USD
Pay Rates And Go Long CZK vs. USD
Chart III-2Inflation Is Above The CB Bands
Inflation Is Above The CB Bands
Inflation Is Above The CB Bands
The Czech authorities’ strong fiscal and monetary support of the economy amid the COVID recession will keep both labor demand and, thereby, wages supported. In turn, core inflation will likely prove resilient in the near term and will rise over the coming 12-18 months, putting upward pressure on long-term interest rates. First, Prime Minister Andrej Babis is determined to promote a rapid economic recovery, as there are upcoming elections scheduled for next year. In early July, the government approved another spending program that will in part finance infrastructure projects and promote job creation in the non-manufacturing sector. The bill is expected to boost infrastructure spending by 140 billion koruna (or 2.5% of GDP) in 2020, and is part of a multi-decade national investment plan to increase domestic productivity. In particular, the construction sector will benefit from a massive uplift in domestic capex that will go towards upgrading the transport network. This will produce a job boom in the construction industry which should mitigate the employment losses in manufacturing and tourism. Second, shortages continue to persist in the labor market. Our labor shortage proxy is at an all-time high, suggesting that labor shortages will continue to facilitate faster wage growth (Chart III-3). Interestingly, Chart III-4 suggests that overall job vacancies have plateaued but have not dropped. This signifies pent-up demand for labor. Critically, this hiring challenge is likely to make industrial firms reluctant to shed workers amid the transitory pandemic-induced manufacturing downturn. Chart III-3Labor Shortages = Wages Higher
Labor Shortages = Wages Higher
Labor Shortages = Wages Higher
Chart III-4Job Vacancies Are Holding Up
JOB VACANCIES ARE HOLDING UP...
JOB VACANCIES ARE HOLDING UP...
Either way, competition for labor in manufacturing and other sectors will keep a firm bid on both wages and unit labor costs in the medium to long term (Chart III-5). Third, low real interest rates will promote domestic credit growth (Chart III-6), helping support final domestic demand which, in turn, will lift inflation. Chart III-5Structural Pressure On Labor Costs
...STRUCTURAL PRESSURE ON LABOR COSTS
...STRUCTURAL PRESSURE ON LABOR COSTS
Chart III-6Low Rates Will Bolster Domestic Demand
Low Rates Will Bolster Domestic Demand
Low Rates Will Bolster Domestic Demand
Similarly, residential real estate prices and rents will continue to grow at a hefty pace due to low borrowing costs and residential property shortages. Core inflation will likely prove resilient in the near term and will rise over the coming 12-18 months, putting upward pressure on long-term interest rates. Finally, core inflation measures are hovering well above the 2% target and the upper band of 3% (Chart III-2 on page 13). As such, the Czech National Bank (CNB) is likely to hike interest rates sooner rather than later. Critically, inflation is acute across various parts of the economy. Specifically, service price inflation is likely to continue rising in the wake of announced price hikes in public services, such as transport. These are being devised by local authorities to counteract a loss in tax revenue. Altogether, easy fiscal policy (infrastructure spending) will support labor demand, wage growth and final domestic demand, in turn heightening inflationary pressures. Unlike its counterparts in the EU, the CNB is more sensitive to price increases due to the relatively higher starting point of inflation in the Czech economy. As such, the central bank will be the first to hike interest rates among its EU counterparts, tolerating the currency appreciation that will come with it. The basis is Czech domestic demand and income growth will be robust. Investment Recommendation Czech swap rates are currently pricing a rise of only 55 bps in interest rates over the next 10 years. As a result, we recommend investors pay 10-year swap rates (see the top panel of Chart III-1 on page 13). We also recommend going long the Czech koruna versus the US dollar. Unlike the Czech central bank, the US Federal Reserve will keep interest rates very low for too long. In short, the Fed will fall well behind the curve, while the CNB will hike earlier. Rising Czech rates versus US rates favor the koruna against the dollar. This is a structural position that will be held for the next couple of years. It is also consistent with the change in our view on the USD, which has gone from positive to negative in our report from July 9. Andrija Vesic Associate Editor andrijav@bcaresearch.com Footnotes 1 Regarding Pakistan’s net financial inflows this year, we estimated that net foreign investment inflows, net foreign portfolio inflows and net other financial inflows to be about US$ 1.5 billion, US$ 0.5 billion, and US$ 10.5 billion, respectively, based on past data and the six-month outlook of the country’s economy. 2 Please see the following articles: Chinese Companies to Relocate Factories to Pakistan Under CPEC Project Importers Survey Shows Production Leaving China for Vietnam, Pakistan, Bangladesh Equities Recommendations Currencies, Credit And Fixed-Income Recommendations

Bond yields remain depressed but risks to the upside are building up. The two main factors explaining the absence of upward motion in yields have been the very easy policy conducted by central banks around the world and the surge in private sector savings…
Highlights Monetary Policy: Central bankers worldwide are promising to keeping policy rates near 0% for at least the next two years, even if inflation begins to rise again. This is an obvious form of forward guidance designed to keep borrowing costs as low as possible until the COVID-19 pandemic ends. It may also be the start of a true shift in policymaker strategy, tolerating a rise in inflation just as many of the secular forces that have dampened global inflation are fading. Bond Strategy: The recent divergence of inflation expectations and real bond yields can persist if central banks commit to their dovish forward guidance. Stay overweight inflation-linked bonds versus nominal government debt, particularly in the US, Canada and Italy. Feature “We’re not thinking about raising rates. We’re not even thinking about thinking about raising rates.” – Fed Chairman Jerome Powell Central bankers have emptied their bags of tricks in recent months, providing extreme monetary policy accommodation to fight the deflationary impacts of the COVID-19 recession. 0% policy interest rates, large-scale asset purchases and liquidity support programs have all been implemented in some form by the major developed market central banks. Even more extreme options like yield curve control have been contemplated in the US and implemented in Australia. Perhaps the most important tool used by policymakers, however, is the most simple of all – dovish forward guidance on future interest rate moves. The Fed, European Central Bank (ECB), Bank of Japan (BoJ) and others are now committing to keep rates at current levels for at least the next two years. Additional “state-based” guidance, tying future rate hikes only to a sustainable return of inflation back to policymaker targets, is the likely next step, with the Bank of Canada already making that connection at last week’s policy meeting. Given how difficult it has been for central banks to reach those targets, policy rates can now potentially stay lower for much longer. Interest rate markets have already discounted such an outcome, with overnight index swap (OIS) curves pricing in no change in policy rates in the US, Europe, UK, Japan, Canada or Australia until at least mid-2022 and only very mild increases afterward (Chart of the Week). It remains to be seen if policymakers will actually follow through on their promises to sit on their hands and do nothing for that long, even as global growth and inflation continue what will likely be an extended and choppy recovery from the deep COVID-19 recession. Chart of the WeekAggressive Forward Guidance Is Working
Can Central Bankers Credibly Be Not Credible?
Can Central Bankers Credibly Be Not Credible?
However, if central bankers are truly serious about keeping interest rates low even if inflation picks up, in an attempt to “catch up” from previous undershoots of inflation targets, that has major implications for global bond investors – in particular, raising the value of maintaining core holdings of inflation-linked bonds in fixed-income portfolios. The First Step To Higher Inflation: Stop Talking About Rate Hikes Central bankers are increasingly using the same arguments, and even the same language, to justify their current hyper-accommodative policy stance. Here are some examples, taken from speeches and policy meetings that took place last week: ECB President Christine Lagarde: “We expect interest rates to remain at their present or lower levels until we have seen the inflation outlook robustly converge to a level sufficiently close to, but below, 2% within our projection horizon and such convergence has been consistently reflected in underlying inflation dynamics.” Federal Reserve Governor Lael Brainard: “Looking ahead, it likely will be appropriate to shift the focus of monetary policy from stabilization to accommodation by supporting a full recovery in employment and a sustained return of inflation to its 2 percent objective […] policy should not preemptively withdraw support based on a historically steeper Phillips curve that is not currently in evidence.” Bank of Canada Governor Tiff Macklem: "As the economy moves from reopening to recuperation, it will continue to require extraordinary monetary policy support. The Governing Council will hold the policy interest rate at the effective lower bound until economic slack is absorbed so that the 2 percent inflation target is sustainably achieved.” Chart 2Global Growth Expectations Have Rebounded
Global Growth Expectations Have Rebounded
Global Growth Expectations Have Rebounded
We could have switched the names on those three quotes and the message would be the same. Policy rates will stay at current levels until inflation has sustainably returned to the 2% target. Raising rates on the back of a forecast of higher inflation, driven by an expectation of lower unemployment, will not be enough this time for policymakers that have been repeatedly burned by their belief in the Phillips Curve. Bond investors have taken note of the central bankers’ message and now expect both stable policy rates and higher inflation expectations. The latest data from the ZEW survey of economic and financial market sentiment, that was published last week and covers the period to mid-July, shows this shift in expectations. On the economy, the current conditions indices for the euro area, US, UK and Japan have stopped falling, while the expectations data have all soared to the highest levels seen since 2015 (Chart 2). The ZEW also poses questions on expectations for interest rates and inflation, and there the answers are more interesting for bond investors. The net balances on expectations for long-term interest rates have bottomed out for the US, euro area and UK, as have expectations for inflation over the next twelve months (Chart 3). At the same time, expectations for short-term interest rates have lagged the moves seen in the other two series, with the net balances hovering around zero for all four countries. One possible interpretation of this data is that a greater number of the financial professionals who take part in the ZEW survey are starting to “get the hint” about central bankers’ dovish messages, expecting higher inflation and bond yields but with no change in short-term policy rates. Bond investors have taken note of the central bankers’ message and now expect both stable policy rates and higher inflation expectations. We see similar pricing in inflation-linked bond markets. While nominal bond yields have stayed stable, the mix between inflation expectations and real bond yields has shifted. Breakevens on 10-year bonds have been slowly climbing across the major developed markets since the end of March, while real yields have fallen roughly the same amount as breakevens have widened (Chart 4). Chart 3Global Inflation Expectations Are Drifting Higher
Global Inflation Expectations Are Drifting Higher
Global Inflation Expectations Are Drifting Higher
Chart 4Inflation Breakevens & Real Yields: Mirror Images
Inflation Breakevens & Real Yields: Mirror Images
Inflation Breakevens & Real Yields: Mirror Images
This is a relatively unusual development in the global inflation-linked bond universe. More often, breakevens and real yields move in the same direction. Inflation expectations tend to rise when economic growth is improving, which also puts upward pressure on real bond yields – often in tandem with markets pricing in higher policy rates at the short end of yield curves. That is not the case today. The latest fall in real bond yields may simply be markets pricing in slower potential economic growth, and lower equilibrium real interest rates, in a world where the COVID-19 pandemic is likely to leave lasting scars. That would be consistent with Bloomberg growth and inflation forecasts for the major developed economies, which expect unemployment rates to remain above pre-COVID levels in 2022, with inflation rates struggling to reach 2% (Chart 5). Chart 5The Consensus Expects A Slow Global Recovery
Can Central Bankers Credibly Be Not Credible?
Can Central Bankers Credibly Be Not Credible?
In a recent report, we presented some basic Taylor Rule estimates of the “appropriate” level of policy rates for the US, euro area, UK, Japan, Canada and Australia after the collapse in growth seen in response to the COVID-19 lockdowns. We used the most basic formulation of the Taylor Rule that put equal weight on deviations of headline inflation from central bank target levels, and deviations of unemployment from full-employment NAIRU measures. Chart 6Taylor Rules Suggest Rates Will Need To Head Higher
Can Central Bankers Credibly Be Not Credible?
Can Central Bankers Credibly Be Not Credible?
Given the surge in unemployment and collapse in inflation due to the COVID-19 recession, Taylor Rule estimates were calling for negative nominal interest rates across the developed economies (Chart 6). The estimates were most severe in the US, where a fed funds rate of -3.8% is deemed “appropriate” with an unemployment rate of 11% and headline CPI inflation at 0.6%. When the Bloomberg consensus forecasts for the next two years are put into the Taylor Rule, a rising path for interest rates is projected but with rates remaining below pre-COVID levels. However, if policymakers stick to their current pledge to keep rates on hold for longer to ensure that inflation not only returns to 2%, but also stays there without the help from very easy monetary policy, then the implication is that a “below-appropriate” interest rate will be maintained for an extended period. Interest rate markets have already come to that conclusion. 5-year OIS rates, 5-years forward are trading between 0% and 1% across the developed economies – levels that are below the neutral interest rate estimates we are using in our Taylor Rule forecasts (Chart 7). Chart 7Markets Priced For An Extended Period Of Below-Neutral Rates
Markets Priced For An Extended Period Of Below-Neutral Rates
Markets Priced For An Extended Period Of Below-Neutral Rates
With interest rates already at or near the zero bound, any rise in inflation from current levels also near 0% will result in real policy rates turning negative if central banks do nothing. This would be consistent with the messages sent by the ZEW survey, and global inflation linked bond markets where real yields are falling deeper into negative territory. That would be a major shift of global policymaker behavior, designed as a planned erosion of inflation-fighting credibility. This is especially true for the likes of the Fed, which has a well-established history of turning hawkish at the first sign of rising inflation pressures. The Fed has already hinted that it is considering shifting its policy strategy to allow overshoots of inflation after periods of undershooting the 2% target. Other central banks, like the ECB, have announced similar reviews of their inflation targets and strategy. Such a move to tolerate higher levels of inflation is a logical response to a global pandemic and deep global recession, coming on the heels of several years of low inflation. The timing may actually be ideal to run more dovish policies to boost inflation, with many of the structural factors that have helped restrain global inflation starting to turn in a more inflationary direction. That would be a major shift of global policymaker behavior, designed as a planned erosion of inflation-fighting credibility. Bottom Line: Central bankers worldwide are promising to keep policy rates near 0% for at least the next two years, even if inflation begins to rise again. This is an obvious form of forward guidance designed to keep borrowing costs as low as possible until the COVID-19 pandemic ends. It may also be the start of a true shift in policymaker strategy, becoming more tolerant of faster inflation. Potential Reasons Why Inflation Could Return Central bankers are talking a good game right now, pledging not to turn too hawkish, too soon and allowing inflation to move back above policy targets. It remains to be seen if they would actually follow through and do nothing if realized inflation rates were to start climbing back to 2% or even higher. It is unlikely that policymakers will be facing that choice anytime soon. The COVID-19 pandemic is showing no signs of slowing in the US and large emerging market countries, global growth remains fragile and heavily reliant on monetary and fiscal policy support, and inflation rates worldwide are currently closer to 0% than 2%. Yet at the same time, there are structural disinflationary forces now changing in a way that may create a more inflationary world after the threat of the pandemic has faded. Demographics Chart 8Demographics Have Turned Less Disinflationary
Demographics Have Turned Less Disinflationary
Demographics Have Turned Less Disinflationary
BCA Research Global Investment Strategy has noted that the global demographic trends that helped restrain inflation in recent decades are shifting.1 The ratio of the number of global workers to the number of global consumers – the global support ratio - peaked back in 2013 and is now steadily falling (Chart 8). There are structural disinflationary forces now changing in a way that may create a more inflationary world after the threat of the pandemic has faded. A rising support ratio implies there are more people producing through work than consuming which, on the margin, is disinflationary. Now, with baby boomers leaving the labor force in droves and becoming consumers in retirement (especially consuming services like health care), the support ratio is falling and becoming a potentially more inflationary force. Globalization Chart 9Globalization Has Turned Less Disinflationary
Globalization Has Turned Less Disinflationary
Globalization Has Turned Less Disinflationary
One of the biggest disinflationary forces of the past quarter-century has been the rapid increase in global trade. As trade barriers fell and global supply chains expanded, companies were able to lower their costs of production. This allowed companies to widen profit margins without resorting to large price increases, helping to dampen overall inflation rates. Now, with global populism and protectionism on the rise, trade as a share of global GDP is declining (Chart 9). The COVID-19 pandemic will likely exacerbate this trend as more companies bring production closer to home, reversing the disinflationary impact of global supply chains, on the margin. A Strong US Dollar The relentless rise of the US dollar in recent years has exerted a major disinflationary headwind to the world economy, with a large share of global traded goods and commodities priced in dollars. Now, with the greenback finally showing signs of rolling over on a more sustainable basis (Chart 10), fueled by less favorable interest rate differentials and signs of improving global growth, the dollar is slowly becoming a more inflationary force. Chart 10USD Weakness Would Be Inflationary
USD Weakness Would Be Inflationary
USD Weakness Would Be Inflationary
Chart 11Structural Reasons Why Policy Rates Need To Stay Low
Structural Reasons Why Policy Rates Need To Stay Low
Structural Reasons Why Policy Rates Need To Stay Low
Of course, these factors are slow moving and will not necessarily result in an immediate increase in global inflation. Yet the trends now in place are more inflationary, on the margin, than has been the case for many years. Coming at a time when global productivity growth is anemic, the potential for an inflationary spark from overly easy monetary policies should not be ignored. Especially given the very high levels of private and public debt in the developed world, which puts more pressure on policymakers to choose inflation as a way to reduce debt burdens (Chart 11). Investment Implication – Stay Overweight Inflation-Linked Bonds Central bankers are now signaling a desire to keep interest rates lower for longer, both to provide stimulus for virus-stricken economies and to boost weak inflation. Coming at a time when secular disinflationary forces are losing potency, this raises the risk of a protracted period of negative real policy rates as inflation rises and policymakers do little to stop it pre-emptively. Against this shifting backdrop, the value of owning global inflation-linked bonds as core holdings in fixed income portfolios is compelling. Chart 12Maintain A Core Overweight In Inflation-Linked Bonds
Maintain A Core Overweight In Inflation-Linked Bonds
Maintain A Core Overweight In Inflation-Linked Bonds
Against this shifting backdrop, the value of owning global inflation-linked bonds as core holdings in fixed income portfolios is compelling. Inflation breakevens are more likely to creep upward than soar higher in the near term given the lingering economic threat from the COVID-19 pandemic. Yet inflation-linked bonds are likely to outperform nominal government debt over the next few years – if central bankers stay true to their word and keep rates unchanged while welcoming a pickup in inflation. The experience of the years following the 2008 financial crisis, when global policy rates were kept near 0% and central banks expanded balance sheets through quantitative easing, may be a template to follow. Global inflation linked bonds, as an asset class, steadily outperformed nominal government bonds from 2012-2016, shown in Chart 12 on a rolling 3-year annualized basis using benchmark indices from Bloomberg Barclays. A similar extended period of outperformance is not out of the question over the next few years, with central banks ramping up asset purchases once again and promising to keep policy easy until inflation returns. Bottom Line: The recent divergence of inflation expectations and real bond yields can persist if central banks commit to their dovish forward guidance. Stay overweight inflation-linked bonds versus nominal government debt, particularly in the US, Canada and Italy where our models show that breakevens are most undervalued. Robert Robis, CFA Chief Fixed Income Strategist rrobis@bcaresearch.com Footnotes 1 Please see BCA Research Global Investment Strategy "Third Quarter 2020 Strategy Outlook, Navigating The Second Wave", dated June 30, 2020, available at gis.bcaresearch.com. Recommendations The GFIS Recommended Portfolio Vs. The Custom Benchmark Index
Can Central Bankers Credibly Be Not Credible?
Can Central Bankers Credibly Be Not Credible?
Duration Regional Allocation Spread Product Tactical Trades Yields & Returns Global Bond Yields Historical Returns
BCA Research's US Bond Strategy service recommends that investors overweight energy issuers within the high-yield space. Specifically, investors should focus their exposure on the independent sub-sector while avoiding the distressed oil field services…
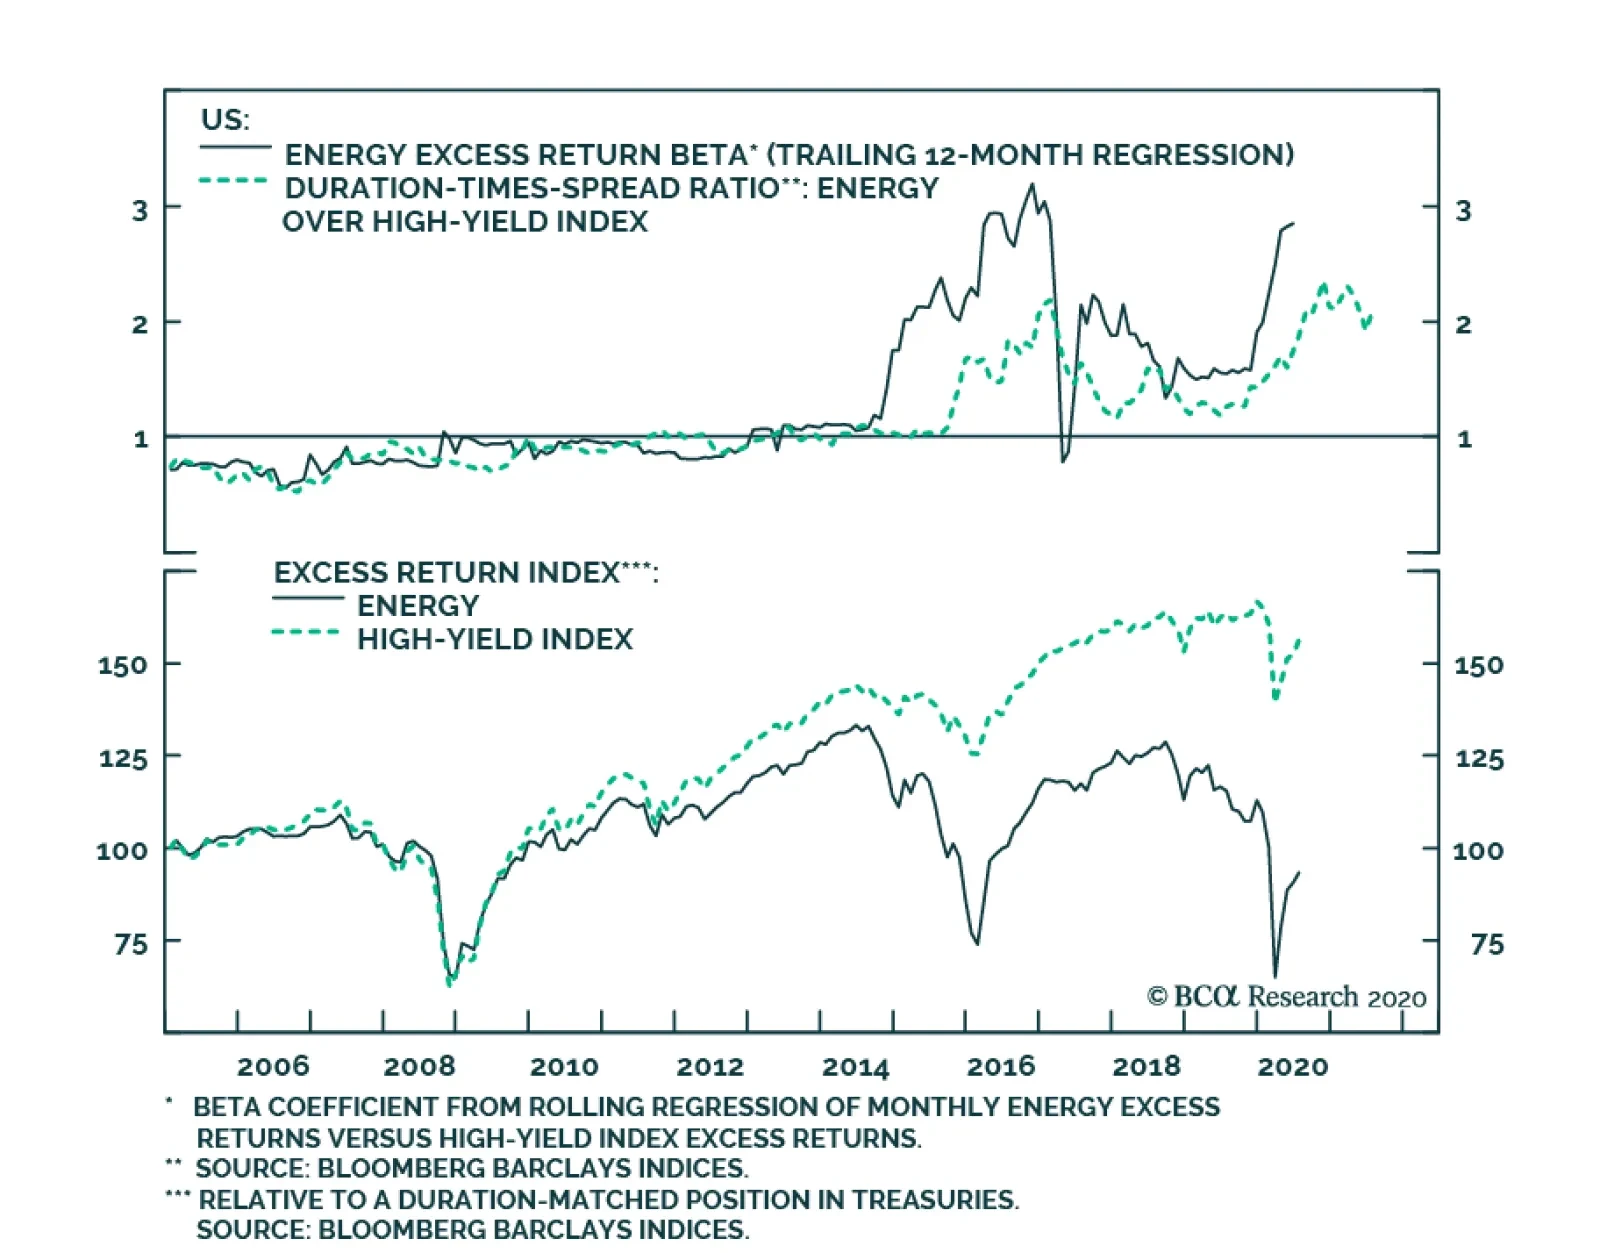
Highlights IG Energy: Investors should overweight Energy bonds within an overweight allocation to investment grade corporate bonds overall. Within IG Energy, the Independent sub-sector should perform best, and we recommend avoiding the higher-rated Integrated space. HY Energy: Investors should overweight high-yield Energy relative to the overall junk index. In particular, investors should focus their exposure on the Independent sub-sector, while avoiding the distressed Oil Field Services space. Feature This week we present part 2 of our two-part Special Report on Energy bonds. Last week’s report showed how to develop a model for Energy bond excess returns (both investment grade and high-yield) based on overall corporate bond index spreads and the oil price.1 This week, we delve deeper into the characteristics of both the investment grade and high-yield Energy indexes to better understand how both are likely to trade in the coming months. Chart 1High-Yield Energy Bond Returns Have Bottomed
High-Yield Energy Bond Returns Have Bottomed
High-Yield Energy Bond Returns Have Bottomed
Chart 2Energy Index Sub-Sector Composition*
The Outlook For Energy Bonds Part 2: Buy The Dip In High-Yield Energy
The Outlook For Energy Bonds Part 2: Buy The Dip In High-Yield Energy
In this week’s deep dive, we don’t limit ourselves to an examination of the overall Energy index. We also consider the outlooks for its five main sub-sectors: Integrated: Major oil firms that are present along the entire supply chain – from exploration and production all the way down to refined products for consumers. Independent: Exploration & production firms. Oil Field Services: Support services for the Independent sector – notably drilling. Midstream: Transportation (pipelines), storage and marketing of crude oil. Refining Chart 2 shows the share of each sub-sector in both the investment grade and high-yield Energy indexes. Midstream (46%) and Integrated (31%) are the largest sub-sectors in the investment grade index. Independent (48%) and Midstream (36%) are the heavyweights in the high-yield space. Investment Grade Energy Risk Profile Overall, investment grade Energy bonds are highly cyclical. That is, they tend to outperform the corporate benchmark during periods of spread tightening and underperform during periods of spread widening. This cyclical behavior is due to Energy’s lower credit rating compared to the Bloomberg Barclays Corporate index. Sixty five percent of Energy’s market cap carries a Baa rating compared to 59% for the overall index (Chart 3). The sector’s cyclical nature is confirmed by its duration-times-spread (DTS) ratio,2 which is well above 1.0 (Chart 4A). Interestingly, Energy has only been a highly cyclical sector since the 2014-2016 oil price crash. Prior to that, Energy mostly tracked the corporate index’s performance and only slightly underperformed the benchmark during the 2008/09 financial crisis. More recently, Energy underperformed the corporate index dramatically when spreads widened in March, but has outperformed by 936 bps since spreads peaked on March 23 (Chart 4A, panel 3). Energy has only been a highly cyclical sector since the 2014- 2016 oil price crash. Turning to the sub-sectors, the Integrated sub-sector immediately stands out as the only one with a higher average credit rating than the corporate benchmark. Ninety-two percent of Integrated issuers are rated A or Aa (Chart 3). The presence of the global oil majors (Total SA, Royal Dutch Shell, Chevron, Exxon Mobil and BP) is what gives the sub-sector its higher average credit quality and makes it the only defensive Energy sub-sector. Notice that Integrated even proved resilient during the 2014-16 Energy bond turmoil (Chart 4B). The remaining four sub-sectors (Independent, Oil Field Services, Midstream and Refining) all have lower average credit ratings than the corporate index (Chart 3) and all trade cyclically relative to the benchmark with Independent (Chart 4C) and Oil Field Services (Chart 4D) being more cyclical than Midstream (Chart 4E) and Refining (Chart 4F). Interestingly, Independent trades more cyclically than Midstream and Refining despite having a greater concentration of high-rated issuers. This is likely due the fact that Independent (aka Exploration & Production) firms are more dependent on the level of oil prices, and typically require a certain minimum oil price to support capital spending and growth. Meanwhile, crude oil is an input for Refining firms and lower oil prices can boost margins, helping offset some of the negative impact from growth downturns. Chart 3Investment Grade Credit Rating Distributions*
The Outlook For Energy Bonds Part 2: Buy The Dip In High-Yield Energy
The Outlook For Energy Bonds Part 2: Buy The Dip In High-Yield Energy
Chart 4AIG Energy Risk Profile
IG Energy Risk Profile
IG Energy Risk Profile
Chart 4BIG Integrated Risk Profile
IG Integrated Risk Profile
IG Integrated Risk Profile
Chart 4CIG Independent Risk Profile
IG Independent Risk Profile
IG Independent Risk Profile
Chart 4DIG Oil Field Services Risk Profile
IG Oil Field Services Risk Profile
IG Oil Field Services Risk Profile
Chart 4EIG Midstream Risk Profile
IG Midstream Risk Profile
IG Midstream Risk Profile
Chart 4FIG Refining Risk Profile
IG Refining Risk Profile
IG Refining Risk Profile
Valuation In terms of value, we find that the Energy sector offers a spread advantage relative to the corporate index and its equivalently-rated (Baa) benchmark (Table 1). This advantage holds up after we control for duration differences by looking at the 12-month breakeven spread. The four cyclical sub-sectors (Independent, Oil Field Services, Midstream and Refining) all also look cheap, whether or not we control for duration differences. Integrated, the sole defensive sub-sector, is roughly fairly valued compared to the equivalently-rated (Aa) benchmark. Table 1IG Energy Valuation
The Outlook For Energy Bonds Part 2: Buy The Dip In High-Yield Energy
The Outlook For Energy Bonds Part 2: Buy The Dip In High-Yield Energy
Balance Sheet Health The par value of outstanding investment grade Energy debt jumped sharply as oil prices plunged in 2014. But the sector has barely issued any debt since the 2014-16 collapse. Instead, Energy firms have relied on capital spending reductions, asset sales, equity issuance and dividend cuts to raise cash. This shift toward austerity explains why Energy’s weight in the index fell from 11% in 2015 to 8% today (Chart 5A). The median Energy firm’s net debt-to-EBITDA consequently improved between 2017 and 2019, but has once again started to rise as earnings have struggled in recent quarters (Chart 5A, bottom panel). At the issuer level, 15 out of the investment grade index’s 56 Energy issuers currently have a negative ratings outlook from Moody’s (Appendix A). Of the 23 Energy sector ratings that Moody’s has reviewed in 2020, 12 have been affirmed with a stable outlook and 11 were assigned negative outlooks. At the sub-sector level, Integrated debt growth lagged that of the corporate index during the last recovery (Chart 5B). Though the sub-sector has an average credit rating of Aa, most issuers carry negative ratings outlooks, including four of the five global oil majors (Total SA, Royal Dutch Shell, Exxon Mobil and BP). Interestingly, Independent trades more cyclically than Midstream and Refining, despite having a greater concentration of high-rated issuers. The outstanding par value of investment grade Independent debt had been stagnant since 2015, it then plunged this year as three sizeable issuers were downgraded from investment grade to high-yield (Chart 5C). EQT Corp, Occidental Petroleum and Apache Corp were all downgraded during the past few months. They currently account for 21% of the high-yield Energy index’s market cap. Encouragingly, only two of the 16 remaining investment grade Independent issuers currently have negative ratings outlooks. The situation is less favorable for Oil Field Services. This sub-sector’s outstanding debt has remained low since the 2014-16 collapse (Chart 5D), but four of the six investment grade Oil Field Services issuers have negative ratings outlooks. Midstream (Chart 5E) and Refining (Chart 5F) both continued to grow their outstanding debt levels throughout the entirety of the last recovery, including during the 2014-16 period. At present, only three of the 23 investment grade Midstream issuers have negative ratings outlooks, while two of the four Refining issuers have negative outlooks. Chart 5AIG Energy Debt Growth
IG Energy Debt Growth
IG Energy Debt Growth
Chart 5BIG Integrated Debt Growth
IG Integrated Debt Growth
IG Integrated Debt Growth
Chart 5CIG Independent Debt Growth
IG Independent Debt Growth
IG Independent Debt Growth
Chart 5DIG Oil Field Services Debt Growth
IG Oil Field Services Debt Growth
IG Oil Field Services Debt Growth
Chart 5EIG Midstream Debt Growth
IG Midstream Debt Growth
IG Midstream Debt Growth
Chart 5FIG Refining Debt Growth
IG Refining Debt Growth
IG Refining Debt Growth
Investment Conclusions As per last week’s report, we recommend that investors overweight Energy bonds within their investment grade corporate bond allocations. This recommendation stems from our view that corporate bond spreads will tighten during the next 12 months and that the oil price will rise. As such, we want to favor cyclical investment grade bond sectors that will outperform during periods of spread tightening. With that in mind, we would advise investors to focus their investment grade Energy allocations on the most cyclical sub-sector: Independent. Not only does the Independent sub-sector have the highest DTS ratio of the five sub-sectors, but its weakest credits have already been purged from the index and further downgrades are less likely. Oil Field Services offer less spread pick-up than Independent, and also have a higher proportion of issuers with negative ratings outlooks. By similar logic, we would avoid the Integrated sub-sector. This sub-sector trades defensively relative to the corporate benchmark and a high proportion of its issuers have negative ratings outlooks. High-Yield Energy Bonds Risk Profile On average, the High-Yield Energy index and the overall High-Yield corporate index have very similar credit ratings. However, the Energy sector has a more barbelled credit rating distribution with a greater proportion of Ba-rated securities (64% versus 55%) and a greater proportion of Ca-C rated issuers (8% versus 1%) (Chart 6). Chart 6High-Yield Credit Rating Distributions*
The Outlook For Energy Bonds Part 2: Buy The Dip In High-Yield Energy
The Outlook For Energy Bonds Part 2: Buy The Dip In High-Yield Energy
Chart 7AHY Energy Risk Profile
HY Energy Risk Profile
HY Energy Risk Profile
It is likely some combination of the larger presence of very low-rated credits and increased oil price volatility that has caused the sector to trade cyclically versus the junk benchmark since 2014 (Chart 7A). Notice that Energy outperformed the junk index during the 2008 sell off, but has since turned cyclical, underperforming in both the 2015/16 and 2020 risk-off episodes. At the sub-sector level, there is currently only one high-yield rated Integrated issuer (Cenovus Energy Inc., Ba-rated, negative outlook). Based on their DTS ratios, the Independent and Oil Field Services sub-sectors are the most cyclical (Charts 7B & 7C). This is because the lower-rated (Caa & below) issuers are concentrated in the these spaces. This is particularly true for Oil Field Services where 41% of the sub-sector’s market cap is rated Caa or below. The Midstream sub-sector also trades cyclically relative to the junk benchmark, but with somewhat less volatility than Independent and Oil Field Services, as evidenced by its DTS ratio of 1.2 (Chart 7D). Refining has traded like a cyclical sector so far this year, but that may not continue now that its DTS ratio has fallen close to 1.0 (Chart 7E). Chart 7BHY Independent Risk Profile
HY Independent Risk Profile
HY Independent Risk Profile
Chart 7CHY Oil Field Services Risk Profile
HY Oil Field Services Risk Profile
HY Oil Field Services Risk Profile
Chart 7DHY Midstream Risk Profile
HY Midstream Risk Profile
HY Midstream Risk Profile
Chart 7EHY Refining Risk Profile
HY Refining Risk Profile
HY Refining Risk Profile
Valuation The Energy sector offers a significant spread advantage over the High-Yield index and also relative to other Ba-rated issuers (Table 2). Adjusting for duration differences by looking at the 12-month breakeven spread makes Energy look even more attractive. Energy spreads need to widen by 189 bps during the next 12 months to underperform duration-matched Treasuries. This compares to 93 bps for other Ba-rated issuers and 150 bps for the overall junk index. Table 2HY Energy Valuation
The Outlook For Energy Bonds Part 2: Buy The Dip In High-Yield Energy
The Outlook For Energy Bonds Part 2: Buy The Dip In High-Yield Energy
Four of the five Energy sub-sectors (Integrated being the exception) also offer attractive value relative to the overall index and their equivalently-rated benchmarks. This remains true after adjusting for duration differences. Balance Sheet Health The high-yield Energy sector has added much more debt than the overall junk index since 2010 (Chart 8A). But of greater concern is that Moody’s has already changed its ratings outlook from stable to negative for 58 Energy issuers since the start of the year. Meanwhile, only 17 high-yield Energy issuers have seen their ratings outlooks confirmed as stable in 2020. Nevertheless, we take some comfort knowing that the Energy sector should benefit from having a large number of issuers able to take advantage of the Federal Reserve’s Main Street Lending facilities. As a reminder, to be eligible for the Main Street facilities issuers must have fewer than 15000 employees or less than $5 billion in 2019 revenue. They must also be able to keep their Debt-to-EBITDA ratios below 6.0, including any new debt added through the Main Street programs. The Energy sector offers a significant spread advantage over the High-Yield index and also relative to other Barated issuers. Of the 61 US high-yield Energy issuers with available data (we exclude 23 foreign issuers that won’t have access to US programs), we estimate that at least 48 are eligible to receive support from the Main Street facilities (Appendix B). This not only includes 15 out of 20 B-rated issuers, but also 12 out of 15 Caa-rated issuers and 4 out of 7 issuers rated below Caa. This broad access is the result of deleveraging that has occurred since the 2014-16 bust (Chart 8A, bottom panel) and it should go a long way toward limiting defaults in the Energy space. The Independent sub-sector’s weight in the index jumped sharply this year, the result of adding three sizeable fallen angels (Chart 8B). Importantly, 24 out of the 28 US Independent issuers appear eligible for Fed support. In contrast, the Oil Field Services sector is in distress. Its weight in the index has been declining for more than a year (Chart 8C), and a large proportion of its issuers are concentrated in lower credit tiers. However, we estimate that out of 19 issuers with available data, 13 are eligible for the Fed’s Main Street Lending facilities. Both Midstream and Refining have high concentrations of Ba-rated issuers and neither has aggressively grown its presence in the index during the past decade (Charts 8D & 8E), though Midstream’s index weight did jump this year. The high credit quality of both indexes means that most issuers will have access to the Main Street facilities, though three of the five Refining issuers are not US based. Chart 8AHY Energy Debt Growth
HY Energy Debt Growth
HY Energy Debt Growth
Chart 8BHY Independent Debt Growth
HY Independent Debt Growth
HY Independent Debt Growth
Chart 8CHY Oil Field Services Debt Growth
HY Oil Field Services Debt Growth
HY Oil Field Services Debt Growth
Chart 8DHY Midstream Debt Growth
HY Midstream Debt Growth
HY Midstream Debt Growth
Chart 8EHY Refining Debt Growth
HY Refining Debt Growth
HY Refining Debt Growth
Investment Conclusions The conclusion from the model we presented in last week’s report was that high-yield Energy should outperform the junk index during the next 12 months, assuming that overall junk spreads tighten and the oil price rises. However, we remain concerned that, despite the nascent economic recovery, some low-rated Energy names will go bust during the next few months, weighing on index returns. The pattern from the 2014-16 default cycle argues that our concerns may be overblown. In February 2016, high-yield Energy started to outperform the overall junk index slightly after the trough in oil prices and eleven months before the peak in the 12-month trailing default rate (Chart 1 on page 1). If oil prices are indeed already past their cyclical trough, then it may already be a good time to bottom-fish in the high-yield Energy space. The fact that the bulk of high-yield Energy issuers are eligible for support through the Main Street lending facilities tips the scales, and we recommend that investors overweight high-yield Energy relative to the overall junk index. In particular, we think investors should focus on the Independent sub-sector where value is very attractive and most issuers can tap the Fed for help if needed. We would, however, avoid the Oil Field Services sector where the bulk of Energy defaults are likely to come from. Midstream and Refining should perform well, but are less cyclical and less attractively valued than the Independent sub-sector. Jeremie Peloso Senior Analyst jeremiep@bcaresearch.com Ryan Swift US Bond Strategist rswift@bcaresearch.com Footnotes 1 Please see US Bond Strategy Special Report, “The Outlook For Energy Bonds Part 1: A Model Of Energy Bond Excess Returns”, dated July 14, 2020, available at usbs.bcaresearch.com 2 Duration-Times-Spread (DTS) is a simple measure that is highly correlated with excess return volatility for corporate bonds. The DTS ratio is the ratio of a sector’s DTS to that of the benchmark index. It can be thought of like the beta of a stock. A DTS ratio above 1.0 signals that the sector is cyclical (or “high beta”), a DTS ratio below 1.0 signals that the sector is defensive or (“low beta”). For more details on the DTS measure please see: Arik Ben Dor, Lev Dynkin, Jay Hyman, Patrick Houweling, Erik van Leeuwen & Olaf Penninga, “DTS (Duration-Times-Spread)”, Journal of Portfolio Management 33(2), January 2007. Appendix A Investment Grade Energy Issuers
The Outlook For Energy Bonds Part 2: Buy The Dip In High-Yield Energy
The Outlook For Energy Bonds Part 2: Buy The Dip In High-Yield Energy
Appendix B High-Yield Energy Issuers
The Outlook For Energy Bonds Part 2: Buy The Dip In High-Yield Energy
The Outlook For Energy Bonds Part 2: Buy The Dip In High-Yield Energy
Highlights US consumer spending will stall this summer in response to the rising number of Covid cases. Worries about the looming fiscal cliff could also dampen sentiment. Markets are likely to trade nervously over the coming days, but ultimately, stocks will resume their uptrend. The number of new cases already seems to be peaking in some southern US states, and there is no political will to rescind fiscal stimulus. Many institutional investors missed out on the equity rally and will be keen to “buy the dip” on any opportunity. The drop in government bond yields since the start of the year has more than offset the decline in earnings expectations. As odd as it sounds, the pandemic may have raised the fair value of equities. If one wants to challenge this conclusion, one needs to demonstrate that: 1) earnings estimates have not fallen enough; 2) government bond yields have been artificially suppressed; or 3) the post-pandemic world justifies a higher equity risk premium. While there is some truth to all three arguments, they are unlikely to hold much sway over the next 12 months, provided that global growth rebounds and governments and central banks maintain ultra-accommodative fiscal and monetary policies. Investors should remain overweight global equities, while tilting their exposure to beaten-down cyclically-geared stocks and non-US markets. The equity bull market will only end when central banks get panicky about rising inflation, which is unlikely to happen for the next three years. From ROMO To FOMO People often talk about FOMO (the Fear of Missing Out). But for many institutional investors, the past four months has been more about ROMO – the Reality of Missing Out. Chart 1Many Investors Are Bearish On Stocks
Many Investors Are Bearish On Stocks
Many Investors Are Bearish On Stocks
Many investment professionals missed the rally that began in March, and not much has changed since then. The July BofA Merrill Lynch Survey of Fund managers revealed that fund managers are almost one standard deviation overweight cash and nearly one standard deviation underweight equities. In fact, cash allocations increased further since June. The latest sentiment survey conducted by the American Association of Individual Investors (AAII) tells a similar story. Bears exceeded bulls by 15 points in this week’s tally, one of the highest spreads on record (Chart 1). This is not what market tops look like. Near-Term Worries Granted, risks abound. The Google Mobility Index has hooked lower, reflecting the worsening Covid outbreak in the sunbelt states and parts of the Midwest. This real time index tends to track economic activity quite well (Chart 2). At this point, it is reasonable to expect the recovery in US consumer spending to stall this summer. Chart 2Covid Outbreak Is Weighing On Spending
Global Equities Can Still Go Higher
Global Equities Can Still Go Higher
Worries about the fiscal cliff could also dampen sentiment. Unemployment benefits for the average American worker are set to fall by more than 60% at the end of July. The funds in the Paycheck Protection Program for small businesses are also running out. To make matters worse, many state and local governments, which began their fiscal year in July, are facing a severe cash crunch due to evaporating tax revenues and rising social spending obligations. Meanwhile, the US elections are only four months away. If the Democrats win the White House and take control of the Senate, the Trump tax cuts will be in jeopardy. Joe Biden has pledged to lift corporate tax rates halfway back to their original levels. This would reduce S&P 500 EPS by about 6%. Risks In Perspective While the discussion above suggests that stocks could trade nervously over the coming days, we should keep things in perspective. The number of new Covid cases has been trending lower in Arizona over the past week and may be close to peaking in the other southern states (Chart 3). Positive news on the vaccine front could also buoy sentiment. Chart 3A Snapshot Of The Number Of New Cases In The Most Afflicted US States
Global Equities Can Still Go Higher
Global Equities Can Still Go Higher
With respect to the fiscal cliff, there is a very high probability that Congress will reach a deal on a new aid package worth around $2.5 trillion. Table 1 shows stimulus remains politically popular nationwide and, more importantly, in the swing states. Table 1There Is Much Public Support For Fiscal Stimulus
Global Equities Can Still Go Higher
Global Equities Can Still Go Higher
If Democrats prevail in November and raise corporate taxes, most of the revenue gained will be plowed back into the economy. Given that empirical estimates suggest that the spending multiplier from the corporate tax cuts was quite small, the net effect will probably be stimulative.1 The risk of an all-out trade war with China would also decline under a Biden administration, which is something the stock market would welcome. Some might contend that stocks are already pricing in a very rosy outlook. However, as we argue below, it is far from clear that this is the case. Has All The Good News Been Priced In? An NPV Analysis The fair value of the stock market can be represented as the expected stream of cash flows that shareholders will receive, deflated by an appropriate discount rate. The discount rate, in turn, can be expressed as a risk-free rate plus an equity risk premium (ERP). The ERP compensates investors for holding riskier stocks compared to safer government bonds. At the start of the year, Wall Street analysts expected S&P 500 earnings to increase by 9% in 2020 and by 11% in both 2021 and 2022. Today, analysts expect earnings to shrink by 23% in 2020, but then rebound by 29% in 2021. This would essentially take earnings back to last year’s levels. Looking further out, analysts expect earning to recover a further 17% in 2022, which would put them on track to reach their pre-pandemic trend by 2024. In contrast, market participants see little scope for a recovery in bond yields (Chart 4). According to the forward curve, the US 10-year is poised to rise from 0.62% at present to just 1.3% in five years’ time. At the start of 2020, investors thought the 10-year yield would be 2.5% in 2025. Along the same vein, the 30-year bond yield is down 106 bps since the start of the year. The 30-year TIPS yield has fallen by 82 bps. Since stocks are a long duration asset, the TIPS yield is a good proxy for the inflation-adjusted, risk-free component of the discount rate. Chart 4After Nosediving, Bond Yields Aren’t Expected To Rise By Much
After Nosediving, Bond Yields Aren't Expected To Rise By Much
After Nosediving, Bond Yields Aren't Expected To Rise By Much
Chart 5 shows that if we combine the change in analyst earnings expectations with the drop in the TIPS yield, the net present value (NPV) of S&P 500 earnings has risen by a staggering 16.2% since the start of the year. Chart 5The Present Value Of Earnings: A Scenario Analysis
Global Equities Can Still Go Higher
Global Equities Can Still Go Higher
Really? It might seem preposterous to conclude that the fair value of the S&P 500 may have increased at a time when the US and the rest of the world have plunged into the deepest recession since the 1930s. Yet, it naturally flows from the premise that the hit to earnings from the pandemic will be temporary, while the decline in bond yields will be much longer lasting. If one wants to challenge this conclusion, one needs to demonstrate that: 1) earnings estimates have not fallen enough; 2) government bond yields have been artificially suppressed; or 3) the post-pandemic world justifies a much higher equity risk premium. Let us examine all three arguments in turn. Are Earnings Estimates Too Optimistic? The short answer is yes. However, this does not say very much. As Chart 6 shows, analysts are usually too optimistic. They typically start every year with overinflated estimates, and subsequently have to scale them down. This happens even during economic expansions. Thus, if estimates end up being trimmed over the coming months, this will not necessarily prevent stocks from moving higher. Chart 6Earnings Estimates Tend To Be Revised Down Even In The Best Of Times
Are Earnings Estimates Too Optimistic? Earnings Estimates Tend To Be Revised Down Even In The Best Of Times
Are Earnings Estimates Too Optimistic? Earnings Estimates Tend To Be Revised Down Even In The Best Of Times
Of course, magnitudes matter a lot. If analysts end up having to revise estimates down more than usual, this could hurt stocks. But will they? That is far from a foregone conclusion. Earnings usually follow the path of nominal GDP. The Congressional Budget Office (CBO) expects the level of nominal GDP to be just half a percentage point lower in 2021 than it was in 2019. In this light, the notion that earnings next year will be on par with last year’s levels does not seem that farfetched. Moreover, one should also note that health care and technology are highly overrepresented on Wall Street compared to Main Street. Together, they account for 42% of S&P 500 market capitalization. Outside these two sectors, S&P 500 earnings are expected to be 9% lower in 2021 relative to 2019. In any case, the conclusion that the pandemic has increased the fair value of equities would not change much if we were to assume that earnings recover more slowly than anticipated. The red colored bar in Chart 5 shows the impact on the NPV in a scenario where earnings only return to their pre-pandemic trend by 2030: the NPV still rises by 13.5%. Even if we assume that earnings permanently remain 5% below their pre-pandemic forecast, the NPV would still increase by 9.2% (blue colored bar). In order to push down the NPV by a considerable amount, one would need to assume that the pandemic will not only reduce the level of corporate earnings, but it will reduce the growth rate of earnings as well. For example, if the pandemic reduces earnings growth by one percentage point, this would cause the NPV to fall by 7.5% (gray colored bar). Is this a sensible assumption, however? We don’t think so. While the pandemic will reduce capital spending temporarily, it is unlikely to damage the long-term growth rate of either productivity or the labor force, the two key drivers of potential output. Chart 7 shows that even after the Great Depression, per capita income eventually returned to its long-term trend. Chart 7No Clear Evidence That The Great Depression Lowered Long-Term Trend Growth
No Clear Evidence That The Great Depression Lowered Long-Term Trend Growth
No Clear Evidence That The Great Depression Lowered Long-Term Trend Growth
Are Bond Yields Distorted To The Downside? The notion that the pandemic may have increased the fair value of the stock market hinges critically on the view that the discount rate has fallen substantially this year. We will get to the question of what the appropriate level of the equity risk premium should be in a moment, but let us first examine the risk-free component of the discount rate. Many pundits argue that central bank bond purchases have pushed down yields below where they ought to be. That may be true, but it is not clear why that matters. If one is making present value calculations, one should look at the actual bond yield, not the yield that accords with one’s preconception of what is appropriate. Granted, if bond yields were to rise sharply in the future, the present value of future earnings would probably end up falling. However, this is unlikely to occur anytime soon. It will take a while for unemployment to return to pre-pandemic levels, during which time inflation will remain dormant. And even once inflation starts rising, central banks will likely refrain from hiking rates because they have been concerned about excessively low inflation for nearly two decades. Central banks could also face pressure from governments to keep rates low in order to suppress interest costs. As a result, real rates could fall initially, which would be supportive of stocks. The bull market in equities will only end when inflation reaches a level that makes markets nervous that central banks will have to raise rates. This is unlikely to happen for the next three years. The Equity Risk Premium Is More Likely To Fall Than Rise Chart 8Non-US Stocks Look Cheaper Than Their US Peers In Both Absolute Terms And In Relation To Bond Yields
Non-US Stocks Look Cheaper Than Their US Peers In Both Absolute Terms And In Relation To Bond Yields
Non-US Stocks Look Cheaper Than Their US Peers In Both Absolute Terms And In Relation To Bond Yields
As noted above, there are many risks confronting investors. The key question is whether the stock market’s perception of these risks will subside or intensify. If it is the former, the equity risk premium will probably shrink, pushing stocks higher. If it is the latter, stocks will fall. Our bet is on the former. We have already learned a lot about the virus. We will learn even more over the coming months. This should reduce the cone of uncertainty investors are facing. On the economic side, central bank asset purchases, combined with large-scale fiscal stimulus, have reduced the tail risk of another market meltdown. If policy stays supportive for the next few years, as we expect, the equity risk premium will shrink. Starting points matter, too. Globally, the equity risk premium, which we calculate by subtracting the real bond yield from the cyclically-adjusted earnings yield, was quite high at the start of the year and is even higher now (Chart 8). This suggests that investors should favor stocks over bonds. A Weaker Dollar Will Give Non-US Stocks An Edge The ERP is particularly elevated outside the US. Thus, valuations tend to favor non-US stocks. Of course, it helps to have factors other than valuations on your side when making investment decisions. In the case of regional and sector allocation, the outlook for the US dollar is critical. Chart 9 shows that cyclical stocks tend to outperform defensives when the dollar is weakening, while non-US stocks tend to do better than their US peers. There are five reasons to expect the US dollar to depreciate over the next 12 months. First, as a countercyclical currency, a revival in global growth should hurt the dollar (Chart 10). Second, the US has been harder hit by the virus over the past few months than most other economies. Thus, the spread between overseas growth and US growth is likely to widen more than usual (Chart 11). Chart 9Cyclical Sectors Should Outperform Defensives As Global Growth Recovers... And A Weaker Dollar Should Also Help Non-US Stocks
Cyclical Sectors Should Outperform Defensives As Global Growth Recovers... And A Weaker Dollar Should Also Help Non-US Stocks
Cyclical Sectors Should Outperform Defensives As Global Growth Recovers... And A Weaker Dollar Should Also Help Non-US Stocks
Chart 10A Revival In Global Growth Should Hurt The Dollar
A Revival In Global Growth Should Hurt The Dollar
A Revival In Global Growth Should Hurt The Dollar
Chart 11The Dollar Will Also Weaken On The Widening Gap Between Overseas Growth And US Growth
The Dollar Will Also Weaken On The Widening Gap Between Overseas Growth And US Growth
The Dollar Will Also Weaken On The Widening Gap Between Overseas Growth And US Growth
Chart 12Interest Rate Differentials No Longer Favor The Dollar
Interest Rate Differentials No Longer Favor The Dollar
Interest Rate Differentials No Longer Favor The Dollar
Third, interest rate differentials no longer favor the dollar, now that the Fed has brought rates down to zero (Chart 12). Fourth, momentum is not on the greenback’s side anymore (Chart 13). Fifth, the dollar is expensive based on measures such as purchasing power parity exchange rates (Chart 14). Chart 13Momentum Is Not On The Greenback’s Side
Global Equities Can Still Go Higher
Global Equities Can Still Go Higher
The right trade over the past few years was to be long the dollar and overweight US stocks. It is time to flip this trade and do the opposite. Peter Berezin Chief Global Strategist peterb@bcaresearch.com Chart 14USD Is Not Cheap
USD Is Not Cheap
USD Is Not Cheap
Footnotes 1 An IMF analysis of the use of funds of listed companies found that only about one fifth of the increase in corporate cash since the adoption of the Tax Cuts and Jobs Act (TCJA) was used for capex and R&D. The rest was utilized for share buybacks, dividend payouts, and other activities. The same study also noted that actual GDP and business investment growth in 2018 fell short of the predicted impact of the TCJA based on empirical studies of postwar US tax changes. Please see Emanuel Kopp, Daniel Leigh, Susanna Mursula, and Suchanan Tambunlertchai, "U.S. Investment Since the Tax Cuts and Jobs Act of 2017," IMF Working Paper, May 31, 2019. Global Investment Strategy View Matrix
Global Equities Can Still Go Higher
Global Equities Can Still Go Higher
Current MacroQuant Model Scores
Global Equities Can Still Go Higher
Global Equities Can Still Go Higher

Banks continue to raise their loss provisions on their credit books because the depressed level of economic activity is increasing the risk of bankruptcies among their borrowers. For now, stalwarts like JP Morgan or US Bancorp are indicating that loss…
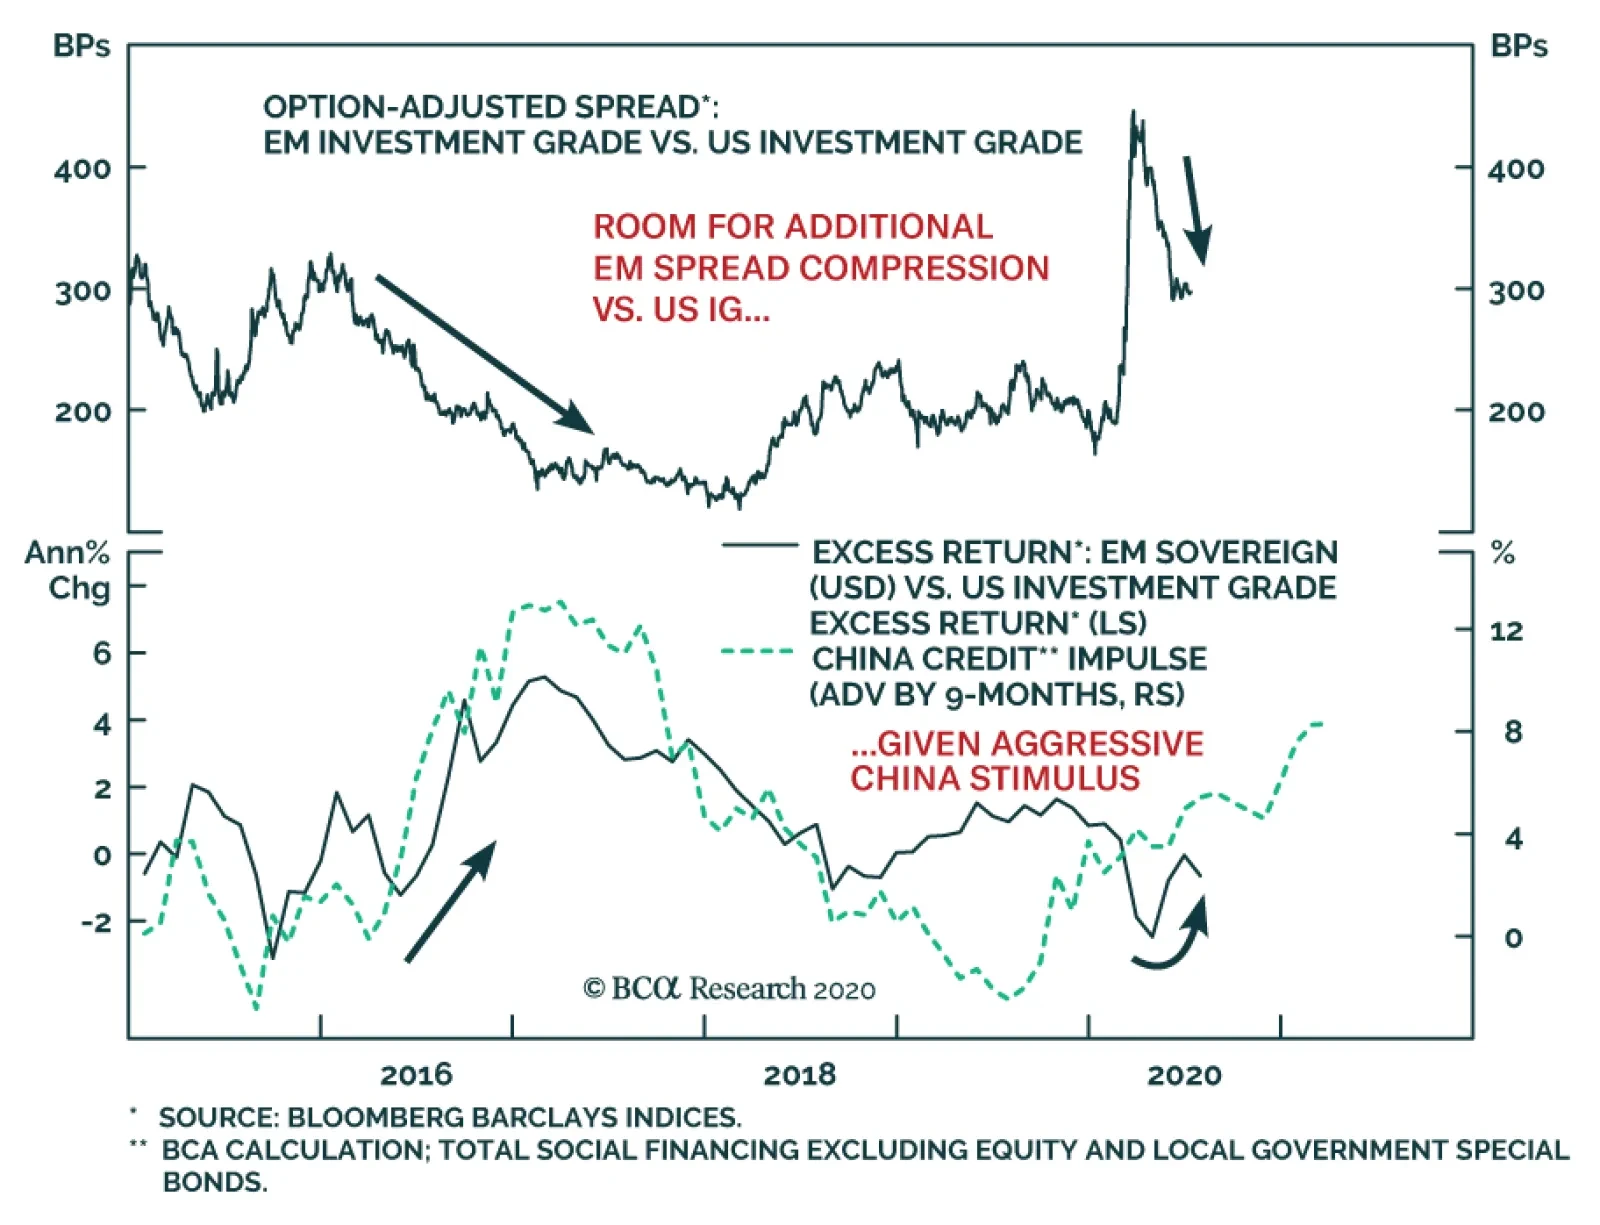
BCA Research's Global Fixed Income Strategy service is upgrading its allocation to EM USD-denominated corporates and sovereigns to neutral. A weaker USD and a clear bottom in growth are required to buy EM USD-denominated sovereign and corporate debt.…
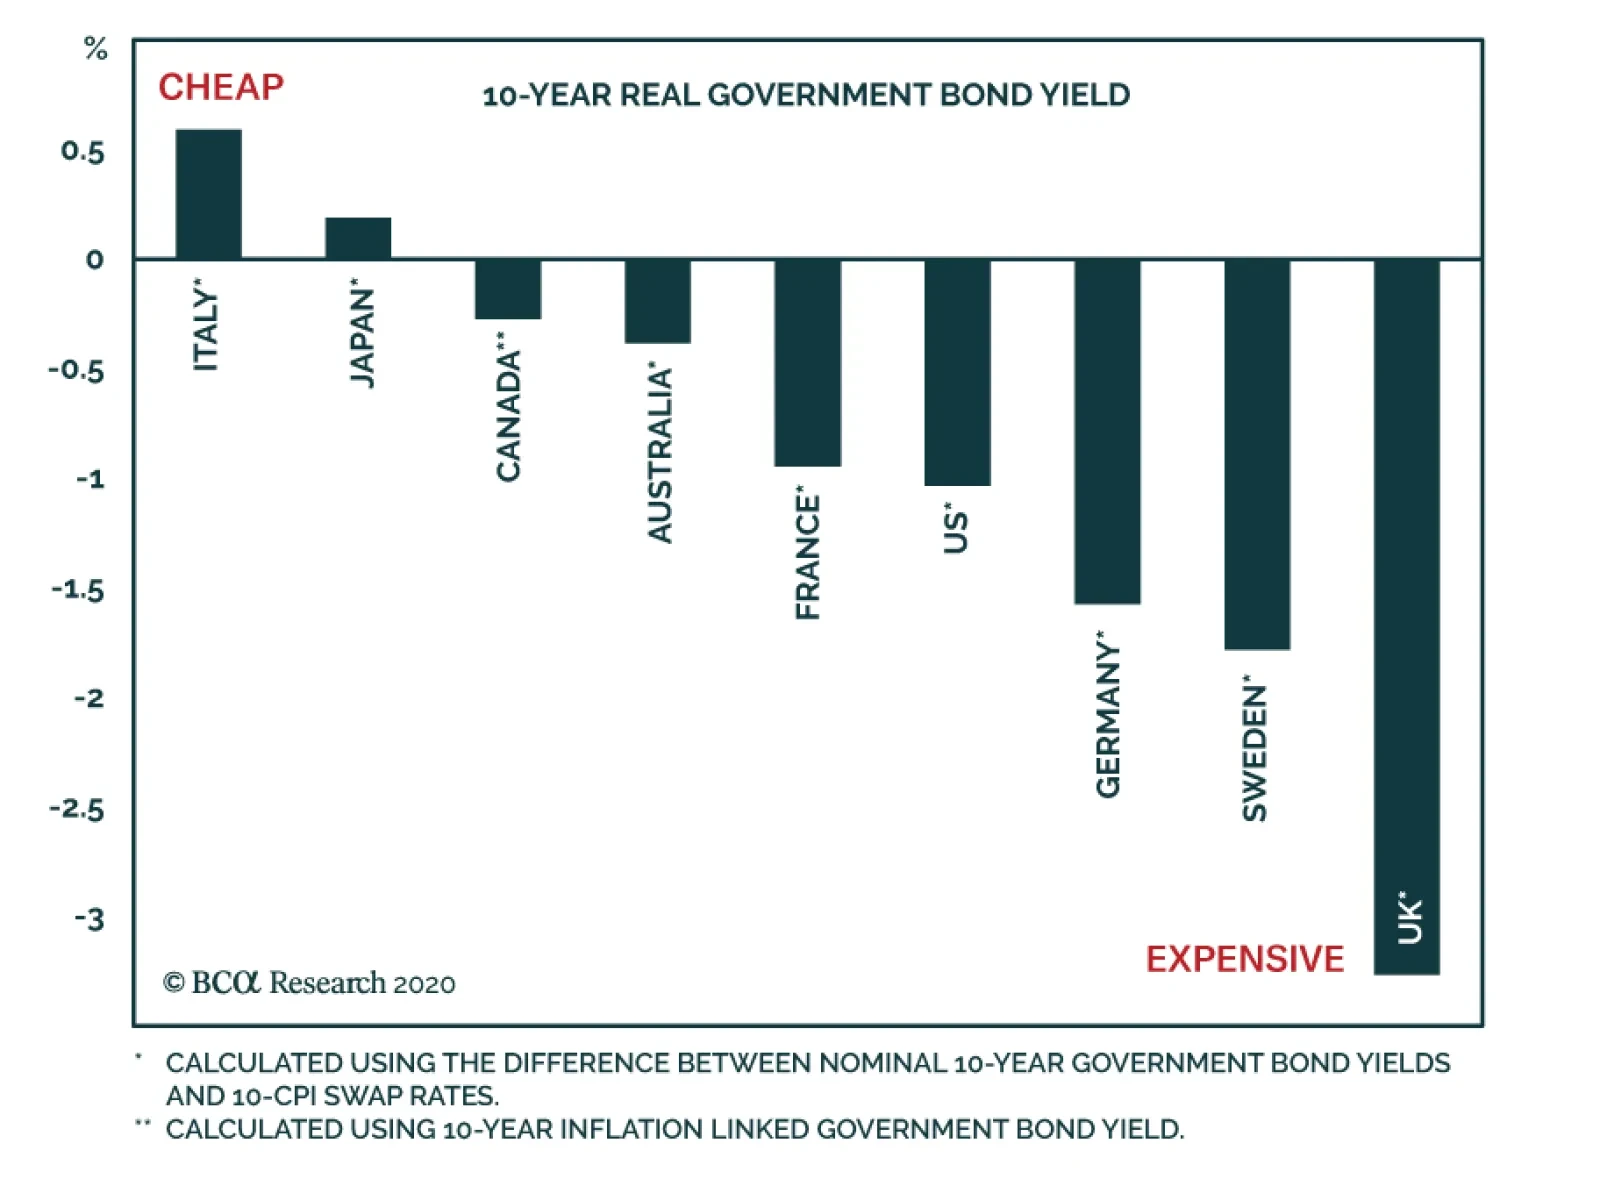
Even at the current low level of yields, government bonds still have a place in a balanced portfolio as a source of diversification against equity and credit risk. However, are govies attractive as standalone assets? In aggregate, our valuation models show…
Highlights Q2/2020 Performance Breakdown: Our recommended model bond portfolio outperformed the custom benchmark by +11bps during the second quarter of the year. Winners & Losers: The government bond side of the portfolio outperformed by +8bps, led by overweights in the US (+4bps), Canada (+4bps) and Italy (+3bps). Spread product generated a small outperformance (+3bps), with overweights in US investment grade (+43bps) offsetting underweights in emerging market debt (-35bps). Scenario Analysis For The Next Six Months: We are sticking close to benchmark on overall duration and spread product exposure, focusing more on relative value between countries and sectors to generate outperformance amid economic uncertainties caused by the growing spread of COVID-19. We continue favoring markets where there is direct buying from central banks, but we are also increasing our recommended exposure to EM USD-denominated debt versus US investment grade corporates. Feature The first half of 2020 has been one of rapid market moves and regime shifts for global fixed income markets. In the first quarter, developed market government debt provided the best returns as bond yields plunged with central banks racing to support collapsing economies through rate cuts and liquidity injections. In Q2, corporate credit delivered the top returns, as economies started to emerge from the COVID-19 lockdowns and, more importantly, the Fed and other major central banks delivered direct support to frozen credit markets through asset purchases. Now, even as an increasing number of global growth indicators are tracing out a "V"-shaped recovery, new cases of COVID-19 are surging though the southern US and major emerging economies like Brazil and India. This raises new challenges for investors for the second half of 2020. A second wave of the coronavirus could jeopardize the nascent global economic recovery, even after the massive easing of monetary and fiscal policies, at a time when valuations on many risk assets appear stretched. In this report, we review the performance of the BCA Research Global Fixed Income Strategy (GFIS) model bond portfolio during the second quarter of 2020. We also present our recommended portfolio positioning for the next six months. Given the lingering uncertainties from the renewed spread of COVID-19, we continue to take a more measured approach in our portfolio allocations. That means focusing more on relative value between countries and sectors while staying closer to benchmark on overall global duration and spread product exposure versus government bonds (Table 1). Table 1GFIS Model Bond Portfolio Recommended Positioning For The Next Six Months
GFIS Model Bond Portfolio Q2/2020 Performance Review & Current Allocations: Selective Optimism
GFIS Model Bond Portfolio Q2/2020 Performance Review & Current Allocations: Selective Optimism
As a reminder to existing readers (and to new clients), the model portfolio is a part of our service that complements the usual macro analysis of global fixed income markets. The portfolio is how we communicate our opinion on the relative attractiveness between government bond and spread product sectors. We do this by applying actual percentage weightings to each of our recommendations within a fully invested hypothetical bond portfolio. Q2/2020 Model Portfolio Performance Breakdown: Slight Outperformance For Both Sovereigns And Credits Chart 1Q2/2020 Performance: Modest Gains From Relative Positioning
Q2/2020 Performance: Modest Gains From Relative Positioning
Q2/2020 Performance: Modest Gains From Relative Positioning
The total return for the GFIS model portfolio (hedged into US dollars) in the second quarter was 3.22%, modestly outperforming the custom benchmark index by +11bps (Chart 1).1 In terms of the specific breakdown between the government bond and spread product allocations in our model portfolio, the former generated +8bps of outperformance versus our custom benchmark index while the latter outperformed by +3bps. That government bond return includes the small gain (+2bps) from inflation-linked bonds, which we added as a new asset class in our model portfolio framework on June 23.2 In a world of very low bond yields (Table 2), our preference for the higher-yielding government bond markets in the US, Canada, the UK and Italy was the main source of outperformance, delivering a combined excess return of +13bps (including inflation-linked bonds). Our underweight in Japan delivered a surprising positive excess return of +4bps as longer-dated JGB yields – which do not fall under the Bank of Japan’s yield curve control policy – rose during the quarter. Underweights in the low-yielding core euro area countries of Germany and France were a drag on the portfolio (a combined -10bps), particularly the latter where longer-maturity French bonds enjoyed a very strong rally in Q2. Table 2GFIS Model Bond Portfolio Q2/2020 Overall Return Attribution
GFIS Model Bond Portfolio Q2/2020 Performance Review & Current Allocations: Selective Optimism
GFIS Model Bond Portfolio Q2/2020 Performance Review & Current Allocations: Selective Optimism
In spread product, our overweights in US investment grade corporates (+43bps), UK investment grade corporates (+7bps) and US commercial MBS (+5bps) squeezed out a combined small gain versus underweights in emerging markets (EM) USD-denominated credit (-35bps), euro area high-yield (-8bps) and lower-rated US high-yield (-6bps). In a world of very low bond yields (Table 2), our preference for the higher-yielding government bond markets in the US, Canada, the UK and Italy was the main source of outperformance. That modest outperformance of the model bond portfolio versus the benchmark is in line with our cautious recommended stance on what are always the largest drivers of the portfolio returns: overall duration exposure and the relative allocation between government debt and spread product. We have stuck close to benchmark exposures on both, eschewing big directional bets on bond yields or credit spreads while focusing more on relative opportunities between countries and sectors. This conservative approach is how we are approaching what we have dubbed “The Battle of 2020” between the opposing forces of coronavirus contagion (which is bullish for government bonds and bearish for credit) and policy reflation (vice versa).3 The bar charts showing the total and relative returns for each individual government bond market and spread product sector are presented in Charts 2 & 3. Chart 2GFIS Model Bond Portfolio Q2/2020 Government Bond Performance Attribution
GFIS Model Bond Portfolio Q2/2020 Performance Review & Current Allocations: Selective Optimism
GFIS Model Bond Portfolio Q2/2020 Performance Review & Current Allocations: Selective Optimism
Chart 3GFIS Model Bond Portfolio Q2/2020 Spread Product Performance Attribution By Sector
GFIS Model Bond Portfolio Q2/2020 Performance Review & Current Allocations: Selective Optimism
GFIS Model Bond Portfolio Q2/2020 Performance Review & Current Allocations: Selective Optimism
The most significant movers were: Biggest Outperformers Overweight US investment grade industrials (+28bps) Overweight US investment grade financials (+12bps) Overweight UK investment grade corporates (+7bps) Overweight US CMBS (+5bps) Underweight Japanese government bonds with maturity greater than 10 years (+5 bps) Biggest Underperformers Underweight EM USD denominated corporates (-24bps) Underweight EM USD denominated sovereigns (-10bps) Underweight EUR high-yield corporates (-8bps) Underweight French government bonds with maturity greater than 10 years (-5bps) Underweight US B-rated high-yield corporates (-4bps) Chart 4 presents the ranked benchmark index returns of the individual countries and spread product sectors in the GFIS model bond portfolio for Q2/2020. Returns are hedged into US dollars (we do not take active currency risk in this portfolio) and adjusted to reflect duration differences between each country/sector and the overall custom benchmark index for the model portfolio. We have also color coded the bars in each chart to reflect our recommended investment stance for each market during Q2/2020 (red for underweight, dark green for overweight, gray for neutral).4 Ideally, we would look to see more green bars on the left side of the chart where market returns are highest, and more red bars on the right side of the chart were returns are lowest. Chart 4Ranking The Winners & Losers From The GFIS Model Bond Portfolio In Q2/2020
GFIS Model Bond Portfolio Q2/2020 Performance Review & Current Allocations: Selective Optimism
GFIS Model Bond Portfolio Q2/2020 Performance Review & Current Allocations: Selective Optimism
The top performing sectors in our model bond portfolio universe in Q2 were all spread product: EM USD-denominated sovereign (+12.9% in USD-hedged terms, duration-matched to the custom model portfolio benchmark index), EM USD-denominated corporate debt (+12.6%), UK investment grade corporates (+11.3%), US investment grade corporates (+10.9%), and high-yield corporates in the euro area (+6.7%) and US (+5.6%). The top performing sectors in our model bond portfolio universe in Q2 were all spread product. During the quarter, we maintained relative exposures to those sectors within an overall small above-benchmark allocation to global spread product – overweight US and UK investment grade versus underweight emerging market credit, neutral overall US high-yield (favoring Ba-rated debt) versus underweight euro area high-yield. Those allocations were motivated by our theme of “buying what the central banks are buying”, like the Fed purchasing US investment grade corporates. Importantly, we had limited exposure to the worst performing sectors during Q2: underweight government bonds in Japan (index return of -0.47% in USD-hedged, duration-matched terms) and Germany (+0.47%), a neutral allocation to Australian sovereign debt (-0.07%) and an underweight in US Agency MBS (+0.20%). The latter two positions came after we downgraded US MBS to underweight in early April and cut our long-held overweight in Australia to neutral in mid-May. Bottom Line: Our model bond portfolio modestly outperformed its benchmark index in the second quarter of the year by +11bps – a positive result driven by our relative positioning that favored higher yielding government debt and spread product sectors directly supported by central bank purchases. Future Drivers Of Portfolio Returns Chart 5Overall Portfolio Allocation: Slightly Overweight Credit Vs Governments
GFIS Model Bond Portfolio Q2/2020 Performance Review & Current Allocations: Selective Optimism
GFIS Model Bond Portfolio Q2/2020 Performance Review & Current Allocations: Selective Optimism
Typically, in these quarterly performance reviews of our model bond portfolio, we make return forecasts for the portfolio based off scenario analysis and quantitative predictions of various fixed income asset classes. However, the current environment is unprecedented because of the COVID-19 outbreak. Not only is there now elevated economic uncertainty, but central banks are running extreme monetary policies in response - including direct intervention in markets through purchases of both government bonds and spread product. Thus, we are reluctant to rely on historical model coefficients and correlations to estimate expected fixed income returns. Instead, we will focus on the logic behind our current model portfolio allocations and the expected contribution to overall portfolio performance over the next six months. At the moment, the main factors that will drive the performance of the model bond portfolio over the next six months are the following: Our recommended overweight stance on relatively higher-yielding sovereigns like the US, Canada and Italy versus low-yielders like Germany, France and Japan; Our allocation to inflation-linked bonds out of nominal government debt in the US, Italy and Canada; Our recommended overweight stance on spread product backstopped by central bank purchases - US investment grade corporates, US Agency CMBS, US Ba-rated high-yield, and UK investment grade corporates; Our recommended underweight stance on riskier spread product - euro area high-yield, US B-rated and Caa-rated high-yield, and EM USD-denominated corporates and sovereigns. The portfolio currently has a small aggregate overweight allocation to spread product relative to government bonds, equal to three percentage points (Chart 5). We feel that is an appropriate allocation to credit versus sovereigns in an environment that is still highly uncertain concerning the spread of COVID-19 and how global growth will evolve over the next 6-12 months. This also leaves room to increase the spread product allocation should the news on the virus and the global economy take a turn for the better. We also remain neutral on overall portfolio duration exposure. Our Global Duration Indicator, which contains growth data like our global leading economic indicator and the global ZEW expectations index, has rebounded sharply and is signaling that bond yields should bottom out in the second half of 2020 (Chart 6). A rise in yields will take longer to develop, however, with virtually all major central banks signaling that policy rates will stay near 0% for an extended period. Chart 6Our Global Duration Indicator Says Bond Yields Will Bottom Out In H2/2020
Our Global Duration Indicator Says Bond Yields Will Bottom Out In H2/2020
Our Global Duration Indicator Says Bond Yields Will Bottom Out In H2/2020
Chart 7Within Governments, Overweight Inflation-Linked Bonds Vs. Nominals
Within Governments, Overweight Inflation-Linked Bonds Vs. Nominals
Within Governments, Overweight Inflation-Linked Bonds Vs. Nominals
The recent moves in developed market government bonds are interesting in terms of the underlying drivers of yields – real yields and inflation expectations. Longer-maturity inflation breakevens – the spread between the yields of nominal and inflation-linked government debt – have drifted higher since late March after major central banks began rapidly easing monetary conditions. At the same time, the actual yields on inflation-linked bonds, i.e. real yields, have moved lower and largely offset the gains in inflation breakevens (Chart 7). Nominal yields have been stuck in very narrow ranges as a result. We do not see that dynamic changing, at least in the near term. Inflation breakevens are too low on our models across all developed markets, and are likely to continue inching higher in the coming months on the back of a pickup in global growth and rising energy prices. At the same time, central banks will be staying on hold for longer while continuing to buy large quantities of nominal bonds, helping push real yields lower. Given these opposing forces on nominal government bond yields, we think it is far too soon to contemplate reducing overall duration – even with equity and credit markets having rallied sharply off the lows and global economic indicators rebounding. Thus, we are maintaining an overall duration exposure close to benchmark in the model portfolio (Chart 8). At the same time, we are playing for wider breakevens and lower real bond yields through allocations to markets where our models indicate better value in being long breakevens: US TIPS, Italian inflation-linked BTPs, and Canadian Real Return Bonds. Within the government bond side of the model bond portfolio, we continue to recommend focusing more on country allocation to generate outperformance. That means concentrating exposures in relatively higher yielding markets like the US, Canada and Italy while maintaining underweights in low-yielding core Europe and Japan. Turning to spread product allocations, we continue to recommend focusing more on policymaker responses to the COVID-19 recession, and its uncertain recovery, rather than the downturn itself. The now double-digit year-over-year growth in global central bank balance sheets - which has led global high-yield and investment grade excess returns by one year in the years after the Global Financial Crisis (Chart 9) – is pointing to additional global corporate bond market outperformance versus governments over the next 6-12 months. Chart 8Overall Portfolio Duration: Close To Benchmark
Overall Portfolio Duration: Close To Benchmark
Overall Portfolio Duration: Close To Benchmark
In other words, we are focusing on global QE rather than global recession, while maintaining a modest recommended overall weighting on global spread product. That allocation could be larger, but we suggest picking the lowest hanging fruit in the credit universe rather than going for the highest beta credit markets like Caa-rated US high-yield that have already seen significant spread compression relative to higher-rated US junk bonds (bottom panel). Chart 9Global QE Supporting Credit Markets
Global QE Supporting Credit Markets
Global QE Supporting Credit Markets
Chart 10Overall Credit Allocation: Keep Buying What The Central Banks Are Buying
Overall Credit Allocation: Keep Buying What The Central Banks Are Buying
Overall Credit Allocation: Keep Buying What The Central Banks Are Buying
We continue to focus our recommended spread product allocations on the parts of global credit markets where central banks are directly buying. We continue to focus our recommended spread product allocations on the parts of global credit markets where central banks are directly buying (Chart 10). In the US, that means overweighting US investment grade corporate bonds (particularly those with maturities of less than five years), US Ba-rated high-yield that the Fed can hold in its corporate bond buying program, US Agency CMBS that is also supported by Fed programs, and UK investment grade corporate bonds that the Bank of England is buying. We also put Italian government bonds into this category, with the ECB buying greater amounts of BTPs as part of its COVID-19 monetary support efforts. What about emerging market debt? We have expressed reservations in recent months about upgrading EM USD-denominated sovereign and corporate debt, even within our portfolio theme of being “selectively opportunistic” about recommended spread product allocations. We have long felt that the time to buy those markets would be when the US dollar had clearly peaked and global growth had clearly bottomed. The latter condition now appears to be in place, and the strong upward momentum in the US dollar is starting to weaken. This forces us to reconsider our stance on EM debt in the model portfolio. Even after the powerful Q2 rally in EM corporate and sovereign debt, EM credit spreads still look relatively attractive using one of our favorite credit valuation metrics – the percentile rankings of 12-month breakeven spreads. Those breakeven spreads are calculated, as the amount of spread widening that would make the return of EM credit equal to duration-matched US Treasuries over a 12-month horizon. We then compare those spreads to their own history to determine how attractive current spread levels are now on a “spread volatility adjusted” basis. Current 12-month breakeven spreads for EM USD-denominated sovereigns and corporates are in the upper quartile of their own history. This compares favorably to other spread products in our model bond portfolio universe, particularly US investment grade corporates where the 12-month breakevens are now just below the long-run median (Chart 11). Chart 11A Comparison Of Credit Sectors Using 12-Month Breakeven Spreads
GFIS Model Bond Portfolio Q2/2020 Performance Review & Current Allocations: Selective Optimism
GFIS Model Bond Portfolio Q2/2020 Performance Review & Current Allocations: Selective Optimism
The current Bloomberg Barclays EM corporate benchmark index option-adjusted spread (OAS) is around 300bps above that of the US investment grade corporate index OAS. That spread still has room to compress further if global growth continues to rebound and the US dollar softens versus EM currencies. Leading growth indicators like the China credit impulse, which has picked up sharply as Chinese authorities have ramped up economic stimulus measures, are now back to levels last seen in 2016 when EM credit strongly outperformed US investment grade corporates (Chart 12). Chart 12Upgrade EM Credit Versus US Investment Grade
Upgrade EM Credit Versus US Investment Grade
Upgrade EM Credit Versus US Investment Grade
Chart 13Overall Portfolio Yield: Close To Benchmark
Overall Portfolio Yield: Close To Benchmark
Overall Portfolio Yield: Close To Benchmark
This week we are upgrading our weighting on EM USD-denominated corporates and sovereigns to neutral, from underweight, in our model bond portfolio. Although we acknowledge that the EM story has been made more complicated by the rapid spread of COVID-19 through the major EM economies, an underweight stance – particularly versus US investment grade credit – is increasingly unwarranted. Therefore, this week we are upgrading our weighting on EM USD-denominated corporates and sovereigns to neutral, from underweight, in our model bond portfolio (see the updated table on pages 17-18). That new allocation will be “funded” by reducing our overweight in US investment grade corporates. Model bond portfolio yield and tracking error considerations Importantly, the selective global government bond and credit allocations we have just outlined do not come at a cost in terms of forgone yield. The portfolio yield after our upgrade of EM debt will be slightly above that of the custom benchmark index (Chart 13), indicating no “negative carry” even when avoiding parts of the US and euro area high-yield markets. Chart 14Overall Portfolio Risk: Moderate
Overall Portfolio Risk: Moderate
Overall Portfolio Risk: Moderate
Finally, turning to the risk budget of the model portfolio, we are aiming for a “moderate” overall tracking error, or the gap between the portfolio’s volatility and that of the benchmark index. The portfolio volatility has fallen dramatically from the surge seen during the global market rout in March, moving lower alongside realized market volatility. The tracking error now sits at 64bps, well below our self-imposed limit of 100bps and within the 50-70bps range we are targeting as a “moderate” level of overall portfolio risk (Chart 14). Bottom Line: We are sticking close to benchmark on overall duration and spread product exposure, focusing more on relative value between countries and sectors to generate outperformance amid economic uncertainties caused by the growing spread of COVID-19. We continue favoring markets where there is direct buying from central banks. We are also increasing our recommended exposure on EM USD-denominated debt to neutral, funded by a reduced allocation to US investment grade corporates where valuations are less attractive. Robert Robis, CFA Chief Fixed Income Strategist rrobis@bcaresearch.com Ray Park, CFA Research Analyst ray@bcaresearch.com Footnotes 1 The GFIS model bond portfolio custom benchmark index is the Bloomberg Barclays Global Aggregate Index, but with allocations to global high-yield corporate debt replacing very high quality spread product (i.e. AA-rated). We believe this to be more indicative of the typical internal benchmark used by global multi-sector fixed income managers. 2 Please see BCA Global Fixed Income Strategy Weekly Report, "How To Play The Revival Of Global Inflation Expectations'", dated June 23 2020, available at gfis.bcaresearch.com. 3 Please see BCA Global Fixed Income Strategy Weekly Report, "Contagion Vs. Reflation: The Battle Of 2020 Rages On", dated June 30, 2020, available at gfis.bcaresearch.com. 4 Note that sectors where we made changes to our recommended weightings during Q2/2020 will have multiple colors in the respective bars in Chart 4. Recommendations The GFIS Recommended Portfolio Vs. The Custom Benchmark Index
GFIS Model Bond Portfolio Q2/2020 Performance Review & Current Allocations: Selective Optimism
GFIS Model Bond Portfolio Q2/2020 Performance Review & Current Allocations: Selective Optimism
Duration Regional Allocation Spread Product Tactical Trades Yields & Returns Global Bond Yields Historical Returns