Fixed Income
Yesterday, the ECB did not cut rates. This can be forgiven, pushing rates further into negative territory will only hurt banks and barely help economic activity. The ECB also eased the terms of the TLTRO-III programs, both in terms of rates (25bps below the…

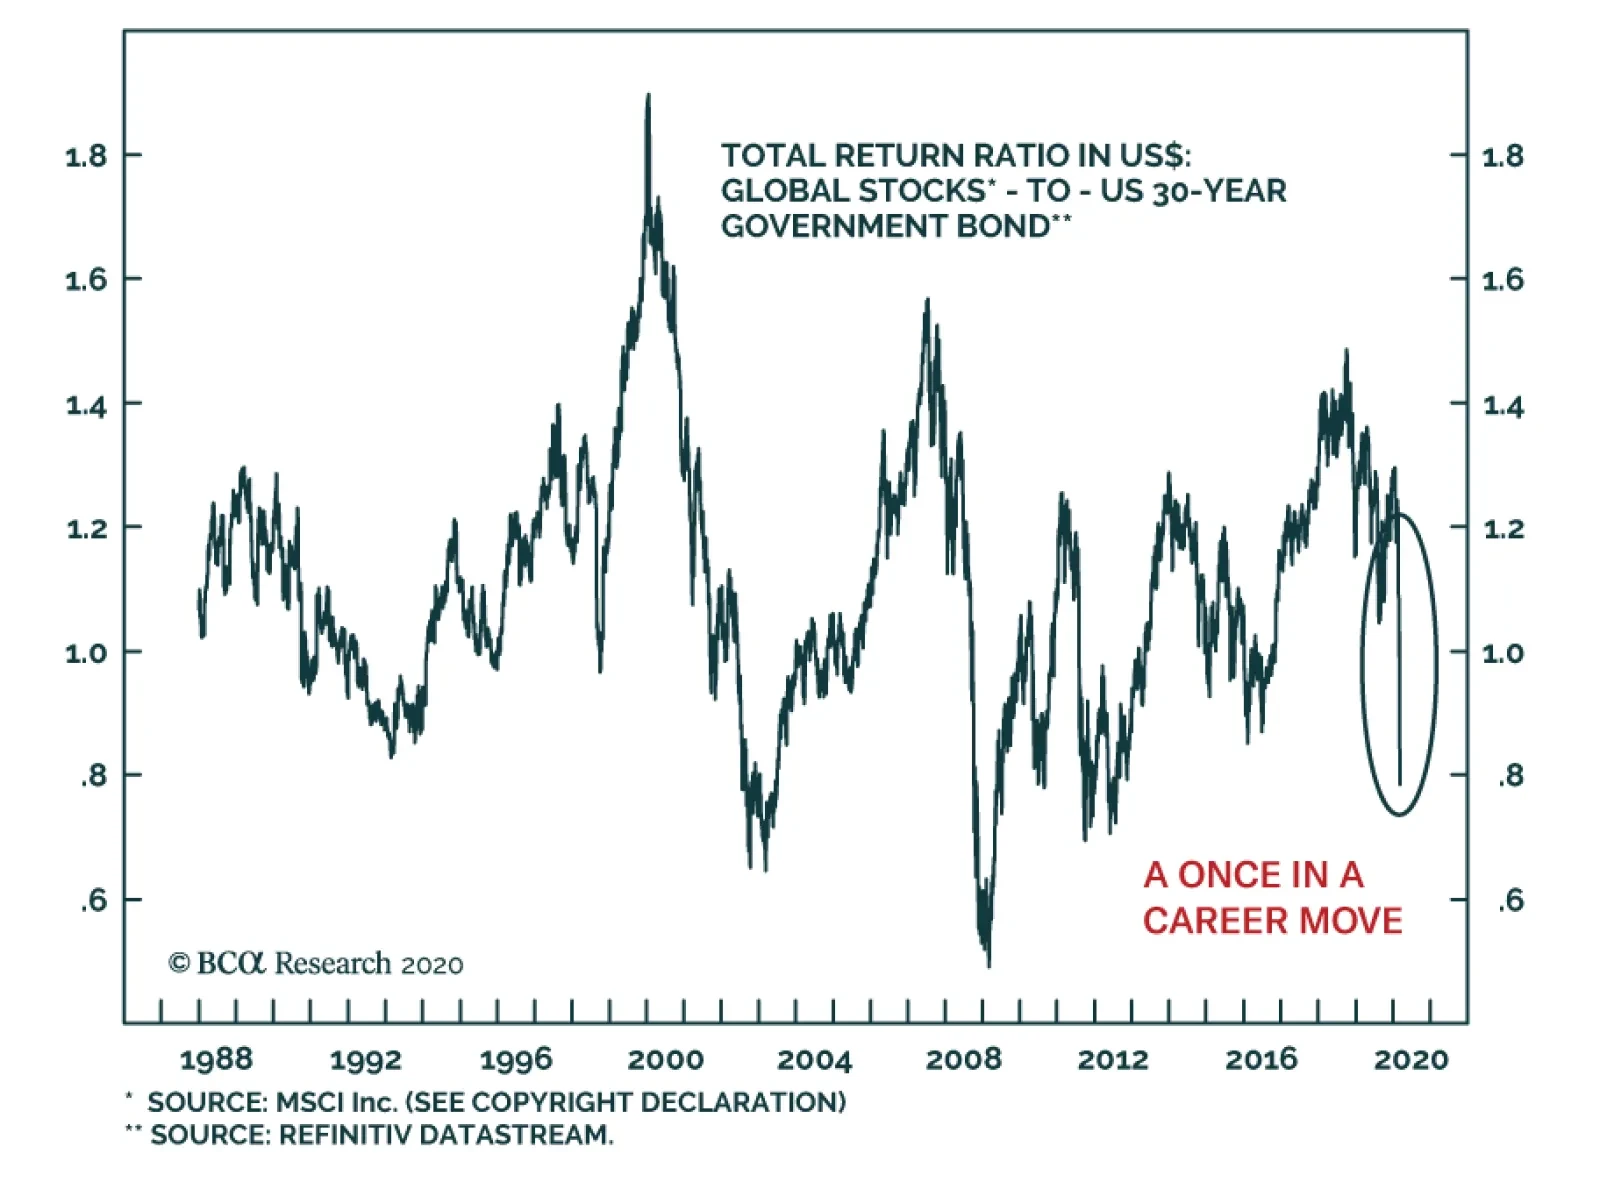
On a happy personal note, I will be away on paternity leave for a short time, reacquainting myself with nappies. As such, there will be no Weekly Reports for the next two weeks, but you will receive two excellent Special Reports penned by my colleagues. Given the ongoing turbulence in the financial markets I will also send out short Alerts as and when necessary. Highlights After the worst three-day rout for stocks versus bonds in living memory, six-month investors have fully capitulated, and the markets are now priced for a technical recession. If the recession can be limited to two quarters, stocks are more likely to outperform long-dated bonds by 12 percent than to underperform by a further 12 percent. Tactical trade: overweight S&P500 versus German 30-year bund, currency hedged, setting a 12 percent profit target with symmetrical stop-loss. The closer that a bond yield gets to the -1 percent lower bound, the more limited becomes the possibility for a further yield decline. Overweight positive yielding bonds versus negative yielding bonds, currency hedged. The most attractive structural pair is overweight the US 30-year T-bond versus the German 30-year bund. Feature Chart of the WeekWidow Makers: Shorting Bonds In Japan, Switzerland... And Now The US
Widow Makers: Shorting Bonds In Japan, Switzerland... And Now The US
Widow Makers: Shorting Bonds In Japan, Switzerland... And Now The US
A Recession Is Now Fully Priced Financial markets have fully priced a downturn when the time horizon of investors that have fully capitulated = the length of the downturn. A week can be a long time in the financial markets. Seven days ago, the markets were not priced for a global recession. Then came the worst three-day rout for stocks versus bonds in living memory, in which stocks underperformed long-dated bonds by 25 percent (Chart I-2).1 Chart I-2The Worst 3-Day Rout: Stocks Underperformed Bonds By 25 Percent
The Worst 3-Day Rout: Stocks Underperformed Bonds By 25 Percent
The Worst 3-Day Rout: Stocks Underperformed Bonds By 25 Percent
The upshot is that investors with six-month horizons have now fully capitulated, meaning the markets are now fully priced for a technical recession (Chart I-3) – defined as a downturn lasting two straight quarters. But the markets are not priced for a more prolonged downturn lasting longer than two quarters. Raising the question: can the downturn be limited to the first half of the year? Chart I-3Six-Month Investors Have Capitulated, Meaning A Recession Is Fully Priced
Six-Month Investors Have Capitulated, Meaning A Recession Is Fully Priced
Six-Month Investors Have Capitulated, Meaning A Recession Is Fully Priced
The pessimistic case is that the coronavirus can neither be contained nor normalised by the summer. Or that even if its direct impact ebbs, there might be second-round effects. A major credit default from, say, a distressed airline or other travel-dependent company could trigger aftershocks in the financial system. Moreover, the recent collapse in the oil price injects new uncertainty into the energy patch as well as into geopolitics. The optimistic case is that large segments of the economy are set to receive a 2009 type triple-boost: from a sharp deceleration in bond yields; from a sharp deceleration in the oil price; and from government spending and/or tax cuts – creating a potent cocktail of stimulants for the second half of this year. Investors with six-month horizons have now fully capitulated. Balancing the pessimistic and optimistic cases, we assess that the downturn can be limited to two quarters – albeit this cannot be our highest conviction view, as we are not experts in epidemiology or immunology. Nevertheless, if this assumption holds, there is now a higher probability that stocks outperform long-dated bonds by 12 percent than that they underperform by a further 12 percent. This three-month tactical trade has a slight twist. It is best expressed as: overweight US stocks versus European bonds (currency hedged). This is because core European bond yields are close to their lower limit, meaning that core European bond prices are close to their mathematical upper limit. All of which brings us to a much higher conviction recommendation. The ‘Widow Maker’ Is Back First the widow maker came to Japan, next to Switzerland, then to the rest of Northern Europe. Now the widow maker has come to America. In the financial lexicon, ‘widow maker’ refers to the fatal strategy of shorting high-quality government bonds in an era when yields have been grinding inexorably lower. Any investment manager who has dared to bet that government bond yields would rise, whether starting from 3 percent, 2 percent, or even 1 percent, and whether in Japan, Switzerland, or even the US – has ended up being carried out of their job in a box, feet first (Chart of the Week). Except that in Switzerland over the past year, the widow maker trade has not been as fatal as it used to be. While the 5-year yield in the US has collapsed by 200 bps, in Switzerland it has edged down by just 20 bps (Chart I-4). Put another way, shorting the US 5-year T-bond has cost 11 percent, but shorting the Swiss 5-year bond has been relatively painless (Chart I-5). Chart I-4Swiss Bond Yields Cannot Fall Much...
Swiss Bond Yields Cannot Fall Much...
Swiss Bond Yields Cannot Fall Much...
Chart I-5...Meaning Swiss Bond Prices Cannot Rise
...Meaning Swiss Bond Prices Cannot Rise
...Meaning Swiss Bond Prices Cannot Rise
The simple reason is that Swiss government bond yields are now very close to their lower bound. The Lower Bound To Bond Yields Is Around -1 Percent The practical lower bound to the policy interest rate is -1 percent, because -1 percent counterbalances the storage cost of holding physical cash and/or other stores of value.2 Imagine the policy rate fell to well below -1 percent. If banks passed this deeply negative rate to their depositors, it would be logical for the bank depositors to flee wholesale into cheaper-to-hold physical cash. This deposit flight would kill the banking system. But if the banks didn’t pass the deeply negative policy rate to their depositors, it would wipe out the banks’ net interest margin – the gap between rates on loans and deposits. This inability to make profits would also kill the banking system. At deeply negative interest rates, bank deposits would flee. Could policymakers just abolish physical cash, forcing us all into ‘digital cash’ with unlimited negative interest rates? No, because that would just push us into other stores of value: for example, gold, or ‘decentralised’ cryptocurrencies. The common objections to cryptocurrencies are that their susceptibility to volatility and fraud makes them a poor store of value. But both objections are also true for gold. Yet who has ever argued that gold cannot be a store of value just because it is volatile and can be stolen (Chart I-6)! Chart I-6Gold Is A Store Of Value Despite Its Volatility
Gold Is A Store Of Value Despite Its Volatility
Gold Is A Store Of Value Despite Its Volatility
The lower bound to the policy rate at around -1 percent also sets the lower bound of the bond yield, because a bond yield is just the expected average policy rate over the bond’s lifetime. For completeness, we should mention one technical exception. If bond investors price in the possibility of being repaid in a different and more valuable currency, the bond yield will carry a further redenomination discount as an offset for the potential currency gain. This is relevant to euro area bonds because there remains the remote possibility of euro disintegration. Therefore, bonds which carry the small possibility of a currency redenomination gain – notably, German bunds – possess a small additional discount on their yields. But in jurisdictions where no currency redenomination is possible, such as Switzerland or Sweden, the practical lower bound to bond yields is around -1 percent. Overweight Positive Yielding Bonds Versus Negative Yielding Bonds Switzerland teaches us that the closer that a bond yield gets to the -1 percent lower bound, the more limited becomes the possibility for a further yield decline (price gain), whereas the possibility for a yield increase (price loss) stays unlimited. Making such bonds a ‘lose-lose’ proposition. The convergence in bond yields has much further to go. Therefore, our high conviction recommendation is to short negative yielding bonds in relative terms. In other words, overweight positive yielding bonds versus negative yielding bonds. And currency hedge the position – as, right now, the cost of currency hedging is low. The recommendation is applicable for both tactical (3-month) and structural (2-year plus) investment horizons, and it is applicable for all bond maturities: 5-year, 10-year, and 30-year. Given where yields now stand, the most attractive structural pair is overweight the US 30-year T-bond versus the German 30-year bund (Chart I-7 and Chart I-8). Chart I-7Expect Yields To Converge At 10-Year Maturities...
Expect Yields To Converge At 10-Year Maturities...
Expect Yields To Converge At 10-Year Maturities...
Chart I-8...And At Ultra-Long ##br##Maturities
...And At Ultra-Long Maturities
...And At Ultra-Long Maturities
Our structural overweight to a 50:50 combination of U.S. T-bonds and Italian BTPs versus a 50:50 combination of German Bunds and Spanish Bonos at 30-year bond maturities is up by 7 percent in just nine months. But the convergence in yields has much further to go (Chart I-9). Chart I-9Overweight Positive Yielding Bonds Versus Negative Yielding Bonds
Overweight Positive Yielding Bonds Versus Negative Yielding Bonds
Overweight Positive Yielding Bonds Versus Negative Yielding Bonds
Fractal Trading System* As discussed, this week’s recommended trade is to overweight stocks versus long-dated bonds expressed as overweight S&P500 versus German 30-year bund. The profit target is 12 percent with a symmetrical stop-loss. In a turbulent week for financial markets, overweight Poland versus Portugal achieved its profit target, short US utilities versus oil and gas and short EUR/CHF hit their stop-losses, and short palladium versus nickel moved comfortably into profit. The rolling 1-year win ratio now stands at 62 percent. Chart I-10Poland Vs. Portugal
Poland Vs. Portugal
Poland Vs. Portugal
When the fractal dimension approaches the lower limit after an investment has been in an established trend it is a potential trigger for a liquidity-triggered trend reversal. Therefore, open a countertrend position. The profit target is a one-third reversal of the preceding 13-week move. Apply a symmetrical stop-loss. Close the position at the profit target or stop-loss. Otherwise close the position after 13 weeks. * For more details please see the European Investment Strategy Special Report “Fractals, Liquidity & A Trading Model,” dated December 11, 2014, available at eis.bcaresearch.com. Dhaval Joshi Chief European Investment Strategist dhaval@bcaresearch.com Footnotes 1 MSCI All-Country World Index (in dollars) versus US 30-year T-bond. 2 The cost of holding physical cash or gold is the cost of its safe storage. Fractal Trading Model
The Widow Maker Is Back... And A Recession Is Fully Priced
The Widow Maker Is Back... And A Recession Is Fully Priced
The Widow Maker Is Back... And A Recession Is Fully Priced
The Widow Maker Is Back... And A Recession Is Fully Priced
Cyclical Recommendations Structural Recommendations
The Widow Maker Is Back... And A Recession Is Fully Priced
The Widow Maker Is Back... And A Recession Is Fully Priced
The Widow Maker Is Back... And A Recession Is Fully Priced
The Widow Maker Is Back... And A Recession Is Fully Priced
The Widow Maker Is Back... And A Recession Is Fully Priced
The Widow Maker Is Back... And A Recession Is Fully Priced
The Widow Maker Is Back... And A Recession Is Fully Priced
The Widow Maker Is Back... And A Recession Is Fully Priced
Trades Closed Trades Asset Performance Currency & Bond Equity Sector Country Equity Indicators Bond Yields Chart II-1Indicators To Watch - Bond Yields
Indicators To Watch - Bond Yields
Indicators To Watch - Bond Yields
Chart II-2Indicators To Watch - Bond Yields
Indicators To Watch - Bond Yields
Indicators To Watch - Bond Yields
Chart II-3Indicators To Watch - Bond Yields
Indicators To Watch - Bond Yields
Indicators To Watch - Bond Yields
Chart II-4Indicators To Watch - Bond Yields
Indicators To Watch - Bond Yields
Indicators To Watch - Bond Yields
Interest Rate Chart II-5Indicators To Watch - Interest Rate Expectations
Indicators To Watch - Interest Rate Expectations
Indicators To Watch - Interest Rate Expectations
Chart II-6Indicators To Watch - Interest Rate Expectations
Indicators To Watch - Interest Rate Expectations
Indicators To Watch - Interest Rate Expectations
Chart II-7Indicators To Watch - Interest Rate Expectations
Indicators To Watch - Interest Rate Expectations
Indicators To Watch - Interest Rate Expectations
Chart II-8Indicators To Watch - Interest Rate Expectations
Indicators To Watch - Interest Rate Expectations
Indicators To Watch - Interest Rate Expectations
Yesterday, BCA Research's Emerging Markets Strategy service took a look at EM sovereign and corporate spreads. Inflows to EM fixed-income funds were enormous in 2019. Meanwhile, EM corporate and sovereign spreads have broken out. Provided this selloff…
Highlights Bear markets occur in phases, and their narrative can mutate. What began as a selloff caused by the coronavirus outbreak could well mutate into an oil crash-led selloff, and then mutate again into a selloff due to policy omnipotence, or something else. We are reiterating our short positions in the EM equity index and a basket of EM currencies versus the US dollar as well as our defensive positioning in EM domestic bonds and credit markets. We are taking profits on our long gold/short oil and copper trade. Oil prices may stabilize, but risks are still skewed to the downside. We are also booking gains on our long Russian domestic bonds/short oil position. Feature Chart I-1A Record Low Currency VOL Is Followed By Major Market Disturbances
A Record Low Currency VOL Is Followed By Major Market Disturbances
A Record Low Currency VOL Is Followed By Major Market Disturbances
Global financial markets are witnessing the unwinding of the policy put. For the past several years, the consensus in the global investment community was that risk assets could not go down because of policy puts from the Federal Reserve, the US Treasury and President Trump, the European Central Bank and the Chinese authorities. Similarly, crude oil prices had been supported by OPEC 2.0’s put from December 2016 until recently. The latest panic and broad-based liquidation of risk assets has been due not only to fear and uncertainty related to the rapid escalation in COVID-19 cases around the world, but also to investor realization that these policy puts are ineffectual. The Fed’s 50-basis-point intra-meeting rate cut proved incapable of stabilizing global risk assets. Investors have begun to doubt the efficacy of policy puts and have thrown in the proverbial towel. Crucially, the high-speed and intensity of the selloff was due to widespread complacency and overbought conditions in risk assets. In our January 23 report, we quoted Bob Prince, co-CIO of Bridgewater, who stated in Davos that “…we have probably seen the end of the boom-bust cycle.” This comment was consistent with prevalent complacency in global financial markets, reflected in very tight credit spreads worldwide, high US equity multiples and record-low implied volatility in various asset classes. In the same January 23 report, we wrote: “Any time an influential person has made a similar declaration in the past, it marked a major turning point in financial markets. Remarkably, implied volatility for the US dollar has plummeted to a record low, as it has for EM currencies and a wide range of equity markets. Chart I-1 illustrates the implied volatility for EM currencies and the US dollar. Such low levels of implied currency market volatility historically preceded major moves in currency markets and often led to a material selloff in broad EM financial markets.” In that same report , we recommended going long implied EM currency volatility. Since then JP Morgan’s EM currency volatility has risen from 6% to 10%. What began as a selloff caused by the coronavirus outbreak could well mutate into an oil crash-led selloff, and then mutate again into a selloff due to policy omnipotence, or something else. Consistent with this thesis, we reinstated our short EM equity index recommendation in the following week’s report – on January 30. The MSCI EM stock index is down 11% since then. Our target is 800, which is 18% below current levels (Chart I-2, top panel). Chart I-2EM Stocks: A Breakdown In The Making
EM Stocks: A Breakdown In The Making
EM Stocks: A Breakdown In The Making
Market Narratives Mutate Chart I-3VIX Surge In Early 2018 Was A Trigger Not Cause Of Selloff
VIX Surge In Early 2018 Was A Trigger Not Cause Of Selloff
VIX Surge In Early 2018 Was A Trigger Not Cause Of Selloff
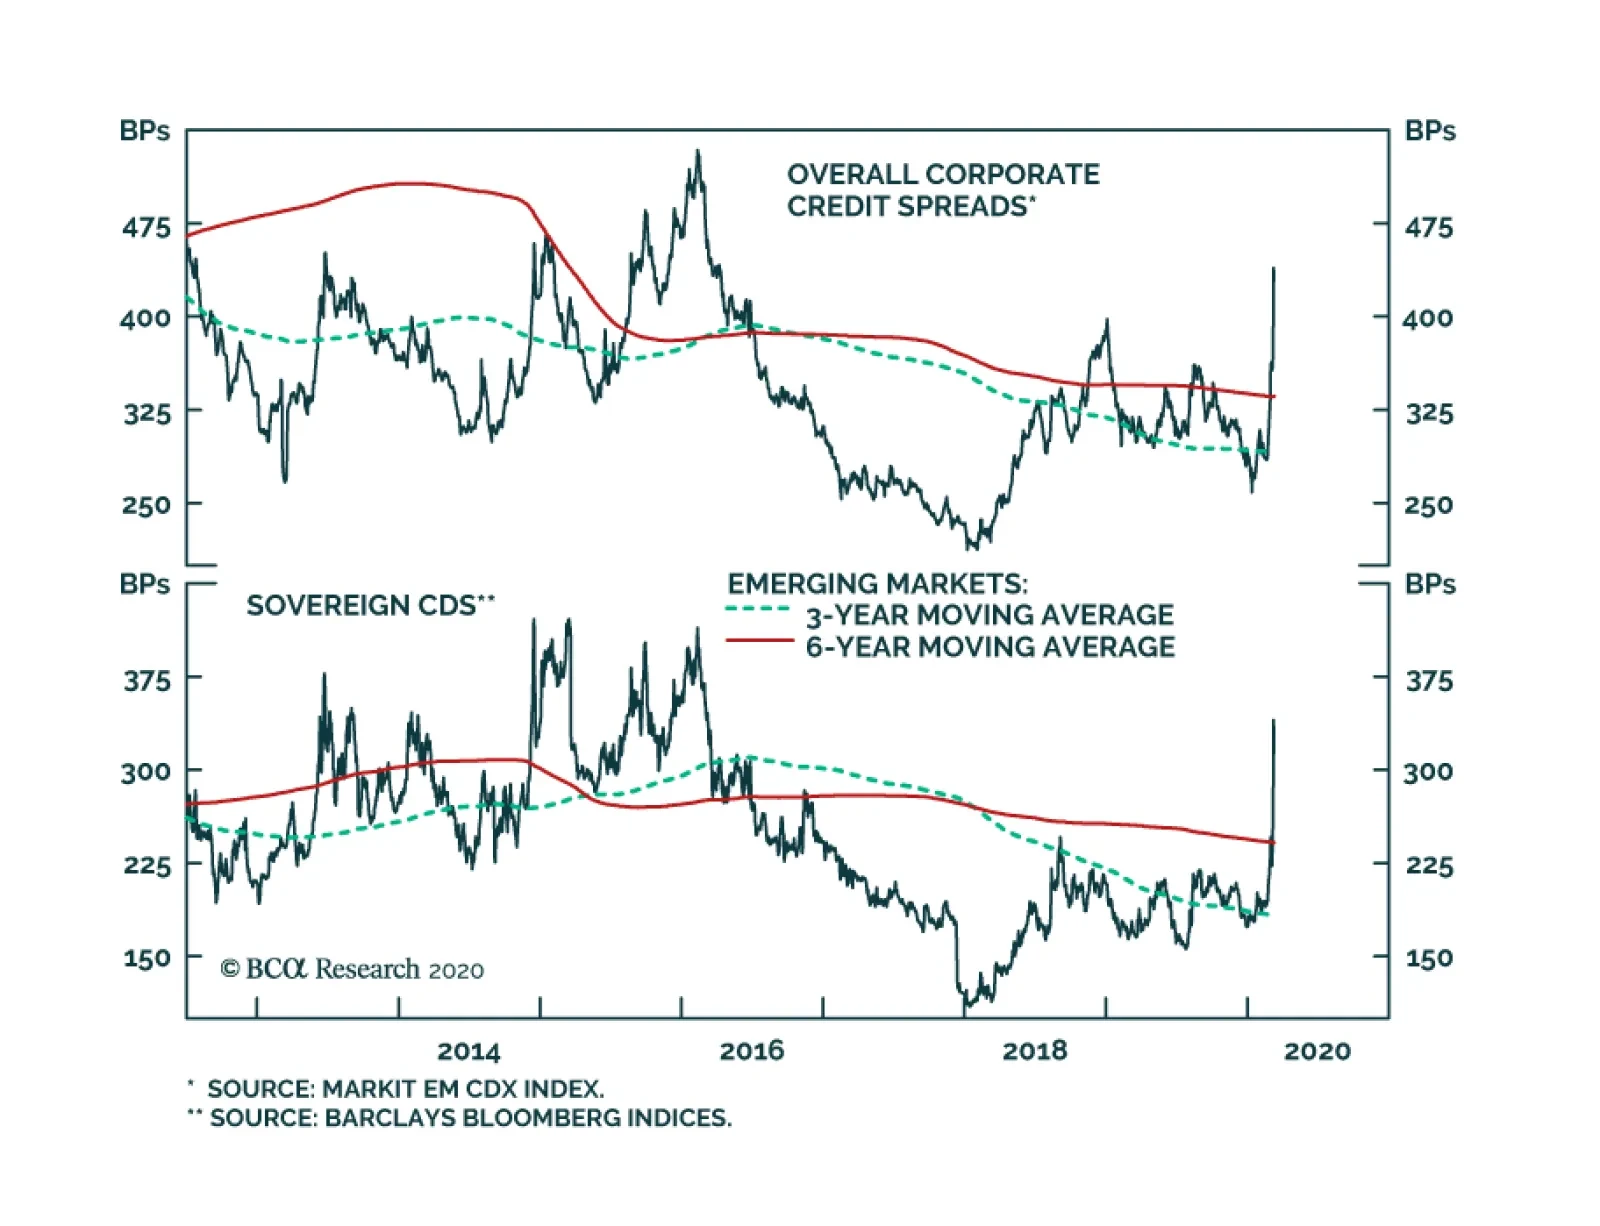
Narratives of all large market moves are always expounded in retrospect. Only after a selloff is well-advanced do investors and commentators come up with reasons for it and build a plausible narrative describing it. Critically, bear markets occur in phases, and their narrative can evolve. What began as a selloff caused by the coronavirus outbreak could well mutate into an oil crash-led selloff, and then mutate again into a selloff due to policy omnipotence, or something else. For example, the early 2018 selloff in global equities and industrial commodities was at the time attributed to the spike in US equity volatility (Chart I-3, top and middle panels). In retrospect, January 2018 marked a major top in the global business cycle (Chart I-3, bottom line). Hence, the true reason for the late-January 2018 top in global stocks and industrial commodities was a downturn in global manufacturing and trade and not the surge in the VIX. The key question investors are currently wrestling with is the following: How deep will this selloff be, and how long will it last? Our view is that the selloff in EM and global risk assets is not yet over. As such, we are reiterating our short positions in the EM equity index and a basket of EM currencies versus the US dollar, as well as our defensive positioning in EM domestic bonds and credit markets. Gauging The Downside There is no doubt that global growth will be affected by the spread of COVID-19 and the precautionary measures taken by the authorities, companies and households around the world to contain the outbreak. Further, growth visibility is extremely low, and that uncertainty is raising the risk premiums that investors demand. The latter is weighing on risk assets in general and global share prices in particular. Presently, precise forecasts for GDP growth and a potential trajectory of COVID-19 cases are not credible, and hence cannot be relied upon to formulate a sound investment strategy. If the current bloodbath in risk assets persists, a market bottom could be reached well before bad economic data are released or COVID-19 infection cases peak. Given the uncertainty related to both the global growth trajectory and the Covid-19 epidemic, the only way for investors to gauge a market bottom is to continuously examine valuations, technicals and market internals. With respect to valuations and technicals, we have the following observations: The EM equity index seems to breaking below its major support lines. If this breakdowns transpires, there is an air pocket until the index reaches its next technical support, which is 18% below its current level (please refer to the top panel of Chart I-2 on page 3). If the EM MSCI equity index drops to this support range, it would be trading at 11 times its trailing earnings (please refer to the bottom panel of Chart I-2 on page 3). At those levels, the EM equity index would be discounting a lot of bad news, making it immune to dismal economic data and general uncertainty. For the S&P 500, if the current defense line – which held been during 2011, 2015 and 2018 selloffs – is violated, the next long-term technical support is around 2400-2500 (Chart I-4). Inflows to EM fixed-income funds were enormous in 2019. Meanwhile, EM corporate and sovereign spreads have broken out (Chart I-5). Provided this selloff commenced from very overbought and expensive levels, the odds are that liquidation forces will not abate right now and that the selloff in EM fixed income has further to go. Chart I-4S&P 500: Where Technical Support Lies?
S&P 500: Where Technical Support Lies?
S&P 500: Where Technical Support Lies?
Chart I-5EM Sovereign And Corporate Spreads Have Broken Out
EM Sovereign And Corporate Spreads Have Broken Out
EM Sovereign And Corporate Spreads Have Broken Out
In a nutshell, we suspect that EM local currency bonds and credit markets received a lot of inflows from European investors in recent years because yields were negative across European fixed-income markets. A weak euro was a boon for European investors investing in EM. That, however, is reversing. Since the recent sharp appreciation in the euro and the nosedive in EM currencies, EM financial market returns in euros have collapsed. This will likely prompt an exodus of European investors from EM financial markets. Chart I-6A Major Breakdown In This Cyclical Indicator
A Major Breakdown In This Cyclical Indicator
A Major Breakdown In This Cyclical Indicator
Even though the EM equity index is not expensive or overbought, rising EM USD and local currency bond yields herald lower share prices, as we discussed at length in last week’s report. Our Risk-On/Safe-Haven currency ratio1 has plummeted below its major technical support and the next level is significantly lower. In other words, this indicator is also in an air pocket (Chart I-6). Given it is extremely well-correlated with EM share prices, the latter will not bottom until this indicator stabilizes. Technical configurations of high-beta and cyclical segments of the global equity universe are consistent with failed breakouts. Such a profile is typically not followed by a correction, but by a major drawdown. These include the European aggregate equity index, the Nikkei, global industrials and US high-beta stocks (Chart I-7). Chart I-7AFailed Breakouts Are Often Followed By Large Drawdowns
Failed Breakouts Are Often Followed By Large Drawdowns
Failed Breakouts Are Often Followed By Large Drawdowns
Chart I-7BFailed Breakouts Are Often Followed By Large Drawdowns
Failed Breakouts Are Often Followed By Large Drawdowns
Failed Breakouts Are Often Followed By Large Drawdowns
Chart I-8The Global Stocks-To-Bonds Ratio Is Back To 2011 Levels
The Global Stocks-To-Bonds Ratio Is Back To 2011 Levels
The Global Stocks-To-Bonds Ratio Is Back To 2011 Levels
Finally, the global stock-to-bond ratio has decisively broken below the upward sloping channel that has been in place since 2009 (Chart I-8). Typically, when a market or ratio experiences such a major breakdown, the recovery does not occur quickly and is unlikely to be V-shaped. In short, the structural breakdown in the global stocks-to-bond ratio suggests that global share prices will likely stay under downward pressure for some time. Bottom Line: Odds are that risk assets remain in a liquidation phase and investors should avoid catching a falling knife. The odds are also high that EM share prices in US dollar terms have another 18% downside. We reckon at those levels – where the MSCI EM equity index is around 800 – it would be safe to start accumulating EM equities, even if the global growth outlook remains mired in uncertainty. For now, we recommend playing EM on the short side. What To Do With Oil Plays Despite periodic spikes in crude prices over the past few years, we have held our conviction that oil is in a structural bear market. We doubted the sustainability of the OPEC 2.0 arrangement, arguing that Russia would not cooperate with Saudi Arabia in the long term. Russia did cooperate much longer than we had expected, temporarily supporting oil prices. Ultimately, Russian President Vladimir Putin abandoned the cartel late last week, and the Saudis have hit back with massive price discounts amid large output increases. Consequently, oil prices have crashed and are presently oversold (Chart I-9). Given the uncertainty related to both the global growth trajectory and the Covid-19 epidemic, the only way for investors to gauge a market bottom is to continuously examine valuations, technicals and market internals. However, there will be no rapprochement between the Saudis and the Russians for some time. Given the drop in demand amid sharp increases in supply, crude oil prices may well slide further. Since July 11, 2019, we have been recommending a long gold/short oil and copper trade (Chart I-10). This position has generated a large 40% gain. Today, we are taking profits on this trade. Instead, we are replacing it with a new position: long gold/short copper. Chart I-9A Long-Term Profile Of Oil Prices
A Long-Term Profile Of Oil Prices
A Long-Term Profile Of Oil Prices
Chart I-10Book Profits On Long Gold / Short Oil And Copper Trade
Book Profits On Long Gold / Short Oil And Copper Trade
Book Profits On Long Gold / Short Oil And Copper Trade
Among oil plays, we have been overweight Mexico and Russia within EM, both in fixed income and equity universes. That said, for absolute return investors, we have not been recommending unhedged long positions in either Mexico or Russia because of our expectation of a drop in oil prices and the ensuing broad-based EM selloff. Regarding Russia, for investors who were looking to gain exposure to local currency bonds, we have been recommending that they hedge this position by shorting oil since November 14, 2019. This recommendation has paid off well, and we are closing this position with a 26% gain. We will be looking to buy Russian local bonds unhedged in the weeks ahead. Chart I-11Relative Performance Of Russian And Mexican Domestic Bonds Is Facing Near-Term Headwinds
Relative Performance Of Russian And Mexican Domestic Bonds Is Facing Near-Term Headwinds
Relative Performance Of Russian And Mexican Domestic Bonds Is Facing Near-Term Headwinds
In Mexico, we have also been reluctant to recommend naked exposure to local currency or US dollar bonds because of our bearish view on oil and the risk of large outflows from EM that would hurt the peso. Indeed, the oil crash and outflows from EM have led to a plunge in the Mexican currency. Instead, in Mexico we have been recommending betting on yield curve steepening. The proposition has been that short rates are anchored by a disinflationary backdrop and tight fiscal policy in Mexico while the long end of the curve could sell off in a scenario of capital outflows from EM. As with Russia, we are monitoring Mexican markets and are looking to recommend buying domestic bonds without hedging the currency risk in the weeks or months ahead. Bottom Line: We are taking profits on our long gold/short oil and copper trade. Oil prices may stabilize, but risks are still skewed to the downside. In the near term, the relative performance of Mexican and Russian stocks and local currency bonds versus their respective EM benchmarks could be undermined by capital outflows from EM in general and these countries in particular (Chart I-11). Nevertheless, both nations’ macro fundamentals remain benign, and their fixed-income and equity markets will outperform their EM peers in the medium term. Arthur Budaghyan Chief Emerging Markets Strategist arthurb@bcaresearch.com Footnotes 1 Calculated as ratio of equal-weighted average of total return indices of cad, aud, nzd, brl, idr, mxn, rub, clp & zar relative to average of jpy & chf total returns (including carry); rebased to 100 at January 2000. Equities Recommendations Currencies, Credit And Fixed-Income Recommendations
Yesterday, BCA Research's Global Fixed Income Strategy service wrote that if there is one silver lining amidst the market carnage, it is that there appear to be few signs of 2008-style systemic financial stress. Bank funding indicators like Libor-OIS…
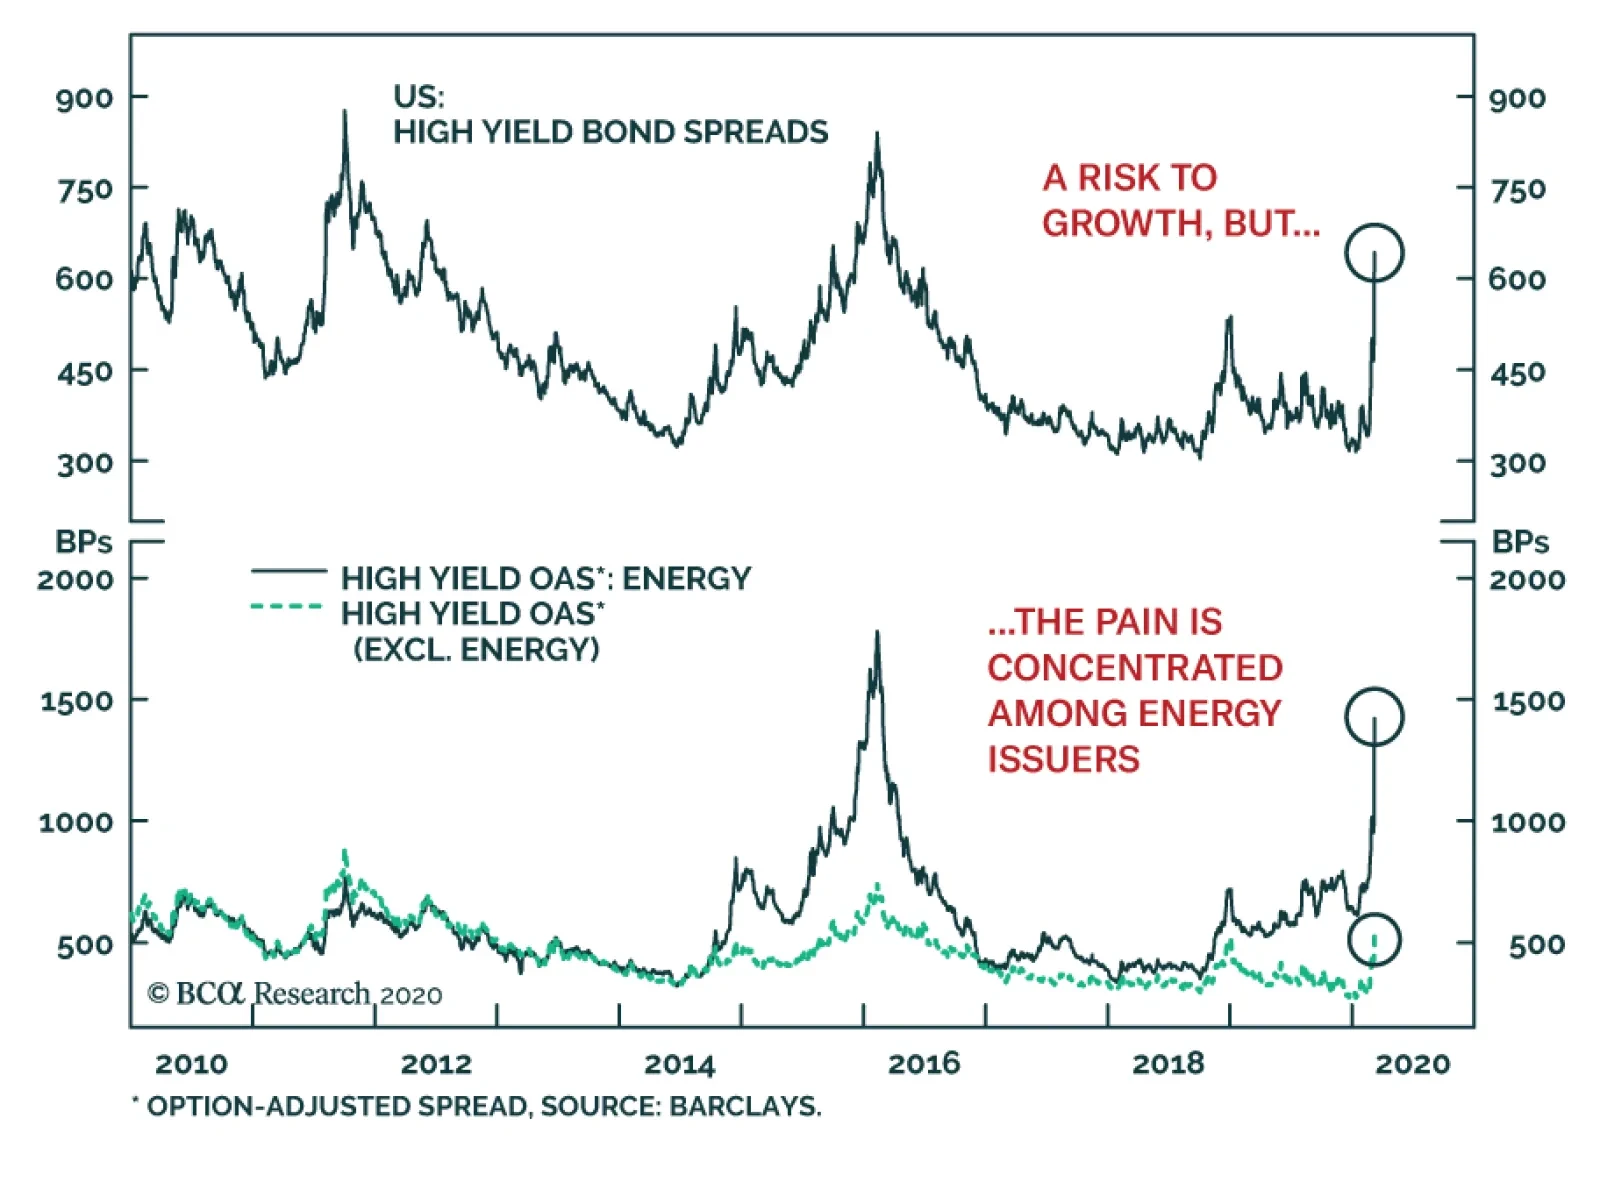
High yield spreads have surged as market volatility spiked and oil prices collapsed. At first glance, this represents a very negative shock for the corporate sector. However, investors must differentiate. Spreads outside of the energy sector remain broadly…
Our colleague Dhaval Joshi, who writes BCA’s European Investment Strategy service, pointed out in our daily meeting that the global stock-to-bond ratio has collapsed by 25% over the past three days ended Monday night, which represents the worst performance of…
Highlights Uncertainty & Yields: Global bond yields, driven to all-time lows as investors seek safety amid rioting markets, now discount a multi-year period of very weak global growth and inflation. Bond Portfolio Strategy: Maintain overall neutral portfolio duration exposure with so much bad news already priced into yields. Downgrade overall global spread product exposure to underweight versus governments on a tactical (0-3 months) basis given intense uncertainties on COVID-19 and oil markets. Model Bond Portfolio Changes – Governments: Upgrade countries that are more responsive to changes in the level of overall global bond yields and with room to cut interest rates (the US & Canada) to overweight, while downgrading sovereign debt with a lower “global yield beta” and less policy flexibility (Germany, France, Japan) to underweight. Model Bond Portfolio Changes – Credit: Downgrade US high-yield, euro area corporates and emerging market USD sovereigns & corporates to underweight. Feature Chart of the WeekOn The Verge Of Global ZIRP
On The Verge Of Global ZIRP
On The Verge Of Global ZIRP
The title of this report is a quote from a worried BCA client this morning, discussing his daily commute into Manhattan from the New York suburbs. We can think of no better analogy for the mood of investors in the current market panic. After having enjoyed a decade of riding the gravy train of recession-free growth and robust returns on risk assets, all underwritten by accommodative monetary policies, worries about a deflationary bust following the boom have intensified. The global spread of COVID-19, the ebbs and flows of the US presidential election and, now, a stunning collapse in oil prices – markets have simply been unable to process the investment implications of these unpredictable events all at once. At times of such stress, the obvious thing to do is to stand aside and hedge portfolios while awaiting better visibility on the uncertainties. At times of such stress, the obvious thing to do is to stand aside and hedge portfolios while awaiting better visibility on the uncertainties. It is clear that global government bonds have been a preferred hedge, with yields collapsing to record lows worldwide. While most of the market attention has been on the breathtaking fall in US yields that has pushed the entire Treasury curve below 1% as the market has moved to discount a swift move to a 0% fed funds rate. New lows were also hit yesterday in countries that had been lagging the Treasury rally: the 10-year German bund reached -0.85% yesterday, while the 10-year UK Gilt fell to an intraday all-time low of 0.08% with some shorter-maturity Gilt yields actually dipping into negative territory (Chart of the Week). The common driver of yesterday’s yield declines was the 25% plunge in global oil prices after the weekend collapse of the OPEC 2.0 alliance between Russia and Saudi Arabia. The inflation expectations component of global bond yields fell accordingly, continuing the correlation with energy prices seen over the past decade. Yet the real component of global bond yields has also been falling, with markets increasingly pricing in an extended period of weak growth and negative real interest rates – especially in the US. Collapsing US Treasury Yields Discount A Recession, Not A Financial Crisis Chart 2Re-opening Old Wounds
Re-opening Old Wounds
Re-opening Old Wounds
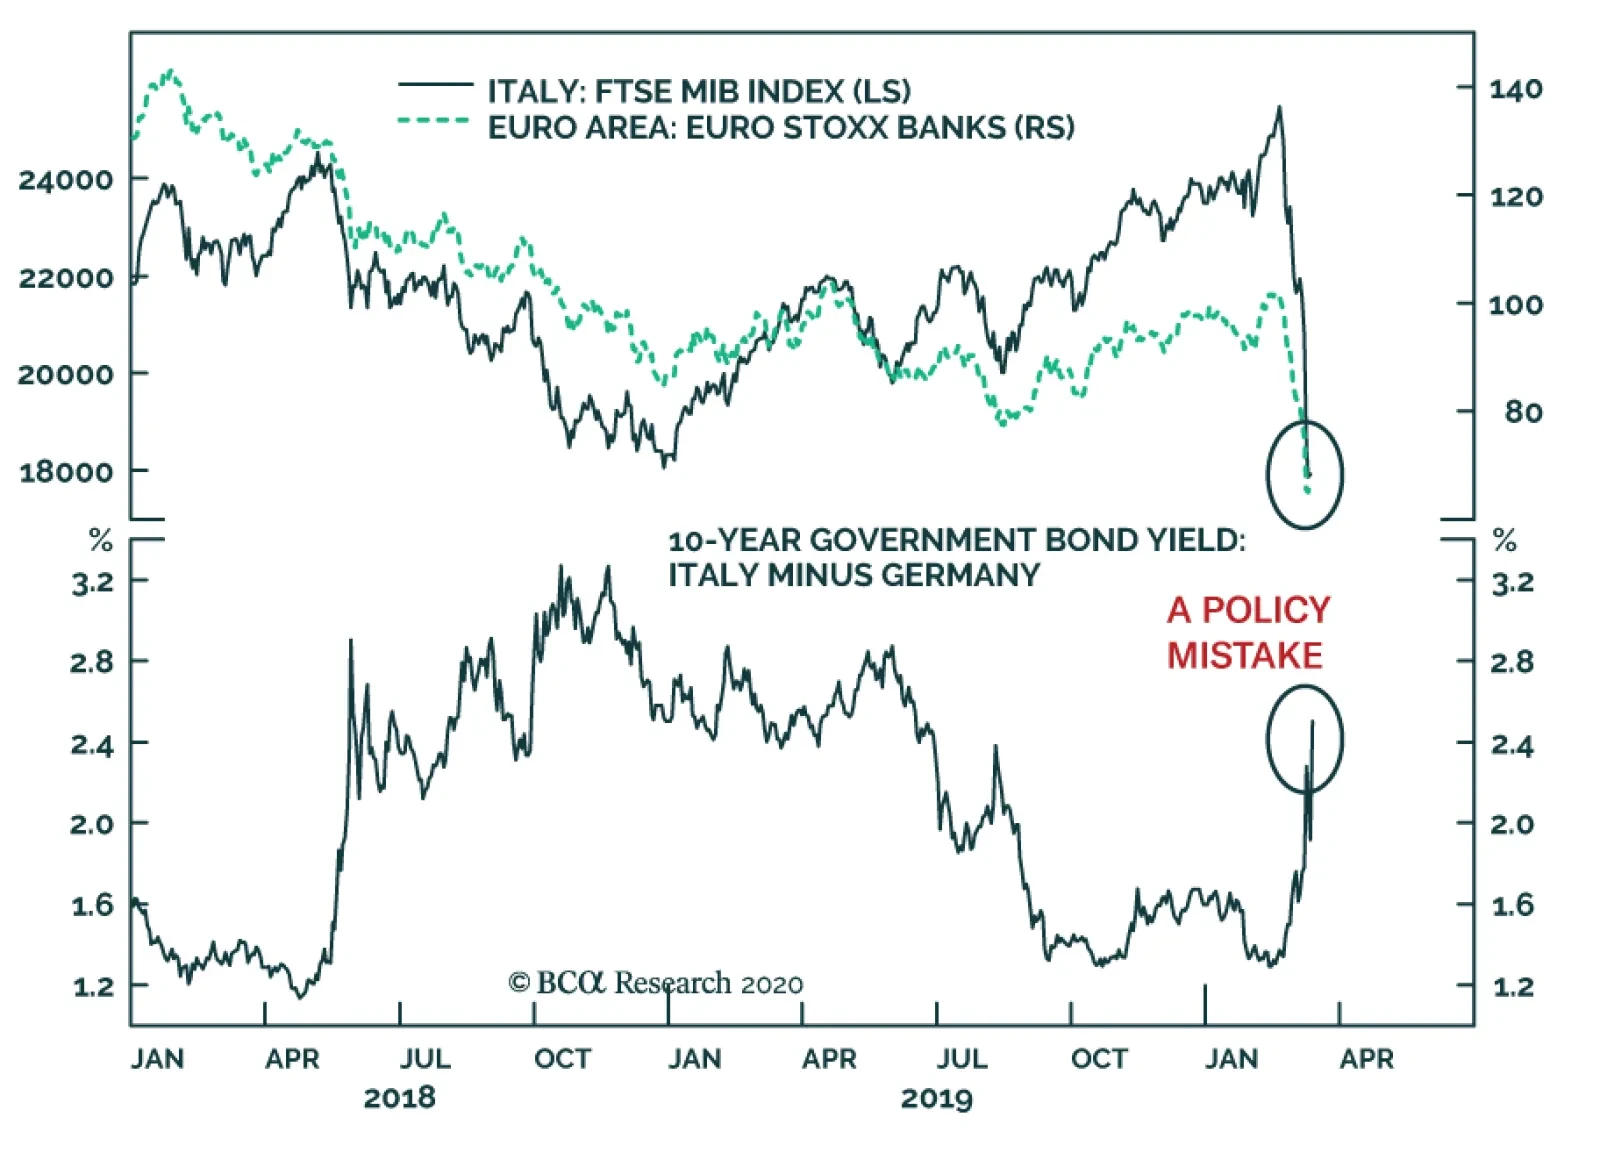
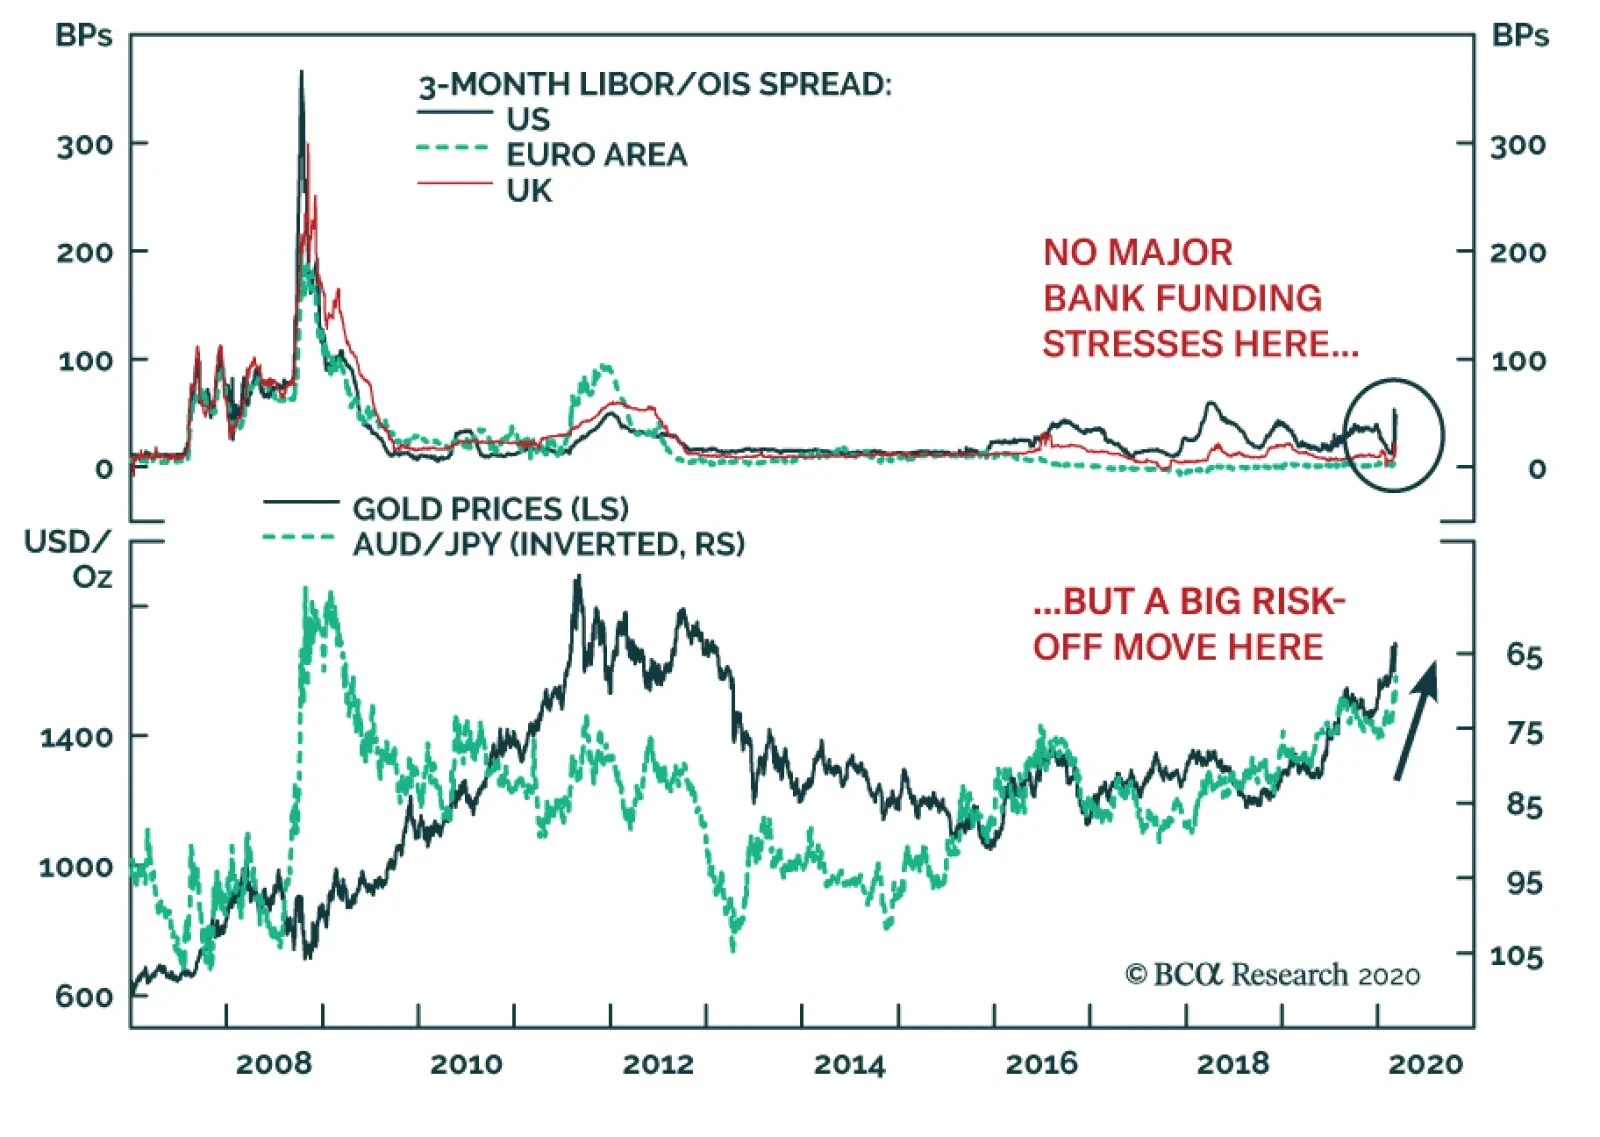
While this latest plunge in US equity markets has been both rapid and powerful, the damage only takes us back to levels on the S&P 500 last seen as recently as January 2019 (Chart 2). The turmoil, however, has reopened old wounds in markets that had suffered their own crises over the past decade, with European bank stocks hitting new all-time lows and credit spreads on US high-yield Energy bonds and Italian sovereign debt (versus Germany) sharply blowing out. The backdrop remains treacherous and global equity markets will likely remain under pressure until the number of new COVID-19 cases peaks outside of China (especially in the US). If there is one silver lining amidst the market carnage, it is that there appears to be few signs of 2008-style systemic financial stress. If there is one silver lining amidst the market carnage, it is that there appears to be few signs of 2008-style systemic financial stress. Bank funding indicators like Libor-OIS spreads and bank debt spreads have widened a bit over the past week but remain at very subdued levels (Chart 3). This is in sharp contrast to classic risk aversion indicators like the price of gold and the value of the Japanese yen versus the Australian dollar, which are closing in on the highs seen during the 2008 global financial crisis and 2012 European debt crisis. Chart 3A Growth Downturn, Not A Systemic Crisis
A Growth Downturn, Not A Systemic Crisis
A Growth Downturn, Not A Systemic Crisis
We interpret this as investors being far more worried about a deep global recession than another major financial crisis. That is also confirmed in the pricing of US Treasury yields, especially when looking at the real yield. Chart 4Does The UST Market Think R* Is Negative?
Does The UST Market Think R* Is Negative?
Does The UST Market Think R* Is Negative?
Chart 5Another Convexity-Fueled Bond Rally
Another Convexity-Fueled Bond Rally
Another Convexity-Fueled Bond Rally
The entire TIPS yield curve is now negative for the first time, even with the real fed funds rate below the Fed’s estimate of the “r*” neutral real rate (Chart 4). The combination of low and falling inflation expectations, and plunging real yields, indicates that the Treasury market now believes that the neutral real funds rate is not 0.8%, as suggested by the Fed’s estimate of r*, but is somewhere well below 0%. With the fed funds rate now down to 0.75% after last week’s intermeeting 50bps cut, the Treasury market is not only pricing the Fed quickly returning to the zero lower bound on the funds rate, but staying trapped at zero for a very long time. The Treasury market is not only pricing the Fed quickly returning to the zero lower bound on the funds rate, but staying trapped at zero for a very long time. Yet that may be too literal an interpretation of the incredible collapse of US Treasury yields. The power of negative convexity is also at work, driving intense demand for long-duration bonds that puts additional downward pressure on yields. Large owners of US mortgage backed securities (MBS) like the big commercial banks have seen the duration of their MBS holdings collapse as yields have fallen. The result is that banks are forced to buy huge amounts of Treasuries (or receive US dollar interest rate swaps) to hedge their duration exposure of negative convexity MBS, hyper-charging the fall in Treasury yields – perhaps over $1 trillion worth of buying, by some estimates.1 This is a similar dynamic to what occurred last summer in Europe, when sharply falling bond yields triggered convexity-related demand for duration from large asset-liability managers like pension funds, further fueling the decline in bond yields (Chart 5). Yet even allowing that some of the Treasury yield decline has been driven by a mechanical demand for duration, a 10-year US Treasury yield of 0.56% clearly discounts expectations of a US recession, as well – which appears justified by the recent performance of some critical US economic data. In Charts 6 & 7, we show a “cycle-on-cycle” analysis of some key US financial and indicators and how they behave before and after the start of the past five US recessions. The charts are set up so the vertical line represents the start of the recession, and we line up the data for the current business cycle as if the latest data point represents the start of a recession. Done this way, we can see if the current data is evolving in a similar fashion to past US economic downturns. Chart 6The US Business Cycle Looks Toppy
The US Business Cycle Looks Toppy
The US Business Cycle Looks Toppy
Chart 7COVID-19 Will Likely Trigger A Confidence-Driven US Recession
COVID-19 Will Likely Trigger A Confidence-Driven US Recession
COVID-19 Will Likely Trigger A Confidence-Driven US Recession
The charts show that the current flat 10-year/3-month US Treasury curve and steady decline in corporate profit growth are both accurately following the path entering past US recessions. Other indicators like the NFIB Small Business confidence survey, the Conference Board’s leading economic indicator and consumer confidence series typically peak between 12-18 months prior to the start of a recession, but appear to be only be peaking now. The same argument goes for initial jobless claims, which are usually rising for several months heading into a recession but remain surprisingly steady of late – a condition that seems unlikely to continue as more companies suffer virus-related hits to their sales and profits and begin to shed labor. Net-net, these reliable cyclical US data suggest that the Treasury market is right to be pricing in elevated recession risk – especially with US cases of COVID-19 starting to increase more rapidly and US financial conditions having tightened sharply in the latest market rout. Bottom Line: Global bond yields, driven to all-time lows as investors seek safety amid rioting markets, now discount a multi-year period of very weak global growth and inflation – most notably in the US. Allocation Changes To Our Model Bond Portfolio The stunning fall in global bond yields has already gone a long way. Yet it is very difficult to forecast a bottom in yields, even with central banks easing monetary policy to try and boost confidence, before there is evidence that the global COVID-19 outbreak is being contained (i.e. a decreasing total number of confirmed cases). By the same token, corporate bonds (and equities) will continue to be under selling pressure until the worst of the viral outbreak has passed. We raised our recommended overall global duration stance to neutral last week – a move that was more tactical in nature as a near-term hedge to our strategic overweight corporate bond allocations in our Model Bond Portfolio amid growing market volatility. Yet with the new stresses coming from the collapse in oil prices and increasing spread of COVID-19 in the US and Europe, we are moving to a much more cautious near-term stance on global credit. Yet with the new stresses coming from the collapse in oil prices and increasing spread of COVID-19 in the US and Europe, we are moving to a much more cautious near-term stance on global credit. This week, we are making the following additional changes to our model bond portfolio to reflect the growing odds of a global recession: Downgrade global corporates to underweight versus global governments Maintain a neutral overall portfolio duration, but favor countries within the government bond allocation that are more highly correlated to changes in to the overall level of global bond yields. Chart 8Favor Higher-Beta Bond Markets With Room To Cut Rates
Favor Higher-Beta Bond Markets With Room To Cut Rates
Favor Higher-Beta Bond Markets With Room To Cut Rates
Given how far yields have declined already, we think raising allocations to “high yield beta” countries that can still cut interest rates, at the expense of reduced weightings toward low beta countries that have limited scope to ease policy, offers a better risk/reward profile than simply raising duration exposure across the board. Such a nuanced argument is less applicable to global corporates, where elevated market volatility, poor investor risk appetite and deteriorating global growth momentum all argue for continued near-term underperformance of corporates versus government bonds. Specifically, we are making the following changes to our recommended allocations, presented with a brief rationale for each move: Upgrade US Treasuries and Canadian government bonds to overweight: Both Treasuries and Canadian bonds are higher beta markets, as we define by a regression of monthly yield changes to changes in the yield of the overall Bloomberg Barclays Global Treasury index (Chart 8). The Fed cut 50bps last week as an emergency measure and has 75bps to go before reaching the zero bound, which the market now expects by mid-year. Additional bond bullish moves after reaching the zero bound, like aggressive forward guidance, restarting quantitative easing and even anchoring Treasury yields in a BoJ-like form of yield curve control, are all possible if the US enters a recession. Meanwhile, the Bank of Canada (BoC) followed the Fed’s cut with a 50bp easing the next day and signaled that additional rate cuts are likely to prevent a plunge in Canadian consumer confidence. The collapsing oil price likely seals the deal for additional rate cuts by the BoC in the next few months. Downgrade Japanese government bonds to maximum underweight: Japanese government bonds (JGBs) are the most defensive low-beta market in model bond portfolio universe, thanks to the Bank of Japan’s Yield Curve Control policy that anchors the 10yr JGB yield around 0%. This makes JGBs the best candidate for a maximum underweight stance when global bond yields are not expected to rise in the near term, as we expect. Downgrade Germany and France to Underweight: The ECB meets this week and will be under pressure to ease policy given recent moves by other major central banks. A -10bps rate cut is expected, which may happen to counteract the recent increase in the euro versus the US dollar, but there is also possibility that ECB will increase and/or extend the size and scope of its current Asset Purchase Program. Given the ECB’s lack of overall monetary policy flexibility, and low level of inflation expectations, we see limited scope for the lower-beta German and French government bonds to outperform their global peers. Remain overweight UK and Australia: While both Australian government bonds and UK Gilts have a “median” yield beta in our model bond portfolio universe, both deserve moderate overweights as there is still the potential for rate cuts in both countries. The Reserve Bank of Australia (RBA) cut the Cash Rate by -25bps last week and they are still open to cut further to boost a sluggish economy hurt by wildfires and weak export demand from China. The RBA will stay more dovish for longer until we will see clear signs of a rebound of the Chinese economy from the COVID-19 outbreak. The Bank of England (BoE) will likely cut its policy rate later this month, or even before the next scheduled policy meeting, as COVID-19 is starting to spread through the UK. Downgrade US High-Yield To Underweight: US junk bonds had already taken a hit during the global market selloff in recent weeks, but the collapse in oil prices pummeled the market given the high weighting of US shale producers in the index (Chart 9). With additional weakness in oil prices likely as Russia and Saudi Arabia are now in a full-fledged price war, US high-yield will come under additional spread widening pressure focused on the weaker Caa-rated segment that contains most of the energy names. We recommend a zero weight in the Caa-rated US junk bonds, within an overall underweight allocation to the entire asset class. Downgrade euro area investment grade and high-yield corporates to underweight: COVID-19 is now spreading faster in Germany and France, after leaving Italy in a full-blown national crisis. The export-oriented economies of the euro area were already vulnerable to a global growth slowdown, but now domestic growth weakness raises the odds of a full-blown recession – not a good environment to own corporate bonds, especially with the euro now appreciating. Downgrade emerging market (EM) USD-denominated sovereigns and corporates to underweight: EM debt remains a levered play on global growth, so the increased odds of a global recession are a problem for the asset class – even with sharply lower interest rates and early signs of a softening in the US dollar (Chart 10). Chart 9Downgrade US Junk Bonds To Underweight
Downgrade US Junk Bonds To Underweight
Downgrade US Junk Bonds To Underweight
Chart 10Still Not Much Broad-Based Weakness In The USD
Still Not Much Broad-Based Weakness In The USD
Still Not Much Broad-Based Weakness In The USD
We will present the new specific model bond portfolio weightings, along with a discussion of the risk management implications of these changes, in next week’s report. Bottom Line: Maintain overall neutral portfolio duration exposure with so much bad news already priced into yields. Downgrade overall global spread product exposure to underweight versus governments on a tactical (0-3 months) basis given intense uncertainties on COVID-19 and oil markets. Upgrade high-beta countries with room to cut interest rates (the US & Canada) to overweight, while downgrading lower-beta countries with less policy flexibility (Germany, France, Japan) to underweight. Downgrade US high-yield, euro area corporates and emerging market USD sovereigns & corporates to underweight. Robert Robis, CFA Chief Fixed Income Strategist rrobis@bcaresearch.com Ray Park, CFA Research Analyst ray@bcaresearch.com Footnotes 1https://www.wsj.com/articles/fear-isnt-the-only-driver-of-the-treasury-rally-banks-need-to-hedge-their-mortgages-1158347080 Recommendations Regional Allocation Spread Product Tactical Trades Yields & Returns Global Bond Yields Historical Returns
Highlights Duration: It is too soon to call the bottom in bond yields. To help make that call we will be looking for when: daily new COVID-19 infections reach zero, global growth indicators improve, US economic indicators worsen, technical indicators signal a reversal. Fed: Low inflation expectations mean that the Fed is unconstrained when it comes to easing policy. Rate cuts will continue until either the funds rate reaches zero, or financial markets signal that enough stimulus has been delivered. Spread Product: Investors with 12-month investment horizons should neutralize allocations to spread product versus Treasuries, including high-yield where the recent oil supply shock will weigh heavily on returns. Investors should also downgrade exposure to MBS with the goal of re-deploying into corporate credit once the current risk-off episode runs its course. Feature Risk off sentiment prevailed in financial markets again last week, as COVID-19 continues to spread throughout the world. Most recently, the city of Milan has been placed under quarantine and New York state has declared a state of emergency. It is difficult to have much certainty about the virus’ ultimate economic impact, but the prospect of US recession looms larger and larger. In bond markets, the 10-year Treasury yield has fallen to 0.54% and the yield curve is pricing-in 91 bps of Fed rate cuts over the next 12 months (Chart 1). If those expectations are met, it would bring the funds rate down to 0.18%, only slightly above the zero-lower-bound. Chart 1Market Priced For A Return To The Zero-Lower-Bound
Market Priced For A Return To The Zero-Lower-Bound
Market Priced For A Return To The Zero-Lower-Bound
On the bright side, there is ample evidence that global economic growth was trending up before the virus struck in late January, and we remain confident that a large amount of pent-up demand will be unleashed once its impact fades. However, we have no clarity on how much longer COVID-19 might weigh on growth. For this reason, we recommend a much more defensive US bond portfolio allocation, even for investors with 12-month horizons. Specifically, investors should keep portfolio duration close to benchmark and reduce spread product allocations to neutral. The market is sending the message that more rate cuts are needed. We will be quick to re-initiate a below-benchmark duration recommendation when we think that bond yields are close to bottoming. In the below section titled “How To Call The Bottom In Yields”, we discuss the factors that will help us make that decision. A State Of Monetary Policy Emergency The Fed took quick action last week, delivering an inter-meeting 50 basis point rate cut as the stock market tumbled on Tuesday morning. Alas, the market is sending the message that those 50 bps won’t be enough. Fed funds futures are pricing-in another 82 bps of easing by the end of next week’s FOMC meeting, followed by further cuts in April (Table 1). Table 1Expectations Priced Into The Fed Funds Futures Curve
When And Where Will Bond Yields Trough?
When And Where Will Bond Yields Trough?
Of course, easier monetary policy is not the solution to what ails the global economy. At his press conference last week, Fed Chair Powell justified the emergency cut by saying that it will help “avoid a tightening of financial conditions which can weigh on activity, and it will help boost household and business confidence.” This is a fair assessment of what monetary policy can hope to accomplish in the current environment. At most, monetary policy can limit the damage in financial markets, which is a worthwhile goal given the strong historical correlation between financial conditions and economic growth (Chart 2). Chart 2Fed Must Do Its Best To Support Financial Conditions
Fed Must Do Its Best To Support Financial Conditions
Fed Must Do Its Best To Support Financial Conditions
What’s more, with inflation expectations at very low levels – as we go to press the 10-year TIPS breakeven inflation rate is a mere 1.03% – there is no reason for the Fed to resist easing policy, even if the expected benefits from easing are small. Chart 3Markets Demand More Easing
Markets Demand More Easing
Markets Demand More Easing
From our perch, the only possible reason for the Fed to refrain from cutting rates quickly all the way back to zero would be to preserve some monetary policy ammunition for when it is needed most. The Fed probably doesn’t see things this way. In conventional economic models it is the level of interest rates that influences economic activity. Therefore, the way to get the most bang for your stimulus buck is to cut rates to zero as quickly as possible. However, if monetary policy is primarily influencing the economy via its impact on financial conditions and investor sentiment, as Chair Powell claimed, then it would be advisable to only deliver rate cuts when financial conditions are tightening rapidly. That is, don’t cut rates if the stock market is rebounding, save your ammo for when equities are in free fall and panic is widespread. We can’t know for certain what the Fed will do between now and the next FOMC meeting. But we can say that, with inflation pressures low, there are no constraints against cutting rates back to the zero bound. The safest takeaway for bond investors is to assume that rate cuts will continue until either (i) the fed funds rate hits zero or (ii) we see signs that the markets and economy are no longer calling for further stimulus. Those signs would be (Chart 3): Yield curve steepening, particularly at the short end. Stocks outperforming bonds. A rising gold price. A falling US dollar. Bottom Line: More rate cuts are coming, and they won’t stop until either the fed funds rate hits zero or financial markets signal that sufficient stimulus has been delivered. We can’t be certain whether that will occur with more or less than the 91 bps of rate cuts that are currently priced for the next 12 months. As such, we recommend keeping portfolio duration close to benchmark. How To Call The Bottom In Yields The US economy is on the cusp of entering a downturn of uncertain duration that will likely be followed by a rapid recovery. Given that outlook, the next big call to make is: When will bond yields put in a bottom? We identify four catalysts that we will monitor to make that call. 1. Virus Panic Abates This is the most important catalyst that could lead us to re-initiate a below-benchmark duration recommendation. The pattern of past viral outbreaks is that bond yields tend to fall until the number of daily new cases reaches zero. This is precisely what happened during the 2003 SARS epidemic (Chart 4A). As for COVID-19, the number of daily new cases looked like it was approaching zero a few weeks ago, but then reversed course as the virus moved on from China to the rest of the world (Chart 4B). One ray of hope is that the number of new cases in China is approaching zero. This suggests that it will also be possible for other countries to contain the virus, but right now it is unclear how long that will take. Chart 4AYields Will Bottom When New Cases Reach Zero
Yields Will Bottom When New Cases Reach Zero
Yields Will Bottom When New Cases Reach Zero
Chart 4BNew COVID-19 Cases Still ##br##Rising
New COVID-19 Cases Still Rising
New COVID-19 Cases Still Rising
In sum, we will keep tracking the global daily number of new cases and will shift to a below-benchmark duration recommendation as it approaches zero. 2. Global Economic Data Improve (Especially China) Chart 5Waiting For A Global Growth Rebound
Waiting For A Global Growth Rebound
Waiting For A Global Growth Rebound
China is where the COVID-19 outbreak started and it is also where we are now seeing the impact in the economic data. The Global Manufacturing PMI dropped from 50.4 to 47.2 in February, due in large part to the plunge in China’s index from 51.1 to 40.3 (Chart 5). In order to call the bottom in US bond yields we will need to see evidence that China can come out the other side of the economic downturn. This means seeing an improvement in the Chinese and Global Manufacturing PMIs. We would also like to see improvement in other global growth indicators such as the CRB Raw Industrials index (Chart 5, panel 2) and the relative performance of cyclical versus defensive equity sectors (Chart 5, bottom panel). Aggressive Chinese stimulus (both monetary and fiscal) might help speed this process along. China’s credit impulse is on the rise (Chart 5, panel 2), and our China Investment Strategy service observed that recently announced policy initiatives related to infrastructure, housing and the automobile sector resemble those that led to a V-shaped Chinese economic recovery in 2016.1 We will be inclined to shift back to below-benchmark portfolio duration when the Global Manufacturing PMI, CRB Raw Industrials index and the relative performance of cyclical versus defensive equities move higher. 3. The US Economic Data Worsen Chart 6Waiting For Weaker US Data
Waiting For Weaker US Data
Waiting For Weaker US Data
While the Global and Chinese economic data are currently in the doldrums, we still haven’t seen COVID’s impact on the US economy. The US ISM Manufacturing PMI is in expansionary territory and the Services PMI is at a healthy 57.3 (Chart 6). Meanwhile, US employment growth has averaged +200k during the past 12 months (Chart 6, panel 2) and the US Economic Surprise Index is above 60 (Chart 6, bottom panel)! Until the US economic data take a hit, another downleg in US bond yields is likely. Looking ahead, if the Global and Chinese economic data are improving as the US data are weakening, financial markets will extrapolate from the Chinese experience and start to price-in an eventual US recovery. Therefore, bond yields will probably start to move higher while the US economic data are still weak. For this reason, one catalyst for us to re-initiate below-benchmark portfolio duration will be when the US economic data weaken. 4. Technical Signals Table 2The 3-Month Golden Rule
When And Where Will Bond Yields Trough?
When And Where Will Bond Yields Trough?
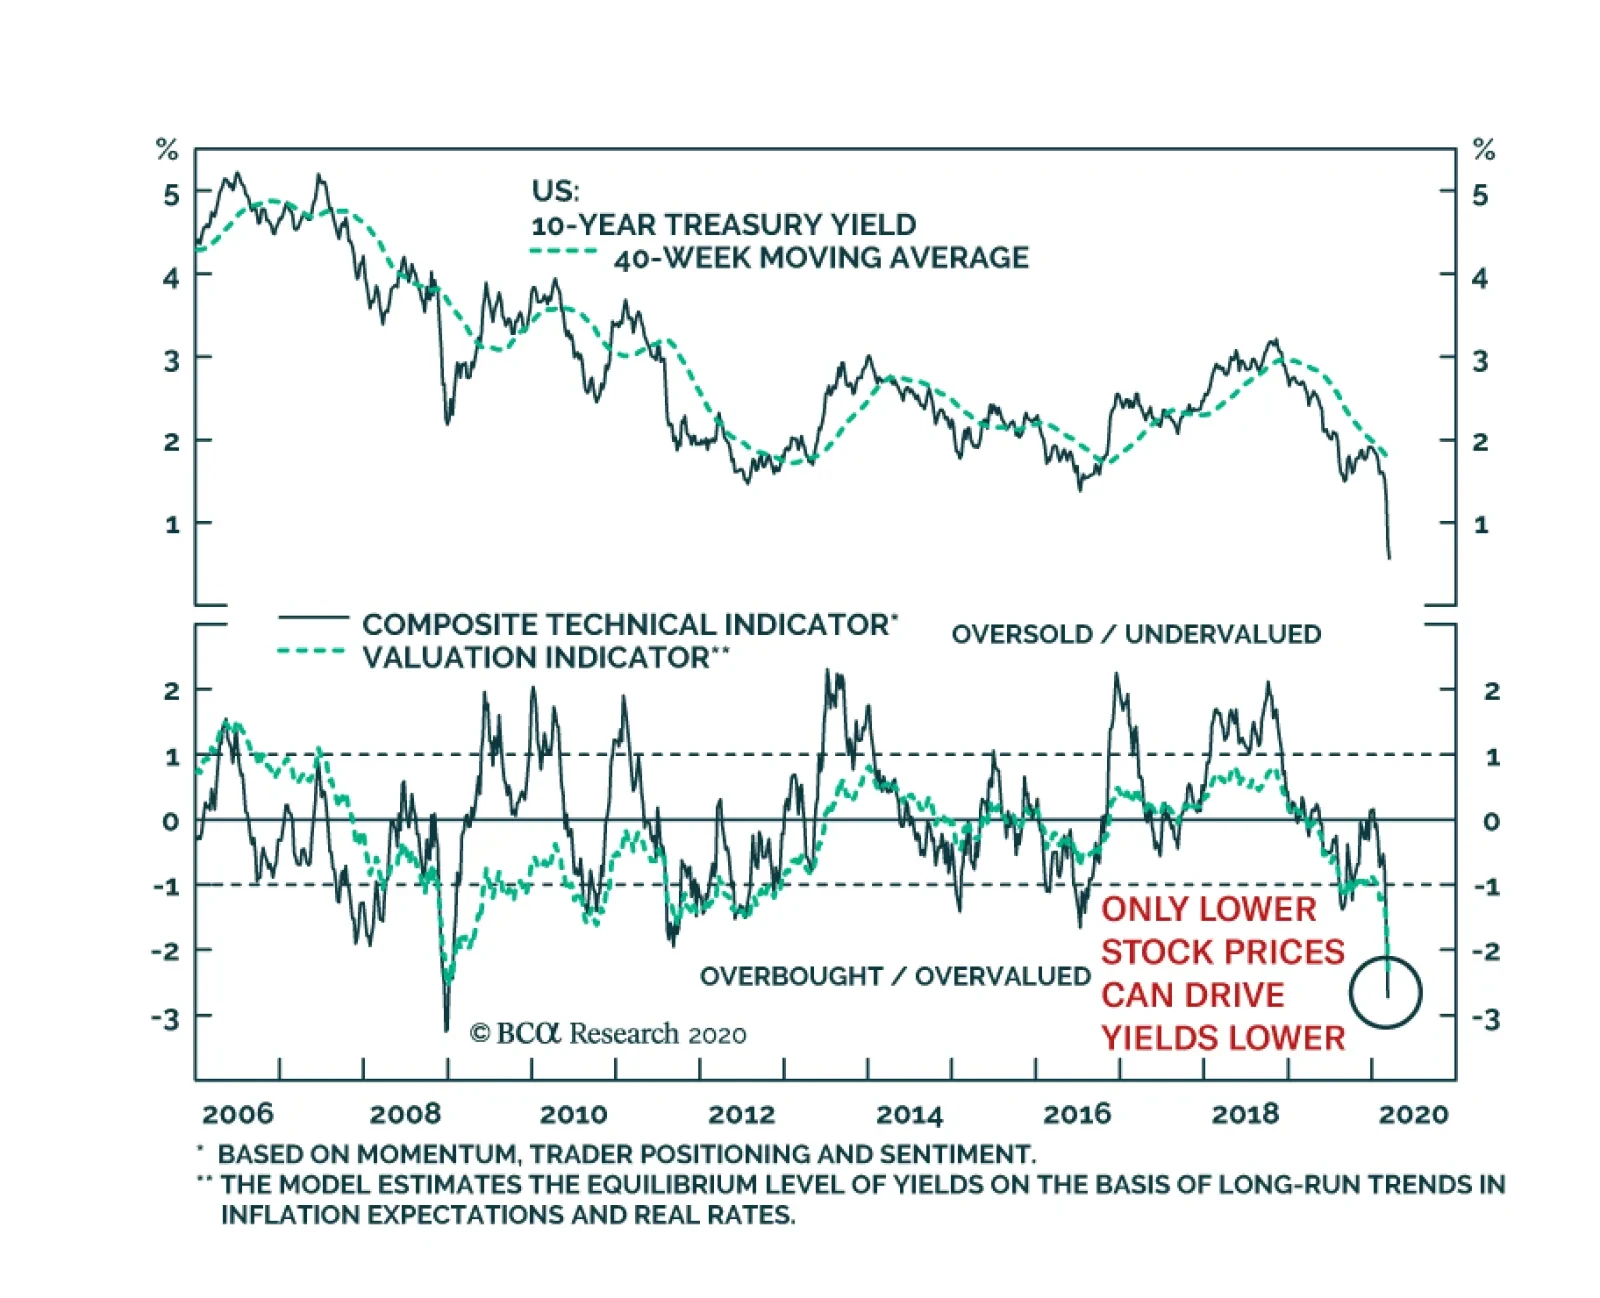
We don’t recommend relying on technical trading rules when forming a 12-month investment view, but technical signals can help add discipline to investment strategies, especially when calling tops and bottoms. One framework with a decent track record is our Golden Rule of Bond Investing applied to a shorter 3-month investment horizon.2 While this 3-month rule doesn’t work as well as when it is applied to a 12-month horizon, we still find that if you correctly predict whether the Fed will deliver a hawkish or dovish surprise relative to market expectations during the next three months, you will make the right duration call 63% of the time (Table 2). The 3-month Golden Rule worked better for dovish surprises than for hawkish surprises in our sample but delivered solid results in both cases. The median 3-month excess Treasury index return versus cash was -1.09% (annualized) when there was a hawkish Fed surprise, compared to +2.56% (annualized) when there was a dovish Fed surprise. For context, the median annualized 3-month excess Treasury index return versus cash during our sample period was +1.79%. Until the US economic data take a hit, another downleg in US bond yields is likely. The overnight index swap curve is currently priced for 94 bps of rate cuts during the next three months, which would essentially take the funds rate back to the zero bound. As of now, we cannot rule out this possibility and are therefore not inclined to look for higher yields during the next 3 months. Momentum, Positioning & Sentiment Other technical signals can also help call tops and bottoms in bond yields. One such signal comes from our Composite Technical Indicator, an indicator that is based on yield changes, investor sentiment surveys and positioning in bond futures markets. Right now, the indicator is sending a strong “overbought” signal with a reading below -1 (Chart 7). Chart 7Technical Treasury Signals
Technical Treasury Signals
Technical Treasury Signals
In isolation, an overbought signal from our Composite Technical Indicator is not a strong reason to call for higher yields. We found that, historically, a reading below -1 from our indicator precedes a 3-month move higher in the 10-year Treasury yield only 53% of the time (Table 3). Table 3Technical Treasury Indicator Performance (1995 – Present)
When And Where Will Bond Yields Trough?
When And Where Will Bond Yields Trough?
One reason for the Composite Technical Indicator’s mediocre performance is that, even at low levels, the market can always become more overbought. But we can partially control for this by combining the overbought signal from our indicator with simple momentum measures that might signal a trend reversal. For example, a reading below -1 from our Composite Technical Indicator combined with a 1-week increase in the 10-year yield precedes a higher 10-year yield during the next three months 58% of the time. If we wait for a 2-week increase in the 10-year yield the rule’s success rate rises to 60%, and it rises to 71% if we wait for the 10-year yield to break above its 4-week moving average. At present, our Composite Technical Indicator shows that Treasuries are extremely overbought, but momentum measures are sending no signals about an imminent trend change (Chart 7, bottom 3 panels). Bottom Line: It is too soon to call the bottom in bond yields. To help make that call we will be looking for when: daily new COVID-19 infections reach zero, global growth indicators improve, US economic indicators worsen, technical indicators signal a reversal. Some Quick Notes On TIPS, MBS And Spread Product Allocations Along with raising recommended portfolio duration to benchmark on a 12-month horizon, we also recommend neutralizing exposure to spread product in US bond portfolios. This includes reducing exposure to high-yield corporate bonds. High-yield remains attractively valued but will continue to sell off as long as risk-off market sentiment prevails. The looming oil price war will also weigh heavily on the sector, which is highly exposed to the US shale energy space. Once again using the SARS epidemic as a comparable, we see that – like Treasury yields – junk excess returns bottomed when the number of daily new cases approached zero (Chart 8). We could still be relatively far from this point, so taking risk off the table makes sense. New all-time lows in Treasury yields will drag mortgage rates lower and lead to a spike in refinancing activity. We also recommend moving MBS allocations to underweight. New all-time lows in Treasury yields will drag mortgage rates lower and lead to a spike in refinancing activity. This spike is not yet fully reflected in MBS spreads, which remain relatively tight (Chart 9) Chart 8Too Soon To Call For Peak Junk Spreads
Too Soon To Call For Peak Junk Spreads
Too Soon To Call For Peak Junk Spreads
Chart 9Downgrade MBS
Downgrade MBS
Downgrade MBS
. Going forward, even after the economic fallout from COVID-19 has passed and it is time to increase exposure to spread product, we will likely continue to recommend an underweight allocation to MBS because better opportunities will be available in investment grade and high-yield corporate bonds where spreads will be much more attractive. On TIPS, last weekend’s oil supply shock – combined with the demand shock from COVID-19 – will conspire to keep long-maturity TIPS breakeven inflation rates well below their “fundamental fair value” for some time yet. But for investors with longer time horizons we see exceptional value in TIPS relative to nominal Treasuries. Even before yesterday’s big drop in oil, the 10-year TIPS breakeven inflation rate was 52 bps cheap relative to the fair value reading from our Adaptive Expectations Model (Chart 10).3 Chart 10TIPS Offer A Ton Of Long-Run Value
TIPS Offer A Ton Of Long-Run Value
TIPS Offer A Ton Of Long-Run Value
Investors with 12-month investment horizons should continue to favor TIPS over nominal Treasuries, but those with shorter horizons may be advised to stand aside and wait for the daily number of new COVID-19 cases to reach zero before re-initiating the position. Ryan Swift US Bond Strategist rswift@bcaresearch.com Footnotes 1 Please see China Investment Strategy Weekly Report, “China: Back To Its Old Economic Playbook?”, dated February 26, 2020, available at cis.bcaresearch.com 2 For more details on our Golden Rule of Bond Investing please see US Bond Strategy Special Report, “The Golden Rule of Bond Investing", dated July 24, 2018, available at usbs.bcaresearch.com 3 For more details on our Adaptive Expectations Model please see US Bond Strategy Weekly Report, “How Are Inflation Expectations Adapting?”, dated February 11, 2020, available at usbs.bcaresearch.com Fixed Income Sector Performance Recommended Portfolio Specification
Technically, US bonds are as overbought and expensive as they were in 2008. 10-year real yields fell to levels last seen in 2012, and the 30-year TIPS yields are negative. 5-year/5-year forward inflation breakevens have hit a record low. The traditional…