Fixed Income
BCA Research has long argued that excess corporate debt would not be the cause of a recession, but would intensify recessionary pressures if a shock large enough threatened debt-servicing capacity. COVID-19 may represent such a shock. Our Corporate…

Highlights An analysis on Colombia is available below. If EM share prices hold at current levels, a major rally will likely unfold. If they are unable to hold, a substantial breakdown will likely ensue. The direction of EM US dollar and local currency bond yields will be the key to whether EM share prices break down or not. We expect continuous EM currency depreciation that will likely trigger foreign capital outflows from both EM credit markets and domestic bonds. This leads us to reiterate our short position in EM stocks. We are booking profits on the long implied EM equity volatility and the short Colombian peso/long Russian ruble positions. Feature The Federal Reserve’s intra-meeting rate cut this week might temporarily boost EM risk assets and currencies. However, it is also possible that investors might begin questioning the ability of policymakers in general and the Fed in particular to continuously boost risk assets. In recent years, investors have been operating under the implicit assumption that policymakers in the US, China and Europe have complete control over financial markets and global growth, and will not allow things to get out of hand. Investors have been ignoring contracting global ex-US profits as well as exceedingly high US equity multiples and extremely low corporate spreads worldwide. In the past 12 months, investors have been ignoring contracting global ex-US profits (Chart I-1) as well as exceedingly high US equity multiples. This has been occurring because of the infamous ‘policymakers put’ on risk assets. As doubts about policymakers’ ability to defend global growth and financial markets from COVID-19 heighten, investors will likely throw in the towel and trim risk exposure. A sudden stop in capital flows into EM is a distinct possibility. The Last Line Of Defense EM share prices are at a critical juncture (Chart I-2). If they hold at current levels, a major rally will likely unfold. If they are unable to hold at current levels, a substantial breakdown will likely ensue. Chart I-1Profitless Rally In 2019 Makes Stocks Vulnerable
Profitless Rally In 2019 Makes Stocks Vulnerable
Profitless Rally In 2019 Makes Stocks Vulnerable
Chart I-2EM Share Prices Are At A Critical Juncture
EM Share Prices Are At A Critical Juncture
EM Share Prices Are At A Critical Juncture
What should investors be looking at to determine whether EM share prices will find a bottom close to current levels, or whether another major down-leg is in the cards? In our opinion, the direction of EM sovereign and corporate US dollar bond yields as well as EM local currency government bond yields will be the key to whether EM share prices break down or not. Chart I-3 illustrates that EM equity prices move in tandem with EM corporate US dollar bond yields as well as EM local currency bond yields (bond yields are shown inverted on both panels). Falling EM fixed income yields have helped EM share prices tremendously in the past year. Chart I-3EM Equities Drop When EM US Dollar & Domestic Bond Yields Are Rising
EM Equities Drop When EM US Dollar & Domestic Bond Yields Are Rising
EM Equities Drop When EM US Dollar & Domestic Bond Yields Are Rising
EM corporate US dollar bond yields can rise under the following circumstances: (1) when US Treasury yields are ascending more than corporate credit spreads are tightening; (2) when EM credit spreads are widening more than Treasury yields are falling; or (3) when both US government bond yields and EM credit spreads are increasing simultaneously. Provided the backdrop of weaker growth is bullish for US government bonds, presently EM corporate US dollar bond yields can only rise if their credit spreads widen by more than the drop in Treasury yields. In short, the destiny of EM equities currently rests with EM corporate spreads. EM corporate and sovereign credit spreads are breaking above a major technical resistance (Chart I-4). The direction of these credit spreads is contingent on EM exchange rates and commodities prices as demonstrated in Chart I-5. Credit spreads are shown inverted in both panels of this chart. Chart I-4A Breakout In EM Sovereign And Corporate Credit Spreads?
A Breakout In EM Sovereign And Corporate Credit Spreads?
A Breakout In EM Sovereign And Corporate Credit Spreads?
Chart I-5Falling EM Currencies And Commodities Herald Wider EM Credit Spreads
Falling EM Currencies And Commodities Herald Wider EM Credit Spreads
Falling EM Currencies And Commodities Herald Wider EM Credit Spreads
EM exchange rates are also crucial for foreign investors’ in EM domestic bonds. The top panel of Chart I-6 demonstrates that even though the total return on the JP Morgan EM GBI domestic bond index has been surging in local currency terms, the same measure in US dollar terms is still below its 2012 level. The gap is due to EM exchange rates. EM local currency bond yields are at all-time lows (Chart I-6, bottom panel), reflecting very subdued nominal income growth and low inflation in many developing economies (Chart I-7). Chart I-6EM Currencies Are Key To EM Domestic Bonds Total Returns
EM Currencies Are Key To EM Domestic Bonds Total Returns
EM Currencies Are Key To EM Domestic Bonds Total Returns
Chart I-7Inflation Is Undershooting In EM Ex-China
Inflation Is Undershooting In EM Ex-China
Inflation Is Undershooting In EM Ex-China
Hence, low EM domestic bond yields are justified by their fundamentals. Yet foreign investors are very large players in EM local bonds, and their willingness to hold these instruments is contingent on EM exchange rates’ outlook. The sensitivity of international capital flows into EM US dollar and local currency bonds to EM exchange rates has diminished in recent years because of global investors’ unrelenting search for yield. As QE policies by DM central banks have removed some $9 trillion in high-quality securities from circulation, the volume of fixed-income securities available in the markets has shrunk. This has led to unrelenting capital inflows into EM fixed-income markets, despite lingering weakness in their exchange rates. Nonetheless, sensitivity of fund flows into EM fixed-income markets to EM exchange rates has diminished but has not yet outright vanished. If EM currencies depreciate further, odds are that there will be a sudden stop in capital flows into EM fixed-income markets. Outside of some basket cases, we do not expect the majority of EM governments or corporations to default on their debt. Yet, we foresee further meaningful EM currency depreciation which will simply raise the cost of servicing foreign currency debt. It would be natural for sovereign and corporate credit spreads to widen as they begin pricing in diminished creditworthiness among EM debtors in foreign currency terms. Bottom Line: Unlike EM equities, EM fixed-income markets are a crowded trade and are overbought. Hence, any selloff in these markets could trigger an exodus of capital pushing up their yields. Rising yields will in turn push EM equities over the cliff. EM Currencies: More Downside We expect EM currencies to continue depreciating. EM ex-China currencies’ total return index (including carry) versus the US dollar is breaking down (Chart I-8, top panel). This is occurring despite the plunge in US interest rates. Notably, as illustrated in the bottom panel of Chart I-8, EM ex-China currencies have not been correlated with US bond yields. The breakdown in correlation between EM exchange rates and US interest rates is not new. This means that the Fed's easing will not prevent EM currency depreciation. EM currencies correlate with commodities prices generally and industrial metals prices in particular (Chart I-9, top panel). The latter has formed a head-and-shoulders pattern and has broken down (Chart I-9, bottom panel). The path of least resistance for industrial metal prices is down. Chart I-8More downside In EM Ex-China Currencies
More downside In EM Ex-China Currencies
More downside In EM Ex-China Currencies
Chart I-9A Breakdown In Commodities Points To A Relapse In EM Currencies
A Breakdown In Commodities Points To A Relapse In EM Currencies
A Breakdown In Commodities Points To A Relapse In EM Currencies
Chart I-10Chinese Imports Are Key To EM Currencies
Chinese Imports Are Key To EM Currencies
Chinese Imports Are Key To EM Currencies
EM currencies’ cyclical fluctuations occur in-sync with global trade and Chinese imports (Chart I-10). Both will stay very weak for now. Finally, China is stimulating, and we believe the pace of stimulus will accelerate. However, the measures announced by the authorities so far are insufficient to project a rapid and lasting growth recovery. In particular, the most prominent measure announced in China is the PBoC’s special re-lending quota of RMB 300 billion to enterprises fighting the coronavirus outbreak. However, this amount should be put into perspective. In 2019, private and public net credit flows were RMB 23.8 trillion, and net new broad money (M2) creation was RMB 16 trillion. Thus, this re-lending quota will boost aggregate public and private credit flow by only 1.2% and broad money flow by mere 2%. This is simply not sufficient to meaningfully boost growth in China. Notably, daily, commodities prices in China do not yet confirm any growth recovery (Chart I-11). Barring an irrigation-type of credit and fiscal stimulus, the mainland economy will disappoint. Bottom Line: The selloff in EM exchange rates will persist. As discussed above, this will likely lead to outflows from both EM credit markets and domestic bonds. Reading Markets’ Tea Leaves It is impossible to forecast the pace and scope of the spread of COVID-19 as well as the precautionary actions taken by consumers and businesses around the world. In brief, it is unfeasible to assess the COVID-19’s impact on the global economy. The direction of EM sovereign and corporate US dollar bond yields as well as EM local currency government bond yields will be the key to whether EM share prices break down or not. Rather than throwing darts with our eyes closed, we examine profiles of various financial markets with the goal of detecting subtle messages that financial markets often send: Aggregate EM small-cap and Chinese investable small-cap stocks seem to be breaking down (Chart I-12). Chart I-11Daily Commodities Prices In China: No Sign Of Revival
Daily Commodities Prices In China: No Sign Of Revival
Daily Commodities Prices In China: No Sign Of Revival
Chart I-12Investable Small Cap Stocks Seem To Be Breaking Down
Investable Small Cap Stocks Seem To Be Breaking Down
Investable Small Cap Stocks Seem To Be Breaking Down
The technical profiles of various EM currencies versus the US dollar on a total return basis (including the carry) are consistent with a genuine bear market (Chart I-13). Hence, their weakness has further to go. Global industrial stocks’ relative performance against the global equity benchmark has broken below its previous technical support (Chart I-14). This is a bad omen for global growth. Chart I-13EM Currencies Are In A Genuine Bear Market
EM Currencies Are In A Genuine Bear Market
EM Currencies Are In A Genuine Bear Market
Chart I-14A Breakdown In Global Industrials Relative Performance
A Breakdown In Global Industrials Relative Performance
A Breakdown In Global Industrials Relative Performance
Finally, Korean tech stocks as well as the Nikkei index seem to have formed a major top (Chart I-15). This technical configuration suggests that their relapse will very likely last longer and go further. Chart I-15A Major Top in Korean And Japanese Stocks?
A Major Top in Korean And Japanese Stocks?
A Major Top in Korean And Japanese Stocks?
All these signposts relay a downbeat message on global growth and, consequently, EM risk assets and currencies. A pertinent question to ask is whether the currently extremely high level of the VIX is a contrarian signal to buy stocks? Investors often buy the VIX to hedge their underlying equity portfolios from short-term downside. However, when and as they begin to view the equity selloff as enduring, they close their long VIX positions and simultaneously sell stocks. In brief, the VIX’s current elevated levels are likely to be a sign that many investors are still long stocks. When investors trim their equity holdings, they will likely also liquidate their long VIX positions. Thereby, share prices could drop alongside a falling VIX. Therefore, we are using the recent surge in equity volatility to close our long position in implied EM equity volatility. Even though risks to EM share prices are still skewed to the downside, their selloff may not be accompanied by substantially higher EM equity volatility. However, we continue to recommend betting on higher implied volatility in EM currencies. The latter still remains very low. Investment Conclusions We reinstated our short position on the EM equity index on January 30, and this trade remains intact. For global equity portfolios, we continue to recommend underweighting EM versus DM. Within the EM equity universe, our overweights are Korea, Thailand, Russia, central Europe, Mexico, Vietnam, Pakistan and the UAE. Our underweights are Indonesia, the Philippines, South Africa, Turkey and Colombia. We are contemplating downgrading Brazilian equities from neutral to underweight. The change is primarily driven by our downbeat view on banks (Chart I-16). This is in addition to our existing bearish view on commodities. We will publish a Special Report on Brazilian banks in the coming weeks. Barring an irrigation-type of credit and fiscal stimulus, the mainland economy will disappoint. Among the EM equity sectors, we continue to recommend a long EM consumer staples/short banks trade (Chart I-17, top panel) as well as a short both EM and Chinese banks versus their US peers positions (Chart I-17, middle and bottom panels). Chart I-16Brazilian Bank Stocks Are Breaking Down?
Brazilian Bank Stocks Are Breaking Down?
Brazilian Bank Stocks Are Breaking Down?
Chart I-17Our Favored EM Equity Sector Bets
Our Favored EM Equity Sector Bets
Our Favored EM Equity Sector Bets
We continue to recommend a short position in a basket of the following currencies versus the US dollar: BRL, CLP, ZAR, PHP, IDR and KRW. We are also structurally bearish on the RMB. Today we are booking profits on the short Colombian peso / long Russian ruble trade (please refer to section on Colombia on pages 13-17). With respect to EM local currency bonds and EM sovereign credit, our overweights are Mexico, Russia, Colombia, Thailand, Malaysia and Korea. Our underweights are South Africa, Turkey, Indonesia, and the Philippines. The remaining markets warrant a neutral allocation. As always, the list of recommendations is available at end of each week’s report and on our web page. Arthur Budaghyan Chief Emerging Markets Strategist arthurb@bcaresearch.com Colombia: Upgrade Domestic Bonds; Take Profits On Short Peso Trade Chart II-1Oil Makes A Huge Difference To Colombia's Current Account
Oil Makes A Huge Difference To Colombia's Current Account
Oil Makes A Huge Difference To Colombia's Current Account
Today we recommend upgrading local currency bonds and booking profits on the short Colombian peso / long Russian ruble trade. The reason is tight fiscal and monetary policies are positive for bonds and the currency. Although we are structurally bullish on Colombia’s economy, we remain underweight this bourse relative the EM equity benchmark. The primary reason is the high sensitivity of Colombia’s balance of payments to oil prices. In particular, oil accounts for a large share (40%) of Colombia’s exports. As of Q4 2019, the current account deficit was $14 billion or 4% of GDP with oil, and $25 billion or 7.5% of GDP excluding oil (Chart II-1). In short, each dollar drop in oil prices substantially widens the nation’s current account deficit and weighs on the exchange rate. Besides, the current hawkish monetary stance and overly tight fiscal policy will produce a growth downtrend. The Colombian economy has reached a top in its business cycle: The flattening yield curve is foreshadowing a major economic slowdown (Chart II-2, top panel). Our proxy for the marginal propensity to spend for businesses and households leads the business cycle by about six months and is presently indicating that growth will roll over soon (Chart II-2, bottom panel). Moreover, the corporate loan impulse has already relapsed, weighing on companies’ capital expenditures (Chart II-3). Chart II-2The Business Cycle Has Peaked
The Business Cycle Has Peaked
The Business Cycle Has Peaked
Chart II-3Investment Expenditures Heading South
Investment Expenditures Heading South
Investment Expenditures Heading South
The government considerably tightened fiscal policy in the past year and will continue to do so in 2020. The primary fiscal balance has surged to above 1% of GDP as primary fiscal expenditures have stagnated in nominal terms and shrunk in real terms last year (Chart II-4). In regards to monetary policy, the prime lending rate is 12% in nominal and 8.5-9% in real (inflation-adjusted) terms. Such high borrowing costs are restrictive as evidenced by several business cycle indicators that are in a full-fledged downtrend: manufacturing production, imports of consumer and capital goods, vehicle sales and housing starts (Chart II-5). Chart II-4Hawkish Fiscal Policy
Hawkish Fiscal Policy
Hawkish Fiscal Policy
Chart II-5The Economy Is In The Doldrums
The Economy Is In The Doldrums
The Economy Is In The Doldrums
Chart II-6Consumer Spending Has Been Supported By Borrowing
Consumer Spending Has Been Supported By Borrowing
Consumer Spending Has Been Supported By Borrowing
Overall, economic growth has been held up solely by very robust household spending, which accounts for 65% of GDP. Critically, consumer borrowing has financed such buoyant consumer expenditures (Chart II-6). However, the pace of household borrowing is unsustainable with consumer lending rates at 18%. Moreover, nominal and real (deflated by core CPI) wage growth are decelerating markedly and hiring will slow down in line with reduced capital spending. Besides, disinflationary dynamics in this country will be amplified due to the massive influx of immigration from Venezuela in the past two years. Currently, the number of immigrants from the neighboring country stands at 1.4 million people, or 5% of Colombia’s labor force. Such an enormous increase in labor supply introduces deflationary pressures in the Colombian economy by depressing wage growth. Therefore, despite the depreciating currency, core measures of inflation will likely drop to the lower end of the central bank’s target range in next 18-24 months. Investment Recommendations The economy is heading into a cyclical slump but monetary and fiscal policies will remain restrictive. Such a backdrop is bullish for the domestic bond market and structurally, albeit not cyclically, positive for the currency. We have been recommending fixed-income investors to bet on a yield curve flattening by receiving 10-year and paying 1-year swap rates. This trade has returned 77 basis points since its initiation on January 17, 2019. Given the central bank will stay behind the curve, this strategy remains intact. Today we recommend upgrading Colombian local currency bonds from neutral to overweight. Further currency depreciation and an exodus by foreign investors remain a risk. However, on a relative basis – versus its EM peers – this market is attractive. The share of foreign ownership of local currency government bonds in Colombia is 25%, smaller than in many other EMs. Additionally, Colombian bond yields are 80 basis points above the J.P. Morgan EM GBI domestic bonds benchmark and its currency is one standard deviation below its fair value (Chart II-7). We are also overweighting Colombian sovereign credit within an EM credit portfolio. Fiscal policy is very tight and government debt is at a manageable 50% of GDP. The government considerably tightened fiscal policy in the past year and will continue to do so in 2020. Continue to underweight Colombian equities relative to the emerging markets benchmark. We will be looking for a final capitulation in the oil market to upgrade this bourse. Finally, we are booking profits on our short COP versus RUB trade, which has returned a 19% gain since May 31, 2018 (Chart II-8). As mentioned earlier, the peso has already cheapened a lot according to the real effective exchange rate based on unit labor costs (Chart II-7). Meanwhile, Colombia’s macro policy mix is positive for the currency. Chart II-7The Colombian Peso Has Depreciated Substantially
The Colombian Peso Has Depreciated Substantially
The Colombian Peso Has Depreciated Substantially
Chart II-8Taking Profits On Our Short COP / Long RUB Trade
Taking Profits On Our Short COP / Long RUB Trade
Taking Profits On Our Short COP / Long RUB Trade
In contrast, Russia is relaxing its fiscal policy – which is marginally negative for the ruble – and the currency has become a crowded trade. Juan Egaña Research Associate juane@bcaresearch.com Footnotes Equities Recommendations Currencies, Credit And Fixed-Income Recommendations
Highlights Financial markets are now fully priced for an economic downturn lasting one quarter… …but they are not fully priced for a recession. To go tactically long equities versus bonds requires a high conviction that the coronavirus induced downturn will last no longer than one quarter. The big risk is that the coronavirus incubation period might be very long, rendering containment strategies ineffective. Hence, a better investment play is to go long positive yielding US T-bonds and/or UK gilts versus negative yielding Swiss bonds and/or German bunds… …or go long negative yielding currencies versus positive yielding currencies. Our favoured expression is long CHF/USD. Fractal trade: overweight Poland versus Portugal. Feature Chart I-1AFinancial Markets Are Priced For A One-Quarter Downturn...
Financial Markets Are Priced For A One-Quarter Downturn...
Financial Markets Are Priced For A One-Quarter Downturn...
Chart I-1B...But Not For A ##br##Recession
...But Not For A Recession
...But Not For A Recession
They say that when China sneezes, the rest of the world catches a cold. But the saying was meant as an economic metaphor, not as a literal medical truth.1 The current coronavirus crisis has two potential happy endings: ‘containment’, in which its worldwide contagion is halted; or ‘normalisation’, in which it becomes accepted as just another type of winter flu. The virus crisis also has a potential unhappy ending in which neither containment nor normalisation can happen. Containing Contagion To determine whether the virus crisis has a happy or unhappy ending, we must answer three crucial questions: 1. Does the virus thrive only in cold weather? If yes, then the onset of spring and summer should naturally contain the contagion (in the northern hemisphere). We are not experts in epidemiology or immunology, but we understand that the Covid-19 virus surface is a lipid (fat) which could become fragile at higher temperatures. Albeit this might just be a temporary containment until temperatures drop again. 2. Does the virus have a short incubation period before symptoms arise? If yes, then quarantining and containment will be effective because infected people are quickly identified. But if, after infection, there is a long asymptomatic period, then containment would be impossible – because for an extended period the virus would be ‘under cover’. In this regard, the dispersion of infections is as important as the number of infections. A thousand cases across a hundred countries is much more worrying than a thousand cases concentrated in two or three countries (Chart I-2). Chart I-2Covid-19 Has Spread To 80 Countries
Covid-19 Has Spread To 80 Countries
Covid-19 Has Spread To 80 Countries
3. Are most infections going undetected because the symptoms are very mild? If yes, then the true mortality rate of the Covid-19 virus is much lower than we think, and perhaps not that different to the mortality rate of winter flu, at around 1 in a 1000. In which case, the new virus could become ‘normalised’ as a variant of the flu. But if the current mortality rate, at ten times deadlier than the flu, is accurate, then it would be difficult to normalise (Chart I-3). Chart I-3The Covid-19 Mortality Rate Is Ten Times Deadlier Than The Flu. Or Is It?
The Covid-19 Mortality Rate Is Ten Times Deadlier Than The Flu. Or Is It?
The Covid-19 Mortality Rate Is Ten Times Deadlier Than The Flu. Or Is It?
An unhappy ending to the crisis will happen if the answer to all three questions is ‘no’. The main risk is that the asymptomatic incubation period appears to be quite long, rendering containment strategies ineffective. Still, even if the happy ending happens, there are two further questions. How much disruption will the economy suffer before the happy ending? And what have the financial markets priced? The Economic Disruption The disruption to the economy comes from both the supply side and the demand side: the supply side because containment strategies such as quarantining entire towns, shuttering factories, and cancelling major sports and social events hurt output; the demand side because a fearful public’s reluctance to use public transport, visit crowded places such as shopping malls, or travel abroad hurt spending. In this way, both production and consumption will suffer a large hit in the first quarter, at the very least. However, when normal activity eventually resumes, production and consumption will bounce back to pre-crisis levels, and in some cases overshoot pre-crisis levels. For example, if the crisis lasts for a quarter, movie-goers will return to the cinemas as usual in the second quarter, albeit they will not compensate for the visit they missed in the first quarter; but for manufacturers, the backlog of components that were not made during the first quarter will mean that twice as many will be made in the second quarter. For the financial markets, it is not the depth of the V that is important so much as its length. Therefore, economic output will experience a ‘V’ (Chart I-4): a lurch down followed by a symmetrical, or potentially even larger, snapback. However, for the financial markets, it is not the depth of the V that is important so much as its length. Chart I-4Economic Output Will Experience A 'V'
Economic Output Will Experience A 'V'
Economic Output Will Experience A 'V'
The Financial Market Disruption Anticipating the economy to experience a V, investors respond to the crisis according to the expected length of the V versus the different lengths of their investment horizons. By length of investment horizon, we mean the minimum timeframe over which the investor cares about a price move, or ‘marks to market’. Say the market expects the downturn to last three months, followed by a full recovery. A three-month investor, caring about the price in three months, will capitulate. He will sell all his equities and buy bonds. Whereas a six-month investor, caring about the price only in six months, will not capitulate because he will factor in both the down-leg and subsequent up-leg of the V. Meanwhile, a twelve-month investor will be completely unfazed by the short-lived downturn. Therefore, if the downturn lasts one quarter only, the market will bottom when all the three-month investors have capitulated, which is to say become indistinguishable in their behaviour from a 1-day trader. In technical terms, the tell-tale sign for this capitulation is that three-month (65-day) fractal structure of the market totally collapses. Last Friday, the financial markets reached this point, meaning that financial markets are now fully priced for an economic downturn lasting one quarter (Chart I-5). Chart I-5When 3-Month Investors Capitulate It Usually Signals A Trend-Reversal...
When 3-Month Investors Capitulate It Usually Signals A Trend-Reversal...
When 3-Month Investors Capitulate It Usually Signals A Trend-Reversal...
However, six-month and longer horizon investors are still a long way from capitulation. Meaning that the markets are not yet priced for a recession – defined as a contraction in activity lasting two or more straight quarters. It follows that if the down-leg of the V lasts significantly longer than a quarter then equities and other risk-assets have further downside versus high-quality bonds (Chart of the Week). During the global financial crisis, three-month investors had fully capitulated by September 3 2008 when equities had underperformed bonds by a seemingly huge 20 percent. However, equities went on to underperform bonds by a further 50 percent and only found a bottom when eighteen-month investors had fully capitulated in early 2009 (Chart I-6). This makes perfect sense, because profits contracted for a full eighteen months (Chart I-7). Chart I-6...But In The Global Financial Crisis The Market Turned Only When 18-Month Investors Had Capitulated...
...But In The Global Financial Crisis The Market Turned Only When 18-Month Investors Had Capitulated...
...But In The Global Financial Crisis The Market Turned Only When 18-Month Investors Had Capitulated...
Chart I-7...Because In The Global Financial Crisis, Profits Contracted For 18 Months
...Because In The Global Financial Crisis, Profits Contracted For 18 Months
...Because In The Global Financial Crisis, Profits Contracted For 18 Months
All of which brings us to a very powerful investment identity: Financial markets have fully priced a downturn when the time horizon of investors that have fully capitulated = the length of the downturn. The message right today is to go tactically long equities versus bonds if you have high conviction that the coronavirus induced downturn will last no longer than one quarter. Given that the coronavirus incubation period appears to be quite long, rendering containment strategies ineffective, we do not have such a high conviction on this tactical trade. Central banks that are already at the limits of monetary policy easing cannot ease much more. Instead, we have much higher conviction that those central banks that are already at the limits of monetary policy easing cannot ease much relative to those that have the scope to ease. The conclusion is: go long positive yielding US T-bonds and/or UK gilts versus negative yielding Swiss bonds and/or German bunds. Conversely, go long negative yielding currencies versus positive yielding currencies. Our favoured expression is long CHF/USD (Chart I-8). Chart I-8Overweight Positive-Yielding Bonds, And Overweight Negative-Yielding Currencies
Overweight Positive-Yielding Bonds, And Overweight Negative-Yielding Currencies
Overweight Positive-Yielding Bonds, And Overweight Negative-Yielding Currencies
Fractal Trading System* This week’s recommended trade is to overweight Poland versus Portugal. Set the profit target at 3.5 percent with a symmetrical stop-loss. In other trades, long EUR/GBP achieved its 2 percent profit target at which it was closed. And short palladium has quickly gone into profit, given that the palladium price is down 10 percent in the last week. The rolling 1-year win ratio now stands at 62 percent. Chart I-9Poland Vs. Portugal
Poland Vs. Portugal
Poland Vs. Portugal
When the fractal dimension approaches the lower limit after an investment has been in an established trend it is a potential trigger for a liquidity-triggered trend reversal. Therefore, open a countertrend position. The profit target is a one-third reversal of the preceding 13-week move. Apply a symmetrical stop-loss. Close the position at the profit target or stop-loss. Otherwise close the position after 13 weeks. * For more details please see the European Investment Strategy Special Report “Fractals, Liquidity & A Trading Model,” dated December 11, 2014, available at eis.bcaresearch.com. Dhaval Joshi Chief European Investment Strategist dhaval@bcaresearch.com Footnotes 1 The original version of the metaphor is attributed to the nineteenth century Austrian diplomat Klemens Metternich who said: “When France sneezes all of Europe catches a cold”. Subsequently, the Metternich metaphor has been adapted for any economy with outsized influence on the rest of the world. Fractal Trading Model
Is The Contagion Containable?
Is The Contagion Containable?
Is The Contagion Containable?
Is The Contagion Containable?
Cyclical Recommendations Structural Recommendations
Is The Contagion Containable?
Is The Contagion Containable?
Is The Contagion Containable?
Is The Contagion Containable?
Is The Contagion Containable?
Is The Contagion Containable?
Is The Contagion Containable?
Is The Contagion Containable?
Trades Closed Trades Asset Performance Currency & Bond Equity Sector Country Equity Indicators Bond Yields Chart II-1Indicators To Watch - Bond Yields
Indicators To Watch - Bond Yields
Indicators To Watch - Bond Yields
Chart II-2Indicators To Watch - Bond Yields
Indicators To Watch - Bond Yields
Indicators To Watch - Bond Yields
Chart II-3Indicators To Watch - Bond Yields
Indicators To Watch - Bond Yields
Indicators To Watch - Bond Yields
Chart II-4Indicators To Watch - Bond Yields
Indicators To Watch - Bond Yields
Indicators To Watch - Bond Yields
Interest Rate Chart II-5Indicators To Watch - Interest Rate Expectations
Indicators To Watch - Interest Rate Expectations
Indicators To Watch - Interest Rate Expectations
Chart II-6Indicators To Watch - Interest Rate Expectations
Indicators To Watch - Interest Rate Expectations
Indicators To Watch - Interest Rate Expectations
Chart II-7Indicators To Watch - Interest Rate Expectations
Indicators To Watch - Interest Rate Expectations
Indicators To Watch - Interest Rate Expectations
Chart II-8Indicators To Watch - Interest Rate Expectations
Indicators To Watch - Interest Rate Expectations
Indicators To Watch - Interest Rate Expectations
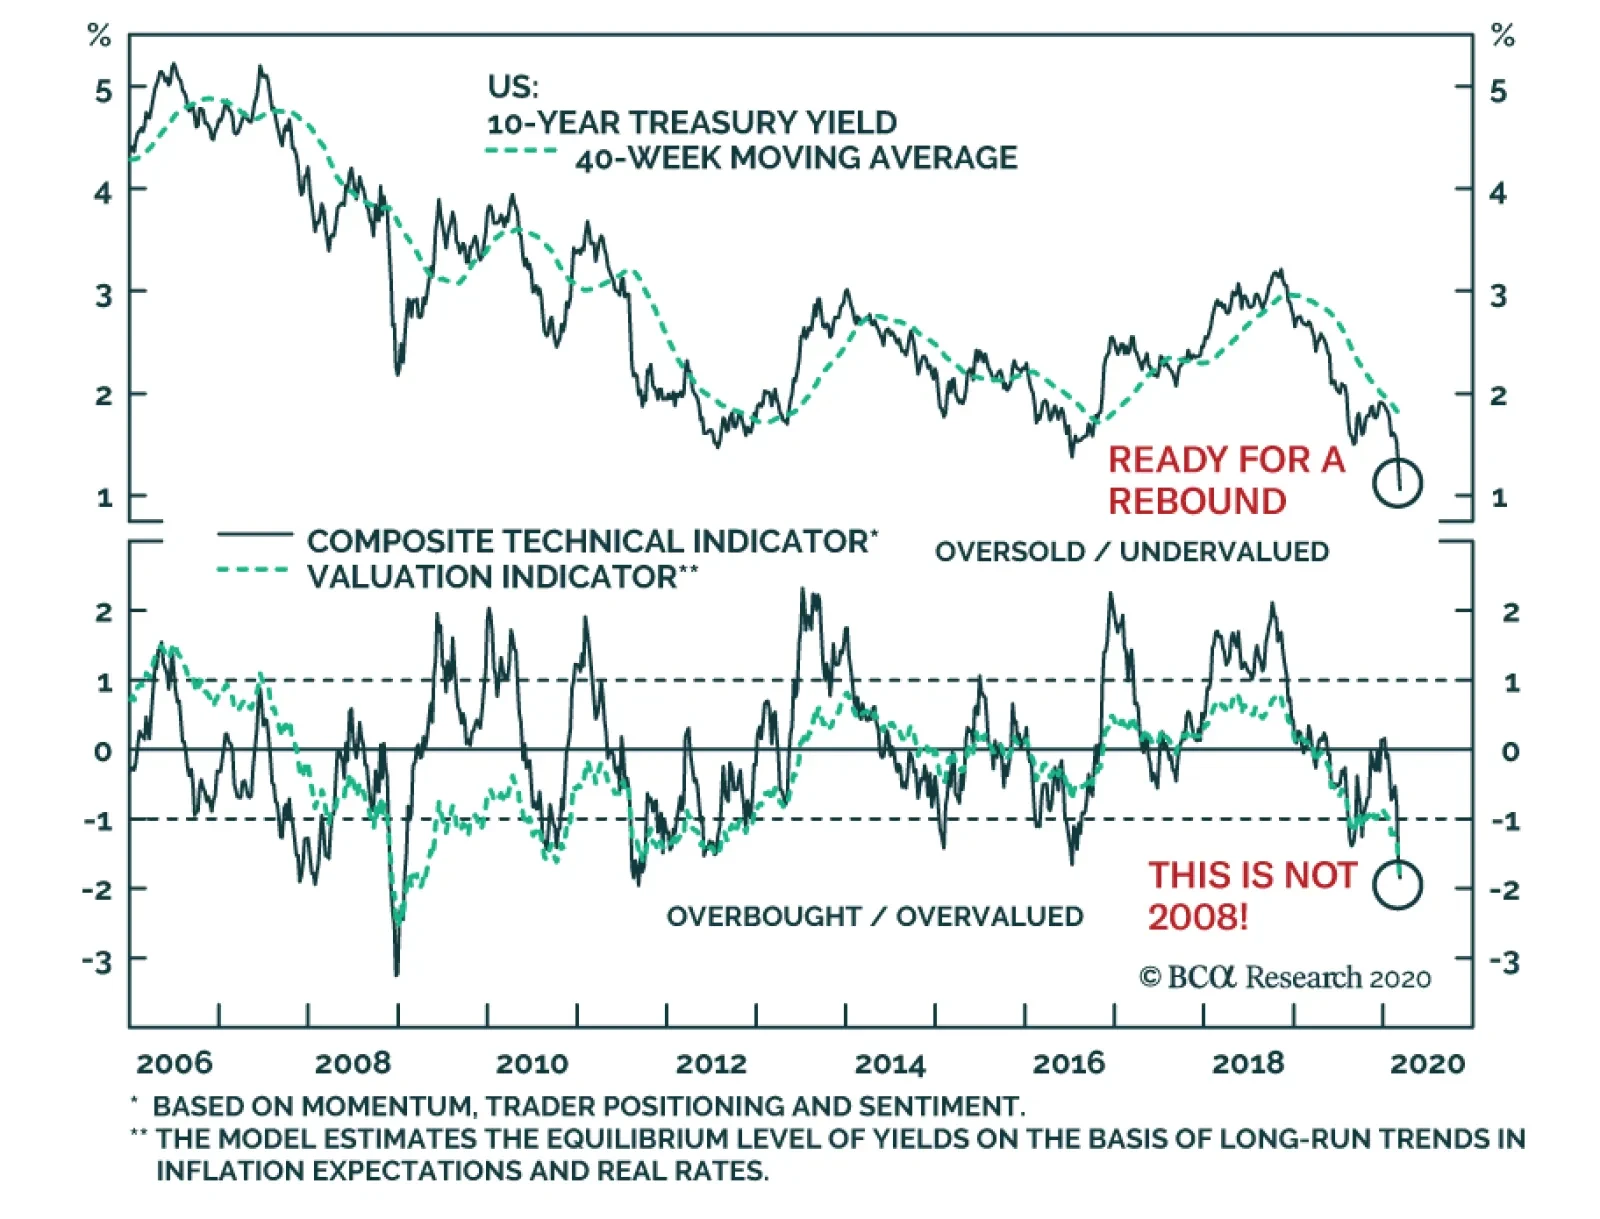
Treasury yields spent yesterday below 1%, which once again begs the question, is it time to sell? Unlike last week, our Composite Technical Indicator and our Bond Valuation Index are now consistent with a bottom. Only in 2008 were they more depressed than…
Highlights At the current rate of work resumption, March’s PMI should rebound to its “normal range” from February’s historic lows. If so, our simple calculation, using China’s PMI figures and GDP growth in Q4 2008 as a template, suggests that China's economic growth in Q1 2020 should come in at around 3.2%. Chinese stocks passively outperformed global benchmarks in the last two weeks. The likelihood of a stimulus overshoot in the next 6-12 months continues to rise, supporting our view that Chinese stocks will actively outperform global benchmark in the coming months. Cyclical stocks have significantly outperformed defensives lately. While this is consistent with our constructive view towards Chinese equities in general, the magnitude of a tech stock rally in the domestic market of late appears to be somewhat excessive. As such, investors should focus their sector exposure in favor of resources, industrials, and consumer discretionary. The depreciation in the RMB against the dollar will come primarily from a stronger dollar rather than a weaker RMB, and the downside in the value of the RMB should be limited. Feature Despite the past week’s plunge in global equities due to the threat of a worldwide COVID-19 pandemic, Chinese stocks have outperformed relative to global benchmarks. This underscores our view that epidemic risks within China are slowly abating, and China’s reflationary response to the crisis will likely overcompensate for the short-term economic shock. Tables 1 and 2 highlight key developments in China’s economy and its financial markets in the past month. On the growth front, both the February official and Caixin PMIs dropped to historic lows as a result of the virus outbreak and nationwide lockdown. On the other hand, economic data from January confirmed that pre-outbreak activity in China was on track to recovery. Daily data also suggests that production in China continues to resume. Moreover, monetary conditions have significantly loosened and fiscal supports have materially stepped up. Chinese equities in both onshore and offshore markets dropped by 2% and 7% respectively (in absolute terms) from their January 13 peaks. Nevertheless, they have both significantly outperformed global equities, particularly in the past week. Equally-weighted cyclical stocks versus defensives in the onshore market have also moved up sharply, driven by a rally in the technology sector stocks. While the outperformance of cyclical stocks is consistent with our constructive view towards Chinese stocks, the magnitude appears to be excessive. Thus, we would advise investors positioning for a cyclical recovery in China to favor exposure in resources, industrials and consumer discretionary stocks. Table 1China Macro Data Summary
China Macro And Market Review
China Macro And Market Review
Table 2China Financial Market Performance Summary
China Macro And Market Review
China Macro And Market Review
In reference to Tables 1 and 2, we have a number of observations concerning developments in China’s macro and financial market data: Chart 1Inventory And Production Shortages Are A Bigger Near-Term Concern Than Weaknesses In Demand
Inventory And Production Shortages Are A Bigger Near-Term Concern Than Weaknesses In Demand
Inventory And Production Shortages Are A Bigger Near-Term Concern Than Weaknesses In Demand
February’s drop in the official PMI below 40% is reminiscent of November 2008, which was the height of the global financial crisis. The raw material inventory sub-index of the PMI in February fell to a record low, a clear indication of strain in China’s manufacturing sector. While the finished goods inventory sub-index ticked up slightly compared with January, factories will likely run out of existing raw materials to produce goods if transportation logistics do not return to normal soon (Chart 1). A higher number in the new orders sub-index relative to production output also suggests the pressure on the supply side will intensify if the virus outbreak in China worsens and continues to disrupt manufacturing activities. This will in turn undermine the effectiveness of Chinese policy response. Daily data from various sources suggests Chinese industrial activities continue to pick up. Between February 10 (the first official return-to-work day after an extended Chinese New Year holiday) and February 25 (the cutoff date for responding to PMI surveys), daily coal consumption in China’s six largest power plants was only about 60% of consumption compared from the same period last year (adjusted for the Lunar Year calendar). This is in line with the 35.7 reading in February’s manufacturing PMI, versus 49.2 a year ago. In the last four days of February, however, coal consumption reached nearly 70% of last year’s consumption. This figure is in keeping with a 10 percentage point increase in the rate of work resumption of enterprises above-designated size in China’s coastal regions.1 If energy consumption and work resumption rates reach about 90% by the end of March compared with Q1 2019, then PMI in March should pick up to 45% or higher. A 45% or higher reading in March’s PMI will imply economic impact from the virus outbreak is mostly limited to February. A simple calculation using China’s GDP growth in Q4 2008 as a template suggests that China's economic growth in Q1 2020 should come in at around 3.2% in real terms. This is in line with the estimate from BCA's Global Investment Strategy service.2 As we pointed out in November last year,3 China is frontloading additional fiscal stimulus in Q1 2020 to secure the economic recovery, which started to bud prior to the virus outbreak. The increase in January’s credit numbers confirms our projection. The monthly flow in total social financing in January (with only three work weeks effectively) reached above RMB 5 trillion. This figure exceeded that in January 2019, the highest monthly credit number last year. Local government bond issuance in January was almost double that a year ago, and a total of 1.2 trillion local government bonds were issued in the first two months of this year - a 53% jump from the same period last year. This suggests that fiscal stimulus has indeed stepped up in 2020. Money supply in January was slightly distorted by the earlier Chinese New Year (it fell in January this year instead of February as in most years) and the COVID-19 outbreak. M1 registered zero growth from a year ago, whereas it grew by 0.4% in January 2019.4 Normally, during the month of the Chinese New Year, households have more cash in deposits whereas corporations have less as they pay pre-holiday bonuses to employees. This seasonality factor causes the growth rate in M0 to rise and M1 growth to fall. The seasonality was exacerbated by the nationwide lockdown on January 20 this year, as many real estate developers reportedly suffered from a significant reduction in home sales and delays in deposits for down payments. Household consumption in the service sector during the Chinese New Year was also severely suppressed. This explains near-zero growth in M1 and a larger-than-expected increase in household deposits in January (Chart 2). We expect the growth in both M0 and M1 to start normalizing in March, as production and household consumption continue to resume. While we do not expect large fluctuations in housing prices, we think growth in home sales may accelerate from Q2 2020. There are early signs that the government is starting to relax restrictions on the real estate sector, on a region by region basis. Land sales remain a major source of local governments’ income, accounting for more than half of total revenues as of last year. Chart 3 shows that as government expenditures lead land sales, a major increase in fiscal stimulus and local government spending means that a significant bump in land sales will be needed in 2020. A strengthening supply of land, coupled with the unlikelihood of large fluctuations in property prices, suggests that there will be more policy supports to the real estate sector and more incentives to boost housing demand. Chart 2Corporates Are Short On Cash
Corporates Are Short On Cash
Corporates Are Short On Cash
Chart 3Land And Home Sales Likely To Pick Up In 2020
Land And Home Sales Likely To Pick Up In 2020
Land And Home Sales Likely To Pick Up In 2020
In the past two weeks, China’s equity market has registered a near-vertical outperformance in both investable and domestic stocks relative to global benchmarks (Chart 4). While this recent outperformance was passive in nature, our policy assessment supports future active outperformance. The recently announced pro-growth policy initiatives increasingly resemble those rolled out at the start of the last easing cycle in 2015/2016. These policy initiatives increase the odds that the upcoming “insurance stimulus” will overcompensate for the short-term economic shock, and will likely lead to a significant rebound in corporate profits in the next 6-12 months. This supports our bullish view on Chinese stocks. Chart 5 also shows that, unlike during the 2015’s “bubble and bust” cycle, both the valuation and margin trading as a percentage of total market cap in China’s onshore market remain materially lower than 2015. Equally-weighted cyclical sectors continue to outperform defensives in both China’s investable and domestic markets, particularly the latter where stock prices in the technology sector were up 12% within the past month. While the outperformance of cyclical stocks relative to defensives is consistent with our constructive view towards Chinese equities in general, the magnitude appears to be somewhat excessive. Given this, we would advise investors positioning for a cyclical recovery in China’s economy to focus their sector exposure in favor of resources, industrials, and consumer discretionary stocks. Chart 4Chinese Stocks Strongly Outperformed Global Benchmarks Over The Past Two Weeks
Chinese Stocks Strongly Outperformed Global Benchmarks Over The Past Two Weeks
Chinese Stocks Strongly Outperformed Global Benchmarks Over The Past Two Weeks
Chart 5Onshore Market Trading Does Not Seem Overly Leveraged
Onshore Market Trading Does Not Seem Overly Leveraged
Onshore Market Trading Does Not Seem Overly Leveraged
China’s three-month repo rate (the de facto policy rate) has fallen significantly in the past month, roughly 30bps below its lowest level in 2016 (Chart 6). China’s government bond yields have also reached their lowest level since 2016. While corporate bond yield spreads in other major economies have picked up sharply in the past month, the reverse is happening in China. This suggests that the market is pricing in further easing and the notion that policy supports will be effective in preventing a surge in corporate bond default rate. From a global perspective, yield spreads on China’s onshore corporate bonds have been elevated since 2016. This indicates that investors have long either priced in a much higher default rate among Chinese corporate bond issuers, or demand an unjustifiably large risk premium (Chart 7). Since we expect Chinese policymakers to continue easing, risks of a surge in China’s corporate bond default rate remain low this year. As such, until we see signs that the Chinese authorities are reverting to a financial de-risking mode, we will continue to favor onshore corporate versus duration-matched government bonds. Chart 6Monetary Policy Now More Accommodative Than 2015-2016
Monetary Policy Now More Accommodative Than 2015-2016
Monetary Policy Now More Accommodative Than 2015-2016
Chart 7Chinese Corporates Pay High Risk Premium For Their Bonds, Even At A Relatively Low Default Rate
Chinese Corporates Pay High Risk Premium For Their Bonds, Even At A Relatively Low Default Rate
Chinese Corporates Pay High Risk Premium For Their Bonds, Even At A Relatively Low Default Rate
Chart 8The RMB Likely To Continue Outperforming Other EM Currencies
The RMB Likely To Continue Outperforming Other EM Currencies
The RMB Likely To Continue Outperforming Other EM Currencies
As we go to press, the Federal Reserve Bank has just made a 50bps cut to the Fed rate, the first emergency cut since the global financial crisis. The USD weakened against the Euro, the Japanese Yen, as well as the RMB immediately following the rate cut. While this reflects the market’s concerns of a worsening virus outbreak and the rising possibility of an economic slowdown in the US, the USD as a countercyclical currency will likely appreciate against most cyclical currencies as the virus continues spreading globally. Hence, the depreciation in the RMB against the dollar will come primarily from a stronger dollar rather than a weaker RMB, and the downside in the value of the RMB should be limited. The continuation of resuming production in China and the expectations of a Chinese economic recovery in Q2 will support an appreciation in the RMB against other EM currencies (Chart 8). Qingyun Xu, CFA Senior Analyst qingyunx@bcaresearch.com Jing Sima China Strategist jings@bcaresearch.com Footnotes 1 http://app.21jingji.com/html/2020yiqing_fgfc/ 2 Please see Global Investment Strategy Weekly Report "Markets Too Complacent About The Coronavirus," dated February 21, 2020, available at gis.bcaresearch.com 3 Please see China Investment Strategy Weekly Report "Questions From The Road: Timing The Turn," dated November 20, 2020, available at gis.bcaresearch.com 4 M1 is mainly made up by cash demand deposits from corporations, whereas M0 is mainly deposits from households Cyclical Investment Stance Equity Sector Recommendations
Yesterday, BCA Research's Global Fixed Income Strategy service raised its overall global duration exposure to neutral on a tactical basis, as a hedge to owning risk assets like corporate bonds, where some value has opened up after last week’s selloff.…
Highlights Chart 1Making New Lows
Making New Lows
Making New Lows
While the number of daily new COVID-19 cases is falling in China, the virus is spreading rapidly to the rest of the world. It is now clear that the outbreak will not be contained, though much uncertainty remains about the magnitude and duration of the global economic fallout. US bond yields have dropped dramatically, with the 10-year yield threatening to break below 1% for the first time ever (Chart 1). Interest rate markets are also pricing-in a rapid Fed response, with more than 100 bps of rate cuts priced for the next year and a 50 bps rate cut discounted for March. On Friday, BCA released a Special Alert making the case that stock prices have fallen enough to buy the market, even on a tactical (3-month) horizon. It is too early to make a similar call looking for higher bond yields. While risk assets will get near-term support from a dovish monetary policy shift, bond yields will stay low (and could even fall further) until global economic recovery appears likely. On a 12-month horizon, our base case scenario is that the Fed will not have to deliver the 110 bps of cuts that are currently priced. We therefore expect bond yields to be higher one year from now. But investors with shorter time horizons should wait before calling the bottom in yields. Feature Investment Grade: Neutral Chart 2Investment Grade Market Overview
Investment Grade Market Overview
Investment Grade Market Overview
Investment grade corporate bonds underperformed the duration-equivalent Treasury index by 176 basis points in February, dragging year-to-date excess returns down to -255 bps. Coronavirus fears pushed spreads wider in February, and the average spread for the overall investment grade index moved back above our cyclical target (Chart 2).1 As for specific credit tiers, Baa spreads are 9 bps above target and Aa spreads are 3 bps cheap. A-rated spreads are sitting right on our target, and Aaa debt remains 5 bps expensive. Looking beyond the economic fallout from the coronavirus, accommodative monetary conditions remain the key support for corporate bonds. Notably, both the 2-year/10-year and 3-year/10-year Treasury slopes steepened in February, and both remain firmly above zero. This suggests that the market believes that the Fed will keep policy easy. As we discussed two weeks ago, restrictive Fed policy – as evidenced by an inverted 3-year/10-year Treasury curve and elevated TIPS breakeven inflation rates – is required before banks choke off the supply of credit, causing defaults and a bear market in corporate spreads.2 Bottom Line: Corporate spreads will keep widening until coronavirus fears abate, but COVID-19 will not cause the end of the credit cycle. Once the dust settles, a buying opportunity will emerge in investment grade corporates, with spreads back above our cyclical targets. Table 3ACorporate Sector Relative Valuation And Recommended Allocation*
Too Soon To Call The Bottom In Yields
Too Soon To Call The Bottom In Yields
Table 3BCorporate Sector Risk Vs. Reward*
Too Soon To Call The Bottom In Yields
Too Soon To Call The Bottom In Yields
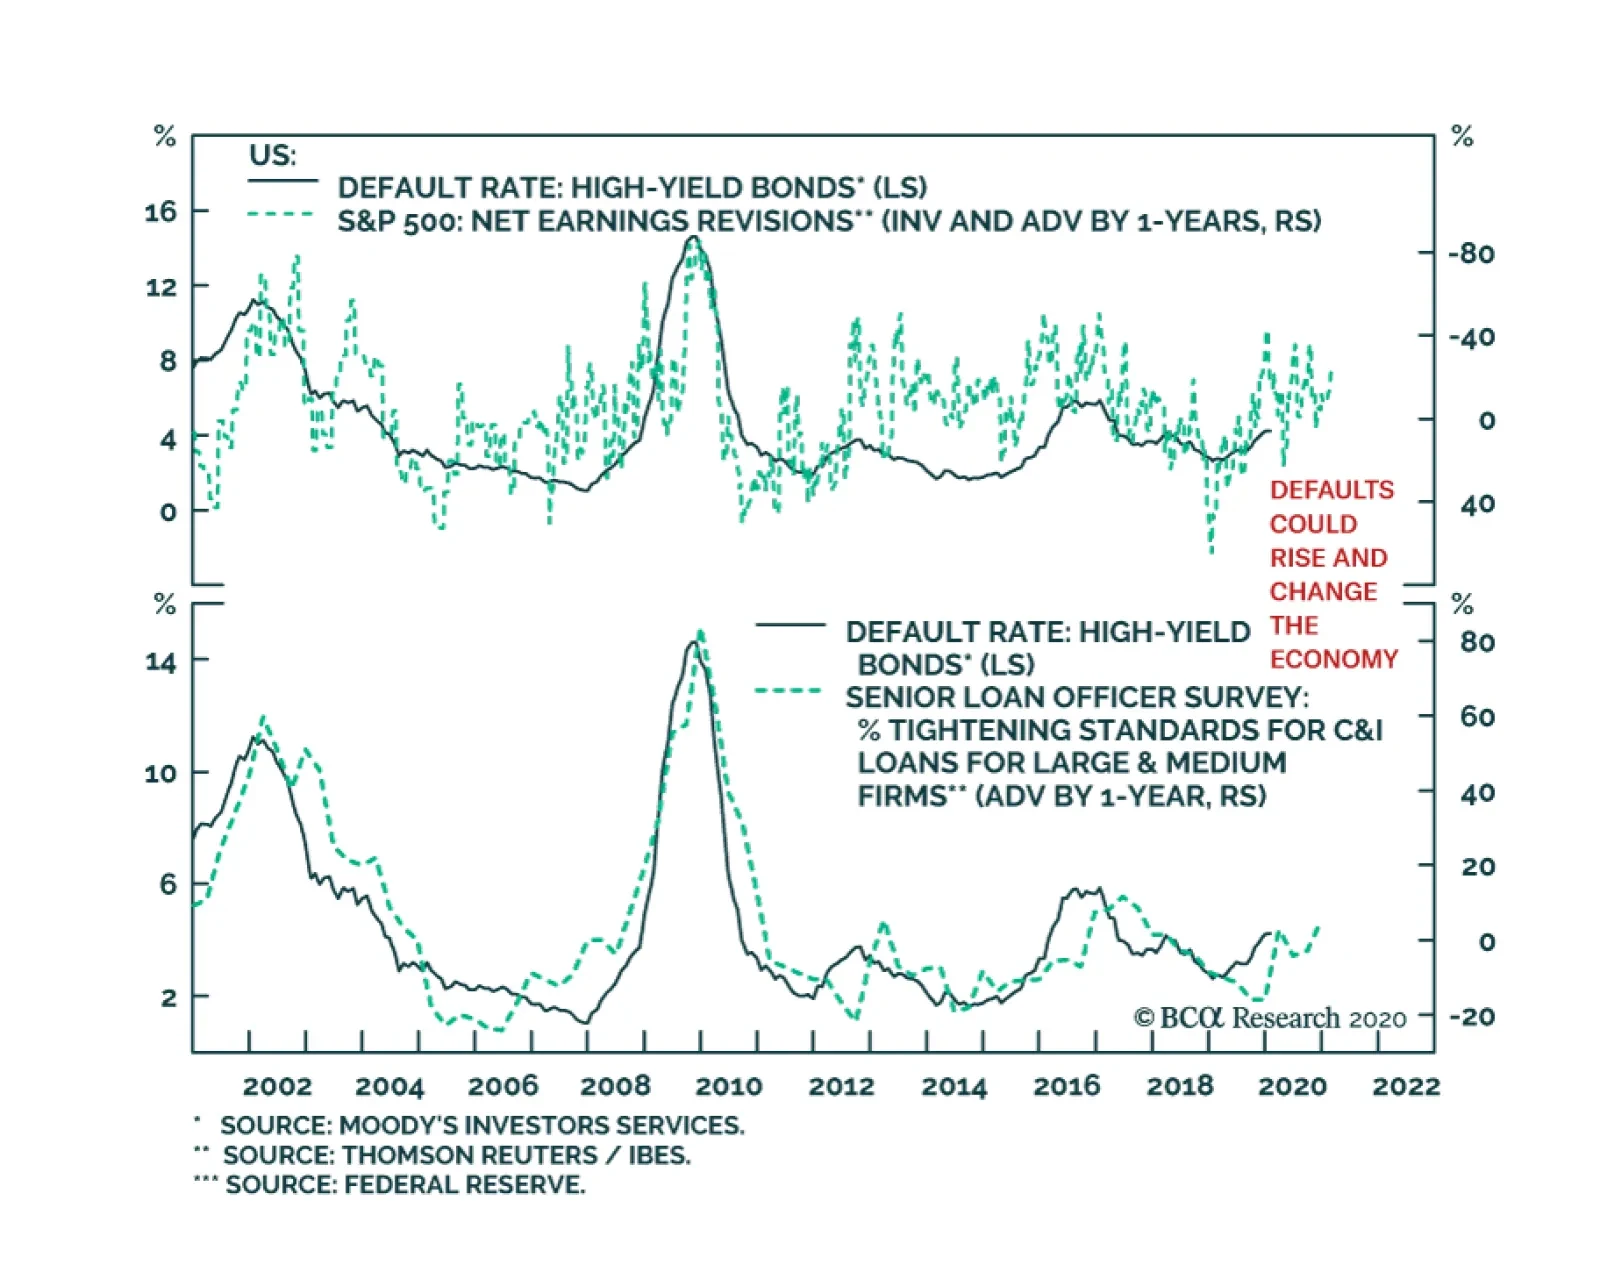
High-Yield: Overweight Chart 3High-Yield Market Overview
High-Yield Market Overview
High-Yield Market Overview
High-Yield underperformed the duration-equivalent Treasury index by 271 basis points in February, dragging year-to-date excess returns down to -379 bps. The junk index spread widened 110 bps on the month and is currently 37 bps below its early-2019 peak. Ex-energy, the average index spread widened 93 bps in February. It is 71 bps below its 2019 peak. High-yield spreads were well above our cyclical targets prior to the COVID-19 outbreak and have only cheapened further during the past month. More spread widening is likely in the near-term, but an exceptional buying opportunity will emerge once virus-related fears fade. This is especially true relative to investment grade corporate bonds. To illustrate the valuation disparity between investment grade and high-yield, we calculated the average monthly spread widening for each credit tier during this cycle’s three major “risk off” phases (2011, 2015 and 2018). We then used each credit tier’s average option-adjusted spread and duration to estimate monthly excess returns for that amount of spread widening (Chart 3, bottom panel). The results show that, in past years, Baa-rated corporates behaved much more defensively than Ba or B-rated bonds. But now, because of the greater spread cushion and lower duration in the junk space, estimated downside risk is similar. In other words, the valuation disparity between investment grade and junk means that investment grade corporates offer much less downside protection than usual compared to high-yield. MBS: Neutral Chart 4MBS Market Overview
MBS Market Overview
MBS Market Overview
Mortgage-Backed Securities underperformed the duration-equivalent Treasury index by 7 basis points in February, dragging year-to-date excess returns down to -60 bps. The conventional 30-year zero-volatility spread widened 1 bp on the month, driven by a 7 bps widening of the option-adjusted spread that was partially offset by a 6 bps reduction in expected prepayment losses (aka option cost). The 10-year Treasury yield has made a new all-time low, and the 30-year mortgage rate – at 3.45% – is only 14 bps above its own (Chart 4). At these levels, an increase in mortgage refinancing activity is inevitable, and indeed, the MBA Refi index has bounced sharply in recent weeks. MBS spreads, however, have not yet reacted to the higher refi index (panel 3). The nominal spread on 30-year conventional MBS is only 9 bps above where it started the year, and expected prepayment losses are 5 bps lower.3 Some widening is likely during the next few months, and we recommend that investors reduce exposure to Agency MBS. Even on a 12-month horizon, MBS spreads offer good value relative to investment grade corporate bonds for now (bottom panel), but investment grade corporates will cheapen on a relative basis if the current risk-off environment continues. This is probably a good time to start paring exposure to MBS, with the intention of re-deploying into corporate credit when spreads peak. Government-Related: Underweight Chart 5Government-Related Market Overview
Government-Related Market Overview
Government-Related Market Overview
The Government-Related index underperformed the duration-equivalent Treasury index by 86 basis points in February, dragging year-to-date excess returns down to -99 bps. Sovereign debt underperformed duration-equivalent Treasuries by 270 bps in February, dragging year-to-date excess returns down to -367 bps. Foreign Agencies underperformed the Treasury benchmark by 162 bps on the month, dragging year-to-date excess returns down to -189 bps. Local Authority debt underperformed Treasuries by 14 bps in February, dragging year-to-date excess returns down to +47 bps. Domestic Agency bonds underperformed by 5 bps in February, dragging year-to-date excess returns down to -7 bps. Supranationals outperformed by 5 bps on the month, bringing year-to-date excess returns up to +7 bps. We continue to see little value in USD-denominated Sovereign debt, outside of Mexico and Saudi Arabia where spreads look attractive compared to similarly-rated US corporate bonds (Chart 5). The Local Authority and Foreign Agency sectors, however, offer attractive combinations of risk and reward according to our Excess Return Bond Map (see Appendix C). Our Global Asset Allocation service just released a Special Report on emerging market debt that argues for favoring USD-denominated EM sovereign debt over both USD-denominated EM corporate debt and local-currency EM sovereign bonds.4 Municipal Bonds: Overweight Chart 6Municipal Market Overview
Municipal Market Overview
Municipal Market Overview
Municipal bonds underperformed the duration-equivalent Treasury index by 80 basis points in February, dragging year-to-date excess returns down to -114 bps (before adjusting for the tax advantage). The average Aaa-rated Municipal / Treasury (M/T) yield ratio rose 11% on the month to 88%, remaining below its post-crisis mean (Chart 6). For some time we have been advising clients to focus municipal bond exposure at the long-end of the Aaa curve, where yield ratios were above average pre-crisis levels. But last month’s sell-off brought some value back to the front end (panel 2). Specifically, the 2-year, 5-year and 10-year M/T yield ratios are all back above their average pre-crisis levels at 85%, 83% and 86%, respectively. 20-year and 30-year maturities are still cheapest, at yield ratios of 93% and 94%, respectively. Investors should adopt a laddered allocation across the municipal bond curve, as opposed to focusing exposure at the long-end. Fundamentally, state and local government balance sheets remain solid. Our Municipal Health Monitor is in “improving health” territory and state & local government interest coverage has improved considerably in recent quarters (bottom panel). Both trends are consistent with muni ratings upgrades continuing to outpace downgrades going forward. Treasury Curve: Maintain A Barbell Curve Positioning Chart 7Treasury Yield Curve Overview
Treasury Yield Curve Overview
Treasury Yield Curve Overview
The Treasury curve bull-steepened dramatically in February, with yields down at least 30 bps across the board. The 2/10 Treasury slope steepened 9 bps on the month, reaching 27 bps. The 5/30 slope also steepened 9 bps to reach 76 bps. February’s plunge in yields was massive, but the fact that it occurred without 2/10 or 5/30 flattening signals that the market expects the Fed to respond quickly and that any economic pain will be relatively short lived. In fact, the front-end of the curve is now priced for 110 bps of rate cuts during the next 12 months (Chart 7). That amount of easing would bring the fed funds rate back to 0.48%, less than two 25 basis point increments off the zero lower bound. Though the drop in 12-month rate expectations didn’t move the duration-matched 2/5/10 or 2/5/30 butterfly spreads very much, the 5-year note remains very expensive relative to both the 2/10 and 2/30 barbells (bottom 2 panels). The richness in the 5-year note will reverse if the Fed delivers less than the 110 bps of rate cuts that are currently priced for the next year. At present, we view less than 110 bps of easing as the most likely scenario, and therefore maintain our position long the 2/30 barbell and short the 5-year bullet. TIPS: Overweight Chart 8Inflation Compensation
Inflation Compensation
Inflation Compensation
TIPS underperformed the duration-equivalent nominal Treasury index by 159 basis points in February, dragging year-to-date excess returns down to -232 bps. The 10-year TIPS breakeven inflation rate fell 24 bps to 1.42%. The 5-year/5-year forward TIPS breakeven inflation rate fell 21 bps to 1.50%. Both rates remain well below the 2.3%-2.5% range consistent with the Fed’s inflation target. We have been recommending that investors own TIPS breakeven curve flatteners on the view that inflationary pressures will first show up in the realized inflation data and the short-end of the breakeven curve, before infecting the long-end.5 However, recent risk-off market behavior has caused long-end inflation expectations to fall dramatically, while sticky near-term inflation prints have supported short-dated expectations. Case in point, the 2-year TIPS breakeven inflation rate declined 16 bps in February, compared to a 24 bps drop for the 10-year (Chart 8). Inflation curve flattening could continue in the near-term but will reverse when risk assets recover. As a result, we recommend taking profits on TIPS breakeven curve flatteners and waiting for a period of re-steepening before putting the trade back on. Fundamentally, we note that the 10-year TIPS breakeven inflation rate is 38 bps cheap according to our re-vamped Adaptive Expectations Model (bottom panel).6 Investors should remain overweight TIPS versus nominal Treasuries on a 12-month horizon. ABS: Underweight Chart 9ABS Market Overview
ABS Market Overview
ABS Market Overview
Asset-Backed Securities underperformed the duration-equivalent Treasury index by 6 basis points in February, dragging year-to-date excess returns down to +26 bps. The index option-adjusted spread for Aaa-rated ABS widened 7 bps on the month. It currently sits at 33 bps, right on top of its minimum pre-crisis level (Chart 9). Our Excess Return Bond Map (see Appendix C) shows that Aaa-rated consumer ABS ranks among the most defensive US spread products. This explains why the sector has weathered the recent storm so well, and why it is actually up versus Treasuries so far this year. ABS also offer higher expected returns than other low-risk spread sectors such as Domestic Agency bonds and Supranationals. For as long as the current risk-off phase continues, consumer ABS are a more attractive place to hide than Domestic Agencies or Supranationals. However, once risk-on market behavior re-asserts itself, consumer ABS will once again lag other riskier spread products. In the long-run, we also remain concerned about deteriorating consumer credit fundamentals, as evidenced by tightening lending standards for both credit cards and auto loans, and a rising household interest expense ratio (bottom 2 panels). Non-Agency CMBS: Neutral Chart 10CMBS Market Overview
CMBS Market Overview
CMBS Market Overview
Non-Agency Commercial Mortgage-Backed Securities underperformed the duration-equivalent Treasury index by 42 basis points in February, dragging year-to-date excess returns down to +1 bp. The index option-adjusted spread for non-agency Aaa-rated CMBS widened 9 bps on the month. It currently sits at 76 bps, below its average pre-crisis level (Chart 10). In a recent Special Report, we explored how low interest rates have boosted commercial real estate (CRE) prices this cycle and concluded that a sharp drawdown in CRE prices is likely only when inflation starts to pick up steam.7 In that report we also mentioned that non-agency Aaa-rated CMBS spreads look attractive relative to US corporate bonds in risk-adjusted terms (Appendix C), and that the macro environment is close to neutral for CMBS spreads. Both CRE lending standards and loan demand were close to unchanged during the past quarter, as per the Fed’s Senior Loan Officer Survey (bottom 2 panels). Agency CMBS: Overweight Agency CMBS performed in line with the duration-equivalent Treasury index in February, leaving year-to-date excess returns unchanged at +35 bps. The index option-adjusted spread widened 2 bps on the month to reach 56 bps. Agency CMBS offer greater expected return than Aaa-rated consumer ABS, while also carrying agency backing (Appendix C). An overweight allocation to this sector remains appropriate. Appendix A: The Golden Rule Of Bond Investing We follow a two-step process to formulate recommendations for bond portfolio duration. First, we determine the change in the federal funds rate that is priced into the yield curve for the next 12 months. Second, we decide – based on our assessments of the economy and Fed policy – whether the change in the fed funds rate will exceed or fall short of what is priced into the curve. Most of the time, a correct answer to this question leads to the appropriate duration call. We call this framework the Golden Rule Of Bond Investing, and we demonstrated its effectiveness in the US Bond Strategy Special Report, “The Golden Rule Of Bond Investing”, dated July 24, 2018, available at usbs.bcaresearch.com. Chart 11 illustrates the Golden Rule’s track record by showing that the Bloomberg Barclays Treasury Master Index tends to outperform cash when rate hikes fall short of 12-month expectations, and vice-versa. Chart 11The Golden Rule's Track Record
The Golden Rule's Track Record
The Golden Rule's Track Record
At present, the market is priced for 110 basis points of cuts during the next 12 months. We anticipate a flat fed funds rate over that time horizon, and therefore anticipate that below-benchmark portfolio duration positions will profit. We can also use our Golden Rule framework to make 12-month total return and excess return forecasts for the Bloomberg Barclays Treasury index under different scenarios for the fed funds rate. Excess returns are relative to the Bloomberg Barclays Cash index. To forecast total returns we first calculate the 12-month fed funds rate surprise in each scenario by comparing the assumed change in the fed funds rate to the current value of our 12-month discounter. This rate hike surprise is then mapped to an expected change in the Treasury index yield using a regression based on the historical relationship between those two variables. Finally, we apply the expected change in index yield to the current characteristics (yield, duration and convexity) of the Treasury index to estimate total returns on a 12-month horizon. The below tables present those results, along with 95% confidence intervals. Excess returns are calculated by subtracting assumed cash returns in each scenario from our total return projections.
Too Soon To Call The Bottom In Yields
Too Soon To Call The Bottom In Yields
Too Soon To Call The Bottom In Yields
Too Soon To Call The Bottom In Yields
Appendix B: Butterfly Strategy Valuations The following tables present the current read-outs from our butterfly spread models. We use these models to identify opportunities to take duration-neutral positions across the Treasury curve. The following two Special Reports explain the models in more detail: US Bond Strategy Special Report, “Bullets, Barbells And Butterflies”, dated July 25, 2017, available at usbs.bcaresearch.com US Bond Strategy Special Report, “More Bullets, Barbells And Butterflies”, dated May 15, 2018, available at usbs.bcaresearch.com Table 4 shows the raw residuals from each model. A positive value indicates that the bullet is cheap relative to the duration-matched barbell. A negative value indicates that the barbell is cheap relative to the bullet. Table 4Butterfly Strategy Valuation: Raw Residuals In Basis Points (As Of February 28, 2020)
Too Soon To Call The Bottom In Yields
Too Soon To Call The Bottom In Yields
Table 5 scales the raw residuals in Table 4 by their historical means and standard deviations. This facilitates comparison between the different butterfly spreads. Table 5Butterfly Strategy Valuation: Standardized Residuals (As Of February 28, 2020)
Too Soon To Call The Bottom In Yields
Too Soon To Call The Bottom In Yields
Table 6 flips the models on their heads. It shows the change in the slope between the two barbell maturities that must be realized during the next six months to make returns between the bullet and barbell equal. For example, a reading of 50 bps in the 5 over 2/10 cell means that we would only expect the 5-year to outperform the 2/10 if the 2/10 slope steepens by more than 50 bps during the next six months. Otherwise, we would expect the 2/10 barbell to outperform the 5-year bullet. Table 6Discounted Slope Change During Next 6 Months (BPs)
Too Soon To Call The Bottom In Yields
Too Soon To Call The Bottom In Yields
Appendix C: Excess Return Bond Map The Excess Return Bond Map is used to assess the relative risk/reward trade-off between different sectors of the US bond market. It is a purely computational exercise and does not impose any macroeconomic view. The Map’s vertical axis shows 12-month expected excess returns. These are proxied by each sector’s option-adjusted spread. Sectors plotting further toward the top of the Map have higher expected returns and vice-versa. Our novel risk measure called the “Risk Of Losing 100 bps” is shown on the Map’s horizontal axis. To calculate it, we first compute the spread widening required on a 12-month horizon for each sector to lose 100 bps or more relative to a duration-matched position in Treasury securities. Then, we divide that amount of spread widening by each sector’s historical spread volatility. The end result is the number of standard deviations of 12-month spread widening required for each sector to lose 100 bps or more versus a position in Treasuries. Lower risk sectors plot further to the right of the Map, and higher risk sectors plot further to the left. Chart 12Excess Return Bond Map (As Of February 28, 2020)
Too Soon To Call The Bottom In Yields
Too Soon To Call The Bottom In Yields
Ryan Swift US Bond Strategist rswift@bcaresearch.com Footnotes 1 For more information on how we calculate our spread targets please see US Bond Strategy Weekly Report, “The Value In Corporate Bonds”, dated February 19, 2019, available at usbs.bcaresearch.com 2 Please see US Bond Strategy Weekly Report, “The Credit Cycle Is Far From Over”, dated February 18, 2020, available at usbs.bcaresearch.com 3 Expected prepayment losses (or option cost) are calculated as the difference between the index’s zero-volatility spread and its option-adjusted spread. 4 Please see Global Asset Allocation Special Report, “Understanding Emerging Markets Debt”, dated February 27, 2020, available at gaa.bcaresearch.com 5 Please see US Bond Strategy Special Report, “2020 Key Views: US Fixed Income”, dated December 10, 2019, available at usbs.bcaresearch.com 6 Please see US Bond Strategy Weekly Report, “How Are Inflation Expectations Adapting?”, dated February 11, 2020, available at usbs.bcaresearch.com 7 Please see US Investment Strategy / US Bond Strategy Special Report, “Commercial Real Estate And US Financial Stability”, dated January 27, 2020, available at usbs.bcaresearch.com Fixed Income Sector Performance Recommended Portfolio Specification Corporate Sector Relative Valuation And Recommended Allocation
Highlights Policy Responses To The Virus: Markets are now pricing in significant monetary policy easing in response to the growth shock from the COVID-19 outbreak and related financial market instability. It is not yet clear, however, that central banks will NOT ease by as much as currently discounted in the low level of bond yields – especially as risk assets will riot anew if policymakers are not dovish enough. Duration: Raise overall global duration exposure to neutral on a tactical basis (0-3 months) until there is greater clarity on the full magnitude of the hit to global growth from the virus. Spread Product: The widening of global corporate bond spreads during last week’s equity market correction was relatively modest, suggesting that the COVID-19 outbreak has not become a credit event that raises downgrade/default risks. Maintain an overall overweight allocation to global corporates versus government bonds. Downgrade US MBS to neutral, however, given the risk of higher prepayments from falling mortgage rates. Feature What a wild ride it has been for investors. Equity markets worldwide corrected sharply last week as investors were forced to downgrade global growth expectations with the COVID-19 outbreak spreading more rapidly outside of China. US equities were particularly savaged with the S&P 500 shedding -11% of its value in a mere five trading sessions, with the VIX index of implied equity volatility spiking over 40, evoking comparisons to some of the darkest days of the 2008 financial crisis. Chart of the WeekCOVID-19 Concerns Causing Market Jitters
COVID-19 Concerns Causing Market Jitters
COVID-19 Concerns Causing Market Jitters
Government bond yields have collapsed alongside plunging equity values, with the benchmark 10-year US Treasury yield hitting an all-time intraday low of 1.04% yesterday. Investors are betting on aggressive rate cuts by global central bankers to offset weak growth momentum and disinflationary pressures that were already in place before the arrival of COVID-19. At the same time, corporate credit spreads widened worldwide last week, but the moves were relatively subdued and do not signal growing concern over future default losses (Chart of the Week). In this report, we discuss how to best position a global bond portfolio given these competing messages from government bond and credit markets. We conclude that maintaining selective strategic (6-12 months) overweights in global spread product versus governments, while also maintaining a neutral tactical (0-3 months) overall duration exposure - as a hedge against a more “U-shaped” recovery from the virus-driven downturn in global growth - is the best way to position for a backdrop where policymakers will need to be as easy as possible in a more uncertain world. What To Do Next On … Duration Risk assets were staging a massive rebound yesterday as we went to press, after policymakers worldwide signaled the need for stimulus measures to offset the COVID-19 growth shock. Both Fed Chairman Jerome Powell and Bank of Japan (BoJ) Governor Haruhiko Kuroda promised to ease monetary policy, if necessary, to stabilize markets. Meanwhile, looser fiscal policy may finally be on the way in Europe. The government of virus-stricken Italy announced a €3.6 billion stimulus package, while the German Finance Minister has hinted at a temporary suspension of Germany’s constitutional “debt brake” on deficit spending. A true coordinated global easing of both monetary and fiscal policy, would be very bullish for beaten-down growth-sensitive assets like equities and industrial commodities that have been focused on the shutdown of China’s economy in February to combat the spread of the virus. A true coordinated global easing of both monetary and fiscal policy, would be very bullish for beaten-down growth-sensitive assets like equities and industrial commodities that have been focused on the shutdown of China’s economy in February to combat the spread of the virus (Chart 2). It’s a different story for government bonds, however, as a rebound in yields from current depressed levels is not assured, even if monetary policy is eased further. This is because central bankers must maintain a dovish bias until the virus-driven uncertainty over global growth begins to fade, or else risk assets will riot once again. It’s all about financial conditions now, especially in the US where COVID-19 and the stock market selloff have become front-page news in a presidential election year. Chart 2How Quickly Will China Rebound?
How Quickly Will China Rebound?
How Quickly Will China Rebound?
For example, the entire US Treasury curve now trades below the mid-point of the fed funds target range, with the market now pricing in a very rapid dovish move by the Fed (Chart 3). Chart 3A Big Grab For Global Duration
A Big Grab For Global Duration
A Big Grab For Global Duration
Yield curves are now very flat in other major developed market (DM) economies, as well. This is partly due to the risk aversion bid for safe assets, which is evident in the deeply negative term premium component of bond yields. Flat curves also reflect a more long-lasting component, with markets pricing in lower equilibrium rates in the future. Investors are not only demanding immediate rate cuts to boost growth and stabilize financial markets, but also see little chance of those cuts eventually being reversed in the future. Chart 4Markets Increasingly Pricing In Global ZIRP
Markets Increasingly Pricing In Global ZIRP
Markets Increasingly Pricing In Global ZIRP
Our simple proxy for the market expectation of the nominal terminal rate- the 5-year overnight index swap (OIS) rate, 5-years forward – is between 0-1% for all major DM countries (Chart 4). The implication is that investors are not only demanding immediate rate cuts to boost growth and stabilize financial markets, but also see little chance of those cuts eventually being reversed in the future. Chart 5Our Central Bank Monitors Say More Easing Is Needed
Our Central Bank Monitors Say More Easing Is Needed
Our Central Bank Monitors Say More Easing Is Needed
Chart 6Global Yields Reflect Dovish Rate Expectations
Global Yields Reflect Dovish Rate Expectations
Global Yields Reflect Dovish Rate Expectations
At the moment, our global Central Bank Monitors – a compilation of economic and financial variables that influence monetary policy decisions – are all signaling a need for rate cuts (Chart 5). This is a function of sluggish growth & weak inflation. The plunge in global government bond yields already reflects that dovish shift in market expectations for central banks. Our 12-month discounters, which measure the expected change in short-term interest rates over the next year as extracted from OIS curves, are all priced for lower policy rates in the US (-97bps as of last Friday’s close), the euro area (-15bps) the UK (-35bps), Japan (-17bps), Canada (-72bps) and Australia (-46bps) (Chart 6). In the US, the current level of the benchmark 10-year Treasury yield is consistent with the extended slump in US industrial activity – as measured by the fall in the ISM manufacturing index – and risk-off sentiment measures like the CRB Raw Industrials/Gold price ratio (Chart 7). Yet at the same time, financial conditions remain very accommodative despite last week’s selloff, suggesting that the US economy can potentially weather a bout of COVID-19 uncertainty – as long as the Fed does not disappoint by delivering fewer rate cuts than the market is demanding and creating another down leg in the equity market. Chart 7UST Yields Need To Stay Lower For Longer
UST Yields Need To Stay Lower For Longer
UST Yields Need To Stay Lower For Longer
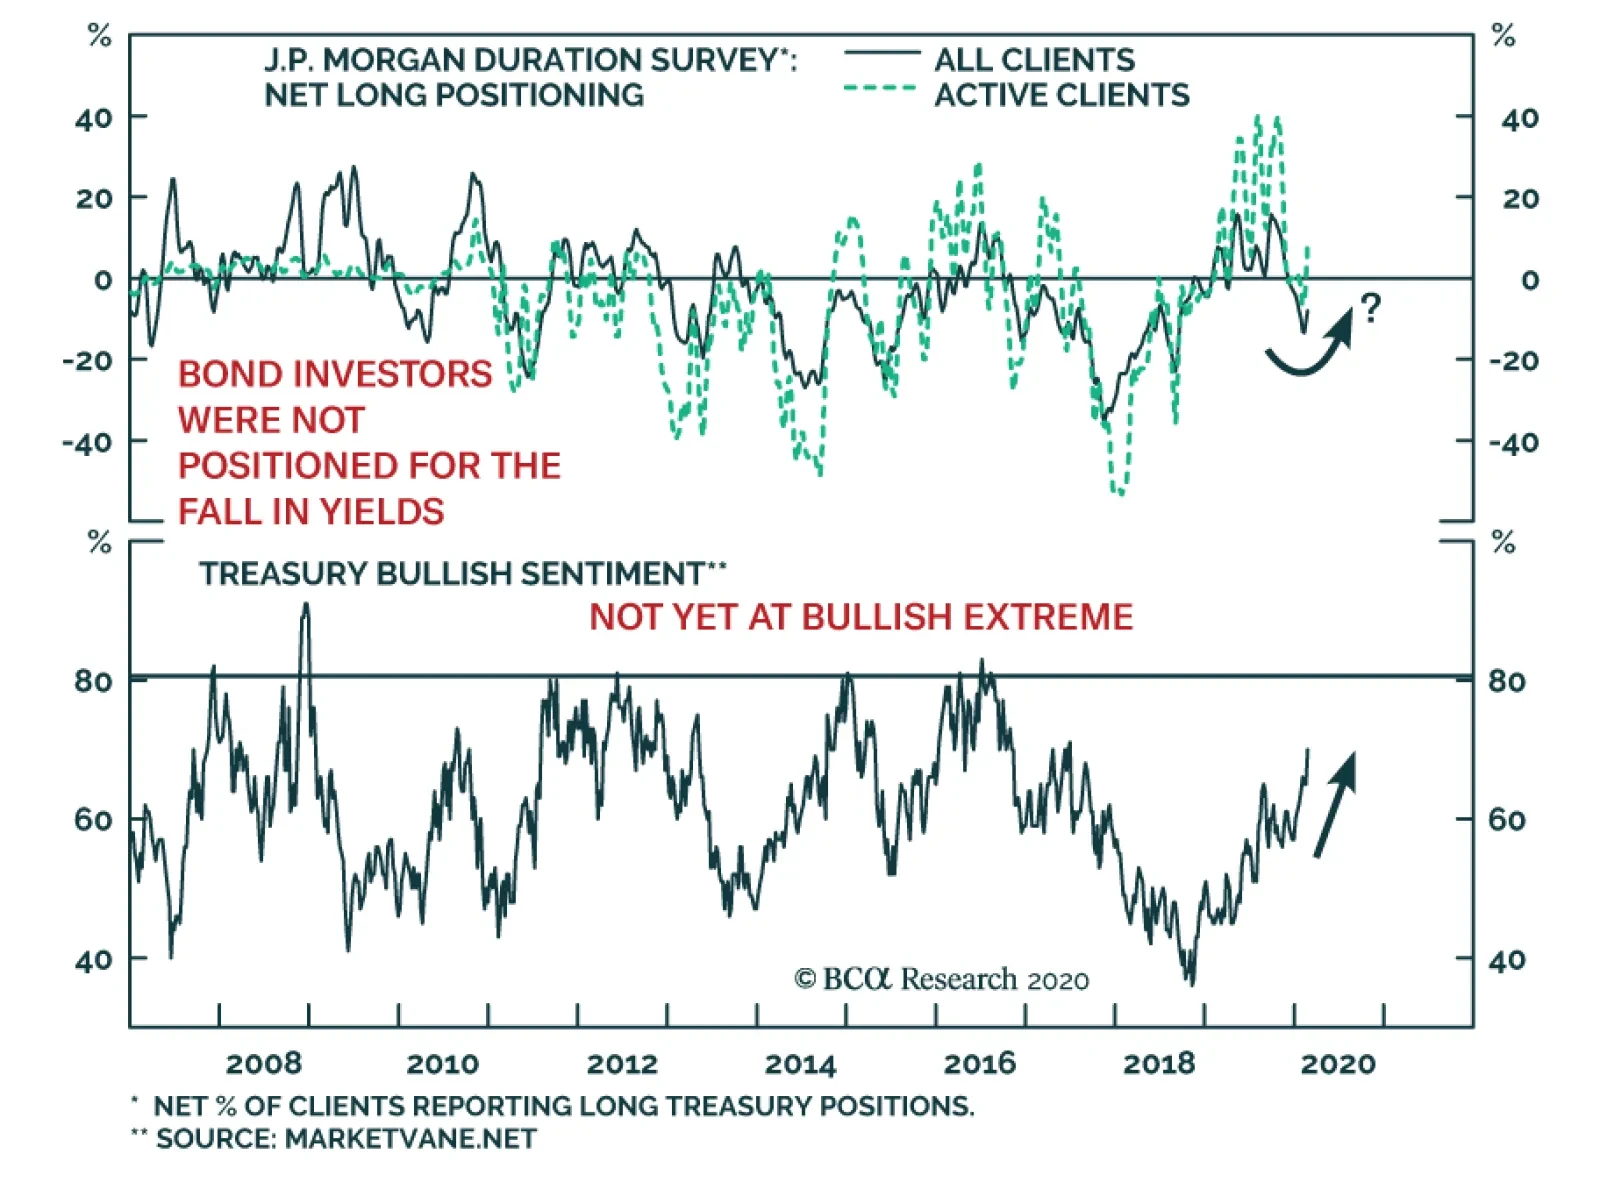
Outside the US, other central banks that have non-zero policy rates – like the Bank of Canada, Reserve Bank of Australia and Bank of England – can deliver on the rate cuts discounted in their OIS curves to fight a COVID-19 global growth downturn, if needed. Chart 8UST Bullishness Still Not At Historical Extremes
UST Bullishness Still Not At Historical Extremes
UST Bullishness Still Not At Historical Extremes
The negative rate club of the ECB and BoJ, however, is far less likely to actually cut rates and will rely on greater asset purchases and forward guidance to try and provide more policy stimulus. We prefer to view duration exposure – on a tactical basis – as a hedge to owning risk assets like corporate bonds, where we see some value now opening up after last week’s selloff, rather than a way to express a directional view on interest rates where we have less visibility and conviction. So what should a bond investor do with duration exposure? It is a difficult call with so many uncertainties on global growth momentum, the spread of the virus outside China, the size of any monetary or fiscal policy stimulus measures, and the degree of risk aversion still evident in financial markets. We prefer to view duration exposure – on a tactical basis – as a hedge to owning risk assets like corporate bonds, where we see some value now opening up after last week’s selloff, rather than a way to express a directional view on interest rates where we have less visibility and conviction. Therefore, we are raising our recommended overall duration exposure to neutral this week on a tactical basis. At the same time, we are maintaining an underweight stance on government bonds versus an overweight on corporate debt. We think a true bottom in yields will be reached when there are more decisive signs that bond positioning has reached a bullish extreme, according to indicators like the JP Morgan duration survey and the Market Vane US Treasury bullish sentiment index (Chart 8). In our model bond portfolio, we are expressing that extension of duration by shifting exposure from shorter maturity buckets to longer duration buckets in most countries. While also increasing exposure to “higher-beta” government bond markets like the US and Canada, at the expense of lower-beta Japanese government bonds. Bottom Line: Raise overall global duration exposure to neutral on a tactical basis (0-3 months) until there is greater clarity on the full magnitude of the hit to global growth from the COVID-19 outbreak. Increase allocations to countries with higher yield betas, like the US and Canada, at the expense of low-beta markets like Japan. What To Do Next On … Spread Product Allocations Chart 9US HY Selloff Was Focused On Energy Names
US HY Selloff Was Focused On Energy Names
US HY Selloff Was Focused On Energy Names
Last week’s equity market meltdown did spill over into corporate bond markets, with credit spreads widening for both investment grade and high-yield corporate debt in the US and Europe. In the US, however, the jump in high-yield spreads was particularly acute among Energy names, with the index option-adjusted spread (OAS) climbing over 1000bps as oil prices plunged (Chart 9). US high-yield ex-energy has been relatively more stable, with the spread climbing to 436bps, despite the surge in equity volatility. Stepping back and looking at US investment grade and high-yield corporates, more broadly, last week’s selloff has restored some value, most notably in high-yield. Stepping back and looking at US investment grade and high-yield corporates, more broadly, last week’s selloff has restored some value, most notably in high-yield. According to our framework for calculating spread targets for global credit, last week’s selloff pushed US investment grade spreads back to our spread targets from very expensive levels (Chart 10).1 Baa-rated US investment-grade moved slightly above our spread target, but we would describe investment grade spreads as now overall fairly valued. US high-yield spreads, on the other hand, have widened well in excess of our spread targets across all credit rating tiers (Chart 11). Chart 10US Investment Grade Spreads Now Fairly Valued
US Investment Grade Spreads Now Fairly Valued
US Investment Grade Spreads Now Fairly Valued
Chart 11US High-Yield Spreads Look Very Cheap
US High-Yield Spreads Look Very Cheap
US High-Yield Spreads Look Very Cheap
In our framework, the spread targets are determined by looking at 12-month breakeven spreads – the amount of spread widening necessary to eliminate the yield cushion of owning corporates over government bonds on a one-year horizon – relative to their long-run history. We group those spreads according to phases of the monetary policy cycle, as defined by the slope of the US Treasury yield curve. The spread target is then calculated based on the median breakeven spread for that phase of the cycle. Currently, we are in “Phase 2” of the policy cycle, which means that the Treasury yield curve (10-year minus 3-year) is positively sloped between 0 and 50bps. In Charts 10 & 11, we add a new wrinkle to our existing way to present the spread targets. We also calculate the targets using the 25th and 75th percentile observations for the breakeven spreads for that phase of the monetary policy cycle. This gives us a range for the spread target that encompasses more of the historical data. Given the improved valuations in US junk bonds, however, we think increasing allocations in our model bond portfolio makes sense. The spread widening in US high-yield has very clearly restored value to spreads, which are well above the upper level of our spread target range. The same cannot be said for US investment grade, where spreads are in the middle of the target range. Chart 12European Corporates Now Offer Better Value
European Corporates Now Offer Better Value
European Corporates Now Offer Better Value
Based on this analysis, we remain comfortable in maintaining our neutral recommended stance on US investment grade corporates and overweight stance on US high-yield. Given the improved valuations in US junk bonds, however, we think increasing allocations in our model bond portfolio makes sense. Thus, this week, we are adding to our recommended high-yield exposure (see Page 12). That increased allocation is “funded” by reducing our US Agency MBS exposure from overweight to neutral. Our colleagues at BCA Research US Bond Strategy are concerned that MBS spreads are likely to widen in the next few months to reflect the higher prepayment risk from the recent steep fall in US mortgage rates. One final note: our spread target framework for euro area corporates also indicates that last week’s global risk-off event also restored some value to European credit (Chart 12). Thus, we are maintaining our recommended overweights for both euro area investment grade and high-yield. Bottom Line: The widening of global corporate bond spreads during last week’s equity market correction was relatively modest, suggesting that the COVID-19 outbreak has not become a credit event that raises downgrade/default risks. Maintain an overall overweight allocation to global corporates versus government bonds. Downgrade US MBS to neutral, however, given the risk of higher prepayments from falling mortgage rates. Robert Robis, CFA Chief Fixed Income Strategist rrobis@bcaresearch.com Footnotes 1 We presented our framework for calculating global corporate spread targets, which builds on the work from our US Bond Strategy sister service, back in January. Please see BCA Research Global Fixed Income Strategy Special Report, "How To Find Value In Global Corporate Bonds", dated January 21, 2020, available at gfis.bcaresearch.com. Recommendations The GFIS Recommended Portfolio Vs. The Custom Benchmark Index
What Bond Investors Should Do After The "Great Correction"
What Bond Investors Should Do After The "Great Correction"
Duration Regional Allocation Spread Product Tactical Trades Yields & Returns Global Bond Yields Historical Returns
Feature “Bayesian: …statistical methods that assign probabilities or distributions to events…based on experience or best guesses before experimentation and data collection and that apply Bayes' theorem to revise the probabilities and distributions after obtaining experimental data.” — Merriam-Webster Dictionary Markets have reacted pretty rationally to the outbreak of the COVID-19 virus. Equities initially rebounded a few days ahead of the peak of new cases in China (Chart 1). But then, once the number of cases in the rest of the world started to accelerate, stock markets sold off again sharply. The MSCI All Country World Index is now down 13% from its peak on February 12. Recommended Allocation
Monthly Portfolio Update: A Classic Bayesian Dynamic
Monthly Portfolio Update: A Classic Bayesian Dynamic
Chart 1Markets Have Reacted In Line With New COVID-19 Cases
Monthly Portfolio Update: A Classic Bayesian Dynamic
Monthly Portfolio Update: A Classic Bayesian Dynamic
No one knows whether this episode will turn into an unprecedented pandemic, which will kill millions worldwide, last for months, and trigger a global recession. So it is the sort of environment in which Bayesian analysis becomes useful. Our “prior” for the probability of a full pandemic would be around 10-20%. If it doesn’t happen, an attractive buying opportunity for risk assets should present itself soon. But there could be further downside first, especially if the number of cases in major countries such as the US, Germany, and the UK were to accelerate significantly. There are some sign that Chinese activity is beginning to recover. There are some signs that Chinese activity is beginning to recover, as new cases of COVID-19 slow, thanks to the draconian measures taken by the authorities. Big Data can help analyze this. For example, live traffic statistics from TomTom show that by February 28, weekday road congestion in Shanghai was back to 50% of its normal level, compared to 19% on February 14 (Chart 2). The Chinese authorities have relaunched fiscal and monetary stimulus, causing short-term rates to fall to their lowest level since 2010 (Chart 3). Monetary policy has been upgraded from “prudent” to “flexible and moderate.” BCA Research’s China strategists believe there is even an increasing possibility of a stimulus overshoot in the next 6-12 months, as the authorities plan for the worst-case scenario but the economy rebounds.1 Chart 2Chinese People Getting Back On The Roads
Monthly Portfolio Update: A Classic Bayesian Dynamic
Monthly Portfolio Update: A Classic Bayesian Dynamic
Chart 3Chinese Stimulus Pushing Down Rates
Monthly Portfolio Update: A Classic Bayesian Dynamic
Monthly Portfolio Update: A Classic Bayesian Dynamic
In the short-term, it is clear that global growth will weaken, though quantifying this is hard. A 1% quarter-on-quarter decline in Chinese GDP in Q1 would bring growth down to 3.5% year-over-year. Our colleagues in BCA’s Global Investment Strategy estimate this would cause global growth to fall 0.8% below trend in Q1, mainly from a contraction in tourism, but that this would be largely made up in Q2, assuming that the epidemic is over by then (Chart 4).2 Could even a limited epidemic tip the world into recession? We doubt it. Consumer confidence remains strong in developed economies (Chart 5) and the virus is not yet serious enough to stop most consumers going out to spend. The global economy was in the process of bottoming out before COVID-19 hit (Chart 6) and there is little reason to think that we will not return to the status quo ante. Chart 4Global Growth To Slow In Q1, But Rebound In Q2
Monthly Portfolio Update: A Classic Bayesian Dynamic
Monthly Portfolio Update: A Classic Bayesian Dynamic
Chart 5Consumers Remain Confident
Monthly Portfolio Update: A Classic Bayesian Dynamic
Monthly Portfolio Update: A Classic Bayesian Dynamic
Chart 6Before COVID-19, Growth Was Bottoming Out
Monthly Portfolio Update: A Classic Bayesian Dynamic
Monthly Portfolio Update: A Classic Bayesian Dynamic
We see the two biggest risks being: 1) a rise in defaults in China, especially among smaller companies, that the government is unable or unwilling to prevent (Chart 7); and 2) a deterioration in the jobs market in the US, as companies start to postpone hiring, or lay off staff (Chart 8). We will watch these carefully over coming weeks. Chart 7Are Chinese Companies Vulnerable?
Monthly Portfolio Update: A Classic Bayesian Dynamic
Monthly Portfolio Update: A Classic Bayesian Dynamic
Chart 8Is The US Job Market Starting To Wobble?
Monthly Portfolio Update: A Classic Bayesian Dynamic
Monthly Portfolio Update: A Classic Bayesian Dynamic
Chart 9Markets Believe Trump Would Beat Sanders
Monthly Portfolio Update: A Classic Bayesian Dynamic
Monthly Portfolio Update: A Classic Bayesian Dynamic
There is one other risk that might give equity markets an excuse for a further sell-off: November’s US presidential election. The probability that Bernie Sanders wins the Democratic nomination has risen to 60% from 15% over the past two months. The consensus believes that Trump can easily defeat Sanders, which is why the President’s probability of being reelected has risen in tandem (Chart 9). But, if the economy starts to weaken and Trump’s approval rating slips, investors could become nervous about the likelihood of a market-unfriendly Sanders administration. We would not recommend long-term investors sell out of risk assets at this point. There could be an attractive buying opportunity over the next few weeks, and investors who have derisked should be looking for a reentry point. With US 10-year bonds yields at 1.2% and German yields at -60 basis points, it is hard to see much further upside for risk-free bonds. Equities should be able to outperform over the next 12 months, as growth rebounds following the COVID-19 episode. We have been recommending overweights in cash and gold, as hedges, since December, and these still make sense. However, if events over the coming weeks point to the risk of global pandemic being higher than we currently think, then investors should Bayesianally adjust and move more risk-off. Otherwise, a peak in COVID-19 cases ex-China should be a strong signal to buy risk assets again. Chart 10Why Should Long-Run Inflation Expectations Fall?
Monthly Portfolio Update: A Classic Bayesian Dynamic
Monthly Portfolio Update: A Classic Bayesian Dynamic
Fixed Income: US Treasurys have become investors’ safe haven of choice over the past few weeks. A marked drop in long-run inflation expectations (Chart 10), in particular, has pushed the 10-year yield to a record low. This seems somewhat illogical, since the Fed will announce this summer the results of its review of monetary policy, which is likely to lead to a more dovish long-term inflation target (perhaps a commitment to achieve 2% on average over the cycle). The market has also priced in at least three Fed rate cuts by year-end (Chart 11). The Fed will certainly cut rates if US growth falters as a result of COVID-19, but this is by no means a certainty. History shows that Treasury yields jumped sharply once previous viral outbreaks ended (Chart 12). We expect yields to be significantly higher in 12 months, and so are underweight duration and prefer TIPS over nominal bonds. Credit will continue to underperform in the risk-off phase, but some interesting opportunities should arise soon, especially among the lowest-rated credits and in the Energy sector. Chart 11Will The Fed Really Be This Accommodating?
Monthly Portfolio Update: A Classic Bayesian Dynamic
Monthly Portfolio Update: A Classic Bayesian Dynamic
Chart 12After Previous Virus Outbreaks, Rates Leapt
Monthly Portfolio Update: A Classic Bayesian Dynamic
Monthly Portfolio Update: A Classic Bayesian Dynamic
Equities: The sell-off has already put on fire sale some stocks most affected by the epidemic. For example, cruise lines are down by 40% over the past month or so, European oil stocks 25%, some luxury goods makers 30%, and airlines 30%. Opportunistic investors might want to buy a basket of the most oversold quality names. Our overweight on euro area stocks has not worked in the sell-off. But, as a cyclical, export-oriented market, we continue to expect Europe to outperform when global growth rebounds. Euro area banks, in particular, represent the best call option on a rise in bond yields, since their performance is highly correlated to the shape of the yield curve. We continue to have a somewhat cyclical tilt among our sector weightings (with overweights on, for example, Energy and Industrials), but may adjust this in our Quarterly Portfolio Outlook in early April if we decide to reduce risk. The sell-off has already put on fire sale some stocks most affected by the epidemic. Currencies: The dollar is a safe-haven currency and so, unsurprisingly, has benefitted from the rush to safety in recent weeks. However, it remains overvalued (Chart 13), and interest rate differentials would move further against it if the Fed does cut rates, since other major developed central banks have much less room to move (Chart 14). This suggests that it will probably resume the weakness it experienced from August to December last year as soon as global growth rebounds. Chart 13Dollar Is Overvalued...
Monthly Portfolio Update: A Classic Bayesian Dynamic
Monthly Portfolio Update: A Classic Bayesian Dynamic
Chart 14...And Interest Differentials Have Moved Against It
Monthly Portfolio Update: A Classic Bayesian Dynamic
Monthly Portfolio Update: A Classic Bayesian Dynamic
Chart 15Metals Prices Stabilized In Recent Weeks
Monthly Portfolio Update: A Classic Bayesian Dynamic
Monthly Portfolio Update: A Classic Bayesian Dynamic
Commodities: Industrial metals fell sharply on the outbreak of COVID-19 in China, but have bottomed in line with the stabilization of the situation in that country (Chart 15). Gold has worked predictably as the best hedge in the sell-off. While it is starting to look technically overbought and would be hurt by a rise in bond yields (Chart 16), for prudent investors it remains a useful hiding place amid heightened risk and ultra-low interest rates. Oil is the commodity that has fallen the most surprisingly, with Brent close to the low it reached during the sell-off in December 2018 (Chart 17). It is much less dependent on Chinese demand than metals are, and so is maybe pricing in a global recession – as well as questioning the commitment of OPEC to cut production further. This would suggest upside to the oil price if global growth turns out not to be so bad, oil demand continues to pick up, and supply remains constrained. Chart 16How Much Could Gold Overshoot?
Monthly Portfolio Update: A Classic Bayesian Dynamic
Monthly Portfolio Update: A Classic Bayesian Dynamic
Chart 17Oil Discounting A Global Recession
Monthly Portfolio Update: A Classic Bayesian Dynamic
Monthly Portfolio Update: A Classic Bayesian Dynamic
Garry Evans, Senior Vice President Chief Global Asset Allocation Strategist garry@bcaresearch.com Footnotes 1 Please see China Investment Strategy Weekly Report, “China: Back To Its Old Economic Playbook?” dated 26 February 2020, available at cis.bcaresearch.com 2 Please see Global Investment Strategy Weekly Report, “Market Too Complacent About The Coronavirus,” dated 21 February 2020, available at cis.bcaresearch.com GAA Asset Allocation
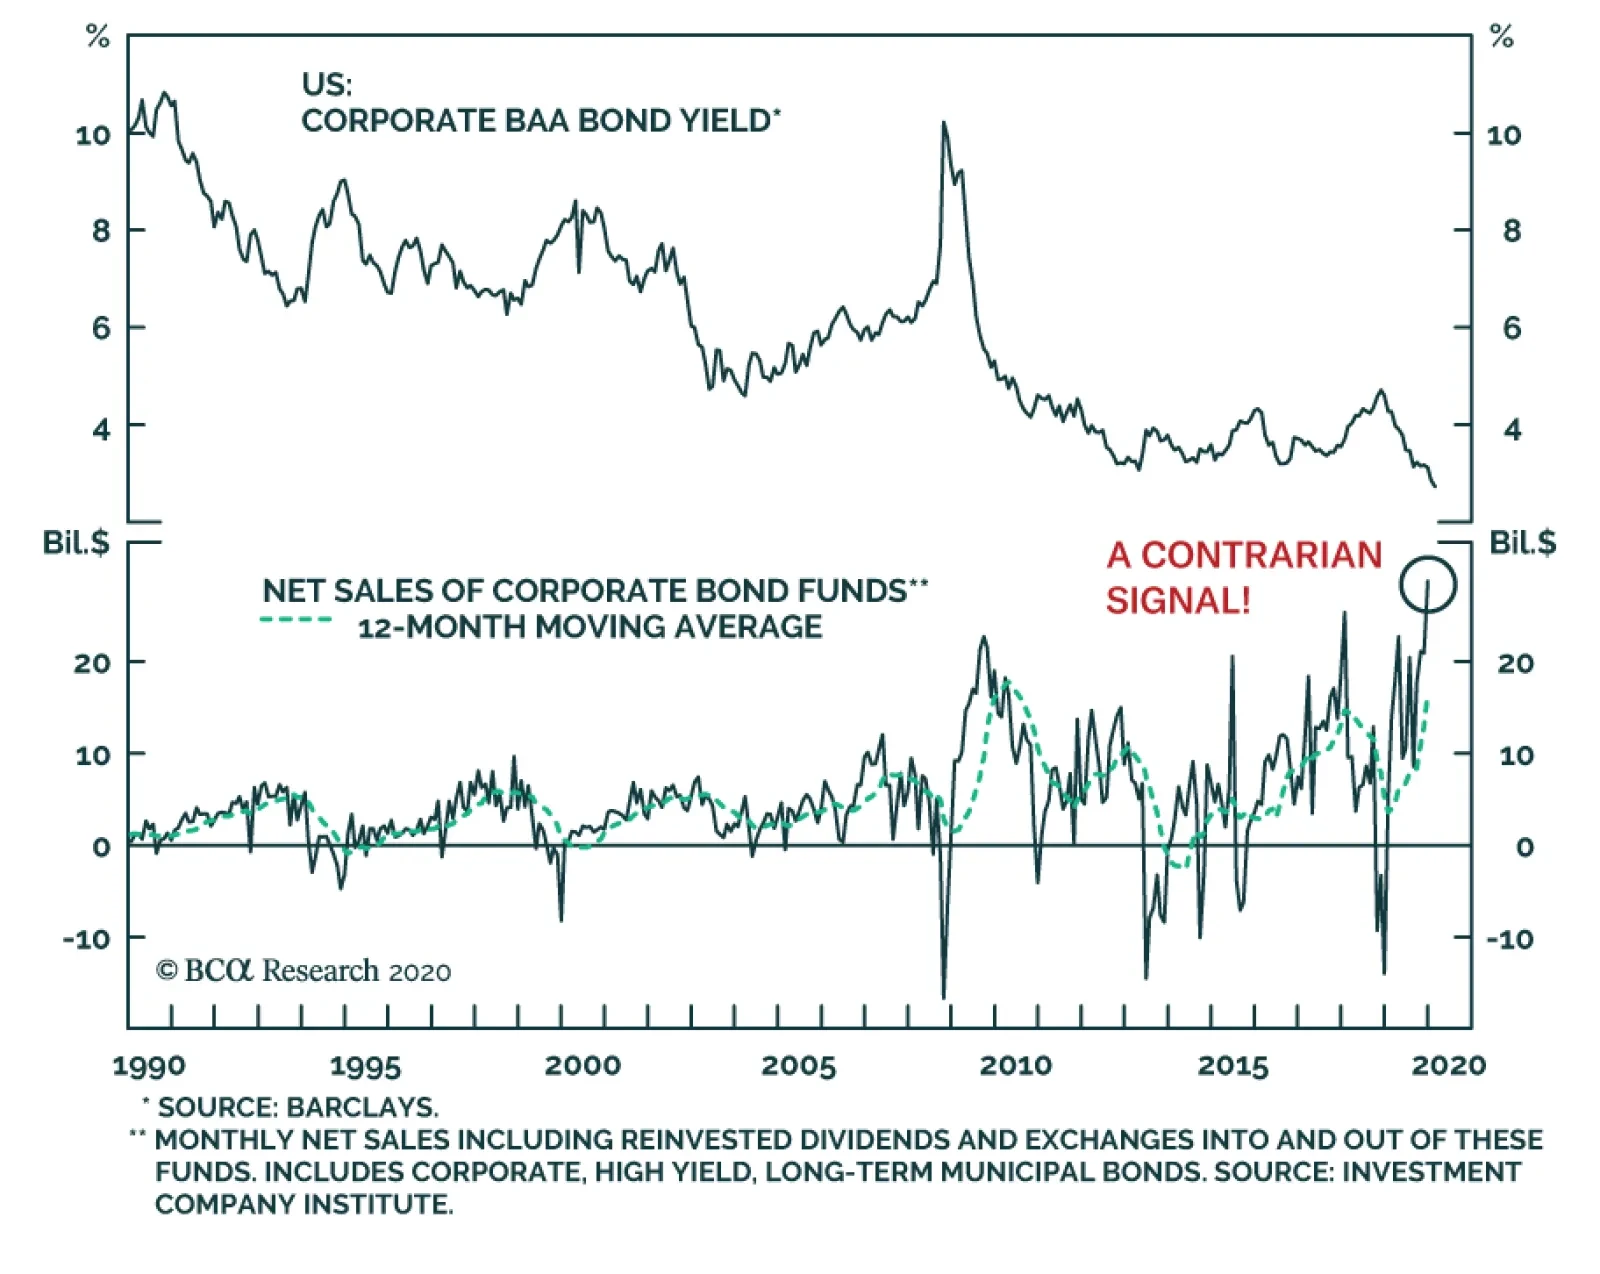
Corporate bond funds have been receiving record-high amounts of funds from the public in recent months. This is a contrarian indicator that usually coincides with a bottom in corporate baa bond yields. Essentially, the market is being supplied with a large…