Fixed Income
10-year Treasury yields are once again trading near 1.47%, their September lows. Compared to then, the near-term trade risks have abated, the Chinese economy has stabilized, and Asia is picking up. Moreover, US CEO confidence and the German ZEW survey have…
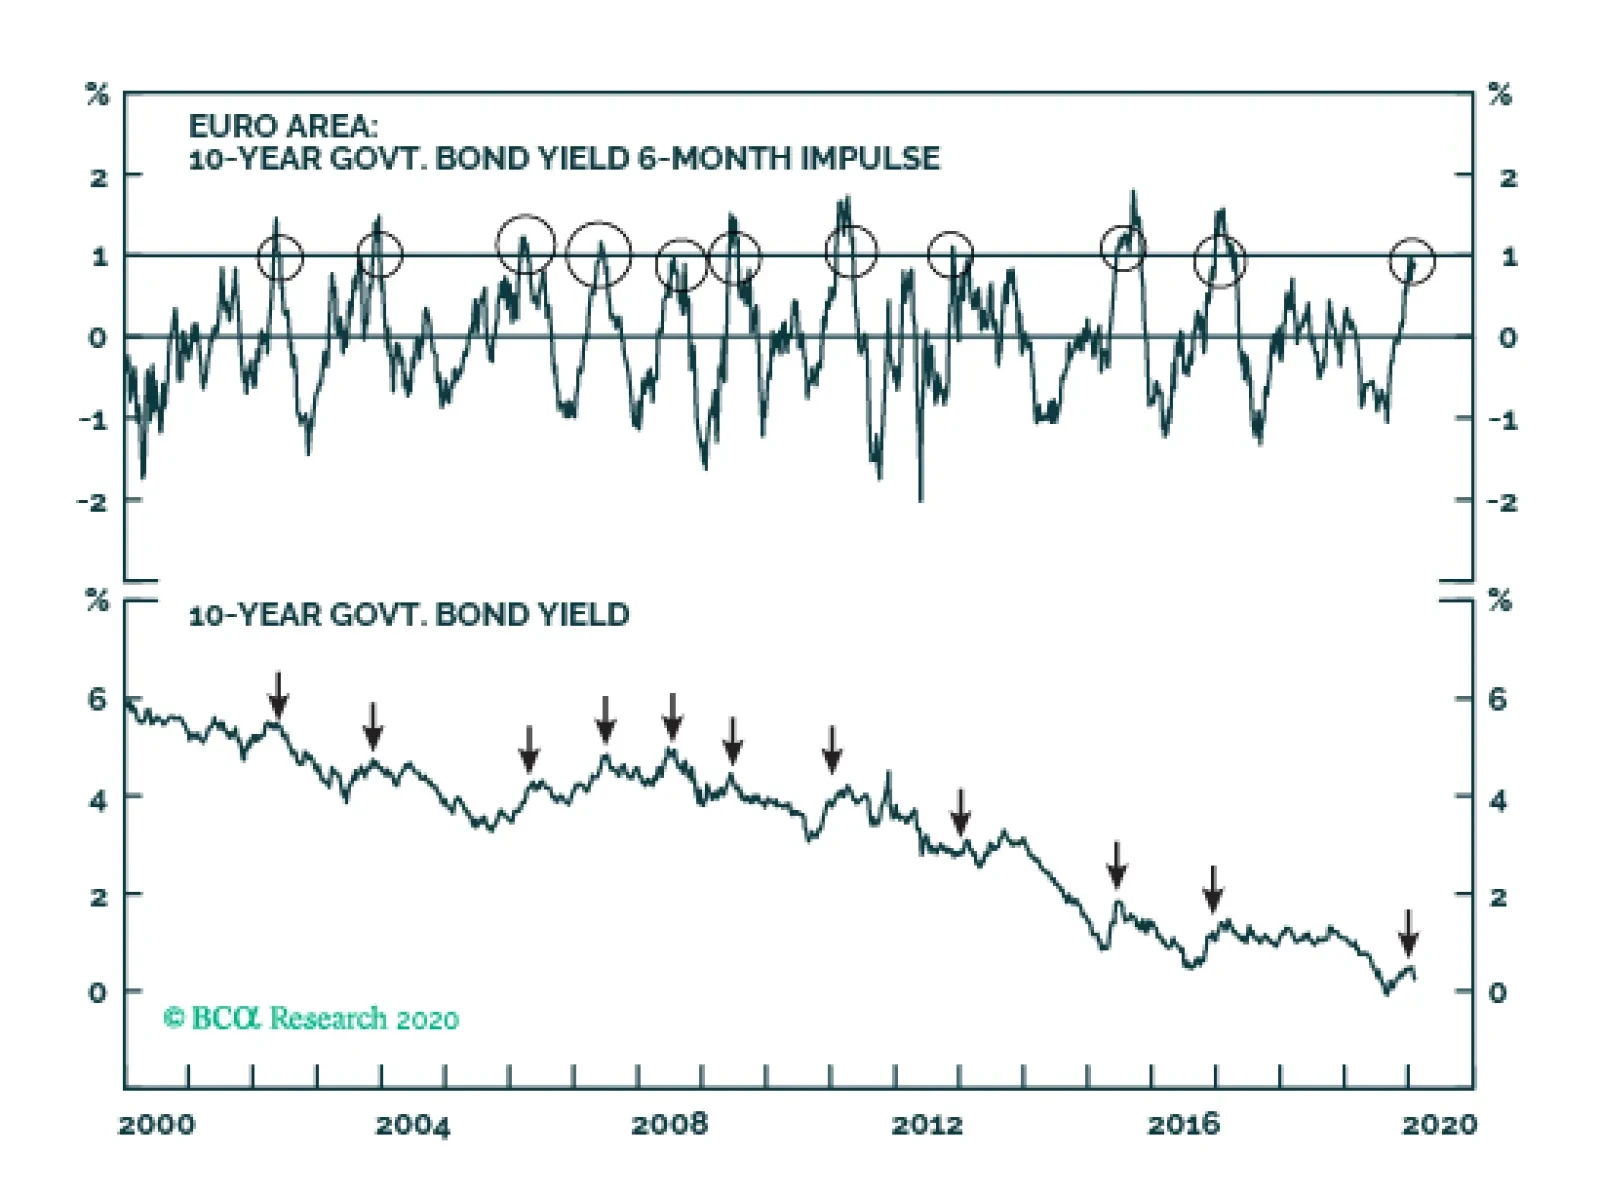
The coronavirus scare is the catalyst for the recent correction. The true cause is that the stock market had reached a point of groupthink-triggered instability and therefore needed the slightest catalyst to correct. The bond yield 6-month impulse had…
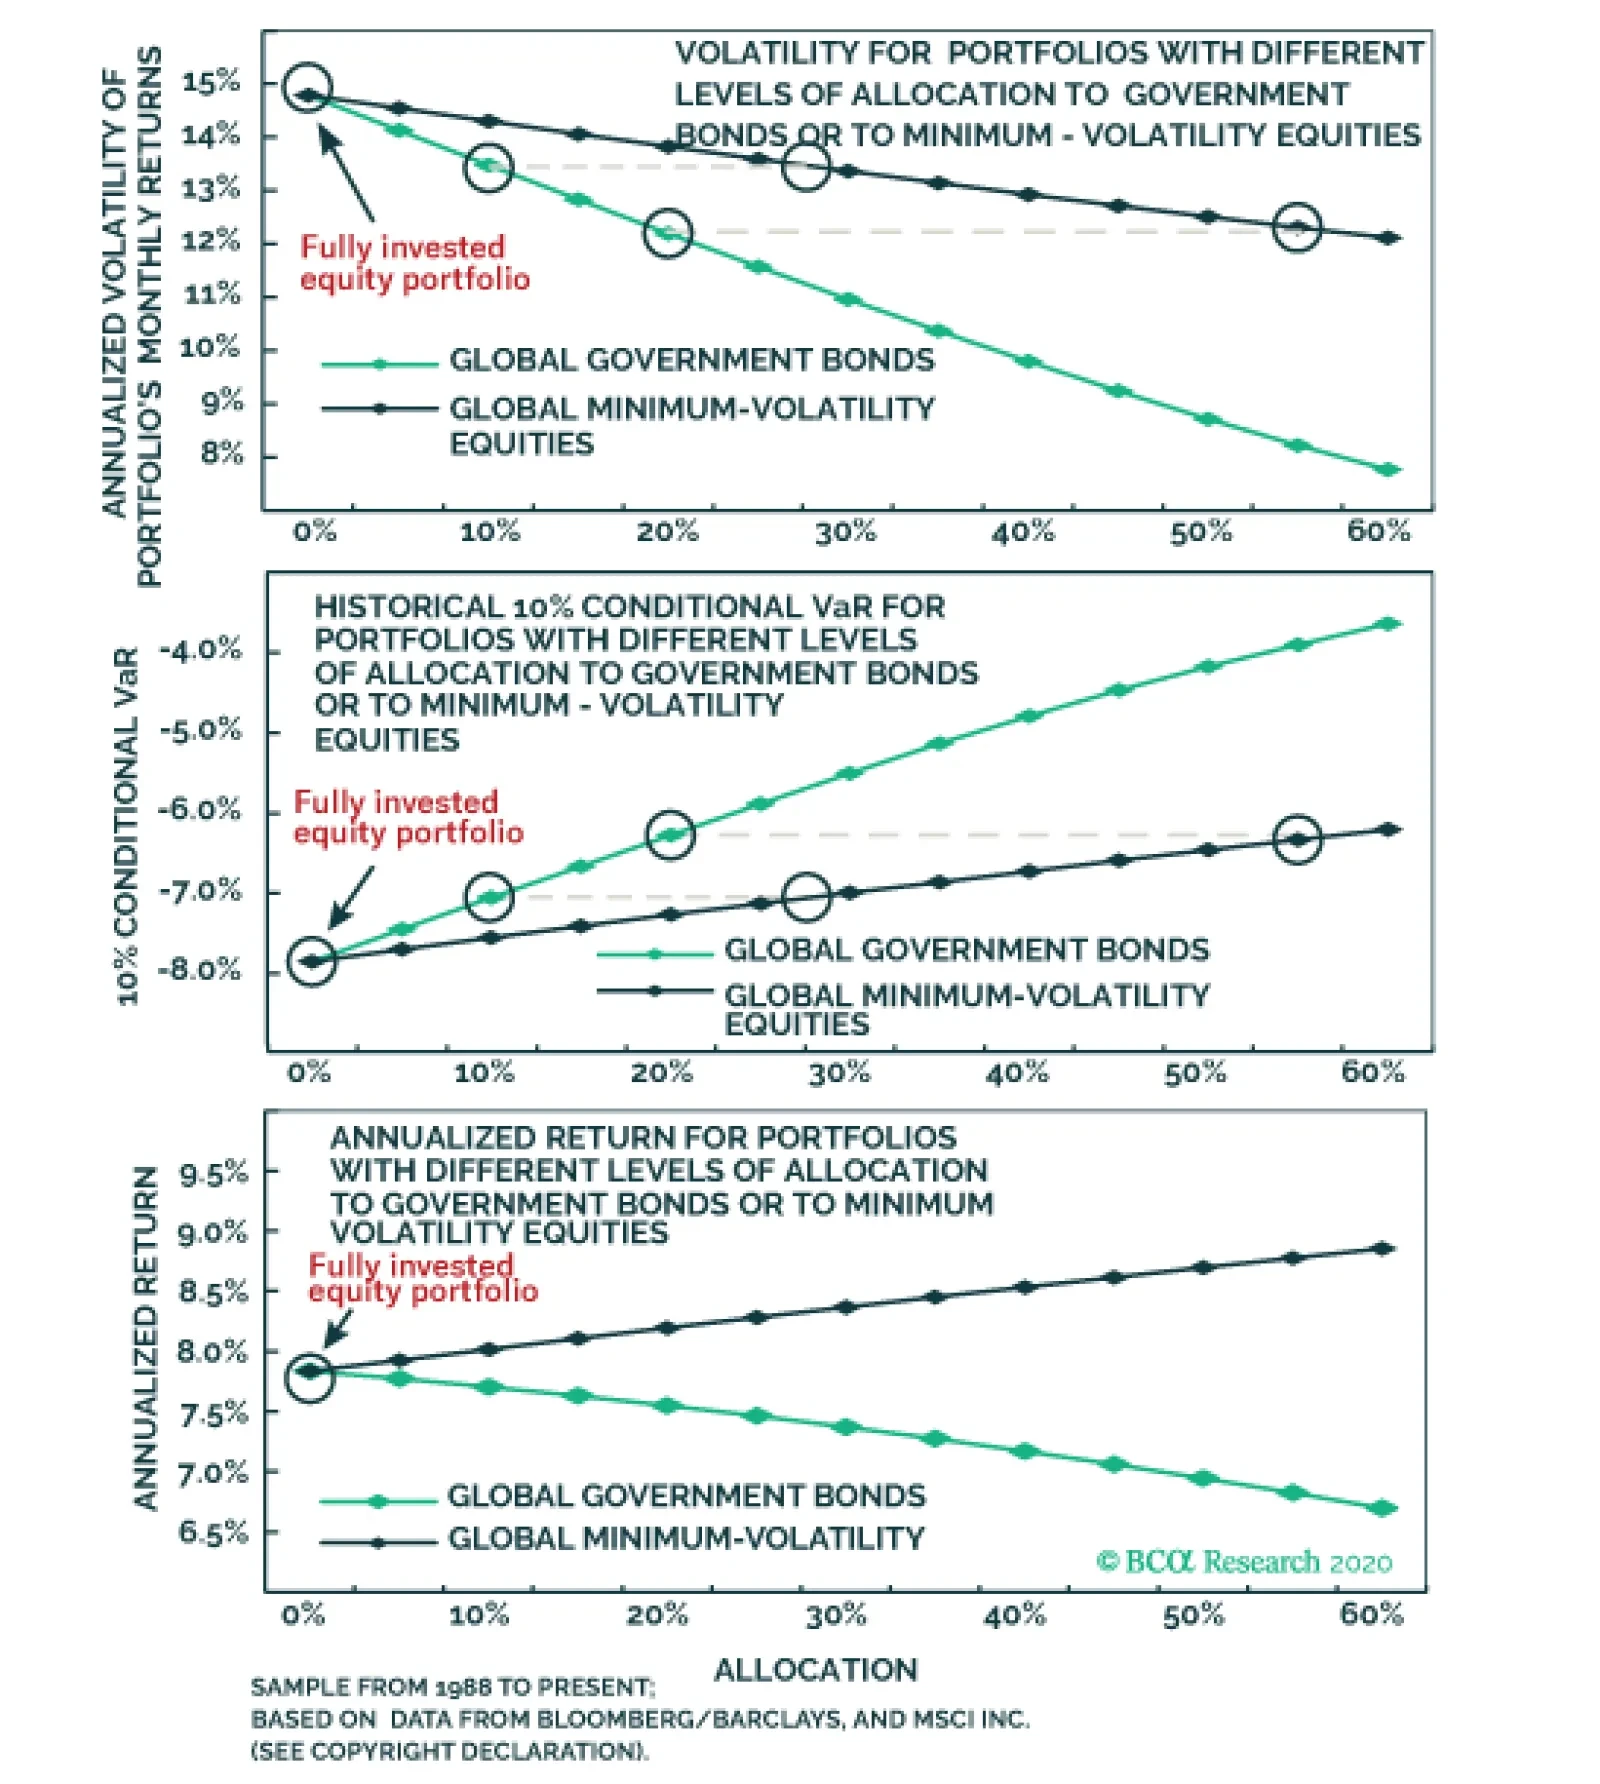
The interest rate sensitivity of low-volatility stocks has increased in recent years: Factor analysis shows that while the beta of the excess returns of minimum volatility to the equity market has remained constant, the beta to the bond market has increased…
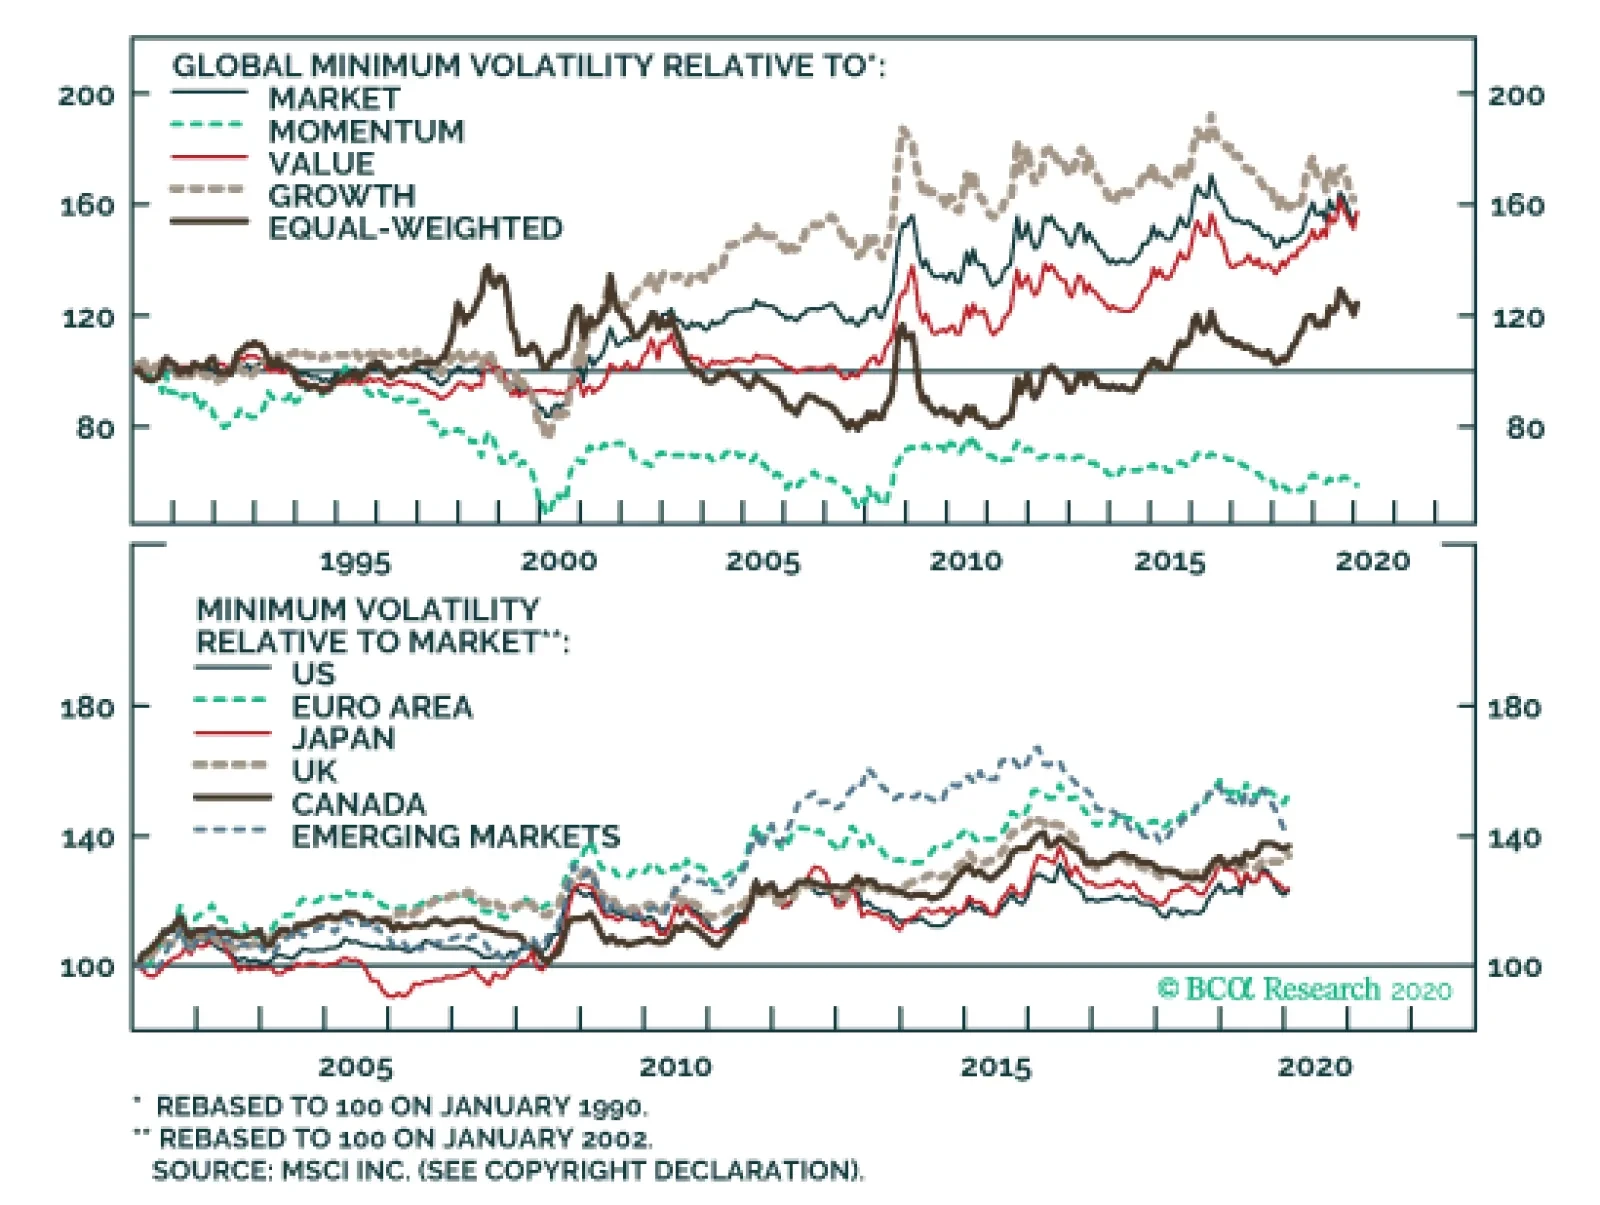
At the global level, minimum volatility has outperformed not only the market since 1990, but also the most popular equity factors, with the exception of momentum. The outperformance relative to the benchmark has proved to be robust, as minimum volatility has…
First, the PBoC is generally a reactive central bank and historically lags pickups in economic activity. Secondly, any additional easing by the PBoC is likely to be focused on reducing corporate lending rates, not interbank rates. While there is a strong…
The Golden Rule links government bonds excess returns to policy rate “surprises”. In China, the 3-month SHIBOR surprise does the best job at explaining Chinese government bond yields, even in periods like 2015 or 2017 when the change in the de jure policy…

Highlights The coronavirus scare is the catalyst for the recent correction, not the cause. The true cause is that the stock market had reached a point of groupthink-triggered instability and therefore needed the slightest catalyst to correct. Bond yields will stay depressed for (at least) the first half of 2020. Long-term investors should use corrections to overweight equities versus bonds, provided bond yields stay near or below current levels. The pound and UK-exposed investments will come under near-term pressure as UK/EU trade deal tensions ratchet up. But ultimately, UK-exposed investments will enjoy a major leg up later this year if both the UK and EU blink. Feature Chart of the WeekThe Next Up-Leg In The Pound And UK-Exposed Investments Will Occur Later In 2020
The Next Up-Leg In The Pound And UK-Exposed Investments Will Occur Later in 2020
The Next Up-Leg In The Pound And UK-Exposed Investments Will Occur Later in 2020
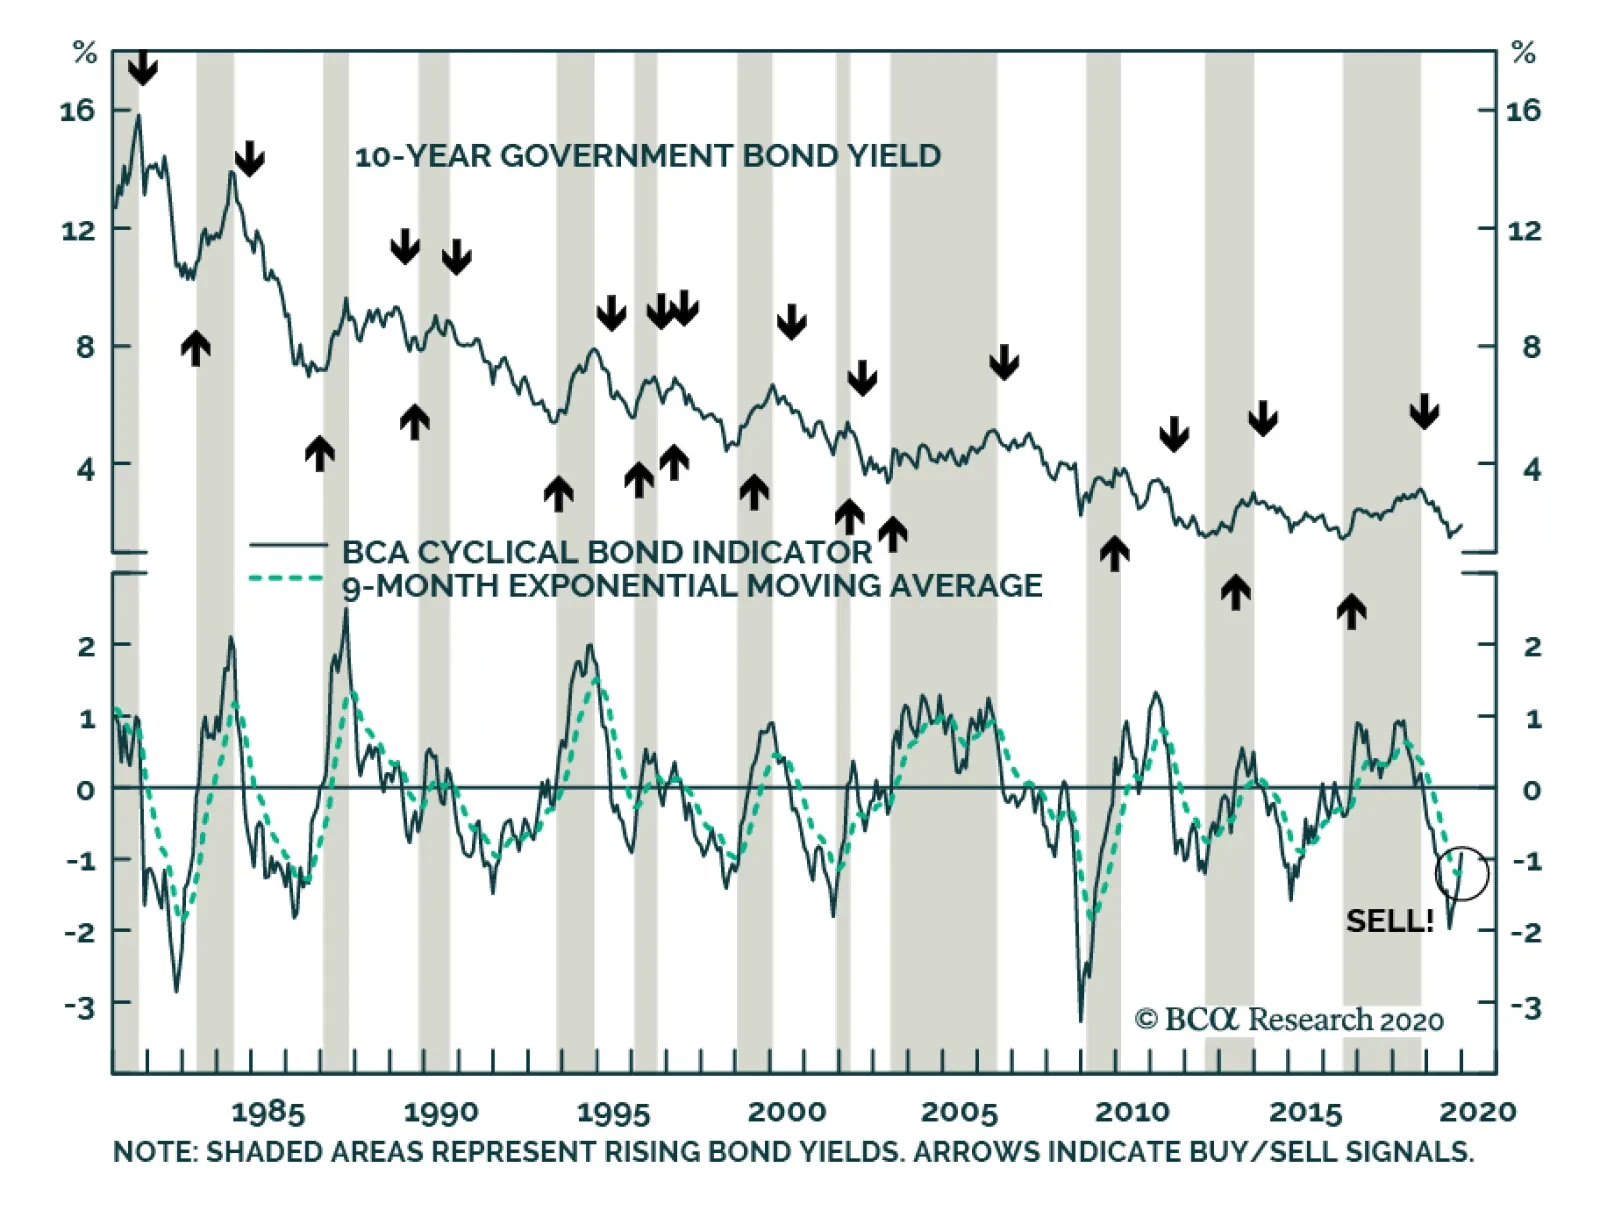
Corrections, Catalysts, And Coronavirus Markets have suffered a correction, begging the question: what caused it? The question is a good one, because identifying the cause can help to inform our response. Yet the danger is that the knee-jerk narrative pinpoints the catalyst rather than the true cause. In which case our response will be wrong too. For example, consider the following two narratives: Tree foliage collapses because of 40 mph winds. Tree foliage collapses because it is autumn. The first narrative is exciting, satisfying, and headline grabbing, but it only pinpoints the catalyst for the foliage collapse: the puff of wind. The second explanation is dull and less newsworthy, but it pinpoints the true cause: in autumn, tree foliage is unstable. Likewise, the coronavirus scare is the catalyst for the recent correction. The true cause is that the stock market had reached a point of groupthink-triggered instability and therefore needed the slightest catalyst to correct. The catalyst could have come from anywhere at any time. If it hadn’t been the coronavirus scare, it would have been the next worry… or the one after that. On January 9 in Markets Are Fractally Fragile we warned that usually cautious value investors had become momentum traders – undermining market liquidity and stability. When this happens, there is a two in three chance of a tactical reversal (Chart I-2). Chart I-2When Markets Are Fractally Fragile, There Is A 2 In 3 Chance Of A Tactical Reversal
When Markets Are Fractally Fragile, There Is A 2 In 3 Chance Of A Tactical Reversal
When Markets Are Fractally Fragile, There Is A 2 In 3 Chance Of A Tactical Reversal
We also warned that the bond yield 6-month impulse – the change in the change – had recently become a severe 100 bps headwind to growth. At this severity of headwind, there is a nine in ten chance that bond yields have reached a near-term peak (Chart I-3). Chart I-3When The Bond Yield 6-Month Impulse Becomes A Severe Headwind, There Is A 9 In 10 Chance Of A Near-Term Peak In Yields
When The Bond Yield 6-Month Impulse Becomes A Severe Headwind, There Is A 9 In 10 Chance Of A Near-Term Peak In Yields
When The Bond Yield 6-Month Impulse Becomes A Severe Headwind, There Is A 9 In 10 Chance Of A Near-Term Peak In Yields
In combination, we warned that equities would underperform bonds by about 4 percent on a tactical horizon. Now that this anticipated correction has happened, what next? Long-term investors should use corrections to overweight equities versus bonds. First, irrespective of coronavirus – or any other catalyst – the recent severe headwind to growth from the bond yield impulse suggests that bond yields will stay depressed for (at least) the first half of 2020. Second, the good news is that the ultra-low bond yields justify and underpin the valuation of equities. Hence, at the current level of bond yields, long-term investors should use corrections to overweight equities versus bonds. Brexit Is “Done”. Or Is It? Rumour has it that Boris Johnson will banish the word Brexit from the UK government lexicon after January 31, because Brexit is now “done”. Good luck with that. When Britain wakes up bleary-eyed on Saturday February 1, what will have changed? Not a lot. The UK will have lost its voice and votes in the EU decision making institutions. Yet in practical terms nothing will have changed, because the UK and EU will enter an 11-month ‘standstill’ transition period in which existing arrangements will continue: the free movement of people, financial contributions, and full access to the single market without tariffs or customs checks. The Conservative government made a manifesto pledge not to extend the 11-month transition, so the more important question is: what will change when the standstill period ends on December 31? The answer depends on what sort of trade deal the UK and EU can negotiate in the limited space of 11 months. Or indeed whether they can negotiate a trade deal at all. Therein lies the problem. A free trade deal with the EU will require a mutual commitment to a ‘level playing field’. If the UK wants to diverge on food standards, environmental protection, labour rights, and state aid – as the Brexit purists yearn – then there is zero chance that the EU will agree to a free trade deal. This leaves two options, neither of which is appealing. The first is for the UK to end the 11-month standstill period without a trade deal. Technically, this would not be ‘no deal’ because the withdrawal agreement would still bind both sides on citizens’ rights, financial contributions, and arrangements for Northern Ireland. A free trade deal with the EU will require a mutual commitment to a ‘level playing field’. However, for UK companies, the option of ending the standstill period without a trade deal would constitute a painful dislocation from the single market involving tariffs and customs checks. It would also hurt the EU economies most exposed to the UK, notably Ireland and the Netherlands. Moreover, a full customs and tariff border in the Irish Sea would endanger the very existence of a ‘United’ Kingdom which included Northern Ireland. The second option is for the UK to accept a trade deal on EU terms, recognising that the EU is the larger and more economically powerful party in the negotiation. The EU will offer the UK a tariff-free and quota-free trade deal conditional on strict level playing field conditions where the UK chooses to diverge from EU standards, combined with a mechanism to adjudicate on any level playing field disputes. Though economically better than no trade deal at all, the Brexit purists would claim it isn’t Brexit. Meanwhile, even without tariffs and quotas, UK companies whose just-in-time supply chains depended on the EU would still suffer disruption, as the level playing field was policed at every border crossing. So this option would satisfy nobody in the UK. The bigger practical problem is a lack of time to leave the EU regulatory orbit smoothly. Nobody believes that eleven months is enough time to implement a system in Northern Ireland that prevent a hard border in the Irish Sea; or indeed to implement a new UK immigration system if free movement were to end at the end of 2020. So what’s the resolution? The answer is the same as it has always been for Brexit – a gradual ratcheting up of tension ahead of a hard deadline to focus minds and force progress. Followed by a ‘fudged resolution’ at the eleventh hour in which both sides blink – because neither side is prepared to go over the cliff-edge. Recall that to get the withdrawal agreement over the line, the UK blinked by allowing Northern Ireland to be treated differently; but the EU also blinked by allowing the withdrawal agreement to be reopened. And once this happened, the pound and UK-exposed investments enjoyed a major leg up (Chart I-1 and Chart I-4-Chart I-7). Chart I-4The FTSE 250 Is A UK-Exposed ##br##Investment
The FTSE 250 Is A UK-Exposed Investment
The FTSE 250 Is A UK-Exposed Investment
Chart I-5The FTSE 100 Is Not A UK-Exposed Investment
The FTSE 100 Is Not A UK-Exposed Investment
The FTSE 100 Is Not A UK-Exposed Investment
Chart I-6UK General Retail Is A UK-Exposed Investment
UK General Retail Is A UK-Exposed Investment
UK General Retail Is A UK-Exposed Investment
Chart I-7UK Clothing And Accessories Is Not A ##br##UK-Exposed Investment
UK Clothing And Accessories Is Not A UK-Exposed Investment
UK Clothing And Accessories Is Not A UK-Exposed Investment
In the next fudged resolution, the UK could blink by retaining full regulatory alignment with the EU in most areas for a little while longer, and where it doesn’t the EU could blink by becoming flexible in its interpretation of ‘level playing field’. Obviously, nobody would call this an extension to the transition, but the UK would, in most practical terms, still be in the single market on January 1 2021. UK-exposed investments will enjoy their next major leg up later this year In this playbook, the pound and UK-exposed investments will come under near-term pressure, as UK/EU trade deal tensions ratchet up. But ultimately, UK-exposed investments will enjoy their next major leg up later this year if both the UK and the EU blink (Chart I-8). Chart I-8The Pound Still Has A Brexit Discount
The Pound Still Has A Brexit Discount
The Pound Still Has A Brexit Discount
Fractal Trading System* There are no new trades this week. The rolling 1-year win ratio now stands at 62 percent. Chart I-9EUR/GBP
EUR/GBP
EUR/GBP
When the fractal dimension approaches the lower limit after an investment has been in an established trend it is a potential trigger for a liquidity-triggered trend reversal. Therefore, open a countertrend position. The profit target is a one-third reversal of the preceding 13-week move. Apply a symmetrical stop-loss. Close the position at the profit target or stop-loss. Otherwise close the position after 13 weeks. * For more details please see the European Investment Strategy Special Report “Fractals, Liquidity & A Trading Model,” dated December 11, 2014, available at eis.bcaresearch.com. Dhaval Joshi Chief European Investment Strategist dhaval@bcaresearch.com Fractal Trading System
Don't Mention The C-Word Or The B-Word
Don't Mention The C-Word Or The B-Word
Don't Mention The C-Word Or The B-Word
Don't Mention The C-Word Or The B-Word
Cyclical Recommendations Structural Recommendations
Don't Mention The C-Word Or The B-Word
Don't Mention The C-Word Or The B-Word
Don't Mention The C-Word Or The B-Word
Don't Mention The C-Word Or The B-Word
Don't Mention The C-Word Or The B-Word
Don't Mention The C-Word Or The B-Word
Don't Mention The C-Word Or The B-Word
Don't Mention The C-Word Or The B-Word
Trades Closed Trades Asset Performance Currency & Bond Equity Sector Country Equity Indicators Bond Yields Chart II-1Indicators To Watch - Bond Yields
Indicators To Watch - Bond Yields
Indicators To Watch - Bond Yields
Chart II-2Indicators To Watch - Bond Yields
Indicators To Watch - Bond Yields
Indicators To Watch - Bond Yields
Chart II-3Indicators To Watch - Bond Yields
Indicators To Watch - Bond Yields
Indicators To Watch - Bond Yields
Chart II-4Indicators To Watch - Bond Yields
Indicators To Watch - Bond Yields
Indicators To Watch - Bond Yields
Interest Rate Chart II-5Indicators To Watch - Interest Rate Expectations
Indicators To Watch - Interest Rate Expectations
Indicators To Watch - Interest Rate Expectations
Chart II-6Indicators To Watch - Interest Rate Expectations
Indicators To Watch - Interest Rate Expectations
Indicators To Watch - Interest Rate Expectations
Chart II-7Indicators To Watch - Interest Rate Expectations
Indicators To Watch - Interest Rate Expectations
Indicators To Watch - Interest Rate Expectations
Chart II-8Indicators To Watch - Interest Rate Expectations
Indicators To Watch - Interest Rate Expectations
Indicators To Watch - Interest Rate Expectations
Highlights BCA’s “Golden Rule of Bond Investing” framework, which links developed economy government bond returns to central bank policy rate “surprises” versus market expectations, also works in China. The relationship between unexpected changes in China’s de facto short-term policy rate and government bond yields has been surprisingly strong over the past decade. Any additional easing by the PBoC this year is likely to be focused on reducing lending rates to the real economy, not interbank rates (which drive government bond yields). As such, yields at the short-end are likely to be flat until later this year at the earliest, whereas yields at the long-end are likely to move modestly higher, at most. The persistent historical gap between economic growth and bond yields in China makes it difficult to forecast the structural outlook for yields using conventional methods. To the extent that Chinese policymakers succeed at shifting the drivers of growth from investment to consumption, we believe that bond yields are more likely to structurally rise than fall. Over the coming 6-12 months, investors should underweight Chinese government bonds versus Chinese equities and onshore corporate bonds. Within a regional government bond portfolio, however, investors should overweight USD-hedged China versus US and developed markets ex-US, as well as in unhedged terms. Feature Last year’s inclusion of Chinese onshore government and policy bank bonds in the Bloomberg Barclays Global Aggregate Index was a significant milestone of China’s journey to internationalize its capital markets. Other bond benchmark providers have since followed suit, highlighting that the trend of increased passive exposure to Chinese assets is likely to continue. Over the past year, the bulk of the market discussion concerning the addition of China to the major bond indices has focused on estimating the size of potential capital inflows that could be triggered and the related impact on onshore bond yields. By contrast, comparatively little work has been done to analyze the core drivers of Chinese government bond yields, and how they compare to the factors that influence yields in the developed markets that dominate the bond indices. This Special Report attempts to fill a hole in the analysis of Chinese bonds. This Special Report attempts to fill that hole in the analysis of Chinese bonds. We look at the predictability of China’s government bond market through the lens of BCA’s “golden rule” framework, and find a surprisingly strong relationship between changes in China’s de facto short-term policy rate and government bond yields. We then present our cyclical (6-12 month) and secular outlooks for government yields given this relationship, and conclude by presenting four specific investment recommendations pertaining to China’s fixed-income market with two audiences in mind: mainland/onshore investors who are focused on returns in unhedged RMB terms, and global fixed-income investors who are primarily focused on hedged US-dollar regional bond exposure. The Golden Rule Of Bond Investing, With Chinese Characteristics In a July 2018 Special Report,1 BCA’s Chief US Bond Strategist, Ryan Swift, elegantly distilled the cyclical US government bond call into a simple question: During the next 12-months, will the Federal Reserve move interest rates by more or less than what is currently priced into the market? Chart 1The (US) Golden Rule Of Bond Investing In Practice
The (US) Golden Rule Of Bond Investing In Practice
The (US) Golden Rule Of Bond Investing In Practice
Ryan argued that a predictive framework for US Treasury returns built around the answer to this question has historically worked so well that it should be referred to as the “Golden Rule of bond investing” (Chart 1). In a follow-up report, our Global Fixed Income Strategy service confirmed that the Golden Rule also largely works in non-US developed market economies, with the exception of Japan due to the absence of any meaningful fluctuation in policy rates over the past two decades.2 The Golden Rule provides a very strong framework to aid fixed-income investors with their cyclical (i.e. 6-12 month) asset allocation decisions, by quantitatively linking government bond returns relative to cash – in other words, the excess return earned by taking duration risk - to policy rate “surprises” compared to what is discounted in shorter-term money markets. The practical application is that a decision to allocate to longer-maturity government bonds is reduced to a bet on whether a central bank will adjust policy rates by more or less than the market expects. The first question we address in this report is to what degree does the Golden Rule apply in China (in yield space rather than in return space), along with an explanation of any differences that may exist. However, we must first note why the Golden Rule of bond investing works, particularly in the US. The first reason is that there is a strong relationship between the US 3-month T-bill rate and Treasury yields of all other maturities. Conceptually, all fixed income investors have a choice when buying US government bonds: they can purchase a 3-month Treasury bill and simply perpetually roll over the position as it matures, or they can purchase a Treasury bond of a longer maturity. This means that yields on longer maturity Treasury bonds simply reflect investor expectations for the average 3-month T-bill rate over the life of the bond, plus some positive risk premium to compensate for the inherent uncertainty of the path and tendency of short-term yields. This helps explain the close link between cyclical changes in 3-month T-bill rates and yields on longer maturity Treasurys. Chart 2In The US, The 3-Month T-Bill Rate Perfectly Tracks The Fed Funds Rate
In The US, The 3-Month T-Bill Rate Perfectly Tracks The Fed Funds Rate
In The US, The 3-Month T-Bill Rate Perfectly Tracks The Fed Funds Rate
The second reason for the Golden Rule’s success is that there is a very tight relationship between the effective Fed funds rate and the 3-month T-bill rate. While it is the (higher) discount rate that is the theoretical no-arbitrage ceiling for the 3-month rate, in practice T-bill rates trade extremely close to the Fed funds rate (Chart 2). This means that Fed funds rate “surprises” (relative to traded market expectations) are akin to surprises in the 3-month rate, which in turn strongly influence the expected future path of short-term interest rates and thus yields on longer maturity Treasurys. In China, we noted in a February 2018 Special Report3 that the 7-day interbank repo rate is now the de jure short-term policy rate in China following the establishment of an interest rate corridor system in 2015. Chart 3 presents our first test of the Golden Rule in China (in yield space rather than in return space), by plotting the annual change in the level of Chinese government bond yields alongside the 7-day repo rate “surprise” over the past year from 2010 to the present. Here, we use the first principal component of zero coupon Chinese government bond yields to represent the average level of yields (rather than selecting a particular maturity), and we use the 12-month RMB swap rate (versus 7-day repo) to represent market expectations for the policy rate. The chart highlights that the fit is good, as measured by a 50% R-squared between the two series. However, deviations in the relationship do exist, with the most notable exception having occurred in 2017: Chinese government bond yields rose considerably more than what the annual surprise in the 7-day repo rate would have suggested. Chart 3In China, The Golden Rule Works Decently Well Using 7-Day Repo...
In China, The Golden Rule Works Decently Well Using 7-Day Repo...
In China, The Golden Rule Works Decently Well Using 7-Day Repo...
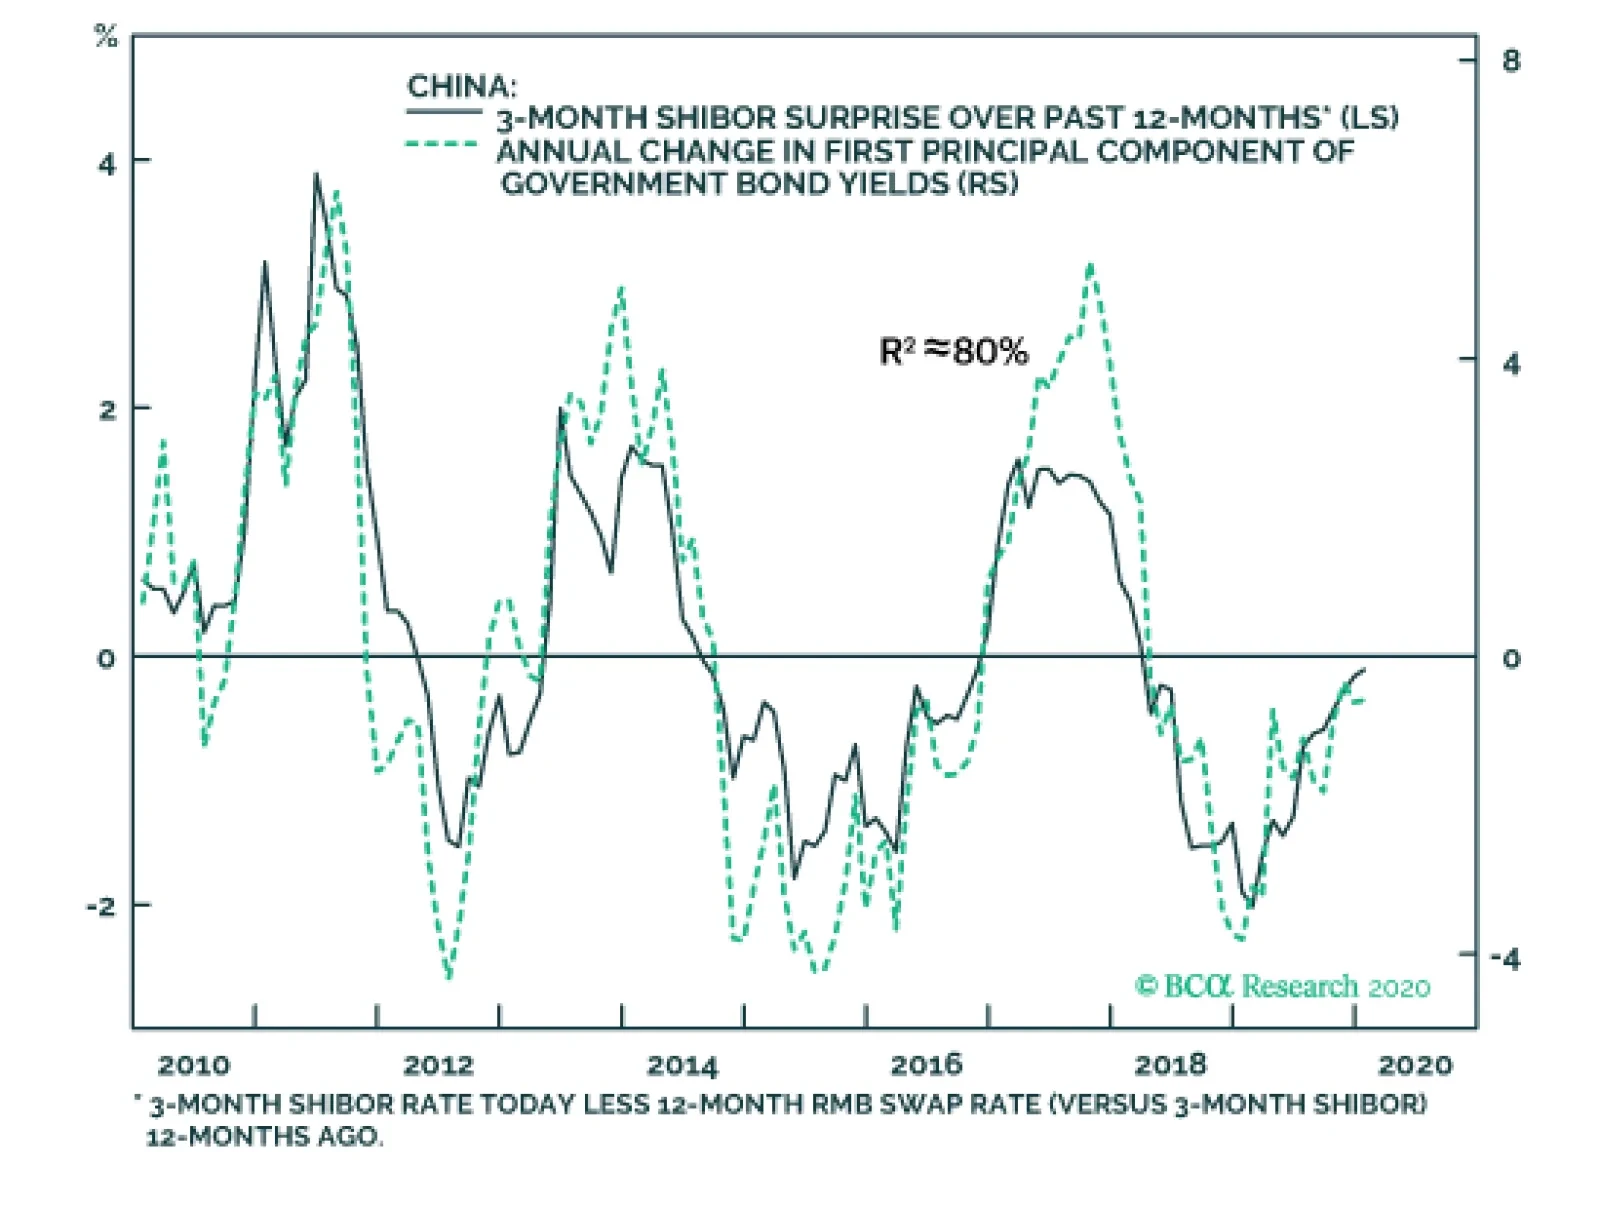
Chart 4...And Extremely Well Using 3-Month SHIBOR
...And Extremely Well Using 3-Month SHIBOR
...And Extremely Well Using 3-Month SHIBOR
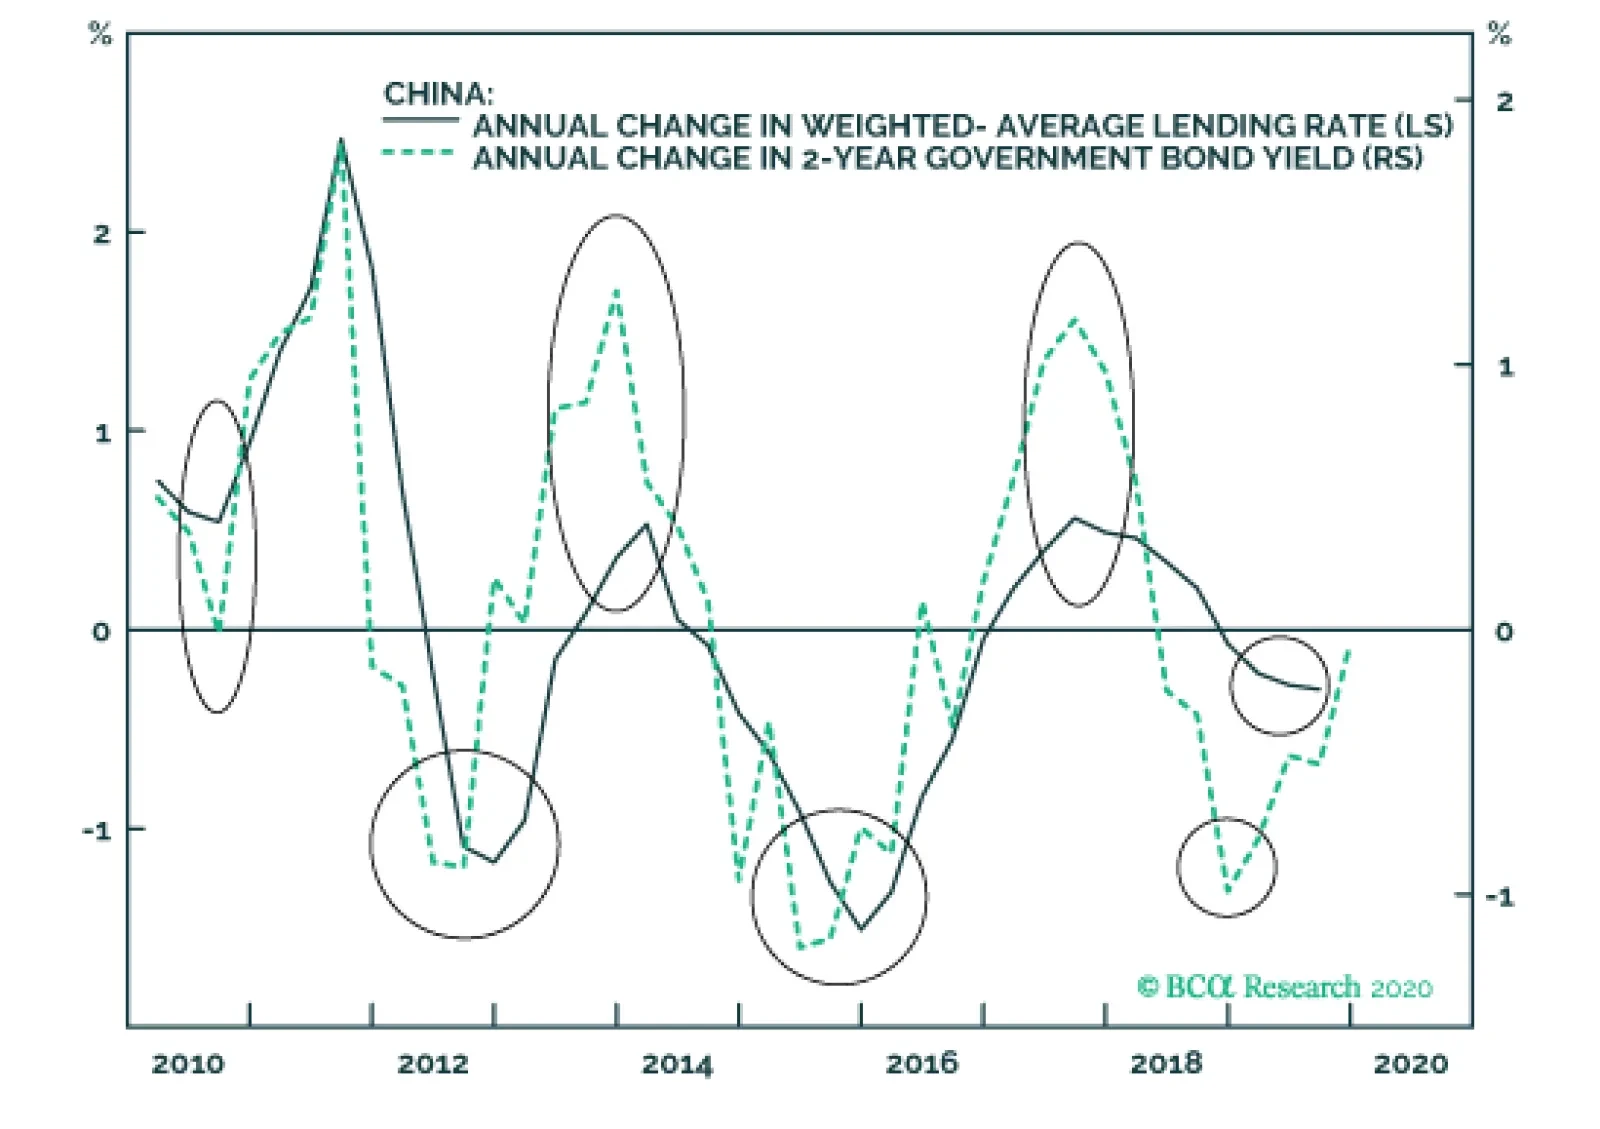
Chart 4 helps resolve a good portion of the 2017 discrepancy, and clarifies the link between Chinese monetary policy and government bond yields. Chart 4 is similar to Chart 3, except that it replaces the 7-day repo rate surprise with that of 3-month SHIBOR (which trades very closely to the 3-month repo rate). The chart illustrates an even closer fit between the two series (with an R-squared close to 80%), and shows that the 3-month SHIBOR surprise does a meaningfully better job at explaining the 2017 rise in Chinese government bond yields. The Golden Rule of bond investing works surprisingly well in China. The fact that the annual surprise in 3-month SHIBOR has done a better job at predicting changes in bond yields over the past decade underscores that the 3-month repo rate is the de facto short-term policy rate in China, a point that we have made in several previous reports. We have noted that the spike in the 3-month/7-day repo rate spread that occurred in late-2016 and lasted until mid-2018 happened because of China’s crackdown on shadow banking activity. This crackdown caused a funding squeeze for China’s small & medium banks, which caused a material rise in lending rates and government bond yields. This episode highlights that future changes in the 3-month repo rate are likely to reflect both underlying changes in net liquidity provided to large commercial banks (measured by the 7-day repo rate), and any dislocations in the interbank market that have the potential to push up lending rates and government bond yields. Bottom Line: BCA’s “Golden Rule” framework, which links developed economy government bond returns to central bank policy rate “surprises” versus market expectations, works for China as well – using the correct measure of the PBOC policy rate. This provides a useful investment framework for Chinese government bonds, which are now significant part of major global bond market benchmarks. The Cyclical Outlook For Chinese Government Bond Yields Given the establishment of the relationship between Chinese short-term interbank rates and government bond yields detailed above, we are now able to more precisely discuss the likely cyclical trajectory of Chinese government bond yields as a function of Chinese monetary policy. Two opposing forces have the potential to affect China’s government bond market this year. The first, a stabilization and modest rebound in Chinese economic activity, may exert upward pressure on yields due to expectations of eventual policy tightening. The second, continued attempts by the PBoC to ease corporate lending rates, may exert downward pressure on yields as it will reflect not just easy but easier monetary conditions. Yields at the long-end are likely to move modestly higher this year, at most. For investors, the raises the obvious question of whether Chinese government bond yields are likely to move up, down, or trend sideways this year. In our view, yields at the short-end are likely to be flat until later this year at the earliest, whereas yields at the long-end are likely to move modestly higher, at most. Yields at the short-end of China’s government bond curve are likely to stay flat for most of this year. There are two reasons why yields at the short-end of China’s government bond curve are likely to stay flat for most of this year. The first is that the PBoC is generally a reactive central bank and has historically lagged a pickup in economic activity, as illustrated in Chart 5. The chart shows the historical path of 3-month SHIBOR in the year following a bottom in economic activity in 2009, 2012, and 2015, and makes it clear that there has been no precedent for a significant rise in interbank rates in the first nine months of an economic recovery. The 2012 episode did see a very sharp rise in 3-month SHIBOR once the PBoC shifted into tightening mode, but we doubt that this experience will be repeated again unless economic growth accelerates much more aggressively than we expect. The second reason why we expect yields at the short-end of the curve to remain muted this year is because any additional easing by the PBoC is likely to be focused on reducing corporate lending rates, not interbank rates. Chart 6 highlights that while there is a strong correlation between changes in Chinese government bond yields and average lending rates in the economy, the former leads the latter. In the past, this relationship has existed because changes in interbank rates have coincided with reductions in the now obsolete benchmark lending rate, with the former usually occurring earlier than the latter. But in a scenario where the PBoC reduces the loan prime rate (LPR) and keeps net banking sector liquidity roughly constant, the extremely tight relationship shown in Chart 4 suggests that short-term bond yields are unlikely to be affected by a reduction in lending rates. Any meaningful decline in short-term yields below short-term interbank rates would simply prompt banks to stop buying these bonds. Chart 5The PBoC Is Generally A Reactive Central Bank
The PBoC Is Generally A Reactive Central Bank
The PBoC Is Generally A Reactive Central Bank
Chart 6Average Lending Rates Lag Short-Term Bond Yields
Average Lending Rates Lag Short-Term Bond Yields
Average Lending Rates Lag Short-Term Bond Yields
Chart 7China's Yield Curve Is Generally Pro-Cyclical
China's Yield Curve Is Generally Pro-Cyclical
China's Yield Curve Is Generally Pro-Cyclical
Additional easing by the PBoC does have the potential to impact the long-end of the government bond curve if investors view these actions as a sign that interbank rates will remain low for some time. This view is reinforced by the fact that China’s yield curve is not particularly flat, and thus has room to move lower. However, Chart 7 also shows that China’s yield curve, defined here as the second principal component of zero coupon Chinese government bond yields, is positively correlated with the relative performance of investable Chinese equities. This suggests that there is a procyclical element to the curve. We suspect that this procyclical element will dominate a potential decline in expectations for future short-term interest rates, but that yields at the long-end are likely to move modestly higher this year, at most. Bottom Line: Any additional easing by the PBoC this year is likely to be focused on reducing lending rates to the real economy, not interbank rates (which drive government bond yields). As such, yields at the short-end are likely to be flat until later this year at the earliest, whereas yields at the long-end are likely to move modestly higher, at most. The Secular Outlook For Chinese Government Bond Yields A common approach to forecasting the likely structural trend for nominal government bond yields is to estimate the trajectory of real long-term potential output growth and to add the monetary authority’s inflation target. This framework is based on the idea that interest rates are in equilibrium when the cost of borrowing is roughly equal to nominal income growth, a condition that results in no change in the burden to service existing debt. Chart 8China's Potential Growth Is Likely To Trend Lower...
China's Potential Growth Is Likely To Trend Lower...
China's Potential Growth Is Likely To Trend Lower...
Based on this framework, we would expect Chinese government bond yields to trend down over time, or possibly flat if the PBoC were to tolerate higher inflation over the coming decade. Chart 8 illustrates the IMF’s forecast of falling real potential growth in China over the coming several years, which is consistent with a shift in the composition of growth from investment to consumption as well as China’s looming demographic crisis. But Chart 9highlights an obvious problem with applying this framework to forecast the secular trend in Chinese government bond yields: over the past decade, yields have persistently averaged below actual nominal GDP growth, both in China and in the developed world. In the latter case, it is an open question whether this will continue to be true in the future, but in China’s case it is clear that government bond yields have little connection (in magnitude) to the pace of GDP growth. This reflects the longstanding strategy of Chinese policymakers to promote investment via persistently low interest rates, as has occurred in other manufacturing and export-oriented Asian economies (Chart 10). Chart 9...But Bond Yields Are Well Below GDP Growth, Just Like In Developed Markets
...But Bond Yields Are Well Below GDP Growth, Just Like In Developed Markets
...But Bond Yields Are Well Below GDP Growth, Just Like In Developed Markets
Chart 10In Industrial Asian Economies, Low Bond Yields Are A Policy Choice
In Industrial Asian Economies, Low Bond Yields Are A Policy Choice
In Industrial Asian Economies, Low Bond Yields Are A Policy Choice
The persistent historical gap between economic growth and bond yields in China makes it difficult to forecast the structural outlook for yields using conventional methods, and largely limits us to inference. To the extent that Chinese policymakers succeed at shifting the drivers of growth from investment to consumption, bond yields are more likely to rise than fall over time. This is because as long as interest rates remain well below the pace of income growth, the incentive to excessively borrow (and invest) is likely to persist. Chart 11China Needs Higher Interest Rates, But Only To A Point
China Needs Higher Interest Rates, But Only To A Point
China Needs Higher Interest Rates, But Only To A Point
However, even in a scenario where Chinese government bond yields structurally trend higher, we expect the rise to be modest. Chart 11 highlights that China’s “private sector” debt service ratio is extremely elevated, underscoring that the country’s ability to tolerate significantly higher bond yields is not strong. In addition, since 2015, China’s debt service ratio has been mostly flat despite rising a rising debt-to-GDP ratio, which has been achieved through lower short-term interest rates. To the extent that policymakers fail to make meaningful progress in shifting China’s growth drivers away from investment over the coming few years, lower (potentially sharply lower) bond yields would appear to be all but inevitable to cope with what would become a permanently growing drag on economic activity from the servicing of debt. For now, we would characterize this scenario as a risk to our base case view, but it is a risk that we will be closely monitoring over the coming years. Bottom Line: The persistent gap between Chinese nominal GDP growth and government bond yields is likely contributing to the problem of excessive leveraging. To the extent that Chinese policymakers succeed at shifting the drivers of growth from investment to consumption, bond yields are more likely to structurally rise than fall. Investment Conclusions Our analysis above points to four recommendations for investors over the coming year: Overweight Chinese stocks versus Chinese government bonds in RMB and USD terms Overweight Chinese onshore corporate bonds versus duration-matched Chinese government bonds in RMB terms Overweight 7-10 year USD-hedged Chinese government bonds versus their US and developed market (DM) counterparts For offshore US dollar-based investors, long 7-10 year Chinese government bonds in unhedged terms Regarding the first two recommendations, our view that yields are likely to be flat at the short-end and modestly higher at the long-end suggests that investors can expect total returns on the order of 2-3% from Chinese government bonds this year. Barring a major and lasting economic slowdown from the 2019-nCoV outbreak, we expect Chinese domestic and investable equities to outperform government securities over the coming 6-12 months. Onshore corporate bonds have a similar outlook: onshore spreads are pricing in (massively) higher default losses than we believe is warranted, meaning that they will outperform duration-matched government equivalents without any changes in yield. Chart 12Within Global Fixed-Income, Hedged Chinese 10-Year Yields Are Relatively Attractive
Within Global Fixed-Income, Hedged Chinese 10-Year Yields Are Relatively Attractive
Within Global Fixed-Income, Hedged Chinese 10-Year Yields Are Relatively Attractive
Chart 13Unhedged Yield Spreads Predict Hedged Relative Performance Versus The US
Unhedged Yield Spreads Predict Hedged Relative Performance Versus The US
Unhedged Yield Spreads Predict Hedged Relative Performance Versus The US
For global fixed-income investors, Charts 12-14 present USD-hedged 10-year Chinese government yields versus the US and DM/DM ex-US, along with the historical relative return profile of USD-hedged Chinese bonds versus hedged and unhedged returns. In hedged space, Chinese 10-year government bond yields are modestly attractive: 2.2% versus 1.6% in the US and 1.8% in DM ex-US. China’s historically low yield beta to the overall level of global 10-year bond yields (Chart 15) suggests that Chinese yields should perform well in 2020 – a year where we expect global bond yields to drift higher as economic growth rebounds. Combined with relatively attractive valuation, this bodes well for the relative performance of Chinese debt versus DM equivalents. A low yield beta against a backdrop of drifting higher global yields implies that longer-maturity Chinese government bonds will outperform their DM equivalents. Chart 14Unhedged Yield Spreads Predict Hedged Relative Performance Versus DM
Unhedged Yield Spreads Predict Hedged Relative Performance Versus DM
Unhedged Yield Spreads Predict Hedged Relative Performance Versus DM
Chart 15China's Yield Beta Has Been Rising, But Is Still Japan-Like
China's Yield Beta Has Been Rising, But Is Still Japan-Like
China's Yield Beta Has Been Rising, But Is Still Japan-Like
We would also recommend longer-maturity Chinese government bonds in unhedged terms versus a USD-hedged global government bond portfolio. Chart 16 highlights that the relative return of this trade is strongly (negatively) linked to USD-CNY, and we expect further (albeit more modest) gains in RMB over the cyclical horizon. Chart 16Modest Further RMB Upside Means Unhedged Chinese Bonds Will Outperform
Modest Further RMB Upside Means Unhedged Chinese Bonds Will Outperform
Modest Further RMB Upside Means Unhedged Chinese Bonds Will Outperform
As a final point, investors should note that today’s report is part of a heightened focus on China’s fixed income market, in terms of both forecasting fixed income returns and analyzing the cyclical and structural implications of the increasing investability of China’s financial markets. More research on this topic is likely to come in 2020 and beyond: Stay Tuned! Jonathan LaBerge, CFA, Vice President Special Reports jonathanl@bcaresearch.com Footnotes 1 Please see US Bond Strategy Special Report "The Golden Rule Of Bond Investing," dated July 24, 2018, available at usbs.bcaresearch.com 2 Please see Global Fixed Income Strategy Special Report "The Global Golden Rule Of Bond Investing," dated September 25, 2018, available at gfis.bcaresearch.com 3 Please see China Investment Strategy Special Report "Seven Questions About Chinese Monetary Policy," dated February 22, 2018, available at cis.bcaresearch.com
Dear clients, Please note that in next week’s China Macro And Market Review, we will include a section explaining our view on the coronavirus outbreak and its economic as well as financial market implications. We maintain our overweight stance on both Chinese investable and A-share equities, over a tactical (0-3 months) and cyclical (6-12 months) time horizon. Please stay tuned. Jing Sima, China Strategist Highlights BCA’s “Golden Rule of Bond Investing” framework, which links developed economy government bond returns to central bank policy rate “surprises” versus market expectations, also works in China. The relationship between unexpected changes in China’s de facto short-term policy rate and government bond yields has been surprisingly strong over the past decade. Any additional easing by the PBoC this year is likely to be focused on reducing lending rates to the real economy, not interbank rates (which drive government bond yields). As such, yields at the short-end are likely to be flat until later this year at the earliest, whereas yields at the long-end are likely to move modestly higher, at most. The persistent historical gap between economic growth and bond yields in China makes it difficult to forecast the structural outlook for yields using conventional methods. To the extent that Chinese policymakers succeed at shifting the drivers of growth from investment to consumption, we believe that bond yields are more likely to structurally rise than fall. Over the coming 6-12 months, investors should underweight Chinese government bonds versus Chinese equities and onshore corporate bonds. Within a regional government bond portfolio, however, investors should overweight USD-hedged China versus US and developed markets ex-US, as well as in unhedged terms. Feature Last year’s inclusion of Chinese onshore government and policy bank bonds in the Bloomberg Barclays Global Aggregate Index was a significant milestone of China’s journey to internationalize its capital markets. Other bond benchmark providers have since followed suit, highlighting that the trend of increased passive exposure to Chinese assets is likely to continue. Over the past year, the bulk of the market discussion concerning the addition of China to the major bond indices has focused on estimating the size of potential capital inflows that could be triggered and the related impact on onshore bond yields. By contrast, comparatively little work has been done to analyze the core drivers of Chinese government bond yields, and how they compare to the factors that influence yields in the developed markets that dominate the bond indices. This Special Report attempts to fill a hole in the analysis of Chinese bonds. This Special Report attempts to fill that hole in the analysis of Chinese bonds. We look at the predictability of China’s government bond market through the lens of BCA’s “golden rule” framework, and find a surprisingly strong relationship between changes in China’s de facto short-term policy rate and government bond yields. We then present our cyclical (6-12 month) and secular outlooks for government yields given this relationship, and conclude by presenting four specific investment recommendations pertaining to China’s fixed-income market with two audiences in mind: mainland/onshore investors who are focused on returns in unhedged RMB terms, and global fixed-income investors who are primarily focused on hedged US-dollar regional bond exposure. The Golden Rule Of Bond Investing, With Chinese Characteristics In a July 2018 Special Report,1 BCA’s Chief US Bond Strategist, Ryan Swift, elegantly distilled the cyclical US government bond call into a simple question: During the next 12-months, will the Federal Reserve move interest rates by more or less than what is currently priced into the market? Chart 1The (US) Golden Rule Of Bond Investing In Practice
The (US) Golden Rule Of Bond Investing In Practice
The (US) Golden Rule Of Bond Investing In Practice
Ryan argued that a predictive framework for US Treasury returns built around the answer to this question has historically worked so well that it should be referred to as the “Golden Rule of bond investing” (Chart 1). In a follow-up report, our Global Fixed Income Strategy service confirmed that the Golden Rule also largely works in non-US developed market economies, with the exception of Japan due to the absence of any meaningful fluctuation in policy rates over the past two decades.2 The Golden Rule provides a very strong framework to aid fixed-income investors with their cyclical (i.e. 6-12 month) asset allocation decisions, by quantitatively linking government bond returns relative to cash – in other words, the excess return earned by taking duration risk - to policy rate “surprises” compared to what is discounted in shorter-term money markets. The practical application is that a decision to allocate to longer-maturity government bonds is reduced to a bet on whether a central bank will adjust policy rates by more or less than the market expects. The first question we address in this report is to what degree does the Golden Rule apply in China (in yield space rather than in return space), along with an explanation of any differences that may exist. However, we must first note why the Golden Rule of bond investing works, particularly in the US. The first reason is that there is a strong relationship between the US 3-month T-bill rate and Treasury yields of all other maturities. Conceptually, all fixed income investors have a choice when buying US government bonds: they can purchase a 3-month Treasury bill and simply perpetually roll over the position as it matures, or they can purchase a Treasury bond of a longer maturity. This means that yields on longer maturity Treasury bonds simply reflect investor expectations for the average 3-month T-bill rate over the life of the bond, plus some positive risk premium to compensate for the inherent uncertainty of the path and tendency of short-term yields. This helps explain the close link between cyclical changes in 3-month T-bill rates and yields on longer maturity Treasurys. Chart 2In The US, The 3-Month T-Bill Rate Perfectly Tracks The Fed Funds Rate
In The US, The 3-Month T-Bill Rate Perfectly Tracks The Fed Funds Rate
In The US, The 3-Month T-Bill Rate Perfectly Tracks The Fed Funds Rate
The second reason for the Golden Rule’s success is that there is a very tight relationship between the effective Fed funds rate and the 3-month T-bill rate. While it is the (higher) discount rate that is the theoretical no-arbitrage ceiling for the 3-month rate, in practice T-bill rates trade extremely close to the Fed funds rate (Chart 2). This means that Fed funds rate “surprises” (relative to traded market expectations) are akin to surprises in the 3-month rate, which in turn strongly influence the expected future path of short-term interest rates and thus yields on longer maturity Treasurys. In China, we noted in a February 2018 Special Report3 that the 7-day interbank repo rate is now the de jure short-term policy rate in China following the establishment of an interest rate corridor system in 2015. Chart 3 presents our first test of the Golden Rule in China (in yield space rather than in return space), by plotting the annual change in the level of Chinese government bond yields alongside the 7-day repo rate “surprise” over the past year from 2010 to the present. Here, we use the first principal component of zero coupon Chinese government bond yields to represent the average level of yields (rather than selecting a particular maturity), and we use the 12-month RMB swap rate (versus 7-day repo) to represent market expectations for the policy rate. The chart highlights that the fit is good, as measured by a 50% R-squared between the two series. However, deviations in the relationship do exist, with the most notable exception having occurred in 2017: Chinese government bond yields rose considerably more than what the annual surprise in the 7-day repo rate would have suggested. Chart 3In China, The Golden Rule Works Decently Well Using 7-Day Repo...
In China, The Golden Rule Works Decently Well Using 7-Day Repo...
In China, The Golden Rule Works Decently Well Using 7-Day Repo...
Chart 4...And Extremely Well Using 3-Month SHIBOR
...And Extremely Well Using 3-Month SHIBOR
...And Extremely Well Using 3-Month SHIBOR
Chart 4 helps resolve a good portion of the 2017 discrepancy, and clarifies the link between Chinese monetary policy and government bond yields. Chart 4 is similar to Chart 3, except that it replaces the 7-day repo rate surprise with that of 3-month SHIBOR (which trades very closely to the 3-month repo rate). The chart illustrates an even closer fit between the two series (with an R-squared close to 80%), and shows that the 3-month SHIBOR surprise does a meaningfully better job at explaining the 2017 rise in Chinese government bond yields. The Golden Rule of bond investing works surprisingly well in China. The fact that the annual surprise in 3-month SHIBOR has done a better job at predicting changes in bond yields over the past decade underscores that the 3-month repo rate is the de facto short-term policy rate in China, a point that we have made in several previous reports. We have noted that the spike in the 3-month/7-day repo rate spread that occurred in late-2016 and lasted until mid-2018 happened because of China’s crackdown on shadow banking activity. This crackdown caused a funding squeeze for China’s small & medium banks, which caused a material rise in lending rates and government bond yields. This episode highlights that future changes in the 3-month repo rate are likely to reflect both underlying changes in net liquidity provided to large commercial banks (measured by the 7-day repo rate), and any dislocations in the interbank market that have the potential to push up lending rates and government bond yields. Bottom Line: BCA’s “Golden Rule” framework, which links developed economy government bond returns to central bank policy rate “surprises” versus market expectations, works for China as well – using the correct measure of the PBOC policy rate. This provides a useful investment framework for Chinese government bonds, which are now significant part of major global bond market benchmarks. The Cyclical Outlook For Chinese Government Bond Yields Given the establishment of the relationship between Chinese short-term interbank rates and government bond yields detailed above, we are now able to more precisely discuss the likely cyclical trajectory of Chinese government bond yields as a function of Chinese monetary policy. Two opposing forces have the potential to affect China’s government bond market this year. The first, a stabilization and modest rebound in Chinese economic activity, may exert upward pressure on yields due to expectations of eventual policy tightening. The second, continued attempts by the PBoC to ease corporate lending rates, may exert downward pressure on yields as it will reflect not just easy but easier monetary conditions. Yields at the long-end are likely to move modestly higher this year, at most. For investors, the raises the obvious question of whether Chinese government bond yields are likely to move up, down, or trend sideways this year. In our view, yields at the short-end are likely to be flat until later this year at the earliest, whereas yields at the long-end are likely to move modestly higher, at most. Yields at the short-end of China’s government bond curve are likely to stay flat for most of this year. There are two reasons why yields at the short-end of China’s government bond curve are likely to stay flat for most of this year. The first is that the PBoC is generally a reactive central bank and has historically lagged a pickup in economic activity, as illustrated in Chart 5. The chart shows the historical path of 3-month SHIBOR in the year following a bottom in economic activity in 2009, 2012, and 2015, and makes it clear that there has been no precedent for a significant rise in interbank rates in the first nine months of an economic recovery. The 2012 episode did see a very sharp rise in 3-month SHIBOR once the PBoC shifted into tightening mode, but we doubt that this experience will be repeated again unless economic growth accelerates much more aggressively than we expect. The second reason why we expect yields at the short-end of the curve to remain muted this year is because any additional easing by the PBoC is likely to be focused on reducing corporate lending rates, not interbank rates. Chart 6 highlights that while there is a strong correlation between changes in Chinese government bond yields and average lending rates in the economy, the former leads the latter. In the past, this relationship has existed because changes in interbank rates have coincided with reductions in the now obsolete benchmark lending rate, with the former usually occurring earlier than the latter. But in a scenario where the PBoC reduces the loan prime rate (LPR) and keeps net banking sector liquidity roughly constant, the extremely tight relationship shown in Chart 4 suggests that short-term bond yields are unlikely to be affected by a reduction in lending rates. Any meaningful decline in short-term yields below short-term interbank rates would simply prompt banks to stop buying these bonds. Chart 5The PBoC Is Generally A Reactive Central Bank
The PBoC Is Generally A Reactive Central Bank
The PBoC Is Generally A Reactive Central Bank
Chart 6Average Lending Rates Lag Short-Term Bond Yields
Average Lending Rates Lag Short-Term Bond Yields
Average Lending Rates Lag Short-Term Bond Yields
Chart 7China's Yield Curve Is Generally Pro-Cyclical
China's Yield Curve Is Generally Pro-Cyclical
China's Yield Curve Is Generally Pro-Cyclical
Additional easing by the PBoC does have the potential to impact the long-end of the government bond curve if investors view these actions as a sign that interbank rates will remain low for some time. This view is reinforced by the fact that China’s yield curve is not particularly flat, and thus has room to move lower. However, Chart 7 also shows that China’s yield curve, defined here as the second principal component of zero coupon Chinese government bond yields, is positively correlated with the relative performance of investable Chinese equities. This suggests that there is a procyclical element to the curve. We suspect that this procyclical element will dominate a potential decline in expectations for future short-term interest rates, but that yields at the long-end are likely to move modestly higher this year, at most. Bottom Line: Any additional easing by the PBoC this year is likely to be focused on reducing lending rates to the real economy, not interbank rates (which drive government bond yields). As such, yields at the short-end are likely to be flat until later this year at the earliest, whereas yields at the long-end are likely to move modestly higher, at most. The Secular Outlook For Chinese Government Bond Yields A common approach to forecasting the likely structural trend for nominal government bond yields is to estimate the trajectory of real long-term potential output growth and to add the monetary authority’s inflation target. This framework is based on the idea that interest rates are in equilibrium when the cost of borrowing is roughly equal to nominal income growth, a condition that results in no change in the burden to service existing debt. Chart 8China's Potential Growth Is Likely To Trend Lower...
China's Potential Growth Is Likely To Trend Lower...
China's Potential Growth Is Likely To Trend Lower...
Based on this framework, we would expect Chinese government bond yields to trend down over time, or possibly flat if the PBoC were to tolerate higher inflation over the coming decade. Chart 8 illustrates the IMF’s forecast of falling real potential growth in China over the coming several years, which is consistent with a shift in the composition of growth from investment to consumption as well as China’s looming demographic crisis. But Chart 9highlights an obvious problem with applying this framework to forecast the secular trend in Chinese government bond yields: over the past decade, yields have persistently averaged below actual nominal GDP growth, both in China and in the developed world. In the latter case, it is an open question whether this will continue to be true in the future, but in China’s case it is clear that government bond yields have little connection (in magnitude) to the pace of GDP growth. This reflects the longstanding strategy of Chinese policymakers to promote investment via persistently low interest rates, as has occurred in other manufacturing and export-oriented Asian economies (Chart 10). Chart 9...But Bond Yields Are Well Below GDP Growth, Just Like In Developed Markets
...But Bond Yields Are Well Below GDP Growth, Just Like In Developed Markets
...But Bond Yields Are Well Below GDP Growth, Just Like In Developed Markets
Chart 10In Industrial Asian Economies, Low Bond Yields Are A Policy Choice
In Industrial Asian Economies, Low Bond Yields Are A Policy Choice
In Industrial Asian Economies, Low Bond Yields Are A Policy Choice
The persistent historical gap between economic growth and bond yields in China makes it difficult to forecast the structural outlook for yields using conventional methods, and largely limits us to inference. To the extent that Chinese policymakers succeed at shifting the drivers of growth from investment to consumption, bond yields are more likely to rise than fall over time. This is because as long as interest rates remain well below the pace of income growth, the incentive to excessively borrow (and invest) is likely to persist. Chart 11China Needs Higher Interest Rates, But Only To A Point
China Needs Higher Interest Rates, But Only To A Point
China Needs Higher Interest Rates, But Only To A Point
However, even in a scenario where Chinese government bond yields structurally trend higher, we expect the rise to be modest. Chart 11 highlights that China’s “private sector” debt service ratio is extremely elevated, underscoring that the country’s ability to tolerate significantly higher bond yields is not strong. In addition, since 2015, China’s debt service ratio has been mostly flat despite rising a rising debt-to-GDP ratio, which has been achieved through lower short-term interest rates. To the extent that policymakers fail to make meaningful progress in shifting China’s growth drivers away from investment over the coming few years, lower (potentially sharply lower) bond yields would appear to be all but inevitable to cope with what would become a permanently growing drag on economic activity from the servicing of debt. For now, we would characterize this scenario as a risk to our base case view, but it is a risk that we will be closely monitoring over the coming years. Bottom Line: The persistent gap between Chinese nominal GDP growth and government bond yields is likely contributing to the problem of excessive leveraging. To the extent that Chinese policymakers succeed at shifting the drivers of growth from investment to consumption, bond yields are more likely to structurally rise than fall. Investment Conclusions Our analysis above points to four recommendations for investors over the coming year: Overweight Chinese stocks versus Chinese government bonds in RMB and USD terms Overweight Chinese onshore corporate bonds versus duration-matched Chinese government bonds in RMB terms Overweight 7-10 year USD-hedged Chinese government bonds versus their US and developed market (DM) counterparts For offshore US dollar-based investors, long 7-10 year Chinese government bonds in unhedged terms Regarding the first two recommendations, our view that yields are likely to be flat at the short-end and modestly higher at the long-end suggests that investors can expect total returns on the order of 2-3% from Chinese government bonds this year. Barring a major and lasting economic slowdown from the 2019-nCoV outbreak, we expect Chinese domestic and investable equities to outperform government securities over the coming 6-12 months. Onshore corporate bonds have a similar outlook: onshore spreads are pricing in (massively) higher default losses than we believe is warranted, meaning that they will outperform duration-matched government equivalents without any changes in yield. Chart 12Within Global Fixed-Income, Hedged Chinese 10-Year Yields Are Relatively Attractive
Within Global Fixed-Income, Hedged Chinese 10-Year Yields Are Relatively Attractive
Within Global Fixed-Income, Hedged Chinese 10-Year Yields Are Relatively Attractive
Chart 13Unhedged Yield Spreads Predict Hedged Relative Performance Versus The US
Unhedged Yield Spreads Predict Hedged Relative Performance Versus The US
Unhedged Yield Spreads Predict Hedged Relative Performance Versus The US
For global fixed-income investors, Charts 12-14 present USD-hedged 10-year Chinese government yields versus the US and DM/DM ex-US, along with the historical relative return profile of USD-hedged Chinese bonds versus hedged and unhedged returns. In hedged space, Chinese 10-year government bond yields are modestly attractive: 2.2% versus 1.6% in the US and 1.8% in DM ex-US. China’s historically low yield beta to the overall level of global 10-year bond yields (Chart 15) suggests that Chinese yields should perform well in 2020 – a year where we expect global bond yields to drift higher as economic growth rebounds. Combined with relatively attractive valuation, this bodes well for the relative performance of Chinese debt versus DM equivalents. A low yield beta against a backdrop of drifting higher global yields implies that longer-maturity Chinese government bonds will outperform their DM equivalents. Chart 14Unhedged Yield Spreads Predict Hedged Relative Performance Versus DM
Unhedged Yield Spreads Predict Hedged Relative Performance Versus DM
Unhedged Yield Spreads Predict Hedged Relative Performance Versus DM
Chart 15China's Yield Beta Has Been Rising, But Is Still Japan-Like
China's Yield Beta Has Been Rising, But Is Still Japan-Like
China's Yield Beta Has Been Rising, But Is Still Japan-Like
We would also recommend longer-maturity Chinese government bonds in unhedged terms versus a USD-hedged global government bond portfolio. Chart 16 highlights that the relative return of this trade is strongly (negatively) linked to USD-CNY, and we expect further (albeit more modest) gains in RMB over the cyclical horizon. Chart 16Modest Further RMB Upside Means Unhedged Chinese Bonds Will Outperform
Modest Further RMB Upside Means Unhedged Chinese Bonds Will Outperform
Modest Further RMB Upside Means Unhedged Chinese Bonds Will Outperform
As a final point, investors should note that today’s report is part of a heightened focus on China’s fixed income market, in terms of both forecasting fixed income returns and analyzing the cyclical and structural implications of the increasing investability of China’s financial markets. More research on this topic is likely to come in 2020 and beyond: Stay Tuned! Jonathan LaBerge, CFA, Vice President Special Reports jonathanl@bcaresearch.com Footnotes 1 Please see US Bond Strategy Special Report "The Golden Rule Of Bond Investing," dated July 24, 2018, available at usbs.bcaresearch.com 2 Please see Global Fixed Income Strategy Special Report "The Global Golden Rule Of Bond Investing," dated September 25, 2018, available at gfis.bcaresearch.com 3 Please see China Investment Strategy Special Report "Seven Questions About Chinese Monetary Policy," dated February 22, 2018, available at cis.bcaresearch.com Cyclical Investment Stance Equity Sector Recommendations
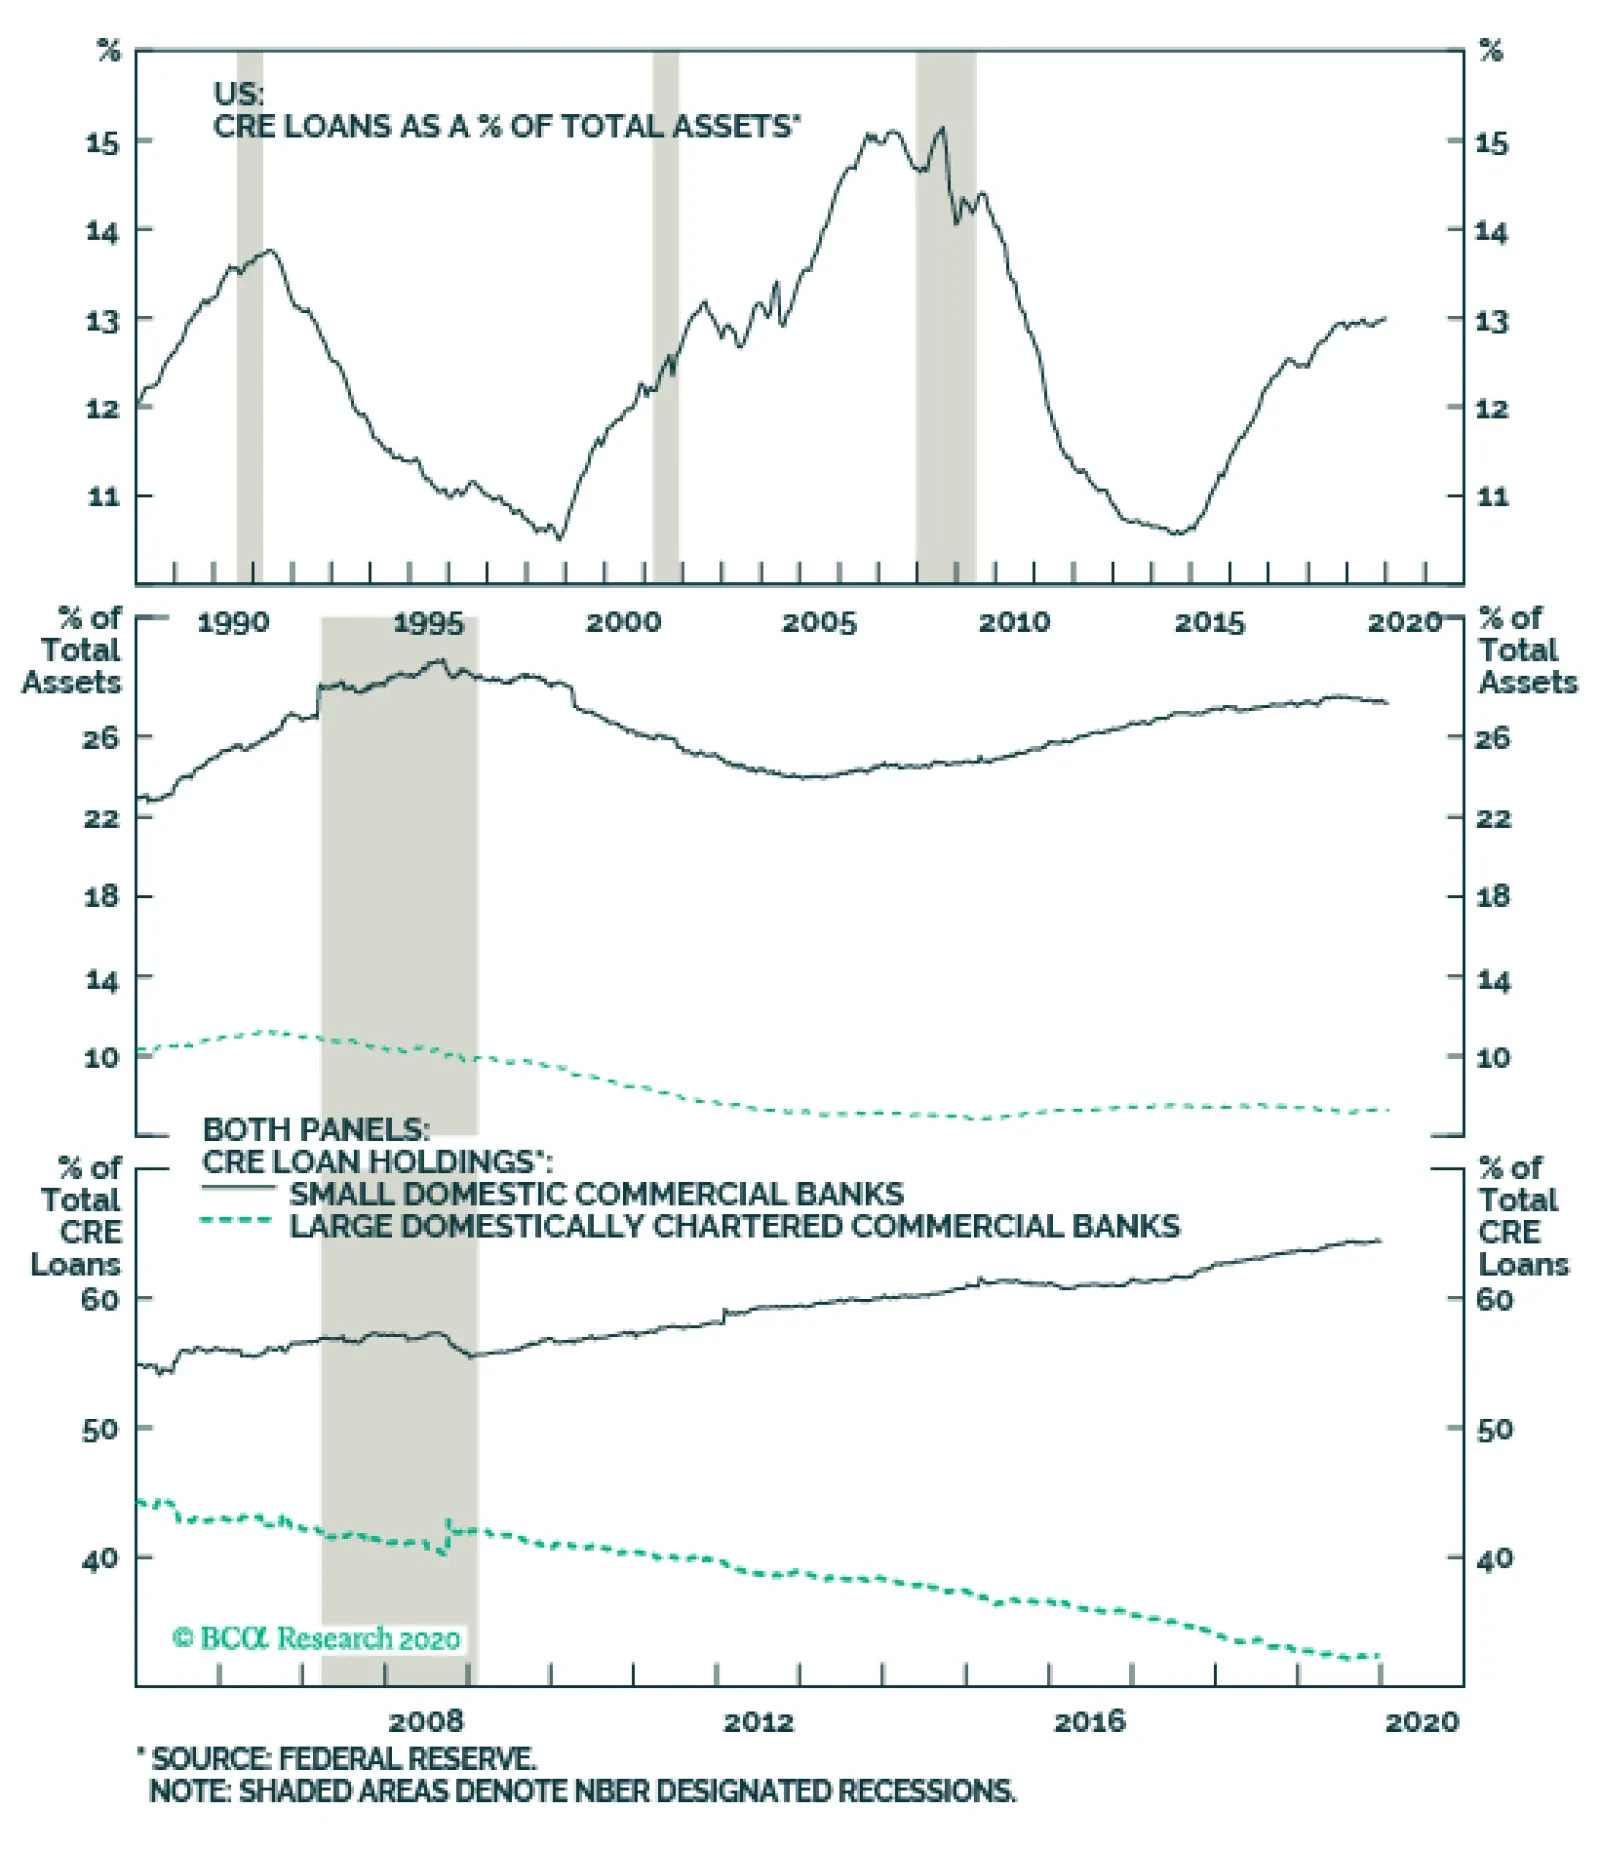
Banks have decreased their overall exposure to commercial property loans to levels below their 2008 and 1989 peaks. It is worth noting that smaller banks have taken an increasingly important role in the commercial property market as they now finance 65% of…