Fixed Income
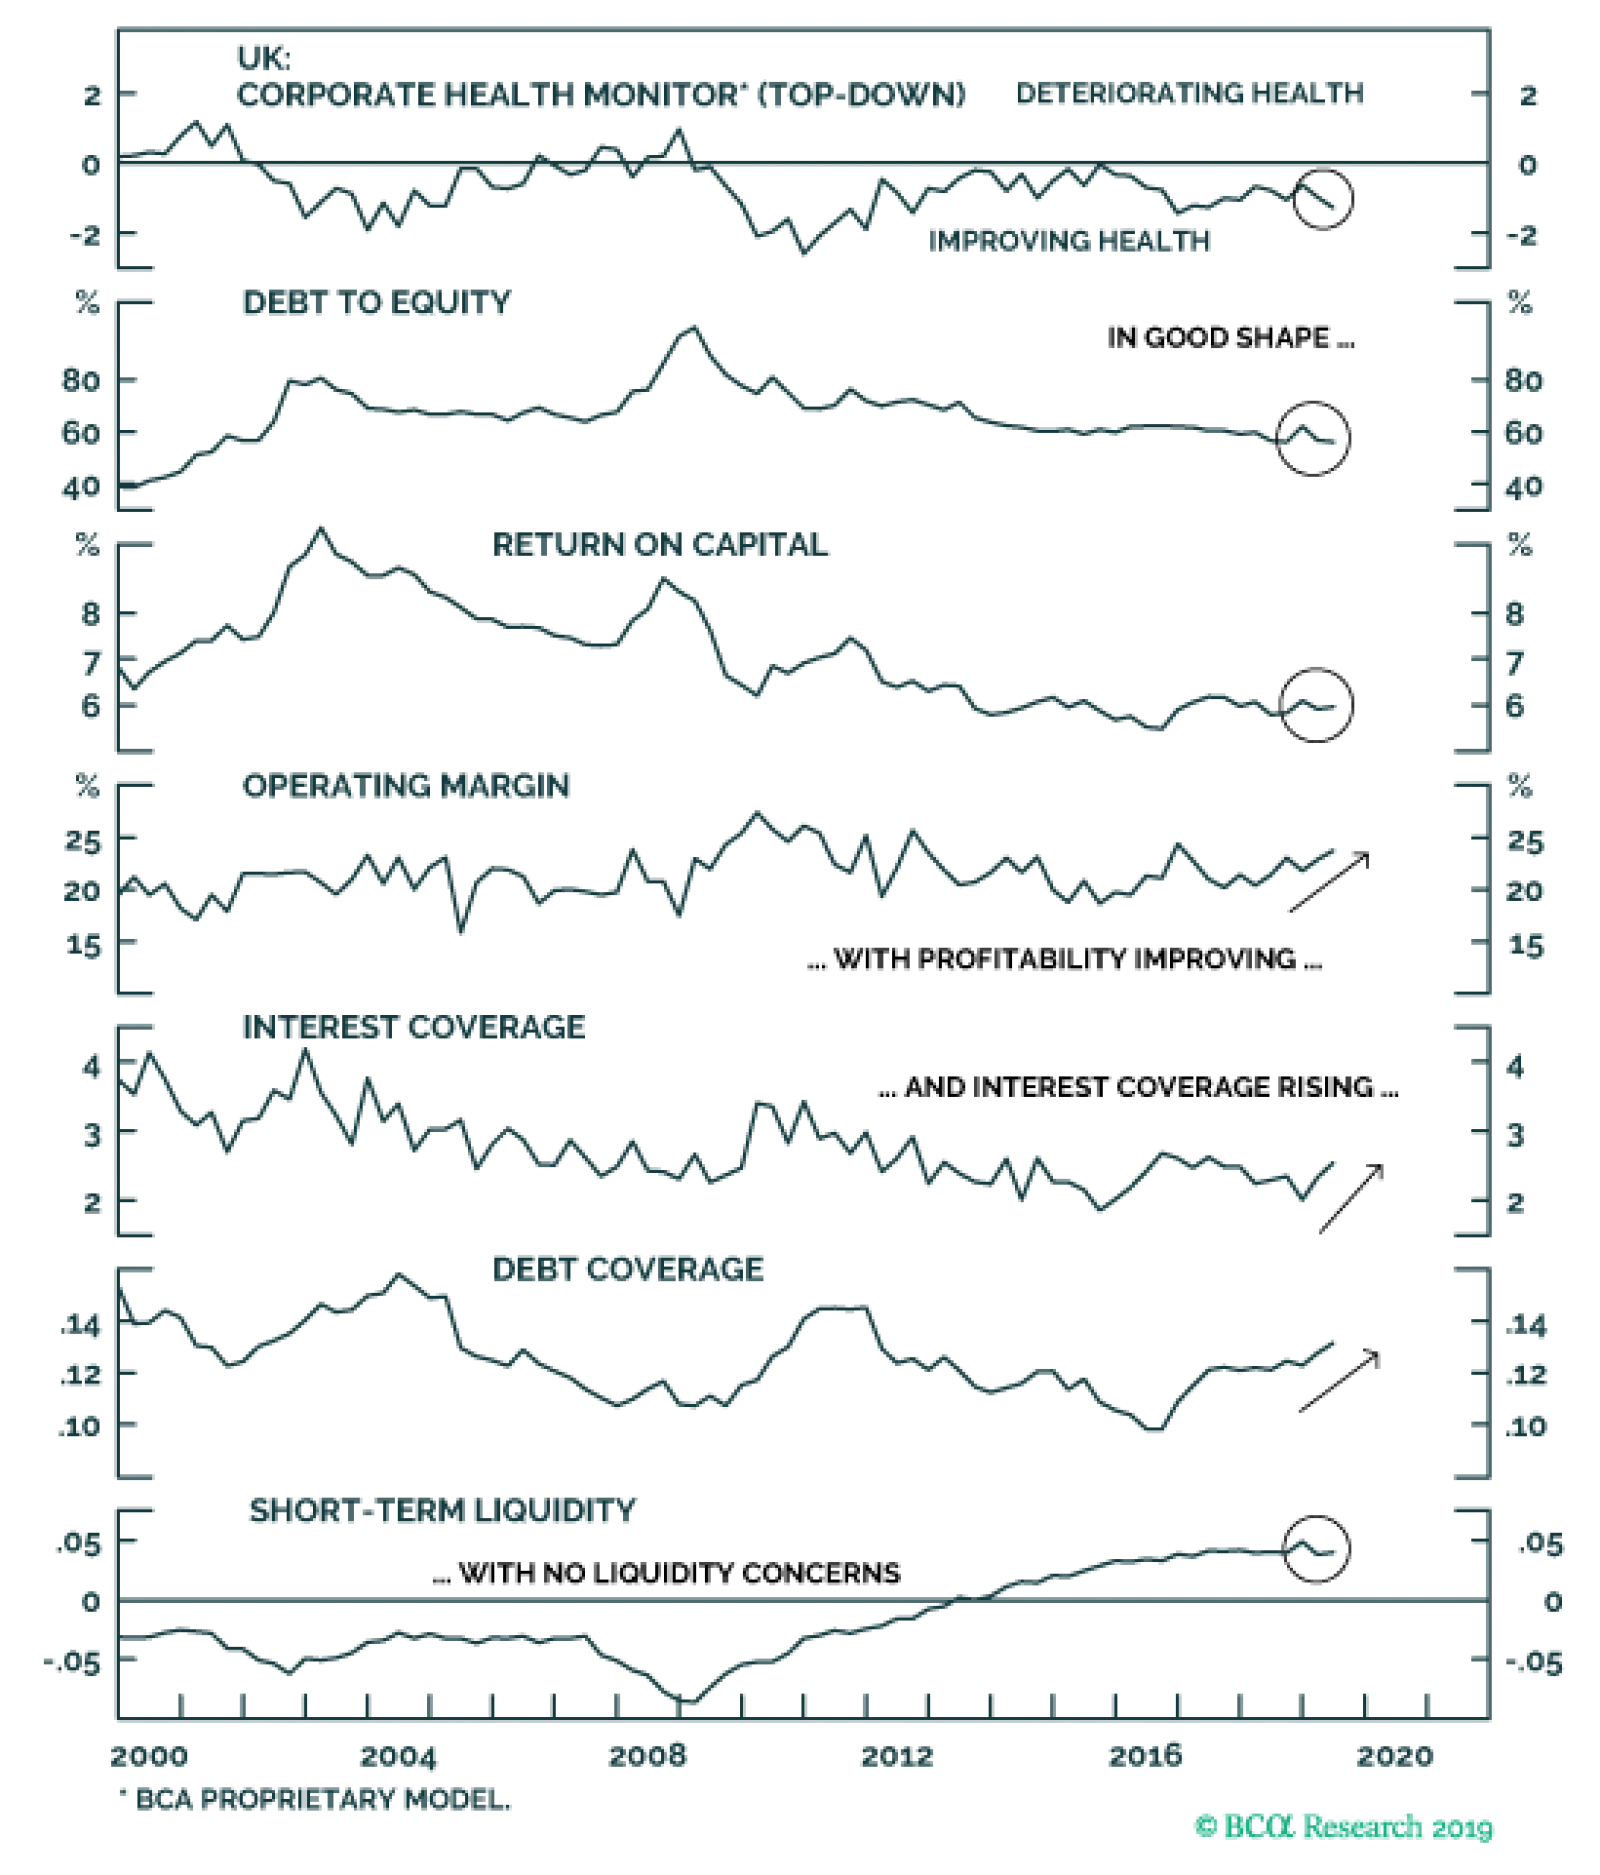
Despite the persistent uncertainty over the UK-EU Brexit negotiations that has weighed on UK economic confidence, our top-down UK corporate health monitor remains in the "improving health" zone. All of the individual components are contributing to the…
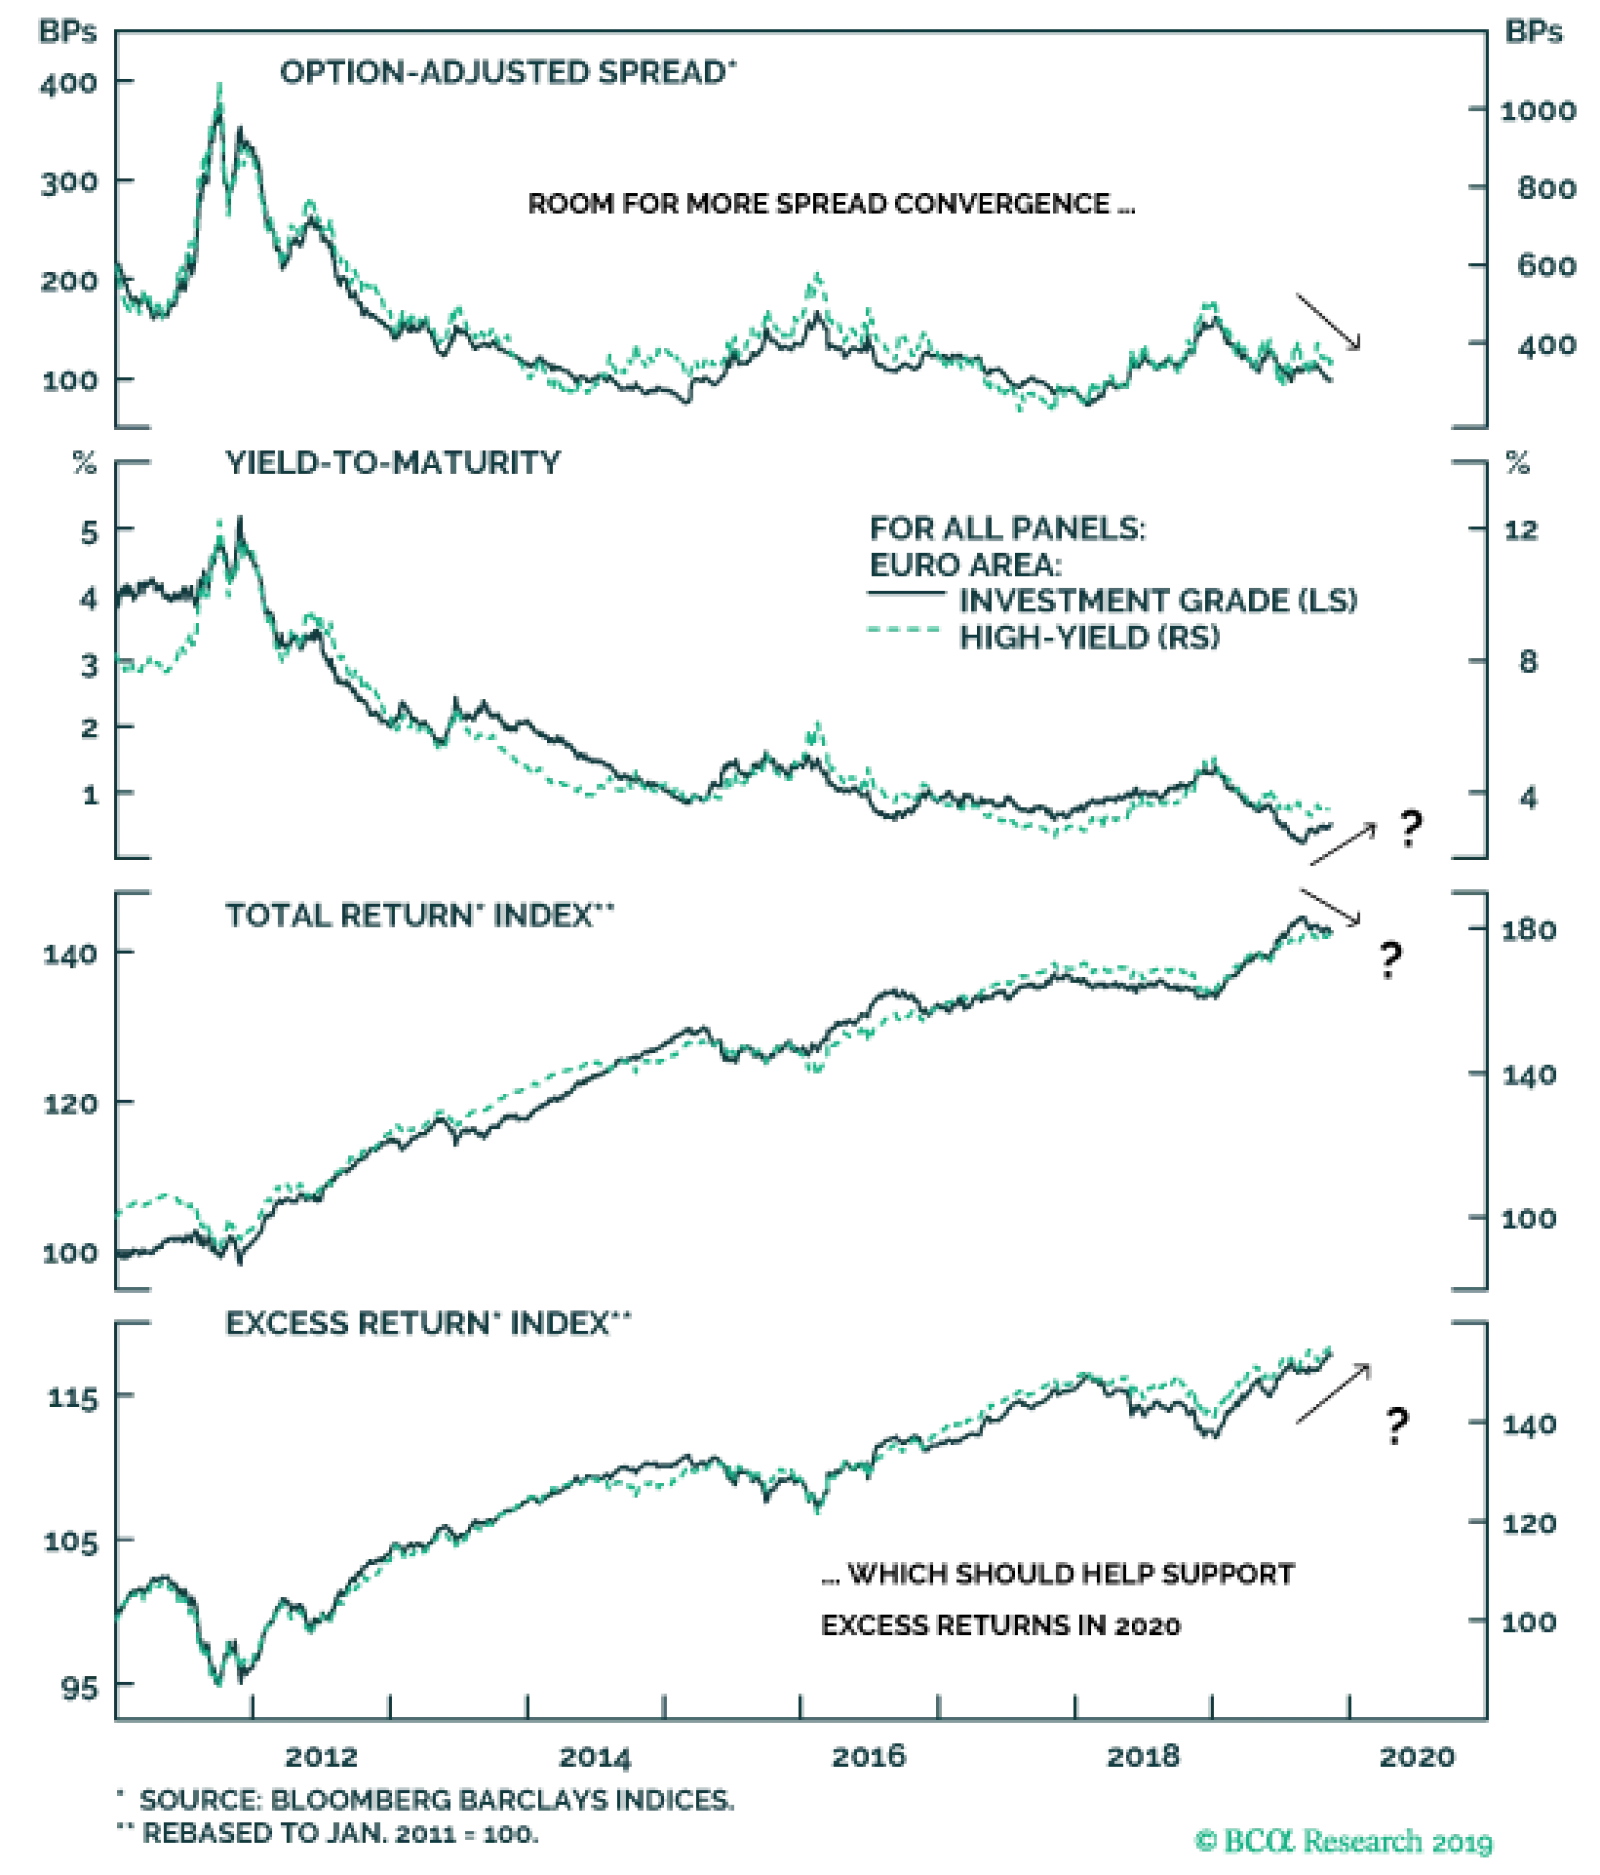
Our bottom-up euro area Corporate Health Monitors are sending different messages for lower-rated and higher-quality issuers. For euro area investment grade, the gap between domestic and foreign issuers has been widening, with the former now in…

Highlights Duration: A survey of the five factors that determine the path for Treasury yields suggests that further upside is likely. We see a clear path to 2.5% for long-maturity Treasury yields as recessionary risk moves to the back burner in the coming months. Credit Cycle: C&I lending standards tightened on net in the third quarter of 2019. But other indicators of monetary conditions point to continued accommodation. We expect lending standards will soon move back into “net easing” territory. Remain overweight Spread Product versus Treasuries. IG Valuation: Investment grade corporate bond spreads for all credit tiers are now below our fair value targets. We recommend only a neutral allocation to the sector. Investors should prefer high-yield bonds, where spreads are more attractive, and Agency MBS, which offer competitive expected returns and much less risk. Feature Chart 1Recession Risk Getting Priced Out
Recession Risk Getting Priced Out
Recession Risk Getting Priced Out
The bond sell-off continued last week, driven by positive developments in US/China trade negotiations and tentative signs of stabilization in some global growth indicators. The renewed sense of economic optimism has reduced the recessionary risk priced into bond markets. The 2/10 Treasury slope has steepened 30 bps since it briefly inverted in late August. During that same period, the 2-year Treasury yield is up 15 bps, the 10-year yield is up 45 bps and the Bloomberg Barclays Treasury index has underperformed a position in cash by 2.7% (Chart 1). These recent developments raise two important questions. First, should investors chase or fade the back-up in Treasury yields? And second, if the sell-off does continue, how high can yields go? To answer these questions we turn to the five macro factors that drive trends in US bond yields. These factors were outlined in our “Bond Kitchen” report from last April, and are listed right here:1 Global growth Policy uncertainty The US dollar The output gap Sentiment Back In The Kitchen Global Growth Chart 2CRB Index Needs To Rebound
CRB Index Needs To Rebound
CRB Index Needs To Rebound
Three global growth indicators are particularly relevant for US Treasury yields. They are the Global Manufacturing PMI, the US ISM Manufacturing PMI and the CRB Raw Industrials index. The latter is especially useful because it updates on a daily basis. Considering the CRB index, we notice that, while it is no longer in a steep downtrend, it has also not rebounded alongside the jump in bond yields (Chart 2). This should give us pause. Continued low readings from the CRB index make it more likely that bond yields will fall back in the coming weeks. We should also note that the ratio between the CRB index and Gold is more highly correlated with the 10-year Treasury yield than the CRB index itself.2 This ratio has bounced off its lows (Chart 2, top panel), but only because Gold has come under downward pressure. With the Fed committed to maintaining an accommodative policy stance until inflation expectations are re-anchored, we expect the Gold price to remain well bid. This means that raw industrials prices must rebound to keep the ratio trending higher. The CRB/Gold ratio has bounced off its lows, but only because Gold has come under downward pressure. More encouraging than the CRB index is the Global Manufacturing PMI, which has moved off its lows during the past three months (Chart 3). The increase has been partially driven by stronger US readings (Chart 3, panel 2), but principally by a significant jump in China’s PMI (Chart 3, bottom panel). Chart 3China Pulling The Global Manufacturing PMI Higher
China Pulling The Global Manufacturing PMI Higher
China Pulling The Global Manufacturing PMI Higher
Somewhat stronger China PMI readings should be expected, given the rebound in our China Investment Strategy’s Li Keqiang Leading Indicator – a composite measure of monetary conditions, money and credit growth (Chart 4).3 We should also expect further modest policy stimulus from China, as long as the labor market remains under pressure (Chart 4, bottom panel). Turning to the US, we have seen three very positive developments in the economic data during the past month. First, the ISM Services PMI jumped from 52.6 to 54.7 in October (Chart 5). A drop in this index to 50 or below would be consistent with a US recession, while the combination of a strong service sector and a depressed manufacturing sector is consistent with our baseline 2015/16 roadmap. This roadmap leads to an eventual rebound in the manufacturing index. Second, the ISM Manufacturing PMI rose a tad in October, but the New Export Orders component jumped significantly from 41 to 50.4 (Chart 5, panel 2). Since the global slowdown began as a non-US phenomenon, a rebound in this export component sends a strong signal that we are at an inflection point. Finally, consumer confidence rose in October following a sharp decline in September. A year-over-year decline in the consumer confidence index is a reasonably strong recession signal, but recent data suggest that this signal is fading (Chart 5, bottom panel). Chart 4Modest Stimulus In China
Modest Stimulus In China
Modest Stimulus In China
Chart 5Three Positive Developments
Three Positive Developments
Three Positive Developments
All in all, the global growth data have turned more positive during the past month. US indicators, in particular, are no longer sending strong recessionary signals. A rebound in the CRB Raw Industrials index would give us more confidence in the durability of the recent rise in Treasury yields. Policy Uncertainty Uncertainty about the US/China trade conflict has eased considerably during the past few weeks, as the two sides appear to be working toward a “phase 1” deal that would prevent the imposition of new tariffs and roll back some that are already in place. Heightened uncertainty about the trade war played a large role in dragging bond yields lower in 2019. This becomes apparent when you notice that survey and sentiment (aka “soft”) data about the economic outlook have been significantly worse than the actual “hard” data on US economic activity.4 It is clear that negative sentiment about the trade war has held survey data and bond yields down, even as underlying US economic activity has been solid. Less bullish dollar sentiment supports a continued uptrend in Treasury yields. We see a continued easing of trade tensions as we head into the first half of next year. President Trump has an incentive to support the economy in an election year, given the historical record of incumbent presidents being re-elected when the economy is strong. However, if this strategy doesn’t work and Trump finds himself behind in the polls by the end of next summer, then he could decide that ramping up the trade war again is the best course of action. In other words, another spike in policy uncertainty in the second half of 2020 is possible if President Trump is trailing in the polls. The US Dollar Chart 6Dollar Sentiment Points To Higher Yields
Dollar Sentiment Points To Higher Yields
Dollar Sentiment Points To Higher Yields
The US dollar is important for the path of US Treasury yields because it signals whether US yields are decoupling from yields in the rest of the world. In other words, if the dollar appreciates significantly alongside rising Treasury yields, then we should view those yields as increasingly out of step with the rest of the world, and thus more likely to fall back down. So far, the dollar has been relatively flat as yields have risen and bullish sentiment toward the US dollar has declined significantly (Chart 6). Less bullish dollar sentiment supports a continued uptrend in Treasury yields. But if yields do in fact continue to rise, it will be important to watch the dollar’s reaction. The Output Gap Chart 7Wage Gains Hurting Margins, Not Raising Prices
Wage Gains Hurting Margins, Not Raising Prices
Wage Gains Hurting Margins, Not Raising Prices
Some sense of the output gap is important for forecasting bond yields. This is because the same amount of global growth will lead to more inflationary pressure and higher bond yields when the output gap is small than when it is large. The fact that the output gap is smaller now than it was in 2016 is probably the reason why the 10-year Treasury yield bottomed 10 bps above its 2016 trough this year, and why the average Treasury index yield bottomed 47 bps above its 2016 trough. We have found wage growth to be an excellent indicator of the output gap, and noted in a recent report that wage growth should continue to accelerate.5 In this vein, another crucial variable to monitor is labor compensation as a percent of national income (Chart 7). The rise in this series indicates that wage gains during the past few years have come at the expense of corporate profit margins, and have not been passed through to higher consumer prices. If this series proves to have a lot more cyclical upside, then it could be some time before wage acceleration translates to higher inflation. Sentiment Chart 8Surprise Index Says Sentiment Is Neutral
Surprise Index Says Sentiment Is Neutral
Surprise Index Says Sentiment Is Neutral
The final factor we consider when forecasting US Treasury yields is sentiment. We have found that the Economic Surprise Index is the single best measure of aggregate market sentiment. That is, when the Surprise index reaches a positive or negative extreme, it usually means that sentiment is too positive or too negative, and will mean-revert in the months ahead. Also, we have observed a strong correlation between the Surprise index and changes in Treasury yields (Chart 8). At present, the Surprise index is roughly neutral, and therefore does not send a strong signal about where sentiment might push bond yields during the next few months. Investment Conclusions To summarize, the outlook from our five macro factors suggests that Treasury yields will rise further in the coming months. Global growth indicators are showing tentative signs of bottoming, and should rise to levels more consistent with the “hard” economic data as policy uncertainty continues to wane. The fact that the US economic data look less recessionary than they did one month ago makes us more confident that our global indicators will rebound. Chart 9A Clear Path To 2.5%
A Clear Path To 2.5%
A Clear Path To 2.5%
We would become concerned about a renewed downtick in yields if the CRB Raw Industrials index fails to rebound, or if the dollar strengthens significantly in the coming weeks. At the beginning of this report, we asked how high Treasury yields can go if the global growth rebound proves durable. To answer that question we refer to current estimates of the long-run neutral fed funds rate. The FOMC’s median estimate of the long-run neutral fed funds rate is 2.5% and the median estimate from the New York Fed’s Survey of Market Participants is 2.48%, with an interquartile range of 2.25% - 2.5%. If recessionary fears move to the back burner, it would be logical for long-dated yields to converge toward those levels. That is in fact what happened in recent years, with the 5-year/5-year forward Treasury yield peaking several times at levels close to the Fed’s median neutral rate estimate (Chart 9). With this in mind, we see a clear path to 2.5% on the 5-year/5-year forward Treasury yield, with the 10-year yield reaching similar levels since the 5/10 Treasury slope is likely to remain flat (Chart 9, bottom panel). For yields to eventually move above 2.5%, the market would have to re-consider its outlook for the long-run neutral fed funds rate. We discussed what factors to monitor in this regard in a recent report.6 Bottom Line: Treasury yields have moved significantly higher in recent weeks, but a survey of the five factors that determine the path for Treasury yields suggests that further upside is likely. We see a clear path to 2.5% for long-maturity Treasury yields as recessionary risk moves to the back burner in the coming months. Checking In On The Credit Cycle In previous reports, we mentioned that three factors drive our view of corporate bond spreads and the credit cycle: Balance sheet health Monetary conditions Valuation We last presented a detailed examination of these factors in a report from mid-September, concluding that accommodative monetary conditions will support corporate bond excess returns, despite deteriorating balance sheet health.7 Three factors drive our view of corporate bond spreads and the credit cycle: Balance sheet health, monetary conditions,and valuation. But since then, C&I lending standards – an important indicator of monetary conditions – moved into “net tightening” territory for the third quarter of 2019 (Chart 10). Tightening C&I lending standards, if they persist, would put significant upward pressure on corporate defaults and credit spreads. Chart 10Credit Cycle Checklist: Monetary Conditions
Credit Cycle Checklist: Monetary Conditions
Credit Cycle Checklist: Monetary Conditions
While the recent move in lending standards is concerning, we expect it to reverse in the near future. The yield curve, another indicator of monetary conditions, has steepened in recent months, suggesting that conditions are becoming more accommodative. Also, loan officers reported that the terms on C&I loans continued to ease in Q3, even as overall standards tightened (Chart 10, panel 3). Most importantly, inflation expectations remain extremely low (Chart 10, bottom panel). This gives the Fed every incentive to maintain accommodative monetary conditions. This should give lenders the confidence to ease lending standards, leading to tight credit spreads and a low corporate default rate. Bottom Line: C&I lending standards tightened on net in the third quarter of 2019. But other indicators of monetary conditions point to continued accommodation. We expect lending standards will soon move back into “net easing” territory. Remain overweight Spread Product versus Treasuries. Downgrade Investment Grade Corporates To Neutral Last week, we downgraded our recommended allocation to investment grade corporate bonds from overweight to neutral.8 We maintain a positive view of the credit cycle, and expect that corporate bonds will continue to outperform Treasuries. However, investment grade corporate spreads no longer provide adequate compensation for their level of risk. We maintain an overweight allocation to high-yield corporates, where spreads remain attractive. Chart 11 shows that investment grade corporate spreads have tightened somewhat in recent months, but that they remain well above the tights seen in early 2018. However, the chart also shows that average index duration has increased considerably this year. All else equal, higher index duration justifies a wider spread. In contrast, notice that high-yield index duration fell this year (Chart 11, bottom panel). This is because high-yield bonds usually carry embedded call options, making them negatively convex. All else equal, lower index duration makes the spread offered by the high-yield index more attractive. Because changes in spread and duration are both important, we prefer to use the 12-month breakeven spread as our main valuation tool. This measure is the spread widening required on a 12-month investment horizon to underperform a duration-matched position in Treasuries. It can be approximated by dividing the option-adjusted spread by duration. Chart 12 shows investment grade 12-month breakeven spreads as a percentile rank since 1995. The overall message is that spreads have rarely been lower. Chart 11Higher Durations Makes IG Spreads Look Too Tight
Higher Durations Makes IG Spreads Look Too Tight
Higher Durations Makes IG Spreads Look Too Tight
Chart 12Investment Grade Corporate Spreads Have Rarely Been Lower
Investment Grade Corporate Spreads Have Rarely Been Lower
Investment Grade Corporate Spreads Have Rarely Been Lower
Finally, we can also recognize that spreads tend to be tight in the middle and late stages of the credit cycle. In the current environment, that means we should expect spreads to be near the bottom of their historical ranges. To control for this fact, we re-calculate our breakeven spread percentile ranks using only mid-cycle periods when the slope of the yield curve is between 0 bps and 50 bps. We can then back-out spread targets for each credit tier based on the median 12-month breakeven spreads seen in similar macro environments. Chart 13 shows that spreads for all investment grade credit tiers have moved below our targets. High-yield spreads are not shown, but they remain well above target levels.9 Chart 13Spreads For All IG Credit Tiers Are Below Target
Spreads For All IG Credit Tiers Are Below Target
Spreads For All IG Credit Tiers Are Below Target
In place of investment grade corporates, which have become expensive, we recommend upgrading Agency MBS. MBS now offer expected returns that are comparable with corporate bonds rated A or higher, with considerably less risk.10 Bottom Line: Investment grade corporate bond spreads for all credit tiers are now below our fair value targets. We recommend only a neutral allocation to the sector. Investors should prefer high-yield bonds, where spreads are more attractive, and Agency MBS, which offer competitive expected returns and much less risk. Ryan Swift US Bond Strategist rswift@bcaresearch.com Footnotes 1 Please see US Bond Strategy Weekly Report, “Bond Kitchen”, dated April 9, 2019, available at usbs.bcaresearch.com 2 For details on why the ratio between the CRB Raw Industrials index and Gold tracks the 10-year Treasury yield please see US Bond Strategy Portfolio Allocation Summary, “The Sequence Of Reflation”, dated March 5, 2019, available at usbs.bcaresearch.com 3 Please see China Investment Strategy Special Report, “The Data Lab: Testing The Predictability Of China’s Business Cycle”, dated November 30, 2017, available at cis.bcaresearch.com 4 For more details on the divergence between “soft” and “hard” data please see US Bond Strategy Weekly Report, “Crisis Of Confidence”, dated October 22, 2019, available at usbs.bcaresearch.com 5 Please see US Bond Strategy Weekly Report, “Position For Modest Curve Steepening”, dated October 29, 2019, available at usbs.bcaresearch.com 6 Please see US Bond Strategy Weekly Report, “Position For Modest Curve Steepening”, dated October 29, 2019, available at usbs.bcaresearch.com 7 Please see US Bond Strategy Weekly Report, “Corporate Bond Investors Should Not Fight The Fed”, dated September 17, 2019, available at usbs.bcaresearch.com 8 Please see US Bond Strategy Portfolio Allocation Summary, “The Fed Will Stay Supportive”, dated November 5, 2019, available at usbs.bcaresearch.com 9 For details on how we calculate our spread targets please see US Bond Strategy Weekly Report, “The Value In Corporate Bonds”, dated February 19, 2019, available at usbs.bcaresearch.com 10 For more details on the positive outlook for MBS please see US Bond Strategy Weekly Report, “Two Themes And Two Trades”, dated October 1, 2019, available at usbs.bcaresearch.com Fixed Income Sector Performance Recommended Portfolio Specification
Highlights The mood among investors is shifting from the recessionary gloom of this past summer. Equities worldwide are rallying, buoyed by a combination of dovish monetary policies, tentative signs of bottoming global growth and expectations of some sort of trade détente between the US and China. The latter is fueling more bullish sentiment towards equities in regions most exposed to global trade and manufacturing like Emerging Markets (EM) and Europe. Feature Chart 1Global Corporates: 2016 Revisited?
Global Corporates: 2016 Revisited?
Global Corporates: 2016 Revisited?
Credit investors, in an unusual twist, have been far more optimistic than their equity brethren. Corporate bonds have delivered solid performance in 2019, with the Bloomberg Barclays Global Corporates total return index up +9.5% year-to-date. This is a surprising development, as global growth concerns triggered a major decline in developed market government bond yields but no widening of credit risk premia (Chart 1). With that in mind, this week we are presenting the latest update of our Corporate Health Monitor (CHM) Chartbook. The CHMs are composite indicators of balance sheet and income statement ratios (using both top-down and bottom-up data) designed to assess the financial well-being of the overall non-financial corporate sectors in the major developed economies. A brief overview of the methodology is presented in Appendix 1 on page 15. The overriding message from the latest read of our CHMs is that the manufacturing-led slowing of global growth this year has not resulted in much deterioration in overall corporate creditworthiness. There are fascinating cross-currents within the data, however. On a regional basis, the CHMs in the euro area, the UK and Canada are in better shape than in the US and Japan. The most interesting differences are across credit quality, with our “bottom-up” high-yield (HY) CHMs looking better than the investment grade (IG) equivalents in both the US and euro area, mostly due to greater relative increases in IG leverage. Our current global corporate bond investment recommendations broadly follow the trends signaled by our CHMs: an aggregate overweight stance versus global government debt, but with a “reverse quality bias” favoring HY over IG in the US and Europe. With government bond yields now on the rise across the developed markets – and with credit spreads fairly tight across the majority of countries - the period of hyper-charged absolute corporate bond returns is over. Expect more carry-like excess returns over sovereigns during the next 6-12 months. US Corporate Health Monitors: Steady Deterioration, Mostly Within Investment Grade Our top-down US CHM is sending a negative message on credit quality, staying in the “deteriorating health” zone since 2015 (Chart 2). The structural declines in the profitability ratios (return on capital and operating margin), debt coverage and, more recently, short-term liquidity are the main causes of that deterioration in US corporate health. Not all the news is negative, however. While operating margins have clearly peaked, they remain at a very high level. The top-down interest coverage ratio is also improving, thanks to low corporate borrowing rates. That is a welcome development that will help extend the US credit cycle by keeping downgrade/default risk, and the credit spreads required to compensate for it, subdued. When looking at our bottom-up US CHMs, the story becomes more nuanced. The bottom-up US high-yield CHM is signaling a surprisingly positive story, spending the past two years in “improving health” territory. The bottom-up US IG CHM remains above the zero line, as has been the case since 2012 (Chart 3). The multi-year increase in the debt-to-equity ratio, and declines in return on capital and interest coverage over the same period, are the main reasons why US IG corporate health has worsened, even as profit margins have stayed high. Chart 2Top-Down US CHM: Steadily Worsening
Top-Down US CHM: Steadily Worsening
Top-Down US CHM: Steadily Worsening
Chart 3Bottom-Up US IG CHM: Some Areas Of Concern
Bottom-Up US IG CHM: Some Areas Of Concern
Bottom-Up US IG CHM: Some Areas Of Concern
The bottom-up US HY CHM is signaling a more positive story, spending the past two years in “improving health” territory (Chart 4), led by stable balance sheet leverage and improvements in operating margins and return on capital. The absolute levels of interest and debt coverage ratios for US HY remain low – a potential future risk for US HY when the US economy goes into its next prolonged downturn. One common signal from all our US CHMs, both top-down and bottom-up, is that short-term liquidity ratios have declined. Those moves are driven by increases in the denominator of the ratios (the market value of assets for the top-down CHM, and the value of current liabilities in the bottom-up CHMs), rather than declines in working capital or cash on corporate balance sheets – trends that would typically precede periods of corporate distress. Just last week, we downgraded US IG to neutral, while maintaining an overweight tilt on US HY.1 The rationale for the move was based on value, as spreads for all US IG credit tiers had tightened to our spread targets, which is not yet the case for HY. The message from our bottom-up US CHMs supports that recommendation. The combination of improving global growth and a Fed that will stay dovish until US inflation has sustainably moved higher paints a favorable backdrop for the relative performance of all US corporate debt versus Treasuries. However, given our expectation that US bond yields will continue to move higher over the next 6-12 months, the lower interest rate duration of US HY relative to IG also supports favoring the former over the latter (Chart 5). Chart 4Bottom-Up US HY CHM: Looking Better Than IG (!)
Bottom-Up U.S. HY CHM: Looking Better Than IG (!)
Bottom-Up U.S. HY CHM: Looking Better Than IG (!)
Chart 5US Corporates: Stay Overweight HY & Neutral IG
U.S. Corporates: Stay Overweight HY & Neutral IG
U.S. Corporates: Stay Overweight HY & Neutral IG
Euro Corporate Health Monitors: Some Cyclical Weakness Our bottom-up euro area CHMs are sending different messages for lower-rated and higher-quality issuers, similar to the divergence in our bottom-up US CHMs. For euro area IG, the gap between domestic and foreign issuers has been widening, with the former now in “deteriorating health” territory (Chart 6). Leverage has gone up for all issuers, with debt/equity ratios now above 100%, but the pace of increase has been faster for domestic issuers. Return on capital and profit margins for domestic issuers have declined since the start of 2018 alongside the prolonged slowing of euro area economic growth. For domestic euro area IG issuers, interest coverage has been steadily climbing since 2015 when the ECB went to negative rates and, more importantly, started its Asset Purchase Program that included corporate debt. Our bottom-up euro area CHMs are sending different messages for lower-rated and higher-quality issuers, similar to the divergence in our bottom-up US CHMs. For euro area HY, the signal from the bottom-up CHM is more positive for both domestic and foreign issuers (Chart 7), with both CHMs sitting just in the “improving health” zone. Leverage has declined, but profit-based metrics have worsened for both sets of issuers. Interest/debt coverage and liquidity, however, are far worse for domestic issuers than foreign issuers. Chart 6Bottom-Up Euro Area IG CHMs: Weak Growth Hitting Domestic Issuers
Bottom-Up Euro Area IG CHMs: Weak Growth Hitting Domestic Issuers
Bottom-Up Euro Area IG CHMs: Weak Growth Hitting Domestic Issuers
Chart 7Bottom-Up Euro Area HY CHMs: Healthy, But Leverage Now Rising
Bottom-Up Euro Area HY CHMs: Healthy, But Leverage Now Rising
Bottom-Up Euro Area HY CHMs: Healthy, But Leverage Now Rising
Within the euro area, our bottom-up IG CHMs for Core and Periphery countries have worsened over the past year, from healthy levels, with both above the zero line (Chart 8). Interest coverage is considerably stronger for Core issuers, although profitability metrics are remarkably similar. Short-term liquidity ratios have also fallen for both regional groups over the past year. We have maintained a moderate overweight stance on euro area corporates, both for IG and HY, since the summer of this year (Chart 9). This view was based on expectations that the European Central Bank (ECB) would ease monetary policy, not on a forecast that euro area growth would revive organically. That outcome came to fruition when the ECB cut rates in September and restarted asset purchases earlier this month. The ECB’s moves create a more supportive monetary backdrop (along with an undervalued euro) that will help keep euro area credit spreads tight – a trend that is reinforced by decent corporate health. Chart 8Bottom-Up Euro Area Regional IG CHMs: Heading In The Wrong Direction
Bottom-Up Euro Area Regional IG CHMs: Heading In The Wrong Direction
Bottom-Up Euro Area Regional IG CHMs: Heading In The Wrong Direction
Chart 9Euro Area Corporates: Stay Overweight IG & HY
Euro Area Corporates: Stay Overweight IG & HY
Euro Area Corporates: Stay Overweight IG & HY
Chart 10Relative Bottom-Up CHMs: Turning In Favor Of The US?
Relative Bottom-Up CHMs: Turning In Favor Of The US?
Relative Bottom-Up CHMs: Turning In Favor Of The US?
We see no reason to alter our recommendations on euro area credit, based on our forecast of better global growth, with no change to the ECB’s ultra-accommodative monetary stance, in 2020. However, a stronger growth backdrop could benefit euro area HY performance more than IG, based on the comparatively healthier signal from the bottom-up euro area HY CHM. The gap between the combined IG/HY bottom-up CHMs for the US and euro area aligns with credit spread differentials between euro area and US issuers (Chart 10).2 latest trends show a narrowing of the gap between the US and euro area CHMs, suggesting relative corporate health favors US names (middle panel). At the same time, the stronger performance of the US economy, which is much less levered to global trade and manufacturing compared to Europe, continues to support US corporate performance versus euro area equivalents (bottom panel). UK Corporate Health Monitor: Some Improvement, Even With Brexit Uncertainty Despite the persistent uncertainty over the UK-EU Brexit negotiations that has weighed on UK economic confidence, our top-down UK CHM remains in the "improving health" zone (Chart 11). All of the individual components are contributing to the strength of the CHM, which even improved from those healthy levels in Q2/2019 (the most recent data available). A sustained easing of UK financial conditions – easy monetary policy alongside a deeply undervalued currency – have helped boost interest/debt coverage ratios by keeping UK corporate borrowing costs low. Top-down operating margins for UK non-financial firms have surprisingly increased and now sit just under 25%. Short-term liquidity remains solid with leverage holding at non-problematic levels. As we discussed in a recent Special Report, the UK economy has been holding up fairly well despite the political uncertainty that has driven a prolonged slowdown in productivity growth through weak business investment.3 The UK consumer has continued to spend, however, seemingly desensitized to the political drama, and the labor market has remained tight enough to support a decent pace of household income growth. Despite the persistent uncertainty over the UK-EU Brexit negotiations, our top-down UK CHM remains in the "improving health" zone. The near term performance of the UK's economy is highly dependent on the final result of Brexit negotiations. If a negotiated Brexit occurs, UK corporates can start to ramp up the capital spending that has been delayed due to the political uncertainty, which will eventually lead to an improvement in UK productivity growth and overall corporate performance. A strengthening pound and rising government bond yields, driven by markets unwinding Brexit risk premia, will mitigate some of that growth thrust, but the net effect will still boost the relative performance of UK corporate debt versus Gilts. There are still near-term political risks stemming from the UK parliamentary election next month, with the deadline for a UK-EU Brexit deal delayed until after the election. Thus, we continue to maintain only a neutral stance on UK IG corporates in our model bond portfolio, despite our overall bias to be overweight global corporate debt versus government bonds. We will reconsider that stance after we have more clarity on the final resolution of the Brexit uncertainty. At a minimum, however, we expect UK corporates to continue to deliver solid excess returns versus UK Gilts (Chart 12). Chart 11UK Top-Down CHM: Solid Improvement, Despite Brexit
U.K. Top-Down CHM: Solid Improvement, Despite Brexit
U.K. Top-Down CHM: Solid Improvement, Despite Brexit
Chart 12UK Corporates: Stay Neutral
U.K. Corporates: Stay Neutral
U.K. Corporates: Stay Neutral
Japan Corporate Health Monitor: A Further Cyclical Deterioration Our bottom-up Japan CHM remains in the "deteriorating health" zone, as has been the case since the start of 2018 (Chart 13).4 The message from the individual CHM components, however, is that this is a cyclical, not structural, deterioration in Japanese corporate credit quality, and from a very healthy starting point. Leverage, defined here as the ratio of total debt to the book value of equity, is slightly above 100%, well below the 100-140% range seen between 2006 and 2015. A similar trend exists for return on capital, which has dipped below 5% but remains high relative to its history (although very low by global standards). Operating margins, debt coverage and short-term liquidity are down from recent peaks but all remain well above the lows of the decade since the 2008 financial crisis. Interest coverage has suffered a more meaningful deterioration relative to its history. However, this is more a cyclical issue related to falling profits (the numerator of the ratio) rather than rising interest costs (the denominator), with the latter remaining subdued thanks to the Bank of Japan’s hyper-easy monetary policy. For the former, the cyclical momentum in Japan’s economy is not improving, despite some recent evidence that global growth may be stabilizing. According to the latest Tankan survey, Japanese manufacturers – who saw profits fall -31% on a year-over-year basis in Q2/2019 - reported a worse business outlook than previously expected, both for large and small firms. This is not surprising, as Japan’s economy remains highly levered to global growth and export demand, in general, and China, in particular. Yet the less trade-sensitive services sector has also weakened – forecasts of the Tankan non-manufacturing index have already rolled over and the services PMI dropped to 49.7 in October. Japan’s corporate spread has widened slightly (+10bps) since the beginning of this year (Chart 14), in contrast to the spread tightening seen in other major developed economy corporate bond markets. This is sign that the markets have responded to the slowing growth momentum in Japan with a bit of a wider risk premium. Yet despite that widening, Japanese corporates with small positive yields continue to generate positive excess returns (on a duration-matched basis) versus Japanese Government Bonds (JGBs); yields on the latter will remain anchored near zero by the Bank of Japan’s Yield Curve Control policy. Thus, we continue to recommend an overweight stance on Japanese corporates vs JGBs as a buy-and-hold carry trade, even with the softening in our Japan CHM. Chart 13Japan Bottom-Up CHM: Cyclical Deterioration
Japan Bottom-Up CHM: Cyclical Deterioration
Japan Bottom-Up CHM: Cyclical Deterioration
Chart 14Japan Corporates: Stay Overweight Vs JGBs For Carry
Japan Corporates: Stay Overweight Vs JGBs For Carry
Japan Corporates: Stay Overweight Vs JGBs For Carry
Canada Corporate Health Monitors: Continuous Improvement Our top-down and bottom-up Canadian CHMs indicate an improving trend in Canadian corporate health, with both remaining in the “improving” zone as of the latest data available from Q2/2019 (Chart 15). The cyclical components (return on capital and operating margins) have gradually improved over the past three years, but remain relatively weak compared to history. Leverage is rising (now above 120% in our bottom-up CHM), but interest/debt coverage ratios remain steady and, in the case of the bottom-up CHM, have outright improved over the past year. We reviewed the Canadian economy last week5 and concluded that a Bank of Canada interest rate cut was unlikely because of signs of improving domestic growth momentum at a time when core inflation was at the midpoint of the BoC’s 1-3% target range. Overall, Canadian growth has been resilient in the face of the 2019 global manufacturing downturn, and should re-accelerate in the next year led by a firm consumer with rebounding housing and business investment. This should help boost the cyclical components of our Canada CHMs, especially if some improvement in global growth helps lift demand for Canadian commodity exports. We also introduced a framework to analyze Canadian corporate bonds in a Special Report published in late August.6 We concluded that Canadian companies’ financial health remains a positive for corporate bond returns on a cyclical basis, but high leverage and mediocre profitability were longer-term concerns. We also noted that the higher credit quality of Canadian corporates, where only 40% of the investment grade index is rated BBB, made them more potentially appealing on a creditworthiness basis relative to the lower quality markets in the US (50% BBB share) and euro area (52%). We continue to recommend an overweight position in Canadian corporate debt relative to Canadian government bonds as a carry trade. We continue to recommend an overweight position in Canadian corporate debt relative to Canadian government bonds as a carry trade. Spreads have held in a well-established range of 100-200bps since the 2009 recession (Chart 16), even during periods when our CHMs were indicating worsening corporate health. Accommodative monetary conditions and relatively low Canadian interest rates will continue to make Canadian corporates relatively attractive, in an environment of decent growth and firm corporate health. Chart 15Canada CHMs: Still Healthy, Despite Slower Growth
Canada CHMs: Still Healthy, Despite Slower Growth
Canada CHMs: Still Healthy, Despite Slower Growth
Chart 16Canadian Corporates: Stay Overweight Vs Canadian Govt. Debt
Canadian Corporates: Stay Overweight Vs Canadian Govt. Debt
Canadian Corporates: Stay Overweight Vs Canadian Govt. Debt
Robert Robis, CFA Chief Fixed Income Strategist rrobis@bcaresearch.com Ray Park, CFA Research Analyst ray@bcaresearch.com Appendix 1: An Overview Of The BCA Corporate Health Monitors The BCA Corporate Health Monitor (CHM) is a composite indicator designed to assess the underlying financial strength of the corporate sector for a country. The Monitor is an average of six financial ratios inspired by those used by credit rating agencies to evaluate individual companies. However, we calculate our ratios using top-down (national accounts) data for profits, interest expense, debt levels, etc. The idea is to treat the entire corporate sector as if it were one big company, and then look at the credit metrics that would be used to assign a credit rating to it. Importantly, only data for the non-financial corporate sector is used in the CHM, as the measures that would be used to measure the underlying health of banks and other financial firms are different than those for the typical company. The six ratios used in the CHM are shown in Table 1 below. To construct the CHM, the individual ratios are standardized, added together, and then shown as a deviation from the medium-term trend. That last part is important, as it introduces more cyclicality into the CHM and allows it to better capture major turning points in corporate well-being. Largely because of this construction, the CHM has a very good track record at heralding trend changes in corporate credit spreads (both for Investment Grade and High-Yield) over many cycles. Table 1Definitions Of Ratios That Go Into The CHMs
BCA Corporate Health Monitor Chartbook: Mixed Signals, But Growth Matters More
BCA Corporate Health Monitor Chartbook: Mixed Signals, But Growth Matters More
Top-down CHMs are now available for the US, euro area, the UK and Canada. The CHM methodology was extended in 2016 to look at corporate health by industry and by credit quality.7 The financial data of a broad set of individual US and euro area companies was used to construct individual “bottom-up” CHMs using the same procedure as the more familiar top-down CHM. Some of the ratios differ from those used in the top-down CHM (see Table 1), largely due to definitional differences in data presented in national income accounts versus those from actual individual company financial statements. The bottom-up CHMs analyze the health of individual sectors, and can be aggregated up into broad CHMs for Investment Grade and High-Yield groupings to compare with credit spreads. In 2018, we introduced bottom-up CHMs for Japan and Canada. With the country expansion of our CHM universe, we now have coverage for 92% of the Bloomberg Barclays Global Aggregate Corporate Bond Index (Appendix Chart 1). Appendix Chart 1We Now Have CHM Coverage For 92% Of The Developed Market Corporate Bond Universe
BCA Corporate Health Monitor Chartbook: Mixed Signals, But Growth Matters More
BCA Corporate Health Monitor Chartbook: Mixed Signals, But Growth Matters More
Footnotes 1 Please see BCA Research Global Fixed Income Strategy Weekly Report, “How Sweet It Is”, dated November 6, 2019, available at gfis.bcareseach.com. 2 We only use the CHMs for euro area domestic issuers in this aggregate bottom-up CHM, as this is most reflective of uniquely European corporate credits. This also eliminates double-counting from US companies that issue in the euro area market that are part of our US CHMs. 3 Please see BCA Research Global Fixed Income Strategy Special Report, “United Kingdom: Cyclical Slowdown Or Structural Malaise?”, dated September 20, 2019, available at gfis.bcaresearch.com. 4 We do not currently have a top-down CHM for Japan given the lack of consistent government data sources for all the necessary components. 5 Please see BCA Research Global Fixed Income Strategy Weekly Report, “How Sweet It Is”, dated November 6, 2019, available at gfis.bcaresearch.com. 6 Please see BCA Research Global Fixed Income Strategy Special Report, “The Great White North: A Framework For Analyzing Canadian Corporate Bonds”, dated August 28, 2019, available at gfis.bcaresearch.com. 7 Please see Section II of The Bank Credit Analyst, “U.S. Corporate Health Gets A Failing Grade”, dated February 2016, available at bca.bcaresearch.com. Appendix 2: US Bottom-Up CHMs For Selected Sectors
APPENDIX 2: ENERGY SECTOR
APPENDIX 2: ENERGY SECTOR
APPENDIX 2: MATERIALS SECTOR
APPENDIX 2: MATERIALS SECTOR
APPENDIX 2: COMMUNICATIONS SECTOR
APPENDIX 2: COMMUNICATIONS SECTOR
APPENDIX 2: CONSUMER DISCRETIONARY SECTOR
APPENDIX 2: CONSUMER DISCRETIONARY SECTOR
APPENDIX 2: CONSUMER STAPLES SECTOR
APPENDIX 2: CONSUMER STAPLES SECTOR
APPENDIX 2: HEALTH CARE SECTOR
APPENDIX 2: HEALTH CARE SECTOR
APPENDIX 2: INDUSTRIALS SECTOR
APPENDIX 2: INDUSTRIALS SECTOR
APPENDIX 2: TECHNOLOGY SECTOR
APPENDIX 2: TECHNOLOGY SECTOR
APPENDIX 2: UTILITIES SECTOR
APPENDIX 2: UTILITIES SECTOR
The GFIS Recommended Portfolio Vs. The Custom Benchmark Index
BCA Corporate Health Monitor Chartbook: Mixed Signals, But Growth Matters More
BCA Corporate Health Monitor Chartbook: Mixed Signals, But Growth Matters More
Recommendations Duration Regional Allocation Spread Product Tactical Trades Yields & Returns Global Bond Yields Historical Returns
Feature Chart I-1Lebanese Bond Yields Have Surged To Precarious Levels
Lebanese Bond Yields Have Surged To Precarious Levels
Lebanese Bond Yields Have Surged To Precarious Levels
In a May 2018 Special Report, we warned that a devaluation and government default were only a matter of time in Lebanon. The country's sovereign US dollar bond yields have now reached a whopping 21% and local currency interest rates stand at 18% (Chart I-1). On the black market, the Lebanese pound is already trading 12% below its official rate. A public run on banks and bank deposit moratorium, as well as public debt default and a massive currency devaluation are now unavoidable. A Classic Case Of EM Bank Run And Currency Devaluation… The current state of Lebanon’s balance of payments (BoP) is disastrous: The current account (CA) deficit has oscillated between 10% and 20% of GDP in the past 10 years (Chart I-2). This wide CA deficit has been funded by speculative portfolio flows into local currency government bonds, sovereign bonds and bank deposits. However, since the middle of 2018 these inflows have dried up. In turn, to defend the currency peg to the US dollar and avoid a currency depreciation in the face of the BoP deficit, the Central Bank of Lebanon (BDL) has been depleting its foreign exchange (fx) reserves, i.e., the central bank has been financing the BoP deficit (Chart I-3). Chart I-2Lebanon's Chronic Current Account Deficit
Lebanon's Chronic Current Account Deficit
Lebanon's Chronic Current Account Deficit
Chart I-3Lebanon: The BoP Has Been Deteriorating Substantially
Lebanon: The BoP Has Been Deteriorating Substantially
Lebanon: The BoP Has Been Deteriorating Substantially
BDL’s gross fx reserves – including gold – have dropped from $48 billion in 2018 to its current level of $43 billion. We estimate that BDL’s net foreign exchange reserves excluding commercial banks’ US dollar deposits at BDL are at just $26 billion. This amount is insufficient in light of the panic-induced outflows the country and the banking system are experiencing.1 As a result of the two-week long bank shutdown amid massive protests, confidence in the banking system is quickly collapsing and capital is leaving Lebanon. Chart I-4Depositors’ Are Heading For The Exit
Depositors' Are Heading For The Exit
Depositors' Are Heading For The Exit
Worryingly, as a result of the two-week long bank shutdown amid massive protests, confidence in the banking system is quickly collapsing and capital is leaving Lebanon.2 Moreover, after opening their doors, Lebanese commercial banks are now imposing unofficial capital controls – they are paying US dollar deposits in local currency only and are no longer providing dollar-denominated credit lines to businesses and importers. This will only intensify the panic among depositors. Chart I-4 illustrates that local currency deposits have already been declining while US dollar deposits have been slowing, and will likely begin contracting soon. In short, capital outflows will intensify in the coming weeks as people and businesses quickly realize that banks cannot meet their demand for deposits. Critically, we suspect Lebanese commercial banks are short on US dollars to meet people’s demand for the hard currency. Commercial banks’ net foreign currency assets stand at negative $70 billion or 127% of GDP. They hold, roughly, somewhere around $20 billion worth of US dollars in the form of liquid and readily available deposits (in banks abroad and deposits in the central bank) versus $124 billion worth of dollar deposits. Over the years, Lebanese commercial banks have been an attractive place for investors and residents to park their US dollars given the high interest rate paid by the banks. In turn, Lebanese commercial banks have been converting these US dollar deposits into local currency in order to buy government bonds. With domestic bonds yielding well above the rates on US dollar deposits - and given the exchange rate peg to the dollar - commercial banks have been de facto playing the carry trade. In addition, commercial banks also lent some of these dollars directly to the private sector. With the economy collapsing and the widening dollar shortage, banks will not be able to either collect their dollar loans or purchase dollars in the market. Without new dollar funding – which is very likely to persist – banks will fail to meet the demand for dollars. As a result, a bank run is imminent. At this point, the sole option is for the central bank to keep pushing local interest rates higher to discourage capital flight and a run on the banks. Yet, at 18% and surging, interest rates will suffocate the Lebanese economy and the property market. This will dampen sentiment further and cause a bank run. Bottom Line: A bank run is brewing and bank moratorium as well as currency devaluation are inevitable. …As Well As Public Debt Default Lebanese commercial banks are not only being squeezed by capital outflows and deposit withdrawals, they are also about to face a public debt default. Chart I-5Public Debt Dynamics Are Toxic
Public Debt Dynamics Are Toxic
Public Debt Dynamics Are Toxic
Lebanese commercial banks are not only being squeezed by capital outflows and deposit withdrawals, they are also about to face a public debt default. Commercial banks own 37% of outstanding government debt. This will come on top of skyrocketing private-sector non-performing loans and will push banks into outright bankruptcy. Lebanon’s fiscal and public debt dynamics have reached untenable levels. The fiscal deficit stands at 10% of GDP and total public debt stands at 150% of GDP (Chart I-5). Surging government borrowing costs will push interest payments as a share of government aggregate expenditures to extremely high levels. These are unsustainable fiscal and debt arithmetics (Chart I-6). Meanwhile, government revenues will decline as growth falters (Chart I-6, bottom panel). The pillars of the Lebanese economy – private credit growth and construction activity – have been already collapsing (Chart I-7). Chart I-6Surging Interest Rates Will Make Public Debt Servicing Impossible
Surging Interest Rates Will Make Public Debt Servicing Impossible
Surging Interest Rates Will Make Public Debt Servicing Impossible
Chart I-7Lebanon: Domestic Economy Has Been Collapsing
Lebanon: Domestic Economy Has Been Collapsing
Lebanon: Domestic Economy Has Been Collapsing
Bottom Line: The Lebanese government will be forced to default on both local currency and dollar debt. This will be the final nail in the coffin of the Lebanese banking system. Ayman Kawtharani Editor/Strategist ayman@bcaresearch.com Footnotes 1 BDL does not publish its holding of net foreign exchange reserves. However, other estimates of BDL’s net fx reserves are even lower. Please refer to the following paper: Financial Crisis In Lebanon, by Toufic Gaspard and the following article: Lebanon Warned on Default and Recession as Its Reserves Decline. 2 Banks shut down allegedly as a result of the ongoing civil disobedience that was sparked by the government’s reckless decision to tax WhatsApp's call service. The protests quickly escalated to a country-wide uprising, causing the government to resign on October 29.
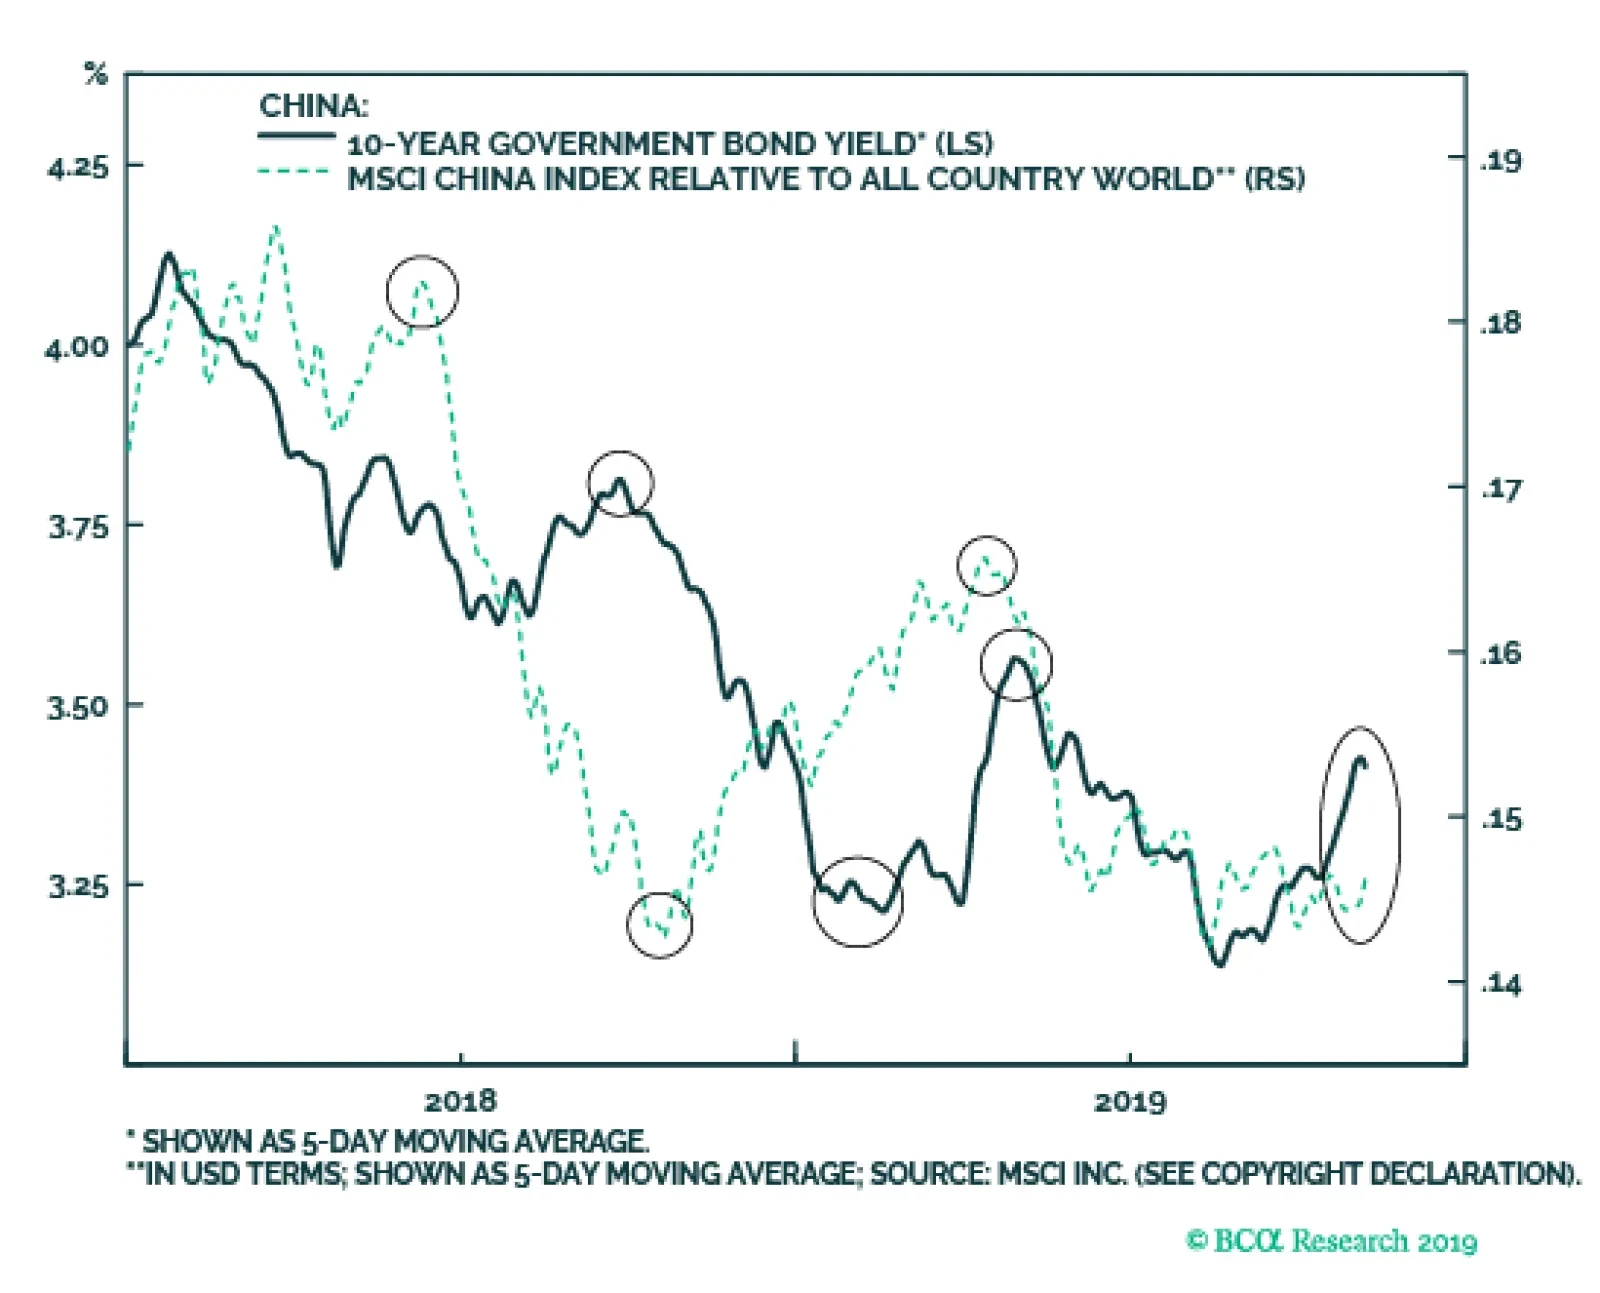
Chinese 10-year government bond yields have risen roughly 15 bps over the past month, and are now 30 bps off of their mid-August low. Many market participants view Chinese government bond yields as a leading growth barometer, but 10-year yields have actually…
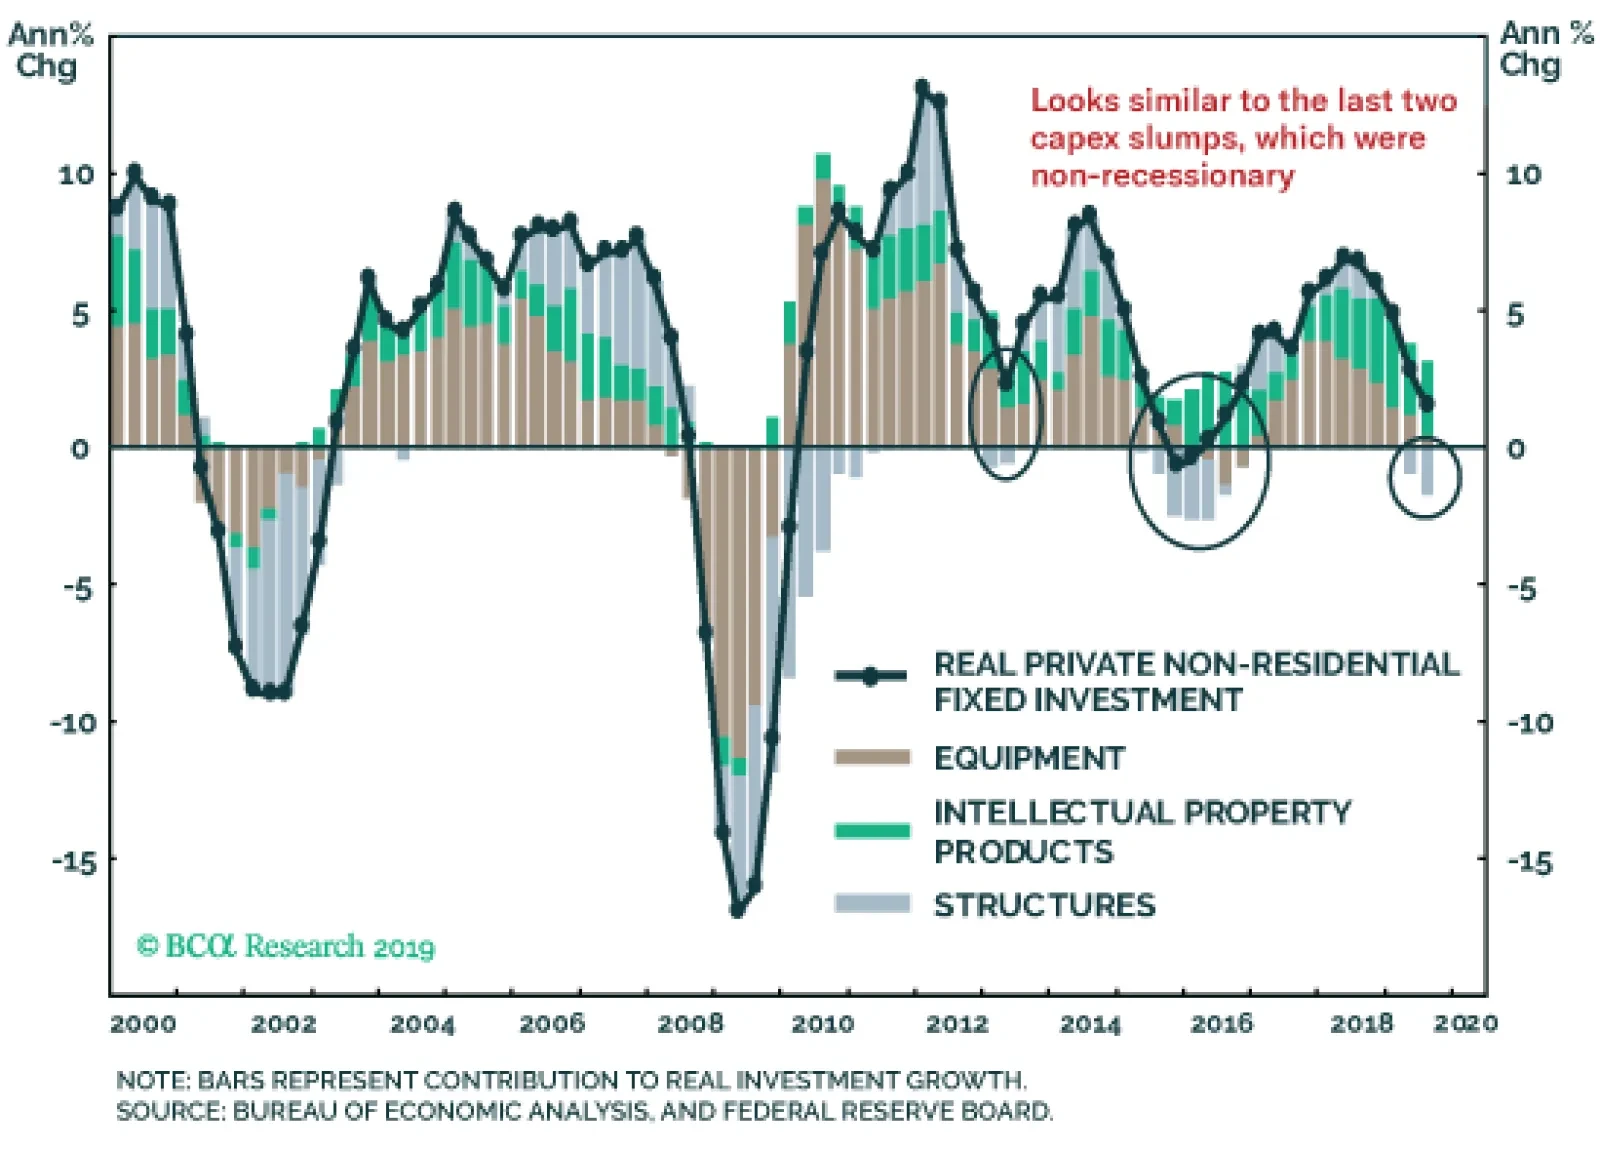
As noted in the previous Insight, U.S. capital spending has slowed, but the bulk of the deceleration has come from buildings and construction – the component of capital spending where it is easiest to delay or cancel investment plans. This is not necessarily…
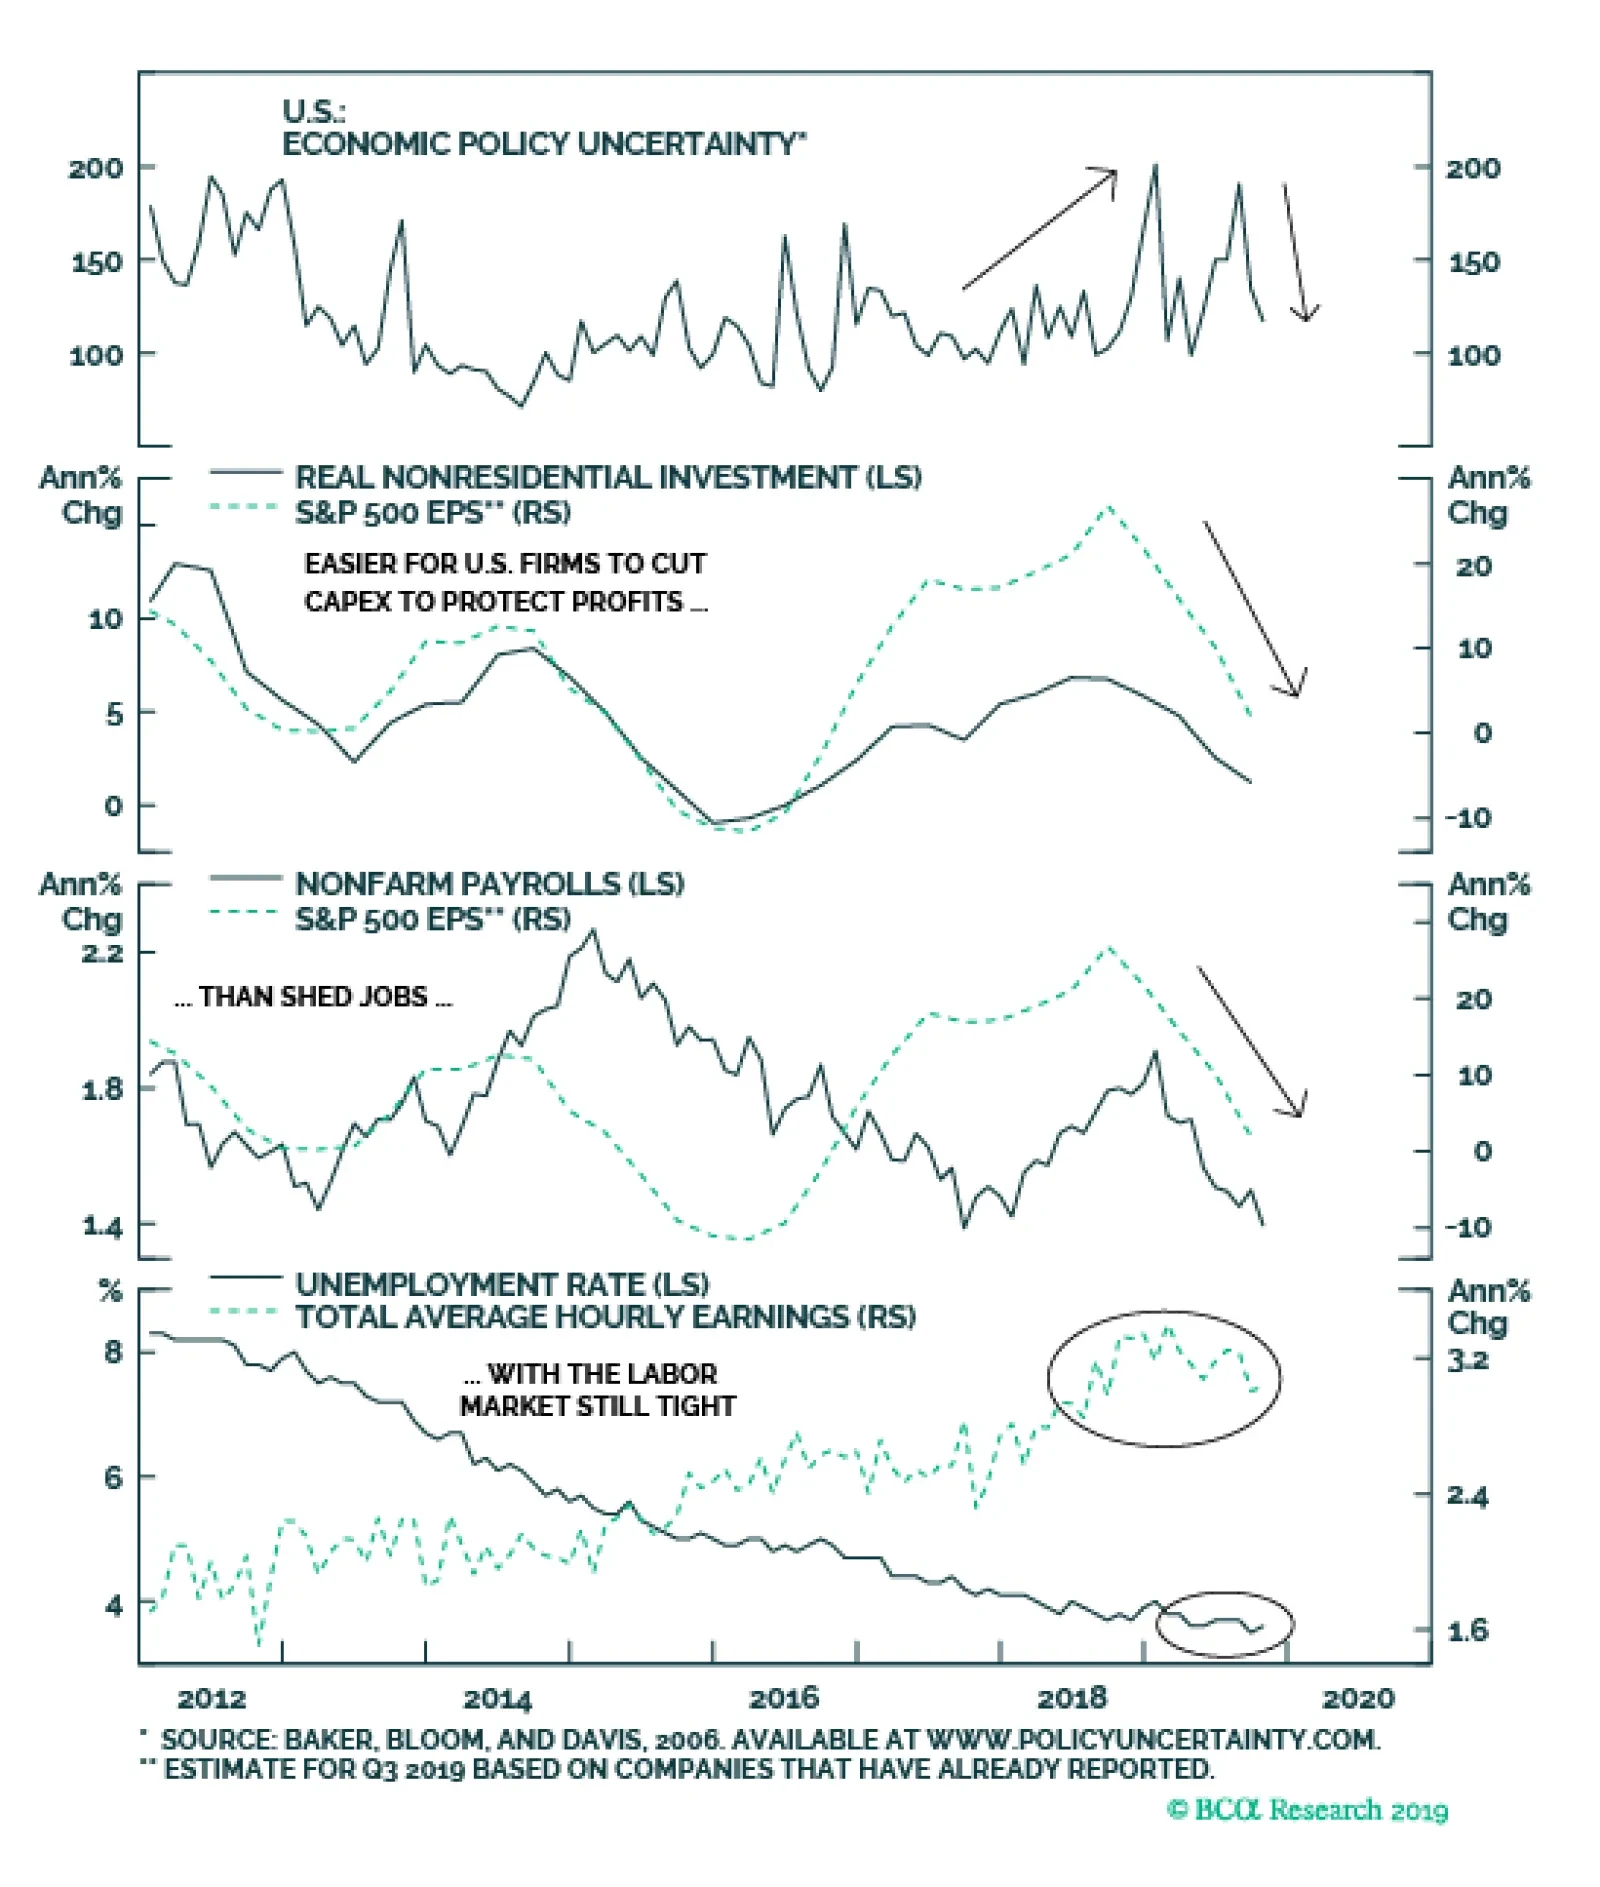
The trade war with China and the global manufacturing recession have had a clear negative impact on business confidence. This much is evident from downbeat results of the Conference Board’s CEO survey. At the same time, U.S. capital spending contracted in…
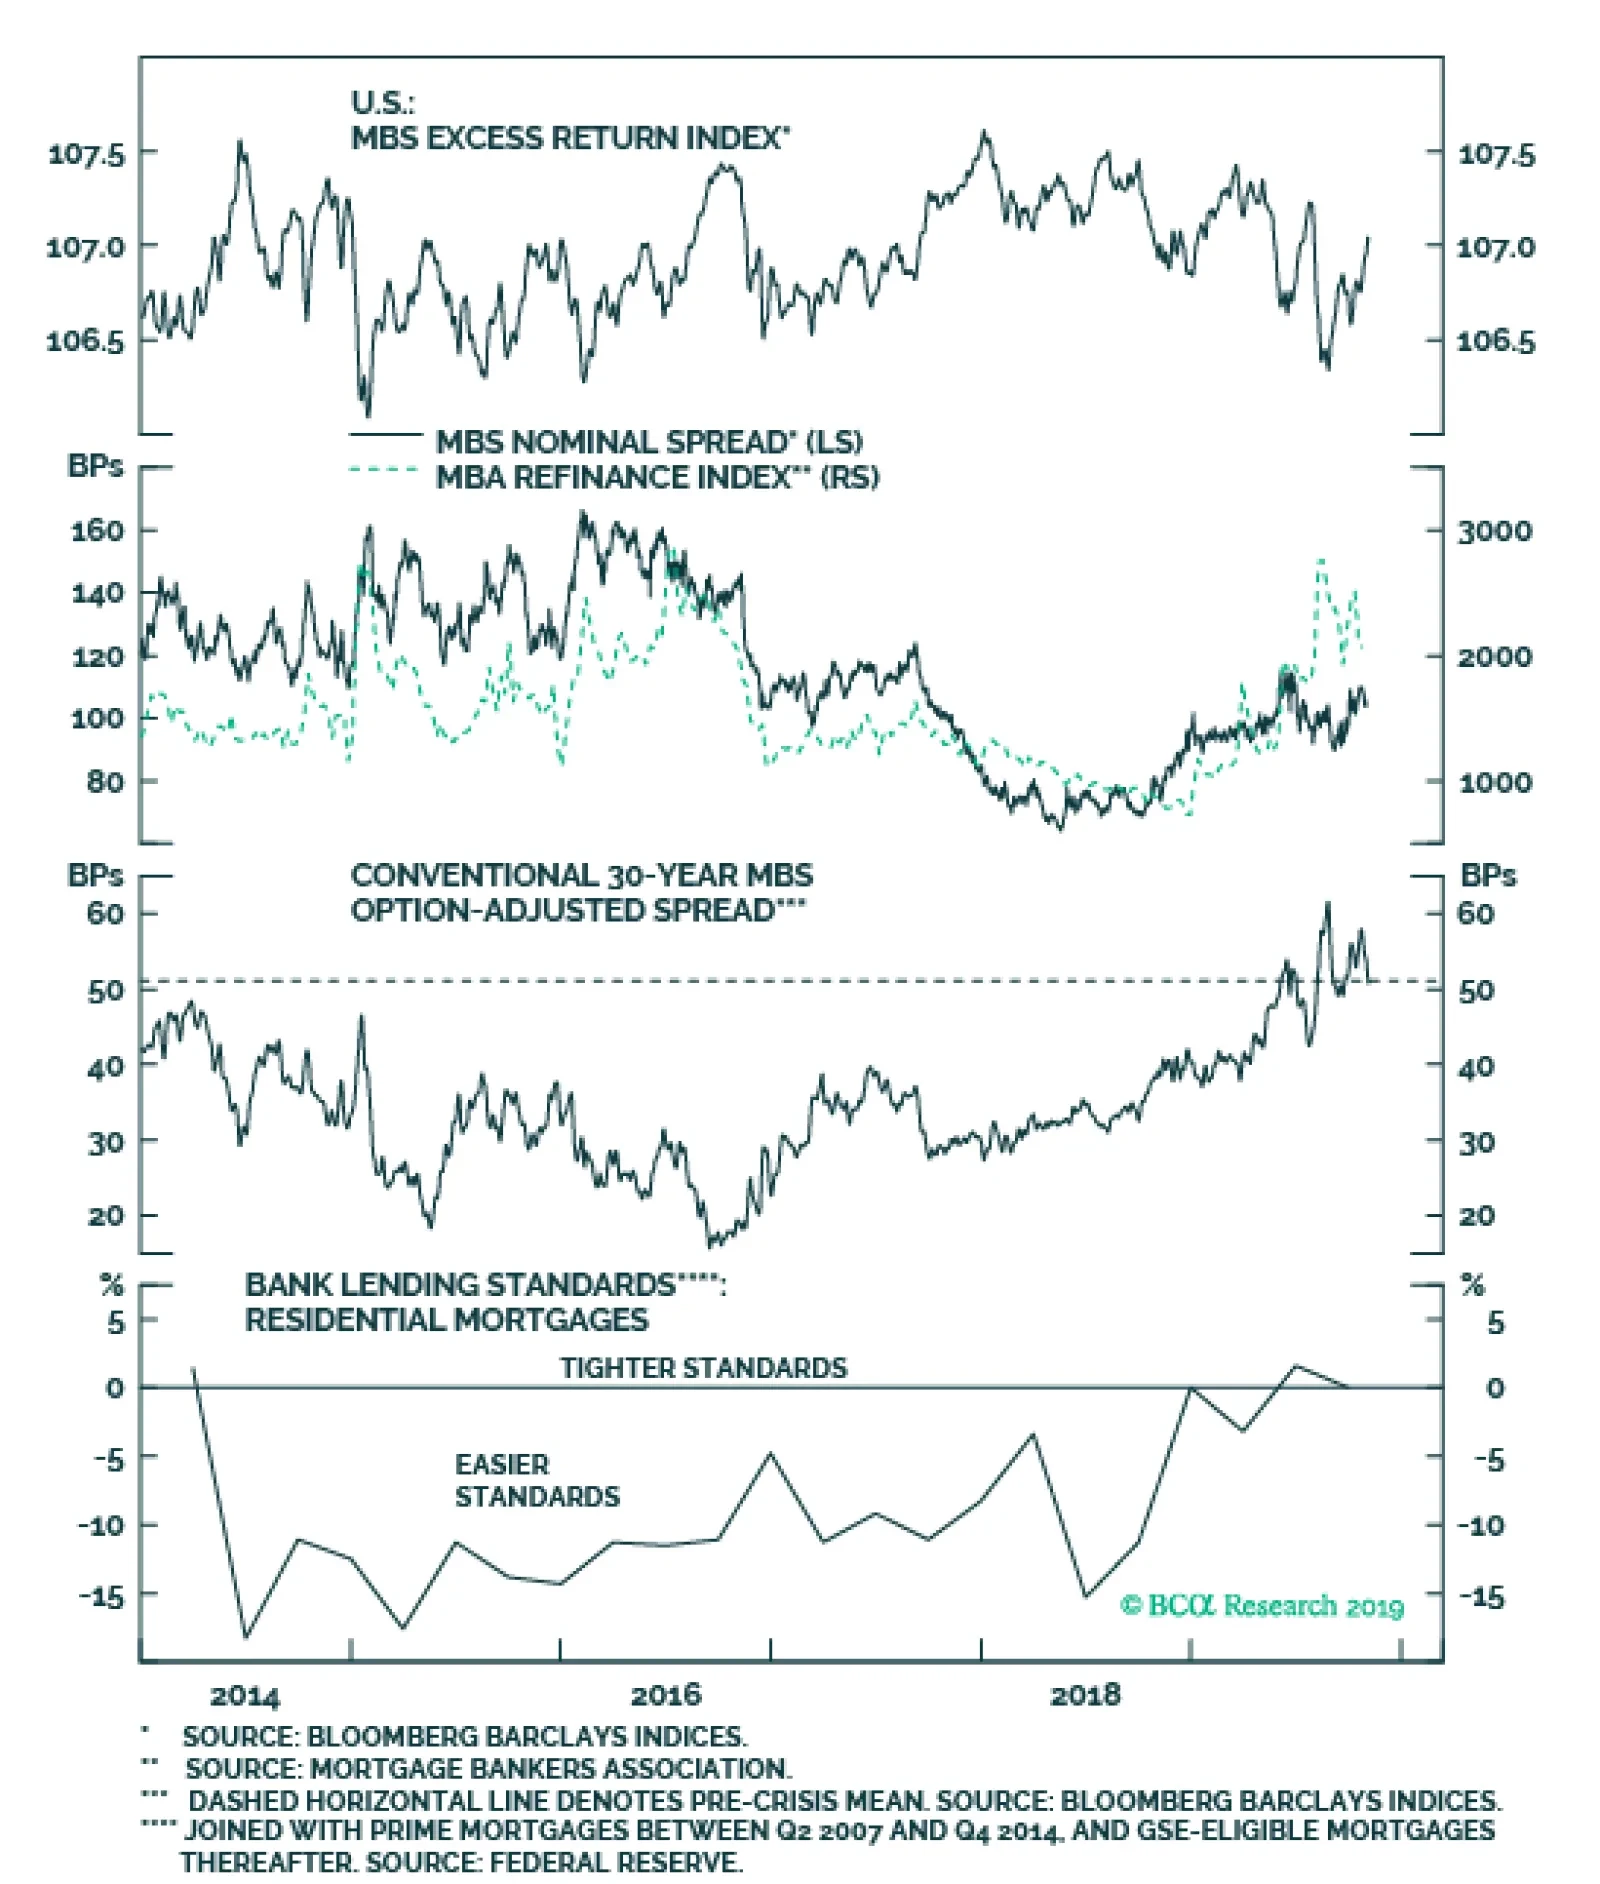
It looks like a good time for U.S. bond investors to shift some allocation into Agency MBS. In particular, our U.S. Bond Strategy service recommends favoring Agency MBS over corporate bonds rated A or higher, for three reasons. First, expected compensation…
Highlights Global: Global growth momentum is bottoming out, leading indicators are improving, inflation is subdued, and central bankers are biased to maintain accommodative monetary policies. This is a bullish “sweet spot” for financial markets, suggesting further upside for global risk assets like equities and corporate credit, especially relative to government bonds. US: The overall US economy is weathering the storm from the global manufacturing slump, which is showing signs of bottoming out. Stay below-benchmark on US Treasury duration, with an initial yield target of 2.25% for the benchmark 10-year. Canada: The Bank of Canada is hinting that “insurance” rate cuts may be needed, but with the Canadian economy and inflation both remaining resilient, the central bank is more likely to keep rates steady until global growth improves. Stay neutral on Canadian government bonds, for now, but prepare to move to underweight in early 2020. Feature After knocking on the door several times in recent weeks, global equity markets are finally enjoying a true breakout. In the U.S., the S&P 500 is setting new all-time highs on a daily basis, while equities in Europe and emerging markets (EM) are also registering solid gains. There is no conflicting signal from global corporate credit markets where spreads remain stable, or from the volatility space with measures like the US VIX index hovering near the 2019 lows. Chart Of The WeekThings Are Looking Up
Things Are Looking Up
Things Are Looking Up
Despite this positive price action, many remain skeptical that this “risk rally” is sustainable. Just last week, a headline in the Financial Times declared that the “U.S. stock market’s new highs baffles investors”. We find that reluctance to accept the equity market strength to be even more baffling, as the current macro backdrop is a perfect “sweet spot” for risk assets to do well. Global economic momentum is bottoming out, with improving leading indicators suggesting better days lie ahead for growth. A majority of central banks worldwide have eased monetary policy over the past several months, providing a more supportive liquidity backdrop for financial markets. The world’s most important central bank, the Federal Reserve, has delivered a cumulative -75bps of rate cuts since July, helping to cool off the US dollar, which is now flat on a year-over-year basis in trade-weighted terms (Chart Of The Week). A softening dollar is also often a signal that global growth is improving, as it indicates a shift in capital flows into more economically-sensitive non-U.S. markets like Europe and EM. Thus, a weaker greenback combined with better global growth prospects should help lift global bond yields by raising depressed inflation expectations (middle panel). The “sweet spot” of accelerating growth and easy money will support the continued outperformance of global equities and credit over government bonds, in an environment of gently rising bond yields. Yet with policymakers worldwide still playing the stimulus game, fearful of persistent negative impacts on growth from the U.S.-China trade dispute and other political uncertainties, it will take a large and sustained increase in inflation expectations before there is any shift to a more hawkish global policy bias. This is critical for bond markets, as a much bigger move higher in global bond yields would require not just a pricing out of rate cut expectations, but the pricing in of future rate hikes. Such a repricing will not occur before there is clear evidence that global growth, broadly speaking, is accelerating for a sustained period and not just stabilizing in a few countries. The earliest we can envision such a hawkish shift for global monetary policy would be late in 2020, led by the Fed signaling a removal of some of the “insurance” rate cuts of 2019. Until that happens, the “sweet spot” of accelerating growth and easy money will support the continued outperformance of global equities and credit over government bonds, in an environment of gently rising bond yields. The Art Of Analyzing Economic Data At Turning Points Typically, at turning points in the global growth cycle, there are always data available to support the arguments of both optimists and pessimists. That is certainly the case today, where so-called “hard” economic data that is reported with a lag (i.e. exports, durable goods orders) remains weak, but leading indicators are starting to improve. For example, the global manufacturing PMI data for October released last week shows the following (Chart 2): strong pickup in China, with the Caixin manufacturing PMI now up to 51.7; slight improvement in the US ISM manufacturing index, which rose from 47.8 to 48.3 in the month but remains below the 50 boom/bust line; bounce in the U.K. Markit manufacturing PMI index, rising from 48.3 to 49.6; the slightest of increases in the overall euro area Markit manufacturing PMI, from 45.7 to 45.9, still below the 50 line but showing marginal improvement in the critical German PMI; Continued weakness in the Japanese Markit manufacturing PMI, which fell to 48.4. The relative message from the PMIs fits with the signals sent from the OECD leading economic indicators (LEI) for those same countries, with the China LEI strengthening the most and the LEIs in Europe and Japan still struggling. The US is a mixed bag, with the ISM ticking up but the LEI languishing. There is, however, a sign of optimism in the export sub-index of the ISM manufacturing data. That measure surged nine points in October from 41.0 to 50.4, signaling a potential bottoming of the overall ISM index within the next three months (Chart 3). While the ISM exports index is volatile, the modest improvement seen in the export order series from the China manufacturing PMI over the past few months (bottom panel) suggests that there may be a more significant improvement in global trade activity brewing – as signaled by the improvement in our global LEI index. Another possible explanation for the reduction in U.S. capital spending is slowing growth in corporate profits, which is related to a number of factors beyond the impact of tariffs and the trade war. Chart 2Global PMIs Are A Mixed Bag
Global PMIs Are A Mixed Bag
Global PMIs Are A Mixed Bag
Chart 3Momentum Turning For The Trade Warriors?
Momentum Turning For The Trade Warriors?
Momentum Turning For The Trade Warriors?
Bottom Line: Global growth momentum is bottoming out, leading indicators are improving, inflation is subdued, and central bankers are biased to maintain accommodative monetary policies. This is a bullish “sweet spot” for financial markets, suggesting further upside for global risk assets like equities and corporate credit, especially relative to government bonds. US Capital Spending Slowdown: Only A Cautious Pause Chart 4Rising Uncertainty? Or Just Slowing Profit Growth?
Rising Uncertainty? Or Just Slowing Profit Growth?
Rising Uncertainty? Or Just Slowing Profit Growth?
For growth pessimists in the US, a modest boost to “soft” data like the ISM does not allay their concerns about a broadening US economic slowdown. The trade war with China and the global manufacturing recession have had a clear negative impact on business confidence when looking at measures like the Conference Board CEO survey. At the same time, US capital spending has contracted in real terms during the 2nd and 3rd quarter of 2019. A logical inference would be to say that uncertainty over the trade war has led to a reduction in capex. Another possible explanation for the reduction in U.S. capital spending is slowing growth in corporate profits, which is related to a number of factors beyond the impact of tariffs and the trade war. Like the fading impact of the 2018 U.S. corporate tax cuts (that helped trigger a surge in after-tax earnings growth) and the squeeze on profit margins from higher labor costs. On a year-over-year basis, US profit growth has slowed from nearly 25% in 2018 to 1.8% in the 3rd quarter (a projection based on the 76% of S&P 500 companies that have already reported). The real non-residential investment spending category from the US GDP accounts has slowed alongside profits, from 6.8% to 1.3% on a year-over-year basis (Chart 4). At the same time, annual growth in US non-farm payrolls has slowed only modestly from 1.91% to 1.4%, with average hourly earnings growth falling from a 2019 peak of 3.4% to 3.0% in October. Given the tightness of the US labor market, with firms continuing to report difficulties in finding quality labor, it should come as no surprise that employment and wages have not slowed as much as capital spending, despite the sharp downturn in profit growth. Businesses that see their earnings getting squeezed will seek to protect profits by cutting back on investment and hiring activity. With a tight labor market, however, cutting capital spending is an easier and less costly decision than laying off workers, as it may be even harder to re-hire those employees if the economy starts to improve once again. With the US Treasury curve no longer inverted, after -75bps of Fed rate cuts and with longer-dated Treasury yields starting to increase, the US economy is stepping back from the recessionary abyss that worried investors during the summer. That can also be seen when breaking down the US non-residential investment data into its broad sub-components (Chart 5). On a contribution-to-growth basis, the only part of US investment spending that is outright contracting year-over-year is Structures. There is still modest positive annual growth in Equipment investment, although that did contract on a quarter-on-quarter basis in Q3/2019. The Intellectual Property Products category (which includes Software, in addition to Research & Development) continues to expand at a steady pace. Chart 5Slowing US Capex Focused On Structures
How Sweet It Is
How Sweet It Is
Chart 6The Fed Has Dis-Inverted The UST Curve
The Fed Has Dis-Inverted The UST Curve
The Fed Has Dis-Inverted The UST Curve
So similar to signals from global PMIs and LEIs, the U.S. capital spending and employment data are sending a mixed message about U.S. growth. Yes, capital spending has slowed but the bulk of the deceleration has come in the component where canceling or delaying investment plans is easiest – buildings and construction. It is not necessarily an indication that a deeper economic downturn is unfolding. Similar cutbacks in Structures investment, without a broader decline in overall capital spending, occurred in 2013 and 2015/16. During the past two U.S. recessions in 2001 and 2008, however, all categories of capital spending contracted. If we look at the breakdown of the contribution to US investment spending today, the backdrop looks more like those non-recessionary years. With the US Treasury curve no longer inverted, after -75bps of Fed rate cuts and with longer-dated Treasury yields starting to increase, the US economy is stepping back from the recessionary abyss that worried investors during the summer (Chart 6). The trade détente between the US and China will help boost depressed business confidence, especially with global growth already showing signs of bottoming out. This, along with a softer US dollar and some easing of wage pressures, will help put a floor underneath US corporate profit growth. Treasury yields have more upside from here, as markets are still priced for -25bps of Fed rate cuts over the next year that is unlikely to happen if the US economy rebounds, as we expect. Bottom Line: The overall US economy is weathering the storm from the global manufacturing slump, which is showing signs of bottoming out. Stay below-benchmark on US Treasury duration, with an initial yield target of 2.25% for the benchmark 10-year. The Bank Of Canada’s Newfound Caution Is Unwarranted Chart 7Canada Is A High-Beta Bond Market
Canada Is A High-Beta Bond Market
Canada Is A High-Beta Bond Market
The Bank of Canada (BoC) has been one of the few central banks to resist the shift towards easier global monetary policy in 2019. This has resulted in Canadian government bonds trading at relatively wide yield spreads to other countries in the developed world, even as global growth has slowed in 2019 (Chart 7). With global growth now set to improve over the next 6-12 months, Canada’s historic status as a “high yield beta” bond market during periods of rising global yields suggests that Canadian government bonds should underperform in 2020. However, in the press conference following last week’s policy meeting, BoC Governor Stephen Poloz noted that the BoC was “mindful that the resilience of Canada’s economy will be increasingly tested as trade conflicts and uncertainty persist.” Poloz even revealed that an “insurance” rate cut was discussed at the policy meeting, although the BoC Governing Council decided against it. This is similar language to that parroted by the more dovish global central bankers over the past several months, raising the risk that Canada could be a lower-beta bond market if the Canadian economy falters. That outcome seems unlikely, given the indications of improving growth momentum, occurring alongside tight labor markets and stable inflation: The RBC/Markit Canadian manufacturing PMI has climbed from a trough of 49 in May to 51 in October, indicating that real GDP growth accelerated in Q3 (Chart 8, top panel); The BoC’s Autumn 2019 Business Outlook Survey (BoS) showed that an increasing share of firms are reporting labor shortages, coinciding with a sharp pickup in the annual growth rate of average weekly earnings to just over 4% (middle panel); Core inflation measures remain right at the midpoint of the BoC’s 1-3% target range, although breakeven inflation rates from Canadian Real Return Bonds remain closer to the bottom end of that range (bottom panel); After a long period of adjustment, house prices and housing activity are showing some signs of recovery in response to easier financial conditions, rising household incomes and improved affordability (Chart 9); Chart 8Resilience In Canadian Growth & Inflation
Resilience In Canadian Growth & Inflation
Resilience In Canadian Growth & Inflation
Chart 9Canadian Housing Showing Improvement
Canadian Housing Showing Improvement
Canadian Housing Showing Improvement
Canadian investment spending is set to pick up, as the Autumn 2019 BoS reported a modest improvement in overall business sentiment and an increase in capital spending plans with a growing number of firms facing capacity pressures (Chart 10). Our bias is to downgrade Canadian government bonds to underweight heading into 2020, as we expect a return to their typical high-beta status during a period of accelerating global growth and rising bond yields. Chart 10Signs Of Life For Canadian Capex?
Signs Of Life For Canadian Capex?
Signs Of Life For Canadian Capex?
Looking forward, reduced U.S.-China trade tensions should provide a boost to Canadian capex. Firms that had previously held off in the past few months due to the slowdown in the economy, caused partially by worries over global trade, will start to invest again. The BoC’s updated forecasts in the latest Monetary Policy Report released last week showed that the central bank expects Canadian exports to resume their expansion in 2020 – despite Governor Poloz’s stated concerns over global growth. Oil and gas exports are expected to improve as pipeline and rail capacity gradually expand, while consumer goods excluding automobiles should remain strong. Improvement in Chinese economic activity would provide a meaningful lift to Canadian exports, as Chinese imports from Canada are still contracting at a double-digit rate (Chart 11). More importantly, Canadian exports to the country’s largest trade partner, the US, have already stabilized and should accelerate as the US economy gains momentum in the next 6-12 months. As Governor Poloz mentioned during the press conference, the BoC's decisions are not going to be directly influenced by political events such as Prime Minister Justin Trudeau’s recent re-election. Yet the odds of Canadian fiscal stimulus have shot up after Trudeau could only secure a minority government in the Canadian Parliament. Any fiscal stimulus is starting from a healthier place with the budget deficit currently at only -1% of GDP and the net government debt-to-GDP ratio falling towards a low 40% level (Chart 12). Expected fiscal stimulus will provide an incremental boost to Canadian growth in 2020. Chart 11The Global Trade Slump Has Hurt Canada
The Global Trade Slump Has Hurt Canada
The Global Trade Slump Has Hurt Canada
Chart 12Canada Can Afford A Fiscal Stimulus
Canada Can Afford A Fiscal Stimulus
Canada Can Afford A Fiscal Stimulus
Net-net, the Canadian economy appears to be in good shape, with momentum starting to improve. Inflation remains close to the BoC target, with rising pressures stemming from a tight labor market. This is not a backdrop that would be conducive to an “insurance” rate cut in December or even in early 2020. Only -18bps of rate cuts over the next twelve months are discounted in the Canadian Overnight Index Swap (OIS) curve. Yet there is only a 16% chance of a -25bp cut expected at the December 2019 meeting, according to Bloomberg. In other words, the markets are not taking the threat of a BoC rate cut seriously – a view that we agree with. Chart 13Stay Neutral On Canadian Government Bonds
Stay Neutral On Canadian Government Bonds
Stay Neutral On Canadian Government Bonds
We suspect that Governor Poloz’s comments about a potential BoC policy ease were more designed to take some steam out of the strengthening Canadian dollar (Chart 13), which was threatening a major breakout going into last week’s BoC meeting. We would be surprised if a rate cut was delivered at the December 2019 BoC meeting, but the dovish message sent last week does raise the possibility that the BoC could shock us. For now, we are choosing to stick with our neutral recommendation on Canadian government bonds, but we will re-evaluate after the December 4 BoC meeting. Our bias is to downgrade Canadian government bonds to underweight heading into 2020, as we expect a return to their typical high-beta status during a period of accelerating global growth and rising bond yields. Bottom Line: The Bank of Canada is hinting that “insurance” rate cuts may be needed, but with the Canadian economy and inflation both remaining resilient, the central bank is more likely to keep rates steady until global growth improves. Stay neutral on Canadian government bonds, for now, but prepare to move to underweight in early 2020. A Brief Follow Up To Our US MBS Versus IG Corporates Recommendation Chart 14Spread Targets Reached - Downgrade US IG To Neutral
Spread Targets Reached - Downgrade US IG To Neutral
Spread Targets Reached - Downgrade US IG To Neutral
In last week’s report, we made the case for raising allocations to US Agency MBS while reducing exposure to higher-quality US investment grade (IG) corporate credit.1 We implemented the trade in our model bond portfolio, lowering our recommended allocation to US IG and increasing the weighting to US Agency MBS. We now see a case for shifting to a formal strategic recommendation, upgrading US Agency MBS to overweight (a ranking of 4 out of 5 in the tables on page 14) and downgrading US IG to neutral (3 out of 5). The rationale for the shift is based on valuation. Our colleagues at BCA Research US Bond Strategy calculate spread targets for each credit tier within US IG (Aaa, Aa, A and Baa). The targets are determined using a methodology that ranks the option-adjusted spread (OAS) of the Bloomberg Barclays index for each credit tier relative to its history, while controlling for the “phase” of the economic cycle as determined by the slope of the US Treasury yield curve.2 The latest rally in IG has driven the OAS for all tiers below those targets, with the Baa tier looking less expensive than the others (Chart 14). As a result, we now advise only a neutral allocation to US IG corporates, with a preference for the Baa credit tier. Robert Robis, CFA Chief Fixed Income Strategist rrobis@bcaresearch.com Ray Park, CFA Research Analyst ray@bcaresearch.com Footnotes 1Please see BCA Research Global Fixed Income Strategy Weekly Report, “Big Mo(mentum) Is Turning Positive”, dated Oct 29, 2019, available at gfis.bcaresearch.com 2For details on how those spread targets are determined, please see U.S. Bond Strategy Weekly Report, “The Value In Corporate Bonds”, dated February 19, 2019, available at usbs.bcaresearch.com Recommendations The GFIS Recommended Portfolio Vs. The Custom Benchmark Index
How Sweet It Is
How Sweet It Is
Duration Regional Allocation Spread Product Tactical Trades Yields & Returns Global Bond Yields Historical Returns