Fixed Income
Investment grade corporate bonds outperformed the duration-equivalent Treasury index by 60 basis points in October, bringing year-to-date excess returns up to +429 bps. When gauging the outlook for corporate bonds, we consider three main factors as part of…

Highlights While the Caixin PMI is pointing to improving economic conditions, other data series still reflect weak growth. China’s business cycle is likely to bottom in Q1 of next year, rather than in Q4. The failure of Chinese stocks to significantly outperform the global benchmark and the continued underperformance of cyclical stocks underscore the near-term risks to equities if this month’s trade & manufacturing data disappoint. We continue to recommend a neutral tactical stance (0-3 months) towards Chinese equities versus global stocks, but expect them to outperform on a cyclical (6-12 month) time horizon after economic growth firmly bottoms. Feature Tables 1 and 2 on pages 2 and 3 highlight key developments in China’s economy and its financial markets over the past month. On the growth front, the data remains mixed: the strength in the October Caixin PMI and the September pickup in electricity production are positive signs, but other important datapoints still point to weak conditions. We continue to expect that China’s business cycle is likely to bottom in Q1 of next year, rather than in Q4. We continue to expect that growth will bottom in Q1 of next year, rather than in Q4. Table 1China Macro Data Summary
China Macro And Market Review
China Macro And Market Review
Table 2China Financial Market Performance Summary
China Macro And Market Review
China Macro And Market Review
Within financial markets, Chinese stocks have rallied in absolute terms over the past month in response to greatly increased odds of a trade truce between China and the US, but have failed to outperform the global benchmark. This, in combination with the continued underperformance of cyclical stocks, suggests that hard evidence of an economic improvement in China will be required before Chinese stocks begin to rise in relative terms. The risk of near-term underperformance is still present, especially if October’s hard trade and manufacturing data disappoint. We continue to recommend a neutral tactical stance (0-3 months) towards Chinese equities versus global stocks, but expect them to outperform on a cyclical (6-12 month) time horizon after economic growth firmly bottoms. In reference to Tables 1 and 2, we provide below several detailed observations concerning developments in China’s macro and financial market data: Chart 1Not Yet A Clear Change In Trend
Not Yet A Clear Change In Trend
Not Yet A Clear Change In Trend
The Bloomberg Li Keqiang index (LKI) ticked up in September, led by an improvement in electricity production. An improvement in the LKI in lockstep with a rising Caixin manufacturing PMI (discussed below) raises the odds that the Chinese economy may be bottoming earlier than we expect, but for now only modestly so. Chinese economic data is highly volatile, and Chart 1 shows that the improvement in the LKI is very muted when shown as a 3-month moving average. In addition, a slight improvement also occurred earlier this year, but proved to be a false signal. All told, for now we continue to expect that growth will bottom in Q1 of next year, rather than in Q4. Our leading indicator for the LKI was essentially flat in September on a smoothed basis, with sequential declines in M3 growth and the credit components of the indicator offsetting improvements in monetary conditions and M2. From a big picture perspective, the story of our LKI leading indicator remains unchanged: it continues to trend higher, at a much shallower pace than has been the case during previous easing cycles. The uptrend is the basis of our forecast that China’s growth will soon bottom, but the uncharacteristically shallow nature of the rise suggests that the eventual recovery will be modest. On a smoothed basis, Chinese residential floor space sold improved again in September, following a very significant rise in August. Over the past 12-18 months, we had emphasized that the double-digit pace of growth in China’s housing starts was unsustainable because it had entirely decoupled from the trend in sales (which have reliably led construction activity over the past decade). This gap disappeared over the summer due to a significant slowdown in starts, which is what we predicted would occur. However, the recent acceleration in floor space sold represents a legitimate fundamental improvement in the housing market, that for now is difficult to attribute to the recent drivers of housing demand (Chart 2).1 Still, investors should continue to watch China’s housing demand data closely over the coming few months, for further signs of a potential re-acceleration in housing construction. Investors need to see meaningful sequential improvements in China’s October trade and manufacturing data. The October improvement in China’s Caixin PMI was quite notable, as it appears to confirm the full one-point rise in the index that occurred in September and suggests that manufacturing in China’s private-sector is now durably expanding. Still, conflicting signals remain: the official PMI fell in October and remains below 50, and the significant September improvement in the Caixin PMI was not corroborated by an improvement in producer prices or nominal import growth (Chart 3). As PMIs are simply timely coincident indicators that do not generally have leading properties, investors will need to see meaningful sequential improvements in China’s October trade and manufacturing data in order to have confidence that the Caixin PMI improvement is not a false signal. Chart 2It Is Not Yet Apparent What Is Driving A Pickup In Housing Demand
It Is Not Yet Apparent What Is Driving A Pickup In Housing Demand
It Is Not Yet Apparent What Is Driving A Pickup In Housing Demand
Chart 3If The Caixin PMI Is Not A False Signal, A Hard Data Improvement Must Occur Soon
If The Caixin PMI Is Not A False Signal, A Hard Data Improvement Must Occur Soon
If The Caixin PMI Is Not A False Signal, A Hard Data Improvement Must Occur Soon
Chinese stocks have rallied 6-7% over the past month in absolute terms, but have modestly underperformed global equities. The rally in global stock prices has occurred largely in response to the mid-October announcement of a trade truce between China and the US. The failure of Chinese stocks to outperform during this period suggests hard evidence of an economic improvement in China will be required before Chinese stocks begin to outpace their global peers. At the regional equity level, the other notable development over the past month has been the continued outperformance of the MSCI Taiwan Index versus the global benchmark. Taiwan’s outperformance has been boosted by a rising TWD versus the dollar, but Taiwanese stocks have also outperformed in local currency terms. Taiwan province is highly exposed to global trade, and it is not surprising that equities have reacted positively to the prospect of a trade truce between the US and China. Further meaningful outperformance, however, will likely require a re-acceleration in Taiwanese exports, as export growth has merely halted its contraction (Chart 4). Within China’s investable equity market, cyclicals have underperformed defensives over the past month after having rallied significantly from late-August to mid-September (Chart 5). We noted in our October 30 Special Report that these cyclical sectors have historically been positively correlated with pro-cyclical macroeconomic and equity market variables,2 and their underperformance versus defensives is thus consistent with the failure of Chinese stocks in the aggregate to outperform global equities over the past month. In both cases, outperformance likely requires hard evidence of an upturn in China’s business cycle. Chart 4Export Growth Needs To Improve In Order To Expect Further Taiwanese Relative Outperformance
Export Growth Needs To Improve In Order To Expect Further Taiwanese Relative Outperformance
Export Growth Needs To Improve In Order To Expect Further Taiwanese Relative Outperformance
Chart 5Cyclical Underperformance Underscores The Near-Term Risks To Chinese Vs. Global Stocks
Cyclical Underperformance Underscores The Near-Term Risks To Chinese Vs. Global Stocks
Cyclical Underperformance Underscores The Near-Term Risks To Chinese Vs. Global Stocks
We do not take the rise in Chinese government bond yields as necessarily indicative of an imminent breakout in relative equity performance. Chart 6Chinese Relative Equity Performance Leads Bond Yields, Not The Other Way Around
Chinese Relative Equity Performance Leads Bond Yields, Not The Other Way Around
Chinese Relative Equity Performance Leads Bond Yields, Not The Other Way Around
Chinese 10-year government bond yields have risen roughly 15bps over the past month, and are now 30bps off of their mid-August low. Many market participants view Chinese government bond yields as a leading growth barometer, but 10-year yields have actually lagged Chinese investable stock performance over the past two years (Chart 6). As such, we do not take the rise in yields as necessarily indicative of an imminent breakout in relative equity performance. Chinese onshore corporate bond spreads have declined over the past month as government bond yields have been rising, continuing a pattern of negative correlation between the two that has prevailed since early-2018. A negative correlation between yields and corporate bond spreads is a normal relationship, and it suggests that spreads may narrow over the coming year if the Chinese economy bottoms in Q1, as we expect. Spreads remain elevated despite the substantial easing in monetary conditions that occurred last year, due to persistent concerns about rising onshore defaults. While we acknowledge that defaults are indeed occurring, we have argued on several occasions that the pace of defaults would have to be much faster in order for current spreads to be justified.3 We continue to recommend a long RMB-denominated position in China’s onshore corporate bond market. The RMB has appreciated over the past month in response to news of a likely trade truce between the US and China, with most of the rise having occurred versus the US dollar. USD-CNY is likely to sustainably trade below the 7 mark in a trade truce scenario, but how much further downside is possible in the near-term absent a re-acceleration in Chinese economic activity remains an open question. With the Fed very likely on hold for the next year, stronger than expected economic growth in China would likely catalyze a persistent selloff in USD-CNY barring a re-emergence of the Sino-US trade war. This, however, is not our base-case view, meaning that we expect modest post-deal strength in the RMB. Jonathan LaBerge, CFA Vice President Special Reports jonathanl@bcaresearch.com Jing Sima China Strategist JingS@bcaresearch.com Footnotes 1. Please see China Investment Strategy Special Report, “China’s Property Market: Where Will It Go From Here?” dated September 13, 2018. 2. Please see China Investment Strategy Weekly Report, “A Guide To Chinese Investable Equity Sector Performance,” dated October 30, 2019. 3. Please see China Investment Strategy Weekly Reports, “A Shaky Ladder,” dated June 13, 2018, "Investing In The Middle Of A Trade War,” dated September 19, 2018 and "2019 Key Views: Four Themes For China In The Coming Year,” dated December 5, 2018. Cyclical Investment Stance Equity Sector Recommendations
Highlights Chart 1The Fed Must Remain Dovish
The Fed Must Remain Dovish
The Fed Must Remain Dovish
Many were quick to label last week’s FOMC decision a “hawkish cut”. This is somewhat true in the near-term. The Fed lowered rates by 25 basis points while signaling that it doesn’t expect to have to cut more. But this focus on the near-term rate path misses the big picture. In the post-meeting press conference, Chairman Powell mentioned inflation expectations several different times. At one point, he called them “central” to the Fed’s framework and said “we need them to be anchored at a level that’s consistent with our symmetric 2 percent inflation goal.” As of today, the 5-year/5-year forward TIPS breakeven inflation rate is 1.69%, well short of the 2.3%-2.5% range that is consistent with the Fed’s goal (Chart 1). The Fed will take care to maintain an accommodative policy stance until inflation expectations are re-anchored. This will provide strong support for risk assets, and we recommend overweight positions in spread product versus Treasuries. We also expect that global growth will improve enough in the coming months for the Fed to keep its promise to stand pat. With the market still priced for 29 bps of cuts during the next 12 months, investors should keep portfolio duration low. Investment Grade: Neutral Chart 2Investment Grade Market Overview
Investment Grade Market Overview
Investment Grade Market Overview
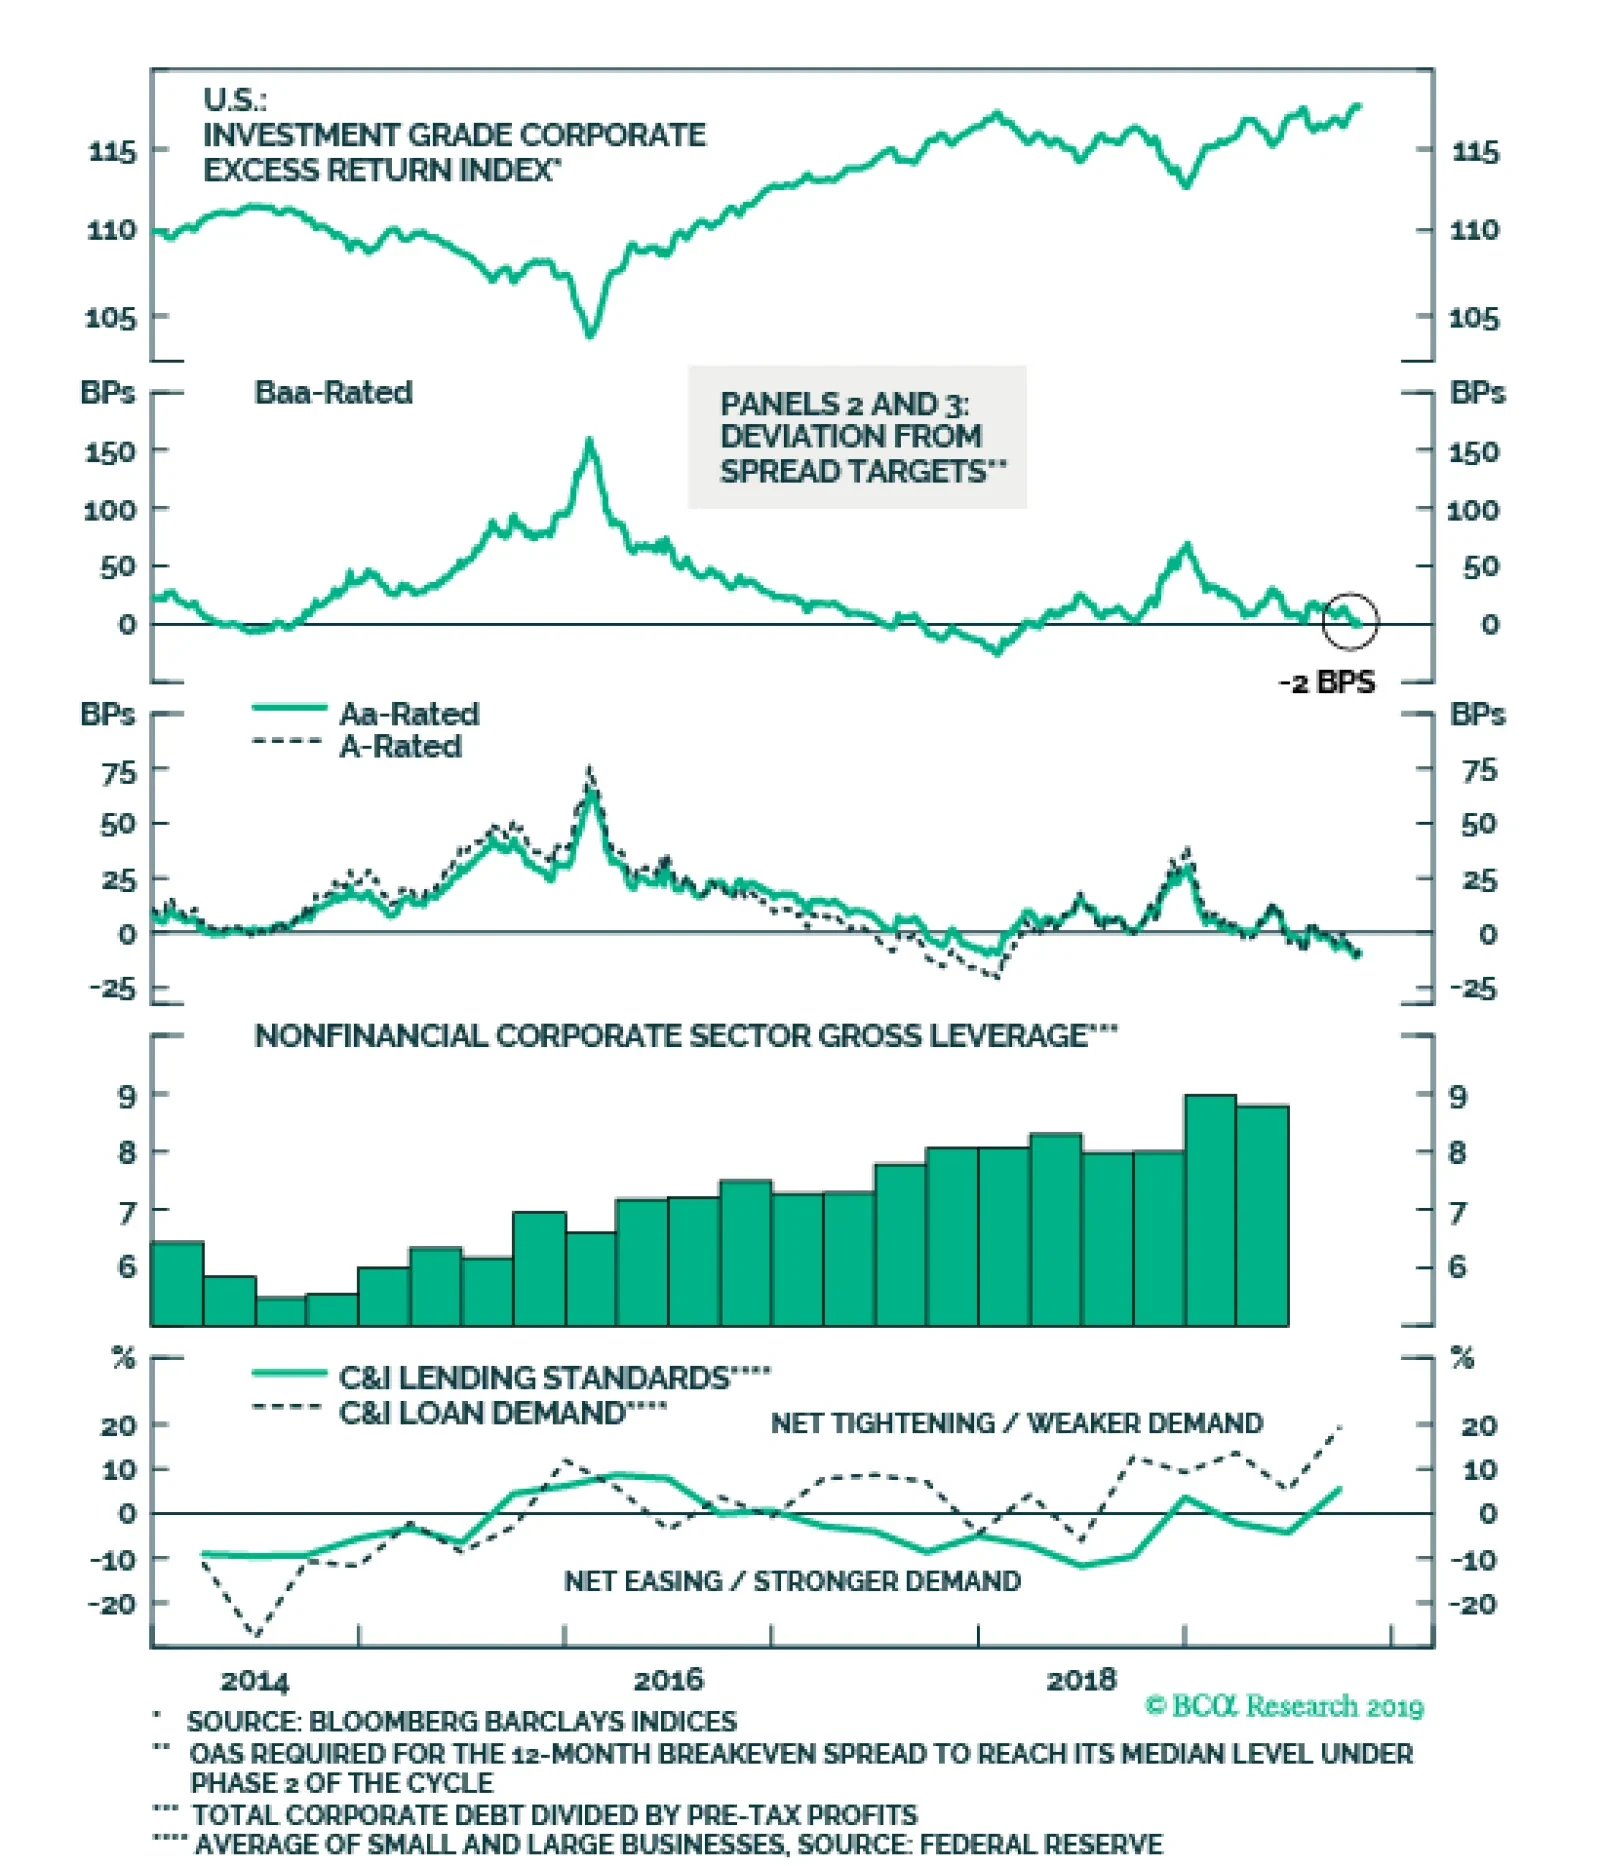
Investment grade corporate bonds outperformed the duration-equivalent Treasury index by 60 basis points in October, bringing year-to-date excess returns up to +429 bps. We consider three main factors in our credit cycle analysis: (i) corporate balance sheet health, (ii) monetary conditions and (iii) valuation.1 On balance sheets, our top-down measure of gross leverage is elevated and rising (Chart 2). In contrast, interest coverage ratios remain solid, propped up by the Fed’s accommodative stance. With inflation expectations still depressed, the Fed can maintain its “easy money” policy for some time yet. The Fed’s Senior Loan Officer survey shows that C&I lending standards tightened in Q3 (bottom panel). We expect the Fed’s accommodative stance to push standards back into “net easing” territory in Q4. But if standards continue to tighten, it could indicate that monetary conditions are not as accommodative as we think. For now, we see valuation as the main headwind for investment grade credit spreads. Spreads for all credit tiers are now below our targets, with the Baa tier looking less expensive than the others (panels 2 & 3).2 As a result, we advise only a neutral allocation to investment grade corporate bonds, with a preference for the Baa credit tier. We also recommend increasing exposure to Agency MBS in place of corporate bonds rated A or higher. Table 3ACorporate Sector Relative Valuation And Recommended Allocation*
The Fed Will Stay Supportive
The Fed Will Stay Supportive
Table 3BCorporate Sector Risk Vs. Reward*
The Fed Will Stay Supportive
The Fed Will Stay Supportive
High-Yield: Overweight Chart 3High-Yield Market Overview
High-Yield Market Overview
High-Yield Market Overview
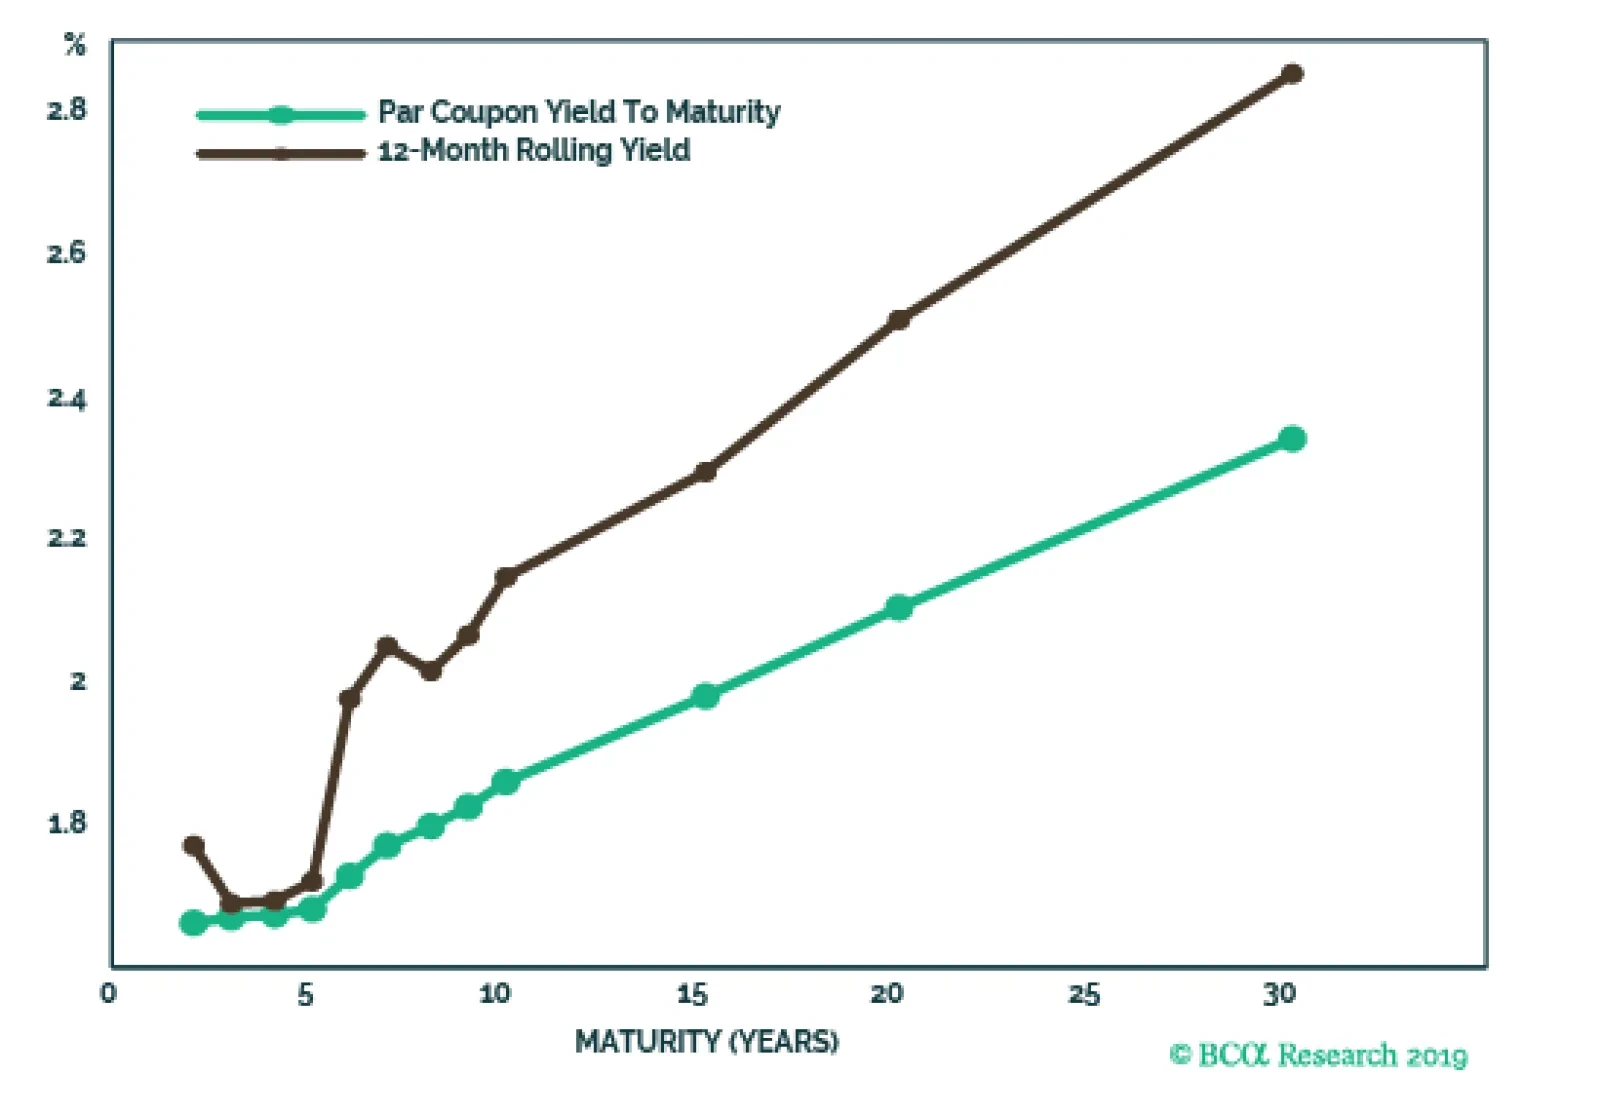
High-Yield performed in line with the duration-equivalent Treasury index in October, keeping year-to-date excess returns steady at +621 bps. The junk index’s option-adjusted spread (OAS) has been fairly stable for most of the year, but the sector has become increasingly attractive from a risk/reward perspective.3 This is because the index’s negatively convex nature has caused its average duration to fall alongside declining Treasury yields. Chart 3 shows that while the index OAS has been rangebound, the 12-month breakeven spread has widened considerably.4 In other words, while junk expected returns have been stable, those expected returns now come with considerably less risk. As a result, the junk index OAS looks increasingly attractive relative to our spread target.5 Specifically, we now view the junk index OAS as 141 bps cheap (panel 3). Falling index duration also explains the divergence between quality spreads and the index OAS. Many have observed that the spread differential between Caa and Ba-rated junk bonds has widened in recent months, while the overall index OAS has been stable (panel 4). However, the divergence evaporates when we look at 12-month breakeven spreads instead of OAS (bottom panel). MBS: Overweight Chart 4MBS Market Overview
MBS Market Overview
MBS Market Overview
Mortgage-Backed Securities outperformed the duration-equivalent Treasury index by 9 basis points in October, bringing year-to-date excess returns up to +3 bps. The conventional 30-year zero-volatility spread widened 4 bps on the month, as a 5 bps widening of the option-adjusted spread (OAS) was partially offset by a 1 bp decline in option cost (i.e. the expected losses from prepayments). This week we recommend upgrading Agency MBS from neutral to overweight, and in particular, we recommend favoring Agency MBS over corporate bonds rated A or higher. We have three main reasons for this recommendation.6 First, expected compensation is competitive. The conventional 30-year MBS OAS is now 53 bps. This is above its pre-crisis average (Chart 4), and only 4 bps below the spread offered by a Aa-rated corporate bond. All investment grade corporate bond credit tiers also look expensive relative to our spread targets. Second, risk-adjusted compensation heavily favors MBS. The Excess Return Bond Map in Appendix C shows that Agency MBS plot well to the right of investment grade corporates. This means that the sector is less likely to see losses versus Treasuries on a 12-month horizon. Finally, the macro environment for MBS remains supportive. Mortgage lending standards have barely eased since the financial crisis (bottom panel), and most people have already had at least one opportunity to refinance their mortgages. This burnout will keep refi activity low, and MBS spreads tight (panel 2). Government-Related: Underweight Chart 5Government-Related Market Overview
Government-Related Market Overview
Government-Related Market Overview
The Government-Related index outperformed the duration-equivalent Treasury index by 20 basis points in October, bringing year-to-date excess returns up to +183 bps. Sovereign debt outperformed duration-equivalent Treasuries by 38 bps on the month, bringing year-to-date excess returns up to +475 bps. Local Authorities outperformed the Treasury benchmark by 9 bps, bringing year-to-date excess returns up to +220 bps. Meanwhile, Foreign Agencies outperformed by 63 bps, bringing year-to-date excess returns up to +261 bps. Domestic Agencies underperformed by 2 bps in October, dragging year-to-date excess returns down to +40 bps. Supranationals underperformed by 8 bps on the month, dragging year-to-date excess returns down to +31 bps. We continue to recommend an underweight allocation to USD-denominated sovereign bonds, given that spreads remain expensive compared to U.S. corporate credit (Chart 5). However, we noted in a recent report that Mexican and Saudi Arabian sovereigns look attractive on a risk/reward basis.7 This is also true for Foreign Agencies and Local Authorities, as shown in the Bond Map in Appendix C. Our Emerging Markets Strategy service also thinks that worries about Mexico’s fiscal position are overblown, and that bond yields embed too high of a risk premium (bottom panel).8 Municipal Bonds: Overweight Chart 6Municipal Market Overview
Municipal Market Overview
Municipal Market Overview
Municipal bonds underperformed the duration-equivalent Treasury index by 7 basis points in October, dragging year-to-date excess returns down to -64 bps (before adjusting for the tax advantage). The average Aaa-rated Municipal / Treasury (M/T) yield ratio fell almost 2% in October, and currently sits at 85% (Chart 6). We recently upgraded municipal bonds from neutral to overweight.9 The decision was based on the fact that yield ratios had jumped significantly. Yield ratios continue to look attractive relative to average pre-crisis levels, especially at the long-end of the Aaa curve (panel 2). Specifically, 2-year and 5-year M/T yield ratios are close to average pre-crisis levels at 73% and 77%, respectively. Meanwhile, M/T yield ratios for longer maturities are all above average pre-crisis levels. M/T yield ratios for 10-year, 20-year and 30-year maturities are 86%, 94% and 97%, respectively. Fundamentally, state & local government balance sheets remain solid. Our Municipal Health Monitor remains in “improving health” territory and state & local government interest coverage has improved considerably in recent quarters (bottom panel). Both of these trends are consistent with muni ratings upgrades continuing to outnumber downgrades going forward. Treasury Curve: Maintain A Barbell Curve Positioning Chart 7Treasury Yield Curve Overview
Treasury Yield Curve Overview
Treasury Yield Curve Overview
The Treasury curve steepened considerably in October, as short-dated yields came under downward pressure even as long-maturity yields edged higher. The 2/10 Treasury slope steepened 12 bps on the month, and currently sits at 17 bps. The 5/30 slope steepened 9 bps on the month, and currently sits at 66 bps (Chart 7). Last week’s report discussed the outlook for the 2/10 Treasury slope on a 6-12 month horizon.10 We considered the main macro factors that influence the slope of the yield curve: Fed policy, wage growth, inflation expectations and the neutral fed funds rate. We concluded that the 2/10 slope has room to steepen during the next few months, as the Fed holds down the front-end of the curve in an effort to re-anchor inflation expectations. However, we see the 2/10 slope remaining in a range between 0 bps and 50 bps, owing to strong wage growth and downbeat neutral rate expectations. Despite the outlook for modest curve steepening, we continue to recommend holding a barbelled Treasury portfolio. Specifically, we favor holding a 2/30 barbell versus the 5-year bullet, in duration-matched terms. This position offers strong positive carry (bottom panel), due to the extreme overvaluation of the 5-year note, and looks attractive on our yield curve models (see Appendix B). TIPS: Overweight Chart 8Inflation Compensation
Inflation Compensation
Inflation Compensation
TIPS outperformed the duration-equivalent nominal Treasury index by 27 basis points in October, bringing year-to-date excess returns up to -64 bps. The 10-year TIPS breakeven inflation rate rose 1 bp on the month, and currently sits at 1.60%. The 5-year/5-year forward TIPS breakeven inflation rate fell 8 bps on the month, and currently sits at 1.69%. Both rates remain well below the 2.3%-2.5% range consistent with the Fed’s target. The divergence between the actual inflation data and inflation expectations is becoming increasingly stark. Trimmed mean PCE inflation has been fluctuating around the Fed’s target for most of the year (Chart 8). However, long-maturity TIPS breakeven inflation rates remain stubbornly low. As we have pointed out in prior research, it can take time for expectations to adapt to a changing macro environment.11 That being said, the 10-year TIPS breakeven rate is currently 32 bps too low according to our Adaptive Expectations Model, a model whose primary input is 10-year trailing core inflation (panel 4). It is highly likely that the Fed will have to tolerate some overshoot of its 2% inflation target in order to re-anchor inflation expectations near desired levels. We anticipate that the committee will do so, and maintain our view that long-dated TIPS breakevens will move above 2.3% before the end of the cycle. ABS: Underweight Chart 9ABS Market Overview
ABS Market Overview
ABS Market Overview
Asset-Backed Securities underperformed the duration-equivalent Treasury index by 5 basis points in October, dragging year-to-date excess returns down to +67 bps. The index option-adjusted spread for Aaa-rated ABS widened 5 bps on the month. It currently sits at 39 bps, 5 bps above its minimum pre-crisis level (Chart 9). Our Excess Return Bond Map (see Appendix C) shows that Aaa-rated consumer ABS rank among the most defensive U.S. spread products and also offer more expected return than other low-risk sectors such as Domestic Agency bonds and Supranationals. However, we remain wary of allocating too much to consumer ABS because credit trends continue to shift in the wrong direction. The consumer credit delinquency rate is still low, but has put in a clear bottom. The same is true for the household interest expense ratio (panel 3). Senior loan officers also continue to tighten lending standards for both credit cards and auto loans. Tighter lending standards usually coincide with rising delinquencies (bottom panel). All in all, our favorable outlook for global growth causes us to shy away from defensive spread products, and deteriorating ABS credit metrics are also a cause for concern. Stay underweight. Non-Agency CMBS: Neutral Chart 10CMBS Market Overview
CMBS Market Overview
CMBS Market Overview
Non-Agency Commercial Mortgage-Backed Securities outperformed the duration-equivalent Treasury index by 6 basis points in October, bringing year-to-date excess returns up to +233 bps. The index option-adjusted spread for non-agency Aaa-rated CMBS was flat on the month. It currently sits at 73 bps, below its average pre-crisis level but somewhat above levels seen in 2018 (Chart 10). The macro outlook for commercial real estate (CRE) is somewhat unfavorable, with lenders tightening loan standards (panel 4) in an environment of tepid demand. The Fed’s Senior Loan Officer survey shows that banks saw slightly stronger demand for nonfarm nonresidential CRE loans in Q3, after four consecutive quarters of falling demand (bottom panel). CRE prices have accelerated of late, but are still not keeping pace with CMBS spreads (panel 3). Despite the poor fundamental picture, our Excess Return Bond Map shows that CMBS offer a reasonably attractive risk/reward trade-off compared to other bond sectors (see Appendix C). Agency CMBS: Overweight Agency CMBS outperformed the duration-equivalent Treasury index by 10 basis points in October, bringing year-to-date excess returns up to +100 bps. The index option-adjusted spread was flat on the month, and currently sits at 57 bps. The Excess Return Bond Map in Appendix C shows that Agency CMBS offer a compelling risk/reward trade-off. An overweight allocation to this high-rated sector remains appropriate. Appendix A: The Golden Rule Of Bond Investing We follow a two-step process to formulate recommendations for bond portfolio duration. First, we determine the change in the federal funds rate that is priced into the yield curve for the next 12 months. Second, we decide – based on our assessments of the economy and Fed policy – whether the change in the fed funds rate will exceed or fall short of what is priced into the curve. Most of the time, a correct answer to this question leads to the appropriate duration call. We call this framework the Golden Rule Of Bond Investing, and we demonstrated its effectiveness in the U.S. Bond Strategy Special Report, “The Golden Rule Of Bond Investing”, dated July 24, 2018, available at usbs.bcaresearch.com. Chart 11 illustrates the Golden Rule’s track record by showing that the Bloomberg Barclays Treasury Master Index tends to outperform cash when rate hikes fall short of 12-month expectations, and vice-versa. Chart 11The Golden Rule's Track Record
The Golden Rule's Track Record
The Golden Rule's Track Record
At present, the market is priced for 29 basis points of cuts during the next 12 months. We anticipate a flat fed funds rate over that time horizon, and therefore anticipate that below-benchmark portfolio duration positions will profit. We can also use our Golden Rule framework to make 12-month total return and excess return forecasts for the Bloomberg Barclays Treasury index under different scenarios for the fed funds rate. Excess returns are relative to the Bloomberg Barclays Cash index. To forecast total returns we first calculate the 12-month fed funds rate surprise in each scenario by comparing the assumed change in the fed funds rate to the current value of our 12-month discounter. This rate hike surprise is then mapped to an expected change in the Treasury index yield using a regression based on the historical relationship between those two variables. Finally, we apply the expected change in index yield to the current characteristics (yield, duration and convexity) of the Treasury index to estimate total returns on a 12-month horizon. The below tables present those results, along with 95% confidence intervals. Excess returns are calculated by subtracting assumed cash returns in each scenario from our total return projections.
The Fed Will Stay Supportive
The Fed Will Stay Supportive
The Fed Will Stay Supportive
The Fed Will Stay Supportive
Appendix B: Butterfly Strategy Valuations The following tables present the current read-outs from our butterfly spread models. We use these models to identify opportunities to take duration-neutral positions across the Treasury curve. The following two Special Reports explain the models in more detail: U.S. Bond Strategy Special Report, “Bullets, Barbells And Butterflies”, dated July 25, 2017, available at usbs.bcaresearch.com U.S. Bond Strategy Special Report, “More Bullets, Barbells And Butterflies”, dated May 15, 2018, available at usbs.bcaresearch.com Table 4 shows the raw residuals from each model. A positive value indicates that the bullet is cheap relative to the duration-matched barbell. A negative value indicates that the barbell is cheap relative to the bullet. Table 4Butterfly Strategy Valuations: Raw Residuals In Basis Points (As Of November 1, 2019)
The Fed Will Stay Supportive
The Fed Will Stay Supportive
Table 5 scales the raw residuals in Table 4 by their historical means and standard deviations. This facilitates comparison between the different butterfly spreads. Table 5Butterfly Strategy Valuation: Standardized Residuals (As Of November 1, 2019)
The Fed Will Stay Supportive
The Fed Will Stay Supportive
Table 6 flips the models on their heads. It shows the change in the slope between the two barbell maturities that must be realized during the next six months to make returns between the bullet and barbell equal. For example, a reading of 48 bps in the 5 over 2/10 cell means that we would only expect the 5-year to outperform the 2/10 if the 2/10 slope steepens by more than 48 bps during the next six months. Otherwise, we would expect the 2/10 barbell to outperform the 5-year bullet. Table 6Discounted Slope Change During Next 6 Months (BPs)
The Fed Will Stay Supportive
The Fed Will Stay Supportive
Appendix C: Excess Return Bond Map The Excess Return Bond Map is used to assess the relative risk/reward trade-off between different sectors of the U.S. bond market. It is a purely computational exercise and does not impose any macroeconomic view. The Map’s vertical axis shows 12-month expected excess returns. These are proxied by each sector’s option-adjusted spread. Sectors plotting further toward the top of the Map have higher expected returns and vice-versa. Our novel risk measure called the “Risk Of Losing 100 bps” is shown on the Map’s horizontal axis. To calculate it, we first compute the spread widening required on a 12-month horizon for each sector to lose 100 bps or more relative to a duration-matched position in Treasury securities. Then, we divide that amount of spread widening by each sector’s historical spread volatility. The end result is the number of standard deviations of 12-month spread widening required for each sector to lose 100 bps or more versus a position in Treasuries. Lower risk sectors plot further to the right of the Map, and higher risk sectors plot further to the left. Chart 12Excess Return Bond Map (As Of November 1, 2019)
The Fed Will Stay Supportive
The Fed Will Stay Supportive
Ryan Swift U.S. Bond Strategist rswift@bcaresearch.com Jeremie Peloso Research Analyst jeremiep@bcaresearch.com Footnotes 1 Please see U.S. Bond Strategy Weekly Report, “Corporate Bond Investors Should Not Fight The Fed”, dated September 17, 2019, available at usbs.bcaresearch.com 2 For details on how we arrive at our spread targets please see U.S. Bond Strategy Weekly Report, “The Value In Corporate Bonds”, dated February 19, 2019, available at usbs.bcaresearch.com 3 Please see U.S. Bond Strategy Weekly Report, “Crisis Of Confidence”, dated October 22, 2019, available at usbs.bcaresearch.com 4 The 12-month breakeven spread is the spread widening required to break even with a duration-matched position in Treasuries on a 12-month horizon. It can be approximated by OAS divided by duration. 5 For details on how we arrive at our spread targets please see U.S. Bond Strategy Weekly Report, “The Value In Corporate Bonds”, dated February 19, 2019, available at usbs.bcaresearch.com 6 Please see U.S. Bond Strategy Weekly Report, “Two Themes And Two Trades”, dated October 1, 2019, available at usbs.bcaresearch.com 7 Please see U.S. Bond Strategy Weekly Report, “A Perspective On Risk And Reward”, dated October 15, 2019, available at usbs.bcaresearch.com 8 Please see Emerging Markets Strategy Weekly Report, “Country Insights: Malaysia, Mexico & Central Europe”, dated October 31, 2019, available at ems.bcaresearch.com 9 Please see U.S. Bond Strategy Weekly Report, “Two Themes and Two Trades”, dated October 1, 2019, available at usbs.bcaresearch.com 10 Please see U.S. Bond Strategy Weekly Report, “Position For Modest Curve Steepening”, dated October 29, 2019, available at usbs.bcaresearch.com 11 Please see U.S. Bond Strategy Weekly Report, “Adaptive Expectations In The TIPS Market”, dated November 20, 2018, available at usbs.bcaresearch.com Fixed Income Sector Performance Recommended Portfolio Specification Corporate Sector Relative Valuation And Recommended Allocation
The key question for asset allocators over coming months will be when (or, perhaps, whether) the global manufacturing cycle will turn up. This would trigger a move into more cyclically sensitive markets, for example euro zone equities and Emerging Market assets. It would push up commodity prices and government bond yields, and lead to a weakening of the U.S. dollar. Recommended Allocation
Monthly Portfolio Update: Looking For The Turning-Point
Monthly Portfolio Update: Looking For The Turning-Point
Chart 1First Inklings Of A Pick-Up?
First Inklings Of A Pick-Up?
First Inklings Of A Pick-Up?
For now, the evidence of this turning-point remains ambiguous, and so we hesitate to pull the trigger. BCA Research's calculation of the global OECD Leading Economic Indicator bottomed earlier this year and should lead to a pick-up in manufacturing activity soon (Chart 1). However, only in EM have the manufacturing PMIs bottomed (Chart 1, panel 2) and this was due mainly to a questionably strong September PMI in China which might be reversed when the latest data-point is published on October 1. In the euro zone, the best that one can say is that the PMIs have stopped falling but they remain at a low level (41.9 in Germany, for instance). Some market-based indicators also signal a pick-up – but not yet convincingly (Chart 2). Defensive currencies such as the U.S. dollar and yen have fallen a little against cyclical currencies like the Korean won and Australian dollar. Euro zone equities have shown some strength, especially in the beaten-down auto sector. The global stock-to-bond ratio looks to be about to break out of its recent range. And copper has bounced off its lows. But these moves could turn out to be just noise rather than the beginning of a trend. Chart 2Are Markets Sniffing Out A Turn?
Are Markets Sniffing Out A Turn?
Are Markets Sniffing Out A Turn?
Easier financial conditions are the most likely cause of a rebound. BCA Research's Financial Liquidity Index tends to lead both manufacturing activity and the relative performance of global stocks by around 12-18 months (Chart 3). With the dovish turn of central banks this year, the decline in long-term interest rates (the 10-year U.S. Treasury yield, even after its recent rebound, is only at 1.7% compared to 3.2% a year ago), the contraction in credit spreads, and a pick-up in money supply growth especially in the U.S. (where M2 is now growing 6.5% year-on-year), it would be surprising if these looser monetary conditions do not feed through into stronger activity over coming quarters. Chart 3Financial Liquidity Propels Growth
Financial Liquidity Propels Growth
Financial Liquidity Propels Growth
Chart 4Could Inflation Now Slow?
Could Inflation Now Slow?
Could Inflation Now Slow?
Indeed, one can easily imagine a scenario next year where growth rebounds but inflation slows (due to the lagged effect of this year’s weaker growth, Chart 4), allowing central banks to remain dovish for some time. This non-inflationary accelerating growth would be highly positive for risk assets and negative for the U.S. dollar. Chart 5 shows how various asset classes behaved in such an environment in the past. Chart 5How Assets Behaved Under Rising Growth/Falling Inflation
Monthly Portfolio Update: Looking For The Turning-Point
Monthly Portfolio Update: Looking For The Turning-Point
Easier financial conditions are the most likely cause of a rebound. There are some risks to this optimistic scenario, however. Chinese growth remains sluggish with, for example, imports – the most important factor as far as the rest of the world is concerned – falling by 8.5% year-on-year in September and showing no signs of recovery (Chart 6). The acceleration of Chinese credit growth in early 2019 has petered out since the summer and points to a much flatter recovery of activity than was the case in 2016 (Chart 7). A politburo meeting in late October could lead to monetary stimulus being ramped up but, for now, investors should not assume a big reflationary impulse from China. In the developed world, the biggest risk is that the slowdown in manufacturing spills over into employment, consumption, and services. There are some signs in the U.S. that companies are delaying hiring decisions: job openings have fallen, and the employment component of both the manufacturing and non-manufacturing ISMs points to a deterioration in the labor market (Chart 8). Growing CEO pessimism, presumably because of anemic earnings and the trade war, points to continuing weakness in capex and a further decline in activity indicators (Chart 9). Chart 6Chinese Growth Still Sluggish...
Chinese Growth Still Sluggish...
Chinese Growth Still Sluggish...
Chart 7...As Credit Growth Peters Out
...As Credit Growth Peters Out
...As Credit Growth Peters Out
Chart 8Are Firms Starting To Delay Hiring?
Are Firms Starting To Delay Hiring?
Are Firms Starting To Delay Hiring?
Chart 9CEOs Are Not Happy
CEOs Are Not Happy
CEOs Are Not Happy
Chart 10Stocks Should Outperform Cyclically
Stocks Should Outperform Cyclically
Stocks Should Outperform Cyclically
On balance, we still expect global growth to accelerate next year, and therefore global equities to outperform bonds over the next 12 months (Chart 10). But we want to have greater conviction for that view before we recommend more aggressive pro-cyclical tilts. We remain overweight equities versus bonds, but hedge the downside risk through an overweight in cash, and through tilts towards U.S. equities, and DM over EM equities. We continue to recommend hedging against the upside risk of greater Chinese stimulus and a strong rally in cyclical assets through an overweight in global Financials, Industrials, and Energy, and also through a neutral stance on Australian equities, which are a clean play on a Chinese rebound. We continue to look for the right timing to turn more positive on pure cyclical assets such as euro zone equities, and Emerging Markets. Fixed Income: A cyclical pick-up would imply that global government bond yields have further to rise (Chart 11). Our global fixed-income strategists have a short-term target for the 10-year U.S. Treasury yield of 2.1% (versus 1.7% now) and -0.2% for Bunds (-0.4% now), which would take yields back to their 200-day moving averages (Chart 12).1 We continue to recommend a moderate underweight on duration, and prefer TIPS to nominal bonds, since inflation breakevens imply that the Fed will miss its inflation target by 80 basis points a year on average over the next 10 years. In an environment of accelerating economic growth, credit (both investment grade and high-yield)should outperform in both the U.S. and Europe. The most attractive points on the credit curve are BBB-rated bonds in IG, and the riskiest bonds in HY. For more risk-averse investors, agency MBS currently offer an attractive yield pickup over quality corporate credits. Chart 11Growth Will Push Up Yields Further...
Growth Will Push Up Yields Further...
Growth Will Push Up Yields Further...
Chart 12...Initially To Their 200-Day Average
...Initially To Their 200-Day Average
...Initially To Their 200-Day Average
Equities: Any upside for U.S. equities must come from improved earnings performance. Throughout 2019, earnings have been beating overly pessimistic analysts’ forecasts and Q3 looks to be no exception, with EPS growth on track to be much stronger than the -5% year-on-year that analysts forecast going into the results season (Chart 13). Next year, nominal GDP growth of 4% and a weaker U.S. dollar should produce 7-8% EPS growth. But, with a forward PE of 17x and the Fed unlikely to boost the multiple by further rate cuts, upside is limited. In the right economic environment (as described above), euro zone and EM stocks should do much better. We are currently neutral on euro zone equities, but the recent stronger performance by European banks gives us more confidence that we may be able to move to overweight soon (Chart 14). Similarly, our EM strategists have instituted a buy stop on the MSCI EM index and say they will go overweight EM equities if the index in USD terms rises 3% from its current level.2 Chart 13Analysts Are Too Pessimistic On Earnings
Monthly Portfolio Update: Looking For The Turning-Point
Monthly Portfolio Update: Looking For The Turning-Point
Currencies: The first inklings of U.S. dollar weakness over the past month suggest that it may, too, be sniffing out the start of a cyclical rebound, since it tends to be a very counter-cyclical currency (Chart 15). Going forward, relative interest rates are also unlikely to be as bullish a force for the U.S. dollar as they have been in the past few years. For now, we are neutral on the U.S. dollar on a trade-weighted basis, but do see it depreciating against the Australian dollar and the euro over the next 12 months. The British pound has already risen to take into account the lesser probability of a no-deal Brexit, and we would not expect it to move much either way until the General Election result is clear. There are some risks to the optimistic scenario: Chinese growth remains sluggish, and there are signs that U.S. companies are delaying hiring decisions. Chart 14First Signs Of Euro Banks Recovering?
First Signs Of Euro Banks Recovering?
First Signs Of Euro Banks Recovering?
Chart 15Recovery Would Be Dollar Bearish
Recovery Would Be Dollar Bearish
Recovery Would Be Dollar Bearish
Commodities: Industrial metals prices have bottomed out in recent months, in line with Chinese leading indicators (Chart 16). But we will need to see greater Chinese stimulus before we become more positive. Crude oil has moved largely in a range for the past six months, with tightness in supply offset by some weakness in demand, especially from developed economies (Chart 17). With demand likely to pick up in line with the global economy, and supply still constrained by the Saudi/Russia production pact and geopolitical disturbances, our energy strategists see Brent crude averaging $66 a barrel in Q4 and $70 in 2020, versus $60 now. Chart 16Not Enough China Stimulus For Metals To Bounce
Not Enough China Stimulus For Metals To Bounce
Not Enough China Stimulus For Metals To Bounce
Chart 17Oil Kept Down By Weak Demand
Oil Kept Down By Weak Demand
Oil Kept Down By Weak Demand
As last year, the Global Asset Allocation service will not publish a Q1 Quarterly in mid-December. Instead, we will send clients on November 22 our annual report of the conversation between Mr and Ms X and BCA Research’s managing editors. This report will detail BCA's house views on the outlook for the macro environment and investment markets in 2020. We will publish GAA Monthly Portfolio Outlooks on the first business days of December and January. Garry Evans Senior Vice President Chief Global Asset Allocation Strategist garry@bcaresearch.com Footnotes 1Please see Global Fixed Income Strategy Weekly Report “Big Mo(mentum) Is Turning Positive,” dated 29 October 2019, available at gfis.bcaresearch.com. 2For an explanation, please see the Emerging Markets Strategy Weekly Report " EM Local Bonds: A New Normal?" dated 24 October 2019, available at ems.bcaresearch.com. Recommended Asset Allocation Model Portfolio (USD Terms)
Analysis on Mexico and Central Europe is available on pages 6 and 10, respectively. Highlights Deflationary pressures have been intensifying in Malaysia and the central bank will be forced to cut its policy rate. To play this theme, we recommend receiving 2-year swap rates. In Mexico, pieces are falling into place for stocks to outperform the EM equity benchmark on a sustainable basis. We are also keeping an overweight allocation on Mexican sovereign credit and local currency bonds. In Central Europe (CE), inflation will continue to rise as both labor shortages and ultra-accommodative monetary and fiscal policies promote strong domestic demand. We are downgrading our allocation of CE local currency bonds from overweight to neutral. Malaysia: Besieged By Deflationary Pressures Malaysian interest rates appear elevated given the state of its economy. Deflationary pressures have been intensifying and the central bank will be forced to cut its policy rate. The Malaysian economy continues to face strong deflationary pressures. To play this theme, we recommend receiving 2-year swap rates. We are also upgrading our recommended allocation to Malaysian local currency and U.S. dollar government bonds for dedicated EM fixed-income portfolios from neutral to overweight. The Malaysian economy continues to face strong deflationary pressures, requiring significant rate cuts by the central bank: Chart I-1 shows that the GDP deflator is flirting with deflation, and nominal GDP growth has slowed to the level of commercial banks’ average lending rates. Falling nominal growth amid elevated corporate and household debt levels is an extremely toxic mix (Chart I-2, top panel). Notably, debt-servicing costs for the private sector – both businesses and households – are high at 13.5% of GDP and are also rising (Chart I-2, bottom panel). Chart I-1The Malaysian Economy Is Flirting With Deflation
The Malaysian Economy Is Flirting With Deflation
The Malaysian Economy Is Flirting With Deflation
Chart I-2High Leverage & Debt Servicing Costs Among Businesses & Households
High Leverage & Debt Servicing Costs Among Businesses & Households
High Leverage & Debt Servicing Costs Among Businesses & Households
Crucially, real borrowing costs are elevated. In real terms, the prime lending rate stands at 5% when deflated by the GDP deflator, and at 3% when deflated by headline CPI. Notably, private credit growth (outstanding business and household loans) has plunged to a 15-year low (Chart I-3), underscoring that real borrowing costs are excessive. Chart I-3Malaysia: Credit Growth Is In Freefall
Malaysia: Credit Growth Is In Freefall
Malaysia: Credit Growth Is In Freefall
Chart I-4Malaysia's Corporate Sector Is Struggling
Malaysia's Corporate Sector Is Struggling
Malaysia's Corporate Sector Is Struggling
Malaysia’s corporate sector is struggling. The manufacturing PMI is below the critical 50 threshold and is showing no signs of recovery. Listed companies’ profits are shrinking (Chart I-4, top panel). Poor corporate profitability is prompting cutbacks in capex spending (Chart I-4, middle and bottom panels) and weighing on employment and wages. The household sector has been retrenching; retail sales have been contracting and personal vehicle sales have been shrinking (Chart I-5). The property market – in particular the residential sub-sector – is still in recession. Property sales and starts are falling, and property prices are flirting with deflation (Chart I-6). Critically, monetary policy easing and exchange rate depreciation are the only levers available to policymakers to reflate the economy. Fiscal policy is constrained as the budget deficit is already large at 3.4% of GDP, and public debt is elevated. Prime Minister Mahathir Mohamad is in fact aiming to reduce the total national debt (including off-balance-sheet debt) back to the government’s ceiling of 54% of GDP (from 80% currently). Chart I-5Malaysian Households Are Retrenching
Malaysian Households Are Retrenching
Malaysian Households Are Retrenching
Chart I-6Malaysia's Property Sector Is In A Downturn
Malaysia's Property Sector Is In A Downturn
Malaysia's Property Sector Is In A Downturn
Bottom Line: The Malaysian economy is besieged by deflationary pressures and requires lower borrowing costs. The central bank will deliver rate cuts in the coming months. Investment Recommendations A new trade idea: receive 2-year swap rates as a bet on rate cuts by the central bank. Consistently, for dedicated EM bond portfolios, we are upgrading local currency and U.S. dollar-denominated government bonds from neutral to overweight. Chart I-7Overweight Malaysian Local Currency And U.S. Dollar Government Bonds
Overweight Malaysian Local Currency And U.S. Dollar Government Bonds
Overweight Malaysian Local Currency And U.S. Dollar Government Bonds
While we are downbeat on the ringgit versus the U.S. dollar, Malaysian domestic bonds will likely outperform the EM GBI index in common currency terms on a total return basis (Chart I-7, top panel). The same is true for excess returns on the country’s sovereign credit (Chart I-7, bottom panel). The basis for the ringgit’s more moderate depreciation, especially in comparison with other EM currencies, is as follows: First, foreigners have reduced their holdings of local currency bonds. The share of foreign ownership has declined from 36% in 2015 to 22% now of total outstanding local domestic bonds in the past 4 years (Chart I-8). Hence, currency depreciation will not trigger large foreign capital outflows. Second, the trade balance is in surplus and improving. This will provide a cushion for the ringgit. Finally, the ringgit is cheap in real effective terms which also limits the potential downside (Chart I-9). Dedicated EM equity portfolios should keep a neutral allocation on Malaysian stocks. We are taking profits on our long Malaysian small-cap stocks relative to the EM small-cap index position. This recommendation has generated a 6.6% gain since its initiation on December 14, 2018. Chart I-8Foreigners' Share Of Local Currency Bonds Has Dropped
Foreigners' Share Of Local Currency Bonds Has Dropped
Foreigners' Share Of Local Currency Bonds Has Dropped
Chart I-9The Ringgit Is Cheap
The Ringgit Is Cheap
The Ringgit Is Cheap
Ayman Kawtharani Editor/Strategist ayman@bcaresearch.com Mexico: Raising Our Conviction On Equity Outperformance Mexican local currency bonds, as well as sovereign and corporate credit, have been one of our highest conviction overweights for some time. These positions have played out very well (Chart II-1). Presently, pieces are falling into place for Mexican stocks to outperform the EM equity benchmark on a sustainable basis. First, long-lasting outperformance by Mexican local currency bonds and corporate credit will lead to the stock market’s outperformance relative to the EM benchmark. Chart II-2 shows that when Mexican local currency bond and corporate dollar bond yields fall relative to their EM peers, the Bolsa tends to outperform. In brief, a relative decline in the cost of capital will eventually translate into relative equity outperformance. Chart II-1Mexico Vs. EM: Domestic Bonds And Credit Markets
Mexico Vs. EM: Domestic Bonds And Credit Markets
Mexico Vs. EM: Domestic Bonds And Credit Markets
Chart II-2Mexico: Relative Stock Prices Are Correlated With Relative Cost Of Capital
Mexico: Relative Stock Prices Are Correlated With Relative Cost Of Capital
Mexico: Relative Stock Prices Are Correlated With Relative Cost Of Capital
Second – as discussed in detail in our previous Special Report – market worries about Mexico’s fiscal position are overblown, especially relative to other developing nations such as Brazil and South Africa. Orthodox fiscal and monetary policies, as well as low public debt, warrant a lower risk premium in Mexico, both in absolute terms and relative to other EM countries. Moreover, market participants and credit agencies have overstated the precariousness of Pemex’s debt and financing requirements. Pemex U.S. dollar bond yields have been falling steadily compared to EM aggregate corporate bond yields since the announcements of policies aimed at supporting the company’s debt sustainability. We have discussed Pemex’s financial sustainability and its effect on public finances in past reports.1 Third, having cut rates twice since September, the Central Bank of Mexico (Banxico) has embarked on a rate cutting cycle. This is positive for stock prices, as it implies higher equity valuations and will eventually put a floor under the economy. Given that both core and headline inflation have fallen within the target bands, this gives the monetary authorities more room to reduce interest rates. Banxico members have been vocal about their desire to cut rates further, which is being foreshadowed by the swap market (Chart II-3, top panel). Given that both core and headline inflation have fallen within the target bands, this gives the monetary authorities more room to reduce interest rates. The slowdown in the domestic economy and Andrés Manuel López Obrador’ (AMLO) administration’s tight fiscal policy will enable and encourage Banxico to further ease monetary policy (Chart II-3, bottom panel). Fourth, another positive market catalyst for Mexican equities is the ongoing outperformance of EM consumer staples versus the overall EM index. Consumer staples have a large 35% share of the overall Mexico MSCI stock index, while this sector in the EM MSCI benchmark accounts for only 7%. Therefore, durable outperformance by consumer staples often hints at a relative cyclical outperformance for the Mexican bourse (Chart II-4). Chart II-3Mexico: Continue Betting On Lower Rates
Mexico: Continue Betting On Lower Rates
Mexico: Continue Betting On Lower Rates
Chart II-4Mexican Equities Are A Play On Consumer Staples
Mexican Equities Are A Play On Consumer Staples
Mexican Equities Are A Play On Consumer Staples
Chart II-5Mexican Stocks Offer Reasonable Value
Mexican Stocks Offer Reasonable Value
Mexican Stocks Offer Reasonable Value
Finally, Mexican equities are not expensive. Chart II-5 illustrates that according to our cyclically-adjusted P/E ratios, Mexican stocks offer good value in both absolute terms and relative to EM overall. We continue to believe AMLO’s administration is proving to be a pragmatic government with the aim of reducing rent-seeking activities and addressing structural issues such as poverty, corruption and crime. These policies will be positive for the economy over the long run and share prices will move higher in anticipation. Bottom Line: We are reiterating our overweight allocation on Mexican sovereign credit and domestic local currency bonds within their respective EM benchmarks. With further rate cuts on the horizon, yet upside risks to EM local currency bond yields, we continue to recommend a curve steepening trade in Mexico: receiving 2-year and paying 10-year swap rates. We now have high conviction that Mexican share prices will stage a cyclical outperformance relative to their EM peers. The bottom panel of Chart II-4 on page 8 illustrates that Mexican stocks seem to have formed a major bottom and are about to begin outperforming the EM equity benchmark. Dedicated EM equity managers should have a large overweight allocation to Mexican stocks. Our recommendation of favoring small-caps over large-cap companies in Mexico has been very profitable since we argued for this trade last November. We are taking a 12.9% profit on this position and recommend keeping an overweight allocation to both Mexican large- and small-caps within an EM equity portfolio. Juan Egaña Research Associate juane@bcaresearch.com Arthur Budaghyan Chief Emerging Markets Strategist arthurb@bcaresearch.com Central Europe: An Inflationary Enclave In Deflationary Europe Our macroeconomic theme for Central European (CE) economies – Hungary, Poland and the Czech Republic, elaborated in the linked report, has been as follows: Inflation will continue to rise as both labor shortages and ultra-accommodative monetary as well as fiscal policies in CE promote strong domestic demand. CE economies have stood out as an inflationary enclave in Europe. Notably, CE economies have stood out as an inflationary enclave in Europe. Going forward, inflation will continue to rise across this region, despite the ongoing contraction in European manufacturing. First, Hungary’s and Poland’s central banks are behind the curve – they remain reluctant to hike rates amid rampantly rising inflation within overheating economies (Chart III-1). In turn, real policy rates across CE are becoming more negative and will promote robust money and credit growth (Chart III-2). Chart III-1CE Central Banks Are Behind The Curve
CE Central Banks Are Behind The Curve
CE Central Banks Are Behind The Curve
Chart III-2Low Real Rates Promote Rampant Credit Growth
Low Real Rates Promote Rampant Credit Growth
Low Real Rates Promote Rampant Credit Growth
Policymakers are justifying stimulative policies by stressing ongoing woes in the Europe-wide manufacturing downturn. Yet, they are paying little attention to genuine inflationary pressures in their own economies. Most notably in Hungary, the National Bank of Hungary (NBH) has been aggressively suppressing its policy rate and engaging in a corporate QE program, despite rising inflation and an overheating economy. Similarly, the National Bank of Poland (NBP) seems inclined to cut rates sooner rather than later. On the other end of the spectrum though, the Czech National Bank (CNB) is the only CE central bank to have embarked on a rate hiking cycle over the past 18 months. Going forward, the CNB looks most likely to normalize rates by continuing its hiking cycle. This development will favor rate differentials between it and the rest of CE. As such, we remain long the CZK versus both the HUF and PLN (Chart III-3). Chart III-3Favor CZK Versus PLN & HUF
Favor CZK Versus PLN & HUF
Favor CZK Versus PLN & HUF
Chart III-4Germany's Manufacturing Cycles And CE Inflation
Germany's Manufacturing Cycles And CE Inflation
Germany's Manufacturing Cycles And CE Inflation
Second, European manufacturing cycles have historically defined CE inflation trends, with time lags of around 12 to 18 months. However, this time around, the euro area manufacturing recession will not translate into slower CE inflation and growth dynamics (Chart III-4). Above all, booming credit induced by real negative borrowing costs has incentivized robust domestic demand in general and construction activity in particular in CE. In addition, employment growth remains strong and double-digit wage growth has supported strong consumer spending (Chart III-5). As a result, manufacturing production volumes have remained relatively resilient in Hungary and Poland, even as manufacturing output volumes in both Germany and the broader euro area have been contracting (Chart III-6). Chart III-5Strong Domestic Demand In CE…
bca.ems_wr_2019_10_31_s3_c5
bca.ems_wr_2019_10_31_s3_c5
Chart III-6...Entails Divergences In Manufacturing With Euro Area
...Entails Divergences In Manufacturing With Euro Area
...Entails Divergences In Manufacturing With Euro Area
Third, inflationary pressures in CE are both acute and genuine. Wage growth has been rising faster than productivity growth across the region, leading to surging unit labor costs (Chart III-7). Mounting wage pressures reflect widespread labor shortages. Further, output gaps in these economies have turned positive, which has historically been a precursor of inflationary pressures. Finally, fiscal policy in CE will remain very expansionary, supporting strong business and consumer demand. Bottom Line: Super-accommodative monetary and fiscal policies have led to a classic case of overheating within CE, particularly in Hungary and Poland, and less so in the Czech Republic. Chart III-7Genuine Inflationary Pressures In Central Europe
Genuine Inflationary Pressures In Central Europe
Genuine Inflationary Pressures In Central Europe
Chart III-8A Widening Current Account Deficit Is A Symptom Of Overheating
A Widening Current Account Deficit Is A Symptom Of Overheating
A Widening Current Account Deficit Is A Symptom Of Overheating
Investment Implications Deteriorating current accounts (Chart III-8), rising inflation and behind-the-curve central banks warrant further currency depreciation in both Hungary and Poland. This is why we continue to recommend a short position on both the HUF and PLN versus the CZK. We are closing our Hungarian/euro area relative three-year swap rate trade with a loss of 87 basis points. Our expectation that the market would price in rate hikes in Hungary despite the central bank’s dovishness has not materialized. Investors should remain overweight CE equities within an EM portfolio due to strong domestic demand in these economies and no direct economic exposure to China. As we expect EM equities to underperform DM stocks, we continue to recommend underweighting CE versus the core European markets. We are downgrading our allocation to CE local currency bonds from overweight to neutral within an EM domestic bond portfolio. The primary reason is a risk of a selloff in core European rates. Anddrija Vesic Research Analyst andrija@bcaresearch.com Footnotes 1. Please see Emerging Markets Strategy, "Mexico: The Best Value In EM Fixed Income," dated April 23, 2019 and "Mexico: Crying Out For Policy Easing," dated September 5, 2019, available at ems.bcaresearch.com Equities Recommendations Currencies, Credit And Fixed-Income Recommendations
The first thing that sticks out in the chart above is that the 5-year note offers poor value. We also note that the curve steepens sharply beyond the 5-year maturity point, so maturities greater than 5 years benefit a lot from rolldown. The simple…
Highlights Declining uncertainty over policy, stabilizing growth in China and improvements in international liquidity, all will allow global economic activity to pick up in the months ahead. A weak dollar will reinforce this positive economic outlook; investors should favor pro-cyclical currencies such as the AUD, NZD and SEK. Bond yields will rise and stocks will outperform bonds on a 12- to 18-month basis. Cyclical stocks are more attractive than defensives. European stocks will outperform U.S. equities and European financials will shine. Copper is a promising buy; stay long the silver-to-gold ratio. Feature The outlook for risk assets and bond yields hinges on global economic activity. The S&P 500 has hit a new high, but our BCA Equity Scorecard Indicator remains non-committal towards stocks (Chart I-1). If global economic activity improves, the Scorecard will begin to flash a clear buy signal, but if growth deteriorates, the indicator will point towards sell. Chart I-1Stocks Could Go Either Way
Stocks Could Go Either Way
Stocks Could Go Either Way
Cautious optimism is in order. Politics, China, liquidity conditions and the dollar collectively will determine the global economic outlook. The liquidity backdrop has significantly improved, political uncertainty should recede and China will morph from a headwind to a modest tailwind. A weak dollar will indicate that the world is healing, and also will ease global financial conditions which will facilitate economic strength. We remain committed to a positive stance on equities on a 12- to 18-month horizon, and recommend below-benchmark duration in fixed-income portfolios. Cyclicals should outperform defensives, European banks offer an attractive tactical buying opportunity and European equities will outperform their U.S. counterparts. Heightened Risks… Chart I-2Risks To The Economy And Stocks
Risks To The Economy And Stocks
Risks To The Economy And Stocks
Many domestic indicators overstate the intrinsic fragility in the U.S. The Duncan LEI, which is the ratio of consumer durable spending and residential and business investment to final sales, has flattened. Therefore, the S&P 500 looks vulnerable and real GDP may contract (Chart I-2). CEO confidence and small business capex intentions warn of a looming retrenchment in household income (Chart I-2, bottom two panels). If consumer spending weakens, then a recession will be unavoidable. As worrisome as these indicators may be, we previously discussed that the major debt imbalances that often precede U.S. recessions are absent,1 the rebound in housing starts and homebuilding confidence is inconsistent with a restrictive monetary stance,2 and pipeline inflationary pressures are absent.3 Instead, business confidence and the Duncan LEI have been eroded by heightened political uncertainty and weak global manufacturing and trade. … Meet Receding Policy Uncertainty … The two biggest sources of policy uncertainty affecting markets, the Sino-U.S. trade war and Brexit, are diminishing. However, the U.S. election will continue to lurk in the background. Chart I-3Weaker Brexit Support = No Hard Brexit Support
Weaker Brexit Support = No Hard Brexit Support
Weaker Brexit Support = No Hard Brexit Support
Brexit Westminster and Britain’s Supreme Court have rebuked U.K. Prime Minister Boris Johnson’s threat of a “No-Deal” Brexit. Moreover, parliamentary support for his latest plan, which essentially keeps Northern Ireland’s economy within the EU, indicates that the probability of a “No-Deal” Brexit has collapsed to less than 5%. This assessment is reinforced by the delay of Brexit to January 31, 2020. An election is scheduled for December 12 and the chance of a new referendum to vet the deal is escalating. According to Matt Gertken, BCA’s Geopolitical Strategist, an election does not increase the risk of a hard Brexit. Meanwhile, support for Brexit is near its lowest point since the June 2016 referendum (Chart I-3). Thus, a new plebiscite would not favor a “No Deal” Brexit. Sino-U.S. Trade War Chart I-4Why The Trade-War Ceasefire?
Why The Trade-War Ceasefire?
Why The Trade-War Ceasefire?
The trade war truce will also greatly diminish economic uncertainty. Uncertainty created by the China-U.S. conflict accentuated the collapse in business confidence and capex intentions. The “phase one deal” announced earlier this month will likely materialize. The White House’s tactical retreat on trade is tied to U.S. President Donald Trump’s desire for a second term. He cannot risk inflicting further economic pain on his base of constituents. Weekly earnings are decreasing for workers in swing states located in the industrial rust belt, especially in those areas that Trump carried in 2016 (Chart I-4). Those swing states are most affected by the slowdown in the global manufacturing and trade sectors. Beijing is also motivated to agree to truce due to its soft economy and deflationary pressures. An easing in trade uncertainty will be positive for the domestic economy. China’s willingness to replace Carrie Lam, the embattled Chief Executive of Hong Kong, and to withdraw the extradition bill at the heart of the protests confirms its eagerness to come to an agreement with the U.S. China’s readiness to make a deal is also made evident by its increasing imports of U.S. agricultural products (Chart I-4, bottom panel). Ultimately, the U.S. will not implement tariffs in December on $160 billion of Chinese shipments. Consequently, investors and businesses should become less concerned about the chances of a worsening trade war. Moreover, chances are growing of a decrease (but not a complete annulation) of the previously imposed U.S. tariffs on China. … And A Q1 2020 Acceleration In Global Growth Global economic activity will improve in Q1 2020 because the drag from China will dissipate and global liquidity conditions will improve. Many activity indicators increasingly reflect these fundamental supports. China China’s economy has reached a new low point: Q3 annual GDP growth is at a 27-year low of 6%, capital spending is weak, industrial production and profits show little life, the labor market is soft, and imports and exports continue to contract. However, a turn in policy has materialized, which will protect the domestic economy. Moreover, this summer’s Politburo and State Council statements showed an increased willingness to reflate the economy. The global economy will accelerate in Q1 2020. Credit creation has stabilized and monetary conditions have eased (Chart I-5). Faced with producer price inflation of -1.2% and employment PMIs of 47.3 and 48.2 in the manufacturing and non-manufacturing sectors, respectively, authorities have allowed the credit impulse to improve to 26% of GDP from a low of 23.8%. In accordance with this new policy direction, the drag from the shadow banking system’s contraction will slow considerably, thanks to a stabilization in both the growth rate of deposits of non-depository financial institutions and the issuance of bonds by small financial institutions. Additionally, the emission of local government bonds will accelerate. Beijing has also meaningfully eased fiscal policy, which is its preferred reflationary tool. Policymakers have cut taxes by 2.8% of GDP in the past two years. The marginal propensity of households to consume is trying to bottom (Chart I-5, bottom). If history is a guide, the acceleration in the rate of change of public-sector capex will fuel this turnaround in China’s marginal propensity to consume, and push up BCA’s China Activity Indicator (Chart I-6). Chart I-5Overlooked Chinese Improvements
Overlooked Chinese Improvements
Overlooked Chinese Improvements
Chart I-6Public Investment Matters
Public Investment Matters
Public Investment Matters
Chart I-7A Bottom In Chinese Exports Growth?
A Bottom In Chinese Exports Growth?
A Bottom In Chinese Exports Growth?
China’s economy is unlikely to bounce back as violently as in 2009, 2012 or 2016. Authorities are much more circumspect in their use of credit to reflate the economy than they were previously. Moreover, the regulatory environment will prevent a boom in the shadow banking system. Nonetheless, the fiscal push and the end of the decline in aggregate credit growth will allow the Chinese economy to stabilize and maybe pick up a bit. Therefore, China will move from a large headwind to a slight tailwind for global activity (Chart I-7, top panel). Mounting public capex also points toward a modest global recovery (Chart I-7, middle panel). Finally, the upturn in our Chinese reflation indicator, which incorporates both fiscal and monetary policy, points to a re-acceleration in U.S. capex intentions (Chart I-7, bottom panel). Global Liquidity Global liquidity conditions continue to improve and the global economy should soon respond within normal policy lags. 95% of central banks are loosening policy, which normally leads to an escalation in global activity (Chart I-8). The dominant central banks (the Federal Reserve, the European Central Bank and the Bank of Japan) will not tighten anytime soon. Inflation expectations in the U.S., the euro area and Japan stand at 1.9%, 1.1%, and 0.2%, respectively, well below levels consistent with a 2% inflation target. Moreover, U.S. core CPI has been perky, but both the ISM and the performance of transportation equities relative to utilities indicate that a deceleration in inflation is imminent (Chart I-9). Salaries are not yet inflationary either because U.S. real wages are growing in line with productivity (Chart I-9, bottom panel). In the euro area and Japan, realized core inflation remains at 1.0% and 0.5%, respectively, and supports the dovish message emanating from inflation expectations. Chart I-8Easier Global Policy Is Important
Easier Global Policy Is Important
Easier Global Policy Is Important
Chart I-9If Inflation Peaks, The U.S. Economy Will Breath A Sigh Of Relief
If Inflation Peaks, The U.S. Economy Will Breath A Sigh Of Relief
If Inflation Peaks, The U.S. Economy Will Breath A Sigh Of Relief
Liquidity indicators are reflecting this accommodative policy setting. The growth of U.S. and European bank deposits has reaccelerated from 2.5% to 6%, a development linked to the exit of a soft patch (Chart I-10). Moreover, BCA’s U.S. Financial Liquidity Indicator is still moving higher and flashing a resurgence in the BCA Global Leading Economic Indicator (LEI), the ISM Manufacturing Index, commodity prices, and EM export prices (Chart I-11). Finally, U.S. and global excess money reinforce the message of BCA’s U.S. Financial liquidity Indicator (Chart I-12). Chart I-10Deposits Suggest The Worst Of The Slowdown Is Behind Us
Deposits Suggest The Worst Of The Slowdown Is Behind Us
Deposits Suggest The Worst Of The Slowdown Is Behind Us
Chart I-11Continued Pick-Up In Financial Liquidity
Continued Pick-Up In Financial Liquidity
Continued Pick-Up In Financial Liquidity
The Fed will add to the supply of global liquidity by tackling the repo market’s seize-up. Depleting excess reserves and mounting financing needs among primary dealers resulted in the September surge in the Secured Overnight Financing Rate (SOFR). The Fed announced three weeks ago it would buy $60 billion per month of T-Bills and T-Notes, which will lead to a climbing stock of excess reserves. Higher excess reserves create a weaker dollar, stronger EM currencies and firming global PMIs (Chart I-13). Ultimately, EM currency strength eases EM financial conditions, which supports global growth (Chart I-13, bottom panel). Chart I-12Excess Liquidity Is Accelerating
Excess Liquidity Is Accelerating
Excess Liquidity Is Accelerating
Chart I-13U.S. Excess Reserves Will Grow Again
U.S. Excess Reserves Will Grow Again
U.S. Excess Reserves Will Grow Again
Borrowing activity in Advanced Economies is showing signs of life. Bank credit is already responding to the drop in global yields, and global corporate bond issuance in September 2019 rose to $434 billion. In the U.S., new issues of corporate bonds have also reaccelerated (Chart I-14). Global Growth Indicators Crucial indicators of global economic activity are picking up on this improving fundamental backdrop. The list includes: A sharp takeoff in the annualized three-month rate of change of capital goods orders in the U.S., the Eurozone and Japan (Chart I-15, top panel). Improvement in this indicator precedes progress in the annual growth rate of orders and in capex itself. Chart I-14Borrowers Are Responding To Easier Financial Conditions
Borrowers Are Responding To Easier Financial Conditions
Borrowers Are Responding To Easier Financial Conditions
Chart I-15Some Green Shoots Are Coming Through
Some Green Shoots Are Coming Through
Some Green Shoots Are Coming Through
Chart I-16Positive Market Signals
Positive Market Signals
Positive Market Signals
A significant upturn in the Philly Fed, Empire State, and Richmond Fed manufacturing surveys for October, which sends a positive signal for the ISM Manufacturing Index (Chart I-15, second panel). Moreover, the new orders and employment components of these surveys indicate that cyclical sectors of the economy will recover and the recent deterioration in employment conditions will be fleeting. A rebound in BCA’s EM economic diffusion index, which incorporates 23 variables. Such an increase usually precedes inflections in global industrial production (Chart I-15, bottom panel). An acceleration – both in absolute and relative terms - in the annual appreciation of Taiwanese stocks. A strong and outperforming Taiwanese equity market is a harbinger of firmer PMIs (Chart I-16, top two panels). A solid performance of EM carry trades financed in yen, European luxury equities, and the relative performance of global semiconductors, materials and industrial stocks, which signal stronger global PMIs (Chart I-16, bottom three panels). Bottom Line: The global economy will accelerate in Q1 2020. A melting probability of a “No-Deal” Brexit and a truce in the Sino-U.S. trade war will allow global uncertainty to recede. Concurrently, China’s economic slowdown is ending and global liquidity conditions are improving. The Dollar As The Arbiter Of Growth Chart I-17The Dollar Is A Counter-Cyclical Currency
The Dollar Is A Counter-Cyclical Currency
The Dollar Is A Counter-Cyclical Currency
The dollar faces potent headwinds. The greenback is a countercyclical currency; a business cycle upswing and a weak USD go hand in hand (Chart I-17). The tightness of this relationship results from a powerful feedback loop: weak growth boosts the dollar, but the dollar’s strength foments additional economic slowdown. Global liquidity and activity indicators signal a weaker dollar because they point toward an economic recovery. BCA’s U.S. Financial Liquidity Index, which foresaw a deceleration in the greenback’s rate of appreciation, is calling for an outright depreciation (Chart I-18, top panel). The expanding holdings of securities on U.S. commercial banks’ balance sheets (a key measure of liquidity) corroborates this message. According to a model based on the U.S., Eurozone, Japanese and Chinese broad money supply, the USD should significantly depreciate in the coming 12 months (Chart I-18, third panel). Finally, our EM Economic Diffusion Index validates pressures on the greenback, especially against commodity currencies (Chart I-18, bottom two panels). Chart I-18Liquidity And Growth Indicators Point To A Weaker Dollar
Liquidity And Growth Indicators Point To A Weaker Dollar
Liquidity And Growth Indicators Point To A Weaker Dollar
Growth differentials support this picture. Late last year, the stimulating effect of President Trump’s tax cuts allowed the U.S. to temporarily diverge from a weak global economy, but the U.S. manufacturing sector is now succumbing to the global slowdown. Once global growth snaps back, the U.S. is likely to lag behind as fiscal policy is becoming more stimulative outside the U.S. than in the U.S. Based on historical delays, this will continue to hurt the dollar (Chart I-19, top panel). Finally, the European economy generally outperforms the U.S. when China reflates, especially if Beijing’s push lifts the growth rate of M1 relative to M2, a proxy for China’s aggregate marginal propensity to consume (Chart I-20). Europe’s greater cyclicality reflects is larger exposure to both trade and manufacturing compared with the U.S. Chart I-19A Global Growth Convergence Will Hurt The Dollar
A Global Growth Convergence Will Hurt The Dollar
A Global Growth Convergence Will Hurt The Dollar
Chart I-20European Growth To Rise Vis-A-Vis The U.S.
European Growth To Rise Vis-A-Vis The U.S.
European Growth To Rise Vis-A-Vis The U.S.
The greenback is expensive and technically vulnerable, which compounds its cyclical risk. The trade-weighted dollar is at a 25% premium to its purchasing power parity equilibrium (PPP), an overvaluation comparable to its 1985 and 2002 peaks. Moreover, our Composite Technical Indicator is overextended and has formed a negative divergence with the price of the dollar (see page 54, Section III). Finally, speculators are massively long the U.S. Dollar Index (DXY). Balance-of-payment flows also flash a significant downside in the dollar (Chart I-21). The U.S. current account deficit stands at 2.5% of GDP, but it is widening in response to the dollar’s overvaluation and the White House’s expansive fiscal policy. Since 2011, foreign direct investments (FDI) have been the main driver of the dollar’s gyrations. Last year, net FDI surged in response to profit repatriations encouraged by the Tax Cuts and Jobs Act of 2017, while portfolio flows stayed in neutral territory. This regulatory change had a one-off impact and FDI will begin to dry out. Therefore, financing the widening current account deficit will become harder. Finally, after years in the red, net portfolio flows into Europe have turned positive (Chart I-21, bottom panel). The USD’s depreciation will ease global financial conditions and supports growth further. In this context, interest rate differentials are noteworthy. The two-year spread in real rates between the U.S. and the rest of the G-10 has fallen significantly since October 2018. Reversals in real rates herald a weaker dollar, especially when it faces valuation, technical and flow handicaps. Moreover, European five-year forward short rate expectations are near record lows. If global growth can stabilize, then the five-year forward one-month OIS will pick up, especially relative to the U.S. An uptick will boost the EUR/USD pair and hurt the dollar (Chart I-22). Chart I-21Balance-Of-Payments Dynamics Turning Against The USD
Balance-Of-Payments Dynamics Turning Against The USD
Balance-Of-Payments Dynamics Turning Against The USD
Chart I-22Relative Long-Term Rate Expectations And The Euro
Relative Long-Term Rate Expectations And The Euro
Relative Long-Term Rate Expectations And The Euro
The three most pro-cyclical currencies in the G-10 – the AUD, NZD and SEK - strengthen the most when BCA’s Global LEI bottoms but global inflation slows (Chart I-23). The GBP will likely generate a much stronger-than-normal performance next year. Cable trades at a 22% discount to PPP. It is also 19% cheap versus short-term interest rate parity models. The absence of a “No-Deal” Brexit should allow these risk premia to dissipate and the pound to recover. The CAD is also more attractive than Chart I-23 implies. The loonie is trading 10% below its PPP, and the USD/CAD often lags the EUR/CAD, a pair that has broken down (Chart I-24). Chart I-23Currency Performance As A Function Of Growth And Inflation
November 2019
November 2019
Chart I-24EUR/CAD Flashing A Bearish USD/CAD Signal
EUR/CAD Flashing A Bearish USD/CAD Signal
EUR/CAD Flashing A Bearish USD/CAD Signal
Bottom Line: A rebound in the global manufacturing sector next year will hurt the USD. The dollar is particularly vulnerable because growth differentials between the U.S. and the rest of the world have melted, the greenback is expensive, balance-of-payment dynamics are deteriorating and interest rate differentials are becoming less supportive. The USD’s depreciation will ease global financial conditions and supports growth further. Additional Investment Implications Bond Yields Have More Upside While the short-term outlook for bonds remains murky, the 12- to 18-month outlook is unambiguously bearish. The BCA Bond Valuation Index is still consistent with much higher U.S. yields in the next 12-18 months (see Section III, page 51). BCA’s Composite Technical Indicator for T-Notes is massively overbought and sentiment, as approximated by the Long-Term Interest Rates component of the ZEW survey, is overly bullish (Chart I-25). Thus, bonds represent an attractive cyclical sell. The Fed will not cut rates aggressively enough for bonds to ignore these valuation and technical risks. Treasurys have outperformed cash by 7.5% in the past year. Based on historical relationships, the Fed needs to cut rates to zero for bonds to beat cash in the coming 12 months (Chart I-26). After this week’s Fed cut to 1.75%, our base case is none to maybe one more rate cut. Chart I-25Sentiment Points To Yield Upside
Sentiment Points To Yield Upside
Sentiment Points To Yield Upside
Chart I-26The Fed Must Cut To Zero For T-Notes To Outperform Cash Further
The Fed Must Cut To Zero For T-Notes To Outperform Cash Further
The Fed Must Cut To Zero For T-Notes To Outperform Cash Further
Bond yields will need a recession to move lower. The deviation of 10-year Treasury yields from their two-year moving average closely tracks the Swedish Economic Diffusion Index (Chart I-27, top panel). Sweden, a small, open economy highly levered to the global industrial cycle, is a good gauge of the global business cycle. The broad weakness in the Swedish economy is unlikely to worsen unless the global slowdown morphs into a deep recession. Even if global growth remains mediocre, Sweden’s Economic Diffusion Index will rise along with yields. The expansion in securities holdings of U.S. commercial banks and the stabilization in China’s credit flows both support this notion (Chart I-27, bottom panel). Financial market developments also point to higher yields. Sectors that typically capture the momentum in the global economy are perking up. For example, bottoms in the annual performance of European luxury equities or Taiwanese stocks have preceded increases in yields (Chart I-28). Chart I-27Yields Have Upside
Yields Have Upside
Yields Have Upside
Chart I-28Key Financial Market Signals For Yields
Key Financial Market Signals For Yields
Key Financial Market Signals For Yields
Stocks Will Outperform Bonds Our conviction is strengthening that equities will outperform bonds. The total return of the stock-to-bond ratio has upside. BCA’s Global Economic and Financial Diffusion Index has rallied sharply, which often precedes an ascent in the stock-to-bond ratio, both in the U.S. and globally (Chart I-29). Bonds are much more expensive than stocks, therefore, only a recession will allow stocks to underperform in the coming 12 to 18 months. The environment is positive for equities. BCA’s Monetary Indicator is very elevated and our Composite Sentiment Indicator shows little complacency toward stocks among investors (see Section III, page 47). Finally, the strength in the U.S. Financial Liquidity Indicator supports the S&P 500’s returns (Chart I-30). Chart I-29Cyclical Indicators Argue In Favor Of Stocks Over Bonds
Cyclical Indicators Argue In Favor Of Stocks Over Bonds
Cyclical Indicators Argue In Favor Of Stocks Over Bonds
Chart I-30Liquidity Tailwind For The S&P 500
Liquidity Tailwind For The S&P 500
Liquidity Tailwind For The S&P 500
A few market developments are noteworthy. 55.6% of the S&P 500’s constituents have reported Q3 earnings, and 74% of those firms are beating estimates. Moreover, the market is generously rewarding firms with the largest positive earnings surprises. Additionally, the Value Line Geometric Index is forming a reverse head-and-shoulder pattern, while the relative performance of the Russell 2000 has formed a double bottom (Chart I-31). The environment also favors cyclicals relative to defensive equities. By lifting bond yields, stronger economic activity leads to a contraction in the multiples of defensives relative to cyclicals. The latter’s earnings expectations respond more positively to reviving economic activity, which creates an offset to climbing discount rates. As a result, cyclicals often outperform defensives when the stock-to-bond ratio increases, or after Taiwanese equities gain momentum (Chart I-32). Chart I-31Improving Equity Market Dynamics
Improving Equity Market Dynamics
Improving Equity Market Dynamics
Chart I-32Favor Cyclicals Over Defensives
Favor Cyclicals Over Defensives
Favor Cyclicals Over Defensives
Compared to other equity markets, the U.S. faces the most challenges. Our model forecasts a 3% annual drop in the S&P 500’s operating earnings in June 2020, and the deviation of U.S. equities from their 200-day moving average has greatly diverged from net earnings revisions (Chart I-33). U.S. equities have already discounted a turnaround in earnings. Moreover, the S&P 500’s margins have downside, a topic covered by BCA’s Chief Equity Strategist Anastasios Avgeriou.4 Our Composite Margin Proxy, Operating Margins Diffusion Index and Corporate Pricing Power Indicator all remain weak (Chart I-34). Downward pressure on margins will limit how rapidly earnings respond when a rebound in global economic activity lifts revenues. Finally, the S&P 500 trades at a historically elevated forward P/E ratio of 18.4, the MSCI EAFE trade at a much more reasonable 14-times forward earnings. Chart I-33Headwinds For U.S. Stocks
Headwinds For U.S. Stocks
Headwinds For U.S. Stocks
Chart I-34Headwinds For U.S. Margins
Headwinds For U.S. Margins
Headwinds For U.S. Margins
The tech sector will also weigh on the performance of U.S. equities relative to international stocks. Tech stocks represent 22.5% of the U.S. benchmark, compared with 9.7% for the euro area. Anastasios recently argued that software spending has remained surprisingly resilient despite the global economic slowdown; it will likely lag spending on machinery and structures when the cycle picks up.5 Consequently, tech earnings will lag other traditional cyclical sectors. Moreover, tech multiples will suffer when the dollar depreciates and bond yields rise (Chart I-35). As high-growth stocks, tech equities derive a large proportion of their intrinsic value from long-term deferred cash flows and their terminal value. Thus, tech multiples are highly sensitive to discount factors. Unaffected by those negatives, European equities will benefit most from the outperformance of stocks relative to bonds. A weak dollar will be the first positive for the common-currency returns of European equities. Valuations are the second tailwind. The risk premium for European equities is 300 basis points higher than for U.S. stocks. Moreover, U.S. margins will likely diminish relative to the Eurozone’s because of stronger unit labor costs in the U.S. Sector composition will also dictate the performance of European equities. Compared with the U.S., Europe is underweight tech and healthcare stocks, a defensive sector (Table I-1). Investors who favor Europe will also bet against these two sectors. Europe is a wager on the other cyclical sectors: materials, industrials, energy and financials. Chart I-35Tech P/Es Are At Risk
Tech P/Es Are At Risk
Tech P/Es Are At Risk
Table I-1Europe Overweights The Correct Cyclicals
November 2019
November 2019
European financials are particularly attractive. Negative European yields are a major handicap for European financials, but this handicap is already reflected in their price. European banks trade at a price-to-book ratio of 0.6 versus 1.3 for the U.S. This discount should be narrowing, not widening. Yields are bottoming and European loan growth is contracting at a -2% annual rate relative to the U.S. versus -8.6% five years ago. Meanwhile, the annual rate of change of European deposits is in line with the U.S. The attraction of European banks comes from the outlook for their return on tangible equity. A model shows that three variables govern European banks’ ROE: German yields, Italian spreads and the momentum of the silver-to-gold ratio (SGR). German yields impact net interest margins, Italian spreads drive peripheral financial conditions and thus, loan generation in the European periphery, and the SGR tracks the global manufacturing cycle (silver has more industrial uses than gold, but is equally sensitive to real yields), which affects loan flows in the European core. This model logically tracks the performance of European banks and financials (Chart I-36). Our positive outlook on global growth and yields, along with the fall in Italian spreads, augurs well for cheap European financial equities and banks in particular. Commodities Our constructive stance on the global business cycle and yields, plus our negative view on the greenback, is consistent with higher industrial commodity prices. Copper looks particularly attractive. Speculators are aggressively selling the metal, whose price stands at an important technical juncture (Chart I-37). Chart I-36The Drivers Of RoE Point To Higher European Bank Stock Prices
The Drivers Of RoE Point To Higher European Bank Stock Prices
The Drivers Of RoE Point To Higher European Bank Stock Prices
Chart I-37Cooper Is An Attractive Play On Global Growth
Cooper Is An Attractive Play On Global Growth
Cooper Is An Attractive Play On Global Growth
Chart I-38Favorable Technical Backdrop For Silver-To-Gold Ratio
Favorable Technical Backdrop For Silver-To-Gold Ratio
Favorable Technical Backdrop For Silver-To-Gold Ratio
Finally, we have favored the SGR since late June. Silver is deeply oversold and under-owned relative to the yellow metal (Chart I-38). Consequently, silver’s greater industrial usage should be a potent tailwind for the SGR.6 Mathieu Savary Vice President The Bank Credit Analyst October 31, 2019 Next Report: November 22, 2019 - Outlook 2020 II. Back To The Nineteenth Century The Cold War is a limited analogy for the U.S.-China conflict; In a multipolar world, complete bifurcation of trade is difficult if not impossible; History suggests that trade between rivals will continue, with minimal impediments; On a secular horizon, buy defense stocks, Europe, capex, and non-aligned countries. There is a growing consensus that China and the U.S. are hurtling towards a Cold War. BCA Research played some part in this consensus – at least as far as the investment community is concerned – by publishing “Power and Politics in East Asia: Cold War 2.0?” in September 2012.7 For much of this decade, Geopolitical Strategy focused on the thesis that geopolitical risk was rotating out of the Middle East, where it was increasingly irrelevant, to East Asia, where it would become increasingly relevant. This thesis remains cogent, but it does not mean that a “Silicon Curtain” will necessarily divide the world into two bifurcated zones of capitalism. Trade, capital flows, and human exchanges between China and the U.S. will continue and may even grow. But the risk of conflict, including a military one, will not decline. In this report, we first review the geopolitical logic that underpins Sino-American tensions. We then survey the academic literature for clues on how that relationship will develop vis-à-vis trade and economic relations. The evidence from political theory is surprising and highly investment relevant. We then look back at history for clues as to what this means for investors. The U.S.-China conflict will not lead to complete bifurcation of the global economy. Our conclusion is that it is highly likely that the U.S. and China will continue to be geopolitical rivals. However, due to the geopolitical context of multipolarity, it is unlikely that the result will be “Bifurcated Capitalism.” Rather, we expect an exciting and volatile environment for investors where geopolitics takes its historical place alongside valuation, momentum, fundamentals, and macroeconomics in the pantheon of factors that determine investment opportunities and risks. The Thucydides Trap Is Real … Speaking in the Reichstag in 1897, German Foreign Secretary Bernhard von Bülow proclaimed that it was time for Germany to demand “its own place in the sun.”8 The occasion was a debate on Germany’s policy towards East Asia. Bülow soon ascended to the Chancellorship under Kaiser Wilhelm II and oversaw the evolution of German foreign policy from Realpolitik to Weltpolitik. While Realpolitik was characterized by Germany’s cautious balancing of global powers under Chancellor Otto von Bismarck, Weltpolitik saw Bülow and Wilhelm II seek to redraw the status quo through aggressive foreign and trade policy. Imperial Germany joined a long list of antagonists, from Athens to today’s People’s Republic of China, in the tragic play of human history dubbed the “Thucydides Trap.”9 Chart II-1Imperial Overstretch
Imperial Overstretch
Imperial Overstretch
The underlying concept is well known to all students of world history. It takes its name from the Greek historian Thucydides and his seminal History of the Peloponnesian War. Thucydides explains why Sparta and Athens went to war but, unlike his contemporaries, he does not moralize or blame the gods. Instead, he dispassionately describes how the conflict between a revisionist Athens and established Sparta became inevitable due to a cycle of mistrust. Graham Allison, one of America’s preeminent scholars of international relations, has argued that the interplay between a status quo power and a challenger has almost always led to conflict. In 12 out of the 16 cases he surveyed, actual military conflict broke out. Of the four cases where war did not develop, three involved transitions between countries that shared a deep cultural affinity and a respect for the prevailing institutions.10 In those cases, the transition was a case of new management running largely the same organizational structure. And one of the four non-war outcomes was nothing less than the Cold War between the Soviet Union and the U.S. The fundamental problem for a status quo power is that its empire or “sphere of influence” remains the same size as when it stood at the zenith of power. However, its decline in a relative sense leads to a classic problem of “imperial overstretch.” The hegemonic or imperial power erroneously doubles down on maintaining a status quo that it can no longer afford (Chart II-1). The challenger power is not blameless. It senses weakness in the hegemon and begins to develop a regional sphere of influence. The problem is that regional hegemony is a perfect jumping off point towards global hegemony. And while the challenger’s intentions may be limited and restrained (though they often are ambitious and overweening), the status quo power must react to capabilities, not intentions. The former are material and real, whereas the latter are perceived and ephemeral. In a multipolar world, the U.S. will not be able to exclude China from the global system. The challenging power always has an internal logic justifying its ambitions. In China’s case today, there is a sense among the elite that the country is merely mean-reverting to the way things were for many centuries in China’s and Asia’s long history (Chart II-2). In other words, China is a “challenger” power only if one describes the status quo as the past three hundred years. It is the “established” power if one goes back to an earlier state of affairs. As such, the consensus in China is that it should not have to pay deference to the prevailing status quo given that the contemporary context is merely the result of western imperialist “challenges” to the established Chinese and regional order. Chart II-2China’s Mean Reverting Narrative
November 2019
November 2019
In addition, China has a legitimate claim that it is at least as relevant to the global economy as the U.S. and therefore deserves a greater say in global governance. While the U.S. still takes a larger share of the global economy, China has contributed 23% to incremental global GDP over the past two decades, compared to 13% for the U.S. (Chart II-3). Chart II-3The Beijing Consensus
November 2019
November 2019
Bottom Line: The emerging tensions between China and the U.S. fit neatly into the theoretical and empirical outlines of the Thucydides Trap. We do not see any way for the two countries to avoid struggle and conflict on a secular or forecastable horizon. What does this mean for investors? For one, the secular tailwinds behind defense stocks will persist. But what beyond that? Is the global economy destined to witness complete bifurcation into two armed camps separated by a Silicon Curtain? Will the Alibaba and Amazon Pacts suspiciously glare at each other the way that NATO and Warsaw Pacts did amidst the Cold War? The answer, tentatively, is no. … But It Will Not Lead To Economic Bifurcation President Trump’s aggressive trade policy also fits neatly into political theory, to a point. Realism in political science focuses on relative gains over absolute gains in all relationships, including trade. This is because trade leads to economic prosperity, prosperity to the accumulation of economic surplus, and economic surplus to military spending, research, and development. Two states that care only about relative gains due to rivalry produce a zero-sum game with no room for cooperation. It is a “Prisoner’s Dilemma” that can lead to sub-optimal economic outcomes in which both actors chose not to cooperate. Diagram II-1 illustrates the effects of relative gain calculations on the trade behavior of states. In the absence of geopolitics, demand (Q3) is satisfied via trade (Q3-Q0) due to the inability of domestic production (Q0) to meet it. Diagram II-1Trade War In A Bipolar World
November 2019
November 2019
However, geopolitical externality – a rivalry with another state – raises the marginal social cost of imports – i.e. trade allows the rival to gain more out of trade and “catch up” in terms of geopolitical capabilities. The trading state therefore eliminates such externalities with a tariff (t), raising domestic output to Q1, while shrinking demand to Q2, thus reducing imports to merely Q2-Q1, a fraction of where they would be in a world where geopolitics do not matter. The dynamic of relative gains can also have a powerful pull on the hegemon as it begins to weaken and rethink its originally magnanimous trade relations. As political scientist Duncan Snidal argued in a 1991 paper, When the global system is first set up, the hegemon makes deals with smaller states. The hegemon is concerned more with absolute gains, smaller states are more concerned with relative, so they are tougher negotiators. Cooperative arrangements favoring smaller states contribute to relative hegemonic decline. As the unequal distribution of benefits in favor of smaller states helps them catch up to the hegemonic actor, it also lowers the relative gains weight they place on the hegemonic actor. At the same time, declining relative preponderance increases the hegemonic state’s concern for relative gains with other states, especially any rising challengers. The net result is increasing pressure from the largest actor to change the prevailing system to gain a greater share of cooperative benefits.11 History teaches us that trade occurs even amongst rivals and during wartime. The reason small states are initially more concerned with relative gains is because they are far more concerned with national security than the hegemon. The hegemon has a preponderance of power and is therefore more relaxed about its security needs. This explains why Presidents George Bush Sr., Bill Clinton, and George Bush Jr. all made “bad deals” with China. Writing nearly thirty years ago, Snidal cogently described the current U.S.-China trade war. Snidal thought he was describing a coming decade of anarchy. But he and fellow political scientists writing in the early 1990s underestimated American power. The “unipolar moment” of American supremacy was not over, it was just beginning! As such, the dynamic Snidal described took thirty years to come to fruition. When thinking about the transition away from U.S. hegemony, most investors anchor themselves to the Cold War as it is the only world they have known that was not unipolar. Moreover the Cold War provides a simple, bipolar distribution of power that is easy to model through game theory. If this is the world we are about to inhabit, with the U.S. and China dividing the whole planet into spheres like the U.S. and Soviet Union, then the paragraph we lifted from Snidal’s paper would be the end of it. America would abandon globalization in totality, impose a draconian Silicon Curtain around China, and coerce its allies to follow suit. But most of recent human history has been defined by a multipolar distribution of power between states, not a bipolar one. The term “cold war” is applicable to the U.S. and China in the sense that comparable military power may prevent them from fighting a full-blown “hot war.” But ultimately the U.S.-Soviet Cold War is a poor analogy for today’s world. In a multipolar world, Snidal concludes, “states that do not cooperate fall behind other relative gains maximizers that cooperate among themselves. This makes cooperation the best defense (as well as the best offense) when your rivals are cooperating in a multilateral relative gains world.” Snidal shows via formal modeling that as the number of players increases from two, relative-gains sensitivity drops sharply.12 The U.S.-China relationship does not occur in a vacuum — it is moderated by the global context. Today’s global context is one of multipolarity. Multipolarity refers to the distribution of geopolitical power, which is no longer dominated by one or two great powers (Chart II-4). Europe and Japan, for instance, have formidable economies and military capabilities. Russia remains a potent military power, even as India surpasses it in terms of overall geopolitical power. Chart II-4The World Is No Longer Bipolar
The World Is No Longer Bipolar
The World Is No Longer Bipolar
A multipolar world is the least “ordered” and the most unstable of world systems (Chart II-5). This is for three reasons: Chart II-5Multipolarity Is Messy
Multipolarity Is Messy
Multipolarity Is Messy
Math: Multipolarity engenders more potential “conflict dyads” that can lead to conflict. In a unipolar world, there is only one country that determines norms and rules of behavior. Conflict is possible, but only if the hegemon wishes it. In a bipolar world, conflict is possible, but it must align along the axis of the two dominant powers. In a multipolar world, alliances are constantly shifting and producing novel conflict dyads. Lack of coordination: Global coordination suffers in periods of multipolarity as there are more “veto players.” This is particularly problematic during times of stress, such as when an aggressive revisionist power uses force or when the world is faced with an economic crisis. Charles Kindleberger has argued that it was exactly such hegemonic instability that caused the Great Depression to descend into the Second World War in his seminal The World In Depression.13 Mistakes: In a unipolar and bipolar world, there are a very limited number of dice being rolled at once. As such, the odds of tragic mistakes are low and can be mitigated with complex formal relationships (such as U.S.-Soviet Mutually Assured Destruction, grounded in formal modeling of game theory). But in a multipolar world, something as random as an assassination of a dignitary can set in motion a global war. The multipolar system is far more dynamic and thus unpredictable. Diagram II-2 is modified for a multipolar world. Everything is the same, except that we highlight the trade lost to other great powers. The state considering using tariffs to lower the marginal social cost of trading with a rival must account for this “lost trade.” In the context of today’s trade war with China, this would be the sum of all European Airbuses and Brazilian soybeans sold to China in the place of American exports. For China, it would be the sum of all the machinery, electronics, and capital goods produced in the rest of Asia and shipped to the United States. Diagram II-2Trade War In A Multipolar World
November 2019
November 2019
Could Washington ask its allies – Europe, Japan, South Korea, Taiwan, etc. – not to take advantage of the lucrative trade (Q3-Q0)-(Q2-Q1) lost due to its trade tiff with China? Sure, but empirical research shows that they would likely ignore such pleas for unity. Alliances produced by a bipolar system produce a statistically significant and large impact on bilateral trade flows, a relationship that weakens in a multipolar context. This is the conclusion of a 1993 paper by Joanne Gowa and Edward D. Mansfield.14 The authors draw their conclusion from an 80-year period beginning in 1905, which captures several decades of global multipolarity. Unless the U.S. produces a wholehearted diplomatic effort to tighten up its alliances and enforce trade sanctions – something hardly foreseeable under the current administration – the self-interest of U.S. allies will drive them to continue trading with China. The U.S. will not be able to exclude China from the global system; nor will China be able to achieve Xi Jinping’s vaunted “self-sufficiency.” A risk to our view is that we have misjudged the global system, just as political scientists writing in the early 1990s did. To that effect, we accept that Charts II-1 and II-4 do not really support a view that the world is in a balanced multipolar state. The U.S. clearly remains the most powerful country in the world. The problem is that it is also clearly in a relative decline and that its sphere of influence is global – and thus very expensive – whereas its rivals have merely regional ambitions (for the time being). As such, we concede that American hegemony could be reasserted relatively quickly, but it would require a significant calamity in one of the other poles of power. For instance, a breakdown in China’s internal stability alongside the recovery of U.S. political stability. Bottom Line: The trade war between the U.S. and China is geopolitically unsustainable. The only way it could continue is if the two states existed in a bipolar world where the rest of the states closely aligned themselves behind the two superpowers. We have a high conviction view that today’s world is – for the time being – multipolar. American allies will cheat and skirt around Washington’s demands that China be isolated. This is because the U.S. no longer has the preponderance of power that it enjoyed in the last decade of the twentieth and the first decade of the twenty-first century. Insights presented thus far come from formal theory in political science. What does history teach us? Trading With The Enemy In 1896, a bestselling pamphlet in the U.K., “Made in Germany,” painted an ominous picture: “A gigantic commercial State is arising to menace our prosperity, and contend with us for the trade of the world.”15 Look around your own houses, author E.E. Williams urged his readers. “The toys, and the dolls, and the fairy books which your children maltreat in the nursery are made in Germany: nay, the material of your favorite (patriotic) newspaper had the same birthplace as like as not.” Williams later wrote that tariffs were the answer and that they “would bring Germany to her knees, pleading for our clemency.”16 By the late 1890s, it was clear to the U.K. that Germany was its greatest national security threat. The Germany Navy Laws of 1898 and 1900 launched a massive naval buildup with the singular objective of liberating the German Empire from the geographic constraints of the Jutland Peninsula. By 1902, the First Lord of the Royal Navy pointed out that “the great new German navy is being carefully built up from the point of view of a war with us.”17 There is absolutely no doubt that Germany was the U.K.’s gravest national security threat. As a result, London signed in April 1904 a set of agreements with France that came to be known as Entente Cordiale. The entente was immediately tested by Germany in the 1905 First Moroccan Crisis, which only served to strengthen the alliance. Russia was brought into the pact in 1907, creating the Triple Entente. In hindsight, the alliance structure was obvious given Germany’s meteoric rise from unification in 1871. However, one should not underestimate the magnitude of these geopolitical events. For the U.K. and France to resolve centuries of differences and formalize an alliance in 1904 was a tectonic shift — one that they undertook against the grain of history, entrenched enmity, and ideology.18 Political scientists and historians have noted that geopolitical enmity rarely produces bifurcated economic relations exhibited during the Cold War. Both empirical research and formal modeling shows that trade occurs even amongst rivals and during wartime.19 This was certainly the case between the U.K. and Germany, whose trade steadily increased right up until the outbreak of World War One (Chart II-6). Could this be written off due to the U.K.’s ideological commitment to laissez-faire economics? Or perhaps London feared a move against its lightly defended colonies in case it became protectionist? These are fair arguments. However, they do not explain why Russia and France both saw ever-rising total trade with the German Empire during the same period (Chart II-7). Either all three states were led by incompetent policymakers who somehow did not see the war coming – unlikely given the empirical record – or they simply could not afford to lose out on the gains of trade with Germany to each other. Chart II-6The Allies Traded With Germany ...
November 2019
November 2019
Chart II-7… Right Up To WWI
November 2019
November 2019
Chart II-8Japan And U.S. Never Downshifted Trade
November 2019
November 2019
A similar dynamic was afoot ahead of World War Two. Relations between the U.S. and Japan soured in the 1930s, with the Japanese invasion of Manchuria in 1931. In 1935, Japan withdrew from the 1922 Washington Naval Treaty – the bedrock of the Pacific balance of power – and began a massive naval buildup. In 1937, Japan invaded China. Despite a clear and present danger, the U.S. continued to trade with Japan right up until July 26, 1941, few days after Japan invaded southern Indochina (Chart II-8). On December 7, Japan attacked the U.S. A skeptic may argue that precisely because policymakers sleepwalked into war in the First and Second World Wars, they will not (or should not) make the same mistake this time around. First, we do not make policy prescriptions and therefore care not what should happen. Second, we are highly skeptical of the view that policymakers in the early and mid-twentieth century were somehow defective (as opposed to today’s enlightened leaders). Our constraints-based framework urges us to seek systemic reasons for the behavior of leaders. Political science provides a clear theoretical explanation for why London and Washington continued to trade with the enemy despite the clarity of the threat. The answer lies in the systemic nature of the constraint: a multipolar world reduces the sensitivity of policymakers to relative gains by introducing a collective action problem thanks to changing alliances and the difficulty of disciplining allies’ behavior. In the case of U.S. and China, this is further accentuated by President Trump’s strategy of skirting multilateral diplomacy and intense focus on mercantilist measures of power (i.e. obsession with the trade deficit). An anti-China trade policy that was accompanied by a magnanimous approach to trade relations with allies could have produced a “coalition of the willing” against Beijing. But after two years of tariffs and threats against the EU, Japan, and Canada, the Trump administration has already signaled to the rest of the world that old alliances and coordination avenues are up for revision. There are two outcomes that we can see emerging over the course of the next decade. First, U.S. leadership will become aware of the systemic constraints under which they operate, and trade with China will continue – albeit with limitations and variations. However, such trade will not reduce the geopolitical tensions, nor will it prevent a military conflict. In facts, the probability of military conflict may increase even as trade between China and the U.S. remains steady. Second, U.S. leadership will fail to correctly assess that they operate in a multipolar world and will give up the highlighted trade gains from Diagram II-2 to economic rivals such as Europe and Japan. Given our methodological adherence to constraint-based forecasting, we highly doubt that the latter scenario is likely. Bottom Line: The China-U.S. conflict is not a replay of the Cold War. Systemic pressures from global multipolarity will force the U.S. to continue to trade with China, with limitations on exchanges in emergent, dual-use technologies that China will nonetheless source from other technologically advanced countries. This will create a complicated but exciting world where geopolitics will cease to be seen as exogenous to investing. A risk to the sanguine conclusion is that the historical record is applicable to today, but that the hour is late, not early. It is already July 26, 1941 – when U.S. abrogated all trade with Japan – not 1930. As such, we do not have another decade of trade between U.S. and China remaining, we are at the end of the cycle. While this is a risk, it is unlikely. American policymakers would essentially have to be willing to risk a military conflict with China in order to take the trade war to the same level they did with Japan. It is an objective fact that China has meaningfully stepped up aggressive foreign policy in the region. But unlike Japan in 1941, China has not outright invaded any countries over the past decade. As such, the willingness of the public to support such a conflict is unclear, with only 21% of Americans considering China a top threat to the U.S. Investment Implications This analysis is not meant to be optimistic. First, the U.S. and China will continue to be rivals even if the economic relationship between them does not lead to global bifurcation. For one, China continues to be – much like Germany in the early twentieth century – concerned with access to external markets on which 19.5% of its economy still depend. China is therefore developing a modern navy and military not because it wants to dominate the rest of the world but because it wants to dominate its near abroad, much as the U.S. wanted to, beginning with the Monroe Doctrine. This will continue to lead to Chinese aggression in the South and East China Seas, raising the odds of a conflict with the U.S. Navy. Given that the Thucydides Trap narrative remains cogent, investors should look to overweight S&P 500 aerospace and defense stocks relative to global equity markets. An alternative way that one could play this thesis is by developing a basket of global defense stocks. Multipolarity may create constraints to trade protectionism, but it engenders geopolitical volatility and thus buoys defense spending. Second, we would not expect another uptick in globalization. Multipolarity may make it difficult for countries to completely close off trade with a rival, but globalization is built on more than just trade between rivals. Globalization requires a high level of coordination among great powers that is only possible under hegemonic conditions. Chart II-9 shows that the hegemony of the British and later American empires created a powerful tailwind for trade over the past two hundred years. Chart II-9The Apex Of Globalization Is Behind Us
The Apex Of Globalization Is Behind Us
The Apex Of Globalization Is Behind Us
The Apex of Globalization has come and gone – it is all downhill from here. But this is not a binary view. Foreign trade will not go to zero. The U.S. and China will not completely seal each other’s sphere of influence behind a Silicon Curtain. Instead, we focus on five investment themes that flow from a world that is characterized by the three trends of multipolarity, Sino-U.S. geopolitical rivalry, and apex of globalization: Europe will profit: As the U.S. and China deepen their enmity, we expect some European companies to profit. There is some evidence that the investment community has already caught wind of this trend, with European equities modestly outperforming their U.S. counterparts whenever trade tensions flared up in 2019 (Chart II-10). Given our thesis, however, it is unlikely that the U.S. would completely lose market share in China to Europe. As such, we specifically focus on tech, where we expect the U.S. and China to ramp up non-tariff barriers to trade regardless of systemic pressures to continue to trade. A strategic long in the secularly beleaguered European tech companies relative to their U.S. counterparts may therefore make sense (Chart II-11). Chart II-10Europe: A Trade War Safe Haven
Europe: A Trade War Safe Haven
Europe: A Trade War Safe Haven
Chart II-11Is Europe Really This Incompetent?
Is Europe Really This Incompetent?
Is Europe Really This Incompetent?
USD bull market will end: A trade war is a very disruptive way to adjust one’s trade relationship. It opens one to retaliation and thus the kind of relative losses described in this analysis. As such, we expect that U.S. to eventually depreciate the USD, either by aggressively reversing 2018 tightening or by coercing its trade rivals to strengthen their currencies. Such a move will be yet another tailwind behind the diversification away from the USD as a reserve currency, a move that should benefit the euro. Bull market in capex: The re-wiring of global manufacturing chains will still take place. The bad news is that multinational corporations will have to dip into their profit margins to move their supply chains to adjust to the new geopolitical reality. The good news is that they will have to invest in manufacturing capex to accomplish the task. One way to articulate this theme is to buy an index of semiconductor capital companies (AMAT, LRCX, KLAC, MKSI, AEIS, BRIKS, and TER). Given the highly cyclical nature of capital companies, we would recommend an entry point once trade tensions subside and green shoots of global growth appear. “Non-aligned” markets will benefit: The last time the world was multipolar, great powers competed through imperialism. This time around, a same dynamic will develop as countries seek to replicate China’s “Belt and Road Initiative.” This is positive for frontier markets. A rush to provide them with exports and services will increase supply and thus lower costs, providing otherwise forgotten markets with a boon of investments. India, and Asia-ex-China more broadly, stand as intriguing alternatives to China, especially with the current administration aggressively reforming to take advantage of the rewiring of global manufacturing chains. Capital markets will remain globalized: With interest rates near zero in much of the developed world and the demographic burden putting an ever-greater pressure on pension plans to generate returns, the search for yield will continue to be a powerful drive that keeps capital markets globalized. Limitations are likely to grow, especially when it comes to cross-border private investments in dual-use technologies. But a completely bifurcation of capital markets is unlikely. The world we are describing is one where geopolitics will play an increasingly prominent role for global investors. It would be convenient if the world simply divided into two warring camps, leaving investors with neatly separated compartments that enabled them to go back to ignoring geopolitics. This is unlikely. Rather, the world will resemble the dynamic years at the end of the nineteenth century, a rough-and-tumble era that required a multi-disciplinary approach to investing. Marko Papic Consulting Editor, BCA Research Chief Strategist, Clocktower Group III. Indicators And Reference Charts The S&P 500 is making marginally new all-time highs. Seasonality is becoming very favorable for stock prices. However, our U.S. profit model continues to point south and expanding multiples have already driven this year’s equity gains. The S&P 500 has therefore already priced in a significant improvement in profits. Further P/E expansion will be harder to come by with bond yields set to rise. Thus, until the dollar falls and creates another tailwind for profits, stocks will not be as strong as seasonality suggests and will only make marginal new highs. Our Revealed Preference Indicator (RPI) remains cautious towards equities. The RPI combines the idea of market momentum with valuation and policy measures. It provides a powerful bullish signal if positive market momentum lines up with constructive readings from the policy and valuation measures. Conversely, if strong market momentum is not supported by valuations and policy, investors should lean against the market trend. Until global growth bottoms and boosts the earnings forecasts of our models, stock gains will stay limited. The outlook for next year remains constructive for stocks. Our Willingness-to-Pay (WTP) indicator for the U.S. continues to improve. This same indicator has recently turned lower in Japan. Meanwhile, it is deteriorating further in Europe. The WTP indicator tracks flows, and thus provides information on what investors are actually doing, as opposed to sentiment indexes that track how investors are feeling. Global yields have turned higher but they remain at exceptionally stimulating levels. Moreover, money and liquidity growth has picked up around the world, and global central banks continue to conduct very dovish policies. As a result, our Monetary Indicator remains at extremely elevated levels. Furthermore, our Composite Technical Indicator is still flashing a buy signal. Also, our BCA Composite Valuation index is still improving. As a result, our Speculation Indicator is back in the neutral zone. 10-year Treasury yields continue to rise, but they remain very expensive. Moreover, both our Bond Valuation Index and our Composite Technical Indicators are still flashing high-conviction sell signals. If the strengthening of the Commodity Index Advance/Decline line results in higher natural resource prices, then, inflation breakevens will also climb meaningfully. Therefore, the current setup argues for a below-benchmark duration in fixed-income portfolios. Weak global growth has been the key support for the dollar in recent months. On a PPP basis, the U.S. dollar remains extremely expensive. Additionally, our Composite Technical Indicator has lost momentum and has formed a negative divergence with the Greenback’s level. Moreover, the U.S. current account deficit has begun to widen anew. This backdrop makes the dollar highly vulnerable to a rebound in global growth. In fact, a breakdown in the greenback will be the clearest signal yet that global growth is rebounding for good. EQUITIES: Chart III-1U.S. Equity Indicators
U.S. Equity Indicators
U.S. Equity Indicators
Chart III-2Willingness To Pay For Risk
Willingness To Pay For Risk
Willingness To Pay For Risk
Chart III-3U.S. Equity Sentiment Indicators
U.S. Equity Sentiment Indicators
U.S. Equity Sentiment Indicators
Chart III-4Revealed Preference Indicator
Revealed Preference Indicator
Revealed Preference Indicator
Chart III-5U.S. Stock Market Valuation
U.S. Stock Market Valuation
U.S. Stock Market Valuation
Chart III-6U.S. Earnings
U.S. Earnings
U.S. Earnings
Chart III-7Global Stock Market And Earnings: Relative Performance
Global Stock Market And Earnings: Relative Performance
Global Stock Market And Earnings: Relative Performance
Chart III-8Global Stock Market And Earnings: Relative Performance
Global Stock Market And Earnings: Relative Performance
Global Stock Market And Earnings: Relative Performance
FIXED INCOME: Chart III-9U.S. Treasurys And Valuations
U.S. Treasurys And Valuations
U.S. Treasurys And Valuations
Chart III-10Yield Curve Slopes
Yield Curve Slopes
Yield Curve Slopes
Chart III-11Selected U.S. Bond Yields
Selected U.S. Bond Yields
Selected U.S. Bond Yields
Chart III-1210-Year Treasury Yield Components
10-Year Treasury Yield Components
10-Year Treasury Yield Components
Chart III-13U.S. Corporate Bonds And Health Monitor
U.S. Corporate Bonds And Health Monitor
U.S. Corporate Bonds And Health Monitor
Chart III-14Global Bonds: Developed Markets
Global Bonds: Developed Markets
Global Bonds: Developed Markets
Chart III-15Global Bonds: Emerging Markets
Global Bonds: Emerging Markets
Global Bonds: Emerging Markets
CURRENCIES: Chart III-16U.S. Dollar And PPP
U.S. Dollar And PPP
U.S. Dollar And PPP
Chart III-17U.S. Dollar And Indicator
U.S. Dollar And Indicator
U.S. Dollar And Indicator
Chart III-18U.S. Dollar Fundamentals
U.S. Dollar Fundamentals
U.S. Dollar Fundamentals
Chart III-19Japanese Yen Technicals
Japanese Yen Technicals
Japanese Yen Technicals
Chart III-20Euro Technicals
Euro Technicals
Euro Technicals
Chart III-21Euro/Yen Technicals
Euro/Yen Technicals
Euro/Yen Technicals
Chart III-23Euro/Pound Technicals
Euro/Pound Technicals
Euro/Pound Technicals
COMMODITIES: Chart III-23Broad Commodity Indicators
Broad Commodity Indicators
Broad Commodity Indicators
Chart III-24Commodity Prices
Commodity Prices
Commodity Prices
Chart III-25Commodity Prices
Commodity Prices
Commodity Prices
Chart III-26Commodity Sentiment
Commodity Sentiment
Commodity Sentiment
Chart III-27Speculative Positioning
Speculative Positioning
Speculative Positioning
ECONOMY: Chart III-28U.S. And Global Macro Backdrop
U.S. And Global Macro Backdrop
U.S. And Global Macro Backdrop
Chart III-29U.S. Macro Snapshot
U.S. Macro Snapshot
U.S. Macro Snapshot
Chart III-30U.S. Growth Outlook
U.S. Growth Outlook
U.S. Growth Outlook
Chart III-31U.S. Cyclical Spending
U.S. Cyclical Spending
U.S. Cyclical Spending
Chart III-32U.S. Labor Market
U.S. Labor Market
U.S. Labor Market
Chart III-33U.S. Consumption
U.S. Consumption
U.S. Consumption
Chart III-34U.S. Housing
U.S. Housing
U.S. Housing
Chart III-35U.S. Debt And Deleveraging
U.S. Debt And Deleveraging
U.S. Debt And Deleveraging
Chart III-36U.S. Financial Conditions
U.S. Financial Conditions
U.S. Financial Conditions
Chart III-37Global Economic Snapshot: Europe
Global Economic Snapshot: Europe
Global Economic Snapshot: Europe
Chart III-38Global Economic Snapshot: China
Global Economic Snapshot: China
Global Economic Snapshot: China
Mathieu Savary Vice President The Bank Credit Analyst Footnotes 1 Please see The Bank Credit Analyst "September 2019," dated August 29, 2019, available at bca.bcaresearch.com 2 Please see The Bank Credit Analyst "June 2019," dated May 30, 2019, available at bca.bcaresearch.com 3 Please see The Bank Credit Analyst "August 2019," dated July 25, 2019, available at bca.bcaresearch.com 4 Please see U.S. Equity Strategy Special Report "Peak Margins," dated October 7, 2019, available at uses.bcaresearch.com 5 Please see U.S. Equity Strategy Weekly Report "Follow The Profit Trail," dated October 15, 2019, available at uses.bcaresearch.com 6 Please see Foreign Exchange Strategy Weekly Report "On Money Velocity, EUR/USD And Silver," dated October 11, 2019, available on fes.bcaresearch.com 7 Please see BCA Research Geopolitical Strategy, “Power And Politics In East Asia: Cold War 2.0?,” September 25, 2012, “Sino-American Conflict: More Likely Than You Think,” October 4, 2013, “The Great Risk Rotation,” December 11, 2013, and “Strategic Outlook 2014 – Stay The Course: EM Risk – DM Reward,” January 23, 2014, “Underestimating Sino-American Tensions,” November 6, 2015, “The Geopolitics Of Trump,” December 2, 2016, “How To Play The Proxy Battles In Asia,” March 1, 2017, and others available at gps.bcaresearch.com or upon request. 8 Please see German Historical Institute, “Bernhard von Bulow on Germany’s ‘Place in the Sun’” (1897), available at http://germanhistorydocs.ghi-dc.org/ 9 See Graham Allison, Destined For War: Can America and China Escape Thucydides’s Trap? (New York: Houghton Miffin Harcourt, 2017). 10 The three cases are Spain taking over from Portugal in the sixteenth century, the U.S. taking over from the U.K. in the twentieth century, and Germany rising to regional hegemony in Europe in the twenty-first century. 11 Duncan Snidal, “Relative Gains and the Pattern of International Cooperation,” The American Political Science Review, 85:3 (September 1991), pp. 701-726. 12 We do not review Snidal’s excellent game theory formal modeling in this paper as it is complex and detailed. However, we highly encourage the intrigued reader to pursue the study on their own. 13 See Charles P. Kindleberger, The World In Depression, 1929-1939 (Berkeley: University of California Press, 2013). 14 Joanne Gowa and Edward D. Mansfield, “Power Politics and International Trade,” The American Political Science Review, 87:2 (June 1993), pp. 408-420. 15 See Ernest Edwin Williams, Made in Germany (reprint, Ithaca: Cornell University Press), available at https://archive.org/details/cu31924031247830. 16 Quoted in Margaret MacMillan, The War That Ended Peace (Toronto: Allen Lane, 2014). 17 Peter Liberman, “Trading with the Enemy: Security and Relative Economic Gains,” international Security, 21:1 (Summer 1996), pp. 147-175. 18 Although France and Russia overcame even greater bitterness due to the ideological differences between a republic founded on a violent uprising against its aristocracy – France – and an aristocratic authoritarian regime – Russia. 19 See James Morrow, “When Do ‘Relative Gains’ Impede Trade?” The Journal of Conflict Resolution, 41:1 (February 1997), pp. 12-37; and Jack S. Levy and Katherine Barbieri, “Trading With the Enemy During Wartime,” Security Studies, 13:3 (December 2004), pp. 1-47.
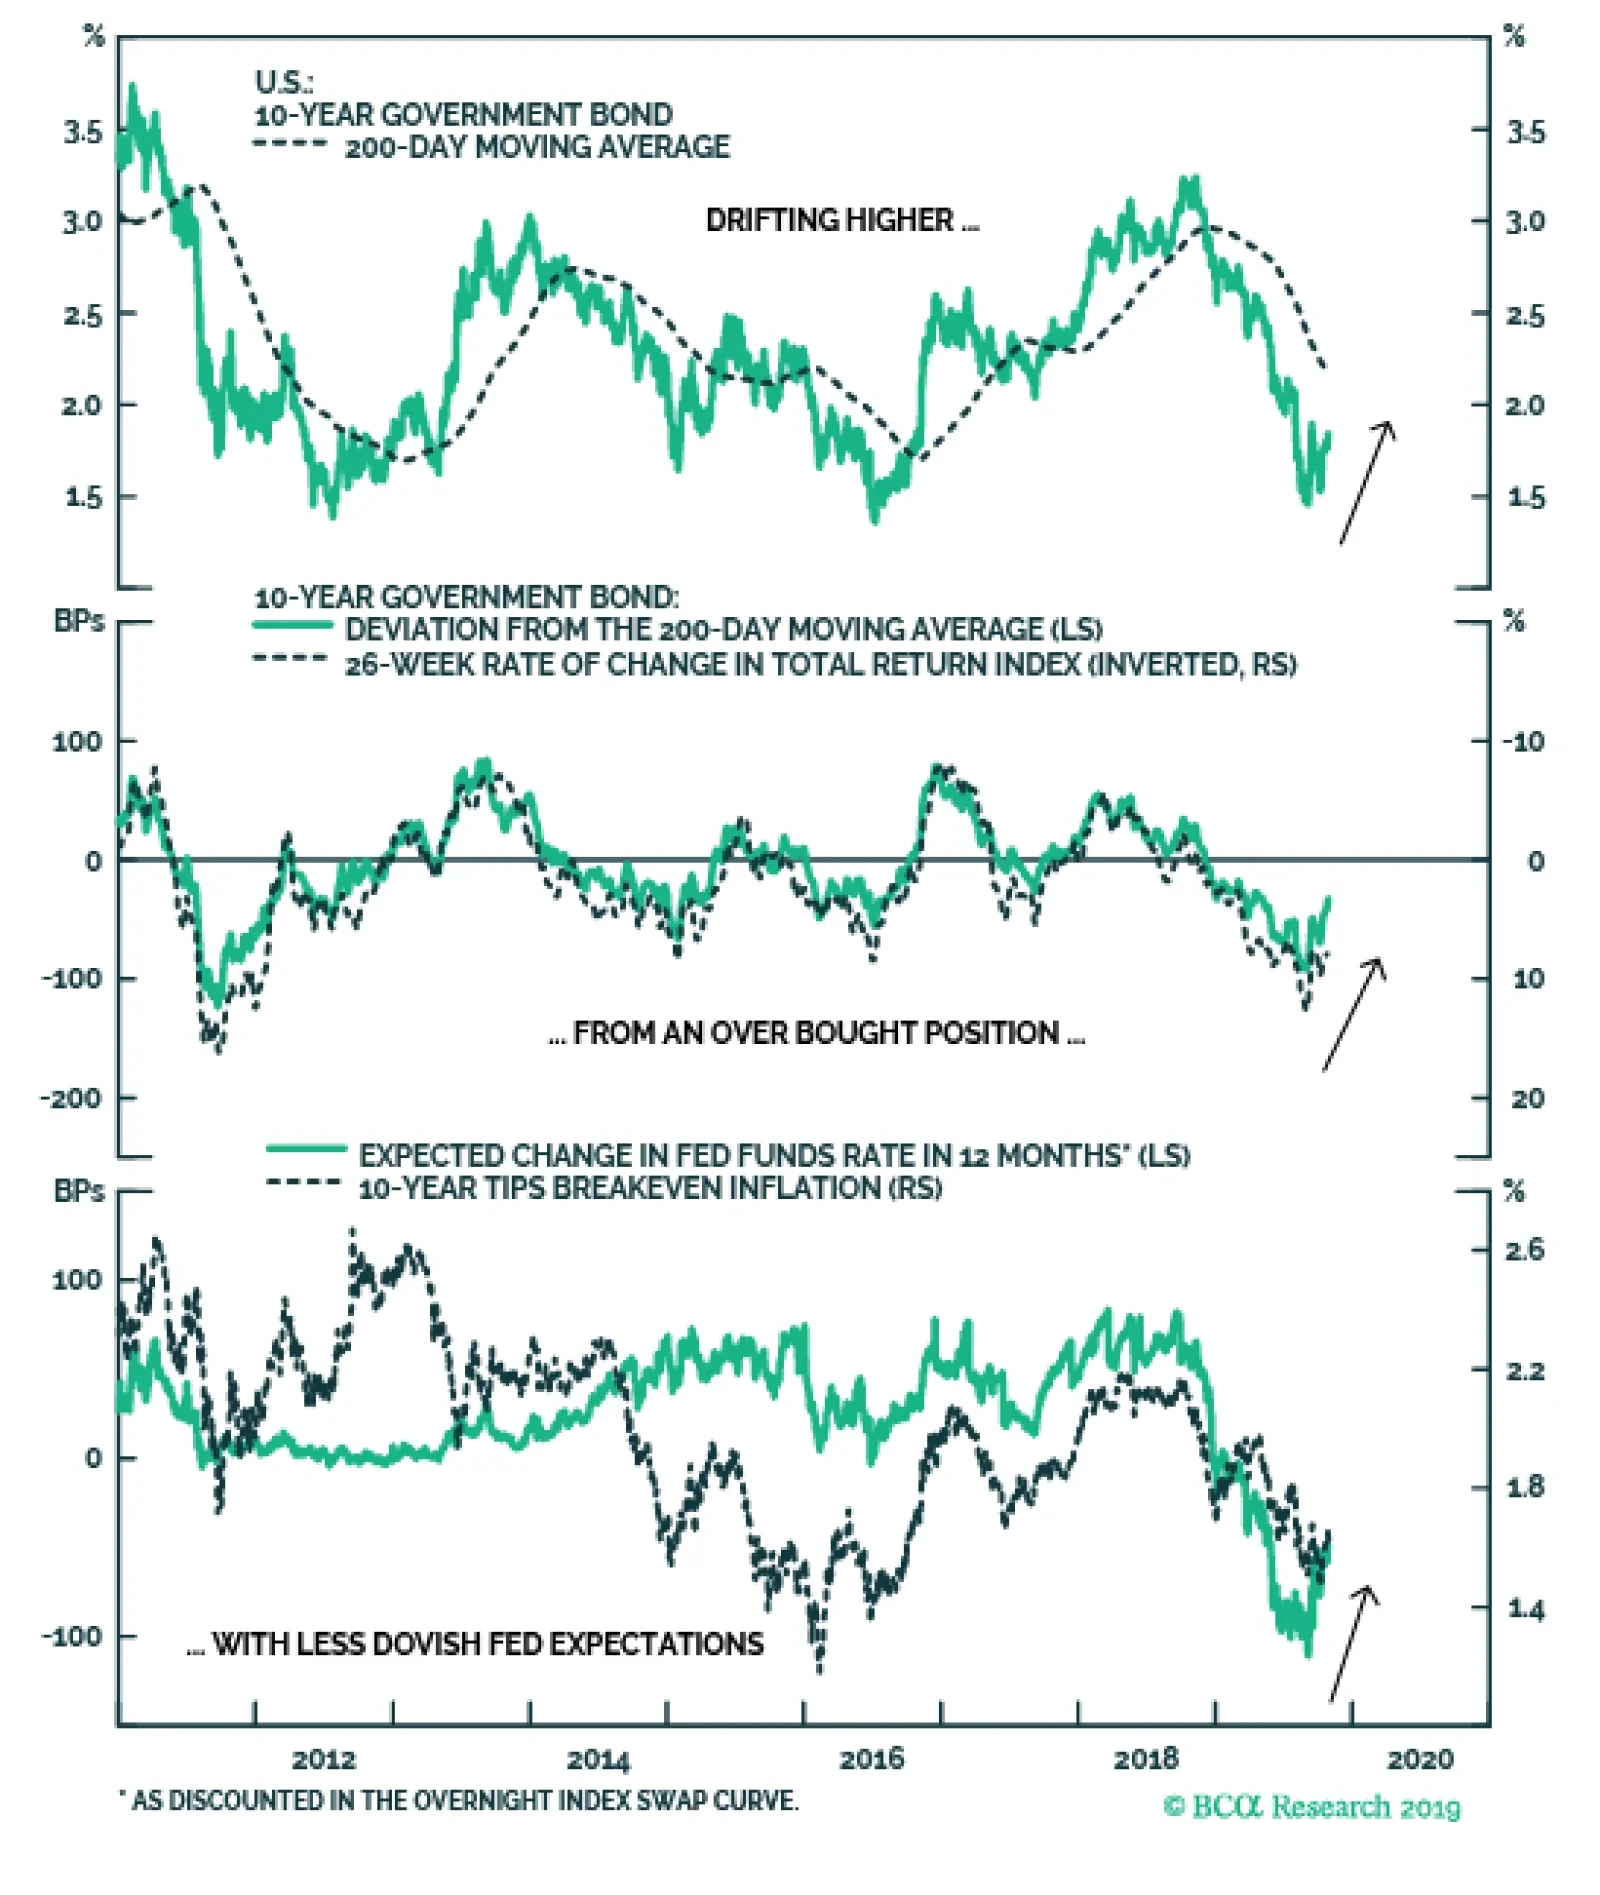
Looking at yields on a country-by-country level, a reasonable initial target for yields would be a return to the medium-term trend as defined by the 200-day moving average (MA). For benchmark 10-year DM government yields, those targets are: U.S.…
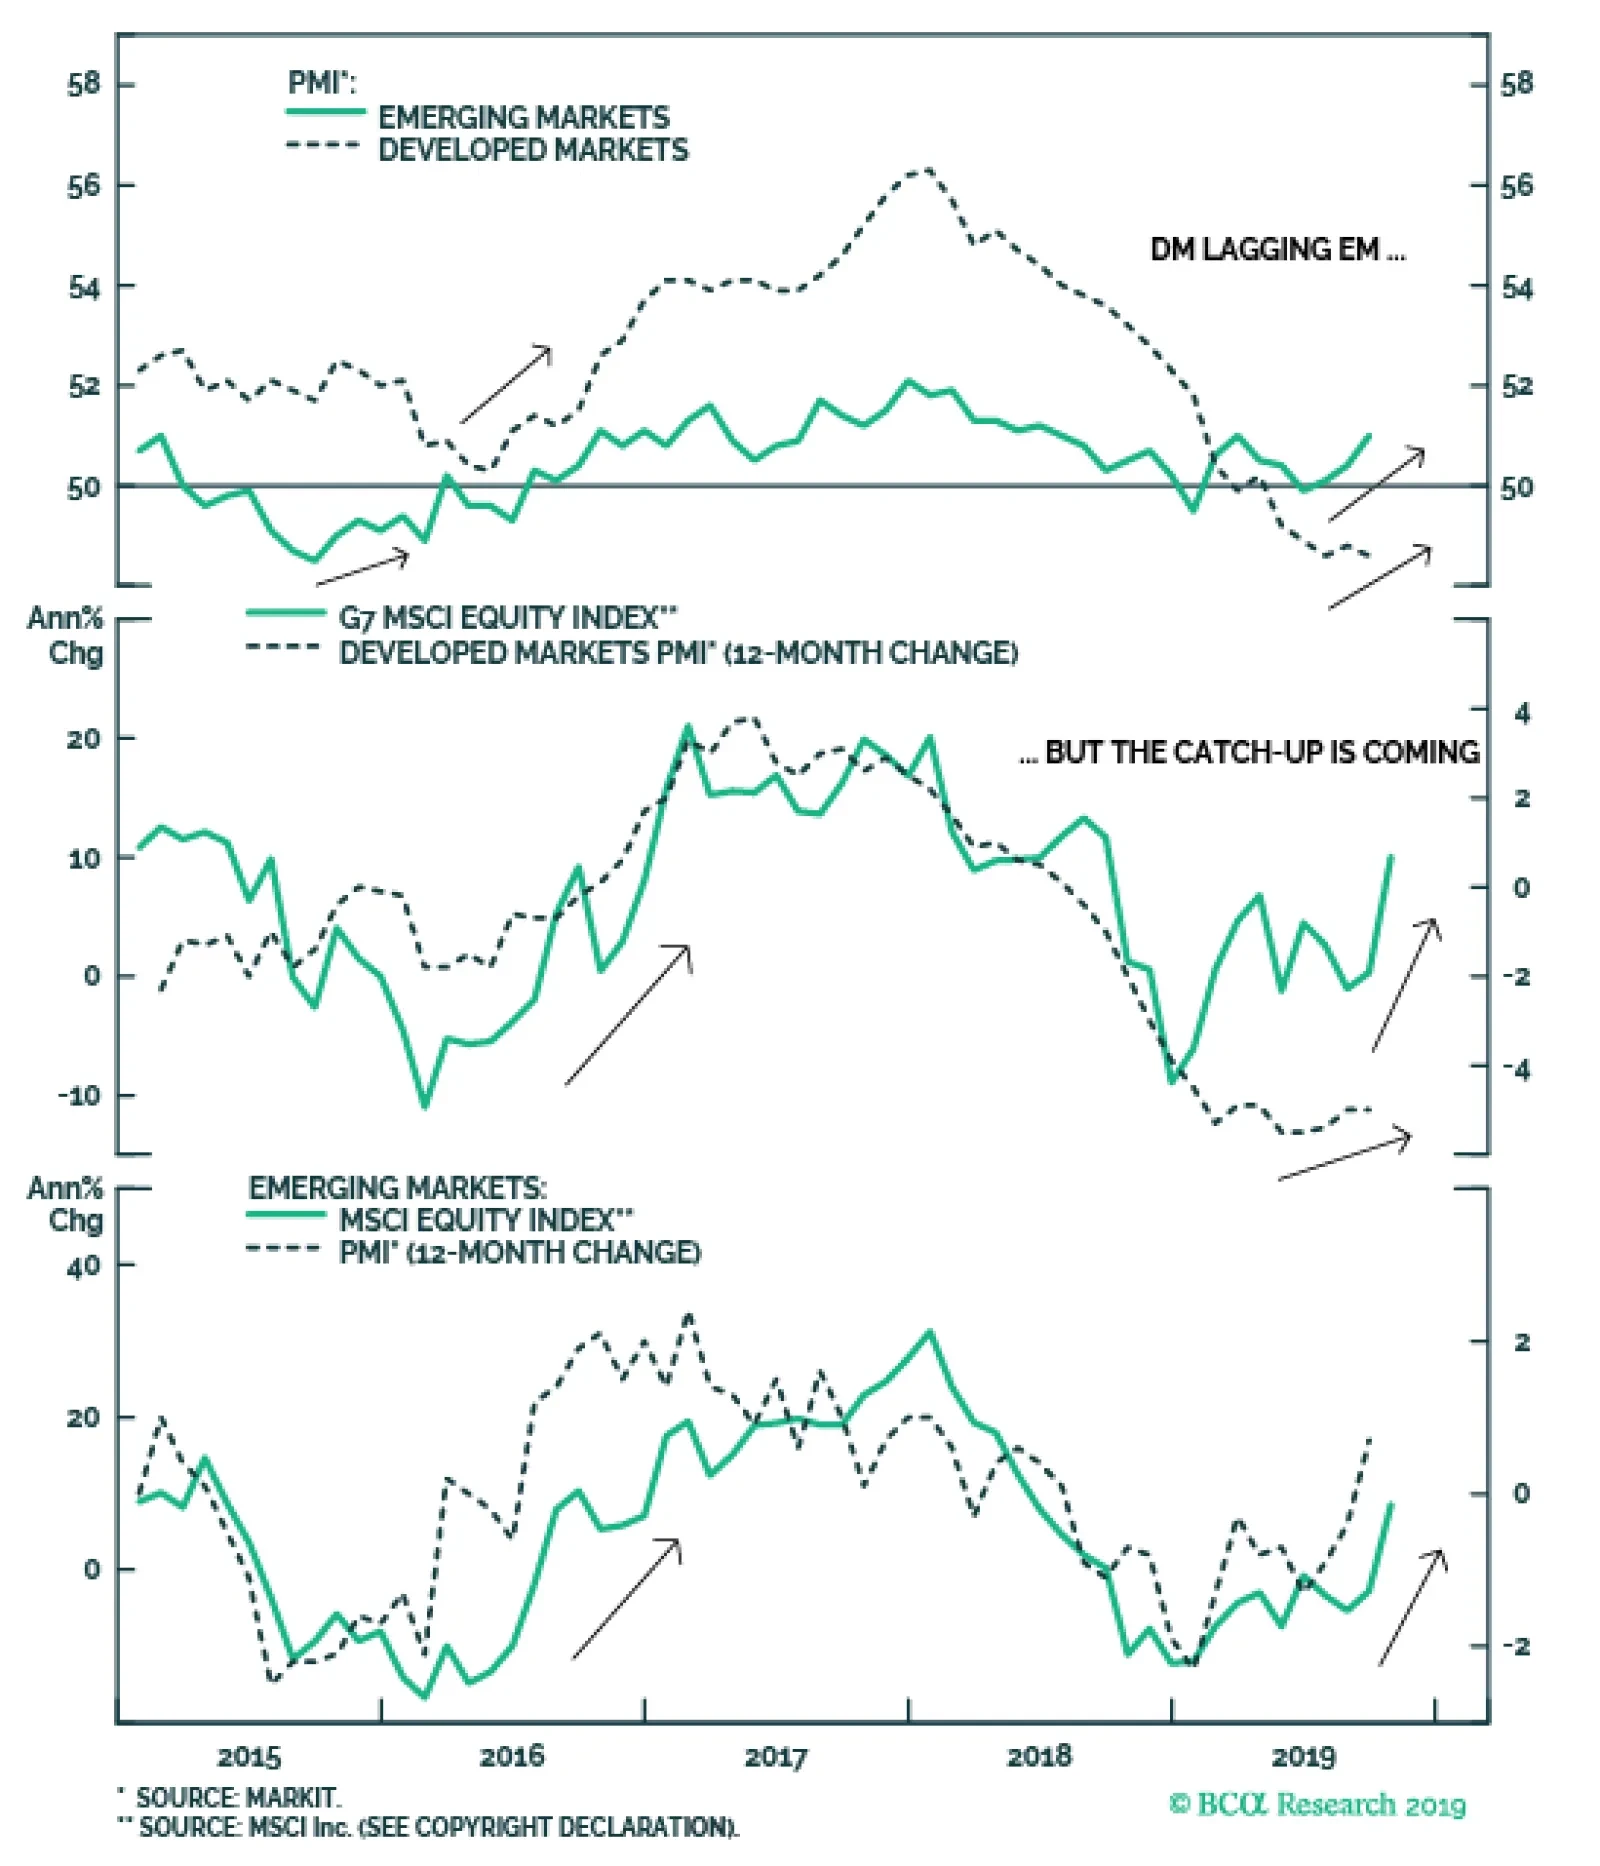
Financial markets have begun to flash positive signals for global growth. Developed market (DM) stock prices are rising, EM equities and currencies have begun to perk up, and EM corporate credit spreads remain stable. Meanwhile, bond volatility measures…
Highlights Rising recession risk, shaky economic fundamentals, and absence of positive yielding assets motivate us to reexamine which assets can be counted on to protect a portfolio in the future. We analyze 10 safe havens on four different dimensions: consistency, versatility, efficiency, and costs. Using this framework, we examine the historical performance of each safe haven and provide an outlook on their likely effectiveness over the next decade. We conclude that U.S. TIPS and farmland should provide the best portfolio protection. Cash, U.S. Treasuries and gold are other good alternatives. Meanwhile, U.S. investment-grade bonds, global ex-U.S. bonds, silver, and currency futures are likely to be poor protection choices. Feature For most investors, capital preservation is the most important goal when managing money. However, how to go about it remains a difficult question. Investing in safe havens can be painful during bull markets, as their returns are usually lower than those of equities. Moreover, economic, political, and financial regimes change over time, which means that an asset that protected your portfolio in the past might not do so in the future. Therefore, it becomes good practice to review one’s safety measures periodically, even if one does not think that a crash is imminent. The current environment in particular, is a propitious time to review safe havens given that: Chart I-1A Great Time To Review Safety Measures
A Great Time To Review Safety Measures
A Great Time To Review Safety Measures
A key recession signal is flashing red: The yield curve inverted in the United States in August (Chart I-1 – top panel). An inversion of the yield curve does not necessarily imply a recession, but historically it has been a very reliable signal of one, given that it indicates that monetary policy is too tight for the economy. Structural risks are rising: Rich equity valuations in the U.S. and high leverage levels elsewhere are signs that the pillars supporting this bull market might be fragile (Chart I-1 – middle panel). In addition, protectionism and populism, forces that BCA has long argued are here to stay, threaten to upend the regime of free trade that has benefited equities since the 1950s.1 Yields are near all-time lows: Historically, investors have been able to endure bear markets by hiding in safe assets with positive yield, as these assets will normally provide a reliable cash flow regardless of the economic situation. However, these type of assets are increasingly hard to find, particularly in the government bond space, where 50% of developed country bonds have negative yields (Chart I-1 – bottom panel). Considering these factors, how should investors protect their portfolios in the next decade? To answer this question, we analyze 10 safe havens divided into five broad asset classes: Nominal government bonds: U.S. Treasuries and global ex-U.S. government bonds. Other fixed income: U.S. investment-grade credit and U.S. TIPS.2 Currencies: yen futures and Swiss franc futures. Precious metals: gold futures and silver futures. Other assets: farmland and U.S. cash. We look at historical performance since 1973 for all safe havens except for global ex-U.S. bonds and farmland. For these assets, we look at performance since 1991 due to limited data availability. We mainly look at quarterly returns in order to compare illiquid assets to publicly traded ones. We do not consider each safe haven in isolation, but rather as an addition to equities within a portfolio. Specifically, we explore our safe haven universe relative to the MSCI All Country World equity index from the perspective of a U.S. investor. For our non-U.S. clients, we will release a report from the perspective of other countries if there is sufficient interest. Importantly, we do not look only at historical performance. We also examine whether there is a reason to believe that future returns will be different from past ones, by analyzing how the properties of each safe haven might have changed. When evaluating each safe haven, we focus on four properties: Consistency: a safe haven should generate consistent positive returns during periods of negative equity performance, with returns increasing with the severity of the equity drawdown. Versatility: safe havens should perform well across different types of crises. Efficiency: a safe haven should produce enough upside during crises, so only a small allocation to the safe haven is necessary to reduce losses. Costs: drag to portfolio overall performance (opportunity costs) should be as small as possible. Readers who wish to see just our overall conclusions should read our Summary Of Results section below. For our analysis of how safe havens have performed in the past, please see the Historical Performance section. Finally, for our analysis of how we expect the performance of safe havens to change, please see our Outlook section. Summary Of Results The Best Safe Havens U.S. TIPS should be an excellent safe haven to protect a portfolio in the next decade. While TIPS might not be as cheap to hold as they have been in the past, upside potential remains strong, which means that a moderate allocation can provide substantial protection to an equity portfolio. Moreover, U.S. TIPS are one of the best hedges against crises triggered by rising rates and inflation, which in our view are the biggest structural risks that asset allocators face. Farmland could also be a great safe haven for investors who have the ability to allocate to illiquid assets given that it is the cheapest safe haven in terms of portfolio drag. However, investors should be aware that the current low yield could potentially affect its performance during crises. Good Alternatives Cash can be a good alternative to protect an equity portfolio, given its outstanding performance during equity drawdowns caused by inflation. Moreover, its opportunity costs should decrease relative to the past. However, investors should take into account that the efficiency of cash at the current juncture is poor, which means that a relatively large allocation is needed in order to achieve meaningful portfolio protection. A portfolio with a 30% allocation to Treasuries historically provided the same downside protection as a portfolio with a 44% allocation to gold. We also like gold futures as a safe haven since they offer some of the most attractive opportunity costs. In addition, their upside is greater than that of most safe havens due to their negative correlations with real rates. However, gold’s volatility makes it an unreliable asset, which prevents us from placing it higher in the safe haven hierarchy. Historically, U.S. Treasuries have been one of the best safe havens to hedge an equity portfolio. Will this performance continue in the future? We do not think so. While yields are still high enough to provide plenty of upside potential, they have fallen to the point where they have increased the opportunity costs of U.S. Treasuries and reduced their consistency. The Rest Global ex-U.S. bonds have very limited upside due to their low yields. Meanwhile U.S. investment-grade credit remains at risk from poor corporate balance sheets, compounded by the fact that credit no longer has an attractive yield cushion. Currencies like the yen and the Swiss franc will continue to be unreliable and very expensive safe havens. Finally, while silver’s costs and reliability could improve, its high cyclicality relative to other safe havens will make silver a poor protection choice. Historical performance Consistency How did safe havens perform when equities lost money? To assess consistency, we plot the performance of each safe haven during all quarters when global equities had losses (Chart I-2). Cash and farmland were the only assets to have positive returns during every equity drawdown. U.S. Treasuries and U.S. TIPS were also very consistent, and had the additional advantage that their returns tended to increase as equity losses worsened. Global ex-U.S. bonds, while not as consistent, generated positive returns most of the time. Chart I-2Safe Haven Returns During Drawdowns In Global Equities
Safe Haven Review: A Guide To Portfolio Protection In The 2020s
Safe Haven Review: A Guide To Portfolio Protection In The 2020s
On the other hand, investment-grade bonds, the yen, the Swiss franc, gold, and silver were much more inconsistent. In general, even though these assets had larger positive returns than other assets, they were prone to deep selloffs concurrent with equity drawdowns. Silver was the worst of all safe havens, being mostly a negative return asset during quarters of negative equity performance. Versatility How did the type of crisis affect the performance of safe havens? We classify crises according to their catalyst into the following four categories: bursts of U.S. asset bubbles (tech bubble, 2008 housing crisis), ex-U.S. crises (1998 EM crisis, European debt crisis), flash crashes/political events (1987 Black Monday, 9/11 terrorist attack), rate/inflation shocks (1974 oil crisis, 1980 Fed shock) and others (every other equity drawdown we could not classify).3 We look at the performance of seven safe havens since 1973 (Chart I-3A) and of all 10 since 19914 (Chart I-3B): Chart I-3ASafe Haven Return During Different Type Of Crisis (1973 - Present)
Safe Haven Review: A Guide To Portfolio Protection In The 2020s
Safe Haven Review: A Guide To Portfolio Protection In The 2020s
Chart I-3BSafe Haven Return During Different Type Of Crisis (1991 - Present)
Safe Haven Review: A Guide To Portfolio Protection In The 2020s
Safe Haven Review: A Guide To Portfolio Protection In The 2020s
During bursts of U.S. asset bubbles, U.S. Treasuries were the most effective hedge in both sample periods, followed by U.S. TIPS and farmland. Corporate bonds, cash, gold, and the Swiss franc also had positive returns, though they were small. Finally, the yen and silver had negative returns. During crises happening outside of the U.S., U.S. Treasuries were once again the best option. U.S. TIPS, yen futures, farmland, gold, and U.S. investment-grade bonds also provided strong returns. Meanwhile, global ex-U.S. bonds and cash provided relatively weak returns, while both the Swiss franc and silver accrued losses. During flash crashes/political events, the Swiss franc had the best performance followed by global ex-U.S. bonds, though in general all safe havens but silver provided positive returns. Rate/inflation shocks were the most difficult type of crisis to hedge. Cash and U.S. TIPS were by far the best performers. Moreover, while U.S. Treasuries were able to eke out a small positive return, all other safe havens lost money during these crises. Efficiency How much allocation to each safe haven was needed to protect an equity portfolio? Chart I-4 show how adding incremental amounts of each safe haven5 to an equity portfolio reduced the overall portfolio’s 10% conditional VaR (the average of the bottom decile of returns).6 Since 1973, U.S. TIPS and U.S. nominal government bonds were the most efficient safe havens, providing the most protection per unit of allocation (Chart I-4 – top panel). Conditional VaR was reduced by almost half when allocating 40% to either Treasuries or TIPS. Cash, U.S. investment-grade, the yen, the Swiss franc, gold, and silver followed in that order. The difference between the safe havens was significant. As an example, a portfolio with a 30% allocation to U.S. Treasuries historically provided the same downside protection as a portfolio with a 36% allocation to U.S. IG credit, a 39% allocation to the yen or a 44% allocation to gold. Meanwhile, there was no allocation to silver which would have provided the same level of protection. When using a sample from 1991, the main difference was the reduced efficiency of cash – the result of lower average interest rates when using a more recent sample. Other than cash, the efficiency of most safe havens remained unchanged: U.S. Treasuries were the best option, followed by U.S. TIPS, farmland, U.S. investment-grade bonds, global ex-U.S. government bonds, cash, the yen, gold, the Swiss franc, and silver in that order (Chart I-4 – bottom panel). Chart I-4Historically, Fixed-Income Assets Were The Most Efficient Safe Havens
Safe Haven Review: A Guide To Portfolio Protection In The 2020s
Safe Haven Review: A Guide To Portfolio Protection In The 2020s
Costs How do safe haven returns compare to equities? To evaluate opportunity costs, we compare the difference of the historical return of each safe haven versus global equities. Overall, hedging with currencies was extremely costly, as their return was well below that of equities in both samples (Chart I-5). Cash was also an expensive safe haven to hedge with, particularly in the most recent sample. On the other hand, fixed-income assets like U.S Treasuries, investment-grade credit, and U.S. TIPS had very low costs (global ex-U.S. bonds also had cost of around 2% in a limited sample). Farmland had negative opportunity costs because it outperformed equities during the sample period.7 Chart I-5Historically Fixed Income Assets And Farmland Had The Lowest Opportunity Cost
Safe Haven Review: A Guide To Portfolio Protection In The 2020s
Safe Haven Review: A Guide To Portfolio Protection In The 2020s
Outlook Chart I-6No More Yield Cushion
Safe Haven Review: A Guide To Portfolio Protection In The 2020s
Safe Haven Review: A Guide To Portfolio Protection In The 2020s
Chart I-7Silver Has Become Less Cyclical
Silver Has Become Less Cyclical
Silver Has Become Less Cyclical
For our outlook, we assess how the four traits under study have changed for all safe havens: Consistency: Will safe havens continue to be reliable in the absence of high coupons? Many of the safe havens in our sample were effective at hedging equities due to their high yield. Even if they had negative capital appreciation, total returns stayed positive thanks to the offsetting effect of the yield return. However, as rates have declined, yield return has also decreased substantially (Chart I-6). Therefore, safe havens, like cash, government bonds, and even farmland will not be as consistent as they were in the past. Credit could be even more vulnerable: the combination of a low yield, and unhealthy fundamentals will turn U.S. corporate bonds into a negative-return asset in the next crisis. Silver might be the lone safe haven to improve its consistency. Industrial use for silver has fallen substantially in the past 10 years, decreasing its cyclical nature (Chart I-7). Thus, while silver might still be an erratic safe haven, it should be more consistent in the future than its historical performance would suggest. Versatility: What will the next crisis look like? Chart I-8Inflation and Political Crisis Will Plague The 2020s
Inflation and Political Crisis Will Plague The 2020s
Inflation and Political Crisis Will Plague The 2020s
Determining what the next crisis will look like is crucial for safe haven selection. Below we rank the types of crises in order of how likely and severe we think they will be in the future: Inflation/rate shock: We expect inflation to be significantly higher over the next decade. This will be the highest risk for asset allocators in the future. As we explained in our May 2019 report, a change in monetary policy framework, procyclical fiscal policy, waning Fed independence, declining globalization, and demographic forces are all conspiring to lift inflation in the next decade.8 Importantly, we believe that the Fed will be dovish initially, as it cannot let inflation continue to underperform its target after missing the mark for the last 10 years (Chart I-8 – top panel). However, this will cause an inflationary cycle, which will eventually lead the Fed to raise rates significantly and trigger a recession. Political events/flash crashes: Political events will also pose a risk to the markets on a structural basis. The rise of China as a superpower has shifted the world into a paradigm of multipolarity, which historically has resulted in military conflict. Moreover, animus for conflict is not dependent on President Trump. The American public in general feels that the economic relationship with China is detrimental to the United States (Chart I-8 – bottom panel). This means that any president, Democrat or Republican will have a political incentive to jostle with China for economic and political supremacy for years to come. Ex-U.S. crises: We expect Emerging Markets in general, and China in particular, to be among the most vulnerable parts of the global economy as we enter the next decade. Over the last 10 years, China’s money supply has increased four-fold, becoming larger than the money supply of the U.S. and the euro area combined. In addition, corporate debt as a % of GDP stands at 155%, higher than Japan at the peak of its bubble and higher than any country in recorded history (Chart I-9). We rank this type of crisis slightly below the first two because Emerging Market assets are depressed already. Thus, while we believe that there is further downside to come for these economies, some weakness has already been priced in. U.S. asset bubble burst: We believe that there are no systemic excesses in the U.S. economy, making a U.S. asset bubble burst a lesser risk than other types of crises. Although it is true that U.S. corporate debt stands at all-time highs, it is still at a much lower level than in other countries. Moreover, weakness of corporate credit is not likely to have systemic consequences on the economy, given that leveraged institutions like banks and households hold only a small amount of outstanding corporate debt (Chart I-10). Chart I-9EM crises Are Also A Risk
EM crises Are Also A Risk
EM crises Are Also A Risk
Chart I-10A U.S. Corporate Debt Deblacle Will Not Have Systemic Consequences
A U.S. Corporate Debt Deblacle Will Not Have Systemic Consequences
A U.S. Corporate Debt Deblacle Will Not Have Systemic Consequences
What does this ranking mean in terms of safe haven performance? U.S. TIPS and cash should be held in high regard as they will be some of the only assets that will perform well during an inflation/rate shock. The Swiss franc and global ex-U.S. bonds should be best performers during political crises, although U.S. TIPS could also provide adequate protection. Efficiency: Is there any upside left for safe havens when interest rates are near zero? As yields go below the zero bound it becomes harder for bonds to generate large positive returns. European or Japanese government bonds in particular would need their yields to go deep into negative territory to counteract a large selloff in equities (Table I-1). But can interest rates go that low? We do not think so. The recent auction of German bunds, where a 0%-yielding 30-year bond attracted the weakest demand since 2011, suggests that interest rates in these countries might be close to their lower bound. On the other hand, though U.S. yields are low, they are still high enough for U.S. Treasuries to provide high returns in case of a crisis. Table I-1No Room For Positive Returns In The Government Bond Space Outside Of The U.S.
Safe Haven Review: A Guide To Portfolio Protection In The 2020s
Safe Haven Review: A Guide To Portfolio Protection In The 2020s
Low rates also have an effect on the efficiency of U.S. investment-grade bonds, cash, and farmland because their upside during crises does not come from capital appreciation but rather from their yield, (the price of IG credit actually declines during most crisis). As mentioned earlier, their yield has declined substantially compared to the past, which means that a larger allocation will be necessary to counteract a selloff. Chart I-11Switzerland Has A High Incentive To Prevent The Franc From Appreciating
Safe Haven Review: A Guide To Portfolio Protection In The 2020s
Safe Haven Review: A Guide To Portfolio Protection In The 2020s
The upside of the yen could also be compromised. The Bank of Japan is likely to intervene aggressively in the currency market to prevent the Japanese economy from falling into a deflationary spiral, since it is very difficult for it to lower Japanese rates further. The Swiss franc is even more vulnerable. In contrast to Japan, Switzerland is a small open economy that has to import most of its products (Chart I-11). This means that the Swiss National Bank has a very high incentive to intervene in currency markets during a crisis, given that a rally in the franc could depress inflation severely. What about U.S. TIPS? In contrast to nominal government bond yields or even yields on corporate debt, U.S. real rates are not limited by the zero bound (Chart I-12). This makes TIPS a more attractive option than other fixed-income assets, since real rates can have much more room for further downside than nominal ones. To be clear, this will only be the case if our forecast of an inflationary crisis materializes. Likewise, since gold is heavily influenced by real rates, it should also offer significant upside during the next crisis.9 Chart I-12Real Rates Have More Downside Potential Than Nominal Ones
Real Rates Have More Downside Potential Than Nominal Ones
Real Rates Have More Downside Potential Than Nominal Ones
Costs: Can I afford to hold safe havens in a world of low returns? To provide an outlook for the expected cost of each safe haven, we use the return assumptions from our June Special Report.10 We subtract the expected return on global equities from the expected return for each safe haven to reach an expected cost value. However, three of the safe havens (global ex-U.S. government bonds, the Swiss franc and silver) did not have a return estimate. We compute their expected returns as follows: For the Swiss franc we use the methodology we used for all other currencies in our report. We base the expected return on the current divergence from the IMF PPP value, as well as the IMF inflation estimates. In addition, we add the relative cash rate assumed return for both our yen and Swiss franc estimates, as futures take into account carry return. For global ex-U.S. bonds we take the weighted average of the expected return of the euro area, Japan, U.K., Canada, and Australia government bonds. We weight the returns according to their market capitalization in the Bloomberg/Barclays government bond index. Due to silver’s dual role as an inflation hedge and industrial metal, silver prices are a function of both gold prices and global growth. To obtain a return estimate we run a regression on silver against these two variables and use our growth and gold return estimate to arrive at an assumed return for silver. Chart I-13 shows our results: while their cost will improve, currency futures remain the most expensive hedge. The opportunity cost of precious metals and cash will decrease, making them more attractive options than in the past. Meanwhile, low yields will increase the opportunity costs of most fixed-income assets. Finally, farmland will remain the cheapest safe haven, even with decreased performance. Chart I-13Oportunity Cost For Fixed Income Safe Havens Will Be Higher Than In The Past
Safe Haven Review: A Guide To Portfolio Protection In The 2020s
Safe Haven Review: A Guide To Portfolio Protection In The 2020s
Juan Manuel Correa Ossa Senior Analyst juanc@bcaresearch.com Appendix A
Safe Haven Review: A Guide To Portfolio Protection In The 2020s
Safe Haven Review: A Guide To Portfolio Protection In The 2020s
Footnotes 1 Please see Geopolitical Strategy Special Report, "The Apex Of Globalization – All Downhill From Here, " dated November 12, 2014, available at gps.bcaresearch.com. 2 We use a synthetic TIPS series for data prior to 1997. For details on the methodology, please see: Kothari, S.P. and Shanken, Jay A., “Asset Allocation with Inflation-Protected Bonds,” Financial Analysts Journal, Vol. 60, No. 1, pp. 54-70, January/February 2004. 3 For a detailed list of how we classified each equity drawdown, please see Appendix A. 4 The only crises caused by a rate/inflation shock occurred in 1974 and 1980. Thus we have this type of drawdown only in Chart 3A and not in Chart 3B. 5 For yen, Swiss franc, silver and gold futures we assume an allocation to an ETF which follows their performance. Since futures have zero initial costs they cannot be directly compared to traditional assets in terms of percentage allocation. 6 We prefer this measure over VaR given that it captures the properties of the left tail of returns more accurately. 7 While the farmland index subtracts management fees, we recognize that there are costs involved in holding these illiquid assets which are not necessarily captured by the return indices. Thus, the real historical cost of holding farmland was not negative but likely close to zero. 8 Please see Global Asset Allocation Strategy Special Report "Investors’ Guide To Inflation Hedging: How To Invest When Inflation Rises," dated May 22, 2019, available at gaa.bcaresearch.com. 9 Please see Commodity & Energy Strategy Special Report "All that Glitters…And Then Some" dated July 25, 2019, available at ces.bcaresearch.com. 10 Please see Global Asset Allocation Strategy Special Report "Return Assumptions - Refreshed and Refined" dated June 25, 2019,