Fixed Income

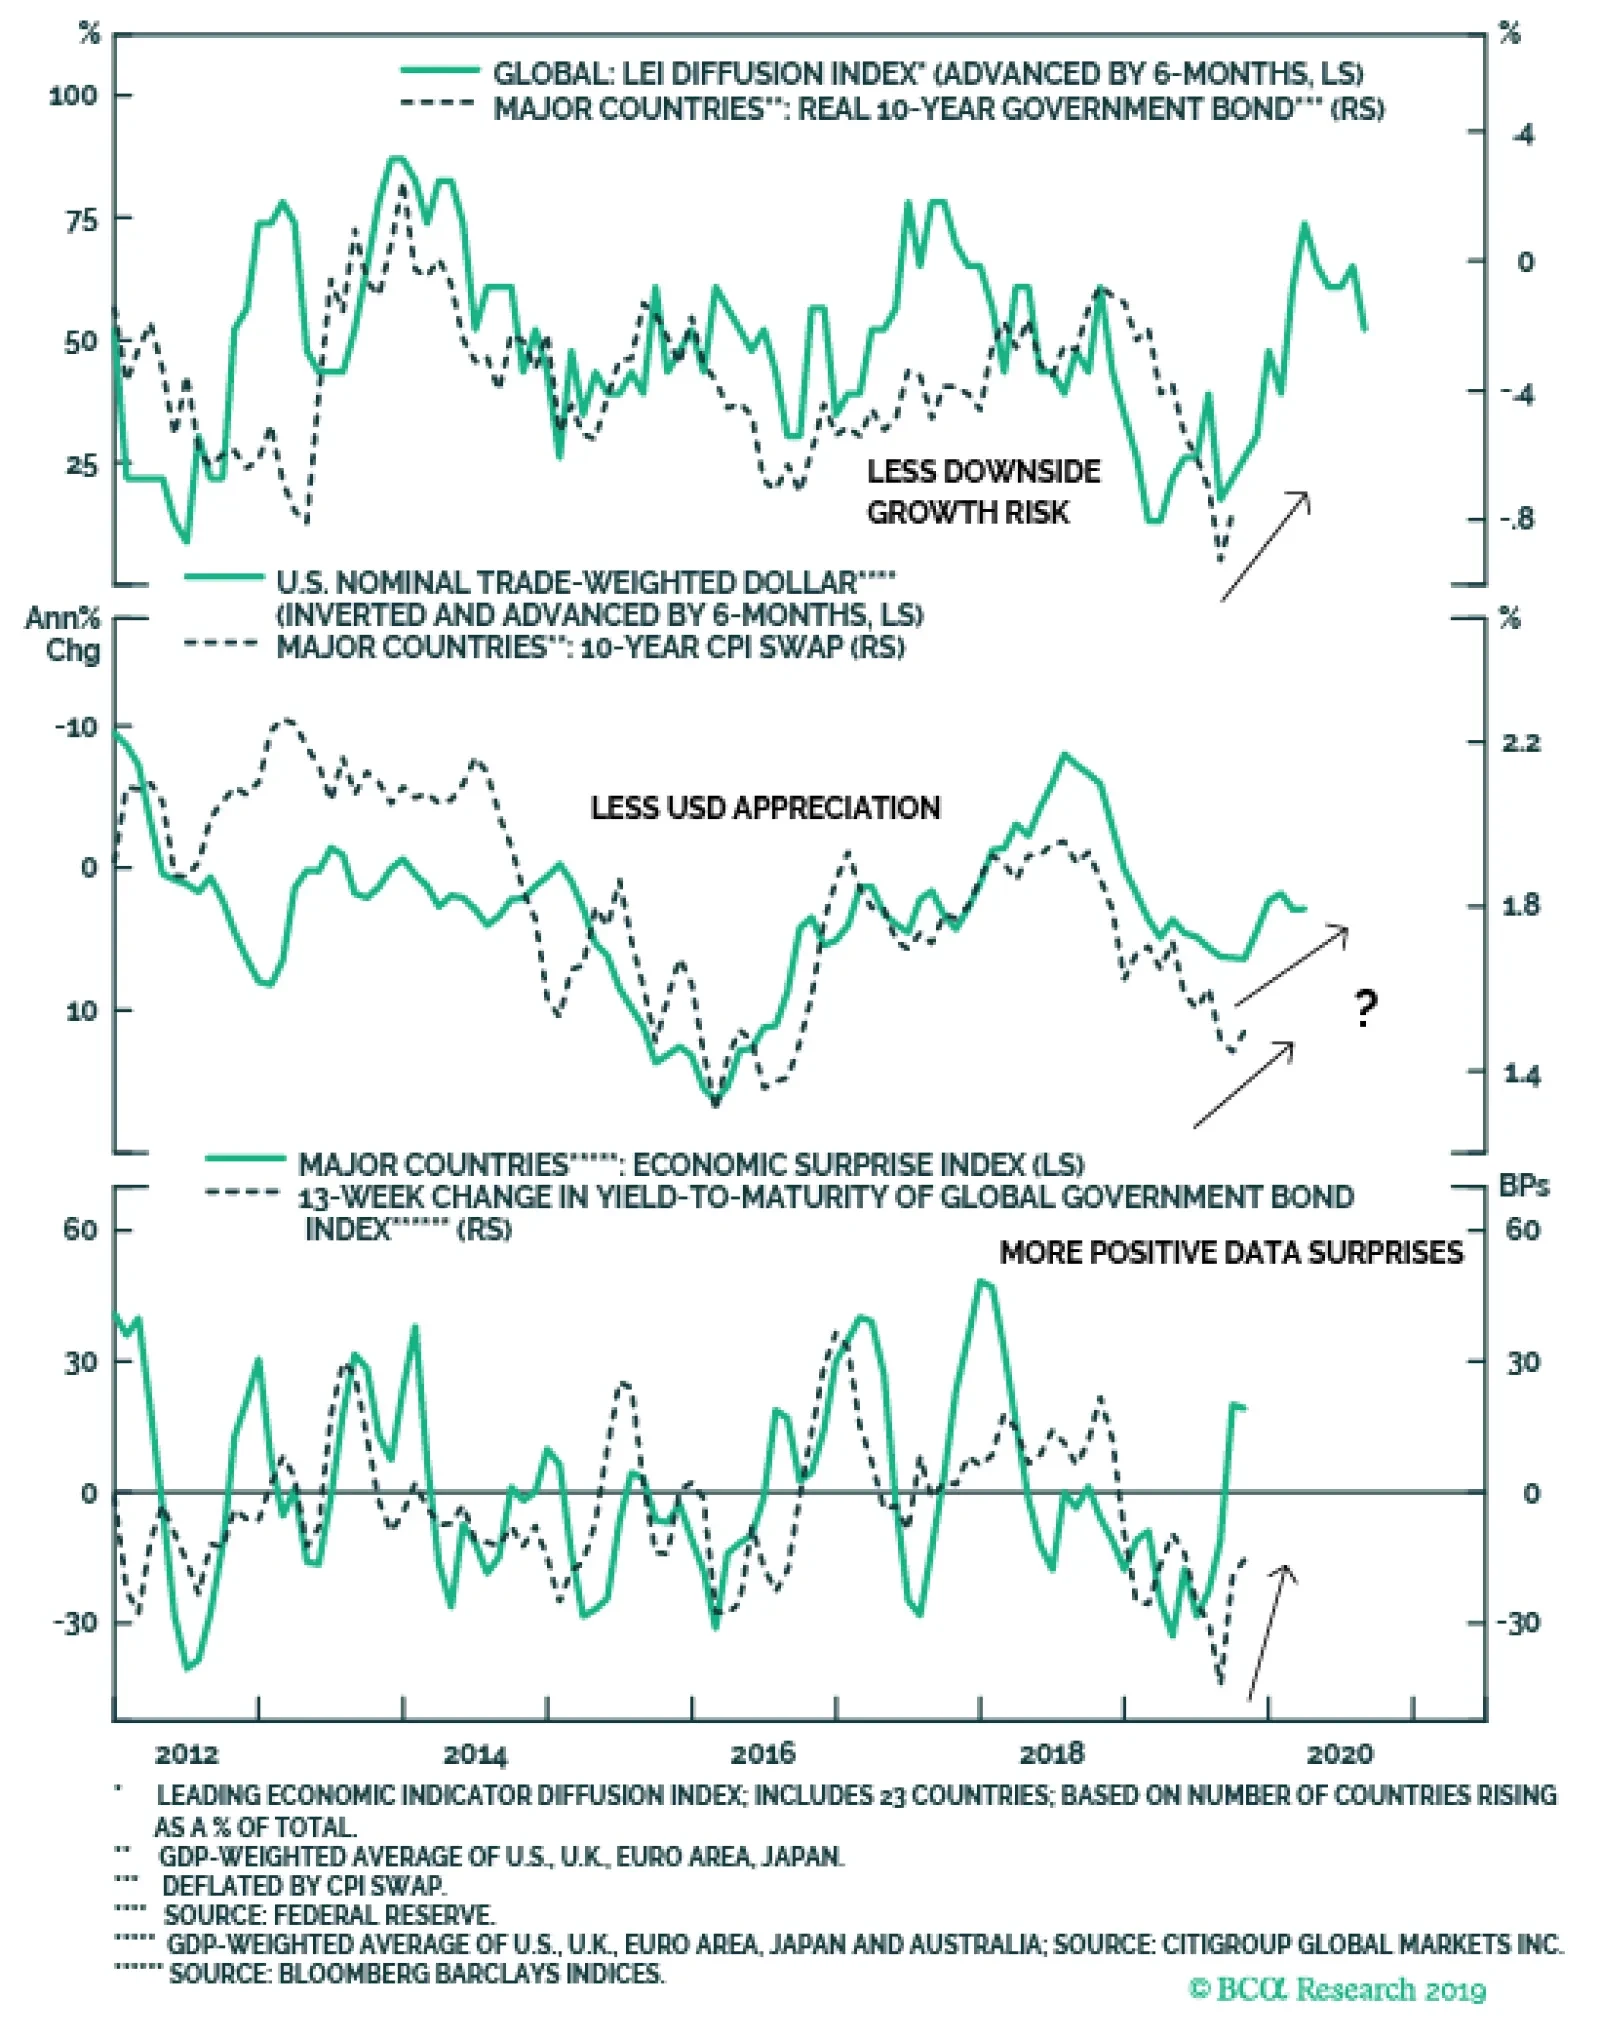
Highlights Equities & Bonds: The accelerating upward momentum of global equities – the ultimate “leading economic indicator” – suggests that the current rise in global bond yields can continue. Maintain below-benchmark overall duration exposure, while staying overweight global corporate credit versus government bonds. U.S. Agency MBS: U.S. agency MBS spreads are now attractive relative to high-quality U.S. corporate bonds, both in absolute terms and on a risk-adjusted basis. Increase allocations to agency MBS, while reducing exposure to Aaa-, Aa- and A-rated U.S. corporates. Feature The U.S. Federal Reserve and European Central Bank (ECB) are both set to ease monetary policy this week. The Fed is almost certain to deliver a third consecutive 25bp rate cut at tomorrow’s FOMC meeting, while the ECB will restart its bond buying program on Friday. Yet government bond yields around the world continue to drift higher, as markets reduce expectations of incremental rate cuts moving forward. Equity prices are an excellent leading indicator of global growth, while bond yields typically reflect current economic conditions. Thus, equity prices should be considered a leading indicator of bond yields. Chart of the WeekMore Upside For Global Bond Yields
More Upside For Global Bond Yields
More Upside For Global Bond Yields
Yields are finally responding to the evidence that global growth is troughing - a dynamic that we have been telegraphing in recent weeks. Global equity markets are rallying, with the U.S. S&P 500 hitting a new all-time high yesterday. The year-over-year increase in global equities, using the MSCI World Index, is now at +10%, the fastest pace of upward acceleration seen since January 2017. Some of that rally in U.S. stock markets can be chalked up to 3rd quarter earnings beating depressed expectations. Yet there is also a forward-looking component of the rally that bond markets are starting to notice. Equity prices are an excellent leading indicator of global growth, while bond yields typically reflect current economic conditions. Thus, equity prices should be considered a leading indicator of bond yields. We see no reason to discount the positive message on growth from rallying equity markets, especially when confirmed by an improvement in our global leading economic indicator (LEI), led by the more cyclical emerging market (EM) countries (Chart of the Week). Falling stock prices in 2018 accurately heralded the global growth slowdown of 2019 which triggered the huge decline in bond yields. Why should rising stock prices not be interpreted in the same light, predicting better global growth – and higher bond yields – over the next 6-12 months? Multiple Signals Point To Higher Bond Yields The more optimistic message on growth is not only confined to developed market (DM) stock prices. EM equities and currencies have begun to perk up, with EM corporate credit spreads remaining stable, as well, mimicking the moves seen in U.S. credit markets. Bond volatility measures like the U.S. MOVE index of Treasury options are retreating to the lower levels implied by equity volatility indices like the U.S. VIX index, which is now just above the 2019 low (Chart 2). Markets are clearly pricing out some of the more negative tail-risk outcomes that prevailed through much of 2019. Some of that reduction in volatility can be attributed to the recent de-escalation of U.S.-China trade tensions and U.K. Brexit risks, both important developments that can help lift depressed global business confidence. A reduction in trade/political uncertainty should help fortify the transmission mechanism between easing global financial conditions and economic activity – an outcome that could extend the rise in yields given stretched bond-bullish duration positioning (Chart 3). Chart 2A More Pro-Risk Global Market Backdrop
A More Pro-Risk Global Market Backdrop
A More Pro-Risk Global Market Backdrop
Chart 3Less Uncertainty = Higher Yields
Less Uncertainty = Higher Yields
Less Uncertainty = Higher Yields
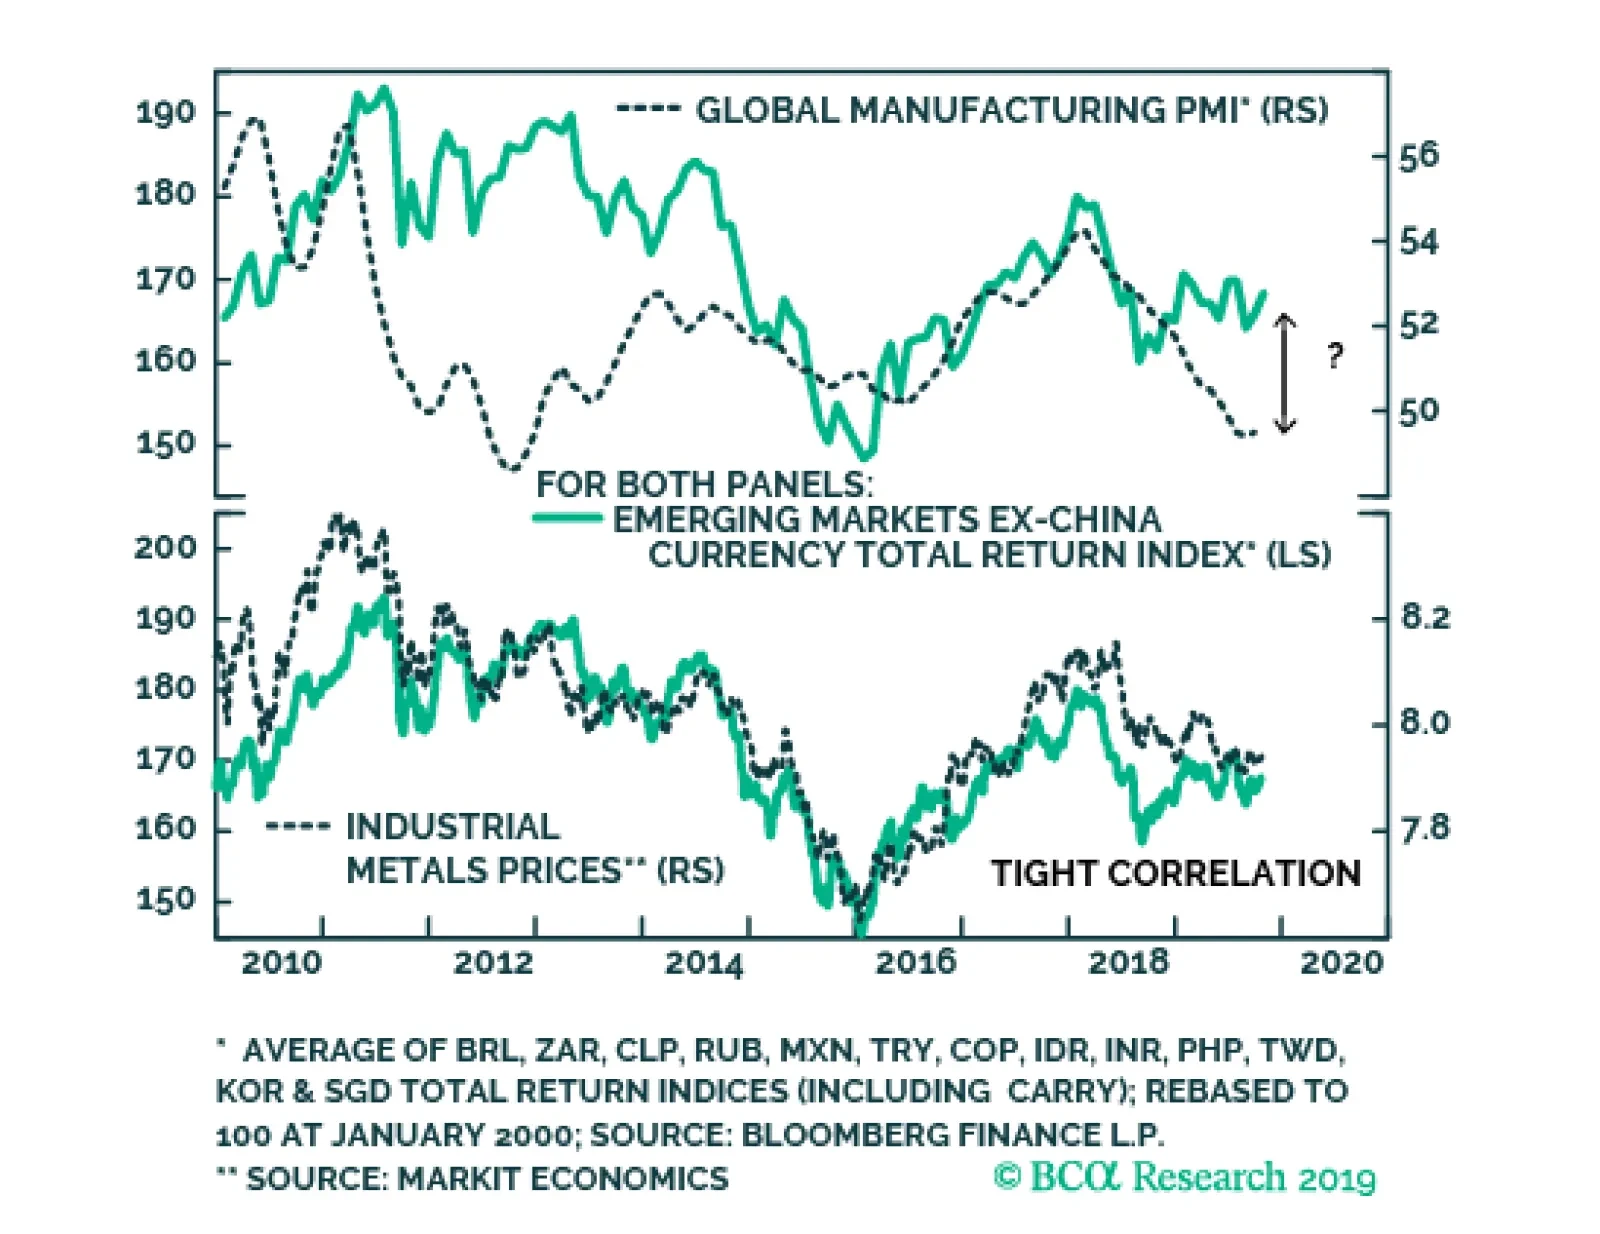
The improving global growth story remains the bigger factor pushing bond yields higher, though. While the manufacturing PMI data within the DM world remain weak, the downward momentum is starting to bottom out on a rate-of-change basis (Chart 4). The EM aggregate PMI index is showing even more improvement, sitting at 51 and above the year-ago level, helping confirm the pickup in EM equity market momentum (bottom panel). Importantly, if this is indeed the trough in the EM PMI, the index would have bottomed above the 2015 trough of 48.5. Given the improvement seen in “Big Mo” for global equities and global LEIs and PMIs, we remain comfortable with our current below-benchmark stance on global interest rate duration exposure. Given the improvement seen in “Big Mo” for global equities and global LEIs and PMIs, we remain comfortable with our current below-benchmark stance on global interest rate duration exposure. How high could yields rise in the near term? Looking at yields on a country-by-country level, a reasonable initial target for yields would be a return to the medium-term trend as defined by the 200-day moving average (MA). For benchmark 10-year DM government yields, those targets are: U.S. Treasuries: the 200-day MA is 2.18%, +23bps above the current level German Bunds: the 200-day MA is -0.22%, +11bps above the current level U.K. Gilts: the 200-day MA is 0.89%, +17bps above the current level Japanese government bonds (JGBs): the 200-day MA is -0.10%, +2bps above the current level Canadian government bonds: the 200-day MA is 1.59%, -2bps below the current level Australian government bonds: the 200-day MA is 1.53%, +43bps above the current level Among those markets, the U.S. is likely to reach the level implied by the 200-day MA, led by the market pricing out the -53bps of rate cuts over the next twelve months discounted in the U.S. Overnight Index Swap curve (Chart 5) – a number that includes the likely -25bp cut tomorrow. A move beyond that 200-day MA may take longer to develop, as it would require markets to begin pricing in some reversal of the Fed’s “mid-cycle cuts” of 2019. That outcome would first require a pickup in TIPS breakevens. The Fed would not feel justified in risking a tightening of financial conditions by signaling rate hikes without the catalyst of higher inflation expectations. Chart 4EM Growth Leading The Way?
EM Growth Leading The Way?
EM Growth Leading The Way?
Chart 5UST Yields Have More Upside
UST Yields Have More Upside
UST Yields Have More Upside
German Bund yields are even closer to that 200-day MA than Treasuries but, as in the U.S., a sustained move beyond that level would require an increase in bombed-out inflation expectations, with the 10-year EUR CPI swap rate now sitting at only 1.05% (Chart 6). As for other markets, the likelihood of reaching, or breaching, the 200-day MA is more varied (Chart 7). Chart 6Bund Yield Upside Limited By Inflation
Bund Yield Upside Limited By Inflation
Bund Yield Upside Limited By Inflation
The move in the Canadian 10-year yield to just above its 200-day MA fits with Canada’s status as a “high-beta” bond market, as we discussed in last week’s report.1 Chart 7Which Yields Will Test The 200-day MA?
Which Yields Will Test The 200-day MA?
Which Yields Will Test The 200-day MA?
The Bank of Canada also meets this week and, while no change in policy is expected, the central bank will be publishing a new Monetary Policy Report that will update their current line of thinking about the Canadian economy and inflation. U.K. Gilts should easily blow through the 200-day MA if and when a final Brexit deal is signed, as the Bank of England remains highly reluctant to consider any policy easing even as political uncertainty weighs on economic growth. With the European Union now agreeing to an extension of the Brexit deadline to January 31, and with U.K. prime minister Boris Johnson now pursuing an early election in December, the political risk premium in Gilts will persist. Thus, Gilt yields will likely lag the move higher seen in higher-beta markets like the U.S. and Canada. JGBs remain the ultimate low-beta bond market with the Bank of Japan continuing to anchor the 10-yield around 0%, making Japan a good overweight candidate in an environment of rising global bond yields. Australian bond yields have the largest distance to the 200-day MA, but the Reserve Bank of Australia is giving little indication that it is ready to shift away from its dovish bias anytime soon, while inflation remains subdued. We do not expect a rapid jump in yields back towards the medium-term trend in the near term, and Australian yields will continue to lag the pace of the uptrend in the higher-beta global bond markets. Net-net, a climb in yields over the next 3-6 months to (or beyond) the 200-day MA is most likely in the U.S. and Canada, and least likely in Japan, Germany and Australia (and the U.K. until the Brexit uncertainty is finally sorted out). Bottom Line: The accelerating momentum of global equities – the ultimate “leading economic indicator” – is suggesting that the current rise in global bond yields can continue. Maintain below-benchmark overall duration exposure, while staying overweight global corporate credit versus government bonds. Raise Allocations To U.S. Agency MBS Out Of Higher Quality Corporate Credit Chart 8U.S. MBS More Attractive Than High-Rated U.S. Corporates
U.S. MBS More Attractive Than High-Rated U.S. Corporates
U.S. MBS More Attractive Than High-Rated U.S. Corporates
Our colleagues at our sister service, BCA Research U.S. Bond Strategy, recently initiated a recommendation to favor U.S. agency MBS versus high-rated (Aaa, Aa, A) U.S. corporate bonds.2 This week, we are adding this position to the BCA Research Global Fixed Income Strategy recommended model bond portfolio. There are three factors supporting this recommendation: 1) The absolute level of MBS spreads is competitive The average option-adjusted spread (OAS) for conventional 30-year U.S. agency MBS – rated Aaa and with the backing of U.S. government housing agencies - is currently 57bps. That is only 3bps below the spread on Aa-rated corporates and 26bps below that of A-rated credit. (Chart 8). 2) Risk-adjusted MBS spreads look very attractive Agency MBS exhibit negative convexity, with an interest rate duration that declines when yields fall. The opposite is true for positively convex investment grade corporate bonds, where the duration rises as yields decrease. This makes agency MBS look attractive on a risk-adjusted basis after the kind of big decline in bond yields seen in 2019. The average duration of the Bloomberg Barclays U.S. agency MBS index is now only 3.4 compared to 7.9 for an A-rated corporate bond. Both of those durations were around similar levels at the 2018 peak in U.S. bond yields, but now the gap between them is large. With those new durations, it would take a 17bp widening of the agency MBS spread for an investor to see losses versus duration-matched U.S. Treasuries, compared to only an 11bp widening of the A-rated corporate spread (bottom panel). This is a big change in the relative risk profile of agency MBS versus high-rated U.S. corporates compared to a year ago, making the former look relatively more attractive. That was not the case the last time agency MBS duration fell so sharply in 2015/16, since corporate bond spreads were widening (getting cheaper) at that time. Today, corporate bond spreads have been stable as corporate duration has increased and agency MBS duration has plunged, making risk-adjusted MBS spreads more attractive. Given our view that U.S. Treasury yields will continue to grind higher, favoring lower duration assets like agency MBS over higher duration investment grade corporates makes sense. Given our view that U.S. Treasury yields will continue to grind higher, favoring lower duration assets like agency MBS over higher duration investment grade corporates makes sense. 3) Macro risks are reduced Mortgage refinancing activity remains the biggest macro driver of MBS spreads, particularly in an environment when mortgage rates are falling and prepayments are accelerating. There was a pickup in refinancing activity over the past year as mortgage rates fell, but the increase has been small relative to similar-sized rate declines in the past (Chart 9). We interpret this as an indication that, after the sustained period of low mortgage rates seen in the decade since the Great Financial Crisis, most homeowners have already had an opportunity to refinance. In other words, the so-called “refi burnout“ is now quite high. Chart 9Muted Refi Activity Keeping Nominal U.S. MBS Spreads Low
Muted Refi Activity Keeping Nominal U.S. MBS Spreads Low
Muted Refi Activity Keeping Nominal U.S. MBS Spreads Low
Beyond refinancing, the other macro risks for agency MBS are subdued. The credit quality of outstanding U.S. mortgages remains solid. The median credit (FICO) score for newly-issued mortgages remains high and stable near the post-2008 crisis highs, while mortgage lending standards have mostly been easing over that same period according to the Federal Reserve Senior Loan Officers Survey. In addition, U.S. housing activity remains solid, with the most reliable indicators like single-family new home sales and the National Association of Home Builders activity surveys all up solidly following this year’s sharp drop in mortgage rates (Chart 10). This makes MBS less risky for two reasons: a) stronger housing activity typically leads to higher mortgage rates, which limits future refi activity; and b) more robust housing demand will boost home prices, the value of the underlying collateral for MBS securities. Chart 10U.S. Housing Activity Hooking Up
U.S. Housing Activity Hooking Up
U.S. Housing Activity Hooking Up
Chart 11Relative Value Favoring U.S. MBS Over U.S. Corporates
Relative Value Favoring U.S. MBS Over U.S. Corporates
Relative Value Favoring U.S. MBS Over U.S. Corporates
Given the improved risk-reward balance of agency MBS versus higher-quality U.S. corporates, we recommend that dedicated fixed income investors make this shift within bond portfolios, reducing allocations to Aaa-rated, Aa-rated and A-rated corporates while increasing exposure to agency MBS. Agency MBS is part of the investment universe of our model bond portfolio. Thus, we are increasing the recommended weighting of agency MBS while reducing the exposure to U.S. investment grade corporates in the portfolio. The changes can be seen in the table on Page 11. We do not split out the investment grade exposure by credit tier in the portfolio, as we prefer to allocate by broad sector groupings (Financials, Industrials, Utilities). So we cannot implement the precise “MBS for high-rated corporates” switch in the model portfolio. There is still a case for reducing overall investment grade exposure and adding to MBS weightings, however. The relative option-adjusted spread of agency MBS and investment grade corporates typically leads the relative excess returns (over duration-matched U.S. Treasuries) between the two by around one year (Chart 11). Thus, the compression of the spread differential between MBS and corporates over the past year is signaling that agency MBS should be expected to outperform the broad U.S. investment grade universe over the next twelve months. Bottom Line: U.S. agency MBS spreads are now attractive relative to high-quality U.S. corporate bonds, both in absolute terms and on a risk-adjusted basis. Increase allocations to agency MBS, while reducing exposure to Aaa-, Aa- and A-rated U.S. corporates. Robert Robis, CFA Chief Fixed Income Strategist rrobis@bcaresearch.com Footnotes 1 Please see BCA Research Global Fixed Income Strategy Weekly Report, “Cracks Are Forming In The Bond-Bullish Narrative”, dated October 23, 2019, available at gfis.bcaresearch.com. 2 Please see BCA Research U.S. Bond Strategy Weekly Report, “Two Themes And Two Trades”, dated October 1, 2019, available at usbs.bcaresarch.com. Recommendations The GFIS Recommended Portfolio Vs. The Custom Benchmark Index
Big Mo(mentum) Is Turning Positive
Big Mo(mentum) Is Turning Positive
Duration Regional Allocation Spread Product Tactical Trades Yields & Returns Global Bond Yields Historical Returns
Highlights Duration: The upturn in bond yields is not yet confirmed by our preferred global growth indicators. We anticipate that a reduction in trade uncertainty during the next few months will cause our indicators to rebound. But until then, investors should view the bond sell-off as tenuous. Yield Curve: Expect modest 2/10 steepening during the next few months, as the Fed keeps rates low even as economic growth improves. Steepening will show up in real yields, not in the TIPS breakeven inflation curve. The 2/10 slope will stay in a range between 0 bps and 50 bps for the next 6-12 months. Yield Curve Strategy: The 5-year Treasury note looks expensive compared to the rest of the yield curve, and historical correlations suggest it will rise the most if the Fed delivers fewer rate cuts than are currently expected. We recommend that investors short the 5-year bullet versus a duration-matched 2/30 barbell. Await Confirmation Bond yields look like they might be bottoming. The 2-year and 10-year Treasury yields are up 10 bps and 31 bps, respectively, since the 2/10 slope briefly inverted in late August (Chart 1). We are cautiously optimistic that the growth revival getting priced into Treasury yields will materialize. However, it’s vital to note that the yield rebound is not yet confirmed by the economic data. Even timely global growth indicators like the CRB Raw Industrials index remain downbeat (Chart 1, bottom panel). If global growth measures don’t bottom soon, then Treasury yields are certain to fall back. Chart 1Yields Are Ahead Of The Data
Yields Are Ahead Of The Data
Yields Are Ahead Of The Data
We do expect the economic data to follow bond yields higher. We noted in last week’s report that the weakness in US economic data is concentrated in survey measures (aka “soft” data), while measures of actual economic activity (aka “hard data”) are holding up well.1 For example: The ISM Manufacturing survey is below its 2016 trough, but the year-over-year growth rate in industrial production is well above 2016 levels (Chart 2, top panel). Capacity utilization also remains elevated (Chart 2, bottom panel). New orders for core capital goods are holding firm, even with CEO confidence at its lowest since 2009 (Chart 2, panel 2). Employment growth remains strong, despite the employment component of the ISM Non-Manufacturing survey being just above the 50 boom/bust line (Chart 2, panel 3). Chart 2Will "Soft" Data Rebound?
Will "Soft" Data Rebound?
Will "Soft" Data Rebound?
Our interpretation of the divergence is that uncertainty about the US/China trade war is weighing on sentiment and holding survey measures down. If that uncertainty is removed, survey measures will quickly rebound and converge with the “hard” data. On that front, we think it’s very likely that trade uncertainty diminishes during the next few months. The US and China have already agreed to an informal “phase one deal” that will require China to buy $40-$50 billion of US agricultural goods while the US delays the October 15 tariff hike. Odds are that President Trump will also delay the planned December 15 tariff hike and probably roll back some existing tariffs.2 The reason is that while Trump’s overall approval rating has been consistently low; until recently, he had been receiving high marks for his handling of the economy (Chart 3). But his economic approval rating took a tumble this summer and, as we head toward the 2020 election, he desperately needs an economic boost and/or policy victory to push up his numbers. We already see some tentative signs of a rebound in the regional Fed manufacturing surveys. A tactical retreat on trade should improve sentiment and cause survey data to move higher, alongside bond yields. And in fact, we already see some tentative signs of a rebound in the regional Fed manufacturing surveys (Chart 4). October figures are out for the New York, Philadelphia, Richmond, Kansas City and Dallas surveys, and they have all diverged positively from the national ISM. Chart 3It's Trump's Economy
It's Trump's Economy
It's Trump's Economy
Chart 4Some Optimism From Regional Surveys
Some Optimism From Regional Surveys
Some Optimism From Regional Surveys
Bottom Line: The upturn in bond yields is not yet confirmed by our preferred global growth indicators. We anticipate that a reduction in trade uncertainty during the next few months will cause our indicators to rebound. But until then, investors should view the bond sell-off as tenuous. Yield Curve: Macro Drivers We noted in the first section that the 2/10 Treasury slope has steepened sharply since it briefly broke below zero in late August. In this section, we consider whether this 2/10 steepening might continue. To do this we run through the main macro drivers of the yield curve. The Fed Funds Rate Traditionally, there is a very tight correlation between the fed funds rate and the slope of the curve (Chart 5). Fed tightening puts upward pressure on the curve’s front-end relative to the back-end, leading to a bear-flattening. Conversely, Fed easing drags the front-end down relative to the long-end, leading to bull-steepening. Chart 5The Fed's Yield Curve Control
The Fed's Yield Curve Control
The Fed's Yield Curve Control
The traditional pattern broke down between 2009 and 2015 when the fed funds rate was pinned at zero. This period saw many episodes of bear-steepening and bull-flattening. But since the funds rate has been off zero, the traditional correlation has begun to re-assert itself. Our base case outlook calls for one more 25 bps rate cut tomorrow, followed by an extended on-hold period. This scenario might be expected to impart some mild steepening pressure to the curve, except for the fact that the front-end is already priced for 53 bps of easing during the next 12 months, significantly more than we expect. Our base case outlook calls for one more 25 bps rate cut tomorrow, followed by an extended on-hold period. If our base case scenario is incorrect, and growth continues to deteriorate, forcing the Fed to cut rates all the way back to zero. Then we would expect some initial bull-steepening, followed by bull-flattening as the funds rate approaches the zero bound. Wage Growth Wage growth is another excellent yield curve indicator, mainly because it helps determine the direction of the fed funds rate. Stronger wage growth causes the Fed to tighten and the curve to flatten. On the flipside, wage growth is a less effective indicator during Fed easing cycles, when it tends to lag changes in the funds rate (Chart 6). In fact, while wage growth is tightly correlated with the 2/10 slope, it lags changes in the slope by about 12 months (Chart 6, panel 2). Chart 6Wages Lead Tightening, But Lag Easing
Wages Lead Tightening, But Lag Easing
Wages Lead Tightening, But Lag Easing
The upshot is that if the economy heads toward recession, then wage growth will not be a timely indicator of Fed rate cuts. However, if recession is avoided and wages continue to accelerate (Chart 6, bottom 2 panels), strong wage growth will limit how accommodative the Fed can be as it seeks to re-anchor inflation expectations. As such, persistently strong wage growth will limit the amount of curve steepening that can occur. Inflation Expectations The Fed’s need to re-anchor inflation expectations in a range consistent with its target is the main reason to forecast curve steepening. At present, the 10-year TIPS breakeven inflation rate is a mere 1.66%, well below the 2.3%-2.5% range that the Fed would consider “well anchored”. One might conclude that if the Fed succeeds in driving this rate higher, it will impart significant steepening pressure to the curve. However, we must also note that the 2-year TIPS breakeven inflation rate is even lower than the 10-year rate (Chart 7). Given our view that long-dated inflation expectations adapt only slowly to the actual inflation data, we would expect both the 2-year and 10-year breakevens to rise in tandem, exerting some modest flattening pressure on the curve.3 Chart 7Any Steepening Will Come From Real Yields
Any Steepening Will Come From Real Yields
Any Steepening Will Come From Real Yields
Ironically, if the Fed is successful in re-anchoring long-dated inflation expectations, we expect it will cause the yield curve to steepen, but through its impact on real yields. At present, the 2-year and 10-year real yields are 0.37% and 0.14%, respectively. The act of holding rates steady for long enough to re-anchor inflation expectations will exert downward pressure on the 2-year real yield, while the 10-year real yield will rise in response to an improved growth outlook. The Fed’s goal of re-anchoring inflation expectations will likely lead to some curve steepening, but through the real component of yields, not the inflation component. The Neutral Rate The neutral rate – the fed funds rate that is neither inflationary nor deflationary – is a major wild card when it comes to the yield curve. Right now, the median Fed estimate calls for a neutral rate of 2.5%, while the market is pricing-in an even lower rate of 2%, at least according to the 5-year/5-year forward Treasury yield (Chart 8). Neutral rate estimates have been revised lower during the past few years, exerting significant flattening pressure on the yield curve. In theory, if we reach an inflection point where neutral rate estimates are revised higher, it would lead to substantial curve steepening. One thing to watch to help predict movement in neutral rate estimates is the gold price.4 Gold performs well when the market perceives monetary policy as increasingly accommodative, either because the Fed is cutting rates or because the assumed neutral rate is rising. The 2013 drop in gold foreshadowed downward revisions to the Fed’s neutral rate estimate (Chart 8, bottom panel). A further increase in gold, especially once the Fed stops cutting rates, would send a strong signal that current neutral rate estimates are too low. Monetary policy arguably exerts its greatest economic impact through the housing market. Investors can also watch the housing market for clues about the neutral rate. Monetary policy arguably exerts its greatest economic impact through the housing market. If housing activity starts to wane, it can be a strong signal that interest rates are too high. Last year, housing activity started to flag once the mortgage rate moved above 4% (Chart 9). If 4% proves to be the ceiling on mortgage rates, it would mean that the Fed’s current neutral rate estimate is roughly correct. However, home prices have moderated since last year, and new construction has started to focus more on the low-end of the market, where supply remains scarce.5 This shift in focus from homebuilders has caused the price of new homes to fall considerably (Chart 9, bottom panel), a supply side re-adjustment that could make the housing market more resilient in the face of higher rates. Chart 8Tracking The Neutral Rate: Gold
Tracking The Neutral Rate: Gold
Tracking The Neutral Rate: Gold
Chart 9Tracking The Neutral Rate: Housing
Tracking The Neutral Rate: Housing
Tracking The Neutral Rate: Housing
An upward re-assessment of the neutral rate would impart steepening pressure to the yield curve, but only if it occurs quickly, before the Fed has time to deliver offsetting rate hikes. However, we think it’s more likely that any increase in neutral rate estimates will occur gradually, alongside Fed tightening. In that case, a roughly parallel upward shift in the yield curve would be the most likely outcome. Verdict Considering all of the above factors, we would look for some modest 2/10 curve steepening during the next few months. The steepening will be driven by the Fed’s desire to re-anchor long-dated inflation expectations, a desire that will result in them keeping rates steady (apart from one more cut tomorrow), even as economic growth improves. As noted above, this steepening will show up in real yields, not in the TIPS breakeven inflation curve. That being said, strong wage growth and overly dovish market rate cut expectations will ensure that any steepening is well contained. We expect the 2/10 slope to stay in a range between 0 bps and 50 bps for the next 6-12 months. Yield Curve Strategy Chart 10Treasury Yield Curve
Position For Modest Curve Steepening
Position For Modest Curve Steepening
When thinking about how to position a Treasury portfolio for our expected yield curve outcome, we first look at the value proposition offered by different Treasury maturities. Chart 10 shows the Treasury yield curve, and also each maturity’s 12-month rolling yield. The rolling yield is simply the combination of each maturity’s 12-month yield income and the price impact of rolling down the curve. It can be thought of as the return you would earn holding each bond for 12 months in an unchanged yield curve environment. The first thing that sticks out in Chart 10 is that the 5-year note offers poor value. We also note that the curve steepens sharply beyond the 5-year maturity point, so maturities greater than 5 years benefit a lot from rolldown. The simple intuition from Chart 10 is confirmed by our butterfly spread models.6 Chart 11shows that the 5-year bullet looks very expensive relative to a duration-matched barbell portfolio consisting of the 2-year and 10-year notes. In fact, with only a few exceptions, bullets are expensive relative to barbells across the entire Treasury curve (see Appendix). Chart 11Bullets Are Very Expensive
Bullets Are Very Expensive
Bullets Are Very Expensive
All else equal, bullets tend to outperform barbells when the yield curve steepens. However, given current valuations, it would take a lot of steepening for bullets to outperform barbells during the next few months. Chart 12Yield Curve Correlations
Yield Curve Correlations
Yield Curve Correlations
Further, Chart 12 shows that the front-end of the yield curve – out to about the 5-year/7-year point – tends to steepen when our 12-month discounter rises, while the long-end of the curve – beyond the 7-year point – tends to flatten. Given that our 12-month discounter is currently -53 bps, meaning that the market is priced for 53 bps of rate cuts during the next year, we expect it will rise during the next few months. This should exert the most upward pressure on the 5-year/7-year part of the curve. We have been recommending that investors play the curve by going long a 2/30 barbell and shorting the 7-year bullet. But given the significant rolldown advantage in the 7-year compared to the 5-year, we amend that recommendation this week. We now recommend that investors short the 5-year bullet and go long a duration-matched barbell consisting of the 2-year and 30-year maturities. Bottom Line: The 5-year Treasury note looks expensive compared to the rest of the yield curve, and historical correlations suggest it will rise the most if the Fed delivers fewer rate cuts than are currently expected. We recommend that investors short the 5-year bullet versus a duration-matched 2/30 barbell. Appendix Table 1Butterfly Strategy Valuation: Raw Residuals In Basis Points (As of October 25, 2019)
Position For Modest Curve Steepening
Position For Modest Curve Steepening
Table 2Butterfly Strategy Valuation: Standardized Residuals (As of October 25, 2019)
Position For Modest Curve Steepening
Position For Modest Curve Steepening
Ryan Swift U.S. Bond Strategist rswift@bcaresearch.com Footnotes 1 Please see U.S. Bond Strategy Weekly Report, “Crisis Of Confidence”, dated October 22, 2019, available at usbs.bcaresearch.com 2 For further details on BCA’s outlook for US/China trade negotiations please see Geopolitical Strategy Weekly Report, “How Much To Buy An American President?”, dated October 25, 2019, available at gps.bcaresearch.com 3 For further details on how inflation expectations adapt to the actual inflation data please see U.S. Bond Strategy Weekly Report, “Adaptive Expectations In The TIPS Market”, dated November 20, 2018, available at usbs.bcaresearch.com 4 Please see U.S. Bond Strategy Weekly Report, “A Signal From Gold?”, dated May 1, 2018, available at usbs.bcaresearch.com 5 Please see U.S. Bond Strategy Weekly Report, “The Long Awkward Middle Phase”, dated July 2, 2019, available at usbs.bcaresearch.com 6 For details on our butterfly spread models please see U.S. Bond Strategy Special Report, “Bullets, Barbells And Butterflies”, dated July 25, 2017, available at usbs.bcaresearch.com Fixed Income Sector Performance Recommended Portfolio Specification
Another potential explanation for the resilience of EM domestic yields to local currency depreciation is investor complacency: extremely low and negative bond yields in DM are inducing an unrelenting search for yields. As a result, investors are looking…
The New Normal for EM local bonds refers to their yields dropping even as EM currencies depreciate when global growth slows. This implies the past relationship between EM domestic yields on the one hand, and EM currencies and global macro variables on the…
The closer a bond yield gets to the -1 percent lower bound, the more limited becomes the possibility for a further yield decline (capital gain), while the possibility for a yield increase (capital loss) stays unlimited. This creates a negative skew or…
Highlights Analysis on Chile is available below. EM local bond yields have decoupled from their traditional macro drivers. This could be a sign that EM domestic bonds are entering a New Normal. We refer to a New Normal for EM local bonds when their yields drop during a global growth slowdown even as their currencies depreciate. Only time will tell whether the recent decoupling between EM local bond yields and their currencies is due to investor complacency or represents a sustainable paradigm shift. We are instituting a buy stop on the MSCI EM equity index at 1075. If and when the EM stock index in dollar terms breaks decisively above this level, we will become cyclically bullish and recommend playing the rally. Feature EM local currency bond yields have fallen below their 2013 lows (Chart I-1) – levels not reached since before the Federal Reserve-induced “Taper Tantrum” in the spring of 2013, when EM domestic bond yields spiked and currencies plunged. Crucially, in a major departure from their historical relationship, the aggregate EM GBI index of local bond yields has decoupled from EM currencies (Chart I-1), commodities prices, EM U.S dollar-denominated sovereign bond yields and the global business cycle (Chart I-2). Chart I-1EM Local Bond Yields Have Decoupled From EM Currencies
EM Local Bond Yields Have Decoupled From EM Currencies
EM Local Bond Yields Have Decoupled From EM Currencies
Chart I-2EM Domestic Bond Yields Have Diverged From Their Traditional Macro Drivers
EM Domestic Bond Yields Have Diverged From Their Traditional Macro Drivers
EM Domestic Bond Yields Have Diverged From Their Traditional Macro Drivers
Will this decoupling persist, or will the past relationship be re-established? In other words, have EM local currency bonds entered a New Normal – a paradigm where their yields behave like DM yields – falling during deflationary periods and rising during business cycle recoveries? What We Got Right And Wrong We had not been anticipating such a large drop in EM domestic bond yields this year. Our analysis has been based on the following pillars: That the global trade and manufacturing recession would persist until late 2019, and that such an outcome would herald lower commodities prices and weaker EM currencies. Falling resource prices and EM currency deprecation, consistent with the history shown in Chart I-1 and I-2, would lead to a foreign investor exodus from EM local bonds, reinforcing currency depreciation and somewhat higher yields. Our theme that the global trade and manufacturing recession has been driven by weak domestic demand in China and the rest of the EM has played out quite well; commodities prices have been weak and EM currencies have depreciated. In addition, the broad trade-weighted dollar has been strong and DM bond yields have plunged in the past 12 months, in line with our theme of a global growth slump. In a major departure from their historical relationship, the aggregate EM GBI index of local bond yields has decoupled from EM currencies commodities prices, EM U.S dollar-denominated sovereign bond yields and the global business cycle. Nevertheless, our view of a selloff in EM domestic bonds has not panned out. In other words, our spot-on macro analysis has not translated into a successful investment call on the direction of EM local yields. The reason has been a change in the relationship between EM bond yields and their typical global macro drivers, specifically EM currencies. A potential counter-argument could be that falling DM bond yields have pushed EM local yields lower. However, contrary to the widespread consensus view, both EM local bond yields and currencies have illustrated a relatively weak correlation with U.S. bond yields (Chart I-3). All in all, even though our macro view has been on the ball, we have been flat-footed by the shifting relationship between EM domestic bond yields and their traditional macro drivers as illustrated in Chart I-1 and I-2. Finally, even though EM bond yields have plunged, their total returns in U.S. dollar terms have not been spectacular (Chart I-4, top panel). Crucially, the EM GBI total return index in dollar terms has not outperformed that of duration-matched U.S. Treasurys (Chart I-4, bottom panel). Chart I-3No Stable Correlation Between EM Markets And U.S. Bond Yields
No Stable Correlation Between EM Markets And U.S. Bond Yields
No Stable Correlation Between EM Markets And U.S. Bond Yields
Chart I-4EM Local Bonds Have Rallied But Have Not Outperformed U.S. Treasurys
EM Local Bonds Have Rallied But Have Not Outperformed U.S. Treasurys
EM Local Bonds Have Rallied But Have Not Outperformed U.S. Treasurys
Our macro views and themes have been positive for DM bonds. Fixed-income investors who favored U.S. Treasurys over EM local bonds have not underperformed by much in the past 12 months and have actually dramatically outperformed in 2018. Complacency Or A New Normal? There are two possible scenarios for EM domestic bonds going forward: Bullish Scenario: EM Local Bonds Have Entered A New Normal We refer to a New Normal for EM local bonds when their yields drop during a global growth slowdown even as EM currencies depreciate. This implies the past relationships between EM domestic yields on the one hand, and EM currencies and global macro variables on the other hand have permanently reversed. If EM domestic bonds have entered a New Normal, central banks in high-yielding EMs should cut interest rates during global growth slowdowns even if their exchange rate depreciates. Besides, their local bond yields should move lower despite currency weakness. If these two conditions are satisfied, one can argue that a major regime shift in EM interest rates has taken place. Ongoing rate cuts by a few of EM central banks - despite lingering weakness in their currencies - could be an indication that we are entering such a regime shift (Chart I-5). We refer to a New Normal for EM local bonds when their yields drop during a global growth slowdown even as EM currencies depreciate. We are open to accept this idea of a New Normal. Central banks in any economy where growth is slowing and inflation is low or falling should reduce interest rates even if their exchange rate depreciates. This will be a positive development for these countries, as it will make their monetary policy counter-cyclical - as it should be. One pre-condition for EM domestic bonds entering a New Normal is for the share of foreign investors holding of local currency bonds to decline. It is occurring at the margin in some countries. In Turkey, South Africa, Malaysia and Poland, the share of foreign investors in domestic bonds has fallen (Chart I-6). Yet, this phenomenon is not occurring in Indonesia, Russia, Colombia and Mexico. Chart I-5Rare Examples Of Rate Cuts Amid Currency Weakness
Rare Examples Of Rate Cuts Amid Currency Weakness
Rare Examples Of Rate Cuts Amid Currency Weakness
Chart I-6Falling Share Of Foreign Investors
Falling Share Of Foreign Investors
Falling Share Of Foreign Investors
Negative Scenario: Investor Complacency Ends Chart I-7EM Currencies Correlate With Global Business Cycle And Commodities Prices
bca.ems_wr_2019_10_24_s1_c7
bca.ems_wr_2019_10_24_s1_c7
Another potential explanation for the resilience of EM domestic yields to local currency depreciation is investor complacency: extremely low and negative bond yields in DM is inducing an unrelenting search for yields. As a result, investors are looking through EM currency depreciation, hoping it will be fleeting. Conditional on our view that EM currencies remain at risk of further depreciation panning out, EM local bonds are unlikely to avoid foreign outflows and higher yields under this scenario. This is especially true for the EM countries with high foreign ownership of local bonds. In theory, various macro forces such as expectations of domestic monetary policy, fiscal policy, inflation prospects, domestic business cycles, individual countries’ exchange rates as well as global interest rates should influence EM local bond yields. In reality, however, EM local yields have historically risen during periods of global business cycle downturns and falling commodities prices. The channel was via EM currencies, which depreciated during these periods (Chart I-7). Thereby, the primary driver for local bond yields has historically been swings in domestic exchange rates. In turn, the basis for this high sensitivity of EM domestic bond yields to their exchange rates has been due to the large share of foreign ownership. Table I-1 illustrates that the share of local currency government bonds held by foreign investors is high in the majority of EM countries. The exceptions are China, India, Korea, the Philippines and Chile. The data for Brazil are suspect. It is difficult to believe that foreigners own a mere 12% and declining share of Brazilian local currency bonds. Another potential explanation for the resilience of EM domestic yields to local currency depreciation is investor complacency: extremely low and negative bond yields in DM is inducing an unrelenting search for yields. As a result, investors are looking through EM currency depreciation, hoping it will be fleeting. What is critical, is that international investors care about the returns on their investments in U.S. dollars, euros or Japanese yen. Hence, they are very sensitive to exchange rates. Historically, foreign investors flee EM local bond markets when EM currencies depreciate, and vice versa. Chart I-8 illustrates the wide gap between total returns on EM domestic bonds in local currency and U.S. dollar terms. Table I-1Share Of Domestic Bonds Held By Foreign Investors
EM Local Bonds: A New Normal?
EM Local Bonds: A New Normal?
Chart I-8EM Currencies Are Key To EM Local Bonds Volatility
EM Currencies Are Key To EM Local Bonds Volatility
EM Currencies Are Key To EM Local Bonds Volatility
In short, most investment return volatility in EM local bonds can be attributed to exchange rates – i.e., investments in EM local bonds have in practical terms constituted a bet on their exchange rates. If EM currencies experience another downleg, foreign investors’ patience might run out, causing a spike in EM local yields. Bottom Line: It is still early to conclude if a New Normal in EM domestic bonds has already taken hold. Only time will tell whether the recent decoupling between EM local bond yields and their currencies is due to an unrelenting search for yield or represents a paradigm shift. Reasons Why Local EM Yields Could Rise There are two macro risks to EM local bonds: 1. A deepening/persisting growth slump in China Deteriorating Chinese domestic growth or a weaker RMB remain the key risks to the rest of the world. In brief, odds are high that China will continue exporting deflation to the rest of the world. Shrinking Chinese imports imply that the rest of the world’s export revenues emanating from their shipments to China are contracting (Chart I-9). A negative growth shock in EM economies that are exposed to China heralds both weaker currencies and lower interest rates. Given that high-yielding EM local bonds yields have risen historically during negative growth shocks, we are reluctant to chase these EM yields lower. This has been, and remains, our main thesis for high-yielding EM bond markets. 2. Rising inflation in the U.S. Despite commentators’ preoccupation with global deflation and recession, U.S. core inflation is moving up. The equal-weighted average of various core measures presently stands at 2.2% and is drifting higher (Chart I-10). Chart I-9Chinese Imports Are Shrinking
Chinese Imports Are Shrinking
Chinese Imports Are Shrinking
Chart I-10U.S. Core Inflation Is Above 2% And Rising
U.S. Core Inflation Is Above 2% And Rising
U.S. Core Inflation Is Above 2% And Rising
Besides, BCA Research’s U.S. wage tracker and unit labor costs have been accelerating (Chart I-11). The tight labor market in the U.S. suggest that risks to wages and unit labor costs and, ultimately, inflation are skewed to the upside. Chart I-11U.S. Wages And Unit Labor Costs Are Accelerating
U.S. Wages And Unit Labor Costs Are Accelerating
U.S. Wages And Unit Labor Costs Are Accelerating
Unless U.S. growth slows much further, America’s fixed-income markets will at some point wake up to the reality of rising inflation. This will produce a shift up in the entire yield curve. Such a spike in U.S. Treasury yields will lead to a period of dollar strength and a selloff in overbought EM local bonds. Bottom Line: EM local bonds are discounting a goldilocks scenario. The two most likely risks that investors should monitor are a deepening growth slump in China and upside surprises in U.S. consumer price inflation. Investment Strategy: Instituting A Buy Stop on EM Equities Given our negative stance on EM exchange rates, we have been receiving rates in EM countries where interest rates historically dropped amid currency deprecation. These include Korea, Chile and Mexico (the latter due to the value in local rates). For a dedicated EM local bond portfolio, our recommended overweights have been: Mexico, Russia, Central Europe, Chile, Korea and Thailand. Our underweights have been South Africa, Turkey, Indonesia, the Philippines and Argentina. Clients can always find our country allocation and trades for the EM local bond universe at the end of our weekly reports - please refer to page 14 - or on our website. Also, gauging the direction of EM local bond yields is critical not only to fixed-income portfolio managers but to equity managers as well. Chart I-12 illustrates that EM equities rally when their domestic bond yields are falling. The failure of EM share prices to rally in recent months amid plunging EM local bond yields has been due to shrinking corporate profits. We are instituting a buy stop on the MSCI EM equity index at 1075. Any pick-up in EM domestic bond yields without recovery in EM corporate earnings will cause a major drop in EM equities. As to our EM equity strategy, our negative view is currently being challenged by the reaction of global share prices to negative profits and growth data releases. Despite very weak global trade and manufacturing data as well as downbeat profits from cyclical sectors, U.S. high-beta stocks and global cyclicals – an equal-weighted average of global industrials, materials and semiconductor stocks - have held up well (Chart I-13). Chart I-12EM Stocks Struggled Despite Falling Local Yields
EM Stocks Struggled Despite Falling Local Yields
EM Stocks Struggled Despite Falling Local Yields
Chart I-13Global Cyclicals And U.S. High-Beta Stocks Are Holding Up
Global Cyclicals And U.S. High-Beta Stocks Are Holding Up
Global Cyclicals And U.S. High-Beta Stocks Are Holding Up
This could reflect investor complacency or it could be that the equity market is sensing an imminent recovery in global growth that we do not see in data. In particular, DM equities are at a critical juncture – not only the S&P 500 but also euro area stock prices are flirting with their previous highs (Chart I-14). Chart I-14Euro Area Stocks Are At Their Major Resistance
Euro Area Stocks Are At Their Major Resistance
Euro Area Stocks Are At Their Major Resistance
If they relapse from here, it will signify a bear market. On the other hand, if these equity markets break out, it would suggest that a major upleg is in the making. Even though EM share prices are well below their previous highs, they are also at a make or break juncture. Therefore, we are instituting a buy stop on the MSCI EM equity index at 1075 (Chart I-15). If and when the EM stock index in dollar terms breaks decisively above this level, we will become cyclically bullish and recommend playing the rally. Chart I-15We Are Instituting A Buy Stop at 1075 on MSCI EM Index
We Are Instituting A Buy Stop at 1075 on MSCI EM Index
We Are Instituting A Buy Stop at 1075 on MSCI EM Index
Arthur Budaghyan Chief Emerging Markets Strategist arthurb@bcaresearch.com Chile: Structural Equity De-Rating The latest violent protests in Chile have raised doubts about its socio-political and economic stability. As a result, Chilean share prices could be facing both absolute and relative (versus other EM bourses) de-ratings. We are downgrading this bourse from overweight to neutral within an EM equity portfolio, reiterating our short position in the peso versus the dollar, and continue to bet on lower rates and falling inflation cyclically, as discussed in great length in our recent report. Chilean stocks have always been among the most expensive within the EM universe due to the nation’s economic and socio-political stability. The violent protests now warrant a structural de-rating of equity valuations (Chart II-1). Chart II-1Chilean Share Prices: A Long-Term Perspective
Chilean Share Prices: A Long-Term Perspective
Chilean Share Prices: A Long-Term Perspective
First, the government will be forced to adopt much more populist policies, such as the recently announced raise in minimum wages, pension payments and healthcare benefits. Unit labor costs for businesses are set to rise substantially, eating into corporate profit margins. Second, in line with more populist policies, larger budget deficits and structurally higher inflation will cause the long-end of the yield curve to rise. Higher interest rates will put downward pressure on equity multiples. Finally, equity investors will require a higher risk premium to invest in this bourse. Chile’s equity valuation premium versus EM overall will shrink. Bottom Line: The central bank will have to cut rates by a larger margin: continue receiving 3-year swap rates. A recession is unavoidable as business confidence will plunge and derail hiring and investments. Inflation will fall much further cyclically: bet on lower inflation by going long 3-year local currency bonds and shorting their inflation-linked counterparts. Continue shorting the peso versus the U.S. dollar. Downgrade the allocation to Chilean stocks from overweight to neutral within an EM equity portfolio. Footnotes Equities Recommendations Currencies, Credit And Fixed-Income Recommendations
The demand for duration and convexity from asset-liability managers like European pension funds and insurance companies created a technical aspect to the fall in bond yields in August. Falling yields raise the value of liabilities for these investors,…
The timing of the bottoming of yields in the major developed markets (DM) should not be surprising: reliable leading indicators of the direction of yields are moving up. The diffusion index of our global leading economic indicator (LEI), which leads DM…
Highlights On a tactical horizon, underweight bonds versus cash, especially those bonds with deeply negative yields… …and underweight bonds versus equities. On a strategic horizon, remain overweight a 50:50 combination of U.S. T-bonds and Italian BTPs versus a 50:50 combination of German Bunds and Spanish Bonos, at either 10-year or 30-year bond maturities. Investors could also play the component pairs: overweight U.S. T-bonds versus German bunds; and overweight Italian BTPs versus Spanish Bonos. New recommendation: switch Japanese yen long exposure into Swedish krona long exposure. Fractal trade: long SEK/JPY. Feature Chart of the WeekSwiss Bond Yields Have Found It Difficult To Go Down, But Easy To Go Up!
Swiss Bond Yields Have Found It Difficult To Go Down, But Easy To Go Up!
Swiss Bond Yields Have Found It Difficult To Go Down, But Easy To Go Up!
Anybody who has dared to bet that JGB yields would rise has ended up being carried out of their job, feet first. Shorting Japanese government bonds (JGBs) is known as the widow maker trade. Over the past 20 years, any investment manager who has dared to bet that JGB yields would rise – whether starting from 2 percent, 1 percent, or even 0.5 percent – has ended up being carried out of their job in a box, feet first. Today, the Bank of Japan’s policy of ‘yield curve control’ means that JGB yields are constrained within a tight range around zero, limiting their immediate scope to break higher. The European equivalent of the widow maker trade has been to short Swiss government bonds. Just as with JGB’s during the past two decades, anybody who has dared to bet that Swiss government bond yields would rise – whether starting from 2 percent, 1 percent, or 0.5 percent – has been proved fatally wrong (Chart I-2). Chart I-2Widow Makers: Shorting Japanese And Swiss Bonds
Widow Makers: Shorting Japanese And Swiss Bonds
Widow Makers: Shorting Japanese And Swiss Bonds
That is, until this year, when Swiss government bond yields reached -1 percent. The Lower Bound To Bond Yields Is Around -1 Percent According to several senior central bankers who have spoken to us, the practical lower bound to the policy interest rate is -1 percent, because “-1 percent counterbalances the storage cost of holding physical cash and/or other stores of value”. They argue that if bank deposit rates were to fall much below -1 percent, it would be logical for bank depositors to flee wholesale into physical cash, and such a deposit flight would destroy the banking system.1 Still, couldn’t central banks just abolish physical cash, forcing us all into ‘digital cash’ with unlimited negative interest rates? No, because that would just push us into other stores of value: for example, gold, or the rapidly growing ‘decentralised’ cryptocurrency asset-class. The common counterargument is that cryptocurrencies’ volatility makes them a poor store of value. But that is also true for gold: during a few months in 2013, gold lost one third of its value (Chart I-3). Yet who has ever argued that gold cannot be a store of value just because its price is volatile! Chart I-3Gold Is A Store Of Value ##br## Despite Its Volatility
Gold Is A Store Of Value Despite Its Volatility
Gold Is A Store Of Value Despite Its Volatility
The practical lower bound to the policy interest rate is around -1 percent because the central bank policy rate establishes the banking system’s funding rate – for example, the Eonia rate in the euro area (Chart I-4). If the funding rate fell well below the rate that the banks were paying on deposits, the banking system would come under severe strain and ultimately go bust. The lower bound of the policy rate also sets the lower bound of the bond yield, because a bond yield is just the expected average policy rate over the bond’s lifetime. Chart I-4The Policy Interest Rate Establishes The Banking System's Funding Rate
The Policy Interest Rate Establishes The Banking System's Funding Rate
The Policy Interest Rate Establishes The Banking System's Funding Rate
There is one important exception. If bond investors price in the possibility of being repaid in a different and more valuable currency, the bond yield will carry a further redenomination discount as an offset for the potential currency gain. This is relevant to euro area bonds because there remains the remote possibility of euro disintegration. Bonds which would expect to see a currency redenomination gain – notably, German bunds – therefore carry an additional discount on their yields. But for bonds where no currency redenomination is possible, the practical lower bound to bond yields is around -1 percent. Overweight High Yielding Bonds Versus Low Yielding Bonds To state the obvious, the closer that a bond yield gets to the -1 percent lower bound, the more limited becomes the possibility for a further yield decline (capital gain), while the possibility for a yield increase (capital loss) stays unlimited. This unattractive lack of upside combined with plenty of potential downside is called negative skew or negative asymmetry. It follows that, close to the lower bound of yields, the cyclicality or ‘beta’ of bond prices also becomes asymmetric. In risk-off phases, the bond prices cannot rally; while in risk-on phases, bond prices can plummet. Making such bonds a ‘lose-lose’ proposition. Case in point: Swiss bond yields have found it difficult to go down this year, but very easy to go up (Chart of the Week). Because their yields were already so close to -1 percent, Swiss bond yields could not decline much during the bond market’s recent strong rally – meaning, Swiss bond prices were very low beta on the way up. But in the recent reversal, Swiss bond yields have risen much more than others – meaning, Swiss bond prices are high beta on the way down (Chart I-5). Chart I-5Swiss Bond Prices Are Low Beta Going Up, But High Beta Going Down
Swiss Bond Prices Are Low Beta Going Up, But High Beta Going Down
Swiss Bond Prices Are Low Beta Going Up, But High Beta Going Down
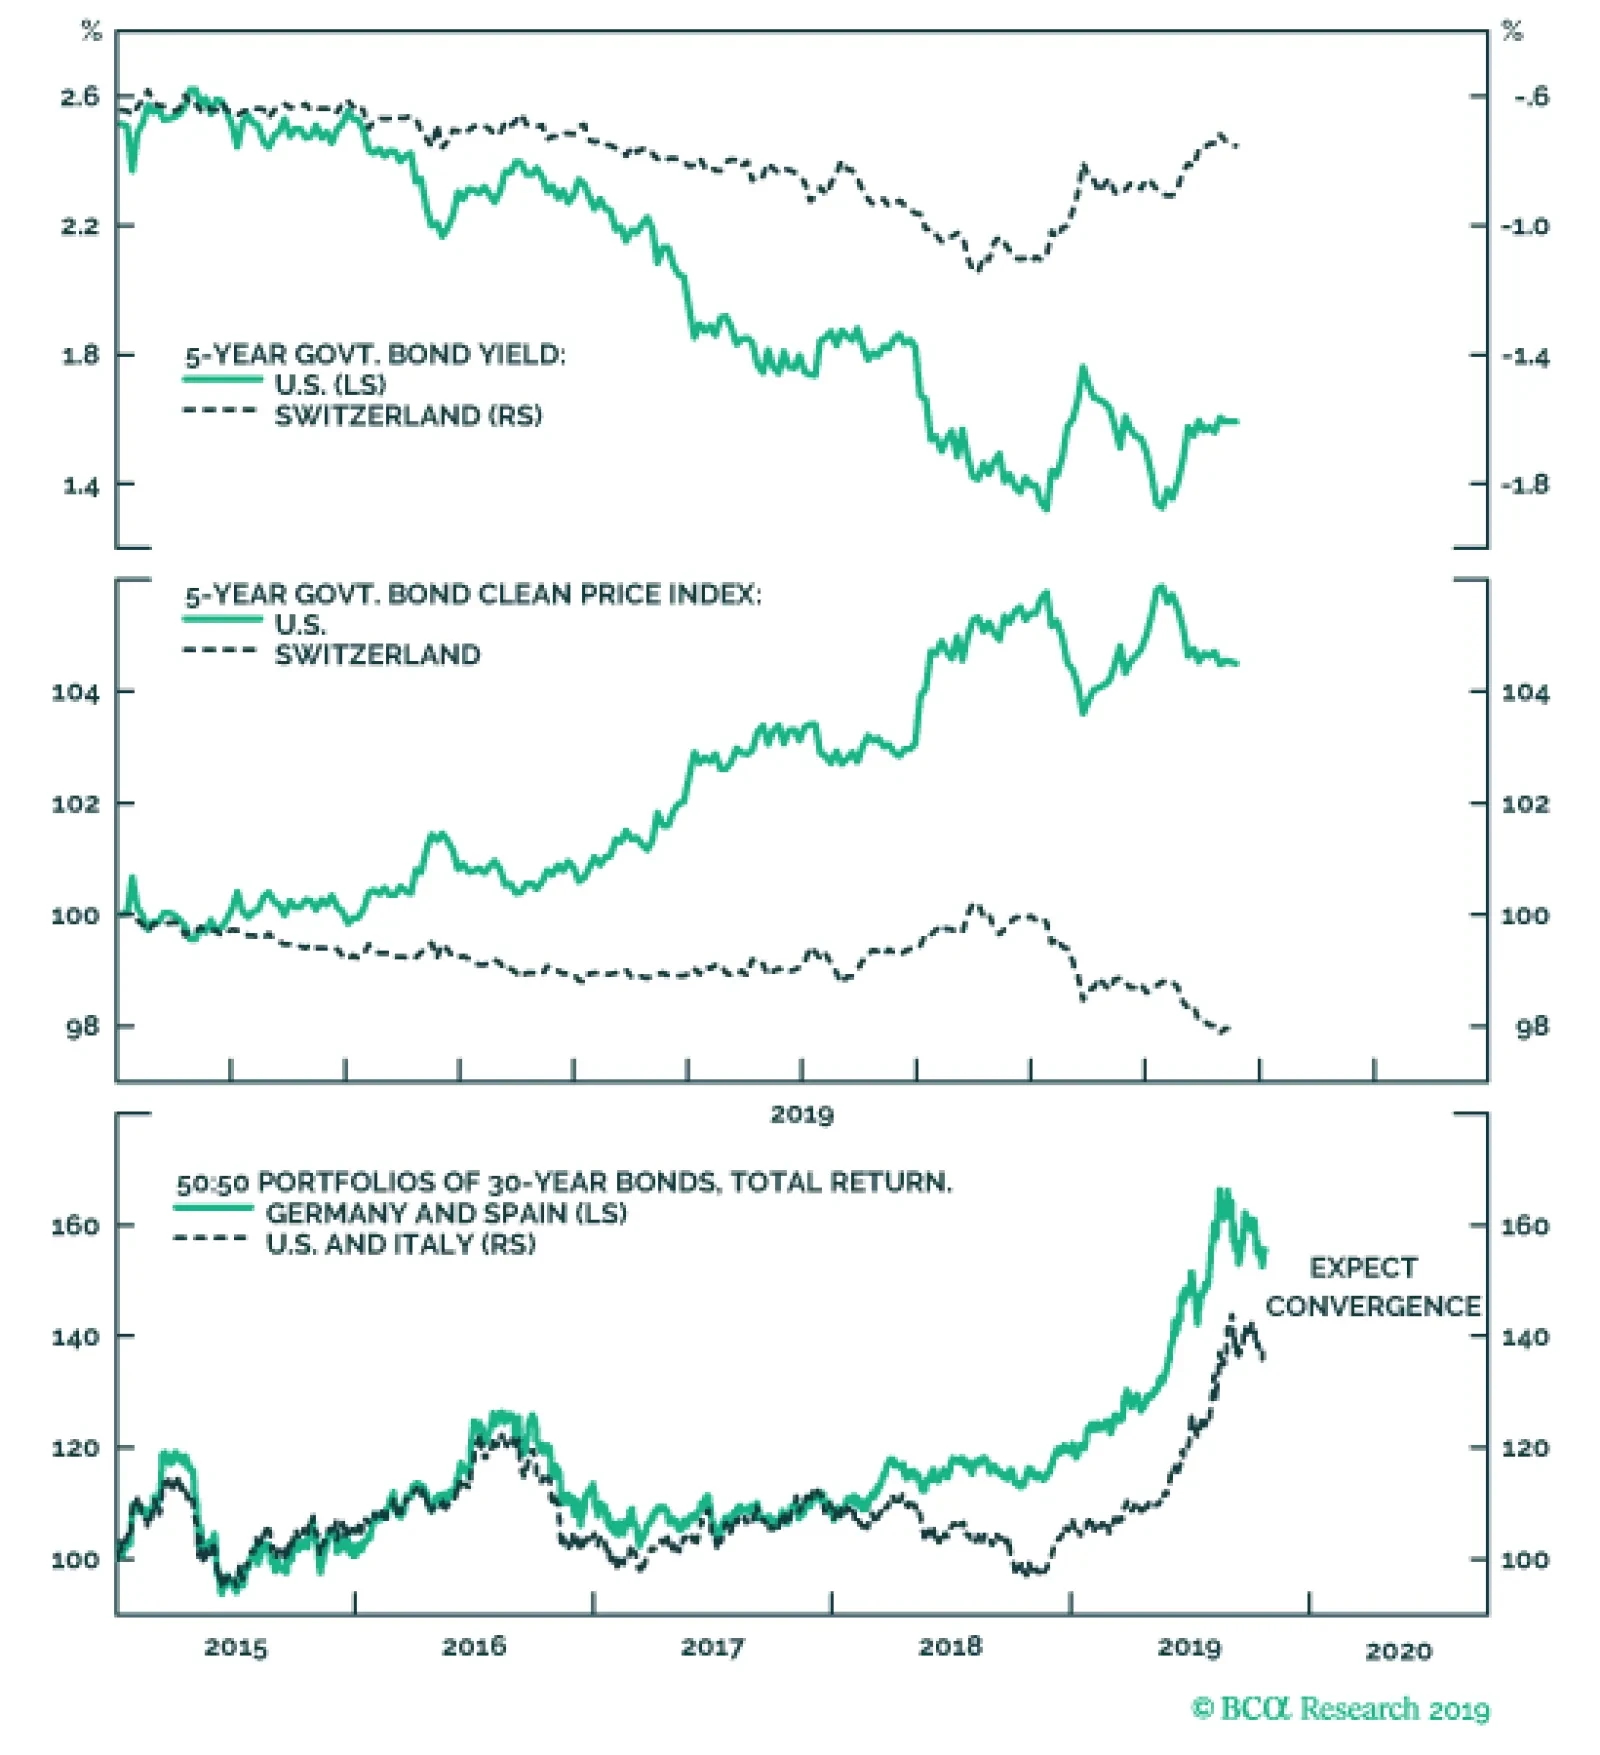
Does this mean the widow maker trade can finally work? Yes, but only on a tactical horizon. For the full rationale, which we will not repeat here, please see Growth To Rebound In The Fourth Quarter, But Fade In 2020. However in summary, expect bond yields to edge modestly higher, and especially those yields that are deeply in negative territory. Also on a tactical horizon, prefer equities over bonds. On a longer term horizon, a much safer way to play the asymmetric beta is to short low yielding bonds in relative terms. In other words, overweight high yielding bonds versus low yielding bonds.2 Close to the lower bound of yields, the cyclicality or ‘beta’ of bond prices becomes asymmetric. Our strategic recommendation is to overweight a 50:50 combination of U.S. T-bonds and Italian BTPs versus a 50:50 combination of German Bunds and Spanish Bonos, at either 10-year or 30-year bond maturities. Since initiation five months ago, the recommendation at the 30-year maturity is already up by almost 7 percent. Nevertheless, it has a lot further to go (Chart I-6). Investors could also play the component pairs: overweight U.S. T-bonds versus German bunds; and overweight Italian BTPs versus Spanish Bonos (Chart I-7 and Chart I-8), but the combined two bonds versus two bonds recommendation has better return to risk characteristics. Chart I-6Expect High Yielding Bonds To Outperform Low Yielding Bonds
Expect High Yielding Bonds To Outperform Low Yielding Bonds
Expect High Yielding Bonds To Outperform Low Yielding Bonds
Chart I-7Expect Yield Spread Convergence At 10-Year Maturities...
Expect Yield Spread COnvergence At 10-Year Maturities...
Expect Yield Spread COnvergence At 10-Year Maturities...
Chart I-8...And At 30-Year ##br##Maturities
...And At 30-Year Maturities
...And At 30-Year Maturities
Switch Into The Swedish Krona Bond yield spreads are also an important driver of currency moves. The currency corollary of overweighting high yielding versus low yielding bonds is to tilt towards low yielding currencies, because these are the currencies that have the most scope for substantial upside. Our favourite low yielding currency has been the Japanese yen, and this has worked very well. Since early 2018, the yen has been the strongest major currency, and is up 16 percent versus the euro. But our favourite currency is now changing to the Swedish krona, for three reasons: The SEK is depressed from a valuation perspective. For example, it is the only major currencies that is weaker than the GBP compared to before the Brexit vote in 2016 (Chart I-9). Chart I-9The Swedish Krona Has Underperformed The Pound Despite Brexit
The Swedish Krona Has Underperformed The Pound Despite Brexit
The Swedish Krona Has Underperformed The Pound Despite Brexit
Unlike other major central banks, the Riksbank is seeking to normalise the policy rate upwards. The SEK is technically oversold on its 130-day fractal dimension, signalling over-pessimism in the price (Chart I-10), while the JPY is showing the opposite tendency. Chart I-10The Swedish Krona Is Due A Countertrend Move
The Swedish Krona Is Due A Countertrend Move
The Swedish Krona Is Due A Countertrend Move
Bottom Line: switch Japanese yen long exposure into Swedish krona long exposure. Fractal Trading System* (Chart 1-11) As just discussed, this week's recommended trade is long SEK/JPY. Set the profit target at 1.5 percent with a symmetrical stop-loss. In other trades, long NZD/JPY has started off very well and long Spain versus Belgium achieved its 3.5 percent profit target, at which it was closed, leaving five open positions. For any investment, excessive trend following and groupthink can reach a natural point of instability, at which point the established trend is highly likely to break down with or without an external catalyst. An early warning sign is the investment’s fractal dimension approaching its natural lower bound. Encouragingly, this trigger has consistently identified countertrend moves of various magnitudes across all asset classes. Chart I-11
NZD VS. JPY
NZD VS. JPY
The post-June 9, 2016 fractal trading model rules are: When the fractal dimension approaches the lower limit after an investment has been in an established trend it is a potential trigger for a liquidity-triggered trend reversal. Therefore, open a countertrend position. The profit target is a one-third reversal of the preceding 13-week move. Apply a symmetrical stop-loss. Close the position at the profit target or stop-loss. Otherwise close the position after 13 weeks. Use the position size multiple to control risk. The position size will be smaller for more risky positions. For more details please see the European Investment Strategy Special Report “Fractals, Liquidity & A Trading Model,” dated December 11, 2014, available at eis.bcaresearch.com. Dhaval Joshi Chief European Investment Strategist dhaval@bcaresearch.com Footnotes 1 The cost of holding physical cash is the cost of its safe storage. 2 Please see the European Investment Strategy Weekly Report ‘Growth To Rebound In The Fourth Quarter, But Fade In 2020’, October 3, 2019 available at eis.bcaresearch.com. Fractal Trading Model Cyclical Recommendations Structural Recommendations Fractal Trades
The ‘Widow Maker’ Trade: Can It Finally Work?
The ‘Widow Maker’ Trade: Can It Finally Work?
The ‘Widow Maker’ Trade: Can It Finally Work?
The ‘Widow Maker’ Trade: Can It Finally Work?
The ‘Widow Maker’ Trade: Can It Finally Work?
The ‘Widow Maker’ Trade: Can It Finally Work?
The ‘Widow Maker’ Trade: Can It Finally Work?
The ‘Widow Maker’ Trade: Can It Finally Work?
Trades Closed Trades Asset Performance Currency & Bond Equity Sector Country Equity Indicators Bond Yields Chart II-1Indicators To Watch - Bond Yields
Indicators To Watch - Bond Yields
Indicators To Watch - Bond Yields
Chart II-2Indicators To Watch - Bond Yields
Indicators To Watch - Bond Yields
Indicators To Watch - Bond Yields
Chart II-3Indicators To Watch - Bond Yields
Indicators To Watch - Bond Yields
Indicators To Watch - Bond Yields
Chart II-4Indicators To Watch - Bond Yields
Indicators To Watch - Bond Yields
Indicators To Watch - Bond Yields
Interest Rate Chart II-5Indicators To Watch - Interest Rate Expectations
Indicators To Watch - Interest Rate Expectations
Indicators To Watch - Interest Rate Expectations
Chart II-6Indicators To Watch - Interest Rate Expectations
Indicators To Watch - Interest Rate Expectations
Indicators To Watch - Interest Rate Expectations
Chart II-7Indicators To Watch - Interest Rate Expectations
Indicators To Watch - Interest Rate Expectations
Indicators To Watch - Interest Rate Expectations
Chart II-8Indicators To Watch - Interest Rate Expectations
Indicators To Watch - Interest Rate Expectations
Indicators To Watch - Interest Rate Expectations
Highlights Shifting Trends: The factors that have driven bond yields lower throughout 2019 – slowing growth, rising uncertainty, demand for safe assets and dovish monetary policy expectations – have all started to turn in a more bond-bearish direction. Duration & Country Allocation Strategy: Maintain a moderate below-benchmark stance on aggregate bond portfolio duration. Favor lower-beta countries with central banks that are more likely to stay relatively dovish as global yields drift higher, like core Europe, Australia and Japan. Credit Allocation Strategy: Stay overweight corporate bonds versus government debt in the U.S. and Europe, both for investment grade and high-yield. Maintain just a neutral stance on EM USD-denominated spread product, but look to upgrade if global growth improves further and the USD begins to weaken. Feature Chart of the WeekBond Yields Sniffing A Turn In Global Growth?
Bond Yields Sniffing A Turn In Global Growth?
Bond Yields Sniffing A Turn In Global Growth?
It has been fifty days (and counting) since the 2019 low for the benchmark 10-year U.S. Treasury yield was reached on September 3. The year-to-date low for the benchmark 10-year German bund yield was seen six days before that on August 28. Yields have risen by a healthy amount since those dates, up +34bps and +37bps for the 10yr Treasury and Bund, respectively. This has occurred despite the significant degree of bond-bullish pessimism on global growth and inflation that can be found in financial media reporting and investor surveys. The fact that yields are now steadily moving away from the lows suggests that the 2019 narrative for financial markets – slowing global growth, triggered by political uncertainty and the lagged impact of previous Fed monetary tightening and China credit tightening, forcing central banks to turn increasingly more dovish – is no longer correct. If that is true, yields have more near-term upside as overbought government bond markets begin to “sniff out” a bottoming out of global growth momentum (Chart of the Week). In this Weekly Report, we take a look at the changing state of the factors that fueled the sharp decline in bond yields in 2019. We follow that up with a review of all our current recommended investment positions on duration, country allocation and spread product allocations in light of recent developments. We conclude that maintaining a below-benchmark duration exposure, while favoring lower-beta countries in sovereign debt and overweighting corporate debt in the U.S. and Europe, is the most appropriate fixed income strategy for the next 6-12 months. The timing of the bottoming of yields in the major developed markets (DM) should not be surprising, given the more bond-bearish turn of reliable leading directional yield indicators. Yields Are Rising At The Right Time, For The Right Reasons Chart 2Bond-Bullish Growth & Inflation Factors Are Turning
Bond-Bullish Growth & Inflation Factors Are Turning
Bond-Bullish Growth & Inflation Factors Are Turning
The timing of the bottoming of yields in the major developed markets (DM) should not be surprising, given the more bond-bearish turn of reliable leading directional yield indicators. The diffusion index of our global leading economic indicator (LEI), which leads the real (ex-inflation expectations) component of DM bond yields by twelve months, is at an elevated level (Chart 2). At the same time, the slowing of the annual rate of growth in the trade-weighted U.S. dollar, which leads 10-year DM CPI swap rates by around six months, is signaling that bond yields have room to increase from the inflation expectations side. Finally, the rising trend of positive data surprises for the major DM countries is also pointing to higher yields. Breaking it down at the country level, the pickup in DM 10-year bond yields since the 2019 lows has been widespread (Charts 3 & 4). The range of yield increases is as low as +16bps in Japan, where the Bank of Japan (BoJ) is pursuing a yield target, to +46bps in Canada where the economy and inflation are both accelerating. Chart 3Pricing Out Some Expected Rate Cuts …
Pricing Out Some Expected Rate Cuts ...
Pricing Out Some Expected Rate Cuts ...
Chart 4… Across All Developed Markets
... Across All Developed Markets
... Across All Developed Markets
The increase in yields has also occurred alongside reduced expectations for easier monetary policy. Our 12-month discounters, which measure the expected change in short-term interest rates priced into Overnight Index Swap (OIS) curves, show that markets have partially priced out some (but not all) expected rate cuts in all major DM countries. The Three Things That Have Changed For Global Bond Markets So what has changed to trigger a reduction in rate cut expectations and an increase in global yields? The bond-bullish narrative that we refer to in the title of this report can be broken down into the following three elements, which have all turned recently: Slowing global growth (now potentially bottoming) Chart 5Global Growth Bottoming Out
Global Growth Bottoming Out
Global Growth Bottoming Out
Current global growth is still trending lower, when looking at measures like manufacturing PMIs or sentiment surveys like the global ZEW index. Forward-looking measures like our global LEI, however, have been moving higher in recent months, suggesting that a bottom in the PMIs may soon unfold (Chart 5). We investigated that improvement in our global LEI in a recent report and concluded that the move higher was focused almost exclusively within the emerging market (EM) sub-components that are most sensitive to improving global growth.1 This fits with the improvement shown in the OECD LEI for China, a bottoming of the annual growth rate of world exports, and the general acceleration of global equity markets – the classic leading economic indicator. Rising political uncertainty (now potentially fading) The U.S.-China trade war (including the implications for the upcoming 2020 U.S. presidential election) and the U.K. Brexit saga have been the main sources of bond-bullish political uncertainty over the past several months. Yet recent developments have helped reduce the odds of the most negative tail risk outcomes, providing a bit of a boost to global bond yields. The U.S. and China have agreed (in principle) to a “phase one” trade deal that, at a minimum, lowers the chances of a further escalation of the trade dispute through higher tariffs. Meanwhile, the momentum has shifted towards a potential final Brexit agreement between the U.K. and European Union that can avoid an ugly no-deal outcome. Our colleagues at BCA Research Geopolitical Strategy believe that developments are likely to continue moving away from the worst-case scenarios, given the constraints faced by policymakers.2 U.S. President Donald Trump is now in full campaign mode for the 2020 elections and needs a deal (of any kind) to deflect criticism that his trade battle with China is dragging the U.S. economy into recession. Already, there has been a sharp decline in income growth for workers in swing states that could vote for either party’s candidate in next year’s election (Chart 6). Trump cannot afford to lose voters in those states, many of which are in the U.S. industrial heartland (i.e. Ohio, Michigan) that helped put him in the White House. In other words, he is highly incentivized to turn down the heat on the trade war or else face a potential loss next November. While these political uncertainties have not been fully resolved by these latest developments, the shift in momentum away from worst-case scenarios has likely been enough to reduce the safe-haven bid for DM government bonds, helping push yields higher. Meanwhile, China is facing a slowing economy and rising unemployment, but with reduced means to fight the downtrend given high private sector debt that has impaired the typical response between easier monetary conditions and economic activity (Chart 7). While the Chinese government does not want to be seen as caving in to U.S. pressure on trade policy, its desire to maintain social stability by preventing a further rise in unemployment from the trade war provides a powerful incentive to try and ratchet down tensions with the U.S. Chart 6Political Reasons For Trump To Retreat On Trade
Political Reasons For Trump To Retreat On Trade
Political Reasons For Trump To Retreat On Trade
In the U.K., a no-deal Brexit is an economically painful and politically unpopular outcome that would severely damage the re-election chances of Prime Minister Boris Johnson and his Conservative party. Thus, even a hard-line Brexiteer like Johnson must respond to the political constraints forcing him to try and get a Brexit deal done (Chart 8). Chart 7Economic Reasons For China To Retreat On Trade
Economic Reasons For China To Retreat On Trade
Economic Reasons For China To Retreat On Trade
Chart 8Political Reasons To Retreat On A No-Deal Brexit
Political Reasons To Retreat On A No-Deal Brexit
Political Reasons To Retreat On A No-Deal Brexit
While these political uncertainties have not been fully resolved by these latest developments, the shift in momentum away from worst-case scenarios has likely been enough to reduce the safe-haven bid for DM government bonds, helping push yields higher. Bull-flattening pressure on yield curves (now turning into moderate bear-steepening) The final leg down in bond yields in August had a technical aspect to it, fueled by the demand for duration and convexity from asset-liability managers like European pension funds and insurance companies. Falling yields act to raise the value of liabilities for that group of investors, forcing them to rapidly increase the duration of their assets to match the duration of their liabilities (the technique used to limit the gap between the value of assets and liabilities). That duration increase is carried out by buying government bonds with longer maturities (and higher convexity), but also through the use of interest rate derivatives like long maturity swaps and swaptions. The end result is a bull flattening of yield curves (both for government bonds and swaps) and a rise in swaption volatility (i.e. the price of swaptions). Those dynamics were clearly in play in August after the shocking imposition of fresh U.S. tariffs on Chinese imports early in the month. Bond and swaption volatilities spiked, and bond/swap yield curves bull-flattened, in both Europe and the U.S. (Chart 9). That effect only lasted a few weeks, however, and volatilities have since declined and curves have steepened. This suggests that the “convexity-buying” effect has run its course and is now starting to work in the opposite direction, with asset-liability managers looking to reduce the duration of their assets as higher yields lower the value of their liabilities. This is putting some upward pressure on longer-maturity global bond yields. Chart 9Signs Of Reduced Convexity-Related Bond Buying
Signs Of Reduced Convexity-Related Bond Buying
Signs Of Reduced Convexity-Related Bond Buying
Chart 10Bull-Flattening Yield Curve Pressures Easing Up A Bit
Bull-Flattening Yield Curve Pressures Easing Up A Bit
Bull-Flattening Yield Curve Pressures Easing Up A Bit
Chart 11Fed & ECB Actions Should Help Steepen Up Curves
Fed & ECB Actions Should Help Steepen Up Curves
Fed & ECB Actions Should Help Steepen Up Curves
The steepening seen so far must be put in context, however, as yield curves remain very flat across the DM world (Chart 10). Term premia on longer-term bonds remain very depressed, although those should start to increase as global growth stabilizes and the massive safe-haven demand for global government debt begins to dissipate. Some pickup in inflation expectations would also help impart additional bear-steepening momentum to yield curves – a more likely result now that the Fed and ECB have both cut interest rates and, more importantly, will start provide additional monetary easing by expanding their balance sheets (Chart 11). Bottom Line: The factors that have driven bond yields lower throughout 2019 – slowing growth, rising uncertainty, demand for safe assets and dovish monetary policy expectations – have all started to turn in a more bond-bearish direction. Reviewing Our Recommended Bond Allocations In light of these shifting global trends described above, the fixed income investment implications are fairly straightforward: Yields are rising around the world, suggesting that the current move is a shift higher driven by non-country-specific factors like more stable future global growth prospects. Duration: A moderate below-benchmark overall duration stance is warranted for global fixed income portfolios, with yields likely to continue drifting higher over at least the next six months. A big surge in yields is unlikely, as central banks will need to see decisive evidence that global growth is not only bottoming, but accelerating, before shifting away from the current dovish bias. Given the reporting lags in the economic data, such evidence is unlikely to appear until the first quarter of 2020 at the earliest. Yet given how flat yield curves are across the DM government bond markets, the trajectory of forward rates is quite stable relative to spot yield levels, making it much easier to beat the forwards by positioning for even a modest yield increase. Country Allocation: Yields are rising around the world, suggesting that the current move is a shift higher driven by non-country-specific factors like more stable future global growth prospects. In that case, using yield betas to the “global” bond yield is a good way to consider country allocation decisions within a fixed income portfolio. We looked at those yield betas in an August report, using Bloomberg Barclays government bond index data for the 7-10 year maturity buckets of individual countries and the Global Treasury aggregate (Chart 12).3 The rolling 3-year betas were highest in the U.S. and Canada, making them good countries to underweight within a global government bond portfolio in a rising yield environment. The yield betas were lowest in Japan, Germany and Australia, making them good overweight candidates. The U.K. was a unique case of having a relatively high historical yield beta prior to the 2016 Brexit referendum and a lower yield beta since then - making the U.K. allocation highly conditional on the resolution of the Brexit uncertainty. Spread Product Allocation: The backdrop described in this report, where global growth is bottoming out but where central banks maintain a dovish bias, is a perfect sweet spot for global spread product like corporate bonds and Peripheral European government debt. Thus, an overweight stance on overall global spread product versus governments is warranted. The backdrop described in this report, where global growth is bottoming out but where central banks maintain a dovish bias, is a perfect sweet spot for global spread product like corporate bonds and Peripheral European government debt. With regards to our current strategic fixed income recommendations and model bond portfolio allocations, we already have much of the positioning described above in place. We are below-benchmark on overall duration, underweight higher-beta U.S. Treasuries; overweight government bonds in lower-beta Germany, France, Japan and Australia (Chart 13); overweight investment grade corporate bonds in the U.S., euro area and U.K.; and overweight high-yield corporate bonds in the U.S. and euro area. Chart 12Favor Lower-Beta Government Bond Markets
Favor Lower-Beta Government Bond Markets
Favor Lower-Beta Government Bond Markets
There are areas where our positioning could change, however. Chart 13Lower-Beta Laggards Should Start To Outperform
Lower-Beta Laggards Should Start To Outperform
Lower-Beta Laggards Should Start To Outperform
In terms of government bonds, we are currently overweight the U.K. and neutral Canada. A final Brexit deal would justify a downgrade of Gilts to at least neutral, if not underweight, as the Bank of England has signaled that rate hikes would be justified if the Brexit uncertainty was resolved. A downgrade of higher-beta Canadian government debt to underweight could also be justified, although the Bank of Canada is not signaling that a change in monetary policy (in either direction) is warranted. For now, we will hold off on any change to our U.K. stance, as it is now likely that there will be another extension of the Brexit deadline beyond October 31. As for Canada, we remain neutral for now but will revisit that stance in an upcoming Weekly Report. With regards to spread product, we are only neutral EM USD-denominated sovereign and corporate debt, as well as Spanish sovereign bonds; and underweight Italian government debt. An EM upgrade to overweight would require two things that are not yet in place: a weaker U.S. dollar and accelerating Chinese economic growth. Chart 14Stay Overweight Corporates In The U.S. & Europe
Stay Overweight Corporates In The U.S. & Europe
Stay Overweight Corporates In The U.S. & Europe
As for Peripheral governments, we have preferred to be overweight European corporate debt relative to sovereign bonds in Italy and Spain. The recent powerful rally in the Periphery, however, has driven the spreads over German bunds in those countries down to levels in line with corporate credit spreads (Chart 14). We will maintain these allocations for now, but will investigate the relative value proposition between euro area Peripheral sovereigns and corporates in an upcoming report. Bottom Line: Maintain a moderate below-benchmark stance on aggregate bond portfolio duration. Favor lower-beta countries with central banks that are more likely to stay relatively dovish as global yields drift higher, like core Europe, Australia and Japan. Stay overweight corporate bonds versus government debt in the U.S. and Europe, both for investment grade and high-yield. Maintain just a neutral stance on EM USD-denominated spread product, but look to upgrade if global growth improves further and the USD begins to weaken. Robert Robis, CFA Chief Fixed Income Strategist rrobis@bcaresearch.com Footnotes 1 Please see BCA Research Global Fixed Income Strategy Weekly Report, “What Is Driving The Improvement In The BCA Global Leading Economic Indicator?”, dated October 2, 2019, available at gfis.bcaresearch.com. 2 Please see BCA Research Geopolitical Strategy Weekly Report, “Five Constraints For The Fourth Quarter”, dated October 11, 2019, available at gps.bcaresearch.com. 3 Please see BCA Research U.S. Bond Strategy/Global Fixed Income Strategy Weekly Report, “Where’s The Positive Carry In Bond Markets?", dated August 20, 2019, available at usbs.bcaresearch.com and gfis.bcaresearch.com. Recommendations The GFIS Recommended Portfolio Vs. The Custom Benchmark Index
Cracks Are Forming In The Bond-Bullish Narrative
Cracks Are Forming In The Bond-Bullish Narrative
Duration Regional Allocation Spread Product Tactical Trades Yields & Returns Global Bond Yields Historical Returns