Fixed Income
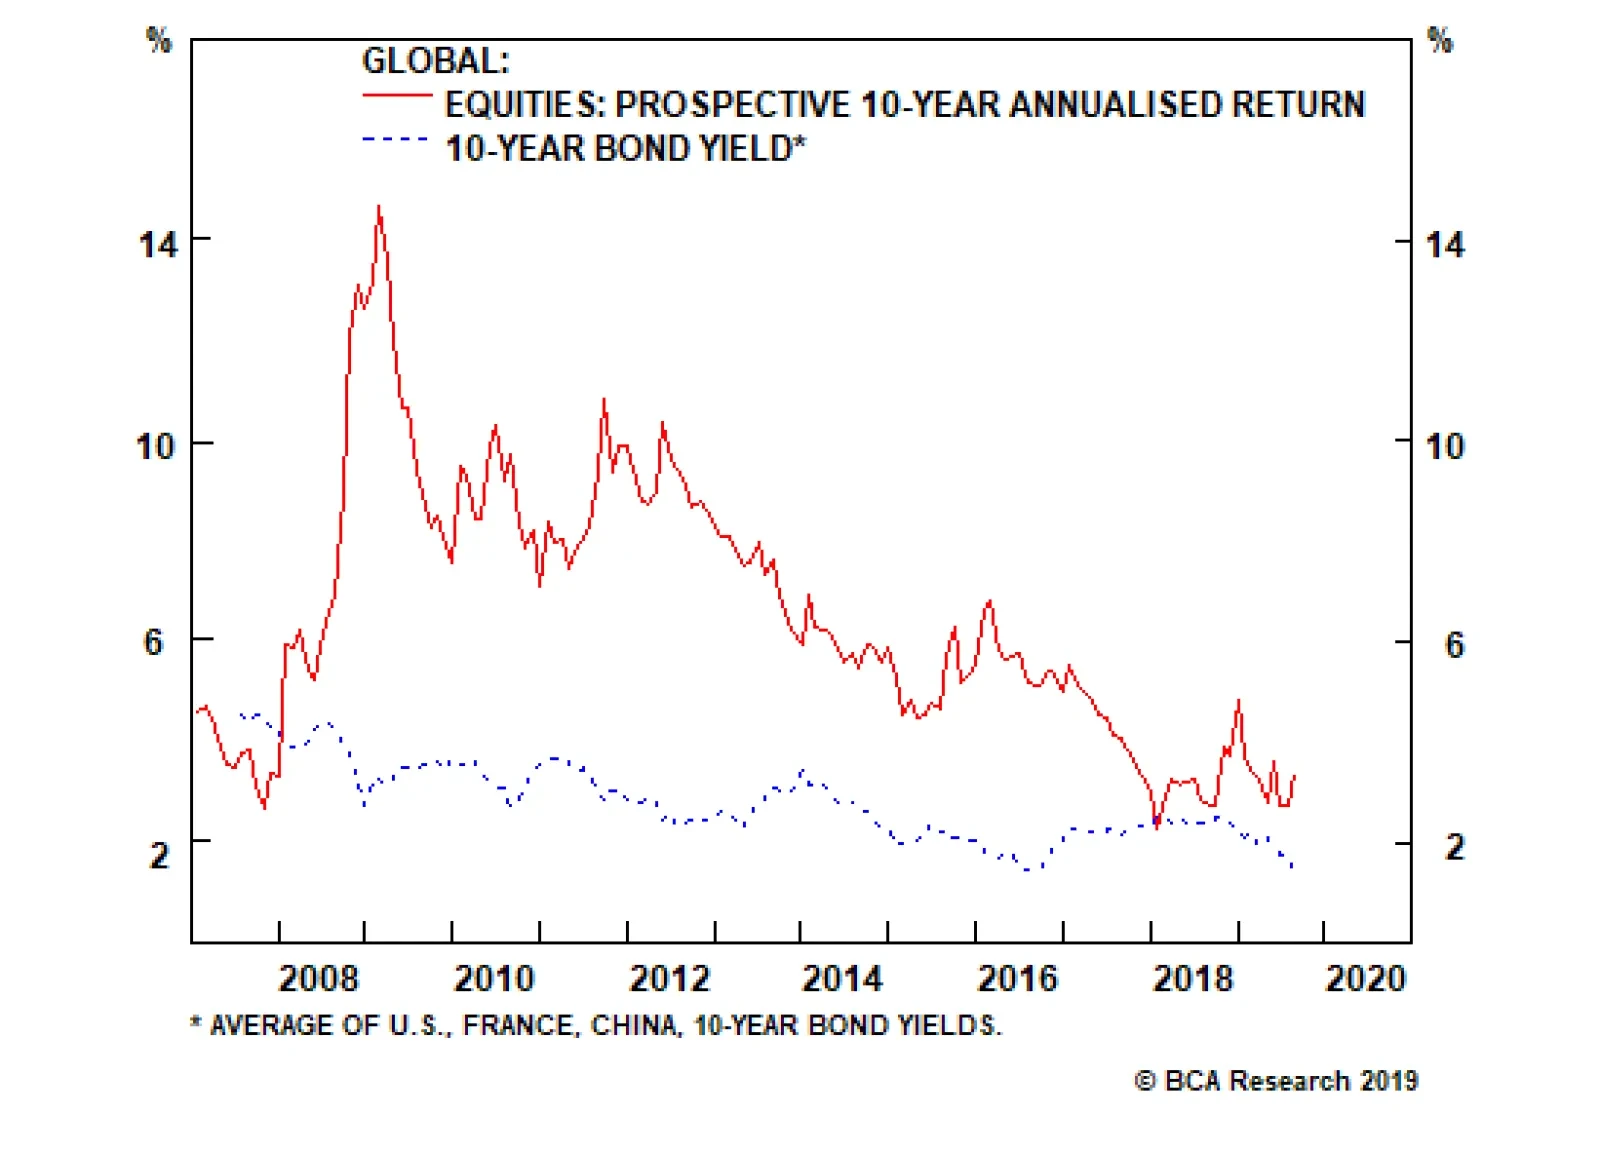
According to our European Investment Strategy team, the prospective 10-year return from equities is an annualized 3 percent, 1.6 percent more than that from bonds. Is the equity risk premium large enough? Yes, because at ultra-low bond yields, the risk of…

Highlights Sovereign bond yields have cratered over the last few months, … : Over the last three months, 10-year yields in the U.S., France, Germany, Switzerland and Australia have fallen by 71, 64, 53, 54, and 67 basis points, respectively. … and the Treasury curve has experienced a significant bull flattening, … : Month-to-date total returns for the Barclays Bloomberg Long, Intermediate and 1-3-Year Treasury Indexes are 9.2%, 1.6% and 1.1%, respectively. … indicating that the bond market thinks more rate cuts are in store: The textbook interpretation of an inverted curve is that monetary policy is too tight and needs to be loosened, but technical factors have amplified the flattening pressure. Is the bond market reacting to weakening growth prospects, or uber-dovish central banks?: The answer has implications well beyond the fixed-income universe. It could mean the difference between an economic slowdown and a market melt-up. Feature BCA researchers convened last week for our monthly View Meeting, much of which was given over to the global decline in sovereign bond yields. Does their plunge owe more to weakening growth prospects or central banks’ synchronized dovish pivot? There have surely been elements of both; after all, central banks wouldn’t be so dovish if they weren’t concerned about the growth outlook. It is clear to our fixed-income strategists that the yield move has overshot the data, however, and they mainly attribute the overshoot to monetary policy. No central bank wants a stronger currency while confronting a demand deficiency aggravated by trade tensions and a global manufacturing slowdown. The New York Times Business section put the prevailing policy winds into living color in a nearly full-page, four-column graphic spotlighting the 32 central banks that have cut their policy rate so far this year.1 The pell-mell rush to cut rates is emblematic of a global scramble for competitiveness. No central bank wants its economy to be caught without a buffer while other economies are busily reinforcing theirs. The Message From The Bond Market Trade tensions are a legitimate threat to global economic growth already challenged by a downswing in the global manufacturing cycle. A recession is a possibility, but it is hardly a foregone conclusion. We agree with our fixed-income colleagues that the yield selloff has overrun the economic fundamentals. Last week’s preliminary European manufacturing PMIs suggested that manufacturing may finally be stabilizing, and there is still no evidence that the manufacturing downturn has infected the services sector (Chart 1). A recession is hardly a foregone conclusion. 10-year Treasury yields have been falling sharply since their 3.25% peak in early November, and the current leg down is the third in a series of sharp declines (Chart 2, top panel). Global sovereign yields have followed the same pattern (Chart 2, bottom panel), but the latest plunge is as much a reflection of ubiquitous easing biases as it is of new concerns about economic weakness. That may sound like a minor point, of interest only to macro specialists, but it has import for all investors. If the yield decline isn’t signaling new softness, then easier financial conditions will be free to act as a tailwind for risk assets. Chart 1Services Are Holding Up ...
Services Are Holding Up ...
Services Are Holding Up ...
Chart 2A Brief Inversion ... But Yields Are Freefalling
A Brief Inversion ... But Yields Are Freefalling
A Brief Inversion ... But Yields Are Freefalling
Neither investment-grade (Chart 3, top panel) nor high-yield corporate bond spreads evince any particular concern about the economy (Chart 3, bottom panel). Although they’ve ticked up, they remain near the bottom of their post-crisis range, and are nowhere near the levels they reached in 2011-12, during the federal budget showdown/U.S. downgrade and the flare-up of the Eurozone crisis, or in 2015-16, during the last manufacturing recession. With banks still easing lending standards for corporate and industrial borrowers (Chart 4), spreads won’t undergo a systematic widening. Borrowers do not default as long as there is a lender willing to roll over their maturing obligations, so tighter credit standards are a precondition for spread-widening cycles. Chart 3No Sign Of Stress Among Corporate Borrowers ...
No Sign Of Stress Among Corporate Borrowers ...
No Sign Of Stress Among Corporate Borrowers ...
Chart 4... And Banks Aren't Applying Any Pressure
... And Banks Aren't Applying Any Pressure
... And Banks Aren't Applying Any Pressure
The Message From The Housing Market Chart 5Lower Rates Have Yet To Impact Housing ...
Lower Rates Have Yet To Impact Housing ...
Lower Rates Have Yet To Impact Housing ...
We have been disappointed by residential investment’s muted response to the significant year-to-date decline in mortgage rates (Chart 5, bottom panel). The trajectory of starts and permits (Chart 5, top panel) hasn’t changed, new and existing home sales haven’t perked up (Chart 5, second panel), and mortgage purchase applications (Chart 5, third panel) appear not to have heard the news that rates are much lower. We thought that the swift fall in mortgage rates would promote more residential investment than it has to date. There is a difference, however, between disappointing growth and a full-on contraction. With affordability remaining high relative to history (Chart 6), and apartment rents exceeding monthly mortgage payments in several locales (Chart 7), housing demand should remain well supported. There are no excesses in the housing market in terms of inventory or oncoming supply that would make housing a source of economic or financial instability. Inventory relative to the number of households is bumping around its all-time lows (Chart 8), and cumulative household formations have easily outstripped housing starts since the crisis broke (Chart 9). Structural factors like a lack of supply geared to first-time and first-move-up buyers, and the ravenous appetite of pools of capital purchasing single-family homes for rent, are squeezing out some would-be buyers, but housing is not about to induce a recession. There are plenty of things for investors to be concerned about, but the housing market isn’t one of them. Chart 6... Though They Have Placed Homeownership In Easier Reach
... Though They Have Placed Homeownership In Easier Reach
... Though They Have Placed Homeownership In Easier Reach
Chart 7
Chart 8... Inventories Are At Record Lows, ...
... Inventories Are At Record Lows, ...
... Inventories Are At Record Lows, ...
Chart 9
The View From Broad And Wall We concede that stocks are not behaving as if all is well. Big daily swings are not a feature of healthy markets, and eight of this month’s sixteen sessions have registered moves of at least 1%. The second quarter’s 3% year-over-year earnings growth is three percentage points better than the consensus expected when earnings season kicked off, however, and despite the single-day moves, the S&P 500 has spent all but the first day of the month in a well-defined range between 2,825 and 2,945 (Chart 10). The market may be jumpy from one day to the next, but investors have not been concerned enough to engage in sustained selling.
Chart 10
The equity market’s verdict on housing is more optimistic than ours. Inspired by earnings reports, the S&P 1500 Homebuilders Index have broken out to a new 52-week high (Chart 11). Retailers were the stars of last week’s earnings releases, with Lowe’s, Nordstrom and Target posting double-digit percentage gains after reporting numbers that failed to live up to investors’ worst fears. Equities are validating the view that the U.S. consumer is alive and kicking. Chart 11Homebuilder Stocks Have Broken Out
Homebuilder Stocks Have Broken Out
Homebuilder Stocks Have Broken Out
The GDP Outlook Chart 12Capex Intentions: Elevated But Slipping
Capex Intentions: Elevated But Slipping
Capex Intentions: Elevated But Slipping
If consumers are well positioned, the U.S. economy should be, too. Consumption accounts for two-thirds of the U.S. economy, with investment and government spending equally dividing the other third. Federal expenditures amount to about 40% of government spending, and between this year’s fiscal thrust and next year’s hotly contested presidential election, D.C. can be counted upon to do its part for the economy. At the state and local level, healthy household income should support state sales and income tax receipts, while still-rising home prices will provide the property taxes to keep municipal coffers full. That leaves fixed asset investment as the economy’s Achilles heel. We are confident, as noted above, that residential investment will not decline enough to pose a problem for the economy, but corporate investment is in the crosshairs of the uncertainty surrounding the multiple trade squabbles. The NFIB survey and the regional Fed surveys indicate that capital expenditure plans are rolling over, even if they remain at a fairly high level (Chart 12). Our base case remains that investment will not fall enough to offset robust consumption and trend-level government spending, but a marked worsening in trade tensions could erode business confidence enough to drag the economy below stall speed. Busted Thesis In our mutual-fund days, we followed one rule without exception. If our thesis for owning a stock was disproved, we got rid of the stock without a backward glance. We no longer manage money, but our clients do, and we try to set a good example, especially in the inevitable instances when things go wrong. We are closing out our agency mREIT recommendation on the ground that we got the rates call underpinning it very wrong. Things went wrong with our agency mortgage REIT recommendation right from the get-go. In retrospect, we should have waited until the FOMC meeting dust settled before putting on a curve-dependent position. We are closing it out now, though, because we recommended the group in anticipation of a steeper yield curve. Given that we think it will take some time for investors to become convinced that a recession is not imminent, and given that mechanical factors may push yields even lower, we do not expect sustained curve steepening for several months. Although we only held it for four weeks, the recommendation left a mark. Through Thursday’s close, our defined subset of agency mREITs lost 11%, while the S&P 500 is down 3.1% and the Barclays High Yield Index is flat. We’re taking our medicine and moving on, but we will take another look at the group when the curve eventually does begin to steepen. Investment Implications Even if recession fears are overblown, as we and a majority of our colleagues believe, it will likely take some time for investors to overcome their concerns. That leads us to believe that equities may be unable to make new highs in the near term, and that Treasury yields have more downside risk than upside risk in the next few months, as rising convexity2 compels investors following asset-liability management strategies to seek out long-maturity bonds. The yield point may sound complex and esoteric, but our Global Fixed Income Strategy team increasingly believes it’s a key to understanding the negative-yield phenomenon and is researching the issue for an upcoming Special Report. Monetary accommodation is not a silver bullet. If the economy has already flipped from expansion to contraction, modest rate cuts parceled out at a deliberate pace will be insufficient to turn things around, and equities and spread product will suffer. If the expansion remains intact, however, rate cuts will help shore up the economy at the margin and quite possibly fuel a new phase of the bull markets in risk assets. Our money is on the latter, and we expect that this bull cycle has one more burst in it that will allow it to sprint to the finish line like the majority of its predecessors. Doug Peta, CFA Chief U.S. Investment Strategist dougp@bcaresearch.com Footnotes 1 Smialek, Jeanna and Russell, Karl, “Rates Are Falling Again. That May Be Dangerous.” New York Times, August 17, 2019, p. B1. 2 Duration measures a bond’s sensitivity to changes in interest rates. Convexity measures duration’s sensitivity to changes in interest rates, which increases as rates fall. Investors like life insurers and pension funds, who match the duration of their investment portfolios with the duration of their liabilities, are forced to increase the duration of their bond holdings at an increasing rate as interest rates fall.
The latest plunge in EM currencies and the widening in EM credit spreads have occurred amid falling U.S. bond yields and a Fed easing. EM equities, credit markets and currencies are much more sensitive to the global business cycle than to U.S.…
With respect to ultra-low bond yield, investors and commentators generally subscribe to one of the following two arguments: Bond yields are reflective – i.e. they are indicative of an upcoming economic calamity and thereby signal a bearish outlook for…
Highlights Today’s equity risk premium of 1.6 percent makes equities the preferred long-term asset-class versus bonds at the current level of bond yields. The caveat is that this conclusion would quickly change if bond yields were to rise significantly. German equities are offering a more attractive risk premium of 3.7 percent versus German bunds. We closed our tactical short in equities at its 4 percent profit-target, and are now tactically neutral. Fractal analysis suggests that bonds are now technically overbought… …but developments in the coming weeks warrant a degree of caution. With trade tensions still simmering, the Italian government in chaos, the ECB likely to unveil new stimulus in September, and the no-deal Brexit deadline looming at the end of October, there is too much event risk to short bonds with high conviction right now. Feature Chart of the WeekStocks Set To Return 3 Percent, Bonds Set To Return 1.4 Percent
Stocks Set To Return 3 Percent, Bonds Set To Return 1.4 Percent
Stocks Set To Return 3 Percent, Bonds Set To Return 1.4 Percent
Bonds Set To Return 1.4 Percent This year’s rally in bonds has dragged down bond yields to unprecedented lows. Indeed, in many markets, the term ‘bond return’ should more truthfully be called ‘bond penalty’. For example, with the German 10-year bund now yielding -0.7 percent, buying and holding it for its ten year life will lose you 7 percent of your money.1 Or will it? Unlike in most jurisdictions where the currency cannot disintegrate, euro area bond yields are complicated by ‘redenomination’ discounts and premiums. If you were certain that the euro was going to break up within the next ten years, and that the German bund would pay you back in new deutschmarks worth 7 percent more than euros, then the currency redenomination gain would more than cancel out the cumulative loss from the negative yield. For this reason a better measure of the euro area bond yield comes from the single currency bloc’s average yield – because in a break up, the expected currency gains and losses for the average euro area bond yield must sum to zero. To avoid the onerous calculation of this euro area average yield, a useful proxy turns out to be the French OAT yield. While not as depressed as the German bund yield, the 10-year OAT yield, at -0.35 percent, still constitutes a bond penalty (Chart I-2). The global bond yield has reached a new record low. Meanwhile, although the global 10-year bond yield is still positive, it recently fell to an all-time low of 1.40 percent – breaking the previous record low of 1.43 percent set in the aftermath of the 2016 shock vote for Brexit (Chart I-3). Chart I-2The French OAT Is A Good Proxy For The Average Euro Area Bond
The French OAT Is A Good Proxy For The Average Euro Area Bond
The French OAT Is A Good Proxy For The Average Euro Area Bond
Chart I-3Bonds Set To Return##br## 1.4 Percent
Bonds Set To Return 1.4 Percent
Bonds Set To Return 1.4 Percent
Stocks Set To Return 3 Percent The long term prospective return from most asset-classes is well-defined: for the bond asset-class it is the yield to maturity, now at 1.4 percent;2 for the equity asset-class it comes from the starting valuation, which tends to be an excellent predictor of the long term prospective return. But which valuation metric? Equity valuations based on earnings are problematic – because valuations appear deceptively attractive when profit margins are structurally high, as they are now (Chart I-4). The problem is that earnings will face a structural headwind when margins normalise, depressing prospective returns. Some people suggest adjusting the earnings to derive a cyclically adjusted price to earnings multiple (CAPE), but by definition this only corrects for the cycle and does not correct for any structural trend. Chart I-4Structurally High Profit Margins Flatter Equity Earnings
Structurally High Profit Margins Flatter Equity Earnings
Structurally High Profit Margins Flatter Equity Earnings
Equity valuations based on assets are also problematic. Nowadays, such assets comprise intellectual capital or intangibles or ‘virtual’ assets, which are extremely difficult to quantify accurately. Hence, our preferred long-term valuation metric is price to sales – because sales are quantifiable, objective, and unambiguous. Indeed, the starting price to sales multiple of the global equity asset-class has been a near-perfect predictor of its prospective 10-year nominal return (Chart I-5). The method is to regress historic starting price to sales with (the known) prospective 10-year returns. Then apply the established relationship to the current price to sales to predict the (the unknown) prospective return. Chart I-5Stocks Set To Return 3 Percent
Stocks Set To Return 3 Percent
Stocks Set To Return 3 Percent
On this basis, today’s prospective 10-year annualised return from global equities is 3 percent. Is The 1.6 Percent Excess Return Enough? So the prospective 10-year return from equities, at an annualised 3 percent, is 1.6 percent more than that from bonds, at 1.4 percent.3 Is this excess return – the so-called ‘equity risk premium’ – enough (Chart of the Week)? Price to sales has been a near-perfect predictor of long term equity returns. Yes, because at ultra-low bond yields, the risk of owning bonds converges with the risk of owning equities. The asymmetry in the future direction of bond yields makes bonds riskier investments. The short-term potential for capital appreciation – nominal or real – diminishes, while the potential for vicious losses increases dramatically. The technical term for this unattractive asymmetry is negative skew. Recent breakthroughs in risk theory and behavioural economics conclude that our perception of an investment’s risk does not come from its volatility or correlation characteristics. It comes from the investment’s negative skew.
Chart I-6
The upshot is that today’s excess prospective return of 1.6 percent does make equities the preferred long-term asset-class at the current level of bond yields. The caveat is that this conclusion would quickly change if bond yields were to rise significantly (Chart I-6). Interestingly, German equities are an excellent long-term proxy for global equities, producing near-identical returns (Chart I-7). This is not surprising given the very similar international and sector focusses. We can infer that the German stock market, just like the global equity asset-class, is set to deliver an annualised 10-year return of 3 percent. But in Germany, the 10-year bond yield is -0.7 percent, implying that German equities are offering a more attractive risk premium of 3.7 percent versus German bunds. Chart I-7German Equities Are An Excellent Proxy For Global Equities
German Equities Are An Excellent Proxy For Global Equities
German Equities Are An Excellent Proxy For Global Equities
Some Other Asset Allocation Thoughts The rally in bonds has hurt our cyclical overweight to the DAX versus long-dated German bunds. However, given the aforementioned long-term analysis, we are sticking with it, albeit switching it from a cyclical to a structural recommendation. Our other recent asset allocation recommendations have worked. In May, we pointed out that the simultaneous strong rallies in equities, bonds, and oil was extremely rare, and that at least one of the rallies would soon break down. This is precisely what happened. While bonds rallied a further 5 percent, equities corrected by 5 percent, and the crude oil price plunged 20 percent. However, our portfolio construction could have been better as our weightings in the three assets left the combined short position roughly flat. The position is now closed. Our tactical short in equities achieved its 4 percent profit-target. Likewise in June, fractal analysis suggested that the double-digit rally in stock markets was vulnerable to a countertrend reversal. This is precisely what happened. Our tactical short position in the MSCI AC World Index achieved its 4 percent profit-target and is now closed (Chart I-8). Stay tactically neutral to equities. Chart I-8Stocks Were Overbought, And Reversed
Stocks Were Overbought, And Reversed
Stocks Were Overbought, And Reversed
Interestingly, the same fractal analysis is suggesting that it is the stellar rally in bonds that is now vulnerable to a countertrend reversal (Chart I-9), implying a tactical short position in bonds. Having said that, developments in the coming weeks warrant a degree of caution. With trade tensions still simmering, the Italian government in chaos, the ECB likely to unveil new stimulus in September, and the no-deal Brexit deadline looming at the end of October, there is too much event risk to short bonds with high conviction right now. Chart I-9Bonds Are Overbought
Bonds Are Overbought
Bonds Are Overbought
Fractal Trading System* This week we note that the sharp underperformance of Spain (IBEX 35) versus Belgium (BEL 20) is technically extended and susceptible to a liquidity-triggered reversal. Accordingly, the recommended trade is to go long Spain versus Belgium setting a profit-target of 3.5 percent with a symmetrical stop-loss. In the other trades, short MSCI All-Country World achieved its 4 percent profit-target and is now closed. For any investment, excessive trend following and groupthink can reach a natural point of instability, at which point the established trend is highly likely to break down with or without an external catalyst. An early warning sign is the investment’s fractal dimension approaching its natural lower bound. Encouragingly, this trigger has consistently identified countertrend moves of various magnitudes across all asset classes. Chart I-10
Spain VS. Belgium
Spain VS. Belgium
The post-June 9, 2016 fractal trading model rules are: When the fractal dimension approaches the lower limit after an investment has been in an established trend it is a potential trigger for a liquidity-triggered trend reversal. Therefore, open a countertrend position. The profit target is a one-third reversal of the preceding 13-week move. Apply a symmetrical stop-loss. Close the position at the profit target or stop-loss. Otherwise close the position after 13 weeks. Use the position size multiple to control risk. The position size will be smaller for more risky positions. * For more details please see the European Investment Strategy Special Report “Fractals, Liquidity & A Trading Model,” dated December 11, 2014, available at eis.bcaresearch.com. Dhaval Joshi, Chief European Investment Strategist dhaval@bcaresearch.com Footnotes 1 Assuming no default risk and no reinvestment risk. 2 Assuming no default risk and no reinvestment risk. 3 Nominal annualised total return, capital plus income. Fractal Trading System Cyclical Recommendations Structural Recommendations Closed Fractal Trades Closed Trades Asset Performance Currency & Bond Equity Sector Country Equity Indicators Bond Yields Chart II-1Indicators To Watch - Bond Yields
Indicators To Watch - Bond Yields
Indicators To Watch - Bond Yields
Chart II-2Indicators To Watch - Bond Yields
Indicators To Watch - Bond Yields
Indicators To Watch - Bond Yields
Chart II-3Indicators To Watch - Bond Yields
Indicators To Watch - Bond Yields
Indicators To Watch - Bond Yields
Chart II-4Indicators To Watch - Bond Yields
Indicators To Watch - Bond Yields
Indicators To Watch - Bond Yields
Interest Rate Chart II-5Indicators To Watch - Interest Rate Expectations
Indicators To Watch - Interest Rate Expectations
Indicators To Watch - Interest Rate Expectations
Chart II-6Indicators To Watch - Interest Rate Expectations
Indicators To Watch - Interest Rate Expectations
Indicators To Watch - Interest Rate Expectations
Chart II-7Indicators To Watch - Interest Rate Expectations
Indicators To Watch - Interest Rate Expectations
Indicators To Watch - Interest Rate Expectations
Chart II-8Indicators To Watch - Interest Rate Expectations
Indicators To Watch - Interest Rate Expectations
Indicators To Watch - Interest Rate Expectations
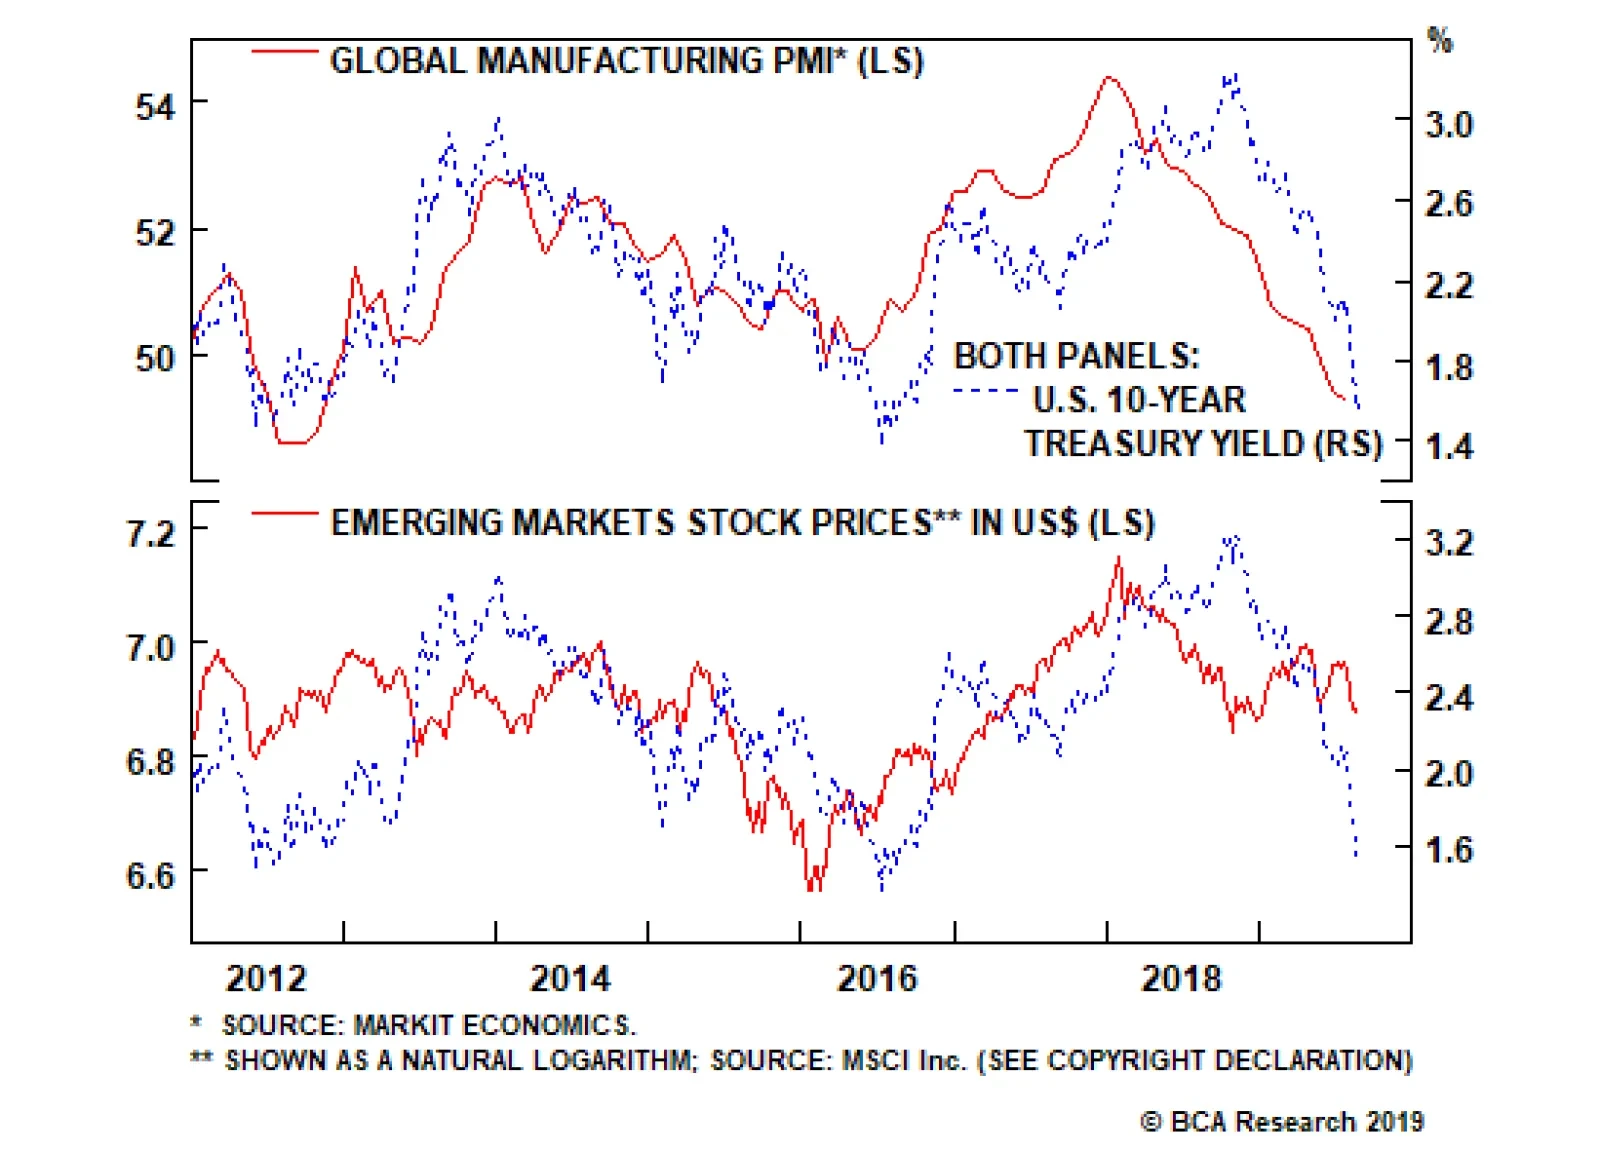
Analyses on the Philippines, Colombia and Argentina are available below. Highlights Global growth conditions, especially outside the U.S., remain bond friendly. Nevertheless, U.S. bonds are overbought and technical factors might exert upward pressure on them in the near term. Our ubiquitous premise remains that EM currencies and EM risk assets are primarily driven by cycles in global trade and the Chinese economy rather than U.S. growth and interest rates. There are no signs of investor capitulation that mark a major bottom in EM risk assets. Feature Given the recent plunge in bond yields around the world, we are devoting this week’s report to discussing the implications of low U.S. bond yields on EM risk assets. Our key takeaway is that lower U.S. bond yields are not a reason to be long EM risk assets and currencies. Low Bond Yields: Reflective Or Stimulative? With respect to ultra-low bond yield, investors and commentators generally subscribe to one of the following two arguments: Bond yields are reflective – i.e. they are indicative of an upcoming economic calamity and thereby signal a bearish outlook for equity and credit markets; The current low levels of bond yields signify a dovish monetary policy stance and hence are bullish for global risk assets. In our opinion, it is not a certainty that the bond market always has perfect foresight of the economic outlook. At the same time, falling global bond yields and easing central banks do not automatically ensure a pickup in global economic activity. Hence, low bond yields do not justify a bullish stance on global stocks and credit markets. Like any other financial market, bonds are driven by time-varying forces. In certain times, bond yields signal a correct trajectory for growth, inflation and monetary policy. At other times, bond prices are driven by investor sentiment and momentum-chasing trading strategies. In times where the latter is occurring, the bond market can send the wrong signal on growth and inflation, as well as misprice the future path of interest rates. U.S. bond yields are presently correct in signaling that global growth continues to decelerate. This is corroborated by many other indicators that we have been publishing. Presently, we have the following observations and reflections on U.S. bond yields: U.S. bond yields are presently correct in signaling that global growth continues to decelerate. This is corroborated by many other indicators that we have been publishing. However, this does not imply that U.S. bond yields will be a reliable leading indicator at the bottom of this business cycle. The basis is that U.S. bond yields did not lead at the top of the cycle. On the contrary, U.S. bond yields lagged the global business cycles by a considerable margin in both 2015-‘16 and in 2018-’19, when the growth slowdown emanated from China/EM. Chart I-1 illustrates that Chinese nominal manufacturing output and import volume growth rolled over in December 2017, yet U.S. bond yields rolled over in October 2018. In recent years, U.S. bond yields have also lagged the global manufacturing PMI index by about six to nine months (Chart I-2, top panel). Chart I-1China’s Business Cycle Led U.S. Bond Yields
China's Business Cycle Led U.S. Bond Yields
China's Business Cycle Led U.S. Bond Yields
Chart I-2Global Manufacturing And EM Stocks Led U.S. Bond Yields
Global Manufacturing And EM Stocks Led U.S. Bond Yields
Global Manufacturing And EM Stocks Led U.S. Bond Yields
Remarkably, EM financial markets have been leading U.S. bond yields in recent years, not the other way around (Chart I-2, bottom panel). For some time we have held the view that the ongoing growth slump in China would culminate into a global manufacturing and trade recession that would be negative for the rest of the world, especially for EM, Japan, commodities producers, and Germany. This theme has been the main reason for our negative view on global stocks, especially cyclicals, as well as our positive stance on safe-haven bonds and bullish view on the dollar. Understanding the origins of this global manufacturing and trade downtrend is critical to gauging the evolution of the business cycle. China is the epicenter of this global trade and manufacturing recession. In turn, the root cause of the mainland’s growth slump is money/credit tightening that has occurred in China in both 2017 and early 2018. Money and credit growth remain lackluster in the Middle Kingdom, despite ongoing fiscal and monetary policy easing (Chart I-3). Notably, domestic credit growth and its impulse have been muted, especially when issuance of government bonds is excluded (Chart I-4). The aggregate credit and fiscal stimulus have so far been insufficient to engineer a recovery. Chart I-3China: Fiscal Deficit And Broad Money Growth
bca.ems_wr_2019_08_22_s1_c3
bca.ems_wr_2019_08_22_s1_c3
Chart I-4China: Private Sector Credit Growth Is Weak
China: Private Sector Credit Growth Is Weak
China: Private Sector Credit Growth Is Weak
Federal Reserve’s policy tightening was not the reason behind the current worldwide manufacturing recession. U.S. domestic demand has not been the source of the ongoing global manufacturing and trade recession. U.S. final domestic demand was robust until Q4 2018 and has so far downshifted only modestly (Chart I-5, top panel). Corroborating this, U.S. manufacturing was the last shoe to drop in the global manufacturing recession (Chart I-5, bottom panel). Accordingly, the Federal Reserve’s policy tightening was not the reason behind the current worldwide manufacturing recession. It follows that lower U.S. interest rates might not be essential to instigate a global economic recovery. Critically, the latest plunge in EM currencies and widening in EM credit spreads has occurred amid falling U.S. bond yields and Fed easing. Chart I-5U.S. Economy And Bond Yields Have Lagged In This Cycle
U.S. Economy And Bond Yields Have Lagged In This Cycle
U.S. Economy And Bond Yields Have Lagged In This Cycle
Chart I-6U.S. Bond Yields And EM: No Stable Correlation
U.S. Bond Yields And EM: No Stable Correlation
U.S. Bond Yields And EM: No Stable Correlation
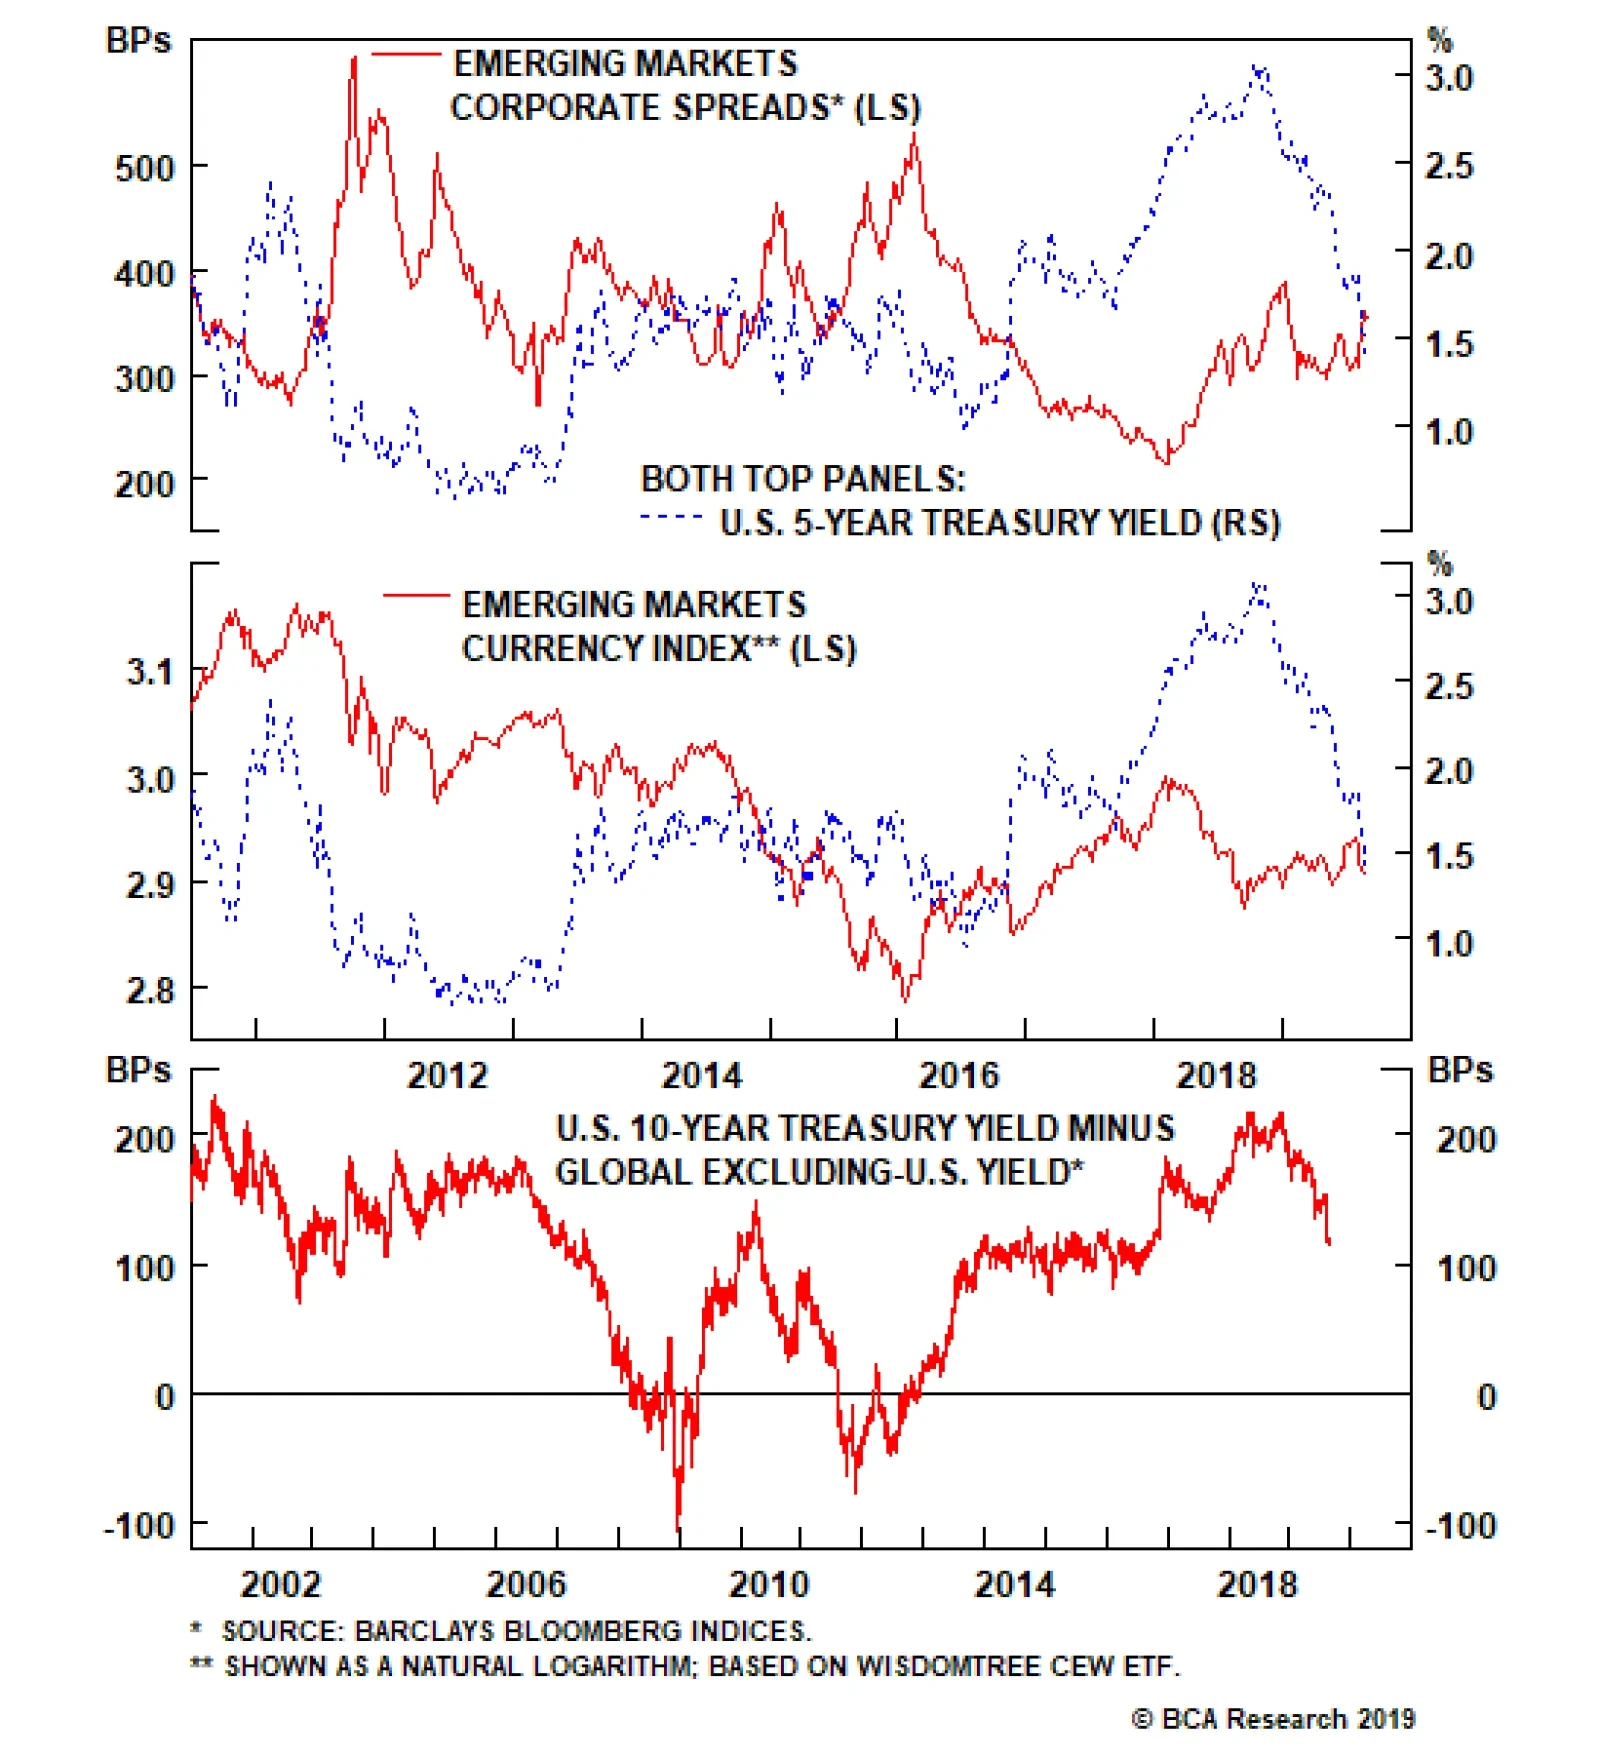
We have long argued against the consensus view that EM equities, credit markets and currencies are much more sensitive to U.S. interest rates than to the global business cycle. Chart I-6 reveals that there has been no stable correlation between U.S. bond yields and EM credit spreads and currencies. Therefore, a bottom in EM currencies and risk assets will occur when global trade and Chinese demand ameliorate rather than as a result of Fed policy. An important question is whether low bond yields are going to support global share prices. Our hunch is that it is not likely.1 First, if U.S. bond yields had not dropped by as much as they have, global equity prices would be lower. In short, reduced long-term interest rate expectations have led investors to pay higher multiples, especially for non-cyclical and growth stocks. The U.S. equity rally since early this year has been due to multiples expansion, especially among non-cyclical and growth stocks. Chart I-7Global Ex-U.S. Share Prices: No Bull Market Here
Global Ex-U.S. Share Prices: No Bull Market Here
Global Ex-U.S. Share Prices: No Bull Market Here
The latter has allowed the S&P 500 to reach new highs recently at a time when global ex-U.S. share prices are not far from their December lows (Chart I-7). Second, falling interest rates are positive for share prices when profits are growing, even if at a slower rate. When corporate profits are contracting, lower interest rates typically do not preclude equity prices from dropping. Going forward, U.S. equities remain at risk due to a potential profit contraction. We do not foresee a recession in U.S. household spending. However, America’s corporate earnings will be under pressure from a stronger dollar and shrinking profit margins due to rising unit labor costs (Chart I-8), notwithstanding the manufacturing recession that is taking hold. Chart I-8U.S. Corporate Profits Are At Risk From Margins
U.S. Corporate Profits Are At Risk From Margins
U.S. Corporate Profits Are At Risk From Margins
One popular narrative attributes exceptionally low bond yields to excess savings over investments. Yet this is not always accurate. Box I-1 below explains why bond yields have little relation to savings and investments in any economy. Chart I-9U.S. Bonds Are High-Yielders Among DM
U.S. Bonds Are High-Yielders Among DM
U.S. Bonds Are High-Yielders Among DM
Finally, some investors wonder if the low/negative bond yields in DM ex-U.S. could push U.S. Treasury yields lower. Our take is that it is possible. The spread of U.S. Treasury yields over DM ex-U.S. is very wide, which could entice foreign fixed-income investors to purchase Uncle Sam’s bonds (Chart I-9). What is preventing foreign fixed-income investors from piling into Treasuries is exchange rate risk. If for whatever reason a consensus emerges among global fixed-income investors that the greenback is not going to depreciate in the next 12-18 months, there could be a stampede of foreign investors into U.S. Treasuries, pushing yields considerably lower. In our opinion, the odds are that the broad trade-weighted dollar will stay firm for now and could make new cycle highs. In such a scenario, investor expectations of U.S. currency depreciation will diminish. This could trigger a stampede of foreign fixed-income investors into U.S. bonds. This is not a forecast but a consideration that bond investors should take into account. Bottom Line: Global growth conditions, especially outside the U.S., remain bond friendly. Nevertheless, bonds are overbought and technical factors discussed in Box I-1 below might exert upward pressure on U.S. bond yields in the near term. Implications For EM We explore three scenarios for the direction of U.S. bond yields in the coming weeks and months and the corresponding potential dynamics for EM risk assets and currencies. Scenario 1: U.S. bond yields continue to fall as the global trade and manufacturing recession endures, suppressing global growth. Outcome: EM currencies will depreciate and EM risk assets will suffer more. Scenario 2: U.S. Treasury yields increase because U.S. domestic demand firms up, even if the global trade contraction persists. Outcome: EM currencies will weaken and EM risk assets will sell off further. Scenario 3: U.S. bond yields rise because the global manufacturing recession abates and a recovery in China leads to a global trade revival. Outcome: EM currencies will appreciate and risk assets will rally considerably. Please note that Scenario 3 is not our baseline scenario. The ubiquitous premise in these deliberations is that EM currencies and EM risk assets are primarily driven by cycles in global trade and the Chinese economy rather than U.S. growth and interest rates. EM currencies and EM risk assets are primarily driven by cycles in global trade and the Chinese economy rather than U.S. growth and interest rates. Chart I-10Stay With Short EM Equities / Long 30-Year U.S. Bonds Strategy
Stay With Short EM Equities / Long 30-Year U.S. Bonds Strategy
Stay With Short EM Equities / Long 30-Year U.S. Bonds Strategy
To capitalize on our view of weaker global growth emanating from China/EM, we have been recommending the following strategy: short EM stocks / long U.S. 30-year Treasuries. This recommendation has panned out nicely, delivering a 21.5% gain since its initiation on April 10, 2017 (Chart I-10). Barring Scenario 3 above, this trade has more upside. EM Financial Markets: No Capitulation So Far Major bottoms in financial markets typically occur after investor capitulation has already taken place. Having reviewed various financial market variables, we conclude that signposts of capitulation in EM risk assets and global equities are absent: The S&P 500 SKEW index is very low. This index reflects the probability that investors are assigning to downside risk in share prices. The SKEW index is currently at one of its lowest readings of the past 30 years (since its existence), which suggests that investors are not hedging themselves against large price swings (Chart I-11). This usually occurs prior to a heightened period of volatility. Chart I-11Are U.S. Equity Investors Complacent?
Are U.S. Equity Investors Complacent?
Are U.S. Equity Investors Complacent?
The volatility measures for EM and commodity currencies are still very subdued (Chart I-12). The same is true for EM equity volatility (Chart I-12, bottom panel). Even though EM and commodities currencies as well as EM share prices have fallen substantially, the price of buying insurance is still low – meaning investors are still not particularly worried. This habitually is a sign of complacency. Chart I-12Cyclical Risk Markets: Implied Volatility Remains Low
Cyclical Risk Markets: Implied Volatility Remains Low
Cyclical Risk Markets: Implied Volatility Remains Low
Chart I-13No Capitulation Among EM Equity And Currency Investors
Investors Are Very Bullish On EM No Capitulation Among EM Equity And Currency Investors
Investors Are Very Bullish On EM No Capitulation Among EM Equity And Currency Investors
Finally, Chart I-13 shows that asset managers’ and leveraged funds’ net long positions in EM equity index futures and high-beta liquid currencies futures were still elevated as of August 15. Bottom Line: There are no signs of investor capitulation that often mark a major bottom in risk assets. BOX 1 Do Bond Yields Equilibrate Savings And Investment? Mainstream economic theory regards bond yields as the interest rate that balances desired savings and desired investment. According to mainstream theory, when desired savings rise relative to desired investment, bond yields drop. The latter induces less savings and more investment equilibrating the system. Conversely, when desired investment increases relative to desired savings, bond yields climb, discouraging investment and incentivizing more savings. The fundamental shortcoming of this economic model stems from the misrepresentation of banking. When a commercial bank buys any security from a non-bank, it originates a new deposit “out of thin air.” The bank does not allocate someone’s deposit into bonds. Diagram I-1 below exhibits this point. When a U.S. bank purchases a dollar-denominated bond from a pension fund, it does not use someone’s deposit to do so. Rather, a new deposit in the U.S. banking system (often at another bank) is created “out of thin air” as a result of the transaction.
Chart I-
The amount of bonds commercial banks can purchase is limited only by regulatory norms, liquidity provision by the central bank as well as its management’s willingness to do so. Nobody needs to save for a bank to buy a bond or make a loan. We have written in past reports on money, credit and savings that deposits in the banking system have no relationship with national or household savings. When an individual or company saves, the amount of deposits in the banking system does not change. All in all, banks do not intermediate savings/deposits into credit/loans. They create new deposits “out of thin air” when they originate a loan to or buy any security from a non-bank. Provided that banks do not utilize national savings or existing deposits to acquire bonds, fluctuations in bond yields do not reflect changes in national savings. Holding everything else constant, bond yields could drop if commercial banks buy bonds en masse. The opposite also holds true. Chart I-14 demonstrates that U.S. commercial banks have been augmenting their purchases of various types of bonds. This partially explains why bond yields have plunged (bond yields shown inverted on this chart). If U.S. banks’ bonds purchases mean revert, as they often do, U.S. bond yields could rise. Chart I-14Are U.S. Banks' Purchases Of Bonds Driving Bond Yields?
Are U.S. Banks' Purchases Of Bonds Driving Bond Yields?
Are U.S. Banks' Purchases Of Bonds Driving Bond Yields?
This along with more bond issuance by the U.S. Treasury to refill its Treasury’s General Account at the Fed as well as the existing overbought conditions in government bonds could produce a pick-up in yields. Such a rebound in bond yields would be technical and would not signal fundamental changes in the U.S. or global business cycles, or in the savings-investment balance. Closing Some Positions Long Latin American / short emerging Asian equity indexes. This position has generated a 6% loss since its initiation on October 11, 2018 and we have low confidence that it will generate positive returns going forward. Long Chinese small cap / short EM small-cap stocks. Our bet has been that Chinese private sector companies trading in Hong Kong and represented in the MSCI small-cap index will perform better than the average EM small cap. This strategy has not worked out and has produced a 4.4% loss since its recommendation on November 20, 2013. We are downgrading Colombian equities from neutral to underweight. Please refer to pages 17-20 for a detailed analysis. Instead, we are upgrading the Peruvian bourse from underweight to a neutral allocation within an EM equity portfolio. Our view remains that gold prices will continue outperforming oil.2 Peru benefits from higher gold and silver prices while Colombia is largely an oil play. Consistently, the Peruvian currency will depreciate less than the Colombian peso. These justify this allocation shift between these two bourses. Arthur Budaghyan Chief Emerging Markets Strategist arthurb@bcaresearch.com Philippines: The Currency Holds The Key Government expenditures, in general, and infrastructure investment, in particular, will rise meaningfully in the next few months. Chart II-1Philippine Current Account Deficit Funded By Volatile Portfolio Flows
Philippine Current Account Deficit Funded By Volatile Portfolio Flows
Philippine Current Account Deficit Funded By Volatile Portfolio Flows
Declining U.S. interest rates coupled with slumping oil prices have supported Philippine financial markets. However, the country’s balance of payments dynamics are still precarious. In particular, Philippine’s wide current account (CA) deficit will need to be funded by volatile foreign portfolio inflows as the basic balance – the sum of CA balance and net FDI – has turned negative (Chart II-1). Critically, the already wide current account deficit is set to balloon even further: First, the 2019 fiscal spending was back-loaded because a Congress impasse delayed the government budget approval to April. Hence, government expenditures, in general, and infrastructure investment, in particular, will rise meaningfully in the next few months. Higher infrastructure spending will drive imports of capital goods higher (Chart II-2). The latter accounts for 32% of total imports. Second, Philippine export growth is likely to contract anew as global trade is not recovering (Chart II-3). Chart II-2Philippine Government Infra Spending Will Accelerate
Philippine Government Infra Spending Will Accelerate
Philippine Government Infra Spending Will Accelerate
Chart II-3Philippine Exports Will Contract
Philippine Exports Will Contract
Philippine Exports Will Contract
We continue to expect broad portfolio capital outflows from EM. Potential for foreign outflows from the Philippines is large. Foreign ownership of local equities is high at 42%. As to foreign ownership of local currency bonds, it stands at around 13%. A renewed decline in the peso will drive away portfolio flows reinforcing additional currency depreciation. The falling peso will prevent the central bank from reducing interest rates further. Even if the central bank does not hike rates to support the peso, market-driven local rates could rise for a period of time. This is bad news for property stocks – which account for about 27% of the MSCI Philippines index. Having rallied considerably, they are at major risk as local interest rates rise. In addition, these stocks have benefited from strong real estate demand emanating from the Philippine Offshore Gaming Operators (POGO) sector – which itself has been largely driven by Chinese capital flows. Both the Chinese and Philippine authorities have begun cracking down fiercely on these operations because they are link to capital flight out of China. This crackdown will curtail capital flows into these areas and depress revenues of Philippine real estate companies. This will occur at a time when the residential market is experiencing weak demand. We continue to recommend shorting/underweighting property stocks. Finally, small cap stocks are in a bear market and are sending an ominous signal (Chart II-4). Furthermore, this bourse is neither attractive in absolute terms nor relative to EM (Chart II-5). Chart II-4Small-Cap Stocks Are In A Bear Market
Small-Cap Stocks Are In A Bear Market
Small-Cap Stocks Are In A Bear Market
Chart II-5Philippine Equities Are Expensive
Philippine Equities Are Expensive
Philippine Equities Are Expensive
Bottom Line: We continue recommending to short the Philippine peso against the U.S. dollar. Overall, EM dedicated investors should continue underweighting the Philippine equity, fixed income and sovereign credit markets within their respective EM universes. Ayman Kawtharani, Editor/Strategist ayman@bcaresearch.com Colombia: A Top In The Business Cycle? Colombia’s business cycle has reached a top and growth will slow considerably in the next 12 months. Falling oil prices and fiscal tightening will cause the Colombian economy to slow down in the next 12 months. What’s more, a depreciating peso and sticky inflation will prevent the central bank (Banrep) from frontloading rate cuts to mitigate the downtrend. The Colombian peso is making new cyclical lows and more weakness is in the cards. While the currency is slightly cheap according to the real effective exchange rate based on unit labor costs (Chart III-1), our negative view on oil prices entails further currency depreciation. Colombia is still very heavily reliant on oil exports – the current account deficit is 4.3% of GDP with oil, but 8.4% excluding it (Chart III-2). Moreover, a chunk of FDIs are destined for the energy sector, and foreign portfolio flows are contingent on exchange rate stability. Therefore, falling oil prices and a weaker peso will result in diminishing FDIs and foreign portfolio flows, reinforcing downward pressure on the currency. Chart III-1The Colombian Peso Is Not That Cheap
The Colombian Peso Is Not That Cheap
The Colombian Peso Is Not That Cheap
Chart III-2Current Account Deficit Is Large And Widening
Current Account Deficit Is Large And Widening
Current Account Deficit Is Large And Widening
Notably, there is a significant pass-through effect from the currency to inflation (Chart III-3). Even though Banrep does not target the exchange rate, having both headline and core inflation above the 3% central target will constrict it from cutting interest rates soon. On the whole, odds are that Colombia’s business cycle has reached a top and growth will slow considerably in the next 12 months. The yield curve is signaling an economic slowdown ahead (Chart III-4). Chart III_3The Exchange Rate And Inflation
The Exchange Rate And Inflation
The Exchange Rate And Inflation
Chart III-4Domestic Demand Is About To Roll Over
Domestic Demand Is About To Roll Over
Domestic Demand Is About To Roll Over
Our credit and fiscal spending impulse might be peaking, signifying a top in domestic demand growth (Chart III-5). The impulse is rolling over primarily due to the substantial fiscal tightening. Duque’s administration has slashed expenditures and the latter are contracting in inflation-adjusted terms (Chart III-6). Chart III-5A Top In The Business Cycle?
A Top In The Business Cycle?
A Top In The Business Cycle?
Chart III-6Severe Fiscal Tightening
Severe Fiscal Tightening
Severe Fiscal Tightening
Government revenues are highly dependent on oil exports, and the recent fall in oil prices will bring about a contraction in fiscal revenues. This, and the government’s strong adherence to fiscal surplus, implies no loosening up on the fiscal side. Finally, our proxy for marginal propensity to spend for businesses and households is indicating that growth is about to roll over (Chart III-7). Auto sales are also weakening, and housing sales are contracting (Chart III-8). Chart III-7The Business Cycle Is Peaking
The Business Cycle Is Peaking
The Business Cycle Is Peaking
Chart III-8Colombia: Certain Segments Have Turned Over
Colombia: Certain Segments Have Turned Over
Colombia: Certain Segments Have Turned Over
Given that both fiscal and monetary policies are unlikely to be relaxed soon, the peso will come under renewed selling pressure, acting as a release valve for the Colombian economy. Investment Recommendations We are downgrading this bourse from neutral to an underweight allocation within a dedicated EM equity portfolio. In its place, we are upgrading Peruvian stocks from underweight to neutral. Continue shorting COP versus RUB. This trade has generated a 14% return since its initiation on May 31st of last year. Finally, within EM local currency bond and sovereign credit portfolios, Colombia warrants a neutral allocation. We also recommend fixed-income investors continue to bet on further yield curve flattening: receive 10-year / pay 1-year swap rates. Juan Egaña, Research Associate juane@bcaresearch.com Argentina: Do Not Catch A Falling Knife The latest rout in Argentine markets has brought fears of another sovereign debt default or restructuring. Are conditions right for buying Argentine markets? Politics complicate the assessment of a debt restructuring and we do not recommend bottom fishing in Argentine financial markets. Looking at the profile of past financial crises and debt defaults, there might be more downside in Argentine asset prices. Sovereign U.S. dollar bond prices remain well above their 2002 and 2008 lows (Chart IV-1). Compared with previous EM financial crises, Argentine stocks might still have considerable downside in U.S. dollar terms (Chart IV-2). Chart IV-1Things Could Get Worse
Things Could Get Worse
Things Could Get Worse
Chart IV-2Historical Patterns Suggest More Downside In Bank Stocks
Historical Patterns Suggest More Downside In Bank Stocks
Historical Patterns Suggest More Downside In Bank Stocks
The equity market index has relapsed below its 2018 lows in dollar terms, which technically qualifies as a breakdown and entails fresh lows ahead (Chart IV-3). Chart IV-3A Technical Breakdown In Argentine Equities
A Technical Breakdown In Argentine Equities
A Technical Breakdown In Argentine Equities
In addition to political uncertainty and rising possibility of a left-wing run government, the nation’s ability to service its foreign currency debt has deteriorated with the currency plunging to new lows. Specifically, the country has large foreign debts of $275 billion. Foreign obligation payments in the next 12 months are about $40 billion. The government lacks foreign currency reserves and export revenues necessary to service its external debt. The central bank’s net foreign exchange reserves (excluding FX swaps and gold) are about $17 billion. The country’s annual exports are $77.5 billion. With agricultural commodities prices falling, exports will likely shrink. By and large, our downbeat stance from April remains intact. Bottom Line: Investors should continue avoiding and underweighting Argentine financial markets. Andrija Vesic, Research Analyst andrijav@bcaresearch.com Footnotes 1 Please note this is the view of BCA’s Emerging Markets Strategy service and is different from BCA’s house view. Clients can read the debate between various BCA strategists in the report What Goes On Between Those Walls? BCA’s Diverging Views In The Open. Please click on the link to access it. 2 We recommended the long gold / short copper and oil trade on July 11, 2019 and this position remains intact. Equities Recommendations Currencies, Fixed-Income And Credit Recommendations
Strong U.S. inflation prints during the past two months add an interesting wrinkle to the macro landscape. Core U.S. inflation grew at an annualized rate of 3.55% in July, following an annualized rate of 3.59% in June. However, these strong inflation readings…
At present, we are stuck in an environment where aggressively easy monetary policy and low bond yields are the sole supports for risky assets. In turn, falling bond yields are stoking concerns about the economy, which results in the perceived need for ever…
There’s an interesting self-fulfilling prophesy that can take hold when the yield curve inverts. Investors interpret the inversion as a signal of weaker economic growth ahead. They then bid up long-dated bond prices causing the curve to invert even more. This…
Highlights Duration: Global manufacturing growth will rebound near the end of this year. Much like in 2016, this will result in higher global bond yields on a 12-month horizon. Investors should keep portfolio duration close to benchmark for now, but be prepared to shift to below-benchmark when our global growth indicators show signs of improvement. Country Allocation: Countries with yield curves furthest away from the effective lower bound also have the most cyclical bond markets. At present, this means that U.S. and Canadian bond markets will perform best if global growth continues to weaken. They will also perform worst in the event of an economic turnaround. Japanese bonds will perform best in a bond bear market, with German debt a close second. Relative Value In Global Government Debt: Changes in the level and shape of global yield curves have altered the relative value opportunities in the global government bond space. We find that the most positive carry (including both yield income and rolldown) in global government bond markets is earned in 30-year German, Japanese and Australian bonds, and in 10-year U.K. and Japanese bonds. Feature Reflexivity Chart 1A Brief Inversion
A Brief Inversion
A Brief Inversion
The decline in global bond yields has been unrelenting, and it took on a life of its own last week when the U.S. 2-year/10-year slope briefly inverted (Chart 1). After the inversion, the 30-year U.S. Treasury yield broke below 2% and the 10-year yield broke below 1.50%. The average yield on the 7-10 year Global Treasury Index closed at 0.49% last Thursday, just above its all-time low of 0.48% (Chart 1, bottom panel). There’s an interesting self-fulfilling prophesy that can take hold when the yield curve inverts. Investors interpret the inversion as a signal of weaker economic growth ahead. They then bid up long-dated bond prices causing the curve to invert even more. This sort of circular reasoning can cause bond yields to disconnect from the trends in global economic data, often severely. While recession fears have benefited government bonds, risky assets – equities and corporate bonds – have experienced relatively minor pain. The S&P 500’s recent sell-off pales in comparison to the one seen late last year (Chart 2). Meanwhile, corporate bond spreads remain well below early-2019 peaks. Risky assets have clearly benefited from the drop in bond yields, as markets price-in a future where central banks ease monetary policy in response to weaker economic growth, and where that easing is sufficient to keep equities and credit well supported. Chart 2Low Yields Support Risk Assets I
Low Yields Support Risk Assets I
Low Yields Support Risk Assets I
Chart 3Low Yields Support Risk Assets II
Low Yields Support Risk Assets II
Low Yields Support Risk Assets II
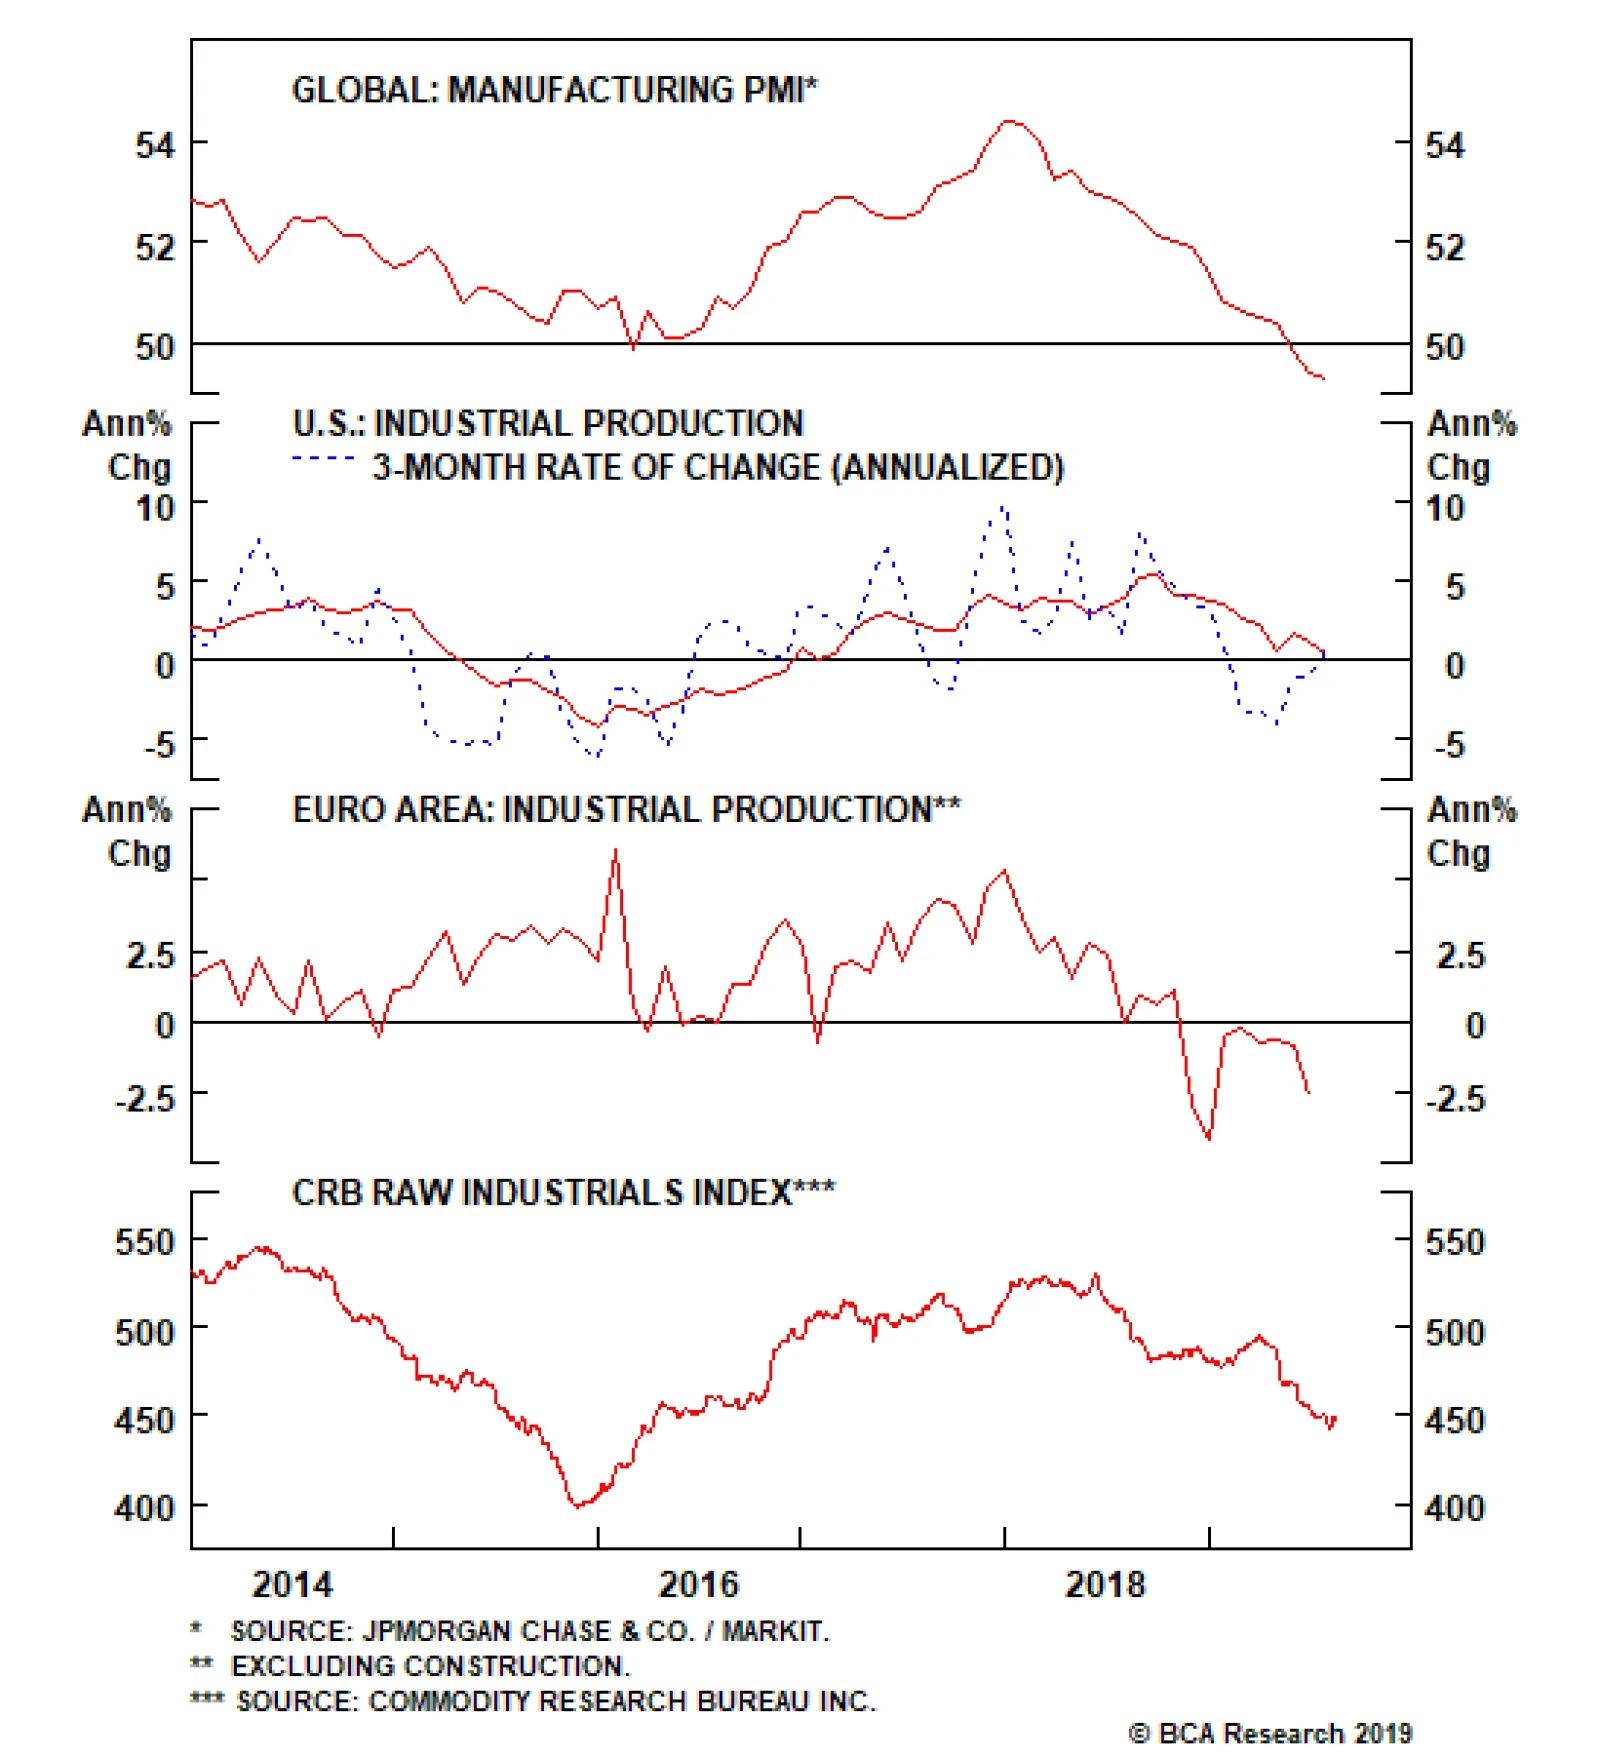
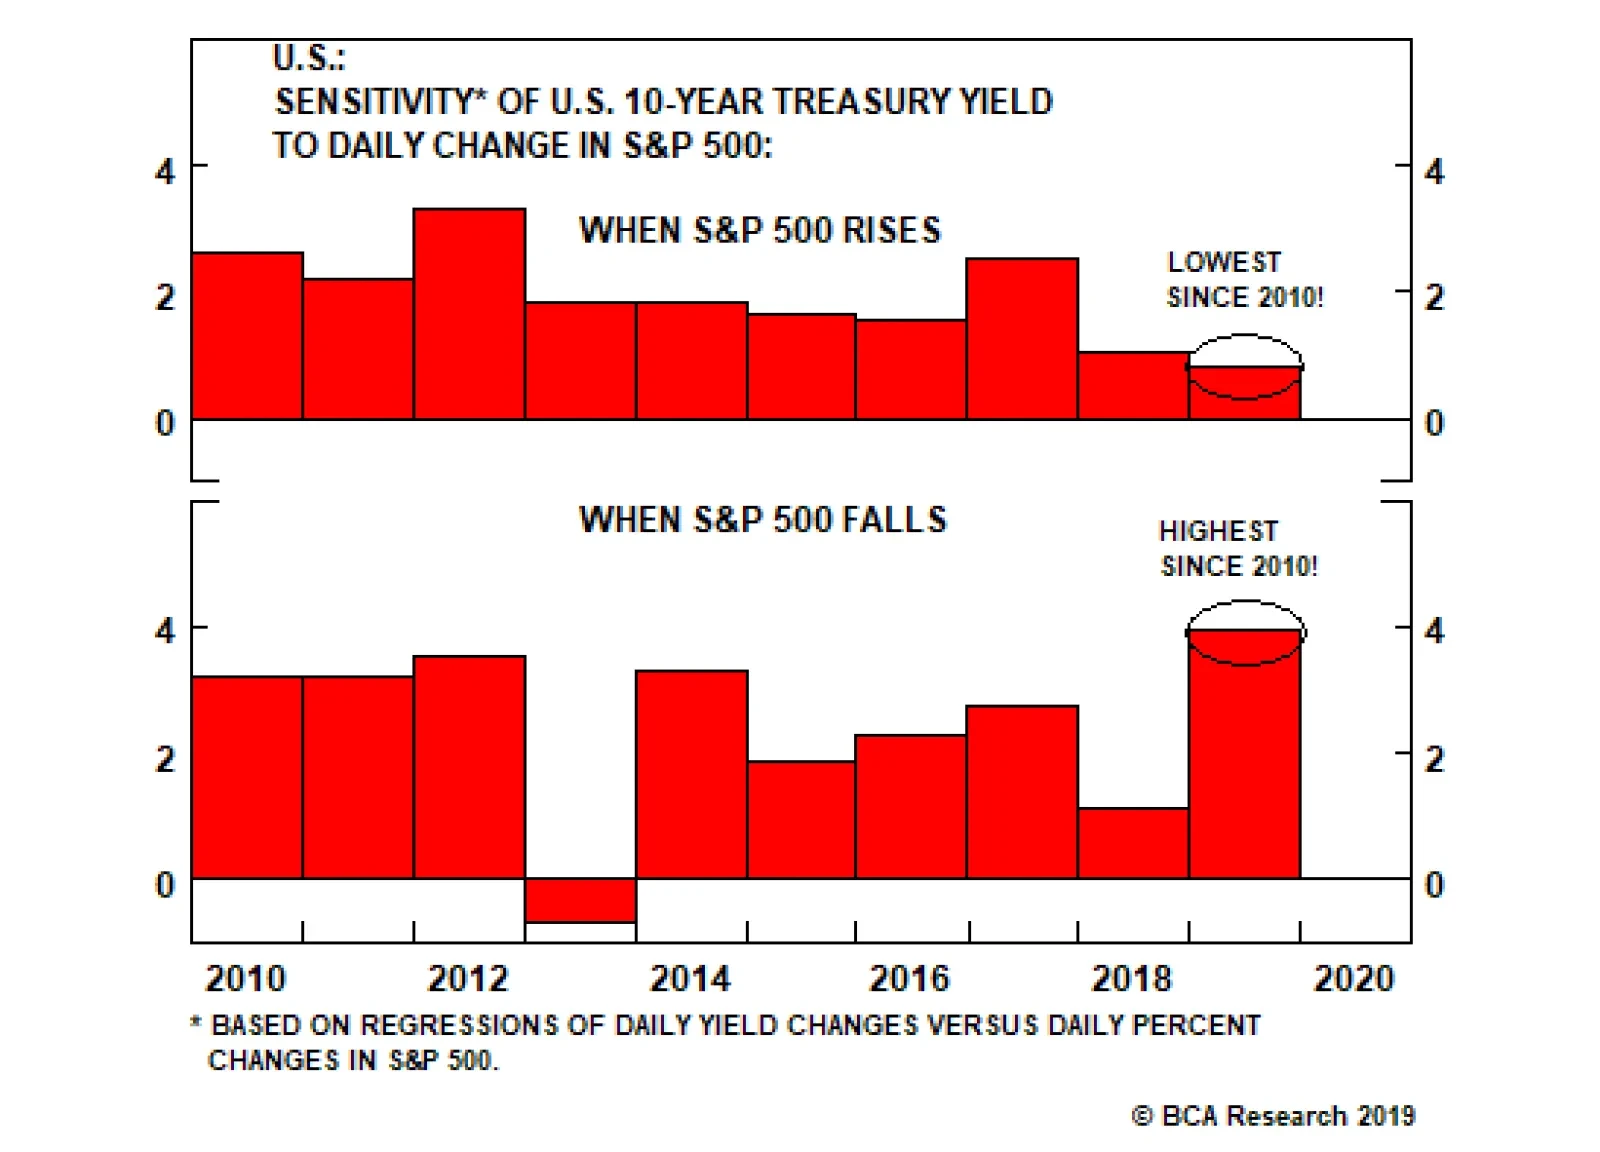
Further evidence of this dynamic is presented in Chart 3. The chart shows the sensitivity of daily changes in the U.S. 10-year Treasury yield to changes in the S&P 500 for each year since 2010. The sample is split into days when the S&P 500 rose and when it fell. For example, in 2010 the sensitivity on “up days” was 2.6, meaning that on days when the S&P 500 rose, the 10-year yield rose 2.6 basis points for every 1% increase in the S&P 500. Similarly, the sensitivity in 2010 on “down days” was 3.2. This means that the 10-year yield fell 3.2 bps for every 1% drop in the equity index. The main takeaway from Chart 3 is how dramatically the sensitivities have shifted in 2019. The yield sensitivity on “up days” has fallen sharply – down to 0.8. This means that yields barely rise on days when equities move up. Meanwhile, the sensitivity on “down days” has shot higher, to just under 4. This means that yields fall a lot on days when equities sell off. The perception of easier monetary policy has been the main support for risk assets this year. The logical interpretation of these trends is that the perception of easier monetary policy has been the main support for risk assets this year. Global Growth Needed At present, we are stuck in an environment where aggressively easy monetary policy and low bond yields are the sole supports for risky assets. In turn, falling bond yields are stoking concerns about the economy, leading to even easier monetary policy. Only one thing can bust us out of this pattern, and that’s a resurgence of global manufacturing growth. Unfortunately, there is little evidence that this is taking place (Chart 4). The Global Manufacturing PMI is now down to 49.3, below the 2016 trough of 49.9 (Chart 4, top panel). U.S. Industrial Production growth remains weak, but is showing signs of stabilization above the 2016 trough (Chart 4, panel 2). European Industrial Production, on the other hand, continues to contract (Chart 4, panel 3). The downtrend in our favorite real-time indicator of global manufacturing – the CRB Raw Industrials index – remains unbroken (Chart 4, bottom panel). However, even though evidence of a turnaround in global manufacturing is scant, we expect a rebound near the end of this year, for the following reasons: Global financial conditions have eased this year, the result of aggressive central bank stimulus. Financial conditions are easier now than they were in 2018, and much easier than they were prior to the 2015/16 global growth slowdown (Chart 5, top panel). China has started to ease credit conditions in response to U.S. tariffs and the slowdown in growth. So far, stimulus has been tepid relative to 2015/16 levels, but it should ramp up in the coming months.1 Many large important segments of the global economy remain unaffected by the global manufacturing slowdown. The U.S. consumer continues to spend: Core retail sales are growing at a robust 5% year-over-year rate, and consumer sentiment remains elevated (Chart 5, panels 2 & 3). Even in the Eurozone, the service sector has not experienced the same pain as manufacturing (Chart 5, bottom panel). Fiscal policy will remain a tailwind for economic growth this year and next. Last week, there were even rumors of increased fiscal thrust from Germany if the growth slowdown persists.2 Strong inflation readings only increased market worries that the Fed might not be as accommodative as necessary. On the whole, we expect that the above 4 factors will lead to a rebound in global manufacturing growth near the end of this year. Much like in 2016, this will result in higher global bond yields on a 12-month horizon, but the global growth indicators shown in Chart 4 will need to rebound first. Chart 4Global Growth Indicators
Global Growth Indicators
Global Growth Indicators
Chart 5Catalysts For Economic Recovery
Catalysts For Economic Recovery
Catalysts For Economic Recovery
Inflation Puts Pressure On Powell Chart 6Strong Inflation Could Complicate The Fed's Message
Strong Inflation Could Complicate The Fed's Message
Strong Inflation Could Complicate The Fed's Message
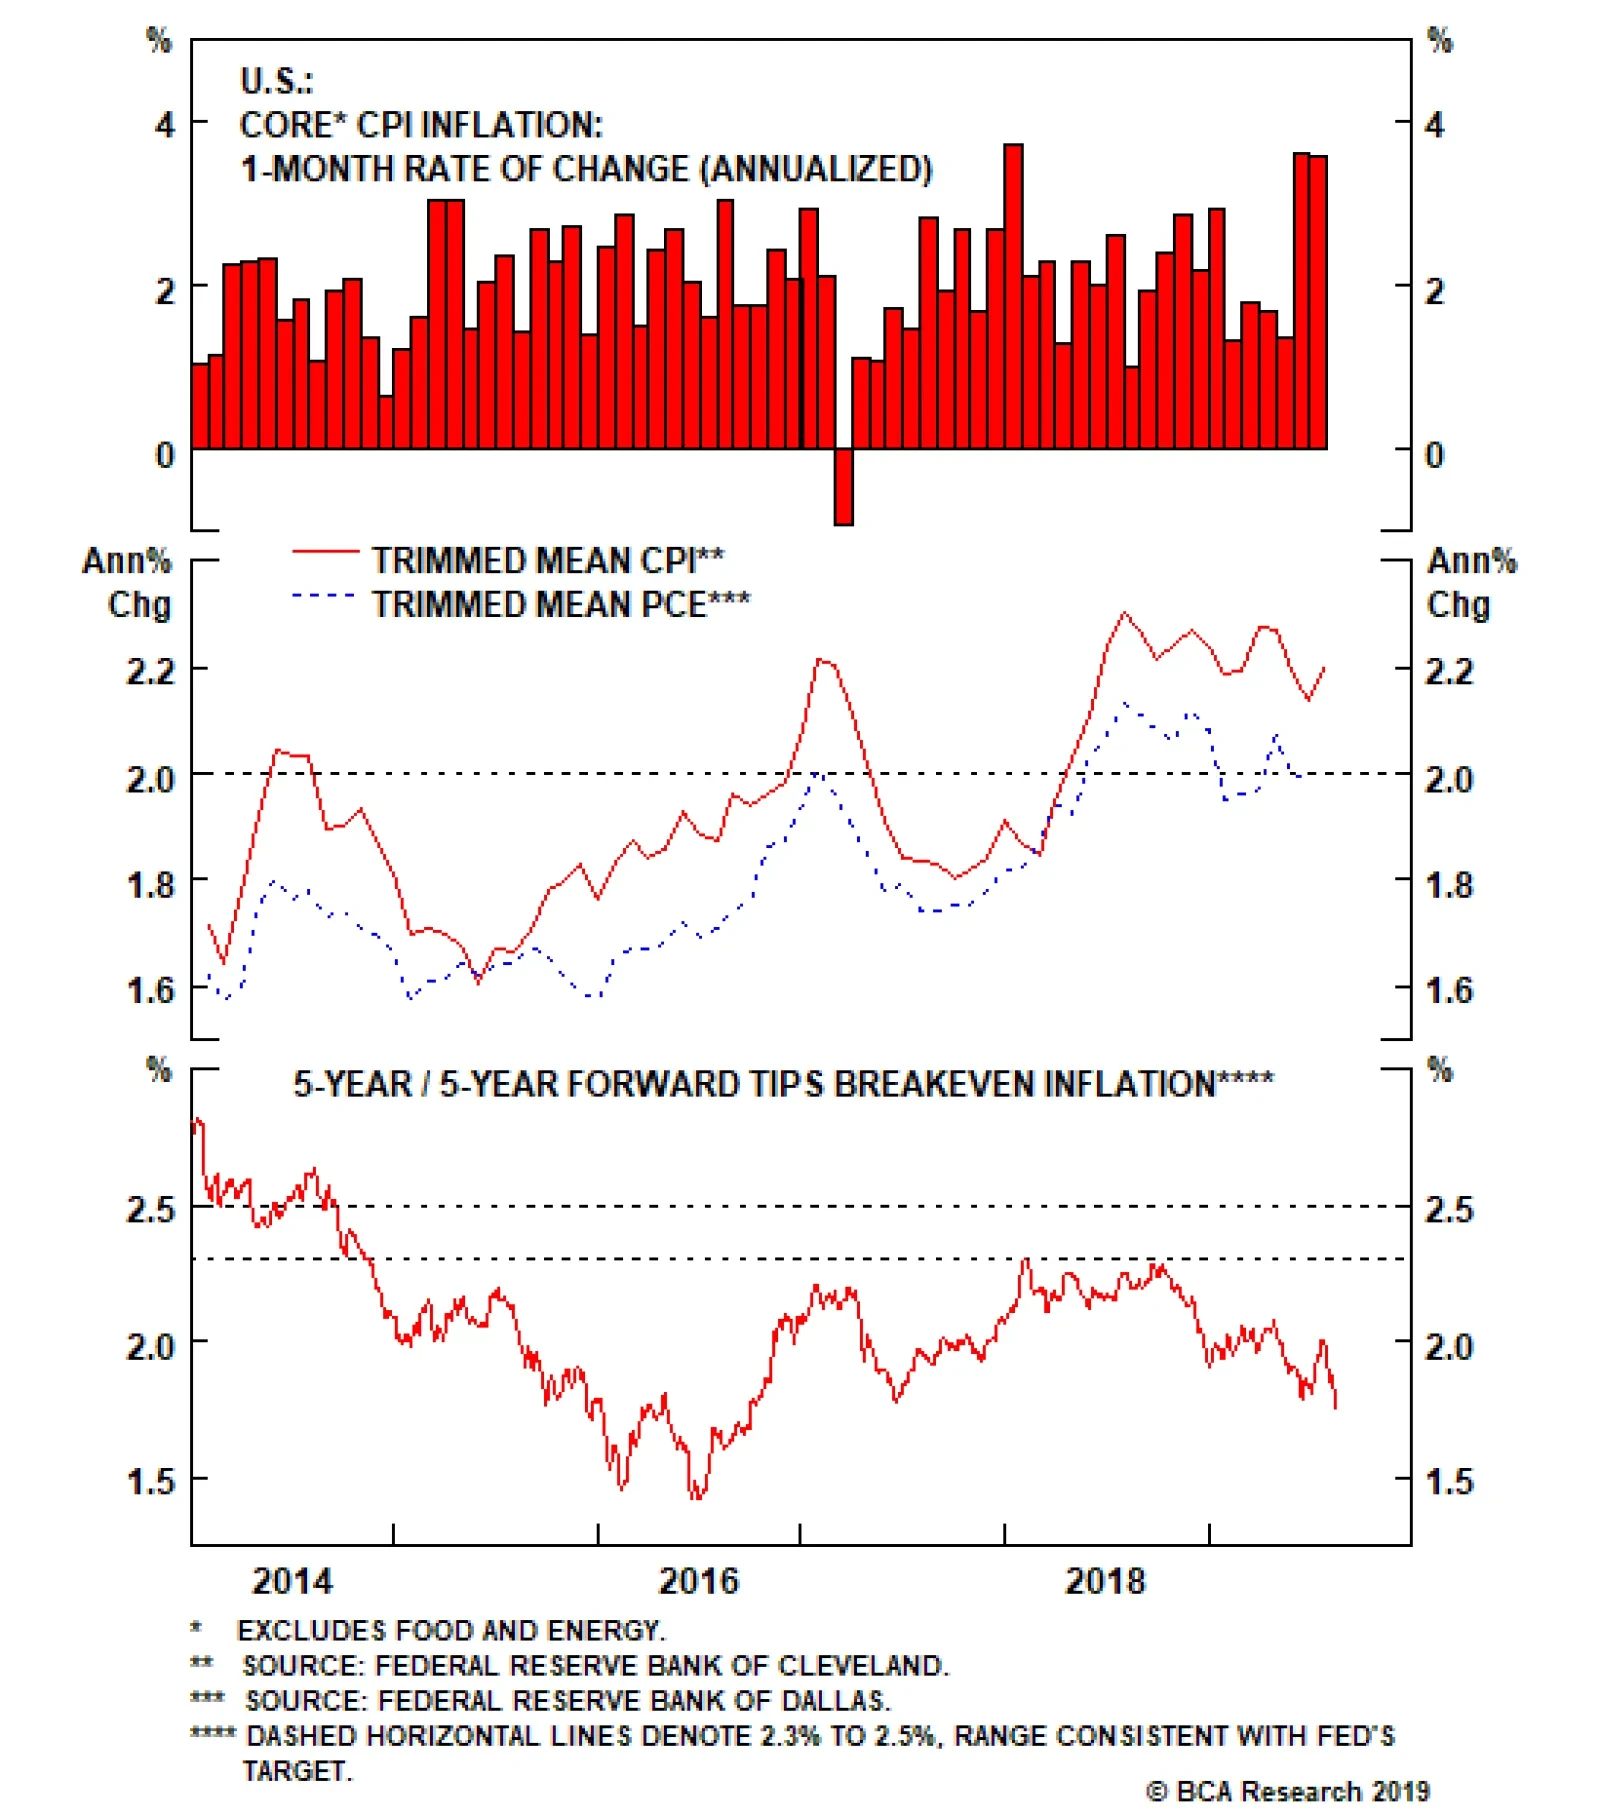
Strong U.S. inflation prints during the past two months add an interesting wrinkle to the macro landscape. Core U.S. inflation grew at an annualized rate of 3.55% in July, following an annualized rate of 3.59% in June (Chart 6). However, these strong inflation readings only increased market worries that the Fed might not be as accommodative as necessary. This exacerbated the flattening of the yield curve and sent long-dated TIPS breakeven inflation rates lower. Our sense is that the Fed is chiefly concerned with re-anchoring inflation expectations (Chart 6, bottom panel). This probably means that another rate cut is coming in September, and that Chairman Powell will do his best to sound accommodative in his Jackson Hole address on Friday. However, recent strong inflation data could prompt Powell to sound more hawkish than the market would like, causing yield curves to flatten and risky assets to fall. Bottom Line: Global manufacturing growth will rebound near the end of this year. Much like in 2016, this will result in higher global bond yields on a 12-month horizon. Investors should keep portfolio duration close to benchmark for now, but be prepared to shift to below-benchmark when our global growth indicators show signs of improvement. Country Allocation & The Zero Lower Bound Perhaps the most straightforward way to think about country allocation within a portfolio of developed market government bonds is to classify the different markets as either “high beta” or “low beta”. Chart 7 shows the trailing 3-year sensitivity of major countries’ 7-10 year bond yields relative to the global 7-10 year yield.3 The U.S. and Canada have the highest betas, followed by the U.K. and Australia. Germany has a beta close to one, and Japan’s beta is the lowest. Chart 7Global Yield Beta
Global Yield Beta
Global Yield Beta
In other words, if global growth falters and global bond yields decline, U.S. and Canadian bond markets should perform best, followed by the U.K. and Australia. German bonds should perform in line with the global index, and Japanese bonds should underperform the global benchmark. What makes this approach to portfolio allocation even better is that the calculation of trailing betas is not really necessary. A very similar ordering of countries – from “high beta” to “low beta” – is achieved by simply ranking the markets from highest yielding to lowest yielding. High yielding countries, like the U.S. and Canada, have the most room to ease monetary policy in response to a negative growth shock. This means that yields in those countries will respond most to global growth fluctuations. On the other hand, the entire Japanese yield curve is already pinned near the effective lower bound. Even in the event of a negative growth shock, there is little scope for easier Japanese monetary policy, and JGB yields will be relatively unaffected. Chart 8High Beta Countries Are Most Sensitive To Economic Growth
High Beta Countries Are Most Sensitive To Economic Growth
High Beta Countries Are Most Sensitive To Economic Growth
It’s interesting to note in Chart 7 that while German yields are actually below JGB yields, bunds remain somewhat less defensive than the Japanese market. This is because the German term structure has only recently moved to the effective lower bound, and investors likely still retain some hope that an improvement in global growth could lead to European policy tightening at some point in the future. This belief is largely absent in Japan, where the term structure has been pinned at the lower bound for many years. Chart 8 provides some further evidence of the split between “high beta” and “low beta” bond markets. It shows that the bond markets with the highest yields are also the most sensitive to trends in global growth, as proxied by the Global Manufacturing PMI. U.S. bond yields are highly correlated with the Global PMI, while Japanese bond yields are hardly correlated at all. It follows that if the slowdown in global growth continues and all nations’ yield curves converge to Japanese levels, then the overall economic sensitivity of global bond yields will decline. Bottom Line: Countries with yield curves furthest away from the effective lower bound also have the most cyclical bond markets. At present, this means that U.S. and Canadian bond markets will perform best if global growth continues to weaken. They will also perform worst in the event of an economic turnaround. Japanese bonds will perform best in a bond bear market, with German debt a close second. Looking For Positive Carry Yield curves have undergone dramatic shifts in recent months, in terms of both level and shape. Not only have curves for the major government bond markets shifted down since the beginning of the year, they also now exhibit varying degrees of a ‘U’ shape (Charts 9A-9F). With that in mind, in this week’s report we look for the best “positive carry” opportunities in global government bond markets. Yield curves for the major government bond markets have shifted down since the beginning of the year, they also now exhibit varying degrees of a ‘U’ shape. We use the term carry to mean the expected return from a given bond assuming an unchanged yield curve. This is essentially the combination of yield income (i.e. coupon return) and the price impact of rolling down (or up) the yield curve. For the purposes of this report, we assume a 12-month investment horizon and incorporate the impact of currency hedging into each security’s yield income.
Chart 9
Chart 9
Chart 9
Chart 9
Chart 9
Chart 9
Rolldown ‘U’ shaped yield curves mean that bonds near the base of the ‘U’ currently suffer from negative rolldown, while the rolldown for long maturities is often highly positive. Table 1 shows that rolldown is currently negative for all 2-year bonds, but especially for U.S. and Canadian debt. The U.S. and Canada have the highest policy rates within developed markets, so it’s not surprising that the front-end of their yield curves are also the most steeply inverted. In other words, their yield curves are pricing-in that they have more room to cut rates than other countries. Table 112-Month Rolldown* (%) For A Long Position In Government Bonds
Where's The Positive Carry In Bond Markets?
Where's The Positive Carry In Bond Markets?
In general, rolldown is relatively modest for most 5-year and 7-year maturities. The exceptions being German 5-year debt and Aussie 7-year debt, which benefit from 31 bps and 45 bps of positive rolldown, respectively. As mentioned above, rolldown is currently very positive for long maturity debt. In fact, a 10-year U.K. bond offers a whopping 85 bps of rolldown on a 12-month horizon. Yield Income & Overall Carry As mentioned above, rolldown is only one part of a bond’s carry. The other is the yield an investor earns over the course of the investment horizon – the yield income. Because we assume that investors hedge the currency impact of their bond positions, this yield income also depends on the native currency of the investor. Therefore, we show yield income and overall carry below from the perspective of investors in each of the major currency blocs (USD, EUR, JPY, GBP, CAD, AUD). USD Investors Being the global high yielder, USD investors benefit the most from currency hedging. That is, USD investors earn a lot of additional income on their currency hedges, making non-U.S. bonds look more attractive. Unsurprisingly, carry is most positive at the long-end of yield curves (Tables 2 & 3). Table 2In USD: 12-Month Yield Income* (%) For A Long Position In Government Bonds
Where's The Positive Carry In Bond Markets?
Where's The Positive Carry In Bond Markets?
Table 3In USD: 12-Month Carry (%) For A Long Position In Government Bonds
Where's The Positive Carry In Bond Markets?
Where's The Positive Carry In Bond Markets?
EUR Investors The polar opposite of USD investors, EUR-based investors give up a lot of return through currency hedging. This makes the potential for positive carry much less. In any case, the best positive carry opportunities still lie in German, Japanese and Australian 30-year bonds. U.K. and Japanese 10-year bonds are also attractive (Tables 4 & 5). Table 4In EUR: 12-Month Yield Income* (%) For A Long Position In Government Bonds
Where's The Positive Carry In Bond Markets?
Where's The Positive Carry In Bond Markets?
Table 5In EUR: 12-Month Carry (%) For A Long Position In Government Bonds
Where's The Positive Carry In Bond Markets?
Where's The Positive Carry In Bond Markets?
JPY Investors Yen-based investors currently have more opportunities to earn positive carry than those based in euros. But these opportunities remain confined to long-maturity debt. Once again, the standouts are Japanese, German and Australian 30-year bonds, and also U.K. and Japanese 10-year debt (Tables 6 & 7). Table 6In JPY: 12-Month Yield Income* (%) For A Long Position In Government Bonds
Where's The Positive Carry In Bond Markets?
Where's The Positive Carry In Bond Markets?
Table 7In JPY: 12-Month Carry (%) For A Long Position In Government Bonds
Where's The Positive Carry In Bond Markets?
Where's The Positive Carry In Bond Markets?
GBP Investors Currency hedges work more in favor of GBP than EUR or JPY. As a result, GBP-based investors see more opportunities to earn positive carry (Tables 8 & 9). Table 8In GBP: 12-Month Yield Income* (%) For A Long Position In Government Bonds
Where's The Positive Carry In Bond Markets?
Where's The Positive Carry In Bond Markets?
Table 9In GBP: 12-Month Carry (%) For A Long Position In Government Bonds
Where's The Positive Carry In Bond Markets?
Where's The Positive Carry In Bond Markets?
CAD Investors As with USD-based investors, CAD-based investors also benefit from currency hedging. All securities continue to offer positive carry when hedged into CAD (Tables 10 & 11). Table 10In CAD: 12-Month Yield Income* (%) For A Long Position In Government Bonds
Where's The Positive Carry In Bond Markets?
Where's The Positive Carry In Bond Markets?
Table 11In CAD: 12-Month Carry (%) For A Long Position In Government Bonds
Where's The Positive Carry In Bond Markets?
Where's The Positive Carry In Bond Markets?
AUD Investors AUD-based investors also see positive carry across the entire global bond space, after factoring-in the impact of currency hedging (Tables 12 & 13). Table 12In AUD: 12-Month Yield Income* (%) For A Long Position In Government Bond
Where's The Positive Carry In Bond Markets?
Where's The Positive Carry In Bond Markets?
Table 13In AUD: 12-Month Carry (%) For A Long Position In Government Bonds
Where's The Positive Carry In Bond Markets?
Where's The Positive Carry In Bond Markets?
Bottom Line: Changes in the level and shape of global yield curves have altered the relative value opportunities in the global government bond space. We find that the most positive carry (including both yield income and rolldown) in global government bond markets is earned in 30-year German, Japanese and Australian bonds, and in 10-year U.K. and Japanese bonds. Ryan Swift, U.S. Bond Strategist rswift@bcaresearch.com Footnotes 1 Please see U.S. Bond Strategy Weekly Report, “The Trump Interruption”, dated August 13, 2019, available at usbs.bcaresearch.com 2 https://www.bloomberg.com/news/articles/2019-08-16/germany-ready-to-raise-debt-if-recession-hits-spiegel-reports 3 We calculate betas using average yields from the Bloomberg Barclays Global Treasury Master index. Fixed Income Sector Performance Recommended Portfolio Specification