Fixed Income

Highlights A lot has changed in a week and a half, … : The FOMC meeting that we thought would mark the end of global market-moving news until September turned out to be a prelude for the real fireworks. … as U.S.-China trade tensions escalated, … : The imposition of tariffs on the only remaining subset of Chinese imports that had escaped duties so far inspired China to let the yuan fall below a key technical level. … and other countries braced for the fallout: China’s devaluation opened up a new front in the conflict, turning a bilateral tariff spat into a threat to other countries’ well-being and competitiveness. Asia-Pacific central banks swiftly followed with larger-than-expected rate cuts. Below-benchmark-duration positioning is no longer appropriate in the near term, and we recommend moving to benchmark duration: Interest rates will be hard-pressed to rise with global central banks squarely in easing mode. Although we still believe that inflation and the fed funds rate will surprise to the upside, it’s going to take a while. Feature Dear Client, There will be no U.S. Investment Strategy next week as we take our final summer break. U.S. Investment Strategy will return on Monday, August 26th. Best regards, Doug Peta So much for the idea that the July 30-31 FOMC meeting would be the last market-moving event before Labor Day. By lunchtime on August 1st, the S&P 500 was back to its July 30th close above 3,010; the 10-year Treasury yield had settled around 1.96%, ten basis points (“bps”) lower than its pre-meeting level; and gold had fallen by ten bucks, to $1,420, as markets digested the news that the Fed was less concerned about the economy than they were. Then the trade war reared its ugly head in the form of new tariffs on Chinese imports to the U.S., and the S&P slid to 2,822, the 10-year Treasury yield tumbled to 1.59%, and gold surged to $1,510. The new round would ensnare the subset of goods that had previously been spared from import duties, and Beijing promised to retaliate. It’s hard for rates to rise when every central bank has an easing bias as it nervously eyes the U.S.-China tilt. Chart 1Beijing Plays The Currency Card
Beijing Plays The Currency Card
Beijing Plays The Currency Card
The retaliation arrived Sunday night in the U.S., when Chinese officials allowed the renminbi to trade above 7 to the dollar for the first time since 2008 (Chart 1). The move provoked a global equity selloff, and the S&P 500 lost 3% in its worst session of the year. With the currency floodgates opened, the trade war morphed from a bilateral tariff spat into a global battle for competitiveness, and central banks in India, Thailand and New Zealand responded with larger-than-expected rate cuts. India is a comparatively closed economy battling a domestic downturn, but it is clear that countries with any reliance on exports are loath to be saddled with a strong currency that will hamstring their global competitiveness. It turns out that the Fed isn’t the only central bank that sees the appeal of taking out some insurance. That is an unfriendly backdrop for below-benchmark-duration positioning, and we are joining our fixed-income colleagues in raising our duration recommendation from underweight to neutral over the tactical timeframe (0-3 months). While we still believe that the fed funds rate and long yields will surprise to the upside, they cannot do so while bond investors are adamant that the Fed is going to have to adopt an easing bias over the near term. Our rates checklist, discussed in the rest of this report, supports the decision. The shift in the rates backdrop undermines our newly established agency mortgage REIT recommendation, and we are watching it closely. The Rates Checklist: The Fed Table 1Rates View Checklist
When The Facts Change
When The Facts Change
Turning to our rates view checklist (Table 1), the first item is derived from our U.S. Bond Strategy service’s golden rule of bond investing.1 The golden rule asks one simple question to anchor views on Treasuries: Over the next 12 months, will the Fed move the fed funds rate by more or less than the bond market is currently discounting? Since 1990, when the Fed has surprised dovishly (the fed funds rate has turned out to be lower than the money market implied twelve months earlier), Treasuries have almost always generated positive excess returns over cash. Periods of negative excess returns have occurred nearly exclusively when the Fed has delivered a hawkish surprise. We still think inflation will become a problem, but it certainly isn’t one yet. Since we rolled out the checklist last year, we have consistently expected a hawkish surprise. Though we continue to believe that an extended cycle of rate cuts is not in the cards, markets disagree, and we concede that the Fed now has a near-term easing bias, despite Chair Powell’s demurrals at the post-meeting press conference. We are leaving the box unchecked because we believe that nearly four more 25-bps cuts over the next twelve months, equating to a target fed funds rate of 1.25-1.50% (Chart 2), are unlikely. The spread between our expectations and the market’s expectations is still wide enough to merit a below-benchmark-duration view over the next twelve months, even if benchmark duration makes more sense for the rest of the year. Chart 2Four More Rate Cuts Are A Stretch
Four More Rate Cuts Are A Stretch
Four More Rate Cuts Are A Stretch
The yield curve’s inversion has become more pronounced in the wake of the re-escalation of the trade war (Chart 3), and we duly check the second box. As a reminder, we track the 3-month/10-year segment of the yield curve to define inversion because it is less susceptible to estimate error, and has been a timelier indicator of recessions, than the more frequently cited 2-year/10-year segment. We have argued before that the unprecedentedly large negative 10-year term premium makes the curve more prone to invert and makes it a less sensitive economic barometer, but part of the rationale of creating a checklist is to limit one’s discretion in interpreting events. Chart 3More Rate Cuts, Please
More Rate Cuts, Please
More Rate Cuts, Please
The Rates Checklist: Inflation Inflation has gone AWOL around the globe. Although the U.S. no longer faces the negative output gaps that remain in other major economies, its main measures of consumer prices (Chart 4) do nothing to counteract the widespread view that the Fed has a free pass to devote its energies to shoring up growth. Inflation break-evens were making progress toward the 2.3-2.5% range consistent with the Fed’s 2% inflation target when we launched the checklist last year, but the plunge in oil prices stopped them in their tracks (Chart 5). Rather than encouraging the Fed to hike, soft inflation expectations helped drive the Fed’s dovish pivot. Chart 4Realized Inflation Is Below Target, ...
Realized Inflation Is Below Target, ...
Realized Inflation Is Below Target, ...
Chart 5... And So Are Inflation Expectations
... And So Are Inflation Expectations
... And So Are Inflation Expectations
Our view that the seeds of inflation pressures have been sown has not changed. After slowing on a real final domestic demand basis in the first quarter from the one-two punch of the government shutdown and the fourth quarter’s sharp tightening of financial conditions, the U.S. economy has resumed operating above capacity. Though we check the “sluggish-inflation” boxes, and acknowledge that inflation is not going to inspire a more restrictive turn in Fed policy any time soon, we do think it will become an issue down the road. The Rates Checklist: The Labor Market The labor market remains robust. The headline unemployment rate remains at a level last seen in 1969, and is well below the CBO’s estimate of NAIRU. NAIRU is the minimum structural unemployment rate, and wage gains quicken when the unemployment rate falls below it (Chart 6). The broader definition of unemployment, encompassing discouraged workers and involuntary part-time workers, fell to its lowest level since 2000 in July (Chart 7), and the job openings and job quits rates (Chart 8) indicate that demand for workers remains high. Chart 6Wage Gains Will Accelerate, ...
Wage Gains Will Accelerate, ...
Wage Gains Will Accelerate, ...
Chart 7... As Slack Has Been Absorbed, ...
... As Slack Has Been Absorbed, ...
... As Slack Has Been Absorbed, ...
Chart 8... And Demand Is Robust
... And Demand Is Robust
... And Demand Is Robust
Chart 9
3.2% year-over-year growth in average hourly earnings may not be thrilling, but wages do remain in an uptrend. The laws of supply and demand (Chart 9), and the Fed’s best efforts, suggest that the uptrend will continue. We do not check any of the labor market boxes, and expect that we will not over the rest of the year. The Rates Checklist: Instability At Home And Abroad Chart 10No Overheating Yet
No Overheating Yet
No Overheating Yet
There continue to be no signs of cyclical overheating in the U.S. economy, as the most cyclical segments of the economy are nowhere near the red end of the tachometer (Chart 10). Financial imbalances have moved to the back burner, but they are part of the Fed’s post-crisis mandate, and we are leaving the imbalances box unticked to reflect that the “low spreads and loosening credit terms” Governor Brainard decried last September2 may stay the Fed from embarking on a full-on easing cycle. We are checking the international duress box, at least for the time being, given the potential for a self-reinforcing rate-cutting cycle that could hold down the entire term structure of rates around the world. Bottom Line: The inverted yield curve, a lack of consumer price inflation, and the cloud cast by the trade war all suggest that bond markets will require some convincing before they allow rates to rise much higher. We conclude that a neutral duration stance is appropriate in the near term. Keeping Score We have been staunch supporters of below-benchmark duration positioning since the end of last July,3 given that we thought the 10-year Treasury yield was too low relative to our assessment of the strength of the U.S. economy and the potential for inflation to begin to rise. It appears that our stronger-than-consensus economic view was correct, but we were myopic in failing to grasp how punk growth in the rest of the world would keep long-maturity Treasury yields from making a sustained move higher. We were way early on inflation’s ETA, and slow to grasp how sensitive the Fed would be to faltering global growth and escalating trade tensions in its absence. In short, both our model of the Fed’s reaction function and the inputs to our model turned out to be faulty. The duration call stings, but our asset allocation recommendations have worked out. The fix we are making is to wait until inflation is a clear and present danger before assuming that the Fed will respond to it. Although we got the duration call wrong, investment-grade and high-yield corporate bonds have outperformed Treasuries in the aggregate since we upgraded them to overweight versus Treasuries at the end of January (Chart 11). BCA as a house niftily sidestepped the fourth-quarter selloff in equities by downgrading them to equal weight, and raising cash to overweight, late last June. We upgraded equities to overweight versus cash and fixed income in our first publication of the year, and the S&P 500 has handily outperformed Treasuries since that date, despite the nasty selloff following the July FOMC meeting and the new round of tariffs (Chart 12). Chart 11Spread Product Has Modestly Outperformed Treasuries, ...
Spread Product Has Modestly Outperformed Treasuries, ...
Spread Product Has Modestly Outperformed Treasuries, ...
Chart 12... But Equities Have Crushed Them
... But Equities Have Crushed Them
... But Equities Have Crushed Them
Agency Mortgage REIT Implications We recommended agency mortgage REITs a day before the FOMC meeting, suggesting that investors allocate capital away from equities and high yield as a way to reduce equity beta and boost portfolio income away from the herd chasing lower and lower high-yield bond yields. Through Thursday’s close, the Bloomberg Mortgage REIT Index has gained about 35 bps on a total return basis, while the Barclays High Yield Index is off 70 bps and the S&P 500 is down 2.7%. Unfortunately, the agency mREITs we sought out for their yield curve exposure have lagged badly as the yield curve has relentlessly flattened. For now, only the one agency mREIT with a dedicated adjustable-rate mortgage portfolio faces immediate earnings pressure. The rest are subject to refinancing volumes, which are likely to be higher than we expected when we projected that the 10-year Treasury yield wouldn’t fall much below 2%. The specter of increased prepayments makes the agency mREITs a less attractive investment than we thought they would be two weeks ago. On the other hand, their exclusively domestic exposure, and low credit risk, increases their value as a haven from global turmoil. Net-net, we are sticking with them, though they are now on a far shorter leash than they were when we made the recommendation. We will not stick with a position to save face, or to avoid looking irresolute. Flexibility and a willingness to admit mistakes are essential characteristics of successful investors. When the facts change, we change our mind, without the faintest hint of embarrassment. Doug Peta, CFA Chief U.S. Investment Strategist dougp@bcaresearch.com Footnotes 1 Please see the July 24, 2018 U.S. Bond Strategy Special Report, “The Golden Rule Of Bond Investing,” available at usbs.bcaresearch.com. 2 Brainard, Lael (2018). “What Do We Mean by Neutral And What Role Does It Play in Monetary Policy,” speech delivered at the Detroit Economic Club, Detroit, Mich., September 12, 2018. 3 Please see the July 30, 2018 U.S. Investment Strategy Weekly Report, “The Rates Outlook,” available at usis.bcaresearch.com.
Dear Client, In case you missed it in real time, please listen to a replay of this quarter’s webcast ‘The Investment World in 5 Charts and 18 Minutes’ available at eis.bcaresearch.com. Also please note that we will be taking a summer break, so our next report will come out on August 22. Dhaval Joshi Highlights The aggregate equity market will go nowhere for the remainder of this year – as the sell-offs from a down-oscillation in growth fight the rallies from the valuation boost given by ultra-low bond yields. But there will be sector and regional losers and winners. Economically-sensitive ‘value’ sectors will be the losers, specifically Industrials and Semiconductors. Defensive ‘growth’ sectors will be the relative winners, specifically Healthcare. Continue to overweight European equities versus Chinese equities. Feature Chart of the WeekThe Global Bond Yield Is Within A Whisker Of An All-Time Low
The Global Bond Yield Is Within A Whisker Of An All-Time Low
The Global Bond Yield Is Within A Whisker Of An All-Time Low
This week the global long bond yield came within a whisker of the all-time low reached after the shock vote for Brexit in June 2016 (Chart of the Week). By definition, this means that the aggregate bond market has gone nowhere for several years. Since the autumn of 2017, the aggregate equity market has also gone nowhere, with no rally or sell-off lasting more than three months (Chart I-2).1 Chart I-2Since October 2017, No Rally Or Sell-Off Has Lasted More Than Three Months
Since October 2017, No Rally Or Sell-Off Has Lasted More Than Three Months
Since October 2017, No Rally Or Sell-Off Has Lasted More Than Three Months
The correct strategy then has been to sell the equity market’s three month rallies and buy the three month sell-offs. In June we predicted that equities would end the year at broadly the same level as then, but that they would experience a dip of at least 4-5 percent along the way. We are now experiencing the dip. The correct strategy has been to sell the three month rallies and buy the three month sell-offs. But isn’t the global bond yield approaching an all-time low a good thing for the economy and equity market? The answer is yes, and no. Yes, the ultra-low level of yields is a boon for the valuation of risk-assets. However, when it comes to credit-sourced economic growth, what matters is not the level of the bond yield, nor its direction, so much as its rate of change. If Bond Yields Decline At A Reduced Pace, Growth Slows Many people struggle to understand this subtle and counterintuitive point. If the bond yield declines, but at a reduced pace, it can slow credit-sourced growth. To understand why, imagine that in a certain period, a -0.5 percent decline in the bond yield added €50 billion to credit creation. This would constitute additional economic demand. If, in the following period, a further -0.5 percent yield decline added another €50 billion of credit-sourced demand, it would constitute the same amount of additional demand – which is to say, the same growth – as in the first period. By comparison, a -0.25 percent yield decline which added €25 billion to demand would result in the growth rate halving. The subtle and counterintuitive point is that the bond yield has continued to decline, yet it has caused credit-sourced growth to slow! Chart I-3In China, The Bond Yield's Peak Rate Of Decline Happened 6 Months Ago
In China, The Bond Yield's Peak Rate Of Decline Happened 6 Months Ago
In China, The Bond Yield's Peak Rate Of Decline Happened 6 Months Ago
This counterintuitive dynamic has unfolded in the global economy this year. Although bond yields have been heading lower, the peak rate of decline – notably in China – happened six months ago. Meaning that credit-sourced growth has almost certainly slowed (Chart I-3). Amplifying this down-oscillation in growth, geopolitical storm clouds are now regathering over the global economy. In the early part of this year, trade tensions and currency wars between the major economic blocs seemed to dissipate, the Middle East was quiet, and the Brexit deadline was postponed. But the lull was temporary. The geopolitical headwinds to growth are now strengthening with a vengeance. That’s the bad news. Equity Valuations Are Hyper-Sensitive To Low Bond Yields Now the good news. While the level of bond yields does not drive economic growth, it does drive the valuations of equities and other risk-assets. Moreover, it does so in a powerful non-linear way. Below a threshold level, ultra-low bond yields can give the valuation of equities an exponential boost. Geopolitical storm clouds are now regathering over the global economy. We refer readers to our other reports for the details, but in a nutshell at ultra-low bond yields the risk of owning bonds converges to the risk of owning equities. The upshot of this risk convergence is that investors price equities to deliver the same feeble nominal return as bonds, meaning that the valuation of equities soars (Chart I-4).2 Chart I-4The Valuation Of Equities Is Back To The Peak Level Of 2000 And 2007
The Valuation Of Equities Is Back To The Peak Level Of 2000 And 2007
The Valuation Of Equities Is Back To The Peak Level Of 2000 And 2007
Theoretically and empirically, this threshold level of the bond yield is in the region of 2 percent. And the bond yield that matters is the global long bond yield, defined as the simple average of the 10-year yields of the U.S., the euro area, and China. To simplify matters, we can proxy the 10-year yield of the aggregate euro area with the 10-year yield of France. So calculate the simple average of the 10-year yields of the U.S., France, and China. A value rising towards 2.5 percent equates to danger for equity valuations. A value falling below 2.0 percent equates to an underpinning for equity valuations. Today, the value stands near 1.5 percent creating a good support for equity and risk-asset valuations. The upshot is that the aggregate equity market will go nowhere for the remainder of this year – as the sell-offs from the down-oscillation in growth fight the rallies from the valuation boost given by ultra-low bond yields. But there will be sector losers and winners. Essentially, economically-sensitive ‘value’ sectors will be the losers while defensive ‘growth’ sectors will be the relative winners. Put simply, the sector trends present during the last up-oscillation in global growth are likely to unwind if they have not already done so. In which case, the sectors most likely to suffer underperformance are: Industrials and Semiconductors (Chart I-5). Chart I-5Industrials Outperformed Strongly... But Are Now Underperforming
Industrials Outperformed Strongly... But Are Now Underperforming
Industrials Outperformed Strongly... But Are Now Underperforming
And the sector most likely to see (continued) outperformance is: Healthcare. There will also be regional losers and winners. This is because regional equity market relative performance just follows from sector relative performance combined with each region’s sector ‘fingerprint’. Bear in mind that a fingerprint can be defined not just by overweight sectors but also by underweight sectors, such as the Shanghai Composite’s negligible weighting in Healthcare, making the Chinese index ultra-cyclical. Continue to overweight European equities versus Chinese equities (Chart I-6). Chart I-6Overweight Europe Versus China
Overweight Europe Versus China
Overweight Europe Versus China
Market Dislocations And Recessions: Cause And Effect As investment strategists, our primary focus should be the financial markets rather than the economy. On this basis, we define a major dislocation in terms of the markets: an episode in which equities underperform bonds by more than 20 percent over a period of more than six months. There have been three such episodes in the twenty-first century.3 Yet our market based definition of a major dislocation also perfectly captures the three last times that the European economy went into recession or near-recession. Does this mean that the recessions caused the financial market dislocations? No. Quite the reverse. The twenty-first century’s recessions have all resulted from financial market dislocations. The twenty-first century’s recessions have all resulted from the financial market dislocations that followed market distortion or mispricing: the bubble valuations of the technology, media and telecom sectors in 2000 (Chart I-7); the mispricing of U.S. mortgages and credit in 2007 (Chart I-8); and the mispricing of euro area sovereign credit risk in 2011 (Chart I-9). Therefore, the major dislocations in the financial markets have always preceded the recessions and near-recessions, sometimes by several quarters, even when both are measured in real time. Chart I-7The Twenty First Century Recessions Stemmed From Financial Market Distortions: The Dot Com Bubble In 1999/2000...
The Twenty First Century Recessions Stemmed From Financial Market Distortions: The Dot Com Bubble In 1999/2000...
The Twenty First Century Recessions Stemmed From Financial Market Distortions: The Dot Com Bubble In 1999/2000...
Chart I-8...The Mispricing Of U.S.##br## Mortgages And Credit In##br## 2007/2008...
...The Mispricing Of U.S. Mortgages And Credit In 2007/2008...
...The Mispricing Of U.S. Mortgages And Credit In 2007/2008...
Chart I-9...And The Mispricing Of Euro Area Sovereign Credit Risk In 2010/2011
...And The Mispricing Of Euro Area Sovereign Credit Risk In 2010/2011
...And The Mispricing Of Euro Area Sovereign Credit Risk In 2010/2011
Today, the consensus overwhelmingly believes that a recession will cause the next major dislocation in financial markets. But history has taught us time and time again that the causality is much more likely to run the other way. Hence, a major dislocation in the financial markets – should one occur – will cause the next recession. And not the other way round! Fractal Trading System* The nickel price has surged on continued fears over Indonesian exports bans. But from a technical perspective the recent surge is excessive and susceptible to a reversal on any easing of the fears. Accordingly, this week’s trade is short nickel versus copper, setting a profit target of 10 percent with a symmetrical stop-loss. In other trades, short ASX200 versus FTSE100 hit its 2 percent stop-loss, but short MSCI All-Country World has moved well into profit. For any investment, excessive trend following and groupthink can reach a natural point of instability, at which point the established trend is highly likely to break down with or without an external catalyst. An early warning sign is the investment’s fractal dimension approaching its natural lower bound. Encouragingly, this trigger has consistently identified countertrend moves of various magnitudes across all asset classes. Chart I-10Short Nickel, Long Copper
Short Nickel, Long Copper
Short Nickel, Long Copper
The post-June 9, 2016 fractal trading model rules are: When the fractal dimension approaches the lower limit after an investment has been in an established trend it is a potential trigger for a liquidity-triggered trend reversal. Therefore, open a countertrend position. The profit target is a one-third reversal of the preceding 13-week move. Apply a symmetrical stop-loss. Close the position at the profit target or stop-loss. Otherwise close the position after 13 weeks. Use the position size multiple to control risk. The position size will be smaller for more risky positions. * For more details please see the European Investment Strategy Special Report “Fractals, Liquidity & A Trading Model,” dated December 11, 2014, available at eis.bcaresearch.com. Dhaval Joshi, Chief European Investment Strategist dhaval@bcaresearch.com Footnotes 1 We define the global long bond yield as the simple average of the 10-year yields in the U.S., euro area, and China. And to make things simple, France provides a good proxy for the euro area long bond yield. 2 Please see the European Investment Strategy Weekly Report “Risk: The Great Misunderstanding Of Finance”, October 25, 2018 available at eis.bcaresearch.com. 3 Based on the relative performance of the MSCI All Country World Index versus the JP Morgan Global Government Bond Index, both in local currency terms. Fractal Trading System Cyclical Recommendations Structural Recommendations Closed Fractal Trades Trades Closed Trades Asset Performance Currency & Bond Equity Sector Country Equity Indicators Bond Yields Chart II-1Indicators To Watch - Bond Yields
Indicators To Watch - Bond Yields
Indicators To Watch - Bond Yields
Chart II-2Indicators To Watch - Bond Yields
Indicators To Watch - Bond Yields
Indicators To Watch - Bond Yields
Chart II-3Indicators To Watch - Bond Yields
Indicators To Watch - Bond Yields
Indicators To Watch - Bond Yields
Chart II-4Indicators To Watch - Bond Yields
Indicators To Watch - Bond Yields
Indicators To Watch - Bond Yields
Interest Rate Chart II-5Indicators To Watch - Interest Rate Expectations
Indicators To Watch - Interest Rate Expectations
Indicators To Watch - Interest Rate Expectations
Chart II-6Indicators To Watch - Interest Rate Expectations
Indicators To Watch - Interest Rate Expectations
Indicators To Watch - Interest Rate Expectations
Chart II-7Indicators To Watch - Interest Rate Expectations
Indicators To Watch - Interest Rate Expectations
Indicators To Watch - Interest Rate Expectations
Chart II-8Indicators To Watch - Interest Rate Expectations
Indicators To Watch - Interest Rate Expectations
Indicators To Watch - Interest Rate Expectations
The Fed cut rates by 25 basis points last week, a move that Chairman Powell described as an “insurance” cut meant to counter the risks from trade tensions and global growth weakness. Powell also described the move as a “mid-cycle adjustment to policy” and not…
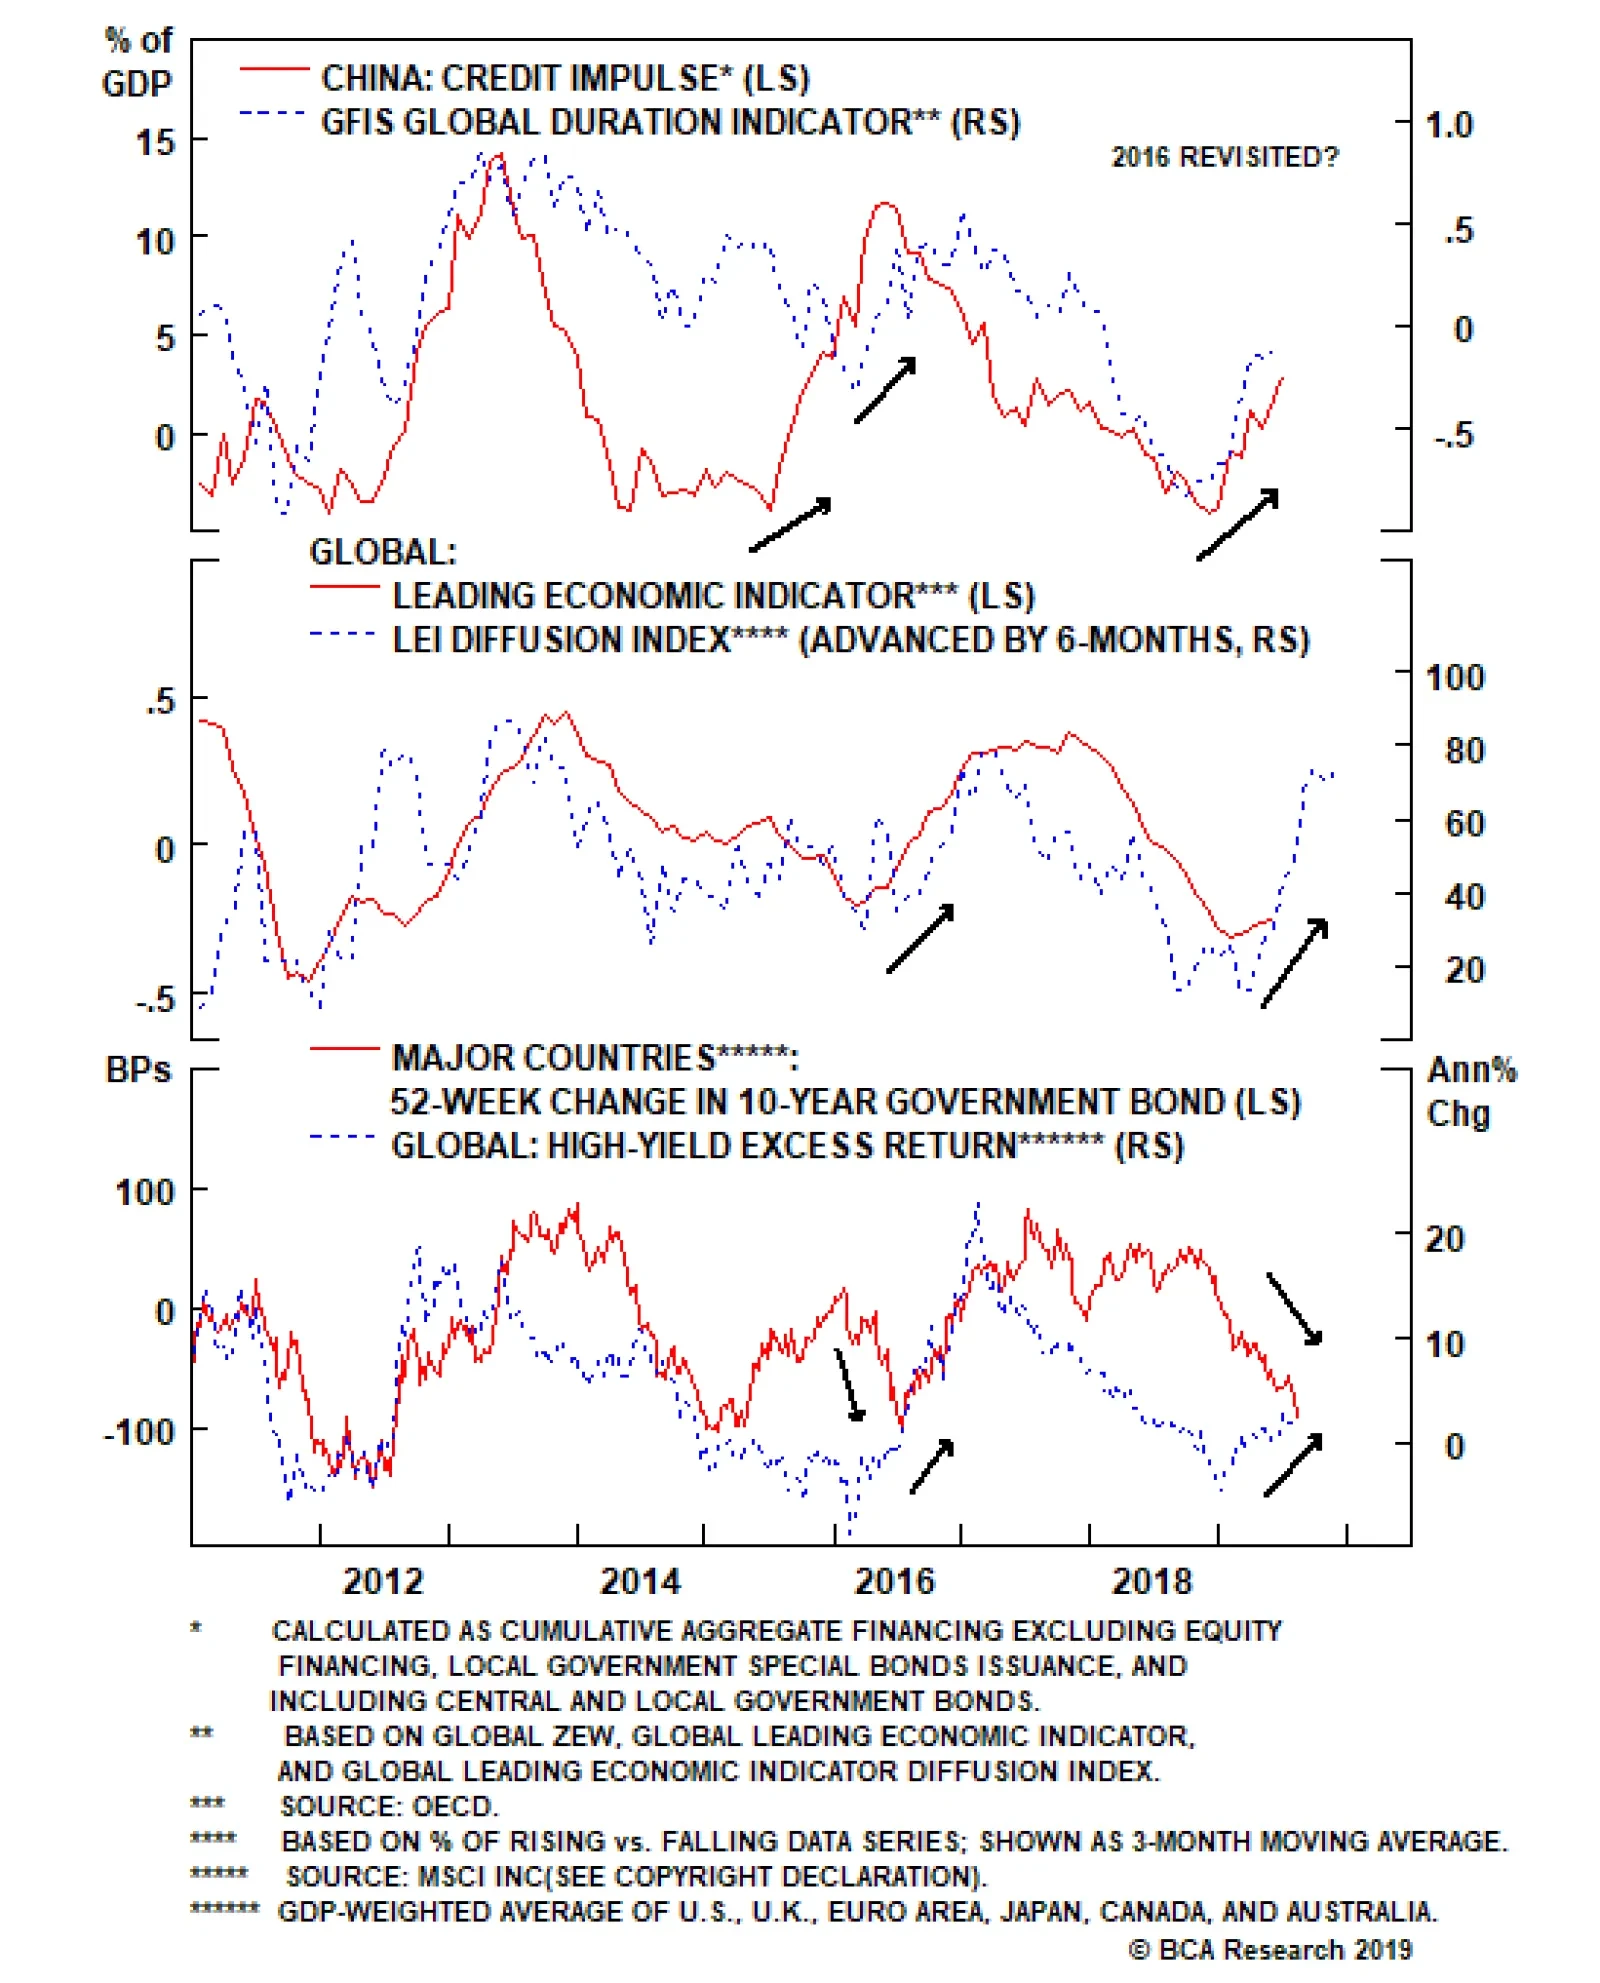
Early leading indicators are flashing a future bottoming of global growth. Several of the more reliable leading economic signals, like our global LEI diffusion index and the China credit impulse, are both flashing the potential for a rebound in global growth…
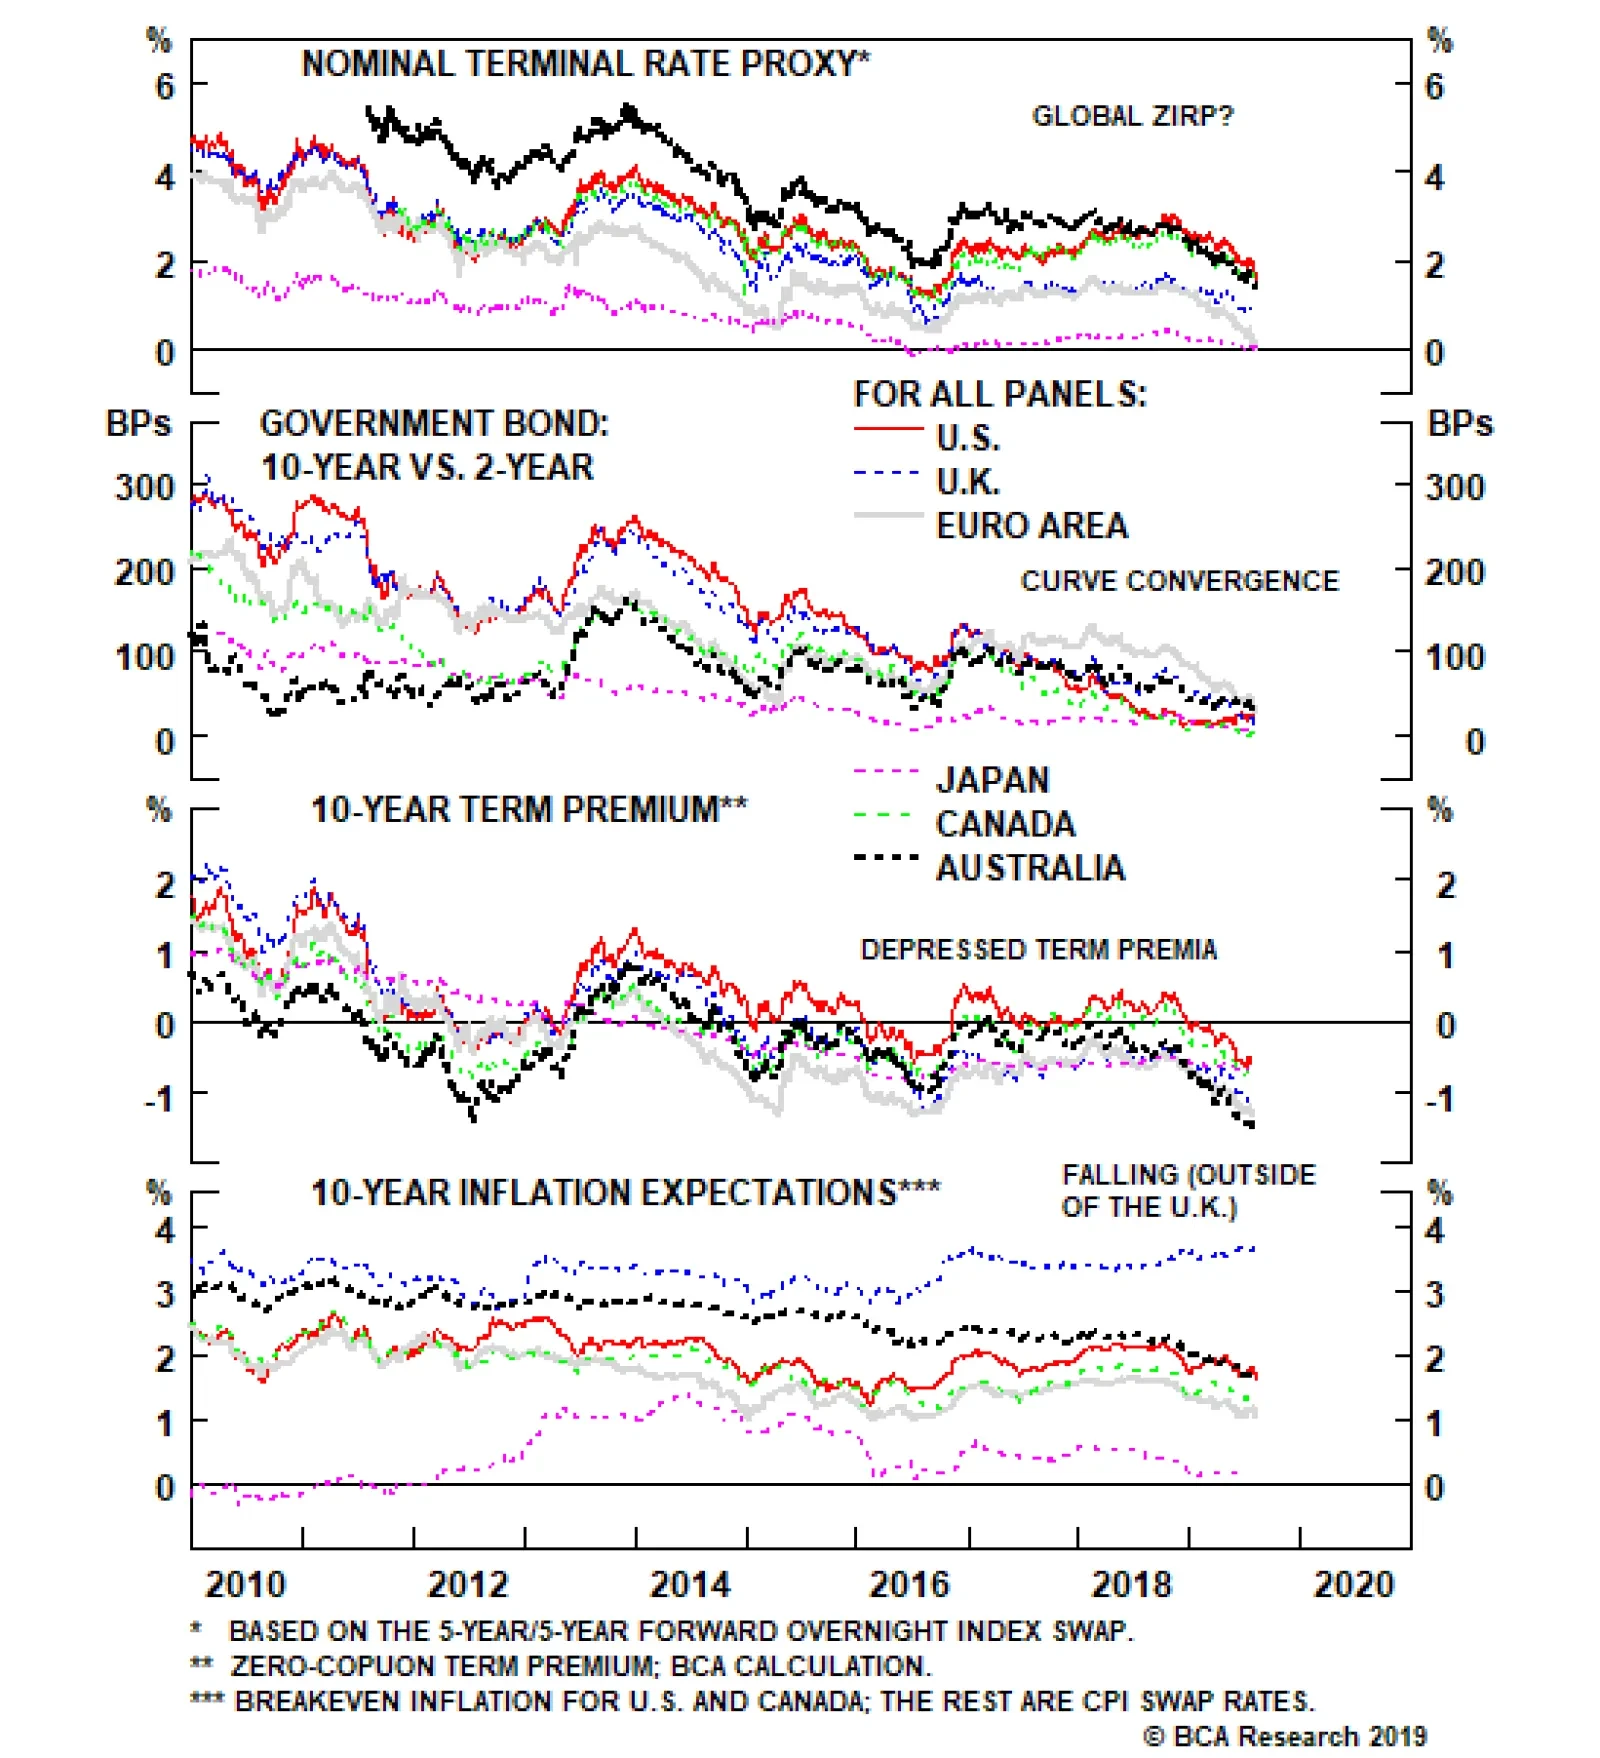
A lot of bad news is already discounted in global bond yields. The rally in government bond markets this year has pushed bond yields down to stretched levels using typical valuation metrics like the 5-year OIS rate, 5-years forward; the term premium on…
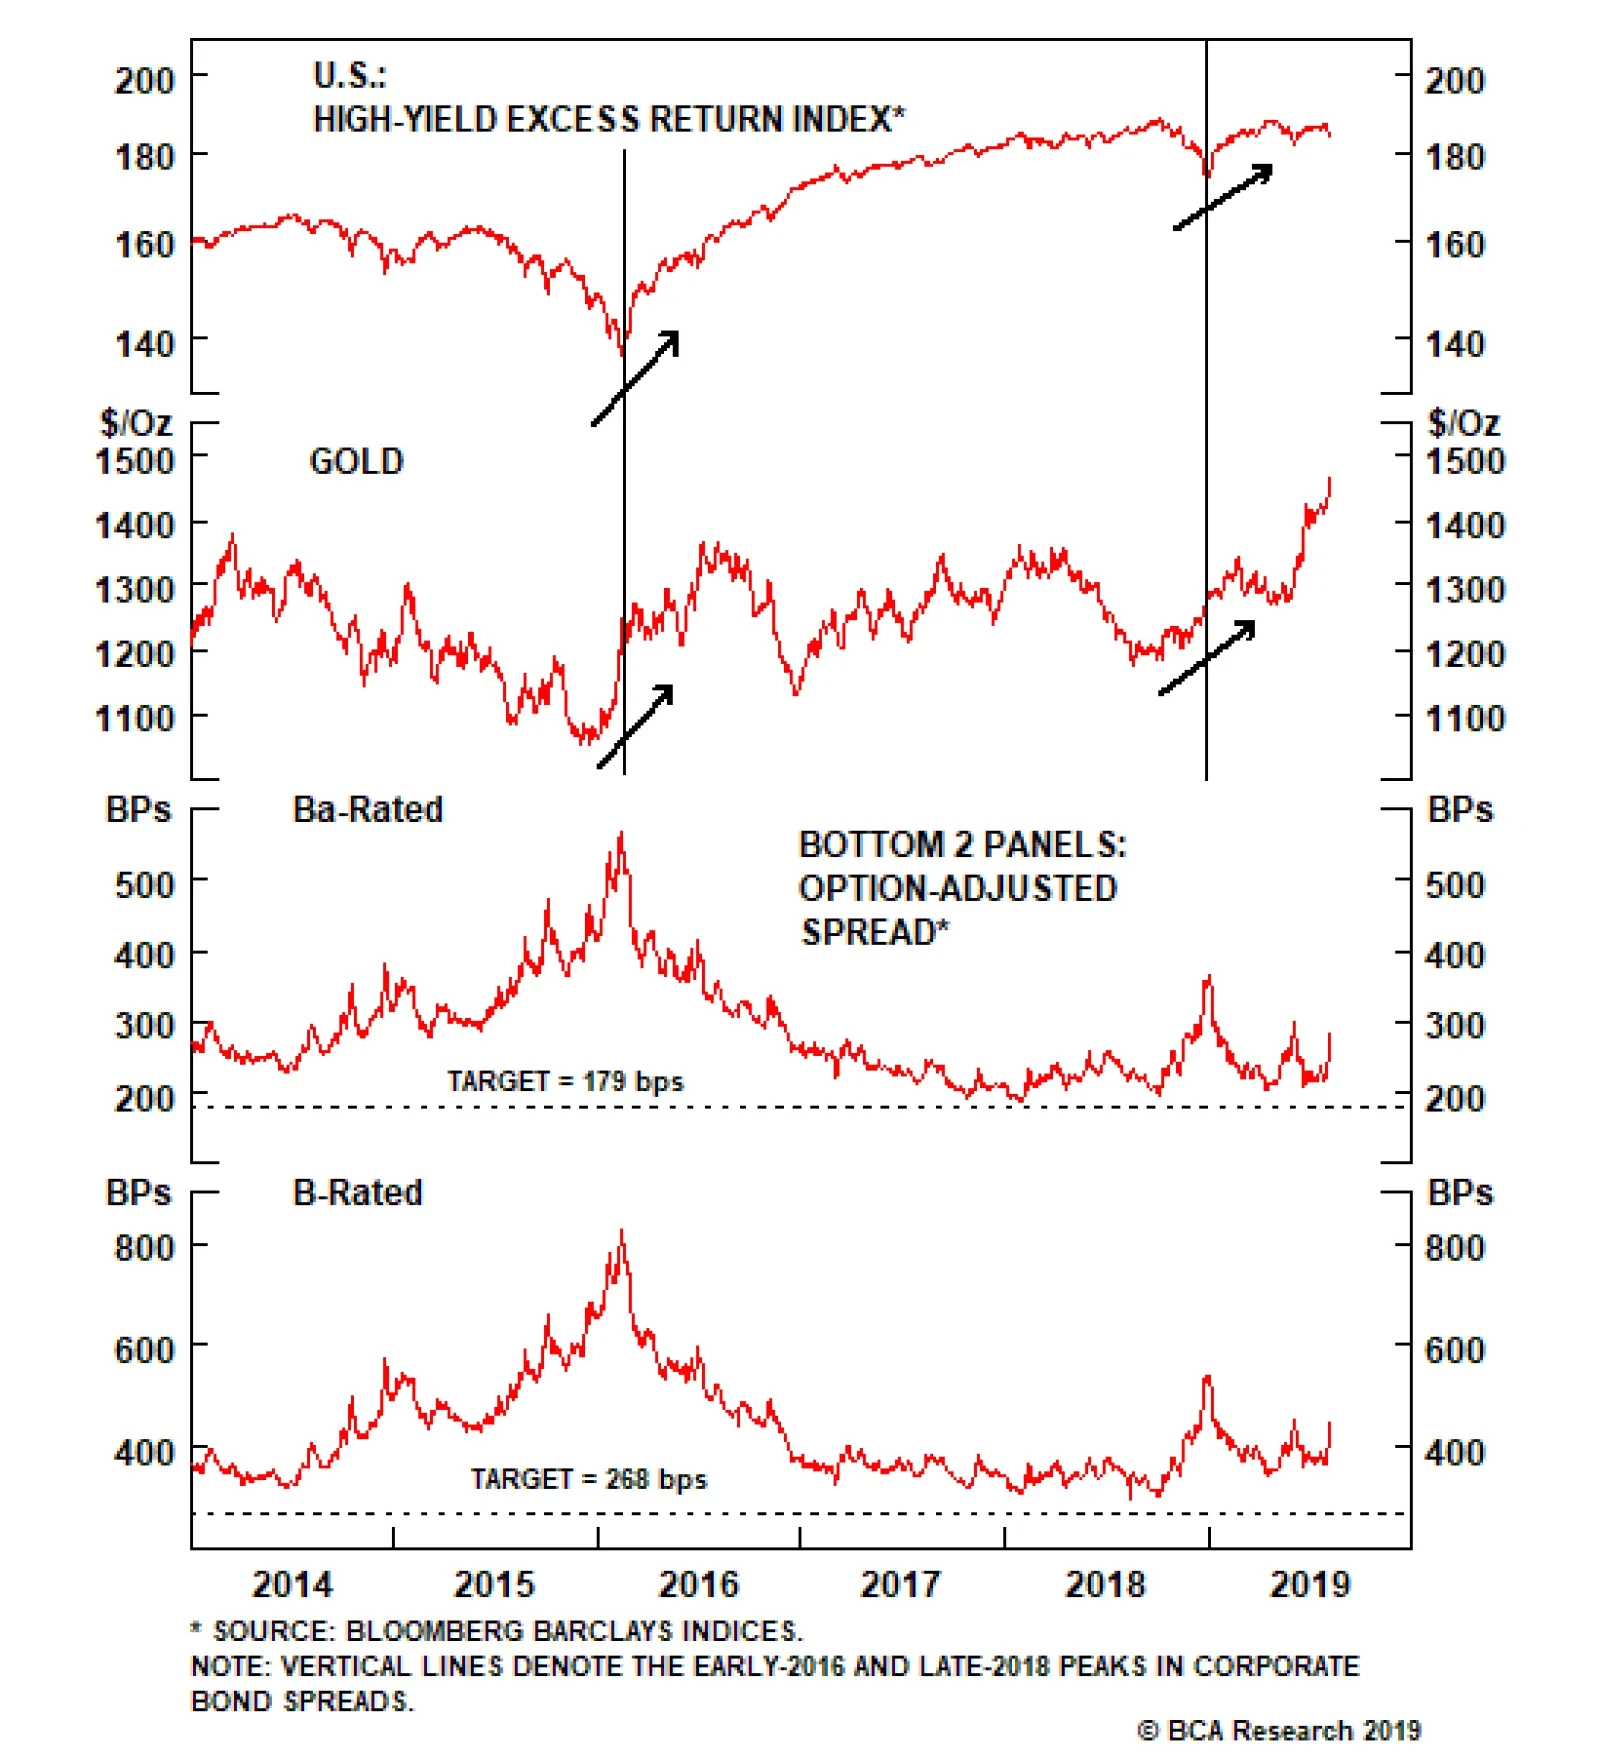
The average U.S. High-Yield index option-adjusted spread has widened sharply in the past few days, from 371 bps at the end of July to 431 bps currently. We are inclined to view the recent spread widening as fleeting. The Fed remains committed to…
Highlights Chinese economic growth slowed in June & July, but at a more moderate pace than had been the case earlier this year. The housing market is a notable exception, which appeared in June to slow in a broad-based fashion. The near-term (0-3 month) outlook is bearish for China-related assets, and investors should bet on further weakness in the RMB. However, investors should remain cyclically bullish (i.e., over a 6-12 month time horizon) in anticipation of an eventual reflationary response from Chinese policymakers that will boost domestic demand enough to offset the intensifying drag from weak external demand. Feature Tables 1 and 2 on pages 2 and 3 highlight key developments in China’s economy and its financial markets over the past month. On the growth front, coincident measures of economic activity suggest that China’s economy experienced “controlled weakness” in June and July: growth continued to slow, but at a more moderate pace than had been the case in late-2018 and early-2019. The housing market appeared to be the exception to this relative stability; all 10 of the core housing indicators that we track decelerated in June, suggesting that a moderation in housing-related activity was broad-based. This implies that a further slowdown in construction is likely over the coming months, barring a meaningful pickup in sales. Table 1China Macro Data Summary
China Macro And Market Review
China Macro And Market Review
Table 2China Financial Market Performance Summary
China Macro And Market Review
China Macro And Market Review
Within financial markets, all of the key developments have occurred over the past several trading days, in response to President Trump’s threat last week to further hike U.S. import tariffs at the beginning of September. Both investable and domestically-listed Chinese stocks have significantly underperformed the global benchmark, as have Hong Kong stocks in response to intensifying protests in the city. A sharp decline in the RMB and the U.S. designation of China as a currency manipulator have unnerved Chinese and global investors, and our bias is to expect even further weakness in the yuan. The near-term outlook remains bearish for China-related assets, as we see the selloff over the past week as the beginning of a financial market riot point that will force policymakers, both in China and the U.S., to address the economic weakness that a full-tariff scenario will entail. The near-term outlook remains bearish for China-related assets, as we see the selloff over the past week as the beginning of a financial market riot point that will force policymakers, both in China and the U.S., to address the economic weakness that a full-tariff scenario will entail. Still, investors should remain cyclically bullish in anticipation of an eventual reflationary response from Chinese policymakers that will boost domestic demand enough to offset the drag from weak external demand. Otherwise stated, we expect Chinese relative performance to trend lower in the near-term, but to be higher 12-months from today. Investors should also continue to hedge the inherent RMB exposure from a long US$ cyclical position in Chinese stocks with a long USD-CNH position. In reference to Tables 1 and 2, we provide below several detailed observations concerning developments in China’s macro and financial market data: Our leading indicator for the Li Keqiang Index is now in a clear uptrend, most recently led by a meaningful improvement in monetary conditions and credit growth. Chart 1Our Leading Indicator Is Now In A (Moderate-Strength) Uptrend
Our Leading Indicator Is Now In A (Moderate-Strength) Uptrend
Our Leading Indicator Is Now In A (Moderate-Strength) Uptrend
Chart 2Money, And Still-Modest Credit Growth, Are Holding Back Our Leading Indicator
Money, And Still-Modest Credit Growth, Are Holding Back Our Leading Indicator
Money, And Still-Modest Credit Growth, Are Holding Back Our Leading Indicator
The Li Keqiang index (LKI) rose moderately in June after a significant decline in May, but remains in a downtrend (Chart 1). The June increase was driven entirely by a pickup in electricity production (which had nearly contracted in May); bank loan growth and rail cargo volume both decelerated. The takeaway for investors is that while the Chinese economy did not slow meaningfully further in June, the pace of growth remained tepid, suggesting the economic activity remains vulnerable to a further increase in U.S. import tariffs. Our leading indicator for the LKI is now in a clear uptrend, most recently led by a meaningful improvement in monetary conditions and credit growth (Chart 2). However, the magnitude of the rise in the indicator is being held back by growth in the money supply, which has only slightly accelerated over the past few months, as well as a “half strength” recovery in credit. Our view is that Chinese policymakers are likely to wait for further economic weakness before allowing money & credit growth to significantly overshoot, which increases the odds of a continued market riot in the short-term. Chart 3Decelerating House Price Appreciation Is Coming
Decelerating House Price Appreciation Is Coming
Decelerating House Price Appreciation Is Coming
All 10 of the housing indicators shown in Table 1 decelerated in June, suggesting that a moderation in housing-related activity was broad-based. Our BCA 70-city diffusion index for (YoY) house prices has an excellent track record at leading inflection points in overall price growth (Chart 3), and is currently suggesting that house price appreciation is at risk of falling back to mid-2018 levels (which would imply a 5-6 percentage point deceleration). Continued weakness in floor space sold continues to suggest that the ongoing pace of housing construction is unsustainable; we expect a further moderation in floor space started over the coming several months barring a meaningful pickup in sales. Both the Caixin and official manufacturing PMI for China rose in July, including the official new export orders component (which we have been closely following). However, the survey was taken prior to President Trump’s renewed tariff threat last week, and we expect the July gains to reverse in August barring a major de-escalation in the conflict. Both investable and domestically-listed Chinese stocks have significantly underperformed the global benchmark over the past week due to President Trump’s threat to impose tariffs on all remaining imports from China. We noted in our May 29 weekly report that a financial market riot point remained likely over the coming few months,1 and we explicitly recommend an underweight position in Chinese stocks for the remainder of 2019 in last week’s report.2 Still, investors should remain cyclically bullish in anticipation of an eventual reflationary response from Chinese policymakers that will boost domestic demand enough to offset the drag from weak external demand. Investors who are already positioned in favor of Chinese stocks should stay long, despite the likelihood of further near-term losses. Investors should remain cyclically bullish in anticipation of an eventual reflationary response from Chinese policymakers that will boost domestic demand enough to offset the drag from weak external demand. Chart 4Intensifying Protests Have Weighed On Hong Kong's Relative Equity Performance
Intensifying Protests Have Weighed On Hong Kong's Relative Equity Performance
Intensifying Protests Have Weighed On Hong Kong's Relative Equity Performance
The MSCI Hong Kong index has also significantly underperformed the global benchmark since late-July, in response to intensifying protests in the city (Chart 4). The protests have been driven by underlying socio-economic factors as well as Beijing’s encroachment on traditional political liberties. However, Hong Kong has no real alternative to Beijing’s sovereignty, and the unrest should gradually die down as long as the imposition of martial law is avoided. Nonetheless, Hong Kong’s stock market is likely to remain under pressure in the interim; for now, we recommend that investors stay underweight versus China and Taiwan. The sector performance within China’s investable and domestically-listed equity markets over the past month has largely been along cyclical / defensive lines. In the investable market, consumer staples, health care, financials, information technology, communication services, and utilities have all outperformed, in contrast to energy, materials, industrials, consumer discretionary, and real estate stocks. The pattern has been similar in the domestic market, with two exceptions: modest staples underperformance, and material underperformance of comm services. Real estate stocks have been among the worst performers in both markets over the past month, possibly in response to the deteriorating housing market data that we highlighted above. China’s 3-month repo rate has fallen approximately 20 bps over the past month, and is now back close to its one-year low. We continue to believe that a cut to the benchmark lending rate is unlikely in the near-term, but could occur in Q4 if economic conditions in China weaken materially further. Chinese onshore corporate spreads increased modestly over the past month, but have not yet risen to a new high for the year. The uptrend in spreads that began in late-May does reflect renewed risks to the Chinese economy from a further increase in U.S. import tariffs, but annualizing the most recent pace of onshore corporate defaults suggests that onshore bond spreads are still much too high. Our long China onshore corporate bond trade continues to register gains in local currency terms (Chart 5), and we recommend that investors stick with a long/overweight currency-hedged stance. Our bias is to bet on further RMB weakness until policymakers aggressively ramp up their reflationary efforts. The yuan weakened sharply this week, with the U.S. dollar breaking above 7 versus both the onshore and offshore RMB (Chart 6). This is the weakest level for the currency since the global financial crisis, and the decline has clearly occurred in response to last week’s tariff threat. We noted in our May 15 report that a meaningful decline in the exchange rate would likely be required in order to stabilize the outlook for earnings & the economy,3 and we recommended at that time that investors should hedge the inherent RMB exposure from a long US$ cyclical position in Chinese stocks by opening a long USD-CNH trade. It is difficult to forecast how much further the RMB is likely to fall, but our bias is to bet on further weakness until policymakers aggressively ramp up their reflationary efforts. Stay tuned. Chart 5Despite Ongoing Default Concerns, Onshore Corporate Bonds Are Winners
Despite Ongoing Default Concerns, Onshore Corporate Bonds Are Winners
Despite Ongoing Default Concerns, Onshore Corporate Bonds Are Winners
Chart 6Weakest RMB In A Decade, And Further Declines Are Likely
Weakest RMB In A Decade, And Further Declines Are Likely
Weakest RMB In A Decade, And Further Declines Are Likely
Jonathan LaBerge, CFA, Vice President Special Reports jonathanl@bcaresearch.com Jing Sima China Strategist jings@bcaresearch.com 1 Please see China Investment Strategy Weekly Report, “Waiting For The Pain,” dated May 29, 2019. 2 Please see China Investment Strategy Weekly Report, “Threading A Stimulus Needle (Part 2): Will Proactive Fiscal Policy Lose Steam?” dated July 24, 2019. 3 Please see China Investment Strategy Weekly Report, “Simple Arithmetic,” dated May 15, 2019. Cyclical Investment Stance Equity Sector Recommendations
Highlights U.S.-China: The escalation of the trade war has renewed investor fears that uncertainty could create an even deeper drag on global growth, requiring a more aggressive easing of global monetary policy. Fed: The Fed had an opportunity last week to regain control of monetary policy from the markets, but opted for only a cautious rate cut that came off as too hawkish. The FOMC will be forced to play defense in the next 3-6 months, likely by cutting rates more than originally envisioned given the market turbulence stemming from the trade war escalation. Fixed Income Asset Allocation: Raise overall global portfolio duration to neutral on a tactical (0-3 months) basis, at least until equity markets stabilize. Maintain strategic (6-12 months) overweights to global corporate bonds, however, as global leading economic indicators are bottoming. Feature A Painful Repricing Chart of the WeekNot A Pretty Picture
Not A Pretty Picture
Not A Pretty Picture
A long-overdue correction in risk assets, or the start of something more sinister? That is the question investors must now consider. Another Twitter blast from @realDonaldTrump has triggered chaos in global financial markets, with the imposition of fresh U.S. tariffs on Chinese imports. This shattered the market calm since the June G20 meeting, when an announced truce on the U.S.-China trade dispute led to optimism that a real deal could be reached. China retaliated to the new tariffs by allowing the USD/CNY exchange rate to depreciate beyond the perceived line in the sand at 7.0. The trade news came at a bad time for financial markets, a few days after the release of soft global manufacturing PMI data for July that highlighted how global growth remains highly vulnerable to trade war developments (Chart of the Week). The Fed did not help matters by delivering an interest rate cut last week but somehow coming across as hawkish (or, at least, not dovish enough). The market response to the renewed trade tensions and yuan weakness has been classic “macro risk-off” – sharply lower government bond yields, alongside big declines in global equity markets and commodity prices (Chart 2) and increases in the value of typical safe-havens like gold and the Japanese yen (Chart 3). Chart 2Growth-Sensitive Assets Not Doing Well
Growth-Sensitive Assets Not Doing Well
Growth-Sensitive Assets Not Doing Well
Chart 3Safe Havens In Demand
Safe Havens In Demand
Safe Havens In Demand
The nature of the fall in global bond yields has been consistent with what has been seen so far in 2019 – fairly coordinated moves in terms of size, with much smaller changes seen in cross-country yield spreads. This suggests that the unobservable “global” bond yield is falling in response to deteriorating global growth expectations, rather than country-specific factors driving local bond yields. Global trade uncertainty – and what that implies for future weakness in corporate profits, investment and employment – is indeed an “external shock” for every nation. We admit that our current duration recommendations have not been aligned to benefit from these moves. Our forecasting philosophy for government bond yields is based on what our colleagues at our sister service, BCA U.S. Bond Strategy, have dubbed “The Golden Rule of Bond Investing”.1 In that framework, the primary driver of government bond market returns (excess returns over cash, to be precise) is the outcome of central bank policy moves versus what is discounted in interest rate markets. In the U.S., we have been steadfast in our expectation that the Fed would disappoint market pricing that was calling for as much as 90bps of rate cuts over the next 12 months. Global trade uncertainty – and what that implies for future weakness in corporate profits, investment and employment – is indeed an “external shock” for every nation. Chart 4Rate Cuts Required - And Discounted - Everywhere
Rate Cuts Required - And Discounted - Everywhere
Rate Cuts Required - And Discounted - Everywhere
Now, with the President giving markets the unpleasant news that a trade deal with China is not imminent, and new tariffs about to be imposed, the pressure is on the Fed to provide an offset through easier monetary policy. Some are even interpreting the timing of Trump’s latest Tariff Tweet in a Machiavellian fashion, as if he wanted to create more uncertainty to get to Fed to cut rates (and, by association, help deliver Trump’s goal of weakening the U.S. dollar). On the surface, Trump ratcheting up the trade tensions sounds like a risky economic game to play leading up to the 2020 Presidential election. Our colleagues at BCA Geopolitical Strategy, however, note that many of the leading Democratic presidential nominee contenders have themselves been pushing for a more hawkish stance on China. Trump may now feel politically emboldened to become even harder on China himself, to avoid being outflanked by the Democrats – even if it means the U.S. stock market suffers a nasty selloff as a result. Although, again, if the Fed cuts rates as a result, Trump will likely view that as a victory given his constant haranguing of Fed Chair Jay Powell over the past year. With Powell tipping his hand last week that trade uncertainty was something that could trigger additional Fed interest rate cuts, and with Trump now highly incentivized to create that uncertainty, the case for betting against the rate cuts discounted in U.S. interest rate markets has weakened – even though it is still debatable whether the U.S. economy has softened enough to justify a full-blown easing cycle. With Powell tipping his hand last week that trade uncertainty was something that could trigger additional Fed interest rate cuts, and with Trump now highly incentivized to create that uncertainty, the case for betting against the rate cuts discounted in U.S. interest rate markets has weakened Our Central Bank Monitors are now signaling a need for some easing of monetary policy in all the major developed economies, including the U.S. (Chart 4). Even though our 12-month Discounters also show that a lot of easing is already priced into Overnight Index Swap (OIS) curves in those same countries, the amount of cuts discounted is consistent with the dovish message from our Central Bank Monitors. Given the renewed trade tensions, alongside no signs of much improvement in overall global growth momentum, we are less certain at the moment that the amount of cuts discounted by markets will not be delivered. Thus, under our Golden Rule framework, a below-benchmark overall global duration stance is not warranted at this time. Therefore, this week, we are increasing our overall duration stance to neutral from below-benchmark, on a tactical basis. In our model bond portfolio on Page 10, we are implementing this view by “neutralizing” the duration exposures within each country. This is done by keeping the same total country weightings versus the benchmark index, but allocating across all maturities in line with the index weightings within each country. This adds about one-half of year of duration to the model portfolio to bring it up the same level as the benchmark index, but without altering the overall allocations to countries or spread product sectors. What To Do Beyond The Short-Term? Chart 5A Lot Of Bad News Discounted In Bond Yields
A Lot Of Bad News Discounted In Bond Yields
A Lot Of Bad News Discounted In Bond Yields
Despite the near-term concerns and volatility stemming from the increased trade tensions, we do not advocate moving to a more defensive portfolio allocation (above-benchmark duration, underweight corporate bonds) to position for a deeper global growth slowdown, for the following reasons: A lot of bad news is already discounted in global bond yields. The rally in government bond markets this year has pushed bond yields down to stretched levels using typical valuation metrics (Chart 5) like the 5-year OIS rate, 5-years forward; the term premium on 10-year yields, and market-implied inflation expectations from CPI swaps or inflation-linked bonds. Additional sustainable declines will be harder to achieve from current levels. The U.S. economy is still holding up relatively well, especially compared to other major economies. Although the U.S. manufacturing sector data has slowed, U.S. Treasury yields already are in line with the diminished readings of the ISM Manufacturing index, which is still above the 50 level signifying expanding activity (Chart 6). The non-manufacturing (services) side of the economy has not seen the same degree of slowing, while consumer confidence and retail sales have both picked up of late. Also, the mean-reverting U.S. data surprise index – which is correlated to the momentum of bond yields – is very stretched to the downside, suggesting less downside potential for Treasury yields from weak U.S. data (Chart 7). Chart 6UST Yields Consistent With Slower Manufacturing
UST Yields Consistent With Slower Manufacturing
UST Yields Consistent With Slower Manufacturing
In addition, the easing of U.S. financial conditions from the 2019 rally in U.S. equity and credit markets before the past few days does suggest a rebound in U.S. growth is likely beyond the next few months. It will take much bigger market declines than seen so far, something beyond a mere “garden-variety” correction in U.S. equities, to tighten financial conditions enough to offset the prior loosening. Chart 7Treasuries Are Vulnerable To Better Data
Treasuries Are Vulnerable To Better Data
Treasuries Are Vulnerable To Better Data
Early leading indicators are flashing a future bottoming of global growth. Several of the more reliable leading economic signals, like our global LEI diffusion index and the China credit impulse, are both flashing the potential for a rebound in global growth to begin around the end of the year (Chart 8). If Chinese policymakers choose to offset the negative domestic economic impact of the new Trump tariffs with even more stimulus measures, as seems likely, then the odds of an eventual growth rebound would improve – especially if there is also a healthy dose of monetary easing from the Fed, ECB (both rate cuts and renewed asset purchases) and other major central banks. Early leading indicators are flashing a future bottoming of global growth. Summing it all up, we see the best way to protect against the risks of an even deeper near-term selloff in risk assets is to increase duration by buying liquid government bonds, rather than reduce credit exposure by selling less liquid corporate bonds. It would take signs that the improvement in leading economic indicators is reversing to justify downgrading global corporate bond exposure. We think it more likely that we’ll be reducing our recommended duration exposure back to below-benchmark sometime in the next few months. We will be watching news on global trade, China stimulus and U.S. non-manufacturing growth before making the next change to our duration call. We see the best way to protect against the risks of an even deeper near-term selloff in risk assets is to increase duration by buying liquid government bonds, rather than reduce credit exposure by selling less liquid corporate bonds. With regards to country allocation within developed market government bonds, we are choosing to stick with our current recommendations: overweight core Europe, the U.K., Japan, Australia and Spain; underweight the U.S. and Italy; and neutral Canada (Chart 9). Those allocations have served us reasonably throughout 2019, with the bulk of the overweights outperforming the Bloomberg Barclays Global Treasury index in hedged USD terms, and the U.S. actually only just matching the global hedged benchmark (thanks to the yield pickup for non-U.S. debt from hedging currency exposure back to higher-yielding U.S. dollars). Chart 8A Light At The End Of The Tunnel?
A Light At The End Of The Tunnel?
A Light At The End Of The Tunnel?
Chart 9We're Sticking With Our Country Allocations
We're Sticking With Our Country Allocations
We're Sticking With Our Country Allocations
Only in the case of Italy, were we have maintained an underweight stance given our concerns about weak Italian growth and the implications for debt sustainability, have we seen a significant underperformance of our recommendation. At current yield/spread levels, however, we remain reluctant to simply chase higher-yielding Italian bond yields in the absence of any sign of improving Italian growth that would justify lower Italian risk premia. Bottom Line: The escalation of the trade war has renewed investor fears that trade could create an even deeper drag on global growth, requiring a more aggressive easing of global monetary policy. Raise overall global portfolio duration to neutral on a tactical (0-3 months) basis, at least until equity markets stabilize. Maintain strategic (6-12 months) overweights to global corporate bonds, however, as global leading economic indicators are bottoming. Robert Robis, CFA, Chief Fixed Income Strategist rrobis@bcaresearch.com Footnotes 1 Please see BCA U.S. Bond Strategy Special Report, “The Golden Rule Of Bond Investing”, dated July 24, 2018, available at usbs.bcaresearch.com. Recommendations The GFIS Recommended Portfolio Vs. The Custom Benchmark Index
Trade War Worries: Once More, With Feeling
Trade War Worries: Once More, With Feeling
Duration Regional Allocation Spread Product Tactical Trades Yields & Returns Global Bond Yields Historical Returns
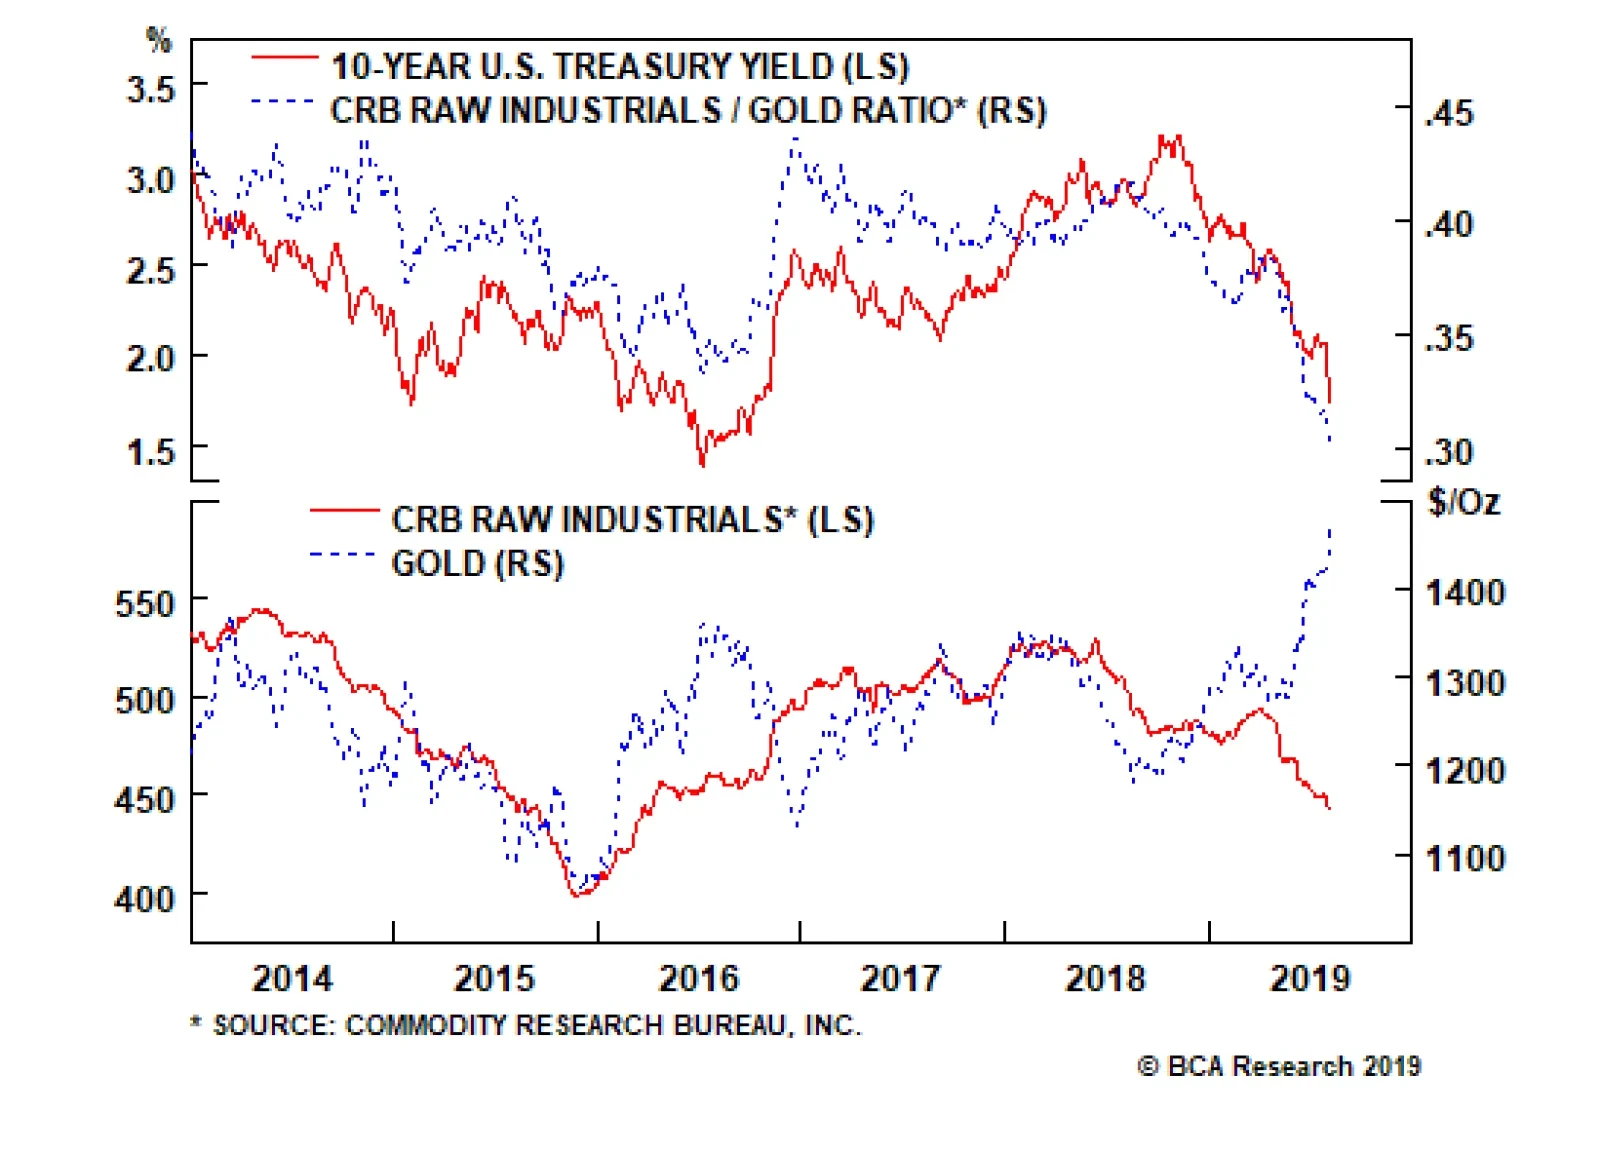
Highlights Chart 1Keep Tracking The CRB / Gold Ratio
Keep Tracking The CRB / Gold Ratio
Keep Tracking The CRB / Gold Ratio
The Fed cut rates by 25 basis points last week, a move that Chairman Powell described as an “insurance” cut meant to counter the risks from trade tensions and global growth weakness. Powell also described the move as a “mid-cycle adjustment to policy” and not “the beginning of a lengthy cutting cycle”. We agree with the Fed’s “mid-cycle” view of the U.S. economy and think an extended cutting cycle is unwarranted, but the market clearly disagrees. Long-end yields fell on Powell’s remarks and fell further as U.S. / China trade tensions re-escalated during the past few days. The 2015/16 period continues to be a good roadmap for the current environment, and we expect the next big move in Treasury yields will be higher. The timing of that move, however, is highly uncertain. Our political strategists expect an increase in saber-rattling between the U.S. and China in the coming months, and bond yields will not rise until either trade tensions ease and/or the global growth data recover. We recommend a tactical neutral allocation to portfolio duration, but expect to switch back to below-benchmark when those conditions are met. The CRB / Gold ratio will continue to be a good guide for the 10-year yield (Chart 1). Feature Investment Grade: Overweight Chart 2Investment Grade Market Overview
Investment Grade Market Overview
Investment Grade Market Overview
Investment grade corporate bonds outperformed the duration-equivalent Treasury index by 63 basis points in July, bringing year-to-date excess returns up to +432 bps. Corporate spreads widened somewhat following Jerome Powell’s perceived hawkishness at last week’s FOMC meeting, but that spread widening will prove fleeting. The Fed remains committed to keeping monetary policy accommodative and that means doing everything it can to prevent a significant tightening of financial conditions.1 The soaring price of gold is the strongest indicator of the Fed’s dovishness, and it is also a buy signal for corporate credit (Chart 2). In terms of valuation, Baa-rated securities offer the most value in investment grade corporate bond space. Baa spreads remain 7 bps above our cyclical target.2 Conversely, Aa and A-rated spreads are 3 bps and 4 bps below target, respectively (panel 4). Aaa spreads are 16 bps below target (not shown). The Fed’s Senior Loan Officer Survey for Q2, released yesterday, showed that commercial & industrial (C&I) lending standards eased for the second consecutive quarter. C&I loan demand continued to contract, but less aggressively than its recent pace (bottom panel). Easing lending standards usually coincide with spread tightening, and vice-versa.
Chart
Chart
High-Yield: Overweight Chart 3High-Yield Market Overview
High-Yield Market Overview
High-Yield Market Overview
High-Yield outperformed the duration-equivalent Treasury index by 66 basis points in July, bringing year-to-date excess returns up to +673 bps. The average index option-adjusted spread tightened 6 bps in July, then widened 26 bps in the first two days of August. At 397 bps, it is currently well above the cycle-low of 303 bps. We see more potential for spread tightening in high-yield than in investment grade. Within investment grade, only Baa-rated spreads appear cheap. However, in high-yield, Ba-rated spreads are 71 bps above our target (Chart 3), B-rated spreads are 142 bps above our target (panel 3) and Caa-rated spreads are 298 bps above our target (not shown).3 Junk spreads also offer reasonable value relative to expected default losses. The current Moody’s baseline forecast calls for a default rate of 2.9% over the next 12 months, not far from our own projection.4 This would translate into 238 bps of excess spread in the High-Yield index, after adjusting for default losses (panel 4). This is comfortably above zero, and only just below the historical average of 250 bps. As noted on page 3, C&I lending standards have now eased for two consecutive quarters and job cut announcements are off their highs (bottom panel). Both trends are supportive of lower default expectations in the future. MBS: Neutral Chart 4MBS Market Overview
MBS Market Overview
MBS Market Overview
Mortgage-Backed Securities outperformed the duration-equivalent Treasury index by 43 basis points in July, bringing year-to-date excess returns up to +32 bps. The conventional 30-year zero-volatility spread tightened 10 bps on the month, consisting of a 9 bps tightening in the option-adjusted spread (OAS) and a 1 bp decline in the compensation for prepayment risk (option cost). Falling mortgage rates hurt MBS in the first half of this year, as lower rates led to an increase in refi activity that drove MBS spreads wider (Chart 4). In fact, the conventional 30-year index OAS moved all the way back to its pre-crisis mean, before tightening last month (panel 3). However, as we noted in a recent report, the nominal 30-year MBS spread remains very tight, at close to one standard deviation below its historical mean.5 The mixed valuation picture means we are not yet inclined to augment MBS exposure, especially given the recent downleg in Treasury yields that could spur another small jump in refis. However, we are equally disinclined to downgrade MBS, given our view that Treasury yields are close to a trough. All in all, we expect the next big move in the MBS/Treasury basis will be a tightening, as global growth improves and mortgage rates rise. However, valuation is not sufficiently attractive to warrant more than a neutral allocation. Government-Related: Underweight Chart 5Government-Related Market Overview
Government-Related Market Overview
Government-Related Market Overview
The Government-Related index outperformed the duration-equivalent Treasury index by 30 basis points in July, bringing year-to-date excess returns up to +164 bps. Sovereign debt outperformed duration-equivalent Treasuries by 68 bps on the month, bringing year-to-date excess returns up to +490 bps. Local Authorities outperformed the Treasury benchmark by 31 bps, bringing year-to-date excess returns up to +244 bps. Meanwhile, Foreign Agencies outperformed by 49 bps, bringing year-to-date excess returns up to +153 bps. Domestic Agencies outperformed by 6 bps in July, bringing year-to-date excess returns up to +31 bps. Supranationals outperformed by 7 bps on the month, bringing year-to-date excess returns up to +36 bps. Sovereign debt remains very expensive relative to equivalently rated U.S. corporate credit (Chart 5). While the sector would benefit if the Fed’s dovish pivot eventually results in a weaker dollar, U.S. corporate bonds would still outperform in that scenario given the more attractive starting point for spreads. We continue to recommend an underweight allocation to Sovereigns. Unlike the debt of most other countries, Mexican sovereign bonds continue to trade cheap relative to U.S. corporates (bottom panel). While this remains an attractive option from a valuation perspective, the President’s on again/off again tariff threats make it a risky near-term proposition. Municipal Bonds: Neutral Chart 6Municipal Market Overview
Municipal Market Overview
Municipal Market Overview
Municipal bonds outperformed the duration-equivalent Treasury index by 102 basis points in July, bringing year-to-date excess returns up to +58 bps (before adjusting for the tax advantage). The average Aaa-rated Municipal / Treasury yield ratio fell 8% in July, and currently sits at 78% (Chart 6). The ratio is more than one standard deviation below its post-crisis mean, and even below the 81% average that prevailed in the late stages of the previous cycle, between mid-2006 and mid-2007. We noted the strong outperformance of municipal bonds in our report two weeks ago, and recommended cutting exposure from overweight to neutral, based on how expensive the bonds have become.6 In that report we noted that Aaa-rated Municipal / Treasury yield ratios for 2-year, 5-year and 10-year maturities were all more than one standard deviation below average pre-crisis levels. Only 20-year and 30-year Aaa-rated municipal bonds continue to look cheap, and we recommend that investors focus muni exposure on that segment of the market. Fundamentally, state & local government balance sheets remain in decent shape and a material increase in ratings downgrades is unlikely any time soon (bottom panel). Our shift to a more cautious stance is driven purely by valuation, and not any immediate concern for municipal bond credit quality. Treasury Curve: Maintain A Barbell Curve Positioning Chart 7Treasury Yield Curve Overview
Treasury Yield Curve Overview
Treasury Yield Curve Overview
The Treasury curve bear-flattened in July, before undergoing a roughly parallel shift down of about 30 bps in the first two days of August, following the FOMC meeting and news about the escalation of the U.S./China trade war. As we go to press, the 2/10 Treasury slope stands at 16 bps, 9 bps flatter than at the end of June. The 5/30 slope is currently 76 bps, exactly equal to its end-of-June level. Our 12-month Fed Funds Discounter is currently -78 bps (Chart 7). This means that the market is priced for roughly three more 25 basis point rate cuts during the next year. While we have shifted to a tactically neutral duration stance because of the uncertainty surrounding the timing of the next move higher in yields, three rate cuts on a 12-month horizon still seems excessive given the underlying strength of the U.S. economy. For this reason we are inclined to maintain a barbelled position across the Treasury curve, and also to stay short the February 2020 fed funds futures contract. The February 2020 contract is priced for three rate cuts spread over the next four FOMC meetings. A short position continues to make sense. On the yield curve, our butterfly spread models continue to show that barbells look cheap relative to bullets (see Appendix B). Further, the 5-year and 7-year yields will rise the most when the market prices-in a more hawkish path for the policy rate. Investors should favor the long-end and short-end of the curve, while avoiding the belly (5-year and 7-year). TIPS: Overweight Chart 8Inflation Compensation
Inflation Compensation
Inflation Compensation
TIPS outperformed the duration-equivalent nominal Treasury index by 43 basis points in July, bringing year-to-date excess returns up to +71 bps. The 10-year TIPS breakeven inflation rate rose 8 bps in July to reach 1.77%, before falling back to 1.67% in the first few days of August (Chart 8). The 5-year/5-year forward TIPS breakeven inflation rate followed a similar path and currently sits at 1.88%. As we have noted in recent research, FOMC members are monitoring long-dated inflation expectations and are committed to keeping policy easy enough to “re-anchor” them at levels consistent with the Fed’s 2% target.7 In the long-run, this will support a return of long-dated TIPS breakeven inflation rates (both 10-year and 5-year/5-year forward) to our 2.3% - 2.5% target range. However, for breakevens to move higher, investors will also need to see evidence that realized inflation can be sustained near 2%. On that note, the core PCE deflator grew at an annualized rate of 2.48% during the past three months. However, the 12-month rate of change remains at 1.5%. The 12-month trimmed mean PCE inflation rate is currently running at 2%, exactly equal to the Fed’s target. In a recent report we noted that 12-month core PCE inflation has a track record of converging toward the trimmed mean.8 We see continued upside in core inflation over the remainder of the year, and therefore recommend an overweight allocation to TIPS versus nominal Treasuries. ABS: Underweight Chart 9ABS Market Overview
ABS Market Overview
ABS Market Overview
Asset-Backed Securities outperformed the duration-equivalent Treasury index by 8 basis points in July, bringing year-to-date excess returns up to +59 bps. The index option-adjusted spread for Aaa-rated ABS tightened 3 bps on the month. It currently sits at 31 bps, well below the pre-crisis mean of 64 bps (Chart 9). In addition to poor valuation, the sector’s credit fundamentals are shifting in a negative direction. Household interest payments continue to trend up, suggesting a higher delinquency rate going forward (panel 3). Meanwhile, the Fed’s Senior Loan Officer Survey for Q2, released yesterday, showed a continued tightening in lending standards for both credit cards and auto loans. Tighter lending standards usually coincide with rising delinquencies (bottom panel). On the bright side, stronger demand for both credit cards and auto loans was reported for the first time since the fourth quarter of 2016. All in all, the combination of poor value and deteriorating credit quality leads us to recommend an underweight allocation to consumer ABS. Non-Agency CMBS: Neutral Chart 10CMBS Market Overview
CMBS Market Overview
CMBS Market Overview
Non-Agency Commercial Mortgage-Backed Securities outperformed the duration-equivalent Treasury index by 42 basis points in July, bringing year-to-date excess returns up to +234 bps. The index option-adjusted spread for non-agency Aaa-rated CMBS tightened 6 bps on the month. It currently sits at 64 bps, below average pre-crisis levels but above levels seen in 2018 (Chart 10). The macro outlook for commercial real estate looks somewhat unfavorable, with lenders tightening standards (panel 4) amidst falling demand (bottom panel). However, on a positive note, commercial real estate prices recently accelerated and are now much more consistent with current CMBS spreads (panel 3). Despite the mixed fundamental picture, CMBS still offer excellent compensation compared to other similarly-rated fixed income sectors.9 Agency CMBS: Overweight Agency CMBS outperformed the duration-equivalent Treasury index by 26 bps in July, bringing year-to-date excess returns up to +119 bps. The index option-adjusted spread tightened 3 bps on the month and currently sits at 47 bps. The Excess Return Bond Map in Appendix C shows that Agency CMBS offer high potential return compared to other low-risk spread products. An overweight allocation to this defensive sector remains appropriate. Appendix A - The Golden Rule Of Bond Investing We follow a two-step process to formulate recommendations for bond portfolio duration. First, we determine the change in the federal funds rate that is priced into the yield curve for the next 12 months. Second, we decide – based on our assessments of the economy and Fed policy – whether the change in the fed funds rate will exceed or fall short of what is priced into the curve. Most of the time, a correct answer to this question leads to the appropriate duration call. We call this framework the Golden Rule Of Bond Investing, and we demonstrated its effectiveness in the U.S. Bond Strategy Special Report, “The Golden Rule Of Bond Investing”, dated July 24, 2018, available at usbs.bcaresearch.com. Chart 11 illustrates the Golden Rule’s track record by showing that the Bloomberg Barclays Treasury Master Index tends to outperform cash when rate hikes fall short of 12-month expectations, and vice-versa. Chart 11The Golden Rule's Track Record
The Golden Rule's Track Record
The Golden Rule's Track Record
At present, the market is priced for 78 basis points of cuts during the next 12 months. We anticipate fewer rate cuts over that time horizon, and therefore anticipate that below-benchmark portfolio duration positions will profit. We can also use our Golden Rule framework to make 12-month total return and excess return forecasts for the Bloomberg Barclays Treasury index under different scenarios for the fed funds rate. Excess returns are relative to the Bloomberg Barclays Cash index. To forecast total returns we first calculate the 12-month fed funds rate surprise in each scenario by comparing the assumed change in the fed funds rate to the current value of our 12-month discounter. This rate hike surprise is then mapped to an expected change in the Treasury index yield using a regression based on the historical relationship between those two variables. Finally, we apply the expected change in index yield to the current characteristics (yield, duration and convexity) of the Treasury index to estimate total returns on a 12-month horizon. The below tables present those results, along with 95% confidence intervals. Excess returns are calculated by subtracting assumed cash returns in each scenario from our total return projections.
Image
Image
Appendix B - Butterfly Strategy Valuation The following tables present the current read-outs from our butterfly spread models. We use these models to identify opportunities to take duration-neutral positions across the Treasury curve. The following two Special Reports explain the models in more detail: U.S. Bond Strategy Special Report, “Bullets, Barbells And Butterflies”, dated July 25, 2017, available at usbs.bcaresearch.com U.S. Bond Strategy Special Report, “More Bullets, Barbells And Butterflies”, dated May 15, 2018, available at usbs.bcaresearch.com Table 4 shows the raw residuals from each model. A positive value indicates that the bullet is cheap relative to the duration-matched barbell. A negative value indicates that the barbell is cheap relative to the bullet. Table 4Butterfly Strategy Valuation: Raw Residuals In Basis Points (As of August 2, 2019)
Underinsured
Underinsured
Table 5 scales the raw residuals in Table 4 by their historical means and standard deviations. This facilitates comparison between the different butterfly spreads. Table 5Butterfly Strategy Valuation: Standardized Residuals (As of August 2, 2019)
Underinsured
Underinsured
Table 6 flips the models on their heads. It shows the change in the slope between the two barbell maturities that must be realized during the next six months to make returns between the bullet and barbell equal. For example, a reading of +55 bps in the 5 over 2/10 cell means that we would only expect the 5-year to outperform the 2/10 if the 2/10 slope steepens by more than 55 bps during the next six months. Otherwise, we would expect the 2/10 barbell to outperform the 5-year bullet. Table 6Discounted Slope Change During Next 6 Months (BPs)
Underinsured
Underinsured
Appendix C - Excess Return Bond Map The Excess Return Bond Map is used to assess the relative risk/reward trade-off between different sectors of the U.S. fixed income market. The Map employs volatility-adjusted breakeven spread analysis to show how likely it is that a given sector will earn/lose money during the subsequent 12 months. The Map does not incorporate any macroeconomic view. The horizontal axis of the Map shows the number of days of average spread widening required for each sector to lose 100 bps versus a position in duration-matched Treasuries. Sectors plotting further to the left require more days of average spread widening and are therefore less likely to see losses. The vertical axis shows the number of days of average spread tightening required for each sector to earn 100 bps in excess of duration-matched Treasuries. Sectors plotting further toward the top require fewer days of spread tightening and are therefore more likely to earn 100 bps of excess return.
Chart 12
Ryan Swift, U.S. Bond Strategist rswift@bcaresearch.com Jeremie Peloso, Research Analyst jeremiep@bcaresearch.com Footnotes 1 Please see U.S. Bond Strategy / Global Fixed Income Strategy Weekly Report, “The Fed’s Got Your Back”, dated June 25, 2019, available at usbs.bcaresearch.com 2 For more details on how we arrive at our spread targets please see U.S. Bond Strategy Weekly Report, “The Value In Corporate Bonds”, dated February 19, 2019, available at usbs.bcaresearch.com 3 For more details on how we arrive at our spread targets please see U.S. Bond Strategy Weekly Report, “The Value In Corporate Bonds”, dated February 19, 2019, available at usbs.bcaresearch.com 4 Please see U.S. Bond Strategy Special Report, “Assessing Corporate Default Risk”, dated March 19, 2019, available at usbs.bcaresearch.com 5 Please see U.S. Bond Strategy Weekly Report, “The Long Awkward Middle Phase”, dated July 2, 2019, available at usbs.bcaresearch.com 6 Please see U.S. Bond Strategy Weekly Report, “A Message To The TIPS Market”, dated July 23, 2019, available at usbs.bcaresearch.com 7 Please see U.S. Bond Strategy Weekly Report, “A Message To The TIPS Market”, dated July 23, 2019, available at usbs.bcaresearch.com 8 Please see U.S. Bond Strategy Weekly Report, “Hedge Near-Term Credit Exposure”, dated May 28, 2019, available at usbs.bcaresearch.com 9 Please see U.S. Bond Strategy Weekly Report, “The Search For Aaa Spread”, dated March 12, 2019, available at usbs.bcaresearch.com Fixed Income Sector Performance Recommended Portfolio Specification Corporate Sector Relative Valuation And Recommended Allocation
Feature The global manufacturing cycle looks dire at the moment. Around the world, manufacturing PMIs have fallen, profit growth has slowed, and capex has been reined back (Chart 1). This is clearly a risky moment for the economic expansion (and the equity bull market) which began in 2009. We hear that many clients are having vigorous debates on their investment committees about what to do – and indeed, at BCA, the views of our strategists are unusually divided.1 Recommendations
Monthly Portfolio Update: Manufacturing Recession, Consumer Resilience, Dovish Central Banks
Monthly Portfolio Update: Manufacturing Recession, Consumer Resilience, Dovish Central Banks
Chart 1Heading Downhill Fast
Heading Downhill Fast
Heading Downhill Fast
Global Asset Allocation veers towards the optimistic camp. In brief, we expect the services and consumer sectors of major economies to remain robust, and that manufacturing will bottom out in the coming months, partly as a result of easier financial conditions, including the dovish turn by central banks and monetary stimulus in China. But we recognize the risks currently and have constructed our portfolio accordingly. We remain overweight equities versus bonds, but leaven that with an overweight on the most defensive equity market, the U.S. The global economy is a wonderful self-organizing system. The disparity between manufacturing and services is stark everywhere. Both the soft data, such as PMIs (Chart 2), and hard data, such as industrial production and retail sales (Chart 3), show that manufacturing almost everywhere is in recession (the U.S. is not yet, but is perhaps headed that way), but that services growth remains robust. Services have been held up by decent wage growth (even in the manufacturing-heavy eurozone) and generally easier fiscal policy (in the eurozone and China, in particular), which have allowed consumers to continue spending. (In the U.S., the risk of tighter fiscal policy next year has been alleviated by last month’s budget agreement which will produce a small positive fiscal thrust in 2020 – see Chart 4.) Chart 2Service Sector Surveys Look Healthier...
Service Sector Surveys Look Healthier...
Service Sector Surveys Look Healthier...
Chart 3...Supported By The Hard Data
...Supported By The Hard Data
...Supported By The Hard Data
Chart 4
Chart 5China Is The Root Cause
China Is The Root Cause
China Is The Root Cause
The manufacturing recession was clearly triggered by China – it is notable, for instance, that large exporting countries have seen no slowdown in sales to the U.S. but a big drop in those to China (Chart 5). In 2017-18, China slowed as a result of its tighter monetary policy and clamp-down on shadow banking. The countries that have been most affected by the slowdown over the past 18 months are, unsurprisingly then, those which have the largest manufacturing sectors, notably Korea, Germany and Japan (Chart 6).
Chart 6
But the global economy is a wonderful self-organizing system. Historically, intra-expansion industrial cycles have typically lasted around 18 months from peak to trough, and 18 months from trough to peak (Chart 7). Lower commodity prices, easier financial conditions, and pent-up demand mean that, after a period of slowdown, demand and risk appetite build up. This self-equilibrating cycle breaks only if there is a major structural imbalance, usually excess debt or rising inflation. As we have argued previously, we do not see clear signs currently that either of these usual structural triggers of recession is present (Chart 8). Chart 7Close To The End Of The Down Wave?
Close To The End Of The Down Wave?
Close To The End Of The Down Wave?
Chart 8No Structural Triggers For Recession
No Structural Triggers For Recession
No Structural Triggers For Recession
Chart 9Financial Conditions Have Eased
Financial Conditions Have Eased
Financial Conditions Have Eased
The Fed cut rates on July 31 as a risk management measure, “a mid-cycle adjustment to policy,” as Chair Powell put it in his post-FOMC press conference. With the stock market close to a record high and unemployment at a 50-year low, there is no obvious need for the Fed to implement a full-out easing campaign. But with inflation well below its 2% target, and a risk that the manufacturing slowdown could spill over into consumption (perhaps if companies start to lay off workers – something there is little sign of yet), an “insurance” cut seemed prudent. Financial conditions have eased significantly in the U.S. this year, and somewhat in Europe (Chart 9), and this should soon start to positively affect growth. China’s stimulus remains key. So far it has been half-hearted (Chart 10). This is because Chinese growth has to a degree stabilized, trade negotiations with the U.S. continue, and because the authorities have not abandoned their wish to delever the economy – it is notable that shadow-bank credit creation has not rebounded (Chart 11). Both fiscal and monetary stimulus will need to be ramped up in the second half if we are to see a repeat of 2016’s China-driven risk rally. Investors should see this as a put option – if Chinese growth slows again, and the trade talks break down (both of which are likely), the authorities will roll out a stimulus on the scale of their previous efforts. Chart 10China's Stimulus Is Only Half-Hearted
China's Stimulus Is Only Half-Hearted
China's Stimulus Is Only Half-Hearted
Chart 11Still Clamping Down On Shadow Banks
Still Clamping Down On Shadow Banks
Still Clamping Down On Shadow Banks
Chart 12Have Stocks Already Discounted A Rebound?
Have Stocks Already Discounted A Rebound?
Have Stocks Already Discounted A Rebound?
What is the biggest risk to our sanguine view? With global stocks up 16% and U.S. stocks 20% year-to-date, the bottoming-out of the manufacturing cycle and greater monetary easing may already be priced in. Chart 12 shows that year-on-year stock market moves typically follow the manufacturing PMIs closely. Even if stock prices remain only at their current level to year-end, they are already discounting a sharp bounce in the PMIs. Fixed Income: If we are right about the macro environment, U.S. Treasury bond yields should rise from their current 2%. Yields usually move in line with consensus GDP forecasts (Chart 13). Economists have cut their 2020 forecast to only 1.8% (from 2.5% for this year). If the 2020 number is revised up, as we expect, Treasury yields have some room to move back up. Moreover, the Fed is unlikely to cut rates twice more by year-end as the futures market implies. Therefore, we stay underweight duration. We have a neutral stance on credit, but this asset class should produce reasonable excess returns over coming quarters given current spreads (Chart 14). U.S. high yield (especially B and below) and eurozone investment grade bonds (which the ECB may start buying again) look attractive. Chart 13Yields Will Rise With GDP Forecasts
Yields Will Rise With GDP Forecasts
Yields Will Rise With GDP Forecasts
Chart 14Some Credit Spreads Look Attractive
Some Credit Spreads Look Attractive
Some Credit Spreads Look Attractive
Equities: Given the uncertainties over the timing and strength of Chinese stimulus, we remain cautious on Emerging Markets and euro area stocks, the most obvious beneficiaries of this. Both regions have structural headwinds (excess foreign-currency debt in the case of EM, the fragile banking system and flattening yield curve for Europe) which mean that, even when Chinese stimulus comes, their outperformance may prove short-lived. For now, we prefer U.S. equities, although we recognize that upside for this year is limited. The key will be whether earnings can surprise analysts’ (over cautious) forecast of only 3% EPS growth in 2019. This seems likely since the Q2 earnings season, with almost half of companies having reported, is coming in at close to 80% beats on the bottom line. To hedge against the upside risk of Chinese stimulus, we continue to recommend building a position in Australian equities and in the Industrials sector. China’s stimulus remains key, but so far it has been half-hearted. Currencies: The U.S. dollar is a counter-cyclical currency and should start to depreciate once signs of a manufacturing recovery become apparent. Moreover, the Fed’s dovish move – and the fact that it has significantly more room to ease than other large DM central banks – should also prove to be dollar bearish eventually (Chart 15). One key cross to watch for signs that the global cycle is bottoming is AUD/JPY, since the Australian dollar is a very cyclical, and the Japanese yen a very defensive, currency (Chart 16). Chart 15Dovish Fed Is Dollar Bearish
Dovish Fed Is Dollar Bearish
Dovish Fed Is Dollar Bearish
Chart 16Watch AUD/JPY For Signs Of A Bottom
Watch AUD/JPY For Signs Of A Bottom
Watch AUD/JPY For Signs Of A Bottom
Chart 17Oil Has Further To Rise
Oil Has Further To Rise
Oil Has Further To Rise
Chart 18
Commodities: We continue to have a bullish outlook for oil. Although developed-world demand growth has slowed slightly this year, OPEC supply constraints mean that inventories should draw down further (Chart 17). We expect Brent crude to average $74 a barrel in 2H2019 (from $65 today). Gold has performed well this year, up 11%. Our colleagues in BCA’s Foreign Exchange Strategy and Commodity & Energy Strategy services conclude that this has largely been because of monetary and financial factors, mostly lower real rates (Chart 18).2 In the coming months, while rates may rise, gold should be helped by a weaker USD. We are neutral on the metal and see it more as an insurance asset. Our FX and Commodity strategists concur with GAA’s long-standing view that gold is a useful portfolio diversification tool to protect against financial, geopolitical, and inflation risks. Garry Evans Chief Global Asset Allocation Strategist garry@bcaresearch.com Footnotes 1 Please see BCA’s Special Report, “What Goes On Between Those Walls? BCA’s Diverging Views In The Open,” dated 19 July 2019, available at www.bcaresearch.com. 2 Please see Commodity & Energy Strategy Special Report, “All That Glitters…And Then Some,” dated 25 July 2019, available at ces.bcaresearch.com. GAA Asset Allocation