Fixed Income

BCA takes pride in its independence. Strategists publish what they really believe, informed by their framework and analysis. Occasionally, this independence results in strongly diverging views and we currently are in one of those times. Within BCA, two views on the cyclical (six to 12-months) outlook for assets have emerged. One camp expects global growth to rebound in the second half of the year. Along with accelerating growth, they anticipate stock prices and risk assets to remain firm, cyclical equities to outperform defensive ones, safe-haven yields to move up, and the dollar to weaken. Meanwhile, another group foresees a further deterioration in activity or a delayed recovery, additional downside in stocks and risk assets, outperformance of defensives relative to cyclicals, low safe-haven yields, and a generally stronger dollar. For the sake of transparency, we have asked representatives of each camp to make their case in a round-table discussion, allowing our clients to decide for themselves which view is more appealing to them. Global Investment Strategy’s Peter Berezin, U.S. Investment Strategy’s Doug Peta, and Global Fixed Income Strategy’s Rob Robis take the mantle for the bullish camp. U.S. Equity Strategy’s Anastasios Avgeriou, Emerging Market Strategy’s Arthur Budaghyan, and European Investment Strategy’s Dhaval Joshi represent the bearish group.1 The round-table discussion below focuses on the cyclical outlook. For longer investment horizons, most strategists agree that a recession is highly likely by 2022. Moreover, on a long-term basis, valuations in both risk assets and safe-haven bonds are very demanding. In this context, a significant back up in yields could hammer risk assets. The BCA Round Table Mathieu Savary: Yield curve inversions have often been harbingers of recessions. Anastasios, you are amongst those investors troubled by this inversion. Do you not worry that this episode might prove similar to 1998, when the curve only inverted temporarily and did not foreshadow a recession? Moreover, how do you account for the highly variable time lags between the inversion of the yield curve and the occurrence of a recession? Anastasios Avgeriou: The yield curve inverts at or near the peak of the business cycle and it eventually forewarns of upcoming recessions. This past December, parts of the yield curve inverted and now, BCA’s U.S. Equity Strategy service is heeding the signal from this simple indicator, especially given that the SPX has subsequently made all-time highs as our research predicted.2 Chart 1 (ANASTASIOS)The 1998 Episode Revisited
The 1998 Episode Revisited
The 1998 Episode Revisited
The yield curve inversion forecasts a Fed rate cut, and it has never been wrong on that front. It served well investors that heeded the message in June of 1998 as the market soon thereafter fell 20% in a heartbeat. If investors got out at the 1998 peak near 1200 and forwent about 350 points of gains until the March 2000 SPX cycle peak, they still benefited if they held tight as the market ultimately troughed near 777 in October 2002 (Chart 1). With regard to timing the previous seven recessions using the yield curve, if we accept that mid-1998 is the starting point of the inversion, it took 33 months before the recession commenced. Last cycle, the recession began 24 months after the inversion. Consequently, December 2020 is the earliest possible onset of recession and September 2021, the latest. Our forecast calls for SPX EPS to fall 20% in 2021 to $140 with the multiple dropping between 13.5x and 16.5x for an SPX end-2020 target range of 1,890-2,310.3 In other words we are not willing to play a 100-200 point advance for a potential 1,000 point drawdown. The risk/reward tradeoff is to the downside, and we choose to sit this one out. Mathieu: Rob, you take a much more sanguine view of the current curve inversion. Why? Rob Robis: While the four most dangerous words in investing are “this time is different,” this time really does appear to be different. Never before have negative term premia on longer-term Treasury yields and a curve inversion coexisted (Chart 2). Longer-term Treasury yields have therefore been pushed down to extremely low levels by factors beyond just expectations of a lower fed funds rate. The negative Treasury term premium is distorting the economic message of the U.S. yield curve inversion. Chart 2 (ROB)Negative Term Premium Distorting The Economic Message Of An Inverted Yield Curve
Negative Term Premium Distorting The Economic Message Of An Inverted Yield Curve
Negative Term Premium Distorting The Economic Message Of An Inverted Yield Curve
Term premia are depressed everywhere, as seen in German, Japanese and other yields, reflecting the intense demand for safe assets like government bonds during a period of heightened uncertainty. Global bond markets may also be discounting a higher probability of the ECB restarting its Asset Purchase Program, as term premia typically fall sharply when central banks embark on quantitative easing. This has global spillovers. Prior to previous recessions, U.S. Treasury curve inversions occurred when the Fed was running an unequivocally tight monetary policy. That is not the case today. The real fed funds rate still is not above the Fed’s estimate of the neutral real rate, a.k.a. “r-star,” which was the necessary ingredient for all previous Treasury curve inversions since 1960 (Chart 3). Chart 3 (ROB)Fed Policy Is Not Tight Enough For Sustained Curve Inversion
Fed Policy Is Not Tight Enough For Sustained Curve Inversion
Fed Policy Is Not Tight Enough For Sustained Curve Inversion
Mathieu: The level of policy accommodation will most likely determine whether Anastasios or Rob is proven right. Peter, you have been steadfastly arguing that policy, in the U.S. at least, remains easy. Can you elaborate why? Peter Berezin: Remember that the neutral rate of interest is the rate that equalizes the level of aggregate demand with the economy’s supply-side potential. Loose fiscal policy and fading deleveraging headwinds are boosting demand in the United States. So is rising wage growth, especially at the bottom of the income distribution. Given that the U.S. does not currently suffer from any major imbalances, I believe that the economy can tolerate higher rates without significant ill-effects. In other words, monetary policy is currently quite easy. Of course, we cannot observe the neutral rate directly. Like a black hole, one can only detect it based on the effect that it has on its surroundings. Housing is by far the most interest rate-sensitive sector of the economy. If history is any guide, the recent decline in mortgage rates will boost housing activity in the remainder of the year (Chart 4). If that relationship breaks down, as it did during the Great Recession, it would suggest that the neutral rate is quite low. Chart 4 (PETER)Declining Mortgage Rates Bode Well For Housing
Declining Mortgage Rates Bode Well For Housing
Declining Mortgage Rates Bode Well For Housing
Given that mortgage underwriting standards have been quite strong and the homeowner vacancy is presently very low, our guess is that housing will hold up well. We should know better in the next few months. Mathieu: Dhaval, you do not agree. Why do you think global rates are not accommodative? Dhaval Joshi: Actually, I think that global rates are accommodative, but that the global bond yield can rise by just 70 bps before conditions become perilously un-accommodative. Here’s where I disagree with Peter: for me, the danger doesn’t come from economics, it comes from the mathematics of ultra-low bond yields. The unprecedented and experimental panacea of our era has been ‘universal QE’ – which has led to ultra-low bond yields everywhere. But what is not understood is that when bond yields reach and remain close to their lower bound, weird things happen to the financial markets.
Chart 5
I refer you to other reports for the details, but in a nutshell, the proximity of the lower bound to yields increases the risk of owning supposedly ‘safe’ bonds to the risk of owning so-called ‘risk-assets’. The result is that the valuation of risk-assets rises exponentially (Chart 5). Because when the riskiness of the asset-classes converges, investors price risk-assets to deliver the same ultra-low nominal return as bonds.4 Comparisons with previous economic cycles miss the current danger. The post-2000 policy easing distorted the global economy by engineering a credit boom – so the subsequent danger emanated from the most credit-sensitive sectors in the economy such as mortgage lending. In contrast, the post-2008 ‘universal QE’ has severely distorted the valuation relationship between bonds and global risk-assets – so this is where the current danger lies. Higher bond yields can suddenly undermine the valuation support of global risk-assets whose $400 trillion worth dwarfs the global economy by five to one. Where is this tipping point? It is when the global 10-year yield – defined as the average of the U.S., euro area,5 and China – approaches 2.5%. Through the past five years, the inability of this yield to remain above 2.5% confirms the hyper-sensitivity of financial conditions to this tipping point (Chart 6). Right now, I agree that bond yields are accommodative. But the scope for yields to move higher is quite limited. Chart 6 (DHAVAL)Since 2015, the Global Long Bond Yield Has Struggled To Surpass 2.5 Percent
Since 2015, the Global Long Bond Yield Has Struggled To Surpass 2.5 Percent
Since 2015, the Global Long Bond Yield Has Struggled To Surpass 2.5 Percent
Mathieu: Monetary policy is important to the outlook, but so is the global manufacturing cycle. The global growth slowdown has been concentrated in the manufacturing sector, tradeable goods in particular. Across advanced economies, the service and consumer sectors have been surprisingly resilient, but this will not last if the industrial sector decelerates further. Arthur, you still do not anticipate any major improvement in global trade and industrial production. Can you elaborate why? Chart 7 (ARTHUR)Global Trade Is Down Due To China Not U.S.
Global Trade Is Down Due To China Not U.S.
Global Trade Is Down Due To China Not U.S.
Arthur Budaghyan: To properly assess the economic outlook, one needs to understand what has caused the ongoing global trade/manufacturing downturn. One thing we know for certain: It originated in China, not the U.S. Chart 7 illustrates that Korean, Japanese, Taiwanese and Singaporean exports to China have been shrinking at an annual rate of 10%, while their shipments to the U.S. have been growing. China’s aggregate imports have also been contracting. This entails that from the perspective of the rest of the world, China has been and remains in recession. U.S. manufacturing is the least exposed to China, which is the main reason why it has been the last shoe to drop. Hence, the U.S. has lagged in this downturn, and one should not be looking to the U.S. for clues about a potential global recovery. We need to gauge what will turn Chinese demand around. In this regard, the rising credit and fiscal spending impulse is positive, but it has so far failed to kick start a recovery (Chart 8). The key reason has been a declining marginal propensity to spend among households and companies. Notably, the marginal propensity to spend of mainland companies leads industrial metals prices by a few months, and it currently continues to point south (Chart 8, bottom panel). The lack of willingness among Chinese consumers and enterprises to spend is due to several factors: (1) the U.S.-China confrontation; (2) high levels of indebtedness among both enterprises and households (Chart 9); (3) ongoing regulatory scrutiny over banks and shadow banking as well as local government debt; and (4) a lack of outright government subsidies for purchases of autos and housing. Chart 8 (ARTHUR)Stimulus Versus Marginal Propensity To Spend
Stimulus Versus Marginal Propensity To Spend
Stimulus Versus Marginal Propensity To Spend
Chart 9 (ARTHUR)Chinese Households Are More Leveraged Than U.S. Ones
Chinese Households Are Leveraged Than U.S. Ones
Chinese Households Are Leveraged Than U.S. Ones
On the whole, the falling marginal propensity to spend will all but ensure that any recovery in mainland household and corporate spending is delayed. Mathieu: Meanwhile, Peter, you have a much more optimistic stance. Why do you differ so profoundly with Arthur’s view? Peter: China’s deleveraging campaign began more than a year before global manufacturing peaked. I have no doubt that slower Chinese credit growth weighed on global capex, but we should not lose sight of the fact there are natural ebbs and flows at work. Most manufactured goods retain some value for a while after they are purchased. If spending on, say, consumer durable goods or business equipment rises to a high level for an extended period, a glut will form, requiring a period of lower production. Chart 10 (PETER)The Global Manufacturing Cycle Has Likely Reached A Bottom
The Global Manufacturing Cycle Has Likely Reached A Bottom
The Global Manufacturing Cycle Has Likely Reached A Bottom
These demand cycles typically last about three years; roughly 18 months on the way up, 18 months on the way down (Chart 10). The last downleg in the global manufacturing cycle began in early 2018, so if history is any guide, we are nearing a trough. The fact that U.S. manufacturing output rose in both May and June, followed by this week’s sharp rebound in the July Philly Fed Manufacturing survey, supports this view. Of course, extraneous forces could complicate matters. If trade tensions ratchet higher, this would weaken my bullish thesis. Nevertheless, with China stimulating its economy again, it would probably take a severe trade war to push the global economy into recession. Mathieu: Dhaval, you are not as negative as Arthur, but nonetheless expect a slowdown in the second half of the year. What is your rationale? Dhaval: To be clear, I am not forecasting a recession or major downturn – unless, as per my previous answer, the global 10-year bond yield approaches 2.5% and triggers a severe dislocation in global risk-assets. In fact, many people get the relationship between recession and financial market dislocation back-to-front: they think that the recession causes the financial market dislocation when, in most cases, the financial market dislocation causes the recession! Nevertheless, I do believe that European and global growth is entering a regular down-oscillation based on the following compelling evidence: From a low last summer, quarter-on-quarter GDP growth rates in the developed economies have already rebounded to the upper end of multi-year ranges. Short-term credit impulses in Europe, the U.S., and China are entering down-oscillations (Chart 11). The best current activity indicators, specifically the ZEW economic sentiment indicators, have rolled over. The outperformance of industrials – the equity sector most exposed to global growth – has also rolled over. Why expect a down-oscillation? Because it is the rate of decline in the bond yield that drove the rebound in growth after its low last summer. Furthermore, it is impossible for the rate of decline in the bond yield to keep increasing, or even stay where it is. Counterintuitively, if bond yields decline, but at a reduced pace, the effect is to slow economic growth. Mathieu: A positive and a negative view of the world logically result in bifurcated outlooks for interest rates and the dollar. Rob, how do you see U.S., German, and Japanese yields evolving over the coming 12 months? Rob: If global growth rebounds, U.S. Treasury yields will have far more upside than Bund or JGB yields. Inflation expectations should recover faster in the U.S., with the Fed taking inflationary risks by cutting rates with a 3.7% unemployment rate and core CPI inflation at 2.1%. The Fed is also likely to disappoint by delivering fewer rate cuts than are currently discounted by markets (90bps over the next 12 months). Treasury yields can therefore increase more than German and Japanese yields, with the ECB and BoJ more likely to deliver the modest rate cuts currently discounted in their yield curves (Chart 12). Chart 11 (DHAVAL)Short-Term Impulses Rebounded... But Are Now Rolling Over
Short-Term Impulses Rebounded... But Are Now Rolling Over
Short-Term Impulses Rebounded... But Are Now Rolling Over
Chart 12 (ROB)U.S. Treasuries Will Underperform Bunds & JGBs
U.S. Treasuries Will Underperform Bunds & JGBs
U.S. Treasuries Will Underperform Bunds & JGBs
Japanese yields will remain mired at or below zero over the next 6-12 months, as wage growth and core inflation remain too anemic for the BoJ to alter its 0% target on 10-year JGB yields. German yields have a bit more potential to rise if European growth begins to recover, but will lag any move higher in Treasury yields. That means that the Treasury-Bund and Treasury-JGB spreads will move higher over the next year. Negative German and Japanese yields may look completely unappetizing compared to +2% U.S. Treasury yields, but this handicap vanishes when all three yields are expressed in U.S. dollar terms. Hedging a 10-year German Bund or JGB into higher-yielding U.S. dollars creates yields that are 50-60bps higher than a 10-year U.S. Treasury. It is abundantly clear that German and Japanese bonds will outperform Treasuries over the next year if global growth recovers. Mathieu: Peter, your positive view on global growth means that the Fed will cut rates less than what is currently priced into the OIS curve. So why do you expect the dollar to weaken in the second half of 2019? Peter: What the Fed does affects interest rate differentials, but just as important is what other central banks do. The ECB is not going to raise rates over the next 12 months. However, if euro area growth surprises on the upside later this year, investors will begin to question the need for the ECB to keep policy rates in negative territory until mid-2024. The market’s expectation of where policy rates will be five years out tends to correlate well with today’s exchange rate. By that measure, there is scope for interest rate differentials to narrow against the U.S. dollar (Chart 13). Chart 13A (PETER)Interest Rate Expectations Against The U.S. Should Narrow (I)
Interest Rate Expectations Against The U.S. Should Narrow (I)
Interest Rate Expectations Against The U.S. Should Narrow (I)
Chart 13B (PETER)Interest Rate Expectations Against The U.S. Should Narrow (II)
Interest Rate Expectations Against The U.S. Should Narrow (II)
Interest Rate Expectations Against The U.S. Should Narrow (II)
Keep in mind that the U.S. dollar is a countercyclical currency, meaning that it moves in the opposite direction of global growth (Chart 14). This countercyclicality stems from the fact that the U.S. economy is more geared towards services than manufacturing compared with the rest of the world. Chart 14 (PETER)The Dollar Is A Countercyclical Currency
The Dollar Is A Countercyclical Currency
The Dollar Is A Countercyclical Currency
As such, when global growth accelerates, capital tends to flow from the U.S. to the rest of the world, translating into more demand for foreign currency and less demand for dollars. If global growth picks up in the remainder of the year, as I expect, the dollar will weaken. Mathieu: Arthur, as you are significantly more negative on growth than either Rob or Peter, how do you see the dollar and global yields evolving over the coming six to 12 months? Arthur: I am positive on the trade-weighted U.S. dollar for the following reasons: The U.S. dollar is a countercyclical currency – it exhibits a negative correlation with the global business cycle. Persistent weakness in the global economy emanating from China/EM is positive for the dollar because the U.S. economy is the major economic block least exposed to a China/EM slowdown. Meanwhile, the greenback is only loosely correlated with U.S. interest rates. Thereby, the argument that lower U.S. rates will drive the value of the U.S. currency much lower is overemphasized. The Federal Reserve will cut rates by more than what is currently priced into the market only in a scenario of a complete collapse in global growth. Yet this scenario would be dollar bullish. In this case, the dollar’s strong inverse relationship with global growth will outweigh its weak positive relationship with interest rates. Contrary to consensus views, the U.S. dollar is not very expensive. According to unit labor costs based on the real effective exchange rate – the best currency valuation measure – the greenback is only one standard deviation above its fair value. Often, financial markets tend to overshoot to 1.5 or 2 standard deviations below or above their historical mean before reversing their trend. One of the oft-cited headwinds facing the dollar is positioning, yet there is a major discrepancy between positioning in DM and EM currencies versus the U.S. dollar. In aggregate, investors – asset managers and leveraged funds – have neutral exposure to DM currencies, but they are very long liquid EM exchange rates such as the BRL, MXN, ZAR and RUB versus the greenback. The dollar strength will occur mostly versus EM and commodities currencies. In other words, the euro, other European currencies and the yen will outperform EM exchange rates. I have less conviction on global bond yields. While global growth will disappoint, yields have already fallen a lot and the U.S. economy is currently not weak enough to justify around 90 basis points of rate cuts over the next 12 months. Mathieu: Before we move on to investment recommendations, Anastasios, you have done a lot of interesting work on the outlook for U.S. profits. What is the message of your analysis? Chart 15 (ANASTASIOS)Gravitational Pull
Gravitational Pull
Gravitational Pull
Anastasios: While markets cheered the trade truce following the recent G-20 meeting, no tariff rollback was agreed. Since the tariff rate on $200bn of Chinese imports went up from 10% to 25% on May 10, odds are high that manufacturing will remain in the doldrums. This will likely continue to weigh on profits for the remainder of the year. Profit growth should weaken further in the coming six months. Periods of falling manufacturing PMIs result in larger negative earnings growth surprises as market forecasters rarely anticipate the full breadth and depth of slowdowns. Absent profit growth, equity markets lack the necessary ‘oxygen’ for a durable high-quality rally. Until global growth momentum turns, investors should fade rallies. Our four-factor SPX EPS growth model is flirting with the contraction zone. In addition, our corporate pricing power proxy and Goldman Sachs’ Current Activity Indicator both send a distress signal for SPX profits (Chart 15). Already, more than half of the S&P 500 GICS1 sectors’ profits are estimated to have contracted in Q2, and three sectors could see declining revenues on a year-over-year basis, according to I/B/E/S data. Q3 depicts an equally grim profit picture that will also spill over to Q4. Adding it all up, profits will underwhelm into year-end. Mathieu: Doug, you do not share Anastasios’s anxiety. What offsets do you foresee? Moreover, you are not concerned by the U.S. corporate balance sheets. Can you share why? Doug Peta: As it relates to earnings, we foresee offsets from a revival in the rest of the world. Increasingly accommodative global monetary policy and reviving Chinese growth will give global ex-U.S. economies a boost. That inflection may go largely unnoticed in U.S. GDP, but it will help the S&P 500, as U.S.-based multinationals’ earnings benefit from increased overseas demand and a weaker dollar. When it comes to corporate balance sheets, shifting some of the funding burden to debt from equity when interest rates are at generational lows is a no-brainer. Even so, non-financial corporates have not added all that much leverage (Chart 16). Low interest rates, wide profit margins and conservative capex have left them with ample free cash flow to service their obligations (Chart 17). Chart 16 (DOUG)Corporations Have Not Added Much Leverage ...
Corporations Have Not Added Much Leverage ...
Corporations Have Not Added Much Leverage ...
Chart 17 (DOUG)...Though They Have Ample Cash Flow To Service It
...Though They Have Ample Cash Flow To Service It
...Though They Have Ample Cash Flow To Service It
Every single viable corporate entity with an effective federal tax rate above 21% became a better credit when the top marginal rate was cut from 35% to 21%. Every such corporation now has more net income with which to service debt, and will have that income unless the tax code is revised. You can’t see it in EBITDA multiples, but it will show up in reduced defaults. Mathieu: The last, and most important question. What are each of your main investment recommendations to capitalize on the economic trends you anticipate over the coming 6-12 months? Let’s start with the pessimists: Arthur: First, the rally in global cyclicals and China plays since December has been premature and is at risk of unwinding as global growth and cyclical profits disappoint. Historical evidence suggests that global share prices have not led but have actually been coincident with the global manufacturing PMI (Chart 18). The recent divergence is unprecedented. Chart 18 (ARTHUR)Global Stocks Historically Did Not Lead PMIs
Global Stocks Historically Did Not Lead PMIs
Global Stocks Historically Did Not Lead PMIs
Second, EM risk assets and currencies remain vulnerable. EM and Chinese earnings per share are shrinking. The leading indicators signal that the rate of contraction will deepen, at least the end of this year (Chart 19). Asset allocators should continue underweighting EM versus DM equities. Finally, my strongest-conviction, market-neutral trade is to short EM or Chinese banks and go long U.S. banks. The latter are much healthier than EM/Chinese ones, as we discussed in our recent report.6 Anastasios: The U.S. Equity Strategy team is shifting away from a cyclical and toward a more defensive portfolio bent. Our highest conviction view is to overweight mega caps versus small caps. Small caps are saddled with debt and are suffering a margin squeeze. Moreover, approximately 600 constituents of the Russell 2000 have no forward profits. Only one S&P 500 company has negative forward EPS. Given that both the S&P and the Russell omit these figures from the forward P/E calculation, this is masking the small cap expensiveness. When adjusted for this discrepancy, small caps are trading at a hefty premium versus large caps (Chart 20). Chart 19 (ARTHUR)China And EM Profits Are Contracting
China And EM Profits Are Contracting
China And EM Profits Are Contracting
Chart 20 (ANASTASIOS)Continue To Avoid Small Caps
Continue To Avoid Small Caps
Continue To Avoid Small Caps
We have also upgraded the S&P managed health care and the S&P hypermarkets groups. If the economic slowdown persists into early 2020, both of these defensive subgroups will fare well. In mid-April, we lifted the S&P managed health care group to an above benchmark allocation and posited that the selloff in this group was overdone as the odds of “Medicare For All” becoming law were slim. Moreover, a tight labor market along with melting medical cost inflation would boost the industry’s margins and profits (Chart 21). This week, we upgraded the defensive S&P hypermarkets index to overweight arguing that the souring macro landscape coupled with a firming industry demand outlook will support relative share prices (Chart 22). Chart 21 (ANASTASIOS)Buy Hypermarkets
Buy Hypermarkets
Buy Hypermarkets
Chart 22 (ANASTASIOS)Stick With Managed Health Care
Stick With Managed Health Care
Stick With Managed Health Care
Dhaval: To be fair, I am not a pessimist. Provided the global bond yield stays well below 2.5 percent, the support to risk-asset valuations will prevent a major dislocation. But in a growth down-oscillation, the big game in town will be sector rotation into pro-defensive investment plays, especially into those defensives that have underperformed (Chart 23). Chart 23 (DHAVAL)Switch Out Of Growth-Sensitives Into Healthcare
Switch Out Of Growth-Sensitives Into Healthcare
Switch Out Of Growth-Sensitives Into Healthcare
On this basis: Overweight Healthcare versus Industrials. Overweight the Eurostoxx 50 versus the Shanghai Composite and the Nikkei 225. Overweight U.S. T-bonds versus German bunds. Overweight the JPY in a portfolio of G10 currencies. Mathieu: And now, the optimists: Doug: So What? is the overriding question that guides all of BCA’s research: What is the practical investment application of this macro observation? But Why Now? is a critical corollary for anyone allocating investment capital: Why is the imbalance you’ve observed about to become a problem? As Herbert Stein said, “If something cannot go on forever, it will stop.” Imbalances matter, but Dornbusch’s Law counsels patience in repositioning portfolios on their account: “Crises take longer to arrive than you can possibly imagine, but when they do come, they happen faster than you can possibly imagine.” Look at Chart 24, which shows a vast white sky (bull markets) with intermittent clusters of gray (recessions) and light red (bear markets) clouds. Market inflections are severe, but uncommon. When the default condition of an economy is to grow, and equity prices to rise, it is not enough for an investor to identify an imbalance, s/he also has to identify why it’s on the cusp of reversing. Right now, as it relates to the U.S., there aren’t meaningful imbalances in either markets or the real economy. Chart 24 (DOUG)Recessions And Bear Markets Travel Together
Recessions And Bear Markets Travel Together
Recessions And Bear Markets Travel Together
Even if we had perfect knowledge that a recession would arrive in 18 months, now would be way too early to sell. The S&P 500 has historically peaked an average of six months before the onset of a recession, and it has delivered juicy returns in the year preceding that peak (Table 1). Bull markets tend to sprint to the finish line (Chart 25). If this one is like its predecessors, an investor risks significant relative underperformance if s/he fails to participate in its go-go latter stages. Table 1 (DOUG)The S&P 500 Doesn’t Peak Until Six Months Before A Recession …
What Goes On Between Those Walls? BCA’s Diverging Views In The Open
What Goes On Between Those Walls? BCA’s Diverging Views In The Open
Chart 25
We are bullish on the outlook for the next six to twelve months, and recommend overweighting equities and spread product in balanced U.S. portfolios while significantly underweighting Treasuries. Peter: I agree with Doug. Equity bear markets seldom occur outside of recessions and recessions rarely occur when monetary policy is accommodative. Policy is currently easy, and will get even more stimulative if the Fed and several other central banks cut rates. Global equities are not super cheap, but they are not particularly expensive either. They currently trade at about 15-times forward earnings. Given the ultra-low level of global bond yields, this generates an equity risk premium (ERP) that is well above its historical average (Chart 26). One should favor stocks over bonds when the ERP is high. Chart 26A (PETER)Equity Risk Premia Remain Elevated (I)
Equity Risk Premia Remain Elevated (I)
Equity Risk Premia Remain Elevated (I)
Chart 26B (PETER)Equity Risk Premia Remain Elevated (II)
Equity Risk Premia Remain Elevated (II)
Equity Risk Premia Remain Elevated (II)
The ERP is especially elevated outside the United States. This is partly because non-U.S. stocks trade at a meager 13-times forward earnings, but it also reflects the fact that bond yields are lower overseas. Chart 27 (PETER)EM And Euro Area Equities Outperform When Global Growth Improves
EM And Euro Area Equities Outperform When Global Growth Improves
EM And Euro Area Equities Outperform When Global Growth Improves
As global growth accelerates, the dollar will weaken. Equity sectors and regions with a more cyclical bent will benefit (Chart 27). We expect to upgrade EM and European stocks later this summer. A softer dollar will also benefit gold. Bullion will get a further boost early next decade when inflation begins to accelerate. We went long gold on April 17, 2019 and continue to believe in this trade. Rob: For fixed income investors, the most obvious way to play a combination of monetary easing and recovering global growth is to overweight corporate debt versus government bonds (Chart 28). Within the U.S., corporate bond valuations look more attractive in high-yield over investment grade. Assuming a benign outlook for default risk in a reaccelerating U.S. economy, with the Fed easing, going for the carry in high-yield looks interesting. Emerging market credit should also do well if we see a bit of U.S. dollar weakness and additional stimulus measures in China. Chart 28 (ROB)Best Bond Bets: Overweight Global Corporates & Inflation-Linked Bonds
Best Bond Bets: Overweight Global Corporates & Inflation-Linked Bonds
Best Bond Bets: Overweight Global Corporates & Inflation-Linked Bonds
European corporates, however, may end up being the big winner if the ECB chooses to restart its Asset Purchase Program and ramps up its buying of European company debt. There are fewer restrictions for the ECB to buy corporates compared to the self-imposed limits on government bond purchases. The ECB would be entering a political minefield if it chose to buy more Italian debt and less German debt, but nobody would mind if the ECB helped finance European companies by buying their bonds. If one expects reflation to be successful, a below-benchmark stance on portfolio duration also makes sense given the current depressed level of government bond yields worldwide. Yields are more likely to grind upward than spike higher, and will be led first by increasing inflation expectations. Inflation-linked bonds should feature prominently in fixed income portfolios, especially in the U.S. where TIPS will outperform nominal yielding Treasuries. Mathieu: Thank you very much to all of you. Below is a comparative summary of the main arguments and investment recommendations of each camp. Summary Of Views And Recommendations
What Goes On Between Those Walls? BCA’s Diverging Views In The Open
What Goes On Between Those Walls? BCA’s Diverging Views In The Open
What Goes On Between Those Walls? BCA’s Diverging Views In The Open
What Goes On Between Those Walls? BCA’s Diverging Views In The Open
Anastasios Avgeriou U.S. Equity Strategist anastasios@bcaresearch.com Peter Berezin Chief Global Strategist peterb@bcaresearch.com Arthur Budaghyan Chief Emerging Markets Strategist arthurb@bcaresearch.com Dhaval Joshi Chief European Investment Strategist dhaval@bcaresearch.com Doug Peta Chief U.S. Investment Strategist dougp@bcaresearch.com Robert Robis Chief Fixed Income Strategist rrobis@bcaresearch.com Mathieu Savary The Bank Credit Analyst mathieu@bcaresearch.com Footnotes 1 To be fair to each individual involved, this is simplifying their views. Even within each camp, the negativity or positivity ranges on a spectrum, as you will be able to tell from the debate itself. 2 Please see BCA U.S. Equity Strategy Weekly Report, “Signal Vs. Noise,” dated December 17, 2018, available at uses.bcaresearch.com. 3 Please see BCA U.S. Equity Strategy Weekly Report, “A Recession Thought Experiment,” dated June 10, 2019, available at uses.bcaresearch.com. 4 Please see the European Investment Strategy Weekly Report “Risk: The Great Misunderstanding Of Finance,” October 25, 2018 available at eis.bcaresearch.com. 5 France is a good proxy for the euro area. 6 Please see Emerging Markets Strategy Weekly Report, “On Chinese Banks And Brazil,” available at ems.bcaresearch.com.
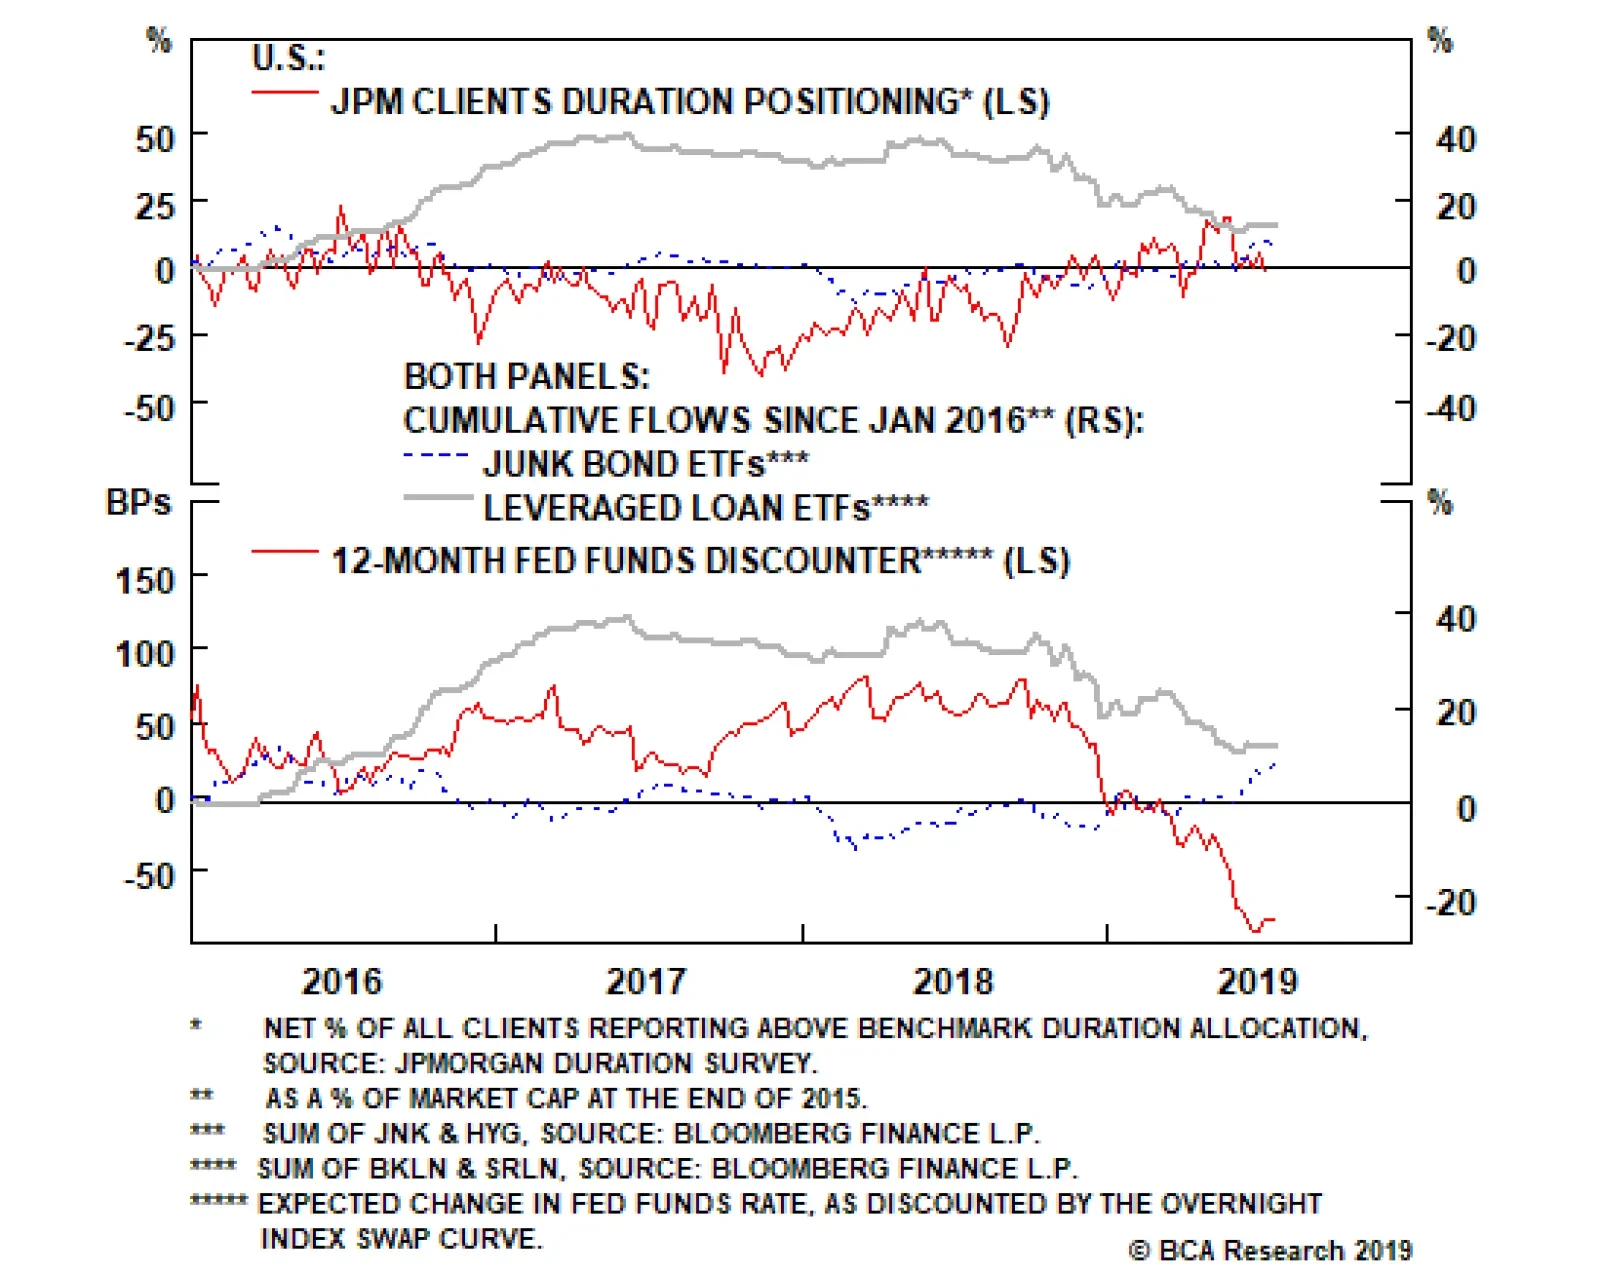
The demand for leveraged loan products is volatile, but that might actually be a good thing for economic stability. The surge in leveraged loans over the past two years has not only been related to demand from private equity funds and CLOs. U.S. retail…
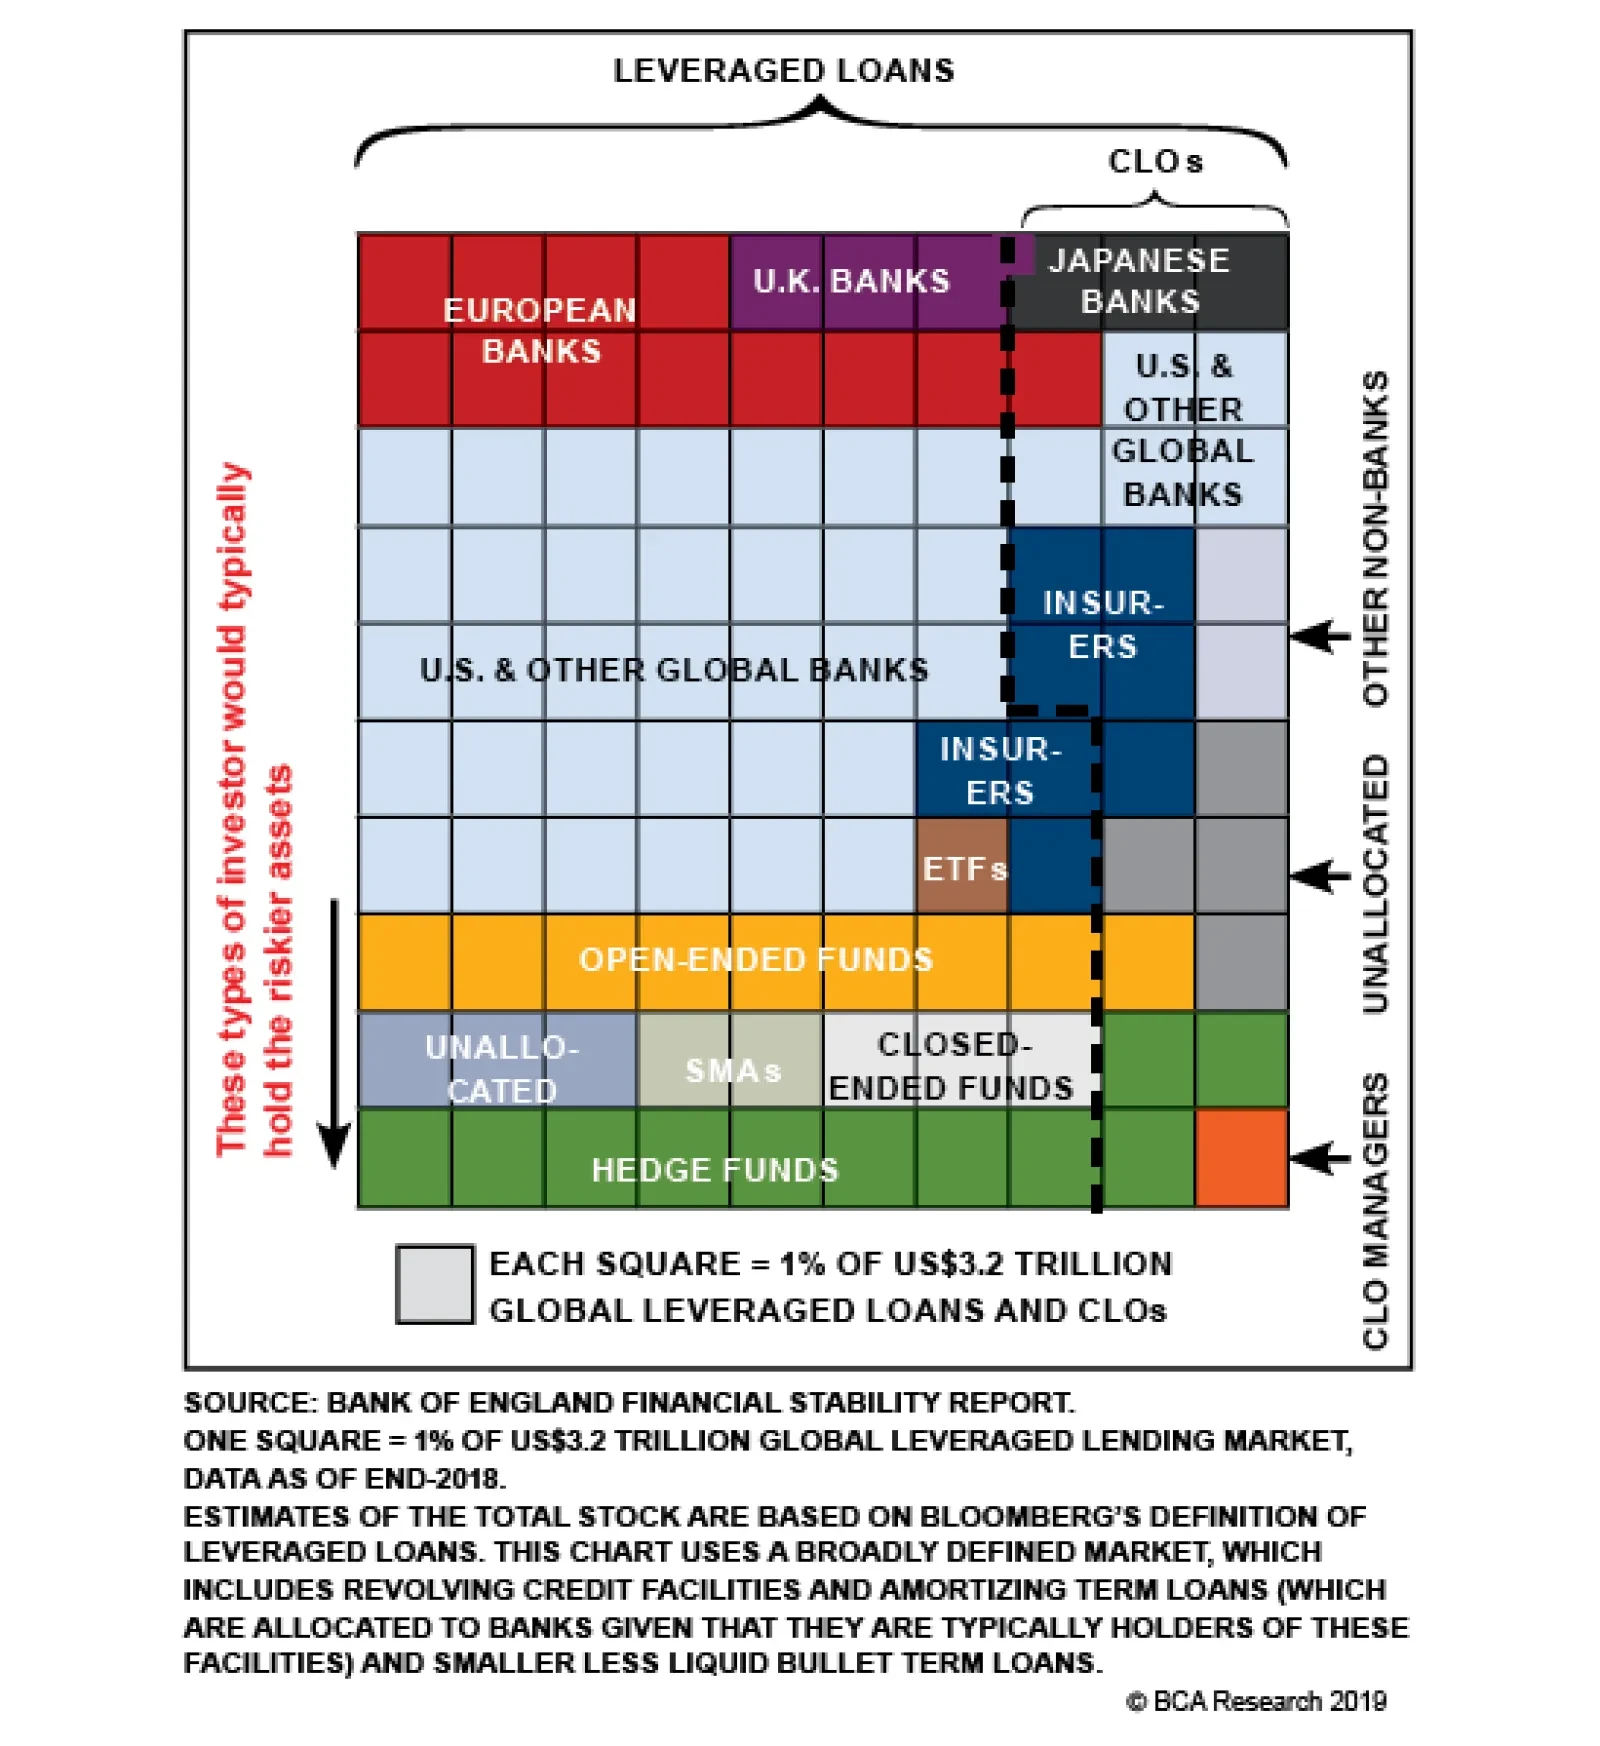
The ownership structure of leveraged loans (and CLOs) is diverse enough to not create systemic problems. We have recreated a chart from the BoE’s July 2019 Financial Stability Report, which colorfully shows the ownership of global leveraged loans and CLOs.…
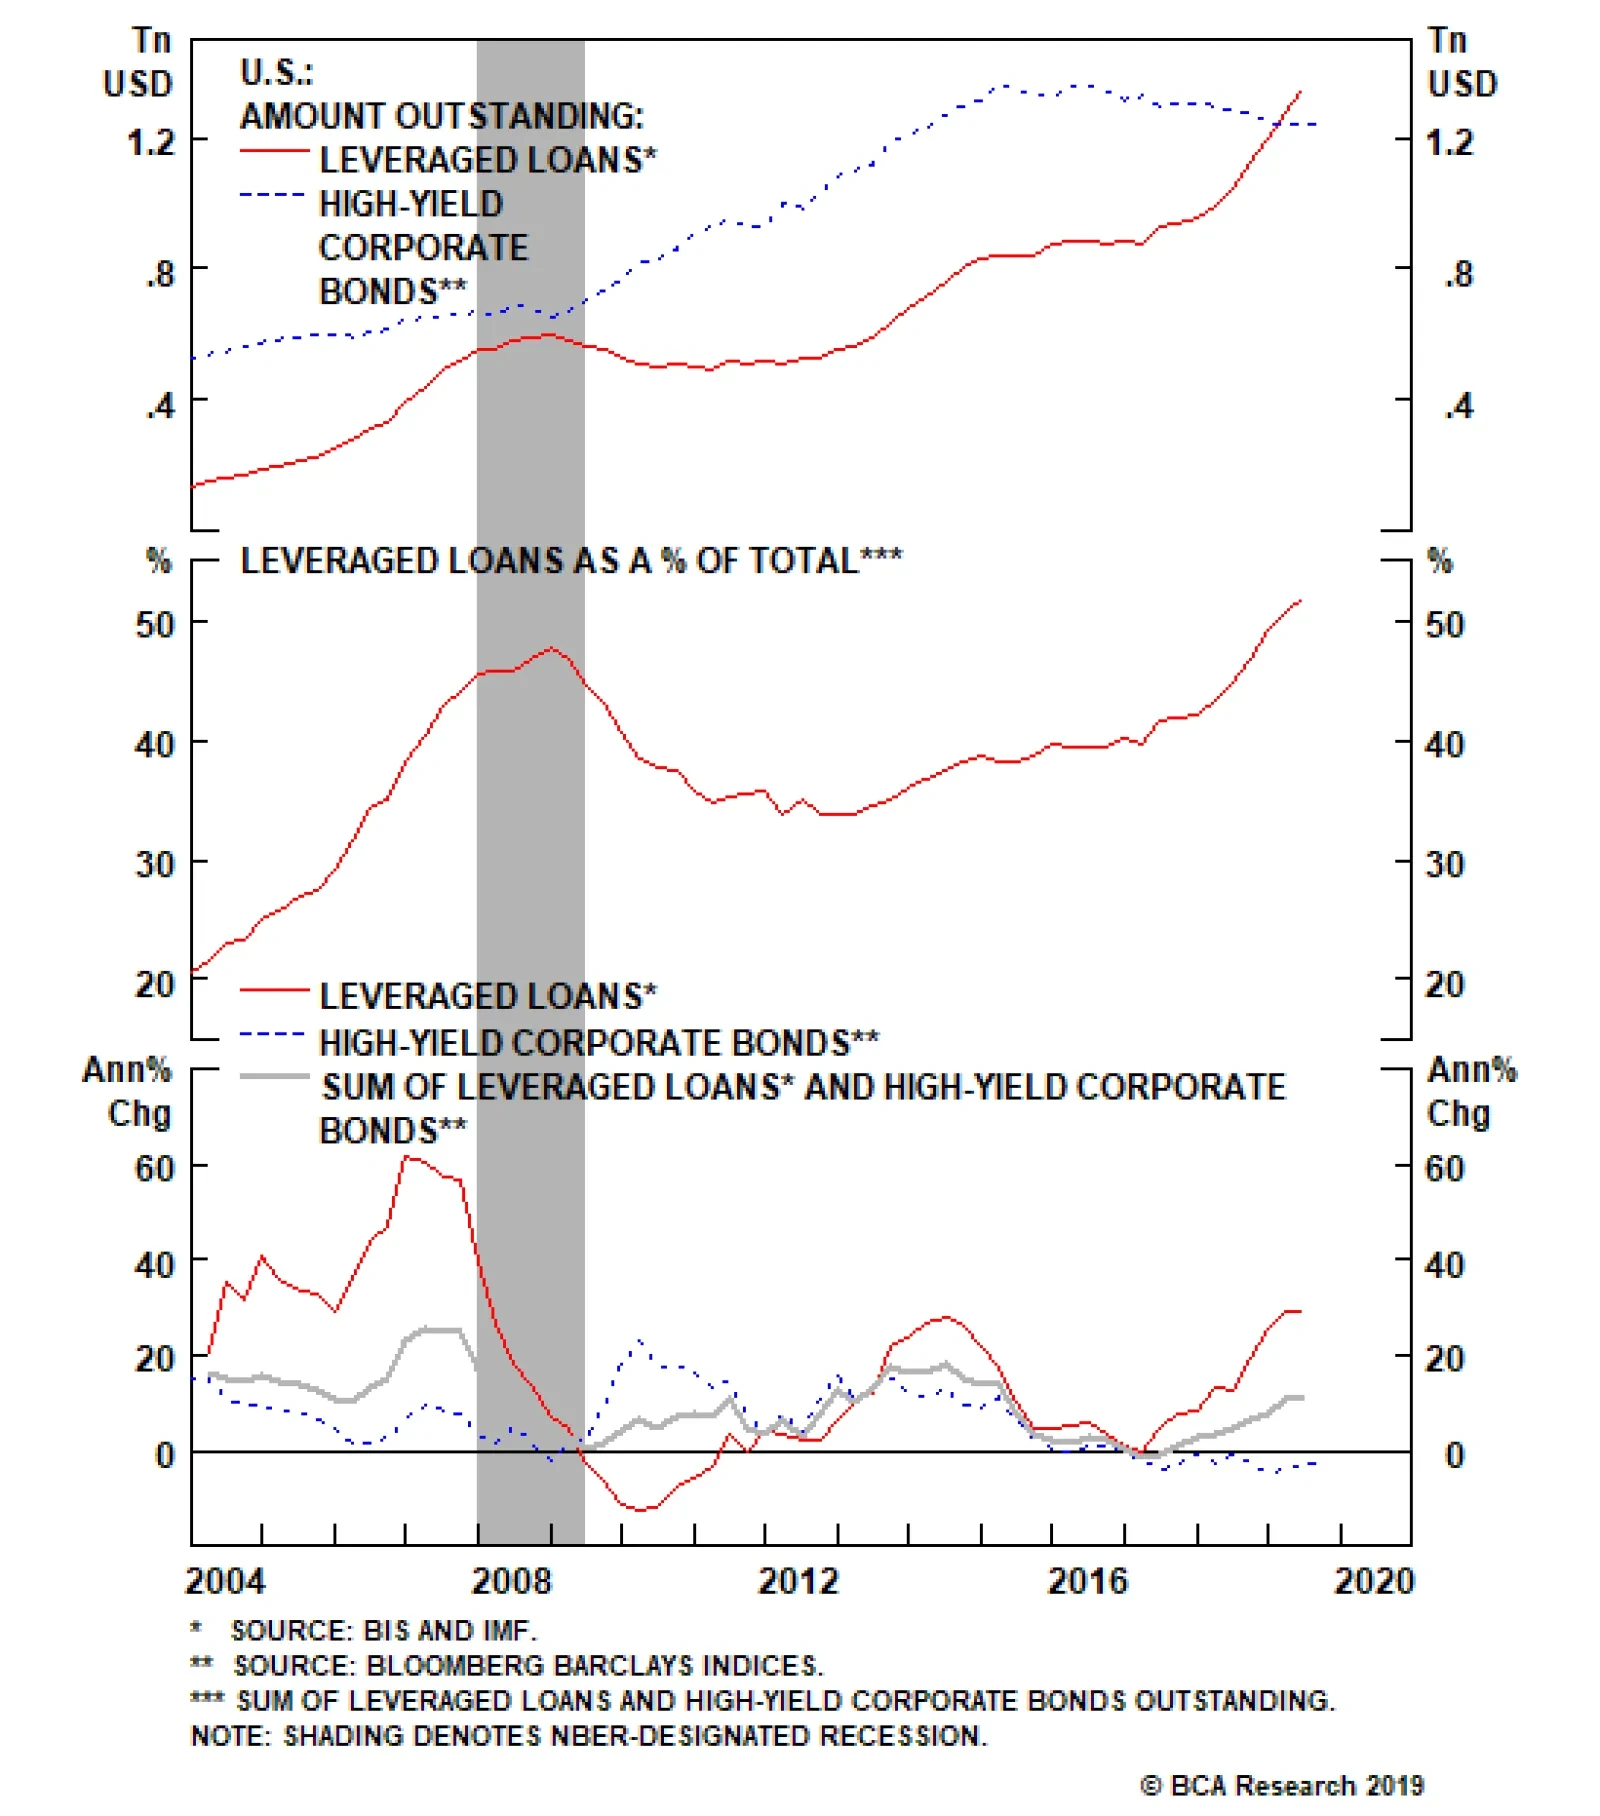
That concern is understandable, as it would be a dereliction of duty for any policymaker or regulator who lived through the 2008 financial crisis to not consider the potential risks to financial stability and future economic growth from a surge in lower…
Highlights Mutual Funds & ETFs: The liquidity mismatch between easily tradeable mutual fund shares and the less liquid underlying corporate bonds makes it possible for negative feedback loops to emerge between fund flows and corporate bond spreads. The growing presence of open-ended mutual funds and ETFs in the corporate bond market should be seen as a risk that could exacerbate future periods of spread widening, leading to worse economic outcomes. BBB Securities: The large amount of outstanding BBB debt could lead to fire sales from corporate bond holders with investment grade-only mandates when the debt is downgraded to junk. However, in contrast to the negative feedback loop that can be generated by mutual fund flows, the evidence shows that the negative price pressure from fallen angel fire sales is fleeting. Leveraged Loans: The rapid surge in leveraged loans has been partially offset by reduced high-yield issuance, helping mitigate a potentially destabilizing rise in all riskier corporate debt. At the same time, bank exposure is focused on the safest CLO tranches, limiting the potential systemic risks from bank losses. Feature In April, we published a Special Report that investigated whether corporate debt poses a risk to the U.S. economy.1 That report focused on what economic theory and empirical evidence say about the relationship between corporate debt and future economic growth. We arrived at the following conclusions: The empirical evidence decisively shows that private (household + business) debt helps predict future economic outcomes. Some evidence shows that household debt is more important than corporate debt in this regard. In contrast to mainstream economic theory, the level of private debt-to-GDP does not help predict future economic outcomes. Rather, it is rapid private debt growth that is linked to more severe economic downturns. Ebullient credit market sentiment is also shown to predict weak economic growth. Tight credit spreads should be viewed as a warning sign, similar to rapid private debt growth. In this follow-up Special Report, we consider three credit market developments that are unique to this cycle: The large ownership stake of open-ended mutual funds and ETFs in the U.S. corporate bond market. The elevated amount of BBB-rated debt outstanding relative to other credit tiers. The rapid issuance of leveraged loans. All three of these developments could mediate the relationship between corporate debt and economic growth, potentially increasing risks to the economy. We consider each factor in turn. 1. Fund Flows One unique feature of the current cycle is that open-ended mutual funds and ETFs own a much larger share of outstanding corporate bonds than in the past. Back in 1990, insurance companies and pension funds were the largest holders of corporate debt, controlling 54% of the market. Meanwhile, open-ended funds owned a paltry 3%. Since then, fund ownership has surged to 16%, mostly at the expense of financial institutions, insurance companies and pensions. Foreign holdings of U.S. corporate bonds have also increased during this period, from 13% of the market to 28% (Charts 1 & 2).
Chart 1
Chart 2Mutual Funds Now An Important Market Player
Mutual Funds Now An Important Market Player
Mutual Funds Now An Important Market Player
Why Does Fund Ownership Matter? We focus on fund ownership of corporate bonds because it has been theorized that flows into and out of open-ended mutual funds can have a similar impact on market prices as leverage, amplifying price moves in either direction. As described in a 2014 paper by Feroli, Kashyap, Shoenholtz, and Shin:2 [W]hen asset flows for certain fixed income securities are high, prices persistently rise and a feedback loop emerges. High flows lead to rising prices, which attract more flows, which further raises prices. Obviously, the proposed feedback loop also works in reverse: Outflows cause prices to decline, and lower prices lead to further outflows. This sort of feedback loop is unique to mutual funds. Insurance companies and pension funds, for example, do not experience investor capital flight in response to a near-term price drop. This makes the larger presence of mutual funds in the corporate bond market potentially destabilizing. Fund ownership has surged to 16%, from a paltry 3% back in 1990. Why Do Fund Flows Behave This Way? Mutual fund shares are much more liquid than the corporate debt securities they hold. As described in a 2017 paper by Goldstein, Jiang and Ng:3 When [mutual] fund investors redeem their shares, they get the net asset value as of the day of redemption. The fund then has to conduct costly liquidation that hurts the value of the shares for investors who keep their money in the fund. Hence, the expected redemption by some investors increases the incentives for others to redeem. In other words, during times of stress, mutual fund investors have an incentive to withdraw their money before other fund shareholders get the chance. Otherwise, they could be stuck holding a basket of illiquid corporate bonds. This bank-run like behavior is well documented for corporate and municipal bond funds, though it appears not to exist for funds that traffic in more liquid instruments, such as Treasuries and equities. In fact, when Goldstein et al looked at how flows into and out of individual corporate bond and equity funds respond to past fund performance, they found that the Flow-Performance curve for an individual corporate bond fund exhibits a pronounced concave shape. Meanwhile, the same curve for an individual equity fund is convex (Chart 3). This means that corporate bond mutual fund shareholders are quick to redeem their shares in response to poor fund performance, while equity fund shareholders are more inclined to stand pat. On the flipside, positive fund performance leads to large equity fund inflows, but doesn’t attract capital to corporate bond funds to the same extent. The above results apply to individual funds, but Goldstein et al also performed the same analysis for corporate bond funds in the aggregate. That is, rather than measuring whether investors sold a particular corporate bond mutual fund in response to its poor performance, they measured whether investors exited the corporate bond mutual fund space altogether in response to poor corporate bond performance. Interestingly, they found a very similar result (Chart 4). Investors are inclined to exit the corporate bond space entirely following periods of poor performance. Meanwhile, they found no relationship between aggregate equity fund flows and performance. Investors might switch between different equity funds in response to recent performance trends, but they don’t exit the asset class altogether.
Chart 3
Chart 4
These results provide a clear indication for why the large presence of corporate bond mutual funds might be destabilizing. Corporate bond fund investors are quick to flee the space during periods of poor performance. For more liquid securities, such as equities and Treasuries, a large mutual fund presence in the market is not a concern, since flows do not respond as aggressively to price shocks. Empirical Evidence For The Flow-Performance Feedback Loop The evidence presented above shows that fund flows respond to performance, but for the theorized feedback loop between fund flows and corporate bond prices to exist, we also need evidence that fund flows impact corporate bond performance. In that regard, a 2019 Banque de France working paper examines the impact of aggregate flows into French corporate bond funds on the yields of the underlying securities.4 It finds that not only do flows impact yields contemporaneously, but also that outflows have a larger influence on yields than inflows. Using a different methodology, a 2015 paper by Hoseinzade finds no material impact of fund flows on underlying corporate bond yields, but for an interesting reason.5 The paper confirms that corporate bond fund shareholders demonstrate bank-run like behavior in response to poor performance, but also argues that “bond fund managers hold a significant level of liquid assets, allowing them to manage redemptions without excessively liquidating corporate bonds.” Chart 5Funds Deploy Cash Before Selling Bonds
Funds Deploy Cash Before Selling Bonds
Funds Deploy Cash Before Selling Bonds
It’s true that corporate bond mutual funds often hold significant allocations to cash and U.S. Treasuries, and Hoseinzade shows that fund managers tend to discharge their most liquid holdings first, before attempting to sell corporate bonds. This result lines up with our casual observation. Chart 5 shows the aggregate liquid asset (cash and Treasury) holdings of corporate bond mutual funds. It is apparent that they tend to fall during periods of spread widening. We also note that corporate bond mutual funds, in aggregate, currently hold about 6% of their assets in liquid securities. This buffer can probably withstand a sizeable shock, but liquid assets fell from similar levels into negative territory during each of the past two recessions. One other factor that could help break the feedback loop between fund flows and prices is the institutional ownership of corporate bond mutual funds. Goldstein et al find that mutual funds mostly owned by institutional investors exhibit less of a feedback loop between flows and performance. That is, large institutional investors are less likely to redeem their shares in response to a bout of poor performance. While we don’t have data on corporate bond mutual fund ownership specifically, Federal Reserve data reveal that insurance companies and pension funds own a significantly larger proportion of outstanding mutual fund shares than in the 1990s, though less than they did in the mid-2000s (Chart 6). Note that Chart 6 shows data for all mutual funds, including equity funds, Treasury funds, etc… Chart 6Institutional Ownership Of Mutual Funds
Institutional Ownership Of Mutual Funds
Institutional Ownership Of Mutual Funds
We conclude that there is enough evidence of a feedback loop between fund flows and corporate bond prices that we should be wary of the growing presence of open-ended mutual funds and ETFs in the corporate bond space. Cash holdings and institutional ownership can help mitigate negative flow/performance feedback loops to some extent, but probably shouldn’t be counted on in the event of a severe shock. What’s The Economic Impact? In our corporate debt Special Report from April, we postulated that changes in corporate bond spreads might, themselves, cause an economic downturn, rather than simply reflect one. The mechanism is summarized nicely by Lopez-Salido, Stein and Zakrajsek (2016):6 [a] sentiment-driven widening of credit spreads amounts to a reduction in the supply of credit, especially to lower credit-quality firms. It is this reduction in credit supply that exerts a negative influence on economic activity. With that in mind, in the current environment it seems very possible that an initially sentiment-driven credit spread widening could be exacerbated by outflows from corporate bond mutual funds. A larger shock to credit spreads leads to a larger reduction in credit supply and a more severe economic impact. Aggregate liquid asset holdings of corporate bond mutual funds tend to fall during periods of spread widening. Bottom Line: The liquidity mismatch between easily tradeable mutual fund shares and the less liquid underlying corporate bonds makes it possible for negative feedback loops to emerge between fund flows and corporate bond spreads. The growing presence of open-ended mutual funds and ETFs in the corporate bond market should be seen as a risk that could exacerbate future periods of spread widening, leading to worse economic outcomes. 2: BBB Debt Outstanding Chart 7The Large Amount Of BBB Debt
The Large Amount Of BBB Debt
The Large Amount Of BBB Debt
It has been widely reported that an unusually large amount of outstanding corporate bonds are rated BBB, the lowest credit rating that is still considered investment grade. In fact, the par value of BBB-rated securities now makes up 50% of the Bloomberg Barclays Investment Grade index, up from 21% in 1990 (Chart 7). The amount of outstanding BBB securities is more than double the par value of the Bloomberg Barclays High-Yield index, and BBBs represent 41% of the total combined par value of the investment grade and high-yield indexes. The reason to be wary about the large amount of outstanding BBB debt is that when the credit cycle turns and ratings downgrades start to occur, a larger than normal amount of debt will be downgraded from investment grade into high-yield. When that happens, any investors with an investment grade-only mandate will be forced to sell. The concern is that such forced selling could set off a negative feedback loop very similar to the one discussed in the first section. An added layer of risk comes from the fact that in addition to investment grade-only mutual funds, insurance companies and pension funds – who still control 35% of the corporate bond market (see Chart 2 on page 3) – are often burdened with larger capital costs for high-yield debt. This means that a very large pool of investors could be impacted by a spate of BBB downgrades. In terms of the potential market impact, a 2010 paper by Ellul, Jotikasthira and Lundblad investigated fire sales of downgraded corporate bonds induced by regulatory constraints.7 The authors found that insurance companies often engage in the forced selling of bonds that have been recently downgraded into high-yield. Further, the downgraded bonds experience negative near-term price pressure from the fire sale, but that pressure tends to reverse after a few months. The finding that the negative price pressure is fleeting is important. In contrast to the negative feedback loop that can be generated by mutual fund flows, BBB securities can only be downgraded to high-yield once. In other words, once the initial fire sale of fallen angel debt takes place, there is no mechanism to force the downward price pressure to continue.8 Bottom Line: The large amount of outstanding BBB debt could lead to fire sales from corporate bond holders with investment grade-only mandates when the debt is downgraded to junk. However, in contrast to the negative feedback loop that can be generated by mutual fund flows, the evidence shows that the negative price pressure from fallen angel fire sales is fleeting. 3. Leveraged Loans The rapid growth of leveraged loans – lending made to below investment-grade borrowers - over the past couple of years has caught the attention of global central banks and financial regulators. That concern is understandable, as it would be a dereliction of duty for any policymaker or regulator who lived through the 2008 financial crisis to not consider the potential risks to financial stability and future economic growth from a surge in lower quality lending. This is especially true given the increase in the number of securitized instruments linked to leveraged loans – collateralized loan obligations, or CLOs – which evokes memories of the toxic subprime mortgage products that helped trigger the 2008 crisis. Although as the Fed’s Vice Chair for Supervision, Randal Quarles, recently noted, the financial media has been overplaying the leveraged loan story in such a way that it felt like “the Earth must be getting hit by an asteroid.” The BoE estimates that the CLOs would have to suffer a loss more than twice as severe as seen during the 2008 financial crisis for the AAA-rated piece of CLOs issued in 2018 to incur losses. The leveraged loan and CLO markets can be opaque. However, based on the information we do have from credible sources like central banks, the IMF and the BIS, some conclusions can be made about the potential economic risks from the rapid build-up of U.S. leveraged loans: Leveraged loan expansion has been partially offset by high-yield contraction. Chart 8More Leveraged Loans, Less Junk Bonds
More Leveraged Loans, Less Junk Bonds
More Leveraged Loans, Less Junk Bonds
Based on estimates from the BIS and IMF, there are around $1.4 trillion in U.S. leveraged loans outstanding, which is greater than the $1.2 trillion U.S. high-yield bond market (Chart 8). That is an all-time high in the dollar amount of leveraged loans, as well as for the share of all lower-rated corporate debt accounted for by loans. The annual growth rate of U.S. leveraged loans is now a whopping 29% - the fastest pace seen since 2007. Yet the growth of the total amount of leveraged loans plus high-yield bonds is a much lower 12%. While that is still a large number, it is below the peak growth rates seen during the past fifteen years. This is because the amount of high-yield bonds outstanding has been modestly contracting since 2015. Much of that run-up in leveraged loan growth has been to satiate the demand for loans created by private equity funds and, more importantly, CLOs. The strong risk appetite from investors resulted in a notable deterioration in lending standards, with loans coming out at higher leverage multiples (debt/EBITDA) and with reduced investor covenant protection. Yet since lower-rated companies were not ramping up high-yield bond issuance at the same time, the economic stability risks from a rapid run-up in total riskier borrowing are lower, on the margin. The ownership structure of leveraged loans (and CLOs) is diverse enough to not create systemic problems.
Chart 9
To date, the Bank of England (BoE) has compiled the most detailed estimates of the ownership breakdown of both leveraged loans and CLOs.9 In Chart 9, we have recreated a chart from the BoE’s July 2019 Financial Stability Report, which colorfully shows the ownership of global leveraged loans and CLOs. The way to read the chart is that each square represents a 1% share of the estimated $3.2 trillion of global leveraged loans and CLOs. The split in the chart is 75% loans and 25% CLOs (CLO ownership is shown on the right side of the thick dotted line). The biggest category of leveraged loan investor is what the BoE titled “U.S. and other global banks”, a group that represents 38% of total loans and CLOs. European banks own 12%, U.K. banks own 3% and Japanese banks own 3% (entirely through CLOs), thus bringing the global bank exposure to 56% of all leveraged loan instruments. While that sounds like a large number, the majority of that is in the form of revolving credit facilities – effectively, overdraft facilities to lower-rated borrowers. Revolving credit facilities are typically less risky than leveraged loans, because credit facilities have greater covenant protection and even more seniority in terms of creditor claims on borrower assets. The BoE estimates that 40% of all global leveraged loans and CLOs are owned by non-bank investors. This includes pension funds, insurance companies and investment funds (mutual funds and ETFs). Chart 9 shows how much more diverse the investor base is for CLOs than for other leveraged loans. It suggests that any future potential losses from CLOs will be distributed more evenly within the financial system, rather than being concentrated in the banks. Chart 10Leveraged Loan Losses Are Typically Lowered Compared To Junk
Leveraged Loan Losses Are Typically Lowered Compared To Junk
Leveraged Loan Losses Are Typically Lowered Compared To Junk
Even within the bank holdings of CLOs, the systemic risks are lessened. The BoE noted that the increased amount of subordination (i.e. lower-rated tranches) of more recent CLO deals helps protect the senior tranches from losses. According to the BoE, the AAA-rated piece of a representative sample of CLOs issued in 2018 was 63%; this compares to 70% for CLOs issued in 2006.10 Furthermore, the central bank estimates that the CLOs would have to suffer a loss more than twice as severe as seen during the 2008 financial crisis for the AAA-rated piece of CLOs issued in 2018 to incur losses. That would be an extraordinary outcome, given how 2008 generated losses on leveraged loans that were over twice as bad as the previous worst year in 2002 (Chart 10). Potential losses from AAA tranches are important from a financial stability perspective. The BoE estimates that 40% of all CLOs are owned by global banks (including a large 13% share from yield-chasing Japanese banks). These banks tend to focus on safer AAA-rated CLO tranches. The demand for leveraged loan products is volatile, but that might actually be a good thing for economic stability. The surge in leveraged loans over the past two years has not only been related to demand from private equity funds and CLOs. U.S. retail investors have also been big buyers of mutual funds and ETFs linked to the leveraged loan market, as a way to seek out higher credit returns against a backdrop of Fed rate hikes. Chart 11Fed Rate Expectations Drive The Demand For Loans Vs Bonds
Fed Rate Expectations Drive The Demand For Loans Vs Bonds
Fed Rate Expectations Drive The Demand For Loans Vs Bonds
Leveraged loans are floating rate instruments. Thus, they are more desirable than fixed-rate high-yield corporate debt when short-term interest rates are rising. This is seen in Chart 11, where we show net flows into the largest U.S. junk bond and leveraged loan ETFs. These flows are plotted with the JP Morgan survey of bond investor duration positioning (top panel) and our Fed Funds Discounter that measures the market-implied expected change in the fed funds rate over the next year (bottom panel). The conclusion is obvious – there was very strong retail demand for floating-rate leveraged loans over fixed-rate junk bonds during 2016-18 when expected rate hikes justified defensive duration positioning. In 2019, the tables have turned. The Fed is more dovish, rate cuts are now expected, investors have been adding duration exposure, and demand for leveraged loan funds has plunged while high-yield bond funds have been seeing inflows. The exodus from all leveraged loan funds has been historically large, with Lipper reporting that there were 33 straight weeks of outflows to July 3, 2019, for a total of $32 billion.11 Already, that reduced demand for leveraged loans has translated into sharply reduced issuance of new U.S. CLOs, which was 73% lower in the first half of 2019 versus the same period in 2018 (Chart 12). At the same time, high-yield bond issuance was up 20% in the first six months of 2019 versus 2018. The reduced demand for leveraged loans has also shifted the balance of power back to lenders, as the share of U.S. leveraged loans that have been issued with limited covenant protection (“cov-lite”) has plunged from 72% in 2018 to around 40% (Chart 13). Chart 12Lower-Rated Issuance Is "Self-Regulating"
Lower-Rated Issuance Is "Self-Regulating"
Lower-Rated Issuance Is "Self-Regulating"
Chart 13Reduced Covenant-Lite Issuance So Far In 2019
Reduced Covenant-Lite Issuance So Far In 2019
Reduced Covenant-Lite Issuance So Far In 2019
This is a critical point on the potential stability risks from leveraged loans – the market for those loans is “self-regulating”, based on final demand from investors who “toggle” between floating rate and fixed rate credit instruments. This helps limit the growth in overall corporate indebtedness, helping to put off the date when credit booms turn into future credit busts. Ryan Swift, U.S. Bond Strategist rswift@bcaresearch.com Robert Robis, CFA, Chief Fixed Income Strategist rrobis@bcaresearch.com Footnotes 1 Please see U.S. Bond Strategy / Global Fixed Income Strategy Special Report, “The Risk From U.S. Corporate Debt: Theory And Evidence”, dated April 23, 2019, available at usbs.bcaresearch.com 2 https://www.nowpublishers.com/article/DownloadEBook/9781680834864?format=pdf 3 http://finance.wharton.upenn.edu/~itayg/Files/bondfunds-published.pdf 4 https://ideas.repec.org/p/bfr/banfra/706.html 5 https://pdfs.semanticscholar.org/5a60feab84a7d10de084abfce414b5888d5586e2.pdf 6 https://www.nber.org/papers/w21879 7 https://pdfs.semanticscholar.org/55a4/8602b17bc7e7f8428695ab6a3ef2c87756ab.pdf 8 Corporate bonds that are downgraded from investment grade to high-yield are called fallen angels. 9 The Financial Stability Board, the international body that monitors and makes recommendations on the global financial system, is due to publish a comprehensive analysis of the ownership structure of the leveraged loan market in the autumn of 2019. 10 For a more detailed description of this analysis, see pages 28 & 29 of the Bank of England’s July 2019 Financial Stability report, which can be found here: https://www.bankofengland.co.uk/financial-stability-report/2019/july-20… 11 https://www.spglobal.com/marketintelligence/en/news-insights/latest-news-headlines/leveraged-loan-news/leveraged-loan-fund-withdrawal-streak-hits-record-33-weeks-totaling-32b