Fixed Income

Highlights Fed: Depressed U.S. Treasury yields now discount more rate cuts than the FOMC is likely to deliver, even for “insurance” purposes to offset the negative growth impacts from trade policy uncertainty. Maintain a below-benchmark strategic U.S. duration stance, and stay underweight the U.S. in global hedged government bond portfolios. JGBs: The low yield beta of Japanese government bonds can be a useful diversifier of duration risk in global government bond portfolios. We recommend taking advantage of this by increasing allocations to Japan, out of U.S. Treasuries, on a currency-hedged basis (in USD). Feature June FOMC Preview: Hawks & Doves, Living Together, Mass Hysteria! The next two days will be critical for global bond markets, with the U.S. Federal Reserve set to update its outlook for U.S. monetary policy. The only logical interpretation of current market pricing is that bond investors now expect a major hit to U.S. (and global) business confidence and economic growth from a U.S.-China trade war - without any lasting pickup in U.S. inflation from the tariffs. The Fed is stuck in a difficult position at the moment. Looking purely at the state of the economy, there is no immediate need for rate cuts. The unemployment rate is still low at 3.6%; real GDP growth was a solid 3.1% in Q1 and the Atlanta Fed’s GDPNow model estimates Q2 growth will be a trend-like 2.1%; and consumer confidence remains healthy. Our Global Duration Indicator has hooked up, driven by an improving global leading economic indicator and stabilizing economic sentiment surveys. Yet despite this, U.S. Treasury yields have melted down to levels consistent with much weaker economic growth and inflation, with -83bps of Fed rate cuts now discounted over the next twelve months (Chart of the Week). Chart of the WeekToo Much Economic Pessimism Now Discounted In U.S. Treasury Yields
Too Much Economic Pessimism Now Discounted In U.S. Treasury Yields
Too Much Economic Pessimism Now Discounted In U.S. Treasury Yields
Chart 2U.S. Business Confidence: Fraying On The Edges
U.S. Business Confidence: Fraying On The Edges
U.S. Business Confidence: Fraying On The Edges
The only logical interpretation of current market pricing is that bond investors now expect a major hit to U.S. (and global) business confidence and economic growth from a U.S.-China trade war - without any lasting pickup in U.S. inflation from the tariffs. Reducing interest rates now would be the appropriate pre-emptive policy response, even if the current health of the economy does not justify a need to ease. A look at various U.S. business confidence surveys confirms that interpretation. Both the NFIB Small Business Confidence index and the Duke CFO U.S. Economic Outlook index are still at fairly high levels, but have clearly softened in recent months (Chart 2, top panel). The deterioration in the Duke CFO measure has come from a sharp fall in the percentage of respondents who are more optimistic on the U.S. economic outlook – a move mirrored by the deterioration in the Conference Board’s survey of CEO Confidence (second panel). On the inflation side, the Duke CFO survey shows that companies have dramatically cut back on their planned increases for labor compensation over the next year, from 5.1% in the March survey to 3.8% in the June survey (third panel). Plans for price increases over the next year have also collapsed from 2.7% to 1.4% in the June survey (bottom panel). As the FOMC deliberates, the doves will make the following case for an insurance rate cut now (Chart 3): The U.S. manufacturing sector has caught up with the global downturn. Market-based inflation expectations remain below levels consistent with the Fed’s 2% PCE inflation target (between 2.3% and 2.4% using CPI-based TIPS breakevens). The 10-year/3-month U.S. Treasury yield curve remains inverted, typically a sign that monetary policy has become restrictive. The trade-weighted dollar remains near the post-crisis highs, even as U.S. bond yields have plunged. Global economic policy uncertainty remains elevated. Meanwhile, the hawks on the FOMC will argue that easing would be premature (Chart 4): Chart 3The Case For Fed Rate Cuts
The Case For Fed Rate Cuts
The Case For Fed Rate Cuts
Chart 4The Case Against Fed Rate Cuts
The Case Against Fed Rate Cuts
The Case Against Fed Rate Cuts
U.S. equities are only 2% below the all-time high. High-yield spreads are stable and nowhere close to the peaks seen during previous bouts of market turmoil. A similar argument applies for market volatility, with the VIX index also relatively subdued in the mid-teens. Global leading economic indicators are bottoming out. Underlying realized inflation trends – average hourly earnings growth, trimmed mean inflation measures – are sticky, at cyclical highs. Given the compelling arguments on both sides, the most likely outcome tomorrow will be the Fed holding off on cutting rates, but making a clear case for what it will take to ease at the July 30-31 FOMC meeting. We imagine that checklist to include: a) Failure of U.S.-China trade talks at the G-20 summit later this month to progress toward an agreement. b) The June U.S. Payrolls report, to be released on July 5th, confirming that the soft May reading was not a one-off. c) The June Consumer Price Index report to be released on July 11th, and the May PCE deflator reading out on July 28th, showing no acceleration of some of the “transitory” components that the Fed believes has been dampening U.S. core inflation. d) A major pullback in U.S. equities and/or a widening of U.S. corporate bond spreads, leading to tighter U.S. financial conditions. Chart 5The Market & FOMC Disagree On The Terminal Rate
The Market & FOMC Disagree On The Terminal Rate
The Market & FOMC Disagree On The Terminal Rate
A new set of FOMC economic projections will be unveiled at this meeting, providing the intellectual cover for the Fed to signal that a rate cut is imminent. A new set of interest rate projections will also be provided. While this current edition of the FOMC has been downplaying the importance of the message implied by those interest rate projections, any movement in the “dots” will be noticed by the markets. The dot plot has only existed in a phase of expected Fed tightening. A shift to a projected ease would be momentous. In particular, any shift in the longer run “terminal rate” dot would be critical to ascertaining the Fed’s reaction function (Chart 5). This is especially true given the wide gap between our estimate of the market expectation of the terminal funds rate for this cycle (the 5-year U.S. Overnight Index Swap rate, 5-years forward, which is currently at 2%) and the median FOMC member estimate of the terminal rate from the last set of economic projections in March (2.8%). If the Fed were to make the case for an insurance rate cut tomorrow, while also lowering the terminal rate estimate, this would suggest that the FOMC was growing more concerned over the medium-term economic outlook as fewer future rate hikes would be needed. More dovish guidance on near-term rate moves, but without any change in the terminal rate projection, would imply that the Fed would view any insurance rate cut as a temporary measure that would need to be reversed at a later date if global uncertainty abates, U.S. growth recovers and U.S. inflation rebounds. Whatever the outcome of this week’s FOMC meeting, U.S. Treasury yields now discount a lot of bad news on both growth and inflation. Both the real and inflation expectations component of the benchmark 10-year Treasury yield are at critical support levels (Chart 6), suggesting that yields can only decline further in the face of incrementally more bearish economic data. Given the risk/reward tradeoff of yields at current levels, we do not recommend chasing this Treasury market rally, and prefer to position for an eventual rebound in yields. Chart 6Not Much Downside Left For Treasury Yields
Not Much Downside Left For Treasury Yields
Not Much Downside Left For Treasury Yields
It is possible that the Fed gives a message this week that is more hawkish than the market expects, similar to last December, leading to a sharp selloff in risk assets that temporarily pushes the 10-year Treasury yield to 2%. Such an outcome would eventually force the Fed’s hand to cut rates down the road to offset the tightening of financial conditions and stabilize equity and credit markets. This will eventually trigger a rebound in Treasury yields via rising inflation expectations and investors’ moving out of bonds into risky assets. Given the risk/reward tradeoff of yields at current levels, we do not recommend chasing this Treasury market rally, and prefer to position for an eventual rebound in yields. Bottom Line: Depressed U.S. Treasury yields now discount more rate cuts than the FOMC is likely to deliver, even for “insurance” purposes to offset the negative growth impacts from trade policy uncertainty. Maintain a below-benchmark strategic U.S. duration stance, and stay underweight the U.S. in global hedged government bond portfolios. JGBs As A Duration Management Tool In Global Bond Portfolios It has been quite some time since we have discussed Japanese government bonds (JGBs) in this publication. That is for a good reason – they are an incredibly boring asset. We can think of many more interesting investments than a bond market with no yield, no volatility, no inflation and a central bank with no other viable policy options. Yet low Japanese interest rates make borrowing in yen a good source of funding for carry trades. JGBs also offer the usual safe-haven appeal during periods of risk aversion and recessions. JGBs are a low-beta sovereign bond market, making them a useful way to manage duration risk in a global bond portfolio – especially in environments like today, where JGB yields are higher than U.S. Treasury yields on a currency hedged basis (in U.S. dollars). Chart 7JGBs Are Essentially A 'Global Duration' Bet
JGBs Are Essentially A 'Global Duration' Bet
JGBs Are Essentially A 'Global Duration' Bet
Most relevant for global bond investors - JGBs typically outperform their developed market peers during periods of rising global bond yields, and vice versa. That can be seen in Chart 7, where we show the total return of the Barclays Bloomberg Japan government bond index, hedged into U.S. dollars, on a duration-matched basis to the Global Treasury index. That return is plotted versus the overall Global Treasury index yield-to-maturity. The correlation is clear from the chart: JGBs outperform when the global yield rises, and underperform when the global yield is falling. In other words, JGBs are a low-beta sovereign bond market, making them a useful way to manage duration risk in a global bond portfolio – especially in environments like today, where JGB yields are higher than U.S. Treasury yields on a currency hedged basis (in U.S. dollars). For bond investors with a view that U.S. Treasury yields have fallen too far and are likely to begin rising again, JGBs are a compelling alternative. Selling Treasuries for JGBs, and hedging the currency risk back into U.S. dollars, can be a way to gain a yield pickup while reducing sensitivity to U.S. bond yield changes (i.e. duration) by owning an asset with a low, or even negative, beta to Treasuries. Chart 8BoJ Needs To Ease, But Options Are Limited
BoJ Needs To Ease, But Options Are Limited
BoJ Needs To Ease, But Options Are Limited
Japan’s export-led economy is sputtering on worries over U.S.-China trade tensions which are dampening global growth sentiment more broadly. The Bank of Japan’s (BoJ) widely-watched Tankan survey shows that business confidence has turned more pessimistic; the manufacturing PMI has fallen below 50; and the OECD leading economic indicator for Japan is falling sharply. Even with the unemployment rate at a multi-decade low of 2.4%, wage growth remains muted and consumer confidence is softening. Our own BoJ Monitor is signaling the need for easier monetary policy, and there are now -9bps of rate cuts discounted in the Japanese Overnight Index Swap curve (Chart 8). The BoJ’s policy options, however, are limited. The official policy rate (the discount rate) is already negative, and pushing that lower risks damaging Japanese bank profitability even further. More dovish forward guidance is of limited impact with markets already priced for a prolonged period of low rates. The BoJ cannot pursue more quantitative easing (QE) either, as it already owns nearly 50% of all outstanding JGBs - a massive presence that has, at times, disrupted functionality in the JGB market. There is nothing on the horizon indicating that JGB yields will move much from current levels, allowing JGBs to maintain their defensive status in global bond portfolios. The only real policy tool left is Yield Curve Control (YCC), where the BoJ has been targeting a 10-year JGB yield close to 0% and managing purchases to sustain the yield target. In our view, any upward adjustment of that yield target range (currently 0-0.2% on the 10yr JGB) would require a combination of three factors: The USD/JPY exchange rate must increase back to at least the 115-120 range, to provide a lower starting point for the likely yen appreciation that would occur if the BoJ targeted a higher bond yield. Japanese core CPI inflation and nominal wage growth must both rise and remain above 1.5%, which is close enough to the BoJ’s 2% inflation target to justify an increase in nominal bond yields. The momentum in the yield differential between 10-year Treasuries and JGBs must be overshooting to the upside; the BoJ would not want to keep JGB yields too depressed for too long if the global economy was strong enough to boost non-Japanese yields at a rapid pace. Chart 9BoJ Yield Curve Control Is Here To Stay
BoJ Yield Curve Control Is Here To Stay
BoJ Yield Curve Control Is Here To Stay
Currently, none of those criteria is in place (Chart 9). USD/JPY is down to 108; core CPI inflation is 0.6%; real wage growth is effectively zero; and the 10yr U.S.-Japan bond spread is contracting. There is nothing on the horizon indicating that JGB yields will move much from current levels, allowing JGBs to maintain their defensive status in global bond portfolios. Changes to our model bond portfolio We have been recommending an overweight stance on JGBs in our model portfolio for much of the past two years. This is in line with our long-held view that global bond yields had to rise on the back of improving global growth and the slow normalization of interest rates by the Fed and other central banks not named the Bank of Japan. Events this year have obviously challenged that view and we have reduced the size of our recommended overweight in our model bond portfolio. Given our view that U.S. Treasury yields are likely to grind higher in the next few months, we see a need to turn to Japan as a way to play defense against a rebound in global bond yields. That means increasing the Japan allocation, and decreasing the U.S. allocation, in our model bond portfolio. We can fine-tune that allocation shift based on the empirical yield betas of U.S. Treasuries to JGBs across different maturity buckets. In Chart 10, we show the rolling 52-week yield beta of JGBs to the other major developed bond markets, shown at the four critical yield curve points (2-year, 5-year, 10-year and 30-year). In all cases, the yield beta is low and fairly consistent across all maturities. When looking at those same rolling betas using yields hedged into U.S. dollars, shown in Chart 11, the story changes (note that we are using hedged yield data from Bloomberg Barclays, so the maturity buckets correspond to those used in the benchmark indices). The yield betas between JGBs and other markets are at or below zero in the 3-5 year and 7-10 year maturity buckets, with particularly large negative betas versus U.S. Treasuries. This implies that there is a gain to be made by focusing any Japan-for-U.S. switch in currency-hedged global bond portfolios on bonds with maturities between three and ten years. Chart 10JGBs Are Low-Beta To Global Yields...
JGBs Are Low-Beta To Global Yields...
JGBs Are Low-Beta To Global Yields...
Chart 11...And Even Negative-Beta After Hedging Into USD
...And Even Negative-Beta After Hedging Into USD
...And Even Negative-Beta After Hedging Into USD
Based on this analysis, and our view on U.S. Treasuries laid out earlier in this report, we are making a shift in our model bond portfolio on page 12 – cutting the weight in the maturity buckets in the middle of the Treasury curve and placing the proceeds into similar maturity buckets in Japan. Bottom Line: The low yield beta of Japanese government bonds can be a useful diversifier of duration risk in global government bond portfolios. We recommend taking advantage of this by increasing allocations to Japan, out of U.S. Treasuries, on a currency-hedged basis (into USD). Robert Robis, CFA, Chief Fixed Income Strategist rrobis@bcaresearch.com Ray Park, CFA, Research Analyst ray@bcaresearch.com Recommendations The GFIS Recommended Portfolio Vs. The Custom Benchmark Index
The Case For, And Against, Fed Rate Cuts
The Case For, And Against, Fed Rate Cuts
Duration Regional Allocation Spread Product Tactical Trades Yields & Returns Global Bond Yields Historical Returns
Highlights June FOMC Meeting: To appease markets, the Fed will at least have to signal that it stands ready to cut rates in July. While this is possible, there is a significant risk that the committee fails to deliver. We continue to advocate a cautious approach to corporate credit spreads in the near-term (0-3 months). Rate Cuts: The historical track record suggests that the 10-year Treasury yield can rise or fall in the immediate aftermath of a Fed rate cut. With a U.S. recession still far off, we see a good chance that Treasury yields will rise during the next 6-12 months, even if the Fed lowers rates in June or July. Treasury Yields: Yields have fallen a lot since the beginning of November, but the move isn't terribly anomalous relative to history. We use statistics to place recent price action in its appropriate historical context. Feature The Fed This Week Chart 1Credit Spreads At Risk
Credit Spreads At Risk
Credit Spreads At Risk
Tomorrow’s FOMC meeting is the main event in financial markets this week, with investors of all stripes eager to learn whether the Fed will deliver on the rate cut expectations that have already been priced into bond yields. As we’ve written in prior reports, our immediate concern is that the Fed may not sound dovish enough to appease markets, leading to further near-term widening in corporate bond spreads.1 Corporate bond excess returns have far outpaced commodity prices of late (Chart 1), leaving the sector vulnerable to any hawkish surprise. What’s Priced In, And Can The Fed Deliver? How dovish must the Fed be to prevent a sell-off in corporate credit? A look at current fed funds futures pricing shows that the market is looking for nearly three 25 basis point rate cuts spread over the next six FOMC meetings (Table 1). Roughly, the market expects one rate cut at either the June or July meeting, a second rate cut in either September or October, and a third rate cut in either December or January. To appease markets, the Fed will at least have to revise its 2019 funds rate projections down and signal that it stands ready to cut rates in July (Chart 2). While this is possible, there is a significant risk that the committee fails to deliver. We continue to advocate a cautious approach to corporate credit markets in the near-term (0-3 months). Table 1Fed Funds Futures: What's Priced In?
Track Records
Track Records
Chart 2Watch For Dot Plot Revisions
Watch For Dot Plot Revisions
Watch For Dot Plot Revisions
Fed Rate Cuts: A Track Record While we are cautious on corporate spreads in the near-term, we are also not willing to chase Treasury yields lower from current levels. Our view is that while the Fed might deliver a rate cut at one of the next few meetings, it is unlikely to lower rates by more than the 84 bps that are priced into the yield curve for the next 12 months. Ultimately, we expect Treasury yields to be higher on a 6-12 month horizon, even if the Fed cuts rates during the next few months. In response to this outlook, a few clients have asked whether it is possible for Treasury yields to rise so soon after a Fed rate cut. While we see no theoretical reason why it shouldn't be possible, it is always a good idea to stress test a theory against the historical track record. We therefore compiled a list of every Fed rate cut since 1995, and looked at how the 10-year Treasury yield reacted to each event. The results are displayed in Tables 2A-2D.
Chart
Chart
Chart
Chart
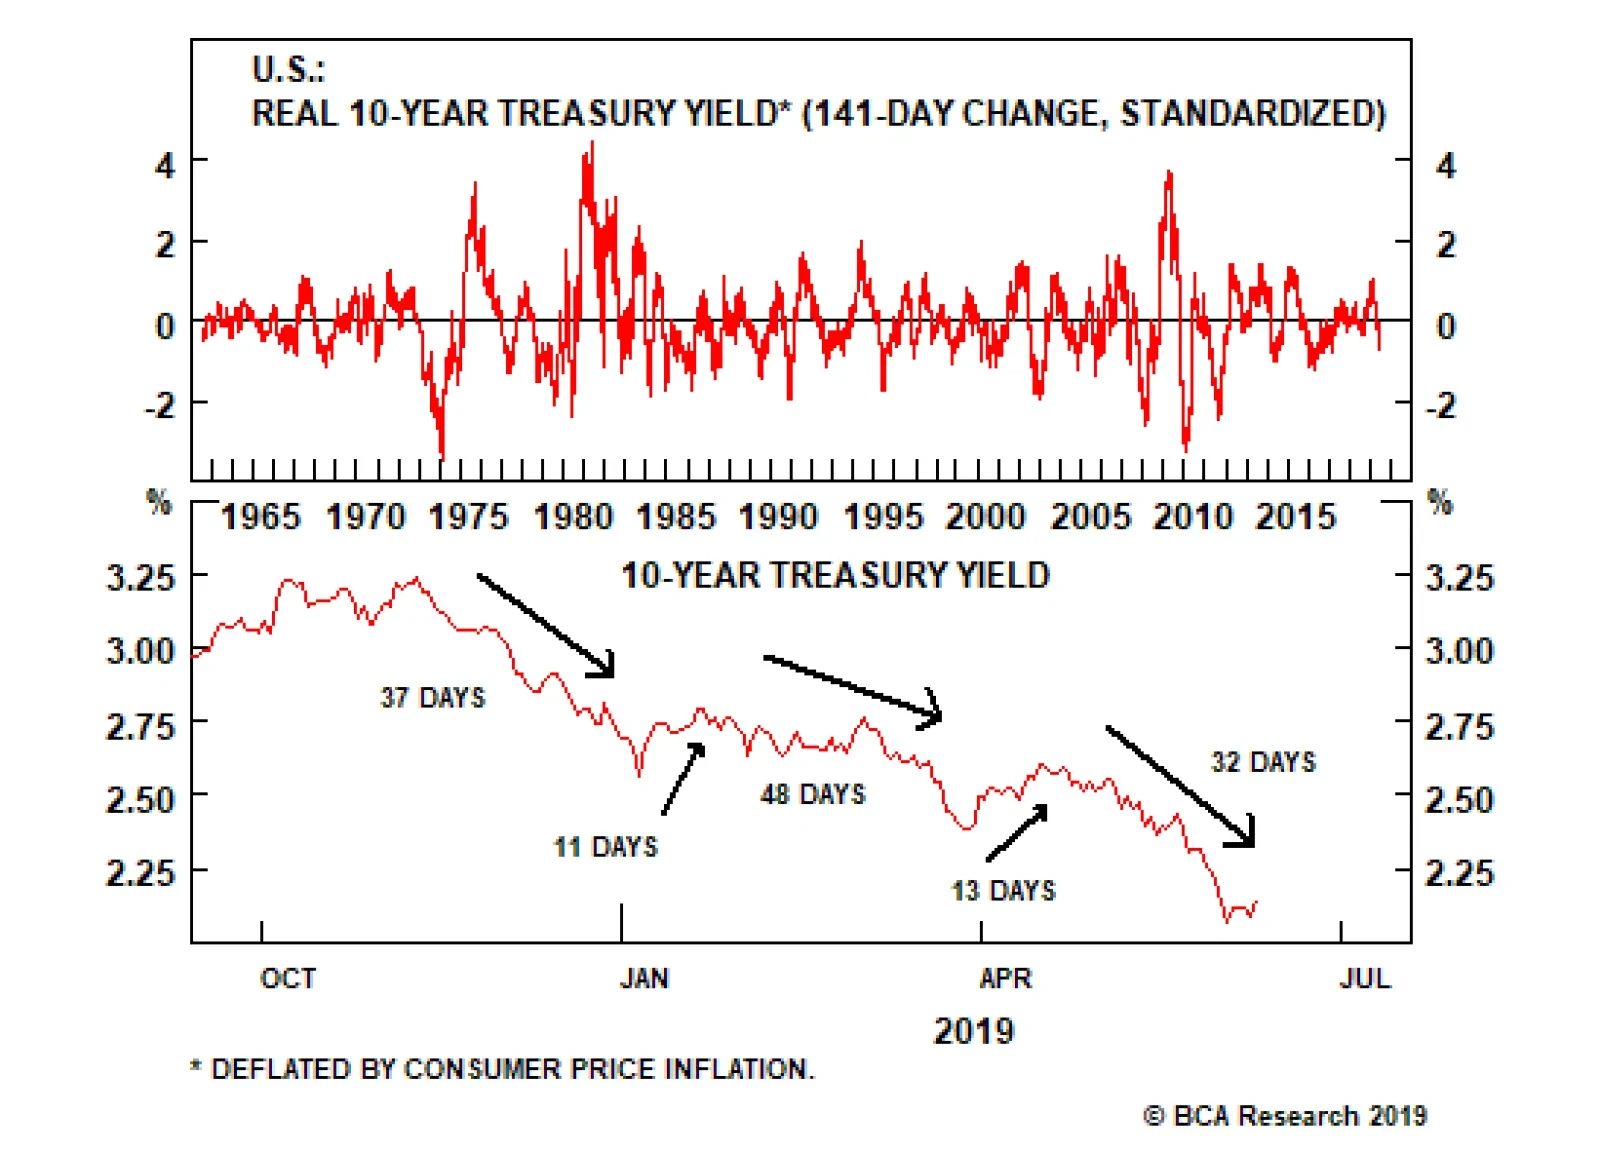
Table 2A shows the rate cuts that the Fed delivered in the mid-1990s, in response to persistently low U.S. inflation and slowing growth in the rest of the world. At the time, overall U.S. economic growth was quite solid and the U.S. economy didn’t fall into recession until 2001. The divergence between relatively strong U.S. economic growth and slower growth in the rest of the world makes the period look very similar to today, and we have long argued that the current cycle should be viewed in the context of the mid-1990s.2 Table 2A reveals that, on average, the 10-year Treasury yield tended to rise in the months following a rate cut, often even in the first 21 days. The historical track record suggests that the 10-year Treasury yield can rise or fall in the immediate aftermath of a Fed rate cut. Table 2C shows the rate cuts that were delivered during the economic recovery of the mid-2000s, and it paints a similar picture as Table 2A. In particular, the 10-year Treasury yield rose dramatically following the 2003 rate cut, and the Fed actually started to hike interest rates almost exactly one year after the 2003 cut. Tables 2B & 2D show the rate cuts that led into the 2001 and 2008 recessions. Not surprisingly, yields were much more likely to fall after the Fed cut rates in those episodes. Bottom Line: The historical track record suggests that the 10-year Treasury yield can rise or fall in the immediate aftermath of a Fed rate cut. The yield is much more likely to fall if the cut occurs in the run-up to a recession. With a U.S. recession still far off, we see a good chance that Treasury yields will rise during the next 6-12 months, even if the Fed lowers rates at one of the next few FOMC meetings. Treasury Yield Moves: A Track Record In recent weeks a BCA client who had been shaking his head at the large drop in Treasury yields reached out to see if we could put the recent moves in historical context. Specifically, he wondered how often such large yield moves have occurred in the past, and whether there is a tendency for moves of this magnitude to mean-revert. Our U.S. Investment Strategy team took a stab at answering these questions. The below analysis first appeared in last week's U.S. Investment Strategy report, but is re-printed here for the interest of U.S. bond clients.3 The ongoing decline in bond yields has felt like a big deal in real time, but it isn’t historically. The sharp decline in the 10-year Treasury yield that began in early November can be viewed as three separate declines (Chart 3). In the first, the 10-year yield fell by 68 basis points (“bps”) over a span of 37 trading days. After retracing a third of the decline over the next 11 sessions, it slid by another 40 bps over 48 days. Following a one-half retracement over the ensuing 13 days, it shed 53 basis points in 32 days, capped off by a 36-bps decline across the final eight sessions (Table 3). Chart 3The Path To 2.07%
The Path To 2.07%
The Path To 2.07%
Table 3A Lower 10-Year Treasury Yield In Three Steps
Track Records
Track Records
Using the daily 10-year Treasury yield series beginning in 1962, we compared the individual yield declines for prior 37-, 48- and 32-day periods, as well as for the aggregate 141-day session spanning the entire stretch from the November 8th peak to the June 3rd trough. We also looked at the May 21st to June 3rd crescendo relative to past eight-day segments. The standardized moves range from three-quarters of a standard deviation below the mean for the 48-day middle leg to 1.5 and 1.8 for the 37- and 8-day moves, respectively (Table 4). All in all, the entire move grades out to 1.3 standard deviations below the mean – a somewhat unusual move, but nothing too special. Table 4Standardized Values Of Nominal 10-Year Treasury Yield Declines
Track Records
Track Records
The current decline’s relative stature is undermined by the wild volatility of the late ‘70s and early ‘80s, when bond yields and annual inflation reached double-digit levels (Chart 4). To try to place the current episode on a more equal framework, we also calculated standardized moves in real (inflation-adjusted) yields. On a real basis, however, the current moves made even less of a splash. The 8-day decline (z-score = -1.2) was the only component that was more than a standard deviation from the mean, and the overall move amounted to just 0.7 standard deviations below the mean (Chart 5). Chart 4No Historical Anomaly In The Current Market
No Historical Anomaly In The Current Market
No Historical Anomaly In The Current Market
Chart 5Little Impact In Terms Of Real Yields
Little Impact In Terms Of Real Yields
Little Impact In Terms Of Real Yields
We are familiar with the electronic financial media’s increasingly popular convention of stating daily yield moves in proportion to the previous day’s closing yield.4 That convention has the advantage of fitting snugly aside stock price quotes on TV and computer screens, but it is ultimately nonsensical. The proportional change in a bond’s yield relative to its starting yield doesn’t come close to approximating the change in the value of that bond. Comparing proportional changes in bond yields across timeframes would be a way of putting today’s yield moves on a more equal footing with yield moves in the high-inflation, high-coupon era of the late seventies and early eighties, but it conveys no practical information. The standardized moves in real yields and Treasury index returns haven’t been a big deal. Our next steps were instead to compare Treasury total returns and the change in the slope of the yield curve to past flattening and steepening episodes. The moves here were also unavailing over both seven- and one-month periods, as the high-coupon ‘70s and ‘80s still dominated (Chart 6). In terms of the change in the 10-year Treasury yield, both nominal and real; Treasury index total returns; and the slope of the yield curve (3-month rate to 10-year yield), both the aggregate move since last October and its three component moves have amounted to one-standard-deviation events. They would only have had about a one-in-six chance of occurring randomly in a normally distributed population, but they do not represent unsustainable moves that cry out to be reversed. Chart 6Little Impact In Terms Of Treasury Total Returns, ...
Little Impact In Terms Of Treasury Total Returns, ...
Little Impact In Terms Of Treasury Total Returns, ...
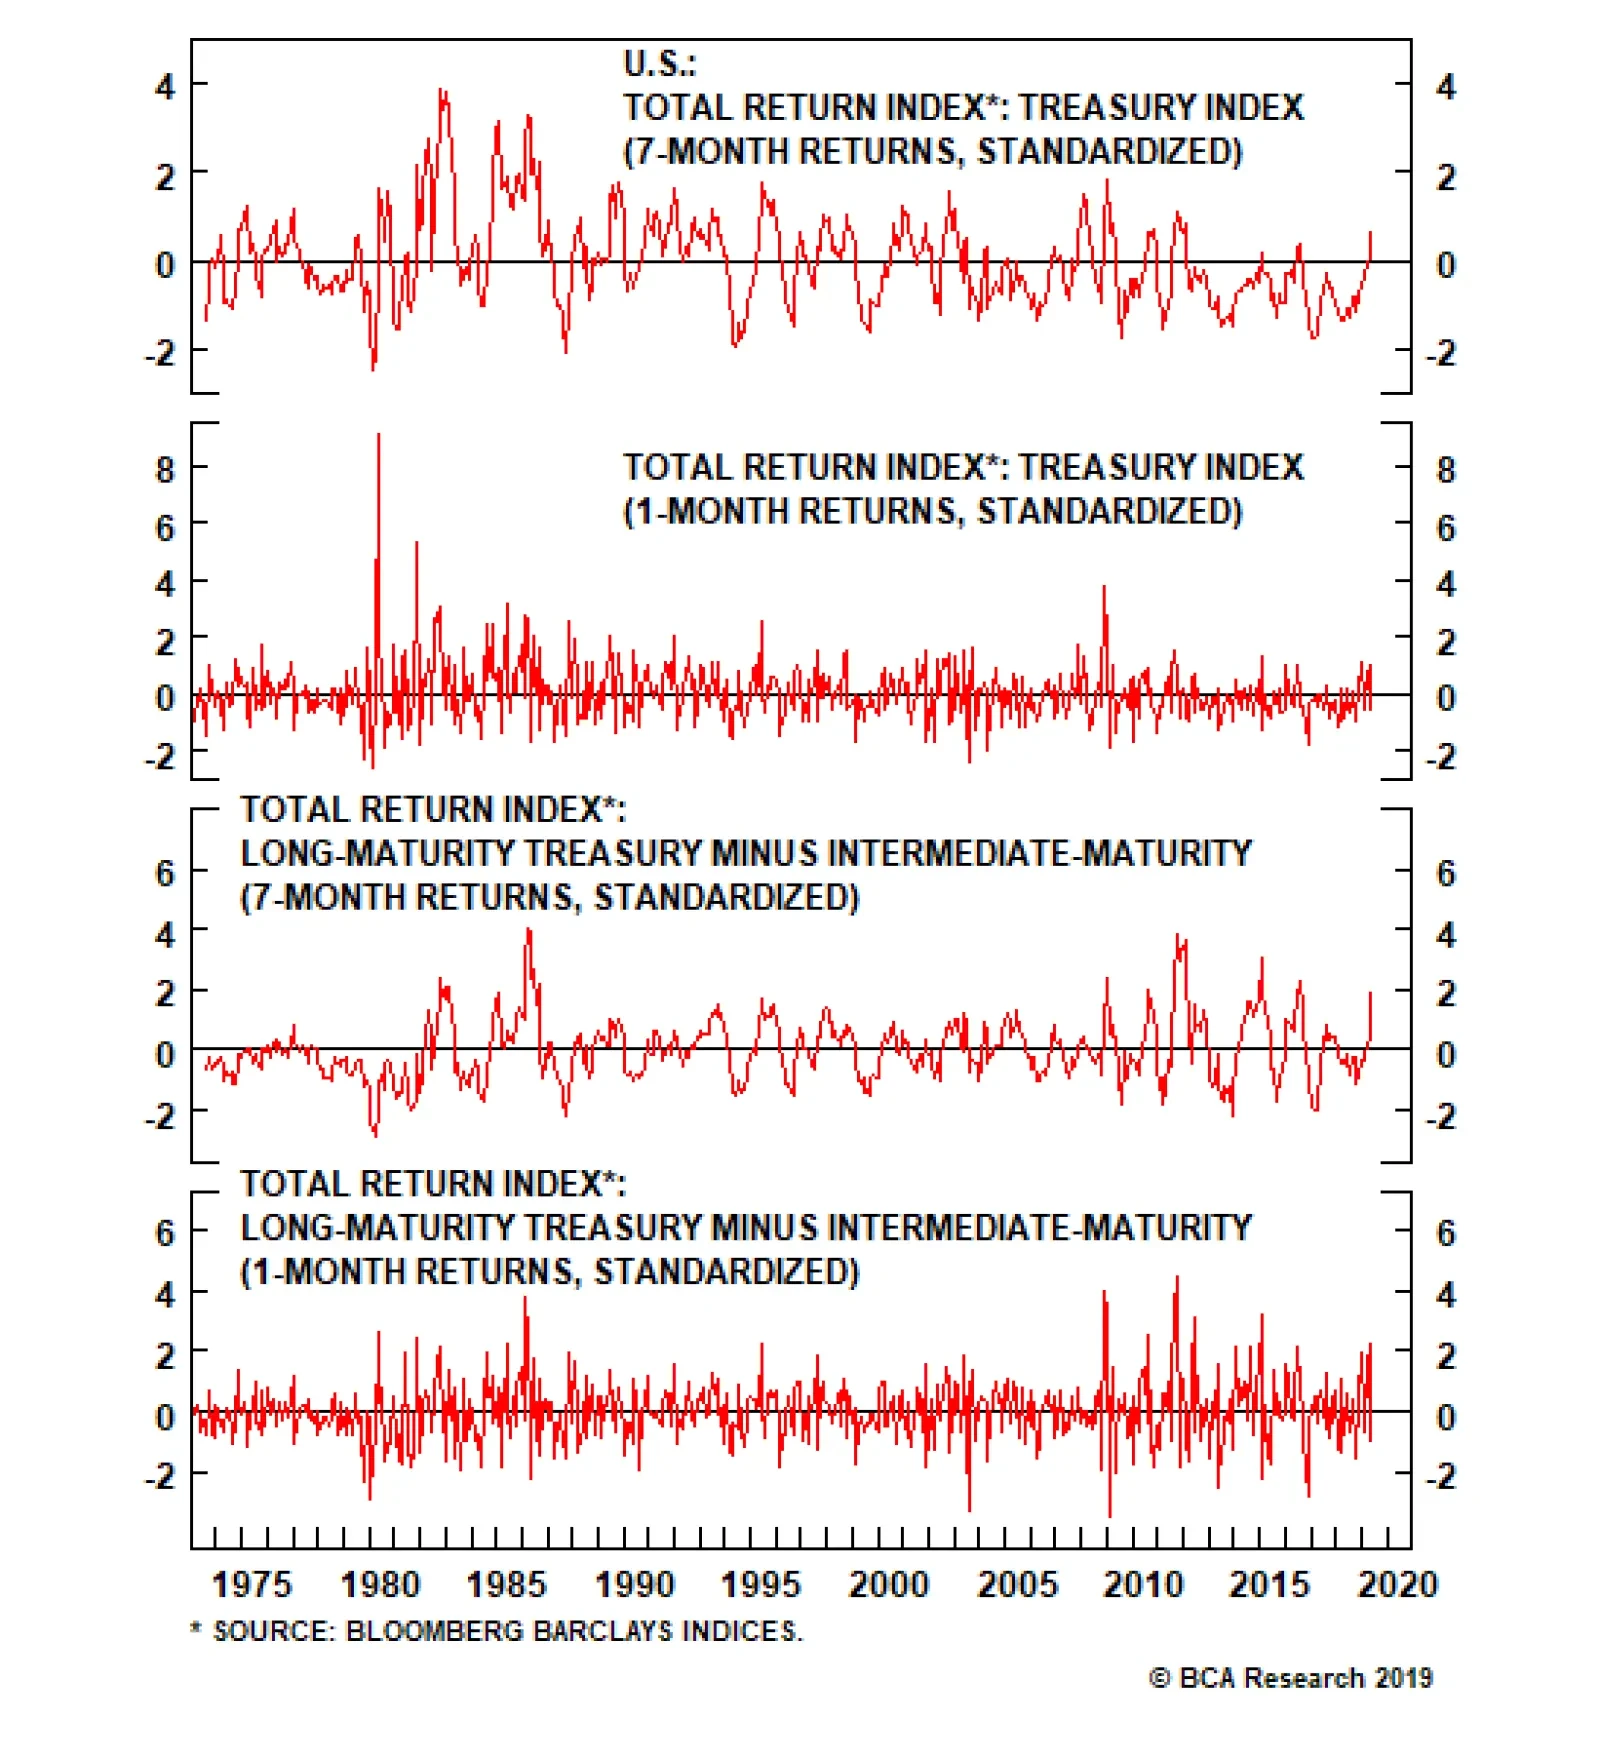
Digging a little deeper to consider total returns across different regions of the yield curve, we do find one apparent anomaly at the long end of the curve. The long Treasury index has outperformed the intermediate Treasury index by a two-standard-deviation margin over both a seven-month and a one-month timeframe (Chart 7). On a standalone basis, the long Treasury index has beaten the seven-month mean return by one-and-a-half standard deviations, and the one-month mean return by two standard deviations (Chart 8). The two-standard-deviation results would only be expected to occur one out of forty times, and thereby validate our client’s sense that something has been going on. Chart 7... But The Spread Between Long- And Intermediate-Index Returns Is Wide, ...
... But The Spread Between Long- And Intermediate-Index Returns Is Wide, ...
... But The Spread Between Long- And Intermediate-Index Returns Is Wide, ...
Chart 8... And Long-Maturity Returns Have Been Elevated
... And Long-Maturity Returns Have Been Elevated
... And Long-Maturity Returns Have Been Elevated
The margin by which long-maturity Treasuries have outperformed intermediate-maturity Treasuries is unusual, and history suggests it will be partially unwound over the next six to twelve months. Moving on to the second part of his inquiry, we reviewed the standalone performance of the long Treasury index, and the relative long-versus-intermediate performance, over subsequent six- and twelve-month periods. We focused our analysis on instances when historical z-scores were greater than or equal to their current levels to try to determine if we should expect current performance to reverse and, if so, how sharply. On a standalone basis, long Treasury index performance has gently reverted to the mean over the subsequent six and twelve months, posting returns over those periods within +/- 0.2 standard deviations of its long-run average (Table 5). Table 5Standardized Values Of Future Long-Maturity Treasury Index Returns
Track Records
Track Records
Outlying relative long-versus-intermediate performance like we’ve witnessed over the last seven months has reversed more convincingly. The long Treasury index has underperformed its intermediate-maturity counterpart over six and twelve months when its z-scores were greater than or equal to their current levels over a seven- and one-month basis, falling roughly 0.5 standard deviations below the mean (Table 6). The future does not have to resemble the past, especially over small sample sizes, but relative long-end underperformance would accord with our constructive view of the U.S. economy. Table 6Standardized Values Of Future Difference Between Long- And Intermediate-Maturity Treasury Index Returns
Track Records
Track Records
Ryan Swift, U.S. Bond Strategist rswift@bcaresearch.com Doug Peta, CFA Chief U.S. Investment Strategist dougp@bcaresearch.com Footnotes 1 Please see U.S. Bond Strategy Weekly Report, “Hedge Near-Term Credit Exposure”, dated May 28, 2019, available at usbs.bcaresearch.com 2 Please see U.S. Bond Strategy Weekly Report, “Tracking The Mid-1990s”, dated June 11, 2019, available at usbs.bcaresearch.com 3 Please see U.S. Investment Strategy Weekly Report, “Context”, dated June 10, 2019, available at usis.bcaresearch.com 4 If a bond yielding 3% at Friday’s close ends Monday’s session with a yield of 2.94%, 6 bps lower, its yield is shown as having declined 2% on the day (-.0006/.03 = -2%). Fixed Income Sector Performance Recommended Portfolio Specification
Employment growth usually starts to slow at least one year before the economy heads into recession. But it showed relatively little weakness in 1998 and 2015/16. If May’s downbeat payrolls number turns out to be the start of a trend, then we will have to…
Our main justification is that such a large number of rate cuts will only occur if the economy enters a recession. At present, the pre-conditions for an economic recession are simply not in place. Rather, the economy is experiencing an external shock – akin…
Highlights Fed: A Fed rate cut in June or July is not a done deal, but is looking increasingly likely purely from a risk management perspective, as it would both calm financial markets and potentially boost the inflation expectations component of Treasury yields. ECB: Easier monetary policy is required in Europe, and Mario Draghi hinted that rate cuts or even more QE are viable policy options. Depressed European bond yields (excluding Italy) suggest that this outcome is already fully priced. Maintain only a neutral allocation to core European government bonds. Feature Chart of the WeekA Lot Of "Negativity" In Bond Yields
A Lot Of "Negativity" In Bond Yields
A Lot Of "Negativity" In Bond Yields
The Great Global Bond Rally of 2019 has caught many by surprise – including, we admit with some humility, us. Not only has the pace of the decline in yields been impressive, but the outright yield levels seen in many markets are startlingly low. The 10-year German bund reach an all-time low of -0.25% last week, while sub-1% 10-year bond yields can be seen in “risky Peripherals” like Spain and Portugal. The ferocity of the global bond move has left 54% of all developed market government bonds trading with negative yields; the highest such percentage since July 2016 after the U.K. Brexit vote unnerved investors (Chart of the Week). There are parallels to today purely from a political risk perspective, given the trade tensions between the U.S. and China (and potentially any other country that the Trump Administration has issues with). Another comparison can be made versus three years ago when looking at more fundamental drivers of low global yields that require a response from policymakers – namely, slowing growth and sluggish inflation. Our Central Bank Monitors are now sending a clear message that easier monetary policy is needed in all the major developed economies (Chart 2). Given soft market-based inflation expectations, this suggests that policymakers must not only talk dovish, but act dovish, to defend the lower bound of price stability. Chart 2Pressure To Ease GLOBAL Monetary Policy
Pressure To Ease GLOBAL Monetary Policy
Pressure To Ease GLOBAL Monetary Policy
We’re seeing that in places like Australia and New Zealand, where policymakers have already cut rates. We can also see that in the euro area, where the ECB has introduced a new funding program to support bank lending (TLTRO3) and is now even contemplating restarting quantitative easing (QE). The Fed is next in line, with numerous Fed officials hinting that some easing of monetary policy could be on the horizon. Much easier monetary policy is already largely discounted in the current depressed level of global bond yields, though. While there are still risks to the growth outlook from trade uncertainty, we do not foresee a U.S./global recession on the immediate horizon. That means the risk/reward balance now favors some pickup in global bond yields, warranting a below-benchmark medium-term stance on duration exposure. Why “Insurance” Fed Cuts Are Likely Chart 3A Strong Dollar Is Disinflationary
A Strong Dollar Is Disinflationary
A Strong Dollar Is Disinflationary
Last week, the Federal Reserve held a research conference to discuss its monetary policy framework. Among the topics discussed were potential changes to the way the Fed manages its inflation target, including tolerating faster inflation after a period of below-target inflation. The goal of such “make-up” strategies would be to ensure that periods of low inflation do not get embedded into inflation expectations and bond yields. The problem with such strategies, however, is they are less likely to work if low interest rates and low inflation are a global phenomenon. The coordinated nature of the global bond rally has left the Fed facing a combination of rapidly falling Treasury yields alongside a strong U.S. dollar. With interest rate differentials continuing to favor the greenback, the currency is exerting downward pressure on commodity prices and, more generally, global inflation (Chart 3). Of course, the dollar does not only trade off interest rate differentials, but also global growth expectations, so some of the dollar rally seen this year reflects slowing non-U.S. economies and capital outflows from non-U.S. financial markets. What is clear, however, is that a strong dollar, and all it represents in terms of global growth, is disinflationary. Numerous Fed officials, including Fed Chairman Jay Powell, gave hints last week that they were open to considering interest rate cuts in response to signs of weakening U.S. growth and heightened trade uncertainty. With 5-year/5-year forward inflation expectations in the TIPS market now at 1.9% – still well below the 2.3-2.4% levels consistent with the Fed’s 2% target on the PCE deflator – the Fed has the cover to deliver one or two “insurance” rate cuts in the next few FOMC meetings. This would be consistent with their risk management framework. Our Central Bank Monitors are now sending a clear message that easier monetary policy is needed in all the major developed economies. Given soft market-based inflation expectations, this suggests that policymakers must not only talk dovish, but act dovish, to defend the lower bound of price stability. If the Fed fails to ratify markets’ dovish expectations at next week’s policy meeting, risk assets will likely sell off – perhaps violently, as occurred last December. That would deliver the kind of tightening in financial conditions that would force the Fed turn more dovish and eventually cut rates anyway. Alternatively, if the Fed actually cuts rates next week or in July and both the economy and inflation eventually recover, and risk assets surge higher, then the Fed can always take back those cuts with tighter policy later (especially if trade uncertainty diminishes with some sort of U.S.-China trade deal at the G20 meeting later this month). Such a strategy could even help Fed credibility by boosting inflation expectations back to levels more consistent with the Fed’s inflation target, which would also help put upward pressure on Treasury yields. Our Fed Monitor is now signaling the need for easier U.S. monetary policy, but that is already discounted in the 75bps of rate cuts (over the next twelve months) priced at the front-end of the yield curve, and in the current low level of Treasury yields (Chart 4). The Treasury rally also looks overdone when looking at other measures, such as the low level of mean-reverting U.S. data surprises, overbought price momentum and extended long duration positioning (Chart 5). Chart 4Treasuries Fully Priced For Fed Easing
Treasuries Fully Priced For Fed Easing
Treasuries Fully Priced For Fed Easing
Net-net, the medium-term risk/reward balance favors moderate below-benchmark duration positioning for Treasury investors, and underweight tilts for the U.S. in global government bond portfolios. More tactically, the amount of Fed rate cuts now discounted seems excessive with only the U.S. manufacturing sector cooling while the rest of the economy remains on firm footing. For that reason, we are already taking profits on one leg of our fed funds futures calendar spread trade initiated last week. The Treasury rally also looks overdone when looking at other measures, such as the low level of mean-reverting U.S. data surprises, overbought price momentum and extended long duration positioning Chart 5The Treasury Rally Looks Stretched
The Treasury Rally Looks Stretched
The Treasury Rally Looks Stretched
Chart 6Fed Funds Futures Trade: Exit Long Aug 2019, Stay Short Feb 2020
Fed Funds Futures Trade: Exit Long Aug 2019, Stay Short Feb 2020
Fed Funds Futures Trade: Exit Long Aug 2019, Stay Short Feb 2020
We recommended buying the August 2019 fed funds futures contract to hedge the risk that the Fed tries to get ahead of market sentiment by cutting rates in June or July. That contract would have returned a positive return in a scenario where the Fed delivered one 25 basis point rate cut in either June or July, and a negative return in a scenario where rates are unchanged. In only one week, that contract’s risk/reward profile has shifted dramatically. The contract is now priced for a loss in both the “one rate cut” and “no rate cut” scenarios. We therefore exit our long position in the August 2019 fed funds futures contract for a gain of +5bps. The second leg of our proposed trade was to short the February 2020 fed funds futures contract. This remains an excellent bet. As of last Friday, a short position in the February 2020 contract will earn a positive return as long as three or fewer rate cuts occur between now and next February (Chart 6). We are keeping this position on as a pure rates trade to play for the Fed delivering less than the market expects. Bottom Line: A Fed rate cut in June or July is not a done deal, but is looking increasingly likely purely from a risk management perspective, as it would both calm financial markets and potentially boost the inflation expectations component of Treasury yields. Are European Bond Yields Discounting More ECB QE? While we see little absolute value in U.S. Treasuries, there may not be much near-term upside in yields without an improvement in European economic growth. Simply put, Europe remains an anchor weighing on global bond yields. While we see little absolute value in U.S. Treasuries, there may not be much near-term upside in yields without an improvement in European economic growth. Simply put, Europe remains an anchor weighing on global bond yields. Our country diffusion indicators for the euro area – measuring the share of countries within the region that are seeing faster GDP growth, rising leading economic indicators and quickening headline inflation rates – all show that the current downturn is broad-based (Chart 7). Dating back to the introduction of the single currency zone in the late 1990s, there have been three periods where the country diffusion indicators were as weak as they are now. All three times lead to multiple interest rate cuts by the ECB. Chart 7A Broad-Based Slowing Of European Growth & Inflation
A Broad-Based Slowing Of European Growth & Inflation
A Broad-Based Slowing Of European Growth & Inflation
Our ECB Monitor is also calling for easier monetary policy in the euro area (Chart 8), driven by weakness in both the growth and inflation components. Chart 8Our ECB Monitor Says 'Ease', Bund Yields Agree
Our ECB Monitor Says 'Ease', Bund Yields Agree
Our ECB Monitor Says 'Ease', Bund Yields Agree
With the ECB policy rate already negative, however, the central bank is reluctant to push rates even lower and starve euro area banks of badly needed net interest margin. Chart 9TLTRO3 Will Help Italian & Spanish Banks The Most
TLTRO3 Will Help Italian & Spanish Banks The Most
TLTRO3 Will Help Italian & Spanish Banks The Most
At last week’s policy meeting, the ECB Governing Council committed to leaving rates unchanged through the first half of 2020. ECB President Mario Draghi noted in his press conference that forward guidance has “become the major monetary policy tool we have now”, suggesting that actual changes in interest rates will be more difficult to implement. Draghi also noted that the new TLTRO3 program was intended only as a “backstop” to sustain current levels of bank lending as the old TLTRO programs begin to roll off, not as a fresh source of stimulus. This was almost certainly aimed at the banks of Italy and Spain – countries that took up nearly 60% of the last TLTRO program that is now starting to roll off and where credit growth is contracting (Chart 9). The ECB worries that the weaker parts of the European banking system are becoming too reliant on cheap central bank funding, making it more difficult to end the liquidity program in the future without causing a credit crunch. German bunds have already priced in some sort of ECB easing (rate cuts or fresh bond buying). Our estimate of the term premium on the 10-year German bund yield is already deeply negative, which reflects both a risk aversion bid for safety and, potentially, some market expectation of incremental ECB QE. Chart 10Market Discounting Fresh ECB Bond Buying?
Market Discounting Fresh ECB Bond Buying?
Market Discounting Fresh ECB Bond Buying?
So if the ECB is reluctant to cut rates or subsidize more lending, what monetary ammunition is left? Draghi did hint last week that the topic of restarting the Asset Purchase Program (APP) came up in the ECB meeting as an option if the economic and inflation backdrop deteriorated further, or global trade uncertainty intensified. The ECB is facing a situation similar to when the APP was first announced in 2014. Inflation expectations, as measured by the 5-year/5-year forward euro CPI swap rate, are now down to 1.2% (Chart 10). It was a similar plunge in inflation expectations that wore down ECB hawks’ reticence to deploy quantitative easing back in 2014. German bunds have already priced in some sort of ECB easing (rate cuts or fresh bond buying). Our estimate of the term premium on the 10-year German bund yield is already deeply negative, which reflects both a risk aversion bid for safety and, potentially, some market expectation of incremental ECB QE. The latter interpretation would also explain the low level of bond yields seen in Peripheral Europe (excluding Italy, dealing with a deficit battle with the European Commission), as investors stretch for yield in anticipation of supportive future ECB policy. We see little investment value in euro area bonds at such low levels, given how much bad news on growth and inflation, and the potential monetary easing in response, is already discounted. Similar to U.S. Treasuries, the risk/reward balance favors a modest below-benchmark structural duration stance. The upside in European yields is still far more limited than for U.S. Treasury yields, given the much more fragile state of European growth and inflation expectations. Treasuries are thus more overpriced than bunds. Bottom Line: Easier monetary policy is required in Europe, and Mario Draghi hinted that rate cuts or even more QE are viable policy options. Depressed European bond yields (excluding Italy) suggest that this outcome is already fully priced. Maintain only a neutral allocation to core European government bonds. Robert Robis, CFA, Chief Fixed Income Strategist rrobis@bcaresearch.com Recommendations
Making Up Is Hard To Do
Making Up Is Hard To Do
Duration Regional Allocation Spread Product Tactical Trades Yields & Returns Global Bond Yields Historical Returns
Our next steps were instead to compare Treasury total returns and the change in the slope of the yield curve to past flattening and steepening episodes. The moves here were also unavailing over both seven- and one-month periods, as the high-coupon ‘70s and…
In the first, the 10-year yield fell by 68 basis points (“bps”) over a span of 37 trading days. After retracing a third of the decline over the next 11 sessions, it slid by another 40 bps over 48 days. Following a one-half retracement over the ensuing 13…
Highlights Fed: The large divergence between Treasury yields and risk assets means that the Fed will almost certainly cut rates during the next few months. The only question is whether a large sell-off in risk assets will be required to force the Fed’s capitulation. Maintain a cautious near-term (0-3 month) allocation to corporate credit. Duration: The economic data and shape of the yield curve do not suggest that the economy is heading into recession. Rather, they suggest that the economy is experiencing an external shock – akin to 1998 or 2015/16 – that can be offset by a relatively minor pivot in Fed policy. Investors should keep portfolio duration low. Corporate Balance Sheets: Growth rates for both corporate profits and debt should settle into the mid-single digits during the next few quarters. This will keep gross leverage and the default rate roughly stable. A sustained period of negative profit growth and tighter C&I lending standards would challenge this outlook. Feature Chart 1Markets Taking The Rate Cut For Granted
Markets Taking The Rate Cut For Granted
Markets Taking The Rate Cut For Granted
Markets aren’t begging for a rate cut. Rather, they are behaving as though one has already occurred. This sort of set-up could lead to wider credit spreads and lower equity prices in the near-term. To elaborate, notice that the S&P 500 is only 3% off its late-2018 peak, but is down an alarming 8% relative to the Bloomberg Barclays Treasury Master Index. Meanwhile, the 10-year Treasury yield had fallen all the way to 2.06% as we went to press last Friday (Chart 1, bottom panel). The overall message from financial markets is that investors expect the Fed to cut rates very soon, but also think that a small number of cuts will be enough to forestall recession and keep risk assets supported. As we see it, the divergence between risk assets and Treasuries makes a rate cut during the next few months a near certainty. If the Fed does not appear sufficiently dovish at next week’s FOMC meeting, then risk assets will sell off. The resulting tightening of financial conditions will then force the Fed’s hand, leading to a rate cut in July or September. The alternative is that the Fed tries to get ahead of market sentiment by delivering a rate cut next week, even if such a move is not easily justified by the economic data. A New Trade In last week’s report, we recommended adding a fed funds futures calendar spread trade to take advantage of these near-term policy moves (Chart 2).1 Specifically, we advised investors to go long the August 2019 fed funds futures contract and short the February 2020 contract. Chart 2Exit Long Aug 2019 / Stay Short Feb 2020
Exit Long Aug 2019 / Stay Short Feb 2020
Exit Long Aug 2019 / Stay Short Feb 2020
We recommended buying the August 2019 fed funds futures contract to hedge the risk that the Fed tries to get ahead of market sentiment by cutting rates in June or July. As of last week, this contract would have earned a positive return in a scenario where the Fed delivered one 25 basis point rate cut in either June or July, and a negative return in a scenario where rates are unchanged. But as of last Friday, the contract’s risk/reward profile had shifted dramatically. The contract is now priced for a loss in both the “one rate cut” and “no rate cut” scenarios. We therefore exit our long position in the August 2019 fed funds futures contract for a gain of 8 bps. . The second leg of our proposed trade was to short the February 2020 fed funds futures contract. This remains an excellent bet. As of last Friday, a short position in the February 2020 contract will earn a positive return as long as three or fewer rate cuts occur between now and next February (Chart 2, bottom panel). In last week’s report, we recommended adding a fed funds futures calendar spread trade to take advantage of these near-term policy moves. Table 1 displays the expected returns from our proposed spread trade (long Aug 2019/short Feb 2020) as of last Friday, the most recent pricing available at the time of publication. Because of the rapid gains in the August 2019 contract price, an outright short position in the February 2020 contract now dominates the expected returns from the calendar spread trade in all likely scenarios. We therefore advise investors to exit the long position in the August 2019 contract, but to remain short the February 2020 contract. Table 1Expected Returns From Long Aug 2019 / Short Feb 2020 Fed Funds Futures Calendar Spread Trade
Tracking The Mid-1990s
Tracking The Mid-1990s
Bottom Line: The large divergence between Treasury yields and risk assets means that the Fed will almost certainly cut rates during the next few months. The only question is whether a large sell-off in risk assets will be required to force the Fed’s capitulation. We advise near-term caution on credit spreads. While a near-term rate cut is likely, we also doubt that the Fed will deliver more than the 76 bps of rate cuts priced into the curve for the next 12 months. We therefore recommend that investors keep portfolio duration low and maintain a short position in the February 2020 fed funds futures contract. More 1998 Than 2001 In the last section we reiterated our view that the Fed will deliver fewer than the 76 bps of rate cuts that are priced into the yield curve for the next 12 months. Our main justification is that such a large number of rate cuts will only occur if the economy enters recession. At present, the pre-conditions for an economic recession are simply not in place. Rather, the economy is experiencing an external shock – akin to 2015/16 and 1998 – that will require only a modest shift in Fed policy. In other words, if we use the mid-1990s cycle as a roadmap, today looks much more like 1998 than 2001. The divergence between manufacturing and services PMIs is exactly what occurred in 1998 and 2015/16. In a recent Special Report, we observed that every single post-WWII recession was preceded by either high inflation or rapid private debt growth (Chart 3).2 At present, inflation is muted and private debt growth is low. The economy is unlikely to experience a recession if there hasn’t been a prior build-up of excess demand. Chart 3Private Debt Growth, High Inflation & Recessions
Private Debt Growth, High Inflation & Recessions
Private Debt Growth, High Inflation & Recessions
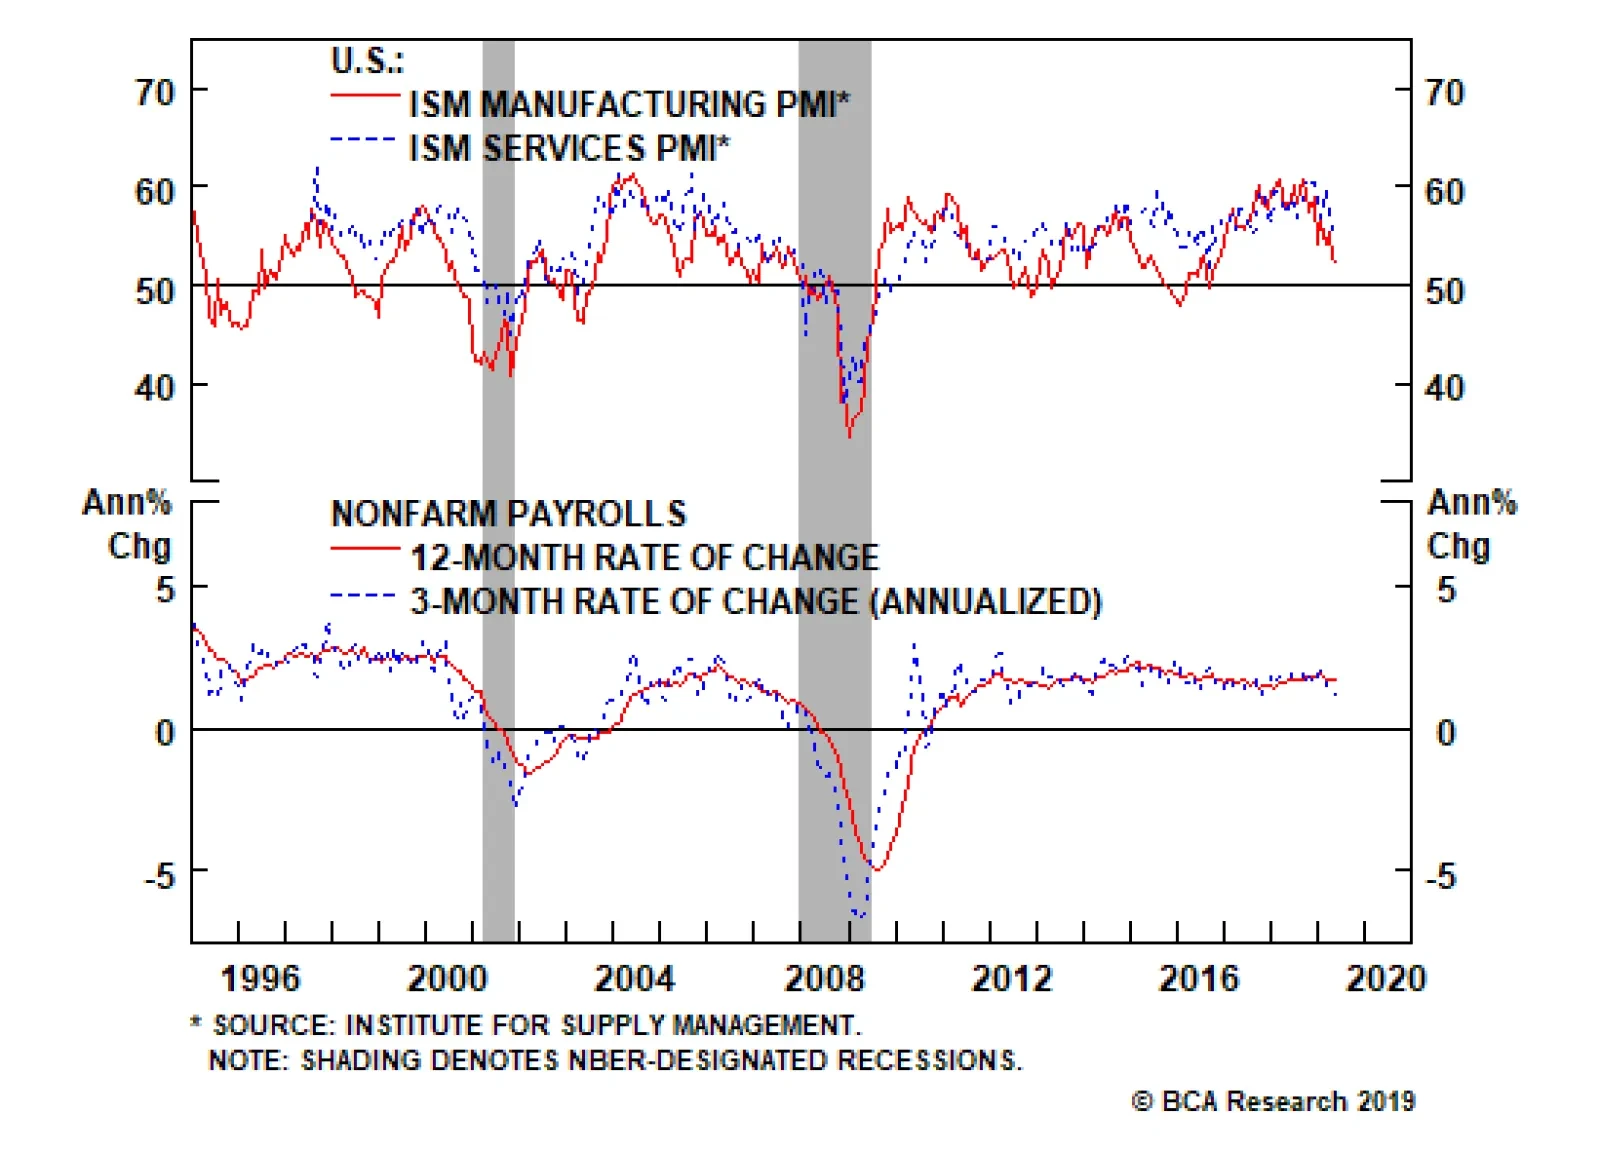
Second, economic indicators are much more consistent with the 2015/16 and 1998 episodes than with “pre-recession” conditions. The ISM Manufacturing PMI has fallen sharply, though it remains above 50, but the ISM Non-Manufacturing PMI looks much healthier. This divergence between manufacturing and services is exactly what occurred in 1998 and 2015/16 (Chart 4). It is consistent with a shock to global demand and trade that has relatively little impact on the U.S. consumer and the domestic economy’s large service sector. Chart 4Divergence Between Services And Manufacturing
Divergence Between Services And Manufacturing
Divergence Between Services And Manufacturing
Granted, the PMIs compiled by Markit do not mirror the divergence between the ISM Manufacturing and Non-Manufacturing surveys. In fact, the Markit Services PMI has dropped sharply alongside its manufacturing counterpart (Chart 5). However, the Markit surveys also showed no divergence between manufacturing and services in 2015/16 and have no available data for 1998. We are therefore inclined to downplay the weakness in the Markit Services PMI for the time being. Chart 5MARKIT PMIs
MARKIT PMIs
MARKIT PMIs
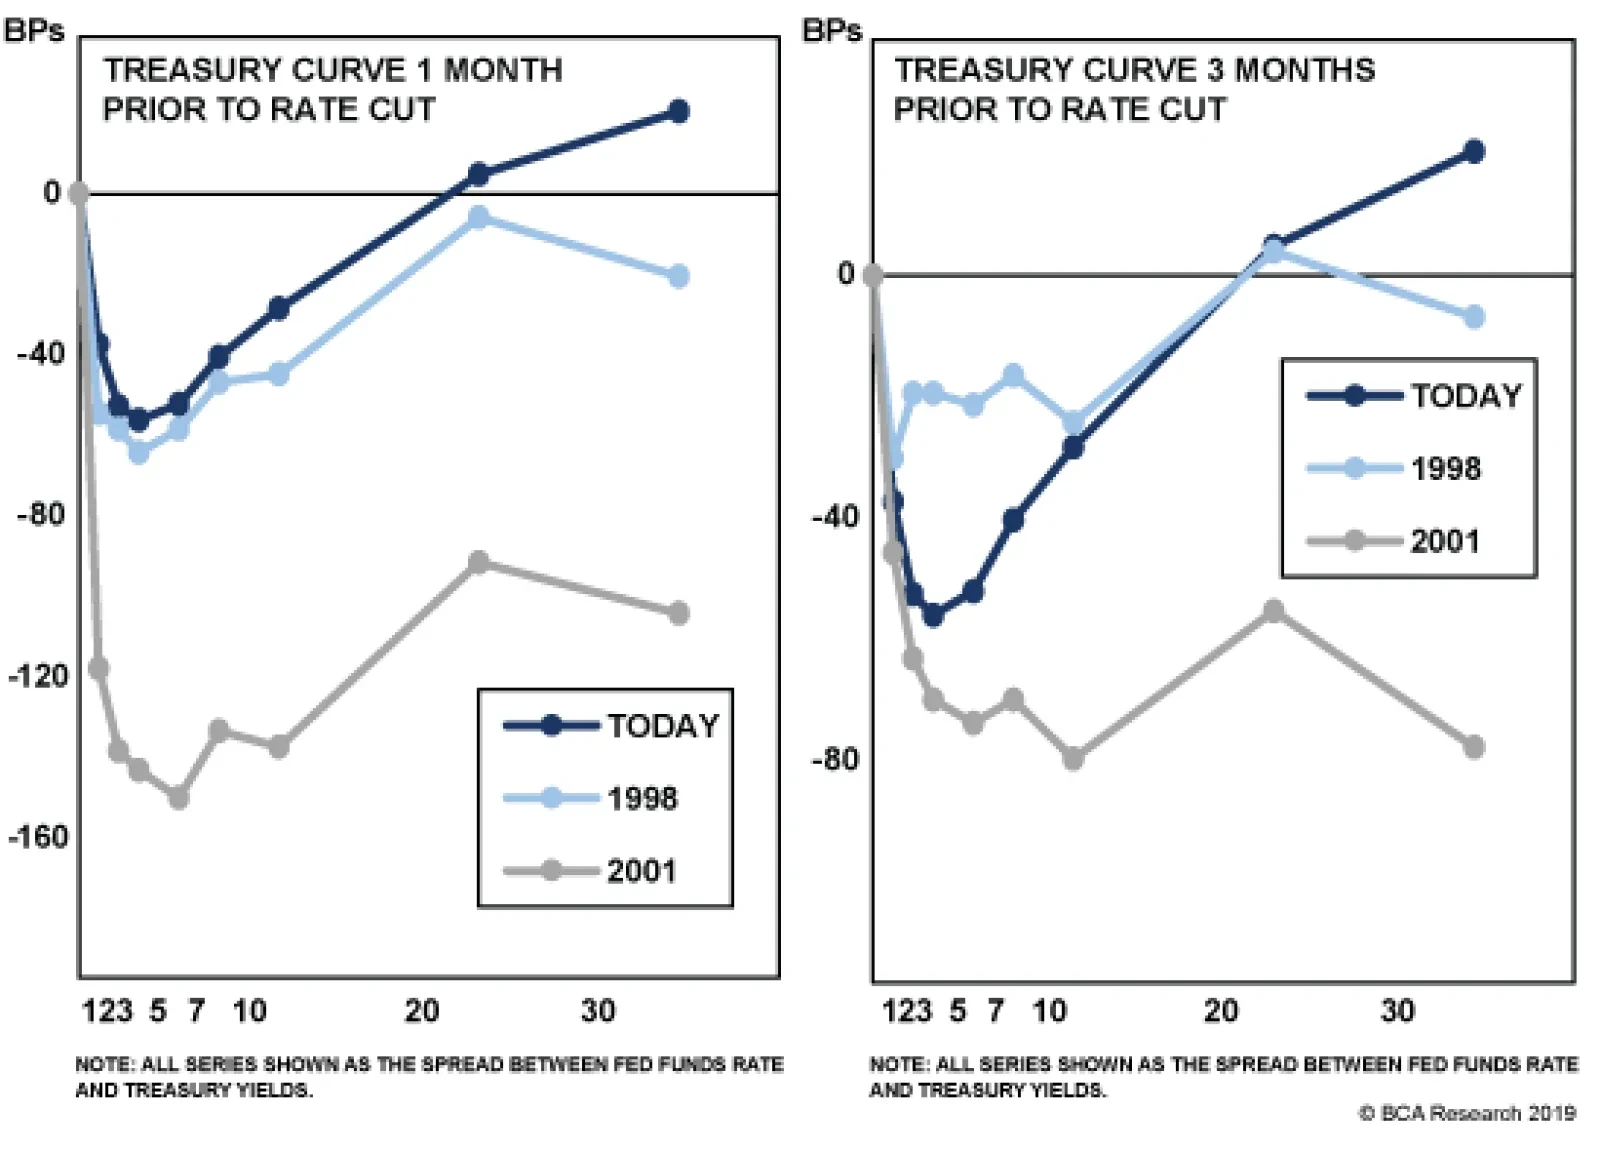
Third, employment growth usually starts to slow at least one year before the economy heads into recession. But it showed relatively little weakness in 1998 and 2015/16 (Chart 4, bottom panel). If May’s downbeat payrolls number turns out to be the start of a trend, then we will have to reconsider our view. But for now, even after last week’s report, employment growth remains solid. Finally, not only do the economic data suggest an episode similar to 1998 and 2015/16, but the slope of the yield curve does as well. While many have focused on the inversion of the 3-month/10-year Treasury slope, the 2-year/10-year slope remains above zero, and has indeed steepened in recent weeks. A more comprehensive look at the entire yield curve, adjusting for changes in the overall level of yields, shows that it looks very similar to the yield curve seen just ahead of the first 1998 rate cut. In contrast, the yield curve seen just before the first 2001 rate cut was more heavily inverted at the front-end, and long-dated yields priced-in much less of a rebound (Charts 6A & 6B).
Chart 6
Chart 6
Bottom Line: The economic data and shape of the yield curve do not suggest that the economy is heading into recession. Rather, they suggest that the economy is experiencing an external shock – akin to 1998 or 2015/16 – that can be offset by a relatively minor pivot in Fed policy. Investors should keep portfolio duration low on the view that the Fed will cut rates by less than 76 bps during the next 12 months. Corporate Health Update Chart 7Weak Profit Growth In Q1
Weak Profit Growth In Q1
Weak Profit Growth In Q1
The full slate of first quarter corporate balance sheet data have now been released, and as expected, corporate profit growth cooled significantly compared to the rapid gains seen in 2018. As a result, our Corporate Health Monitor – an equal-weighted composite of six important financial ratios – ceased its recent improvement and jumped firmly back into “deteriorating health” territory (Chart 7). Our preferred measure of pre-tax profits contracted at an annualized rate of 17% in Q1, dragging the year-over-year growth rate down to 7%, from 15% in 2018 Q4 (Chart 7, bottom panel). The crucial relationship for corporate bond investors is between pre-tax profit growth and debt growth. If profit growth exceeds debt growth, then gross leverage will decline over time taking the default rate with it. Conversely, defaults tend to rise whenever profit growth fails to keep pace with debt growth.3 Corporate debt has been growing at an annualized pace of about 6-8%. This means that profit growth would have to slow to below those levels for us to become concerned about an increase in defaults. This could occur for the next quarter or two, as the weak global growth environment weighs on revenues (Chart 8). But our Profit Margin Proxy – corporate selling prices less unit labor costs – is in a strong uptrend, suggesting that the weakness may not be that dire. The crucial relationship for corporate bond investors is between pre-tax profit growth and debt growth. There is also some reason to think that corporate debt growth might slow during the next few quarters. According to the Fed’s Senior Loan Officer Survey, C&I loan demand has weakened significantly in recent months, while lending standards remain approximately unchanged. Historically, it is extremely rare for loan demand to weaken without a simultaneous tightening in bank lending standards (Chart 9). However, if the current unusual situation were to persist, it would be quite positive from the perspective of corporate balance sheet health. It would suggest that firms are adding less debt to balance sheets, even though banks continue to make credit readily available. Chart 8Profit Margins Still Strong
Profit Margins Still Strong
Profit Margins Still Strong
Chart 9Is Corporate Sector On A Debt Diet?
Is Corporate Sector On A Debt Diet?
Is Corporate Sector On A Debt Diet?
Bottom Line: Growth rates for both corporate profits and debt should settle into the mid-single digits during the next few quarters. This will keep gross leverage and the default rate roughly stable. A sustained period of negative profit growth and tighter C&I lending standards would challenge this outlook. Ryan Swift, U.S. Bond Strategist rswift@bcaresearch.com Footnotes 1 Please see U.S. Bond Strategy Portfolio Allocation Summary, “When Expectations Are Self-Fulfilling”, dated June 4, 2019, available at usbs.bcaresearch.com 2 Please see U.S. Bond Strategy/Global Fixed Income Strategy Special Report, “The Risk From Corporate Debt: Theory And Evidence”, dated April 23, 2019, available at usbs.bcaresearch.com 3 Please see U.S. Bond Strategy Special Report, “Assessing Corporate Default Risk”, dated March 19, 2019, available at usbs.bcaresearch.com Fixed Income Sector Performance Recommended Portfolio Specification
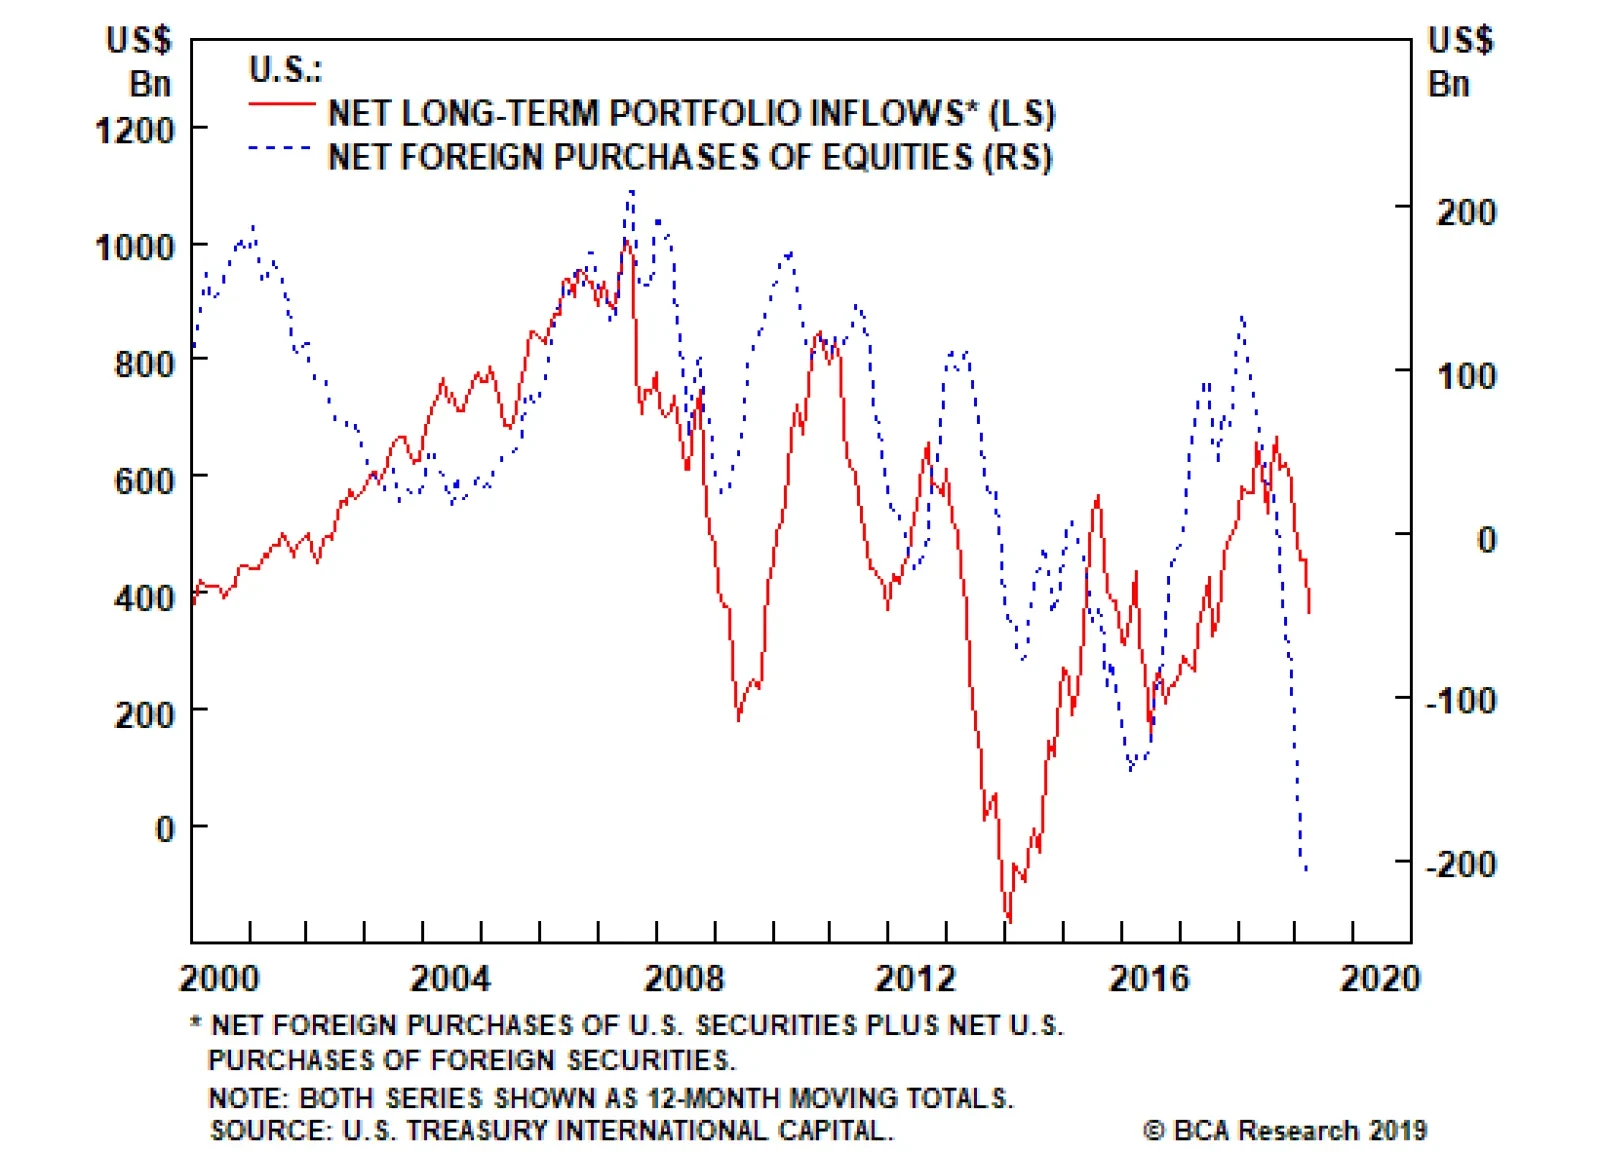
The change in the U.S. tax code to allow for the repatriation of offshore cash helped the dollar in 2018, but not to the extent that might have been expected. The issue today is that the tax break was a one-off, and net flows into the U.S. are now rolling…
Highlights Bond yields have fallen a lot since the beginning of November, … : At the close on November 8th, the 10-year Treasury bond yielded 3.24%. By last Monday, it was yielding just 2.07%. … but the move isn’t terribly anomalous relative to history: In terms of nominal yields, the decline was just over a one-standard-deviation event; per real yields, it amounted to a -0.7 sigma move. The Fed may be preparing for a rate cut, but overweight duration positions will only pay off if several more follow: A one-and-done rate cut would stretch out the expansion and the bull markets in equities and spread product, but Treasuries are priced for an extended rate-cutting cycle. Feature Stocks are said to be the only asset that people want more of when prices rise, and less of when they fall. Lately, bonds have also seemed to have an upward-sloping demand curve, because more and more people have bought them as they’ve gotten more expensive. A BCA client who’s been shaking his head at the action got in touch with us last week to try to make some sense of it all. Experience tells him that big moves like the one that’s been unfolding since last November don’t go on forever. When they stop, mean reversion would suggest that they’re prone to retrace a good bit of territory. He came to us for some historical context to support or contradict his intuition, as summed up in something like the following statement. “Over the past 50 years, the current move equates to an x-standard-deviation event. Following similar instances, rates have risen by x basis points over the next six months, and by y basis points over the next twelve months.” The Empirical Record The sharp decline in the 10-year Treasury yield that began in early November can be viewed as three separate declines (Chart 1). In the first, the 10-year yield fell by 68 basis points (“bps”) over a span of 37 trading days. After retracing a third of the decline over the next 11 sessions, it slid by another 40 bps over 48 days. Following a one-half retracement over the ensuing 13 days, it shed 53 basis points in 32 days, capped off by a 36-bps decline across the final eight sessions (Table 1). Chart 1The Path To 2.07%
The Path To 2.07%
The Path To 2.07%
Table 1A Lower 10-Year Treasury Yield In Three Steps
Context
Context
Using the daily 10-year Treasury yield series beginning in 1962, we compared the individual yield declines for prior 37-, 48- and 32-day periods, as well as for the aggregate 141-day session spanning the entire stretch from the November 8th peak to the June 3rd trough. We also looked at the May 21st to June 3rd crescendo relative to past eight-day segments. The standardized moves range from three-quarters of a standard deviation below the mean for the 48-day middle leg to 1.5 and 1.8 for the 37- and 8-day moves, respectively (Table 2). All in all, the entire move grades out to 1.3 standard deviations below the mean – a somewhat unusual move, but nothing too special. Table 2Standardized Values Of Nominal 10-Year Treasury Yield Declines
Context
Context
The current decline’s relative stature is undermined by the wild volatility of the late ‘70s and early ‘80s, when bond yields and annual inflation reached double-digit levels (Chart 2). To try to place the current episode on a more equal framework, we also calculated standardized moves in real (inflation-adjusted) yields. On a real basis, however, the current moves made even less of a splash. The 8-day decline (z-score = -1.2) was the only component that was more than a standard deviation from the mean, and the overall move amounted to just 0.7 standard deviations below the mean (Chart 3). Chart 2No Historical Anomaly In The Current Market
No Historical Anomaly In The Current Market
No Historical Anomaly In The Current Market
Chart 3Little Impact In Terms Of Real Yields
Little Impact In Terms Of Real Yields
Little Impact In Terms Of Real Yields
We are familiar with the electronic financial media’s increasingly popular convention of stating daily yield moves in proportion to the previous day’s closing yield.1 That convention has the advantage of fitting snugly aside stock price quotes on TV and computer screens, but it is ultimately nonsensical. The proportional change in a bond’s yield relative to its starting yield doesn’t come close to approximating the change in the value of that bond. Comparing proportional changes in bond yields across timeframes would be a way of putting today’s yield moves on a more equal footing with yield moves in the high-inflation, high-coupon era of the late seventies and early eighties, but it conveys no practical information. The margin by which long-maturity Treasuries have outperformed intermediate-maturity Treasuries is unusual, ... Our next steps were instead to compare Treasury total returns and the change in the slope of the yield curve to past flattening and steepening episodes. The moves here were also unavailing over both seven- and one-month periods, as the high-coupon ‘70s and ‘80s still dominated (Chart 4). In terms of the change in the 10-year Treasury yield, both nominal and real; Treasury index total returns; and the slope of the yield curve (3-month rate to 10-year yield), both the aggregate move since last October and its three component moves have amounted to one-standard-deviation events. They would only have had about a one-in-six chance of occurring randomly in a normally distributed population, but they do not represent unsustainable moves that cry out to be reversed. Chart 4Little Impact In Terms Of Treasury Total Returns, ...
Little Impact In Terms Of Treasury Total Returns, ...
Little Impact In Terms Of Treasury Total Returns, ...
Digging a little deeper to consider total returns across different regions of the yield curve, we do find one apparent anomaly at the long end of the curve. The long Treasury index has outperformed the intermediate Treasury index by a two-standard-deviation margin over both a seven-month and a one-month timeframe (Chart 5). On a standalone basis, the long Treasury index has beaten the seven-month mean return by one-and-a-half standard deviations, and the one-month mean return by two standard deviations (Chart 6). The two-standard-deviation results would only be expected to occur one out of forty times, and thereby validate our client’s sense that something has been going on. ... and history suggests they’ll be partially unwound over the next six to twelve months. Chart 5... But The Spread Between Long- And Intermediate-Index Returns Is Wide, ...
... But The Spread Between Long- And Intermediate-Index Returns Is Wide, ...
... But The Spread Between Long- And Intermediate-Index Returns Is Wide, ...
Chart 6... And Long-Maturity Returns Have Been Elevated
... And Long-Maturity Returns Have Been Elevated
... And Long-Maturity Returns Have Been Elevated
Moving on to the second part of his inquiry, we reviewed the standalone performance of the long Treasury index, and the relative long-versus-intermediate performance, over subsequent six- and twelve-month periods. We focused our analysis on instances when historical z-scores were greater than or equal to their current levels to try to determine if we should expect current performance to reverse and, if so, how sharply. On a standalone basis, long Treasury index performance has gently reverted to the mean over the subsequent six and twelve months, posting returns over those periods within +/- 0.2 standard deviations of its long-run average (Table 3). Table 3Standardized Values Of Future Long-Maturity Treasury Index Returns
Context
Context
Outlying relative long-versus-intermediate performance like we’ve witnessed over the last seven months has reversed more convincingly. The long Treasury index has underperformed its intermediate-maturity counterpart over six and twelve months when its z-scores were greater than or equal to their current levels over a seven- and one-month basis, falling roughly 0.5 standard deviations below the mean (Table 4). The future does not have to resemble the past, especially over small sample sizes, but relative long-end underperformance would accord with our constructive view of the U.S. economy. It would also be consistent with our anti-duration and pro-inflation biases. Table 4Standardized Values Of Future Difference Between Long- And Intermediate-Maturity Treasury Index Returns
Context
Context
The Fed, Again The consistency of the comments from Fed officials last week would seem to suggest that they are trying to prepare the ground for a rate cut. A cut at next week’s FOMC meeting might be a little too abrupt, but it seems increasingly possible that the committee could guide markets to a cut at the next scheduled meeting at the end of July. Various officials have made it abundantly clear that they view trade tensions as a threat to the economy, and that the bank is prepared to adjust policy, if need be, to sustain the expansion. Uber-dovish St. Louis President Bullard, who said last Monday that, “a downward policy rate adjustment may be warranted soon,” no longer appears to be such an outlier. We do not think a rate cut is necessary, and we would be content to remain on the sidelines if we were on the committee, but our opinion is irrelevant. We endeavor not to be distracted by what we think should happen, devoting our focus instead to determining what’s most likely to happen. To that end, our estimate of the probability that the Fed’s next move might be a cut is rising by the speech/interview. When incorporating that probability into investment strategy, we have been thinking a lot about a question that keeps being raised within BCA: If the Fed cuts rates next week or next month, how will markets respond? Assuming the economic backdrop doesn’t deteriorate, we expect that a rate cut will keep the equity and credit bull markets going. The answer depends heavily on the context in which the Fed cuts, and we assume that if the Fed cuts after the economy has taken a dramatic turn for the worse, risk assets would decline. In that case, markets would presumably read the Fed’s decision as confirmation that things were even worse than they perceived and that a significant bout of risk aversion was right around the corner. On the other hand, if the cut came against a backdrop of decent, if unexciting, economic data, risk assets would likely rally. For an investor who cannot resist injecting his/her opinion into the mix, the market response would be supportive of risk assets if a rate cut was unnecessary, but negative if the economy couldn’t get along without it. Investment Implications We believe that the U.S. economy is doing just fine, thank you, and do not yet see the signs that the expansion requires more monetary accommodation if it is to continue. Assuming that the cast of the incoming data does not change enough to change our view, we would expect that a rate cut would defer the end of the expansion and thereby defer the end of the bull markets in risk assets. We are therefore content to stick with our recommendation that investors should remain at least equal weight equities and spread product. We are still looking for restrictive monetary policy to be the catalyst that ends the expansion, and anything that pushes restrictiveness further into the future ought to keep the market parties going. Our view has aligned with the house view over the last year, but there is no guarantee that it will continue to do so. A growing minority of managing editors has been repeatedly challenging the internal consensus in our daily meetings, and it will be debated vigorously at our monthly view meeting Monday morning in Montreal. It is possible that the house view, and the U.S. Investment Strategy view, could soon become less constructive, though our level of conviction remains fairly high. Doug Peta, CFA Chief U.S. Investment Strategist dougp@bcaresearch.com Footnotes 1 If a bond yielding 3% at Friday’s close ends Monday’s session with a yield of 2.94%, 6 bps lower, its yield is shown as having declined 2% on the day (-.0006/.03 = -2%).