Geopolitics
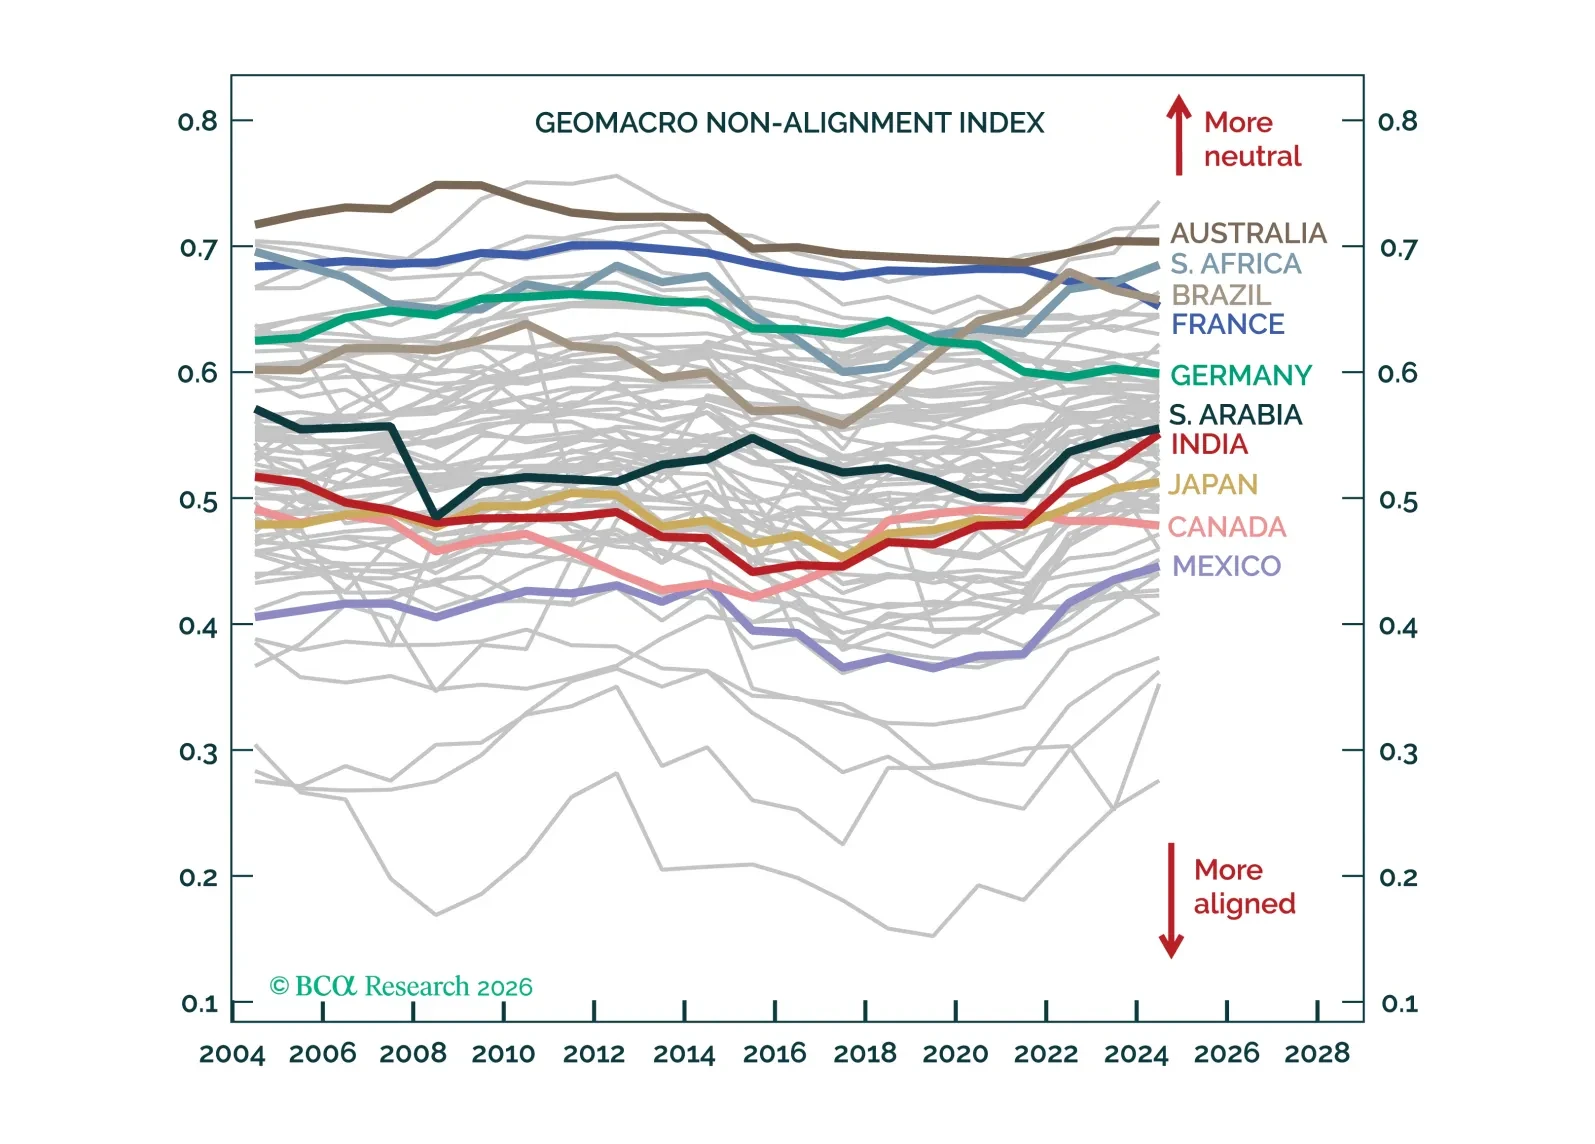
We have long argued, on a case-by-case basis, that countries willing to play the superpowers against each other win in a multipolar world. The logic is intuitive, and in this report, we measure it systematically.
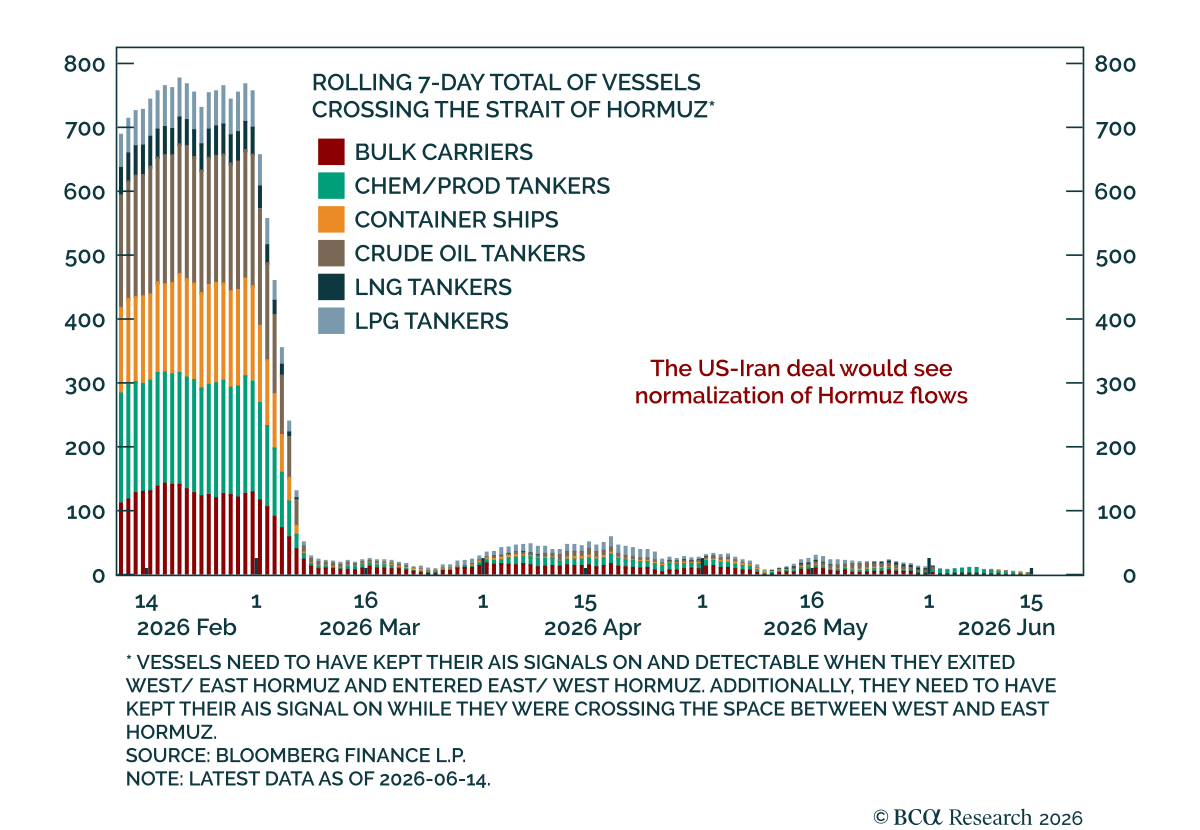

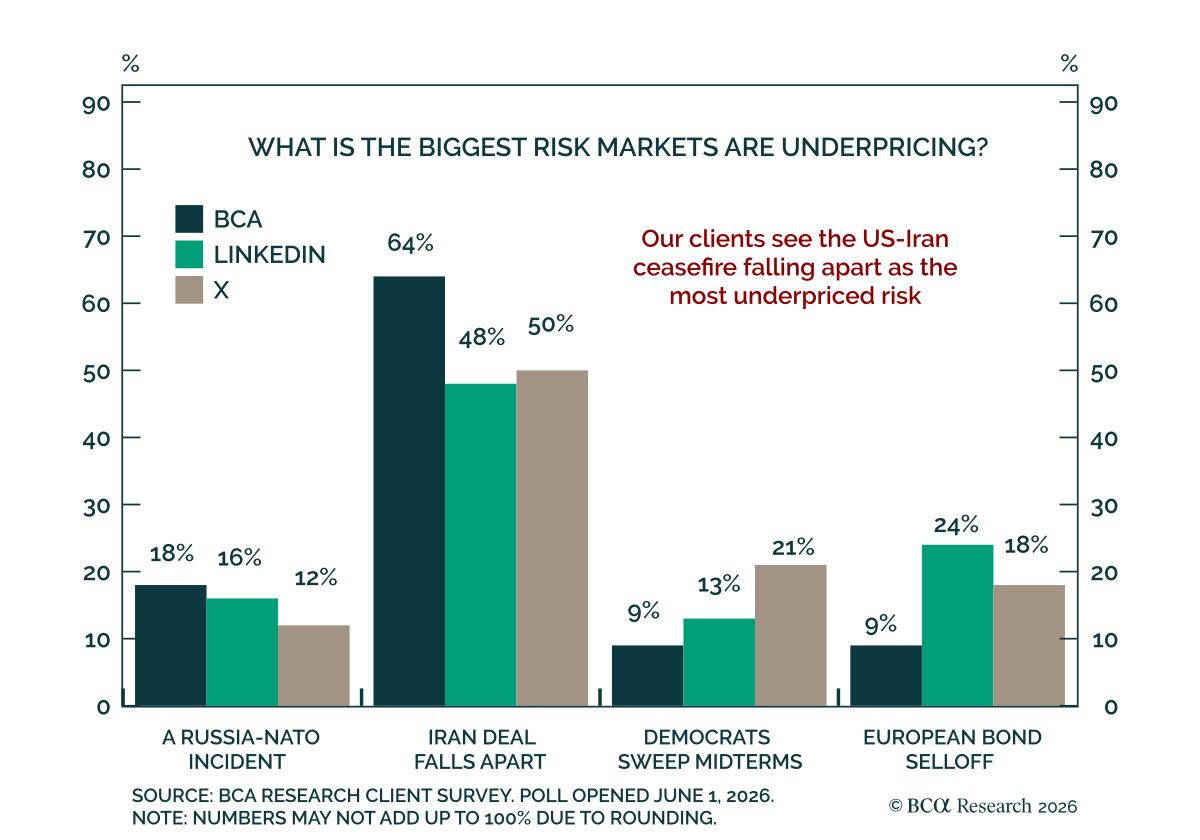
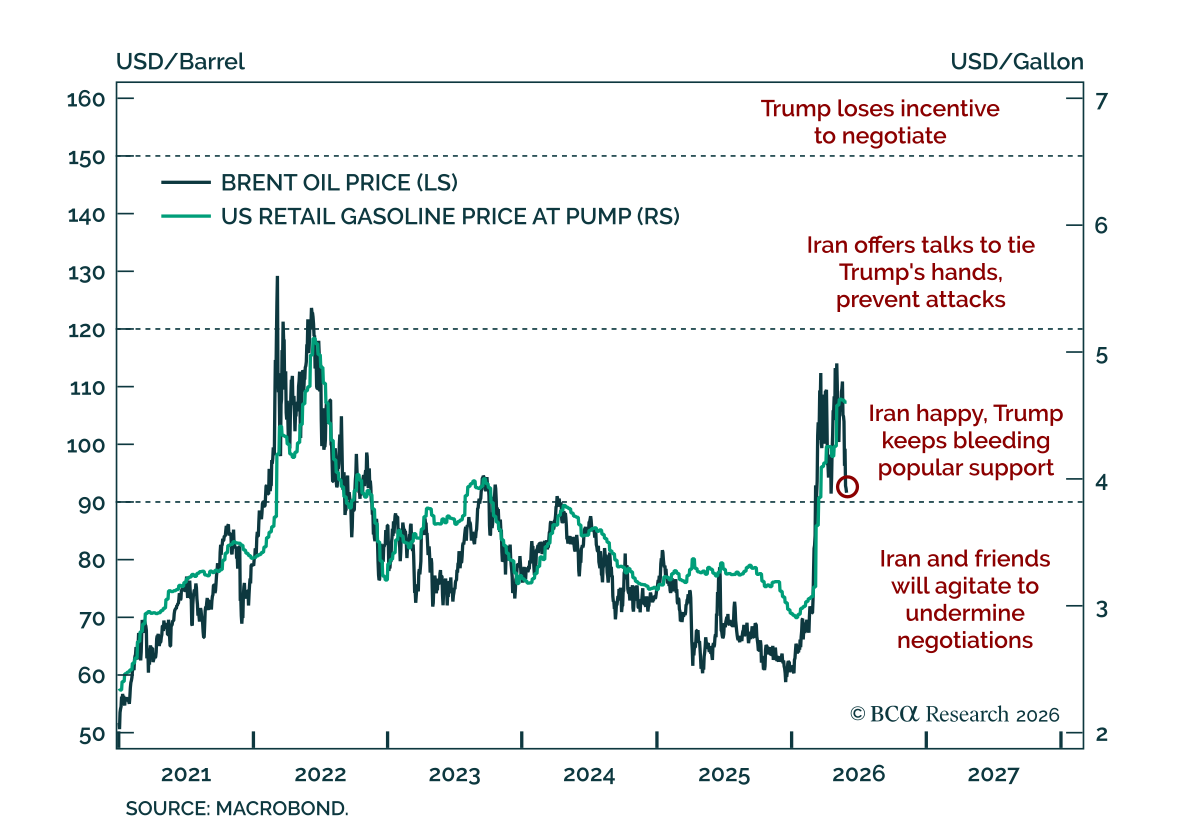
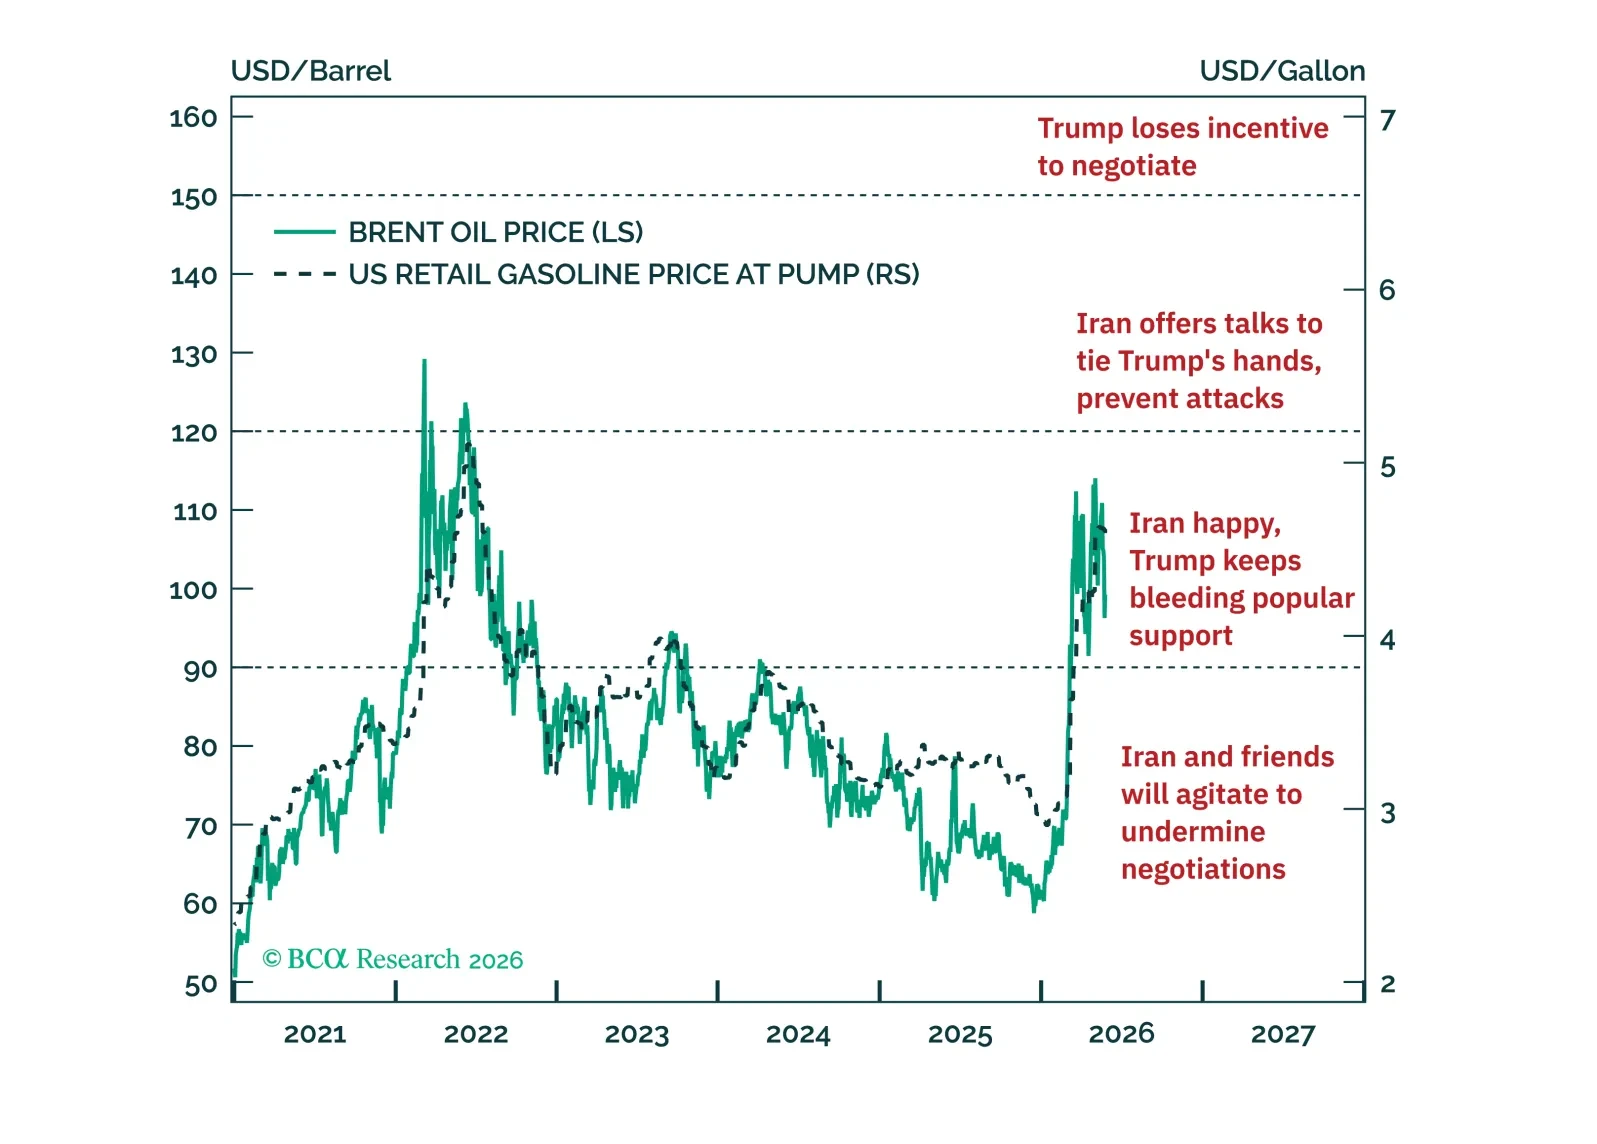
The odds of a near-term US-Iran deal have gone up slightly, but the odds of a Russian provocation that divides NATO have also gone up.
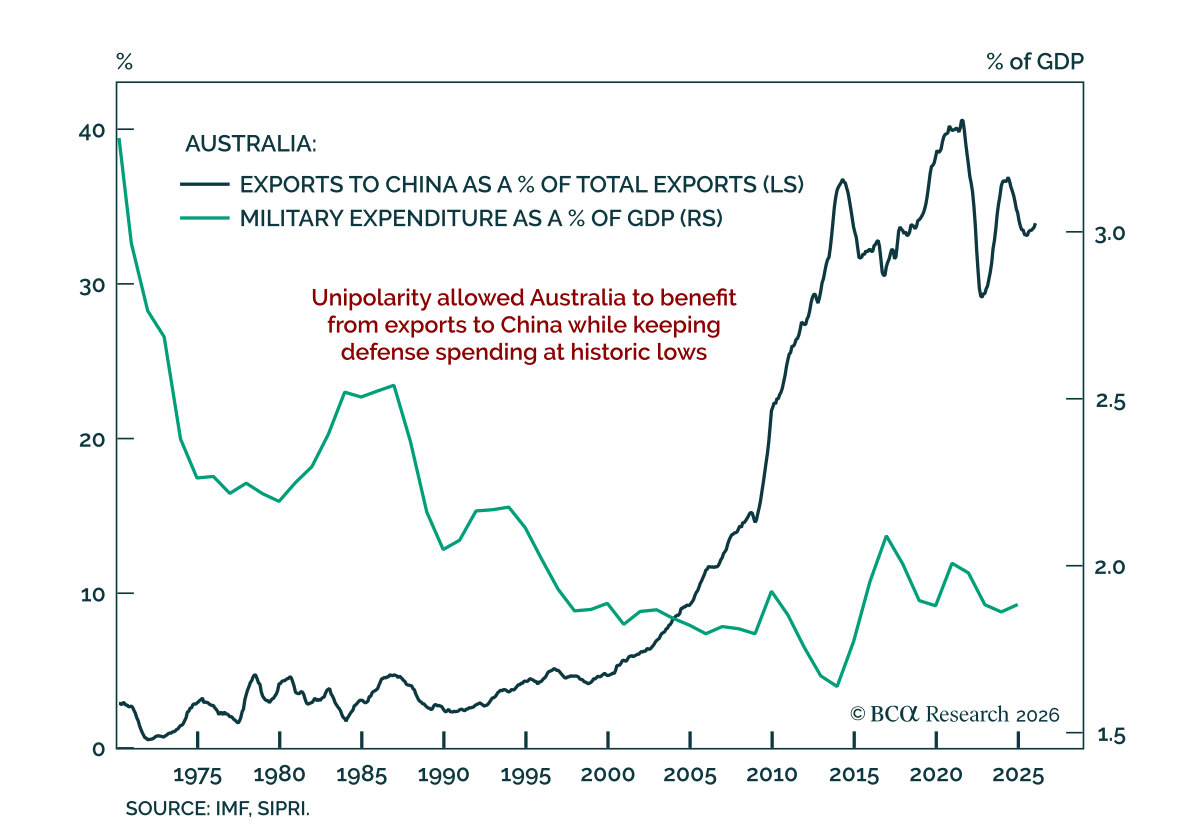
In this month’s Beta Report, we assess what that structural tension means for investors under two distinct scenarios. In our base case – a multipolar world order – Australia's position turns out to be more advantageous than it appears. The great power capital expenditure race generates demand for precisely what Australia produces. In the tail risk – a hard bipolar rupture – the calculus inverts, and the same commodity dependencies that long appeared as structural strengths begin to look like structural liabilities.